Advanced Moisture Modeling of Polymer...
19
Advanced Moisture Modeling of Polymer Composites by K. Chandrashekhara Curators’ Professor Department of Mechanical and Aerospace Engineering A National University Transportation Center at Missouri University of Science and Technology NUTC R296
-
Upload
nguyenmien -
Category
Documents
-
view
217 -
download
1
Transcript of Advanced Moisture Modeling of Polymer...

Advanced Moisture Modeling of Polymer Composites
by
K. Chandrashekhara Curators’ Professor
Department of Mechanical and Aerospace Engineering
A National University Transportation Center at Missouri University of Science and Technology
NUTC R296
Disclaimer
The contents of this report reflect the views of the author(s), who are responsible for the facts and the
accuracy of information presented herein. This document is disseminated under the sponsorship of
the Department of Transportation, University Transportation Centers Program and the Center for
Transportation Infrastructure and Safety NUTC program at the Missouri University of Science and
Technology, in the interest of information exchange. The U.S. Government and Center for
Transportation Infrastructure and Safety assumes no liability for the contents or use thereof.
NUTC ###

Technical Report Documentation Page
1. Report No. NUTC R296
2. Government Accession No. 3. Recipient's Catalog No.
4. Title and Subtitle Advanced Moisture Modeling of Polymer Composites
5. Report Date April 2014
6. Performing Organization Code 7. Author/s K. Chandrashekhara
8. Performing Organization Report No. Project #00034385
9. Performing Organization Name and Address Center for Transportation Infrastructure and Safety/NUTC program Missouri University of Science and Technology 220 Engineering Research Lab Rolla, MO 65409
10. Work Unit No. (TRAIS) 11. Contract or Grant No. DTRT06-G-0014
12. Sponsoring Organization Name and Address U.S. Department of Transportation Research and Innovative Technology Administration 1200 New Jersey Avenue, SE Washington, DC 20590
13. Type of Report and Period Covered Final
14. Sponsoring Agency Code
15. Supplementary Notes 16. Abstract Long term moisture exposure has been shown to affect the mechanical performance of polymeric composite structures. This reduction in mechanical performance must be considered during product design in order to ensure long term structure survival. In order to determine the long-term moisture effects on composite components, representative parts are commonly tested after having been exposed to an accelerated moisture conditioning environment. Accelerated moisture conditions are established in order to rapidly drive moisture into test specimens simulating worst-case long term exposure scenarios. Currently accepted methodologies for analyzing the time required to condition specimens are limited, allowing only simple geometry and an assumption that diffusivity rates are independent of the flow path or direction. Therefore, a more advanced finite element method is desired. In the current work, a three dimensional model is developed and implemented in commercial finite element code. The parametric study has been conducted for 3D shapes, moisture diffusion pathways, and varying moisture and temperature conditions. Finite element results are validated with a one-dimensional analytical model and experimental results. The moisture model developed for the homogeneous composite laminate is extended for hybrid composites. In the following study, the moisture diffusion characteristics in two-phase hybrid composites using moisture concentration-dependent diffusion method have been investigated. The two phases are unidirectional S-glass fiber-reinforced epoxy matrix and unidirectional graphite fiber-reinforced epoxy matrix. A user-defined subroutine was developed to implement this method into commercial finite element code. Three-dimensional finite element models were developed to investigate the moisture diffusion in hybrid composites. A normalization approach was also integrated in the model to remove the moisture concentration discontinuity at the interface of different material components. The moisture diffusion in the three-layer hybrid composite exposed to 45 ºC/84% relative humidity for 70 days was simulated and validated by comparing the simulation results with experimental findings.
17. Key Words Polymer composites, FRP, Moisture model, 3D simulation
18. Distribution Statement No restrictions. This document is available to the public through the National Technical Information Service, Springfield, Virginia 22161.
19. Security Classification (of this report) unclassified
20. Security Classification (of this page) unclassified
21. No. Of Pages 19
22. Price
Form DOT F 1700.7 (8-72)

MISSOURI S&T – NATIONAL UNIVERSITY TRANSPORTATION CENTER ADVANCED MATERIALS AND NON-DESTRUCTIVE TESTING TECHNOLOGIES
Sequential #: R296 Project Title: Advanced Moisture Modeling of Polymer Composites Matching Research Agency: Bell Helicopter Textron Principal Investigator: K. Chandrashekhara, Curators’ Professor, Department of Mechanical and Aerospace Engineering Project Duration: 02/28/2012 – 12/31/2013 Project Summary: Long term moisture exposure has been shown to affect the mechanical performance of polymeric composite structures. This reduction in mechanical performance must be considered during product design in order to ensure long term structure survival. In order to determine the long-term moisture effects on composite components, representative parts are commonly tested after having been exposed to an accelerated moisture conditioning environment. Accelerated moisture conditions are established in order to rapidly drive moisture into test specimens simulating worst-case long term exposure scenarios. Currently accepted methodologies for analyzing the time required to condition specimens are limited, allowing only simple geometry and an assumption that diffusivity rates are independent of the flow path or direction. Therefore, a more advanced finite element method is desired. In the current work, a three dimensional model is developed and implemented in commercial finite element code. The parametric study has been conducted for 3D shapes, moisture diffusion pathways, and varying moisture and temperature conditions. Finite element results are validated with a one-dimensional analytical model and experimental results. The moisture model developed for the homogeneous composite laminate is extended for hybrid composites. In the following study, the moisture diffusion characteristics in two-phase hybrid composites using moisture concentration-dependent diffusion method have been investigated. The two phases are unidirectional S-glass fiber-reinforced epoxy matrix and unidirectional graphite fiber-reinforced epoxy matrix. A user-defined subroutine was developed to implement this method into commercial finite element code. Three-dimensional finite element models were developed to investigate the moisture diffusion in hybrid composites. A normalization approach was also integrated in the model to remove the moisture concentration discontinuity at the interface of different material components. The moisture diffusion in the three-layer hybrid composite exposed to 45 ºC/84% relative humidity for 70 days was simulated and validated by comparing the simulation results with experimental findings.

Summary of Results: A comprehensive 3D model was developed and implemented in ABAQUS to simulate the moisture absorption in composite materials during service conditions. Results from 2D and 3D models were compared to the analytical and experimental findings. 3D analysis exhibited lower average moisture content in comparison with the prediction from the existing models, but the 3D modeling was more accurate than 2D modeling, especially in prediction of moisture diffusion into thick composite laminates. For hybrid composite structure, a moisture concentration-dependent method was proposed and implemented using user-defined subroutine USDFLD in commercial finite element code to simulate moisture diffusion behavior in multi-layer unidirectional fiber-reinforced hybrid composite structures. The moisture concentration-dependent method assumes that the fibers restrain the matrix from free-swelling. As a result, the diffusion coefficients gradually decrease due to swelling stress built inside the material during the diffusion process, and then drift to a constant value when moisture concentration approaches equilibrium moisture content. The concentration-dependent diffusivity curves are continuous fifth-order polynomial curves. The curve pattern function for CFRP component was different from that of GFRP. Finite element model for a three-layer hybrid composite structure was developed, and the simulation results were validated with experimental findings. This model was extended to simulate the moisture diffusion behavior in adhesive-bonded four-layer hybrid symmetric composite laminates. The results indicated that thinner adhesive layers (0.12 mm thick) didn’t significantly affect the overall moisture uptake. Thicker adhesive layers (0.76 mm thick) noticeably accelerated the overall moisture uptake after 81 days’ conditioning. This is because, the diffusivities in partial saturated regions of CFRP and GFRP components gradually decrease due to the residual stresses, while the diffusivity of adhesive layers is constant and also its solubility is higher than that of CFRP and GFRP layers. As a result, the adhesive nodes near the side surfaces can absorb moisture more quickly from the longitudinal and transverse directions at later stages than CFRP and GFRP components. The dependency of adhesive’s diffusion coefficients on moisture concentration will be investigated in the future. Mathematical Background: The moisture diffusion behavior in a simple orthotropic composite plate is governed by Fick’s second law:
∂∂
∂∂
+
∂∂
∂∂
+
∂∂
∂∂
=∂∂
zcD
zycD
yxcD
xtc
332211 (1)
where ),,,( tzyxc is the moisture concentration, and iiD (i=1, 2, 3) are the diffusion coefficients along three principal axes (length direction, width direction, and thickness direction, respectively). However, in order to take the moisture diffusion contribution from edges into account, the edge correction factor is usually used as shown below:

2
33
22
33
1133 1
++=
DD
wh
DD
lhDD (2)
where D is the effective diffusivity through thickness, and hwl ,, are the length, width and thickness of the plate, respectively. The diffusivity is generally considered to be dependent only on temperature, as expressed in the Arrhenius-type equation:
( )( )TREdeDD ⋅−⋅= /0 (3)
where 0D is the diffusivity constant, dE is the diffusion activation energy, and T is the temperature in Kelvin. However, in the moisture concentration-dependent diffusion model, the diffusion coefficients are also dependent on the moisture concentration on every material node during the diffusion process. Since the temperature conditioning in two cases studied in this work is constant during moisture diffusion process, the thermal expansion induced internal stresses due to elevated temperature are not taken into account in this study. Another important parameter is the equilibrium moisture content mM , which has the same physical meaning as solubility. This parameter indicates the saturated moisture concentration under certain moist conditioning and temperature. This value is typically a constant if water immersion conditioning is applied, or in an exponential relationship with relative humidity if the humid air conditioning is applied, as follows:
mM constant= (liquid immersion) (4)
bm RHaM ⋅= (humid air) (5)
where a and b are both experimentally determined constants.
Normalization Approach A few similarities exist between Fick’s law and Fourier’s law, which govern the mass diffusion and heat transfer, respectively. The governing equation for three-dimensional heat transfer in orthotropic materials is given by
P x y zT T T TC K K Kt x x y y z z
ρ ∂ ∂ ∂ ∂ ∂ ∂ ∂ = + + ∂ ∂ ∂ ∂ ∂ ∂ ∂
(6)
where ρ is the material density, pC is the specific heat capacity, and T is the temperature. The thermal diffusivity / ( )pK Cρ is the change rate of the temperature. For most materials, the thermal diffusivity is several orders higher than the mass diffusivity, which means that the material can reach thermal equilibrium state much faster than moisture equilibrium state.
The difference between heat transfer and mass diffusion is the continuity of primary variables at the interface for layered multi-material system. For heat
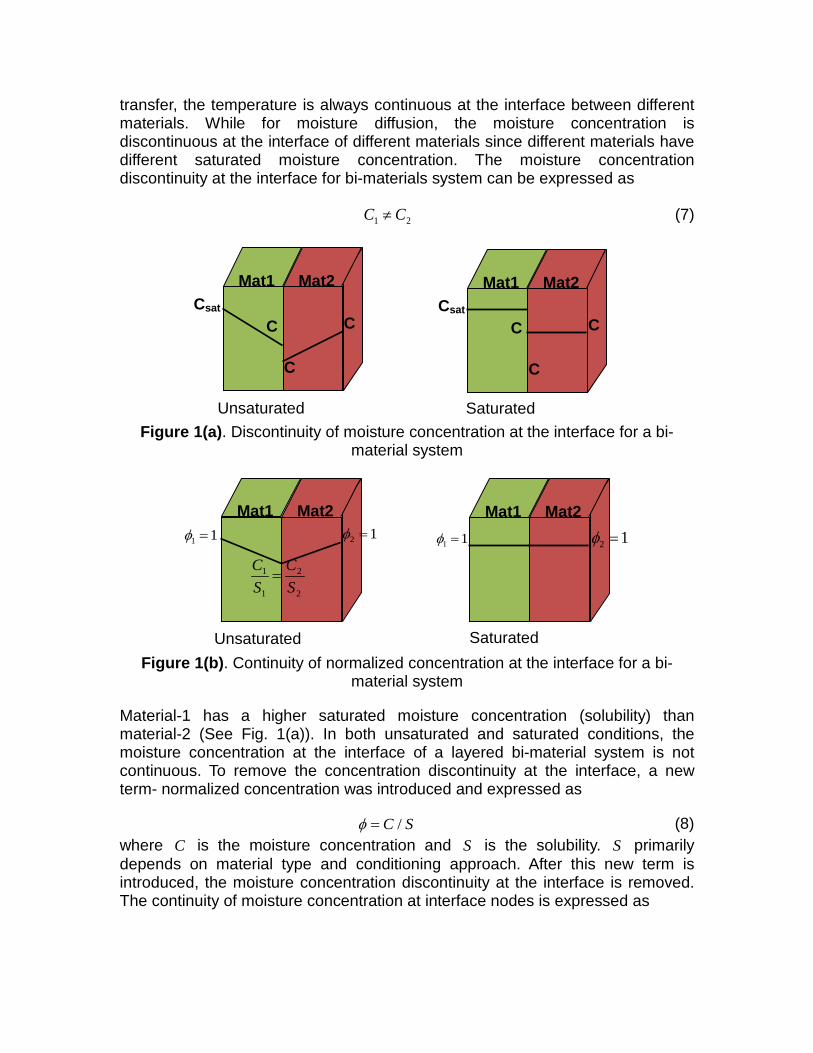
transfer, the temperature is always continuous at the interface between different materials. While for moisture diffusion, the moisture concentration is discontinuous at the interface of different materials since different materials have different saturated moisture concentration. The moisture concentration discontinuity at the interface for bi-materials system can be expressed as
21 CC ≠ (7)
Figure 1(a). Discontinuity of moisture concentration at the interface for a bi-
material system
Figure 1(b). Continuity of normalized concentration at the interface for a bi-
material system
Material-1 has a higher saturated moisture concentration (solubility) than material-2 (See Fig. 1(a)). In both unsaturated and saturated conditions, the moisture concentration at the interface of a layered bi-material system is not continuous. To remove the concentration discontinuity at the interface, a new term- normalized concentration was introduced and expressed as
/C Sφ = (8) where C is the moisture concentration and S is the solubility. S primarily depends on material type and conditioning approach. After this new term is introduced, the moisture concentration discontinuity at the interface is removed. The continuity of moisture concentration at interface nodes is expressed as
1 1φ =
2
2
1
1
SC
SC
=
2 1φ = Mat1 Mat2
Unsaturated
1 1φ = 2 1φ = Mat1 Mat2
Saturated
Unsaturated
Csat C
C
C
Mat1 Mat2
Saturated
Csat C
C
C
Mat1 Mat2
1 2 1 1
1 2 2 2
C C C Sor constantS S C S
φ = = = = (9)
The normalized concentration φ is continuous at the interface nodes in both unsaturated and saturated conditions (see Fig. 1(b)). Essentially,
1 2/C C constant= is the necessary condition for the continuity of normalized concentration at interfacial nodes. The necessity of this condition could be further proved by Henry’s law.
Finite Element Modeling The three-dimensional Fickian equation with normalized concentrationφ , can be expressed as
11 22 33D D Dt x x y y z zφ φ φ φ ∂ ∂ ∂ ∂ ∂ ∂ ∂ = + + ∂ ∂ ∂ ∂ ∂ ∂ ∂
(10)
The finite element equations are given by
[ ] [ ] K M Fφ φ+ = (11)
[ ] [ ] [ ] Ω= ∫ dNNMT
(12)
[ ] [ ] [ ][ ] Ω= ∫ dBDBKT
(13)
[ ] Ω= ∫ dNqFT
(14)
where [ ]K is the moisture diffusivity matrix, [ ]M is the moisture velocity matrix, [ ]N is the shape function, F is the moisture flow vector, φ is the nodal
normalized moisture content, and φ is the change rate of the nodal normalized moisture concentration. The diffusivity matrix [D] is given by
[ ]
=
33
22
11
000000
DD
DD (15)
The matrix of derivatives of shape functions [ ]B is given by
[ ]
[ ]
[ ]
[ ]
∂∂∂∂∂∂
=
zNyNxN
B (16)
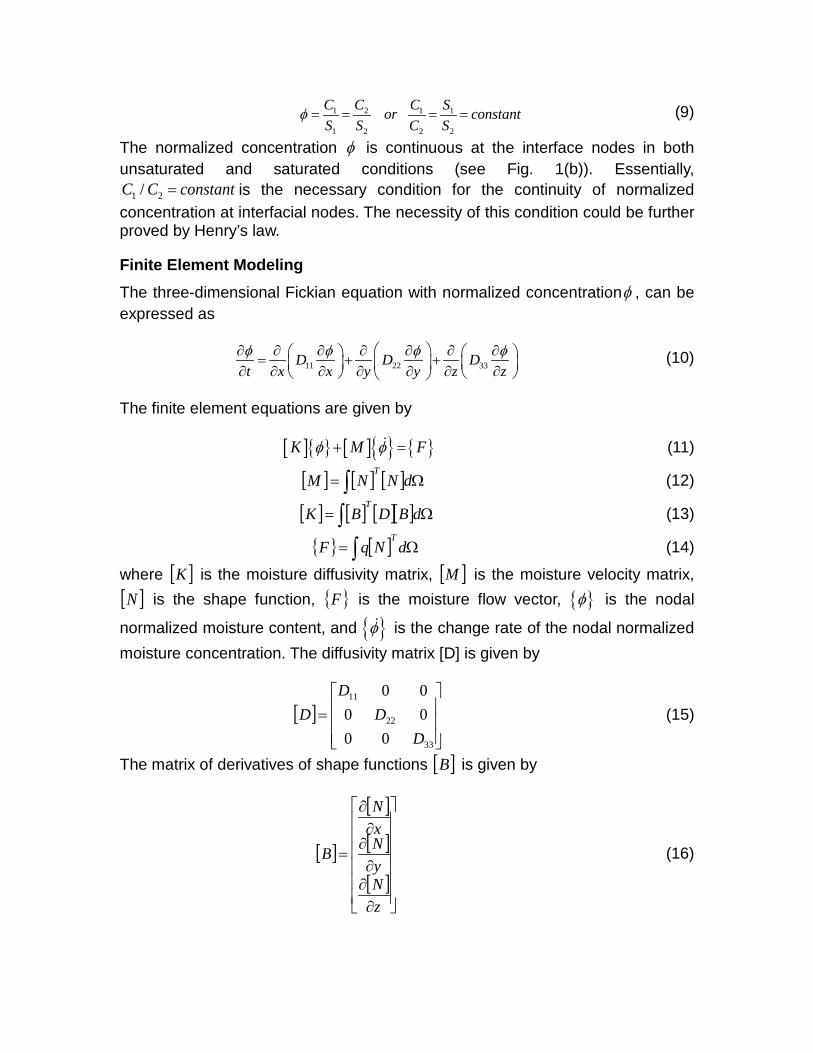
NUMERICAL SIMULATION To validate the moisture concentration-dependent diffusion model for layered hybrid composites, a case study was conducted and the results were compared with experimental findings from the literature. A detailed manufacturing process is presented in the same literature. All experimental specimens were made from unidirectional S-glass fiber-reinforced epoxy polymer GFRP prepreg 3M SP250-S29 and unidirectional high modulus carbon fiber-reinforced epoxy polymer CFRP prepreg Cyanamid T152/751/135. In Case 1, unidirectional three-layer hybrid composite specimens were layered up with 4 plies of GFRP prepregs on both the top and bottom and 8 plies of CFRP prepregs in the middle (see Fig. 2). The dimensions after curing were 2.76 in. x 2.76 in. x 0.13 in. (70 mm x 70 mm x 3.2 mm). The specimens were conditioned at 45 C° and 84% RH for 70 days. The moisture weight gain of multi-layer hybrid structure was calculated with
dndd
wnwwtotal WWW
WWWM
+++++
=21
21 (17)
where wiW and diW (i=1, 2, …..n) are the weight of absorbed moisture and initial weight for the nth layer component, respectively.
Figure 2. Geometry of three-layer hybrid plate (Case 1)
In Case 1, both the length and width of the plate are much larger than the thickness (the aspect ratio was 21.88), the moisture diffusion from four edge sides can be ignored. Hence, this case can be modeled as a one-dimensional diffusion problem along the thickness direction, which significantly reduces the computational cost. A mesh convergence study was conducted in this one-dimensional model. Four different mesh sizes, with 7, 11, 32, and 64 elements, in the thickness direction were investigated. Differences were evident in 7 and 11 elements, both of which had higher moisture concentration and normalized moisture concentration compared with the other two cases (see Fig. 3(a) and Fig. 3(b)). Finite element models with mesh sizes of 32 and 64 elements showed the results overlapping over each other, implying convergence of results. The moisture content value jump in Fig. 3(a) indicated the discontinuity of moisture concentration at the interfaces of CFRP and GFRP laminates, while the normalized moisture concentration is always continuous at the interfaces (see Fig. 3(b)). The convergence study was also conducted for later three-dimensional cases. In both one-dimensional and three-dimensional cases, the initial time
GFRP
CFRP
70 mm
70 mm 1.4 mm 0.9 mm
0.9 mm
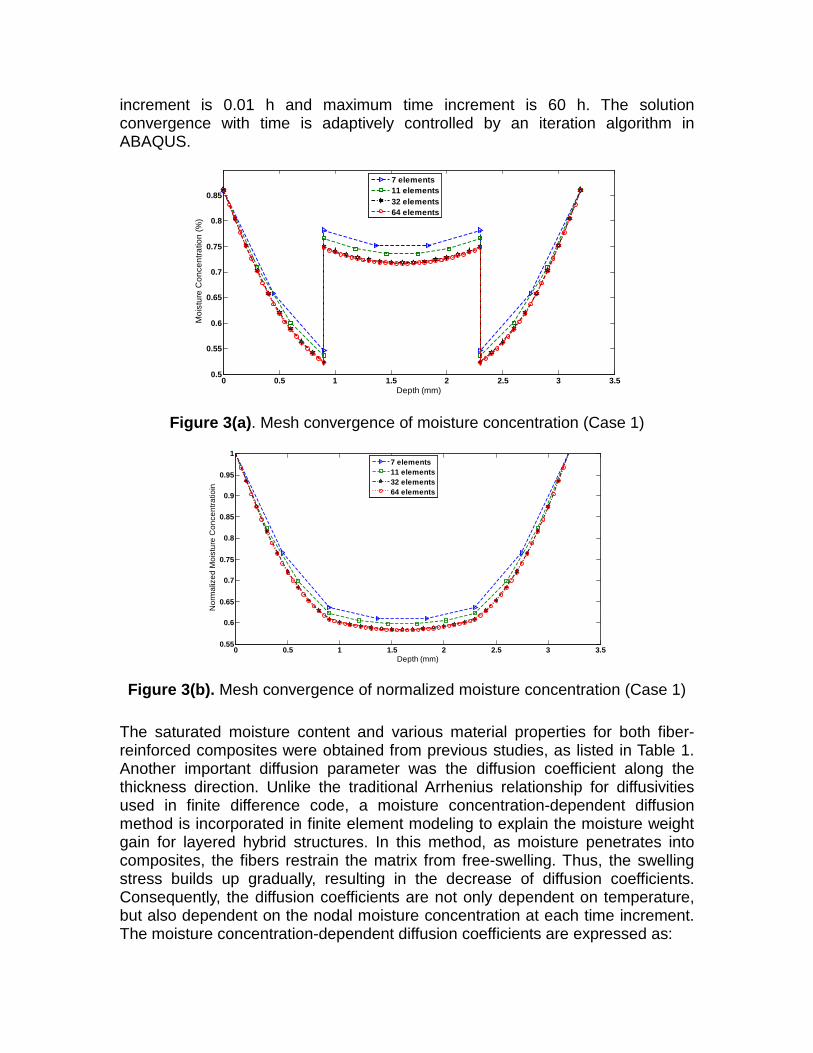
increment is 0.01 h and maximum time increment is 60 h. The solution convergence with time is adaptively controlled by an iteration algorithm in ABAQUS.
0 0.5 1 1.5 2 2.5 3 3.50.5
0.55
0.6
0.65
0.7
0.75
0.8
0.85
Depth (mm)
Moi
stur
e C
once
ntra
tion
(%)
7 elements11 elements32 elements64 elements
Figure 3(a). Mesh convergence of moisture concentration (Case 1)
0 0.5 1 1.5 2 2.5 3 3.50.55
0.6
0.65
0.7
0.75
0.8
0.85
0.9
0.95
1
Depth (mm)
Nor
mal
ized
Moi
stur
e C
once
ntra
tioin
7 elements11 elements32 elements64 elements
Figure 3(b). Mesh convergence of normalized moisture concentration (Case 1)
The saturated moisture content and various material properties for both fiber-reinforced composites were obtained from previous studies, as listed in Table 1. Another important diffusion parameter was the diffusion coefficient along the thickness direction. Unlike the traditional Arrhenius relationship for diffusivities used in finite difference code, a moisture concentration-dependent diffusion method is incorporated in finite element modeling to explain the moisture weight gain for layered hybrid structures. In this method, as moisture penetrates into composites, the fibers restrain the matrix from free-swelling. Thus, the swelling stress builds up gradually, resulting in the decrease of diffusion coefficients. Consequently, the diffusion coefficients are not only dependent on temperature, but also dependent on the nodal moisture concentration at each time increment. The moisture concentration-dependent diffusion coefficients are expressed as:

( ) ( ) ( )( )TREz
dehCDD ⋅−⋅Μ⋅Ψ⋅= /0 (18)
where ( )CΨ is the pattern function representing the dependence of diffusivity on nodal moisture concentration. ( )hM is an experimentally determined thickness factor which is similar to the edge correction factor, representing the dependence of diffusivity on the specimen thickness. In this study, the initial effective diffusivities were obtained from the initial slopes of moisture absorption curves. The pattern functions were obtained by trial-and-error methods. The resultant effective diffusivities of CFRP and GFRP in Case 1 are illustrated in Fig. 4(a). For both CFRP and GFRP composites, when nodal moisture concentration increases, the diffusivities continuously decrease, and when the moisture concentration approaches solubility value mM , the diffusivities gradually drift to a constant value. The concentration-dependent diffusivity curves in Fig. 4(a) are continuous fifth-order polynomial curves. The corresponding normalized pattern functions are given by
1C012.650-C016.443-C011.190C018.179-102.011 -52-83-114-165-20 +⋅⋅⋅⋅⋅⋅+⋅⋅⋅⋅=Ψ CCFRP (19) 1C015.339C011.338-C013.197C012.878-109.219 -62-73-114-155-20 +⋅⋅+⋅⋅⋅⋅+⋅⋅⋅⋅=Ψ CGFRP (20)
Table 1. Diffusion properties for CFRP and GFRP
CFRP GFRP ∞M 1.23% @ 84% RH 0.86% @ 84% RH
Density after Curing 1.54 g/cm3 1.90 g/cm3 Fiber Volume Fraction 56% 54%
The pattern function for CFRP is different from that of GFRP. The initial effective diffusivities for CFRP, GFRP were -6 22.708 x 10 mm / sec and -6 21.075 x 10 mm / sec , respectively. Fig. 4(b) illustrates that the simulation results from day 3 to day 49 overestimate the moisture uptake. But overall, the simulation results reasonably match with experimental findings.
0 0.2 0.4 0.6 0.8 1 1.2 1.40
0.5
1
1.5
2
2.5
3x 10⁻⁶
Moisture Concentration (%)
Diff
usiv
ity (m
m2 /s
ec)
Effective diffusivity Dz of CFRP in case 1
Effective diffusivity Dz of GFRP in case 1
Figure 4(a). Effective diffusivities of CFRP and GFRP (Case 1)

0 1 2 3 4 5 6 7 8 9 100
0.1
0.2
0.3
0.4
0.5
0.6
0.7
0.8
Square Root (time) (days 1/2)
Mt (%
)
Simulation results in case 1
Experimental results in case 1
Figure 4(b). Comparison between simulation results and experimental findings (Case 1)
The moisture concentration-dependent method was implemented using a user-defined subroutine USDFLD in ABAQUS version 6.10. Fig. 5 illustrates the flowchart of subroutine USDFLD. At the beginning of every time step, the normalized moisture concentration ϕ and moisture concentration c are calculated at all integration points. The user-defined subroutine USDFLD checks the new ϕ and c at all material points, and the moisture diffusivity matrix is updated according to these values. Then the updated moisture diffusivity matrix is incorporated in new assembly equation, which is iteratively solved to get new normalized moisture concentration and moisture concentration for next time step.
Start of New Step
Start of Increment
Solve
Converged?No
Calculate at integration point
USDFLD
Start of Iteration
Write Output
End of Step?No
ϕ
Yes
Figure 5. Flowchart of user-defined subroutine USDFLD

The moisture concentration-dependent diffusion method had been validated by comparing simulation results with experimental findings in Case 1 (see Fig. 4(b)). This case study was extended to Case 2. In Case 2, four-layer unidirectional hybrid laminates with or without adhesive layers were conditioned at 45 C° and 84% RH for 1.5 years, and the effect of adhesives on the moisture diffusion behavior was investigated. The laminate configuration, with and without adhesive layers, is illustrated in Fig. 6. Two different adhesive thicknesses (0.12 mm and 0.76 mm) were considered in this case.
Figure 6. Hybrid laminate configuration without (left) and with (right) adhesive layers (Case 2)
In this case, the thickness of multi-layer hybrid composite structure was considerable, thus the moisture contribution from four edges must be taken into account. The laminate configuration under investigation was symmetric with respect to both geometry and boundary conditions along three principle axes. To save computational cost, 1/8th of the geometry was modeled for hybrid laminates (see Fig. 7(a) and Fig. 7(b)). The three outer surfaces of the laminate configuration, with and without adhesive layers, were subjected to saturated boundary conditions.
Figure 7(a). 1/8th model of four-layer symmetric hybrid composites with adhesive
50 mm
50 mm 2.8 mm 2.8 mm
2.8 mm 2.8 mm
50 mm
50 mm 2.8 mm 2.8 mm
2.8 mm 2.8 mm
GFRP
CFRP FM-300
Path line 2
Path line 1

(Case 2)
Figure 7(b). 1/8th model of four-layer symmetric hybrid composites without adhesive (Case 2)
Since Case 1 and Case 2 are under the same temperature and relative humidity conditions, the same normalized pattern functions for both CFRP and GFRP in Case 1 applied to Case 2. In Case 2, the through-thickness diffusivities for CFRP and GFRP were calculated by dividing the effective diffusivities in Case 1 with edge correction factor. The edge correction factor in Case 1 was 1.191 which was determined using Equation (2). The longitudinal diffusivities were derived using the following equations:
( ) rf DvD ⋅−= 111 (21)
( ) rf DvD ⋅−= π/2122 (22)
where 11D is the longitudinal diffusivity, 22D is the transverse diffusivity, and rD is diffusivity in resin matrix. Because both the composite components are unidirectional, the diffusivity along thickness direction 33D in each component is the same as the transverse diffusivity. The resultant diffusion coefficients are illustrated in Fig. 8(a) and Fig. 8(b) for CFRP and GFRP components, respectively, at 45 C° /84% RH. The FM-300 adhesive layers were modeled as a homogenous material. The parameters in the Arrhenius equation were derived from the diffusivities taken at two temperatures. The resultant Arrhenius-type diffusivity equation for FM-300 is given as
( )TFM eD /-5523.2831
300 9.2166 ⋅=− (23)
Substituting T=318.15 K in Equation (23), the diffusivity of FM-300 was calculated as -7 22.6604 x 10 mm / sec . Similarly, the parameters in the solubility equation for FM-300 were derived from the equilibrium moisture content taken at two different levels of relative humidity. The resultant solubility equation for FM-300 is given as
1.34023.3225 RHM m ⋅= (24)
Path line 2
Path line 1

Substituting RH=84% in Equation (24), the equilibrium moisture content of FM-300 is calculated as 2.63%.
0 0.2 0.4 0.6 0.8 1 1.2 1.40
1
2
3
4
5
6
7x 10⁻⁶
Moisture Concentration (%)
Diff
usiv
ity (m
m2 /s
ec)
Diffusivity D22(D33) of CFRP in case 2
Diffusivity D11 of CFRP in case 2
Figure 8(a). Effective diffusivity of CFRP (Case 2)
0 0.1 0.2 0.3 0.4 0.5 0.6 0.7 0.8 0.90
0.5
1
1.5
2
2.5x 10⁻⁶
Moisture Concentration (%)
Diff
usiv
ity (m
m2 /s
ec)
Diffusivity D22(D33) of GFRP in case 2
Diffusivity D11 of GFRP in case 2
Figure 8(b). Effective diffusivity of GFRP (Case 2)
0 5 10 15 20 250
0.1
0.2
0.3
0.4
0.5
0.6
0.7
Square Root of Time (days 1/2)
Mt (%
)
Moisture uptake curve with 0.12 mm thickness adhesiveMoisture uptake curve with 0.76 mm thickness adhesiveMoisture uptake curve without adhesive
Figure 8(c). Moisture weight gain curves with and without adhesive layers (Case 2)

In Fig. 8(a), the ratio of longitudinal diffusivity 11D to transverse diffusivity ( 22D or 33D ) for CFRP was 2.8278 as per Equations (21) and (22) and the fiber volume fractions listed in Table 1. The ratio of longitudinal diffusivity to transverse diffusivity for GFRP was 2.693 as per the same equations. The initial effective longitudinal diffusivity for CFRP was -6 26.43 x 10 mm /sec and the initial effective longitudinal diffusivity for GFRP was -6 22.431 x 10 mm / sec . Fig. 8(c) illustrates the overall moisture uptake curves of three different hybrid composite structures (with three 0.12 mm adhesive layers, with three 0.76 mm adhesive layers and without adhesive) exposed to 45 C° /84% RH for 1.5 years. The results indicated that three 0.12 mm thick adhesive layers didn’t significantly influence the overall moisture uptake as compared to without-adhesive case. At the end of 1.5 years’ exposure, the overall moisture weight gain for hybrid structure without adhesive was 0.64%. For hybrid structure with 0.12 mm thickness adhesive, the moisture weight gain was 0.65%. For hybrid structure with 0.76 mm adhesive, the adhesive’s effect on moisture weight gain is negligible for the first 81 days, but after that, the difference of average moisture uptake between without-adhesive case and 0.76 mm adhesive case gradually increased. At the end of exposure, the moisture uptake percentage for hybrid structure with 0.76 mm thickness adhesive was 0.70%, which was 9.38% higher than without-adhesive case. The moisture concentration and normalized concentration distribution of three different hybrid composite structures after 1.5 years’ exposure are shown in Fig. 9, Fig. 10 and Fig. 11. Both discontinuity of the moisture concentration and continuity of the normalized concentration at the interfaces of different components can be clearly observed from these contours.
Figure 9. Moisture concentration and normalized concentration contour after 1.5
years’ exposure (without-adhesive)
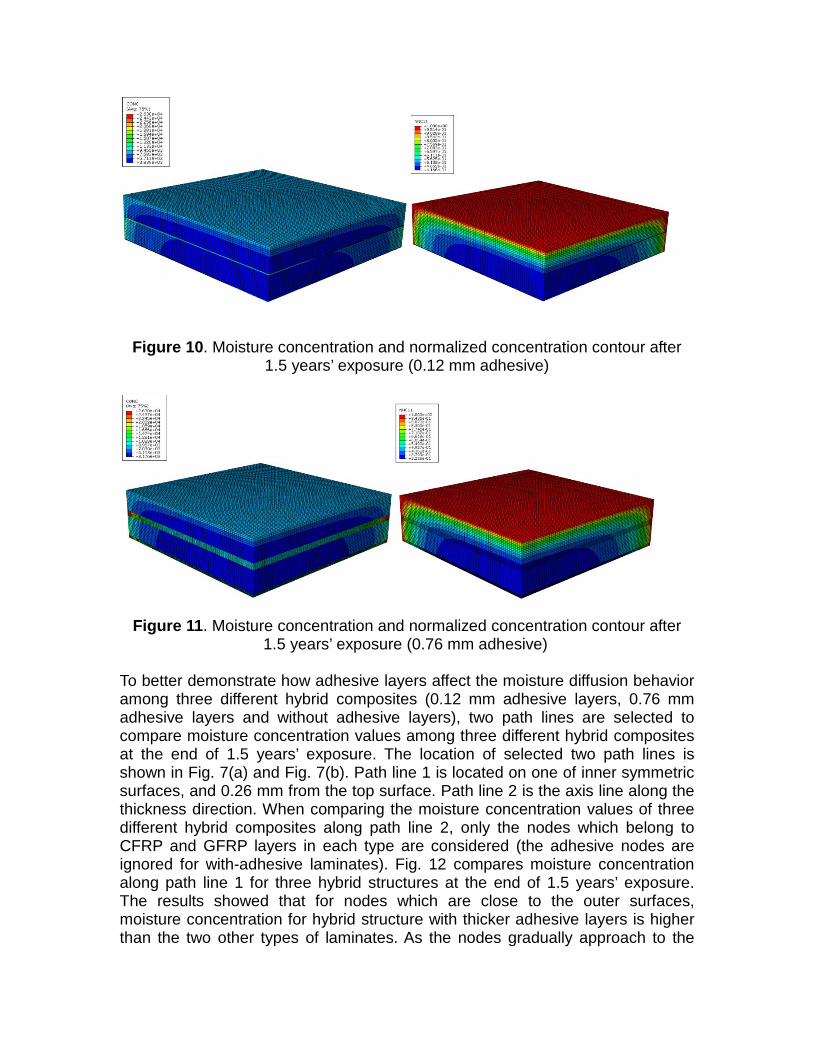
Figure 10. Moisture concentration and normalized concentration contour after 1.5 years’ exposure (0.12 mm adhesive)
Figure 11. Moisture concentration and normalized concentration contour after 1.5 years’ exposure (0.76 mm adhesive)
To better demonstrate how adhesive layers affect the moisture diffusion behavior among three different hybrid composites (0.12 mm adhesive layers, 0.76 mm adhesive layers and without adhesive layers), two path lines are selected to compare moisture concentration values among three different hybrid composites at the end of 1.5 years’ exposure. The location of selected two path lines is shown in Fig. 7(a) and Fig. 7(b). Path line 1 is located on one of inner symmetric surfaces, and 0.26 mm from the top surface. Path line 2 is the axis line along the thickness direction. When comparing the moisture concentration values of three different hybrid composites along path line 2, only the nodes which belong to CFRP and GFRP layers in each type are considered (the adhesive nodes are ignored for with-adhesive laminates). Fig. 12 compares moisture concentration along path line 1 for three hybrid structures at the end of 1.5 years’ exposure. The results showed that for nodes which are close to the outer surfaces, moisture concentration for hybrid structure with thicker adhesive layers is higher than the two other types of laminates. As the nodes gradually approach to the

center point, when the path depth is larger than around 14 mm, the moisture concentration for hybrid structure with 0.76 mm adhesive layers is the lowest among three types of laminates. This is because, at early stages, the longitudinal and transverse diffusivities of CFRP and GFRP are higher than the diffusivity of adhesive layers. After 81 days’ conditioning, the diffusivities in partial saturated regions of CFRP and GFRP components gradually decrease due to the residual stresses, while the diffusivity of adhesive layers is constant and also its solubility is higher than that of CFRP and GFRP layers. As a result, the adhesive nodes near the side surfaces can absorb moisture more quickly from the longitudinal and transverse directions at later stages than CFRP and GFRP components. The higher moisture concentration in the adhesive layers compared with surrounding CFRP and GFRP laminate can be observed from Fig. (10) and Fig. (11). Since adhesive nodes near the side surfaces have higher moisture concentration than that of surrounding CFRP and CFRP laminate, those nodes play a role of accelerating the moisture diffusion to the surrounding CFRP and CFRP nodes. While in the center region, the number of saturated adhesive nodes is not as many as the side adhesive nodes, thus the adhesive nodes near the center will not be able to play the acceleration role as the side adhesive nodes do. Also in the center region, most of CFRP and CFRP are not fully saturated; the diffusivity of CFRP and CFRP components is still higher than the diffusivity of adhesive layers. This is the reason that moisture concentration of hybrid structure with thicker adhesive layers along path line 2 is lower than the other two structures (as shown in Fig. 13). However, as time elapses, more and more adhesive nodes will gradually get saturated and its acceleration role will be more evident (as shown in Fig. 8(c)).
0 5 10 15 20 25
0.4
0.5
0.6
0.7
0.8
0.9
1
Path Line Depth (mm)
Moi
stur
e C
once
ntra
tion
(%)
0.12 mm adhesive0.76 mm adhesiveWithout adhesive
Figure 12. Comparison of moisture concentration along path line 1 among three
different hybrid structures after 1.5 years’ exposure

0 1 2 3 4 5 6
0.4
0.5
0.6
0.7
0.8
0.9
1
Path Line Depth (mm)
Moi
stur
e C
once
ntra
tion
(%)
Without adhesive0.12 mm adhesive (ignored adhesive layers)0.76 mm adhesive (ignored adhesive layers)
Figure 13. Comparison of moisture concentration along path line 2 among three different hybrid structures after 1.5 years’ exposure
Publications:
1. N. Roe, Z. Huo, K. Chandrashekhara, A. Buchok, “Three Dimensional Simulation of Moisture Diffusion in Thick Composites,” International SAMPE Technical Conference, Baltimore, MD, May 21-24, 2012.
2. N. Roe, Z. Huo, K. Chandrashekhara, A. Buchok and R.A. Brack, “Advanced Moisture Modeling of Polymer Composites,” Journal of Reinforced Plastics and Composites, 32(7), pp. 437-449, April 2013.
3. Z. Huo, V. Bheemreddy, K. Chandrashekhara and R.A. Brack, “Modeling and Simulation of Moisture Diffusion in Hybrid Fiber-reinforced Polymer Composites,” International SAMPE Technical Conference, Long Beach, CA, pp. 2472-2486, May 6-9, 2013.
4. Z. Huo, V. Bheemreddy, K. Chandrashekhara and R.A. Brack, “Modeling of Concentration-dependent Moisture Diffusion in Hybrid Fiber-reinforced Polymer Composites,” Journal of Composite Materials, DOI: 10.1177/0021998313519150, pp. 1-13, Jan. 2014.
Acknowledgements:
This project is funded by Bell Helicopter Textron Inc. and National University Transportation Center (NUTC) at Missouri S&T.


![Thermal-Mechanical Properties of Polyurethane-Clay Shape Memory Polymer … · properties of PU shape memory polymer [20]. Heat-treatment of the nano-clay removed the moisture and](https://static.fdocuments.in/doc/165x107/60e3c08a7d9f13103926d0ad/thermal-mechanical-properties-of-polyurethane-clay-shape-memory-polymer-properties.jpg)