Advanced miRNA Expression Analysis: miRNA and its Role in Human Disease Webinar Series Part 3
51
Sample to Insight Jonathan Shaffer, Ph.D. [email protected] Senior Scientist, Product Development Advanced miRNA expression analysis data analysis tutorial
-
Upload
qiagen -
Category
Healthcare
-
view
619 -
download
1
Transcript of Advanced miRNA Expression Analysis: miRNA and its Role in Human Disease Webinar Series Part 3

Sample to Insight
Jonathan Shaffer, Ph.D.
Senior Scientist, Product Development
Advanced miRNA expression analysis
data analysis tutorial

Sample to Insight
Legal disclaimer
Advanced miRNA expression analysis 2
QIAGEN products shown here are intended for molecular
biology applications. These products are not intended for
the diagnosis, prevention or treatment of a disease.
For up-to-date licensing information and product-specific
disclaimers, see the respective QIAGEN kit handbook or
user manual. QIAGEN kit handbooks and user manuals
are available at www.QIAGEN.com or can be requested
from QIAGEN Technical Services or your local distributor.

Sample to Insight
Welcome to our four-part webinar series on miRNAs
Advanced miRNA expression analysis 3
Part 1: Biofluid miRNA profiling: from sample to biomarker
Part 2: Meeting the challenges of miRNA research
Part 3: Advanced miRNA expression analysis
Part 4: Functional analysis of miRNA
miRNA and its role in human disease
Sample to Insight
Live data analysis demonstrations4
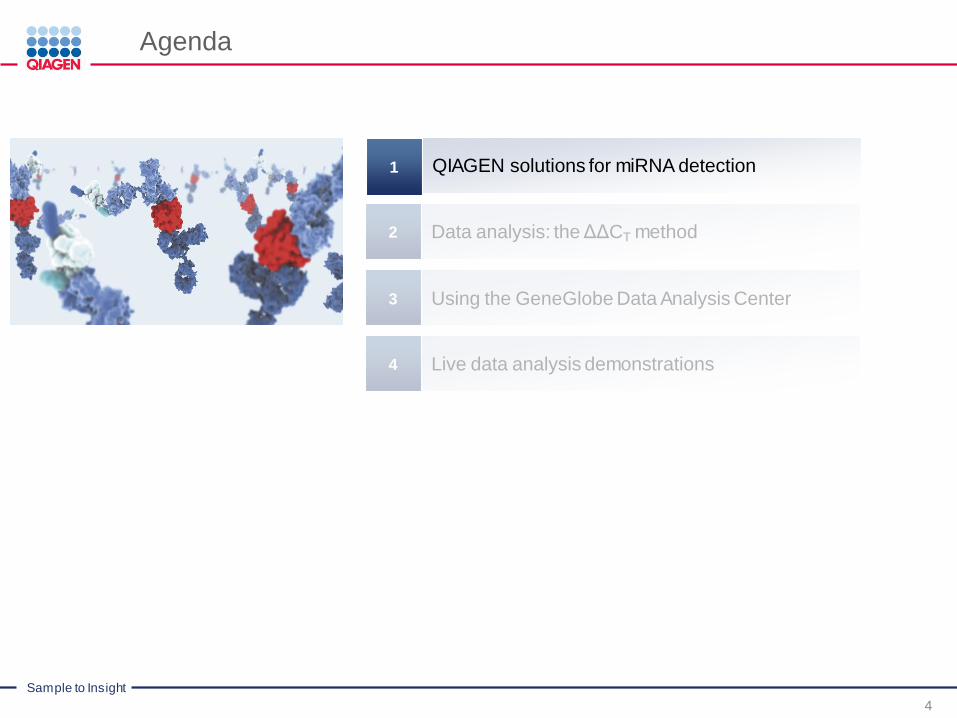
Agenda
1
Data analysis: the ΔΔCT method2
Using the GeneGlobe Data Analysis Center3
4
QIAGEN solutions for miRNA detection

Sample to Insight
Advanced miRNA expression analysis 5
QIAGEN Sample to Insight Solutions for miRNA research
Sample prepReal-time
PCR assaysData analysis Interpretation
QIAcube
miRNeasy Mini
miRNeasy Micro
miRNeasy FFPE
miRNeasySerum/Plasma
ExoRNeasySerum/Plasma
Instruments
QIAgilityRotorGene QCompatibility with all Real-time PCR instruments
miScript PCR System
miScript PreAMP
miScript Microfluidics
miScript PCR Arrays
miScript Primer Assays
GeneGlobe Data Analysis Center
Kits/solutions
Ingenuity Pathway Analysis
miScript MimicsmiScript Inhibitors

Sample to Insight
Advanced miRNA expression analysis 6
QIAGEN Sample to Insight solutions for miRNA research
Sample prepReal-time
PCR assaysData analysis Interpretation
QIAcube
miRNeasy Mini
miRNeasy Micro
miRNeasy FFPE
miRNeasySerum/Plasma
ExoRNeasySerum/Plasma
Instruments
QIAgilityRotorGene QCompatibility with all Real-time PCR instruments
miScript PCR System
miScript PreAMP
miScript Microfluidics
miScript PCR Arrays
miScript Primer Assays
GeneGlobe Data Analysis Center
Kits/solutions
Ingenuity Pathway Analysis
miScript MimicsmiScriptInhibitors

Sample to Insight
miScript PCR System
Advanced miRNA expression analysis 7
Complete miRNA quantification system
1. Reverse transcription
miScript II RT Kit
2. Preamplification for limiting RNA amounts
miScript PreAMP PCR Kit
miScript PreAMP Primer Mixes
3. High-throughput expression analysis
miScript miRNA PCR Arrays
4. Low-throughput miRNA quantification
miScript Primer Assays
5. Real-time PCR reagents
miScript SYBR Green PCR Kit

Sample to Insight
Advanced miRNA expression analysis 8
QIAGEN Sample to Insight Solutions for miRNA research
Sample prepReal-time
PCR assaysData analysis Interpretation
QIAcube
miRNeasy Mini
miRNeasy Micro
miRNeasy FFPE
miRNeasySerum/Plasma
ExoRNeasySerum/Plasma
Instruments
QIAgilityRotorGene QCompatibility with all Real-time PCR instruments
miScript PCR System
miScript PreAMP
miScript Microfluidics
miScript PCR Arrays
miScript Primer Assays
GeneGlobe Data Analysis Center
Kits/solutions
Ingenuity Pathway Analysis
miScript MimicsmiScriptInhibitors

Sample to Insight
Live data analysis demonstrations4
Agenda
1
Data analysis: the ΔΔCT method2
Using the GeneGlobe Data Analysis Center3
9
QIAGEN solutions for miRNA detection

Sample to Insight
Real-time PCR data analysis
Advanced miRNA expression analysis 10
(1) Schmittgen TD, Livak KJ.(2008):Analyzing real-time PCR data by the comparative C(T) method. Nat Protoc.;3(6):1101-8
(2) Livak, KJ, and Schmittgen, TD.(2001): Analysis of Relative Gene Expression Data Using Real-Time Quantitative PCR and the 2-∆∆CT Method METHODS 25, 402–408
(3) www.Gene-Quantification.info
CT = 23.8
Absolute quantification
Absolute input copies, based on a standard curve
Relative quantification
Comparative CT method: also known as the 2-∆∆CT method
Selection of internal control
Selection of calibrator (e.g., untreated control or normal sample)
Assumes that the PCR efficiency of the target gene is similar to the internal control gene (and that the efficiency of the PCR is close to 100%)
Fold change = 2-∆∆CT
∆CT = CTGene - CT
Normalizer
∆∆CT = ∆CT (sample 2) – ∆CT (sample 1) where sample 1
is the control sample and sample 2 is the experimental
sample

Sample to Insight
Data analysis workflow
Advanced miRNA expression analysis 11
Steps 1 and 2:
Set baseline and threshold to determine CT values
Step 3:
Export CT values
Step 4:
Analyze data using ΔΔCT method of relative quantification

Sample to Insight
Data analysis step 1: Set your baseline
Advanced miRNA expression analysis 12
Baseline
Definition: Noise level in early cycles where there is no detectable increase in
fluorescence due to PCR products
How to set:
Observe amplification plot using the “Linear View”
Determine the earliest visible amplification
Set the baseline from cycle 2 (or 3) to two cycles before the earliest visible amplification
Note: The number of cycles used to calculate the baseline can be changed and should be reduced if high template amounts are used
Important: Ensure baseline settings are
the same across all PCR runs in the
same analysis to allow comparison of
results

Sample to Insight
Data analysis step 2: Set your threshold
Advanced miRNA expression analysis 13
Threshold
Purpose: Used to determine the CT (threshold cycle) value. The point at which
the amplification curve intersects with the threshold line is called the CT
How to set:
Observe amplification plot using the “Log View”
Place the threshold in the lower half of the log-linear range of the amplification plot, above the background signal
Note: Never set the threshold in the plateau phase
Important: Ensure threshold settings
are the same across all PCR runs in
the same analysis to allow
comparison of results

Sample to Insight
Example: Setting the baseline and threshold
Advanced miRNA expression analysis 14
Applied Biosystems® 7900HT
Threshold: 0.2
Baseline: From cycle 2 (or 3) to two cycles before the earliest visible amplification
Threshold: Place in the lower half of the log-linear range of the amplification plot, above the background signal
Baseline: Cycles 3 to 15

Sample to Insight
Data analysis step 3: Export CT values
Advanced miRNA expression analysis 15
One 5 µm FFPE section used per FFPE isolation
Each isolation is from a different section
On average, each isolation provided enough total RNA for:
Two full human miRNome profiles
Ten pathway-focused PCR arrays
RT: 125 ng total RNA, HiSpec Buffer
qPCR: Human miFinder miScript miRNA PCR Array (0.5 ng cDNA per well)
4
8
12
16
20
24
28
32
36
40
1 7 13 19 25 31 37 43 49 55 61 67 73
Human miFinder miRNA Assay
CT V
alu
e
FFPE Isolation 1
FFPE Isolation 2
FFPE Isolation 3
4
8
12
16
20
24
28
32
36
40
1 7 13 19 25 31 37 43 49 55 61 67 73
Human miFinder miRNA Assay
CT V
alu
e
FFPE Isolation 1
FFPE Isolation 2
FFPE Isolation 3
Normal lung Lung tumor

Sample to Insight
Data analysis step 4: Analyze data
Advanced miRNA expression analysis 16
ΔΔCT method of relative quantification
Normal (N) lung total RNA Lung tumor (T) total RNA
N cDNA (Iso. 1) N cDNA (Iso. 2) N cDNA (Iso. 3) T cDNA (Iso. 1) T cDNA (Iso. 2) T cDNA (Iso. 3)
Exported CT values Exported CT valuesCalculate ΔCT
for each miRNAon each array
ΔCT = CTmiRNA – AVG CT
SN1/2/3/4/5/6 ΔCT = CTmiRNA – AVG CT
SN1/2/3/4/5/6
Tip for choosing an appropriate snoRNA / snRNA controls for normalization
Make sure that the selected controls are not influenced by the experimental conditions
Sample to Insight
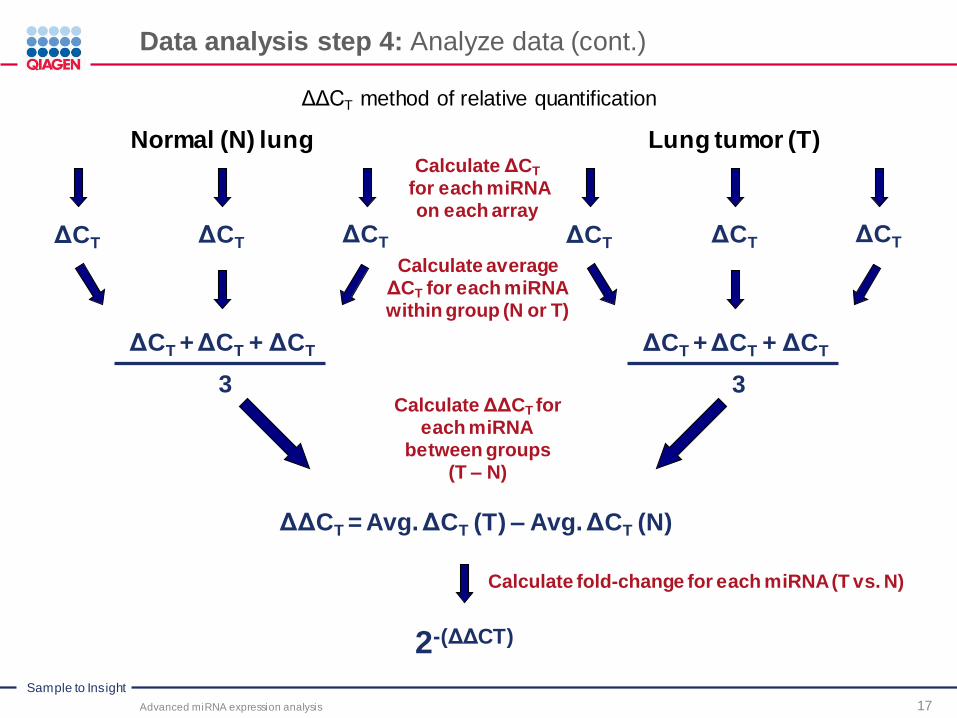
Data analysis step 4: Analyze data (cont.)
Advanced miRNA expression analysis 17
ΔΔCT method of relative quantification
Normal (N) lung Lung tumor (T)Calculate ΔCT
for each miRNAon each array
ΔCT ΔCTΔCT ΔCTΔCT ΔCT
Calculate ΔΔCT for each miRNA
between groups(T – N)
ΔΔCT = Avg. ΔCT (T) – Avg. ΔCT (N)
Calculate fold-change for each miRNA (T vs. N)
2-(ΔΔCT)
Calculate average ΔCT for each miRNAwithin group (N or T)
ΔCT + ΔCT + ΔCT
3
ΔCT + ΔCT + ΔCT
3
Sample to Insight
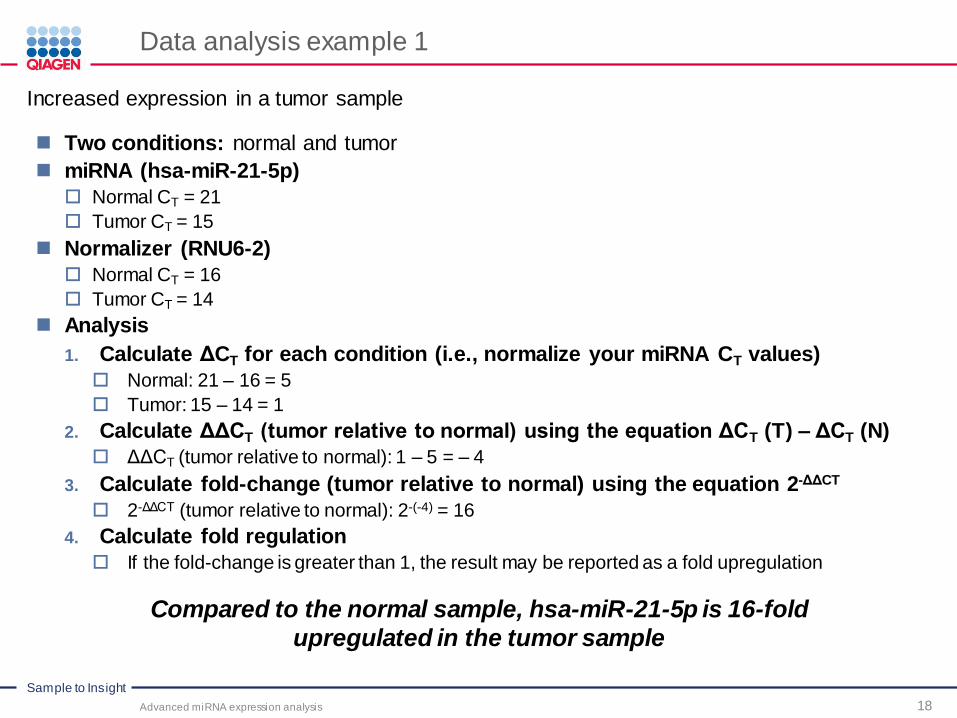
Data analysis example 1
Advanced miRNA expression analysis 18
Two conditions: normal and tumor
miRNA (hsa-miR-21-5p)
Normal CT = 21
Tumor CT = 15
Normalizer (RNU6-2)
Normal CT = 16
Tumor CT = 14
Analysis
1. Calculate ΔCT for each condition (i.e., normalize your miRNA CT values)
Normal: 21 – 16 = 5
Tumor: 15 – 14 = 1
2. Calculate ΔΔCT (tumor relative to normal) using the equation ΔCT (T) – ΔCT (N)
ΔΔCT (tumor relative to normal): 1 – 5 = – 4
3. Calculate fold-change (tumor relative to normal) using the equation 2-ΔΔCT
2-ΔΔCT (tumor relative to normal): 2-(-4) = 16
4. Calculate fold regulation
If the fold-change is greater than 1, the result may be reported as a fold upregulation
Increased expression in a tumor sample
Compared to the normal sample, hsa-miR-21-5p is 16-fold
upregulated in the tumor sample

Sample to Insight
Data analysis example 2
Advanced miRNA expression analysis 19
Two conditions: normal and tumor
miRNA (hsa-miR-16-5p)
Normal CT = 15
Tumor CT = 16
Normalizer (RNU6-2)
Normal CT = 16
Tumor CT = 14
Analysis
1. Calculate ΔCT for each condition (i.e., normalize your miRNA CT values)
Normal: 15 – 16 = –1
Tumor: 16 – 14 = 2
2. Calculate ΔΔCT (tumor relative to normal) using the equation ΔCT (T) – ΔCT (N)
ΔΔCT (tumor relative to normal): 2 – (–1) = 3
3. Calculate fold-change (tumor relative to normal) using the equation 2-ΔΔCT
2-ΔΔCT (tumor relative to normal): 2–(3) = 0.125
4. Calculate fold regulation:
If the fold-change is less than 1, the negative inverse of the result may be reported as a fold downregulation(–1 / 0.125 = –8)
Decreased expression in a tumor sample
Compared to the normal sample, hsa-miR-16-5p is 8-fold
downregulated in the tumor sample

Sample to Insight
Serum and plasma data analysis
Advanced miRNA expression analysis 20

Sample to Insight
Serum and plasma samples (cont.)
Advanced miRNA expression analysis 21
Special data analysis case
Serum or plasma total RNA samples: The snoRNA/ snRNA panel
of targets does not exhibit robust expression and therefore should not
be selected as normalization controls
Control Serum sample 1 Serum sample 2 Serum sample 3
SNORD61 36.3 34.3 35.8
SNORD68 34.6 35.0 35.3
SNORD72 35.0 35.0 35.0
SNORD95 31.1 39.3 33.5
SNORD96A 33.6 34.5 35.4
RNU6-2 37.9 39.1 35.0
Typical CT values for miScript PCR Controls in serum samples
Step 1: Calibrate samples using cel-miR-39-3p CT mean
Step 2: Normalize serum or plasma sample data
Option 1: Normalize CT values to CT mean of all commonly expressed miRNAs
Option 2: Normalize CT values to CT mean of invariant miRNAs

Sample to Insight
Serum and plasma samples (cont.)
Advanced miRNA expression analysis 22
Calibrate data using cel-miR-39-3p CT mean
Uncalibrated
Assay Sample 1 Sample 2
hsa-miR-16 16.0 19.0
hsa-miR-21 20.0 24.0
hsa-miR-192 23.0 26.0
hsa-miR-103 23.0 23.0
hsa-miR-25 22.0 25.0
cel-miR-39-3p 18.0 21.0
Compared to sample 1, all assays in sample 2 appear to have delayed CT values Compared to sample 1, cel-miR-39-3p in sample 2 also has a delayed CT value Conclusion: calibrate samples (cel-miR-39-3p CT values indicate a differential recovery)
Calibrated (Sample 2 CT values -3)
Assay Sample 1 Sample 2
hsa-miR-16 16.0 16.0
hsa-miR-21 20.0 21.0
hsa-miR-192 23.0 23.0
hsa-miR-103 23.0 20.0
hsa-miR-25 22.0 22.0
cel-miR-39-3p 18.0 18.0

Sample to Insight
Serum and plasma sample data normalization options
Advanced miRNA expression analysis 23
Option 1: CT values normalized to CT mean of expressed miRNAs
-8
-4
0
4
8
12
Fo
ld-R
eg
ula
tio
n
Calculate the CT mean for commonly expressed miRNAs
Those miRNAs with CT values < 30 (or 32 or 35) in all assessed samples

Sample to Insight
Serum and plasma sample data normalization options
Advanced miRNA expression analysis 24
Option 2: CT values normalized to CT mean of invariant miRNAs
-8
-4
0
4
8
12
Fo
ld-R
eg
ula
tio
n
Commonly Expressed miRNAs
hsa-let-7a hsa-miR-92a
hsa-let-7c hsa-miR-93
hsa-miR-21 hsa-miR-103a
hsa-miR-22 hsa-miR-126
hsa-miR-23a hsa-miR-145
hsa-miR-24 hsa-miR-146a
hsa-miR-25 hsa-miR-191
hsa-miR-26a hsa-miR-222
hsa-miR-26b hsa-miR-423-5p
Calculate the CT mean for invariant miRNAs
Choose at least four to six miRNAs that exhibit little CT variation

Sample to Insight
Serum and plasma sample data normalization options (cont.)
Advanced miRNA expression analysis 25
Comparison of normalization methods
Option 1:
Commonly expressed miRNAs(miRNome, 384HC, pathway)
Option 2:
Invariant panel of miRNAs(small panel screening, single assays)
-8
-4
0
4
8
12
Fo
ld-R
eg
ula
tio
n
-8
-4
0
4
8
12
Fo
ld-R
eg
ula
tio
n
Note 1: In this example, fold regulation looks highly similar, irrespective of the
chosen normalization method. This is correct, as your results should be
independent of the chosen normalization method
Note 2: For small panel screening, do not use a CT mean of all miRNAs, as this
array is biased (miRNA assays included on this array are not random)

Sample to Insight
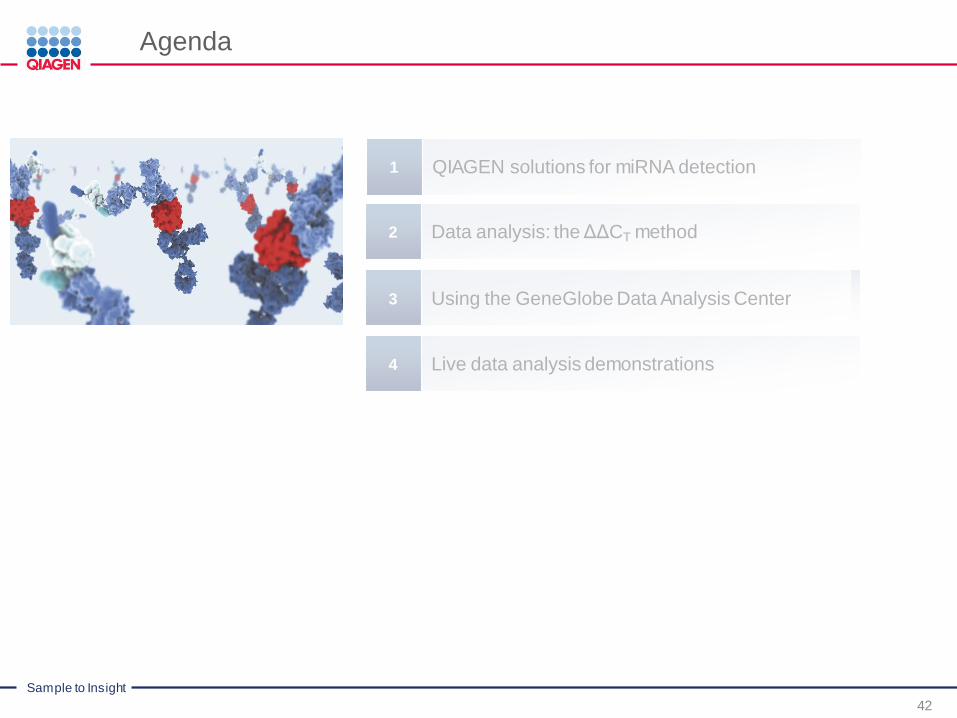
Live data analysis demonstrations4
Agenda
1
Data analysis: the ΔΔCT method2
Using the GeneGlobe Data Analysis Center3
26
QIAGEN solutions for miRNA detection
Sample to Insight
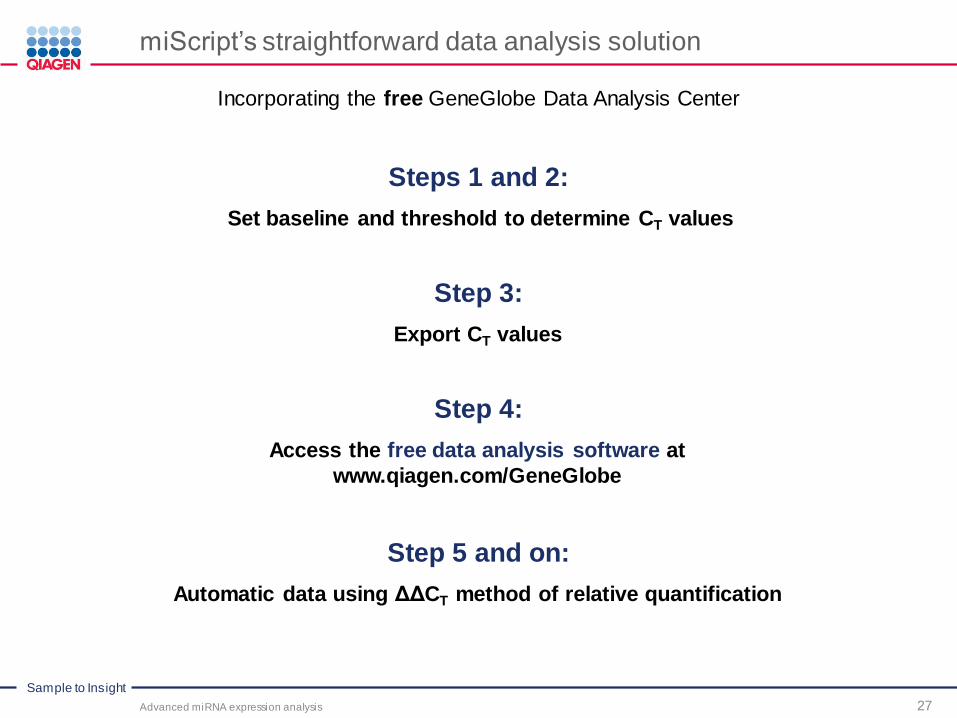
miScript’s straightforward data analysis solution
Advanced miRNA expression analysis 27
Incorporating the free GeneGlobe Data Analysis Center
Steps 1 and 2:
Set baseline and threshold to determine CT values
Step 3:
Export CT values
Step 4:
Access the free data analysis software at
www.qiagen.com/GeneGlobe
Step 5 and on:
Automatic data using ΔΔCT method of relative quantification
Sample to Insight
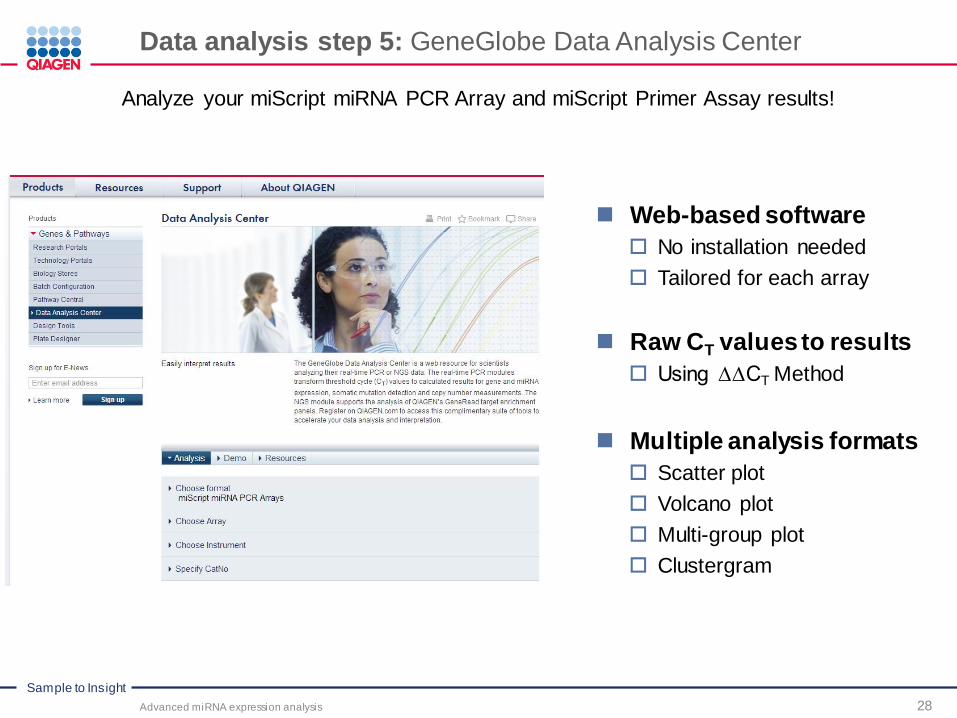
Data analysis step 5: GeneGlobe Data Analysis Center
Advanced miRNA expression analysis 28
Analyze your miScript miRNA PCR Array and miScript Primer Assay results!
Web-based software
No installation needed
Tailored for each array
Raw CT values to results
Using ∆∆CT Method
Multiple analysis formats
Scatter plot
Volcano plot
Multi-group plot
Clustergram

Sample to Insight
GeneGlobe Data Analysis Center
Advanced miRNA expression analysis 29
Step 1
What should you do at this page?
1. Choose format
2. Choose array
3. Choose instrument
4. Confirm catalog number
5. Click Start Analysis
1. Format
3. Instr.
2. Array
4. CatNo
5. Click Start Analysis

Sample to Insight
GeneGlobe Data Analysis Center (cont.)
Advanced miRNA expression analysis 30
Step 2
Upload data tab
What should you do at this tab?
1. Verify technology
2. Verify catalog number
3. Verify plate format
4. Upload exported CT values
5. Click Upload
4. Upload exported CT values
5. Click Upload
1. Technology
3. Plate Format
2. Cat. No.

Sample to Insight
GeneGlobe Data Analysis Center (cont.)
Advanced miRNA expression analysis 31
Step 3
Analysis setup tab Uploaded Data
Key features:
All miRNAs and controls found on
chosen array
All CT data uploaded to software
What should you do at this tab?
Verify that your data has been uploaded
correctly
Sample to Insight
GeneGlobe Data Analysis Center (cont.)
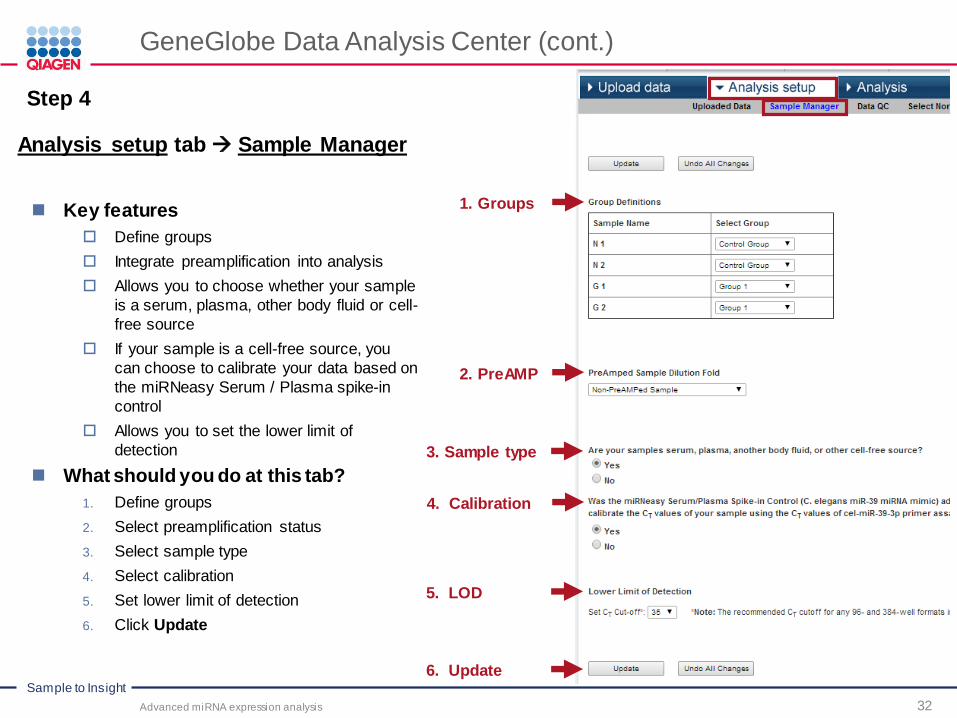
Advanced miRNA expression analysis 32
Step 4
Analysis setup tab Sample Manager
Key features
Define groups
Integrate preamplification into analysis
Allows you to choose whether your sample
is a serum, plasma, other body fluid or cell-
free source
If your sample is a cell-free source, you
can choose to calibrate your data based on
the miRNeasy Serum / Plasma spike-in
control
Allows you to set the lower limit of
detection
What should you do at this tab?
1. Define groups
2. Select preamplification status
3. Select sample type
4. Select calibration
5. Set lower limit of detection
6. Click Update
1. Groups
3. Sample type
2. PreAMP
4. Calibration
5. LOD
6. Update

Sample to Insight
GeneGlobe Data Analysis Center (cont.)
Advanced miRNA expression analysis 33
Step 5 (ONLY IF YOU CALIBRATE YOUR DATA)
Analysis setup tab Processed Data
Key features:
Shows data that has been calibrated
using the miRNeasy Serum / Plasma
spike-in control assay (cel-miR-39-3p)
CT values
What should you do at this tab?
Verify that your data has been calibrated
correctly

Sample to Insight
GeneGlobe Data Analysis Center (cont.)
Advanced miRNA expression analysis 34
Step 6
Analysis setup tab Data QC
Key features:
Display results of quality checks:
PCR efficiency
RT efficiency
What should you do at this tab?
Verify that your samples have
passed the QC checks

Sample to Insight
GeneGlobe Data Analysis Center (cont.)
Advanced miRNA expression analysis 35
Step 7
Analysis setup tab Select Normalization Method
Key features:
Provides four common methods
for data normalization
Manual selection of HKG
Auto selection of HKG
Auto selection from Full Plate
Global CT mean of expressed miRNAs
What should you do at this tab?
Choose how you want your data
to be normalized
Choose
normalization
method

Sample to Insight
GeneGlobe Data Analysis Center (cont.)
Advanced miRNA expression analysis 36
Step 8
Analysis setup tab Data Overview

Sample to Insight
GeneGlobe Data Analysis Center (cont.)
Advanced miRNA expression analysis 37
Step 9
Analysis tab: this tab provides an overview of all ΔΔCT related calculations and provides a
guide for you regarding the trust that you should place in your data.
Sample to Insight
GeneGlobe Data Analysis Center (cont.)
Advanced miRNA expression analysis 38
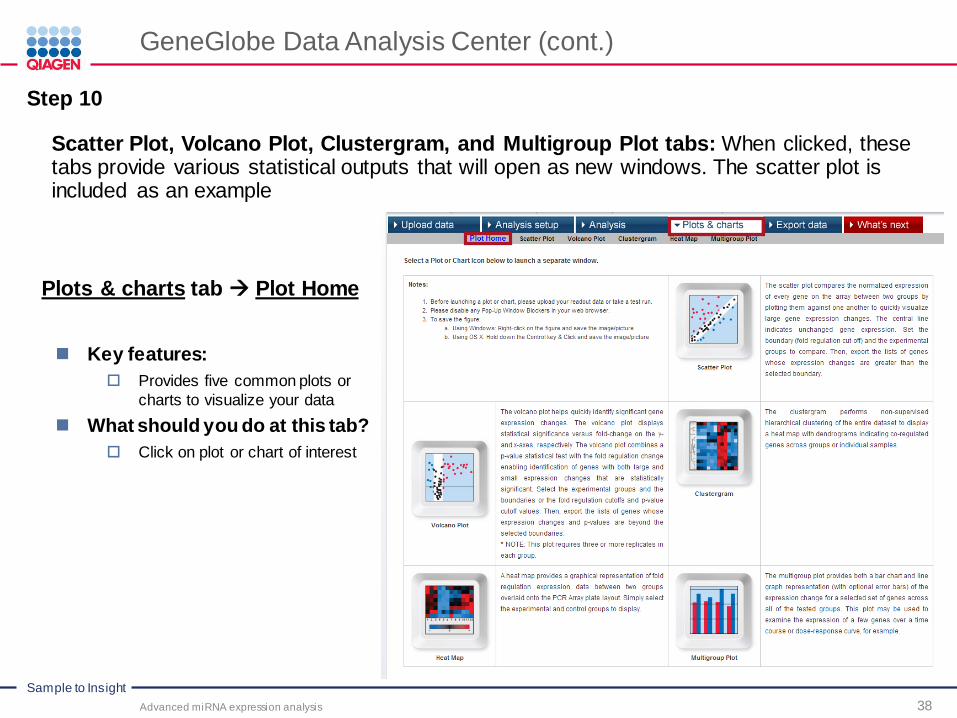
Step 10
Scatter Plot, Volcano Plot, Clustergram, and Multigroup Plot tabs: When clicked, these tabs provide various statistical outputs that will open as new windows. The scatter plot is included as an example
Plots & charts tab Plot Home
Key features:
Provides five common plots or
charts to visualize your data
What should you do at this tab?
Click on plot or chart of interest

Sample to Insight
GeneGlobe Data Analysis Center (cont.)
Advanced miRNA expression analysis 39
Step 11
Export data tab
Key features:
Allows you to export your analysis results of choice
What should you do at this tab?
1. Select analysis results to export
2. Click Export
1. Select results
2. Export
Sample to Insight
GeneGlobe Data Analysis Center (cont.)
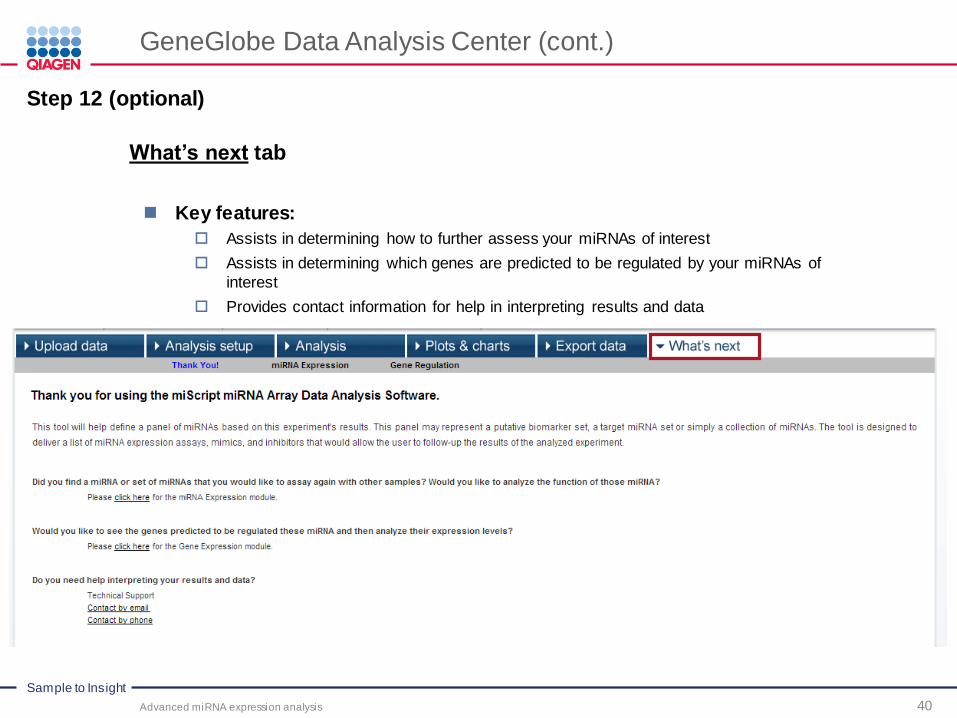
Advanced miRNA expression analysis 40
Step 12 (optional)
What’s next tab
Key features:
Assists in determining how to further assess your miRNAs of interest
Assists in determining which genes are predicted to be regulated by your miRNAs of
interest
Provides contact information for help in interpreting results and data

Sample to Insight
GeneGlobe Data Analysis Center (cont.)
Advanced miRNA expression analysis 41
Step 13 (optional)
What’s next tab miRNA Expression
Key features:
Assists in determining
how to further assess
your miRNAs of interest
Sample to Insight
Live data analysis demonstrations4
Agenda
1
Data analysis: the ΔΔCT method2
Using the GeneGlobe Data Analysis Center3
42
QIAGEN solutions for miRNA detection

Sample to Insight
Live data analysis demonstration
Advanced miRNA expression analysis 43
How to use the GeneGlobe data analysis center
Web-based software
No installation needed
Tailored for each array
Raw CT values to results
Using ∆∆CT Method
Multiple Analysis Formats
Scatter Plot
Volcano Plot
Multi-Group Plot
Clustergram

Sample to Insight
Live data analysis example 1
Advanced miRNA expression analysis 44
Is miRNA expression altered under hypoxic conditions?
Treatment: ± deferoxamine (DFO) for 24 hr
Isolation: miRNeasy Mini Kit
RT: miScript II RT Kit (HiSpec)
qPCR: miFinder 384HC
miScript miRNA PCR Array
Free data analysis
Experimental workflow
Seed Hep G2 cells

Sample to Insight
Live data analysis demonstration: serum sample data
Advanced miRNA expression analysis 45
How to use the GeneGlobe data analysis center
Web-based software
No installation needed
Tailored for each array
Raw CT values to results
Using ∆∆CT Method
Multiple analysis formats
Scatter plot
Volcano plot
Multi-group plot
Clustergram

Sample to Insight
Live data analysis example 2
Advanced miRNA expression analysis 46
Is serum miRNA expression altered in colorectal cancer?
Experimental workflow:
5 µl serum input
Serum samples: Normal (n=3) and
colorectal cancer (n=3)
Isolation: miRNeasy Serum / Plasma Kit
RT: miScript II RT Kit (HiSpec)
qPCR: Serum & Plasma 384HC
miScript miRNA PCR Array
70 nl serum equivalents for an entire plate
Free data analysis
PreAMP: miScript PreAMP PCR Kit and
miScript PreAMP Primer Mix
Sample to Insight
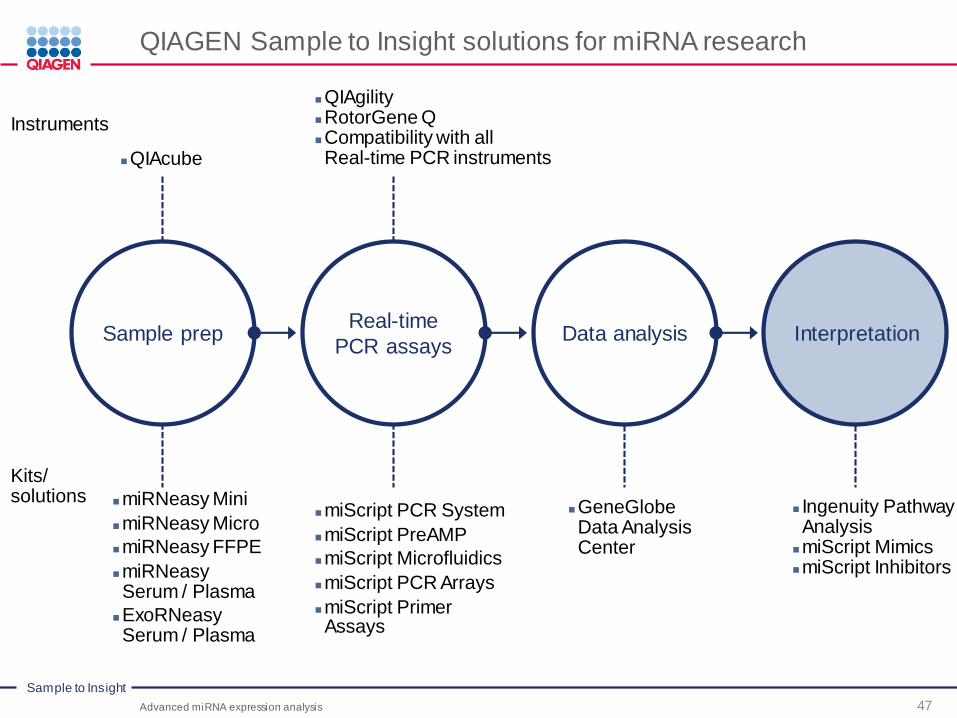
Advanced miRNA expression analysis 47
QIAGEN Sample to Insight solutions for miRNA research
Sample prepReal-time
PCR assaysData analysis Interpretation
QIAcube
miRNeasy Mini
miRNeasy Micro
miRNeasy FFPE
miRNeasySerum / Plasma
ExoRNeasySerum / Plasma
Instruments
QIAgilityRotorGene QCompatibility with all Real-time PCR instruments
miScript PCR System
miScript PreAMP
miScript Microfluidics
miScript PCR Arrays
miScript Primer Assays
GeneGlobe Data Analysis Center
Kits/solutions
Ingenuity Pathway Analysis
miScript MimicsmiScript Inhibitors

Sample to Insight
Ingenuity Pathway Analysis (IPA)
Advanced miRNA expression analysis 48
Asking “what’s next?” by modeling, analyzing and understanding complex 'omics data
Analysis of gene expression / miRNA / SNP microarray data
Deeper understanding of metabolomics, proteomics and RNAseq data
Identification of upstream regulators
Insight into molecular and chemical interactions and cellular phenotypes
Discoveries about disease processes

Sample to Insight
Where can I find the products discussed today?
Advanced miRNA expression analysis 49
www.qiagen.com
www.qiagen.com/GeneGlobe

Sample to Insight
Advanced miRNA expression analysis 50
QIAGEN Sample to Insight solutions for miRNA research
Sample prepReal-time
PCR assaysData analysis Interpretation
QIAcube
miRNeasy Mini
miRNeasy Micro
miRNeasy FFPE
miRNeasy Serum / Plasma
ExoRNeasySerum / Plasma
Instruments
QIAgilityRotorGene QCompatibility with all Real-time PCR instruments
miScript PCR System
miScript PreAMP
miScript Microfluidics
miScript PCR Arrays
miScript Primer Assays
GeneGlobe Data Analysis Center
Kits/solutions
Ingenuity Pathway Analysis
miScript MimicsmiScript Inhibitors

Sample to Insight
Advanced miRNA expression analysis 51
Thank you for attending today’s webinar!
Jonathan Shaffer, Ph.D.
Contact QIAGEN
1-800-426-8157
Questions?