Advanced GPC Part 2 – GPC and Light Scattering. Introduction As well as viscometers, the use of...
43
Advanced GPC Part 2 – GPC and Light Scattering
-
date post
21-Dec-2015 -
Category
Documents
-
view
226 -
download
2
Transcript of Advanced GPC Part 2 – GPC and Light Scattering. Introduction As well as viscometers, the use of...
Advanced GPC Part 2 – GPC and Light Scattering
Introduction
As well as viscometers, the use of light scattering detector is becoming more prevalent
Light scattering detector have the same advantages as viscometers, they give molecular weights that are not dependent on calibrants
With light scattering detectors, you don’t even have to calibrate the column!
They also give other information relating to the polymer molecules in solution
They are however fairly difficult to use and data interpretation is complex
This presentation outlines light scattering and the combination of light scattering and viscometry, triple detection
Light Scattering of Polymers
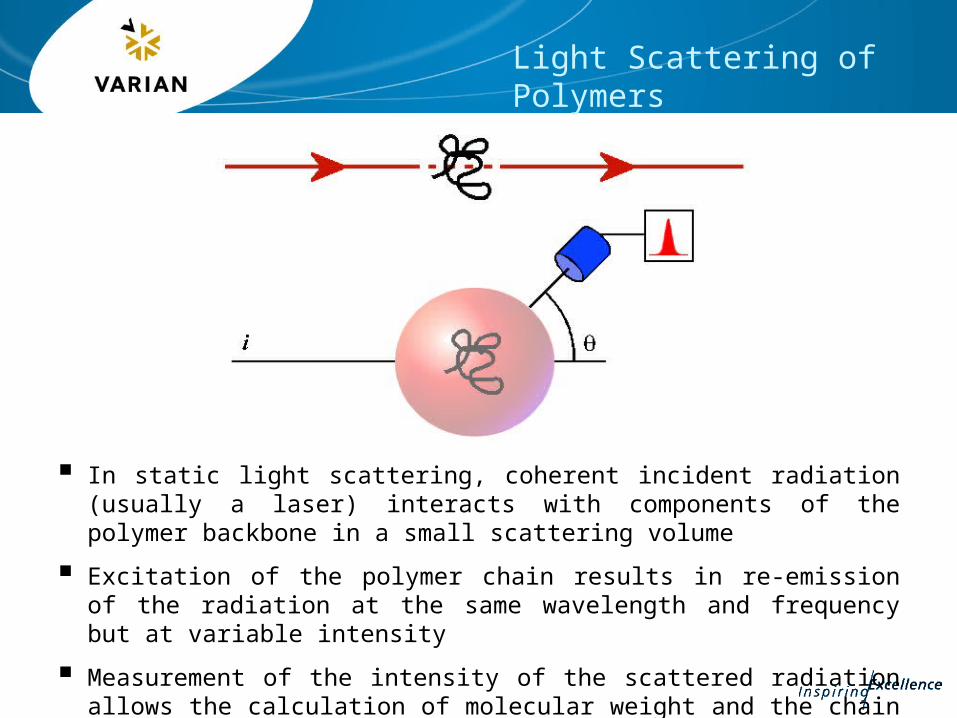
In static light scattering, coherent incident radiation (usually a laser) interacts with components of the polymer backbone in a small scattering volume
Excitation of the polymer chain results in re-emission of the radiation at the same wavelength and frequency but at variable intensity
Measurement of the intensity of the scattered radiation allows the calculation of molecular weight and the chain dimensions
Determination of Molecular Weight by Light scattering
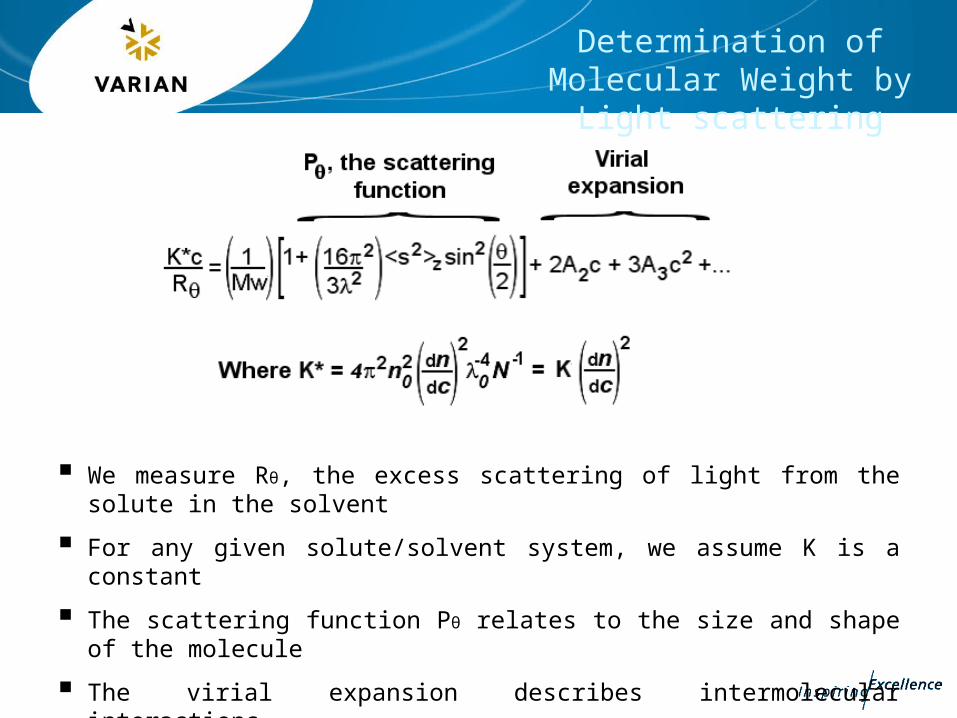
We measure Rθ, the excess scattering of light from the solute in the solvent
For any given solute/solvent system, we assume K is a constant
The scattering function Pθ relates to the size and shape of the molecule
The virial expansion describes intermolecular interactions
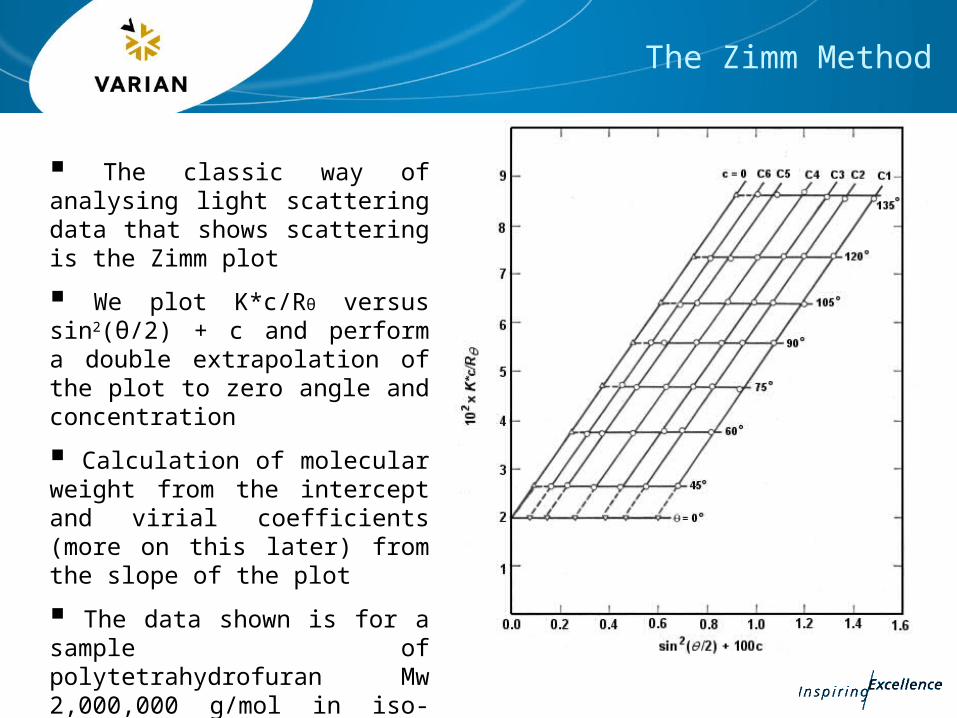
The classic way of analysing light scattering data that shows scattering is the Zimm plot
We plot K*c/Rθ versus sin2(θ/2) + c and perform a double extrapolation of the plot to zero angle and concentration
Calculation of molecular weight from the intercept and virial coefficients (more on this later) from the slope of the plot
The data shown is for a sample of polytetrahydrofuran Mw 2,000,000 g/mol in iso-propanol at 46ºC
The Zimm Method
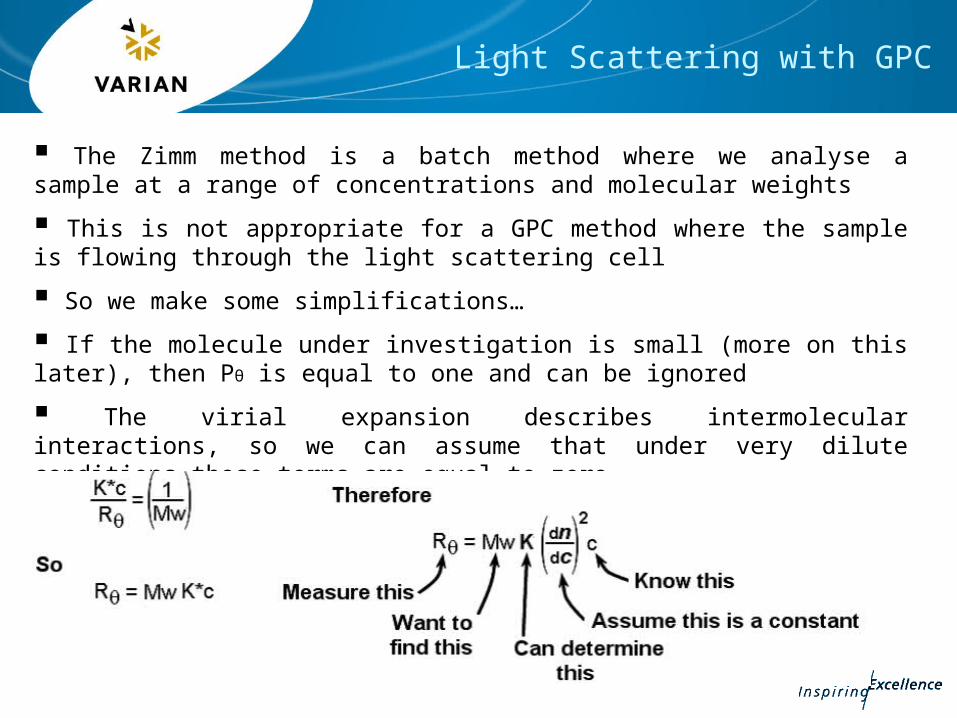
The Zimm method is a batch method where we analyse a sample at a range of concentrations and molecular weights
This is not appropriate for a GPC method where the sample is flowing through the light scattering cell
So we make some simplifications…
If the molecule under investigation is small (more on this later), then Pθ is equal to one and can be ignored
The virial expansion describes intermolecular interactions, so we can assume that under very dilute conditions these terms are equal to zero
Light Scattering with GPC
Scattering for Larger Molecules
If we are looking at smaller molecules, we can measure the light at any angle and determine molecular weight from the simplified equation
However, when the molecules are large (greater then 1/20th the wavelength of the light), the simplification does not work because Pθ is not equal to one
This causes a problem as we now need to know Pθ
But it is also useful, as Pθ is related to s, the radius of gyration, a measure of the size of the molecule
If we can measure Pθ, not only will we be able to determine the molecular weight of the polymer using the light scattering equation, but we should be able to determine the molecular size
Molecular Size and Light Scattering
From the classical static light scattering equation, the size of the scattering molecule can be measured, the s term in the light scattering equation
This is called the radius of gyration, also known as Rg
The value of <s2>z, the mean square radius of gyration, is related to the characteristic dimensions of different molecular shapes are shown below
For rods (length of rod)2 = 12<s2>z
For spheres (radius of sphere)2 = 5<s2>z/3
For coils (root mean square end to end distance)2 = 6<s2>z
The value of s is very useful as it can tell us a lot about the polymer
What Does Radius of Gyration Really Mean?
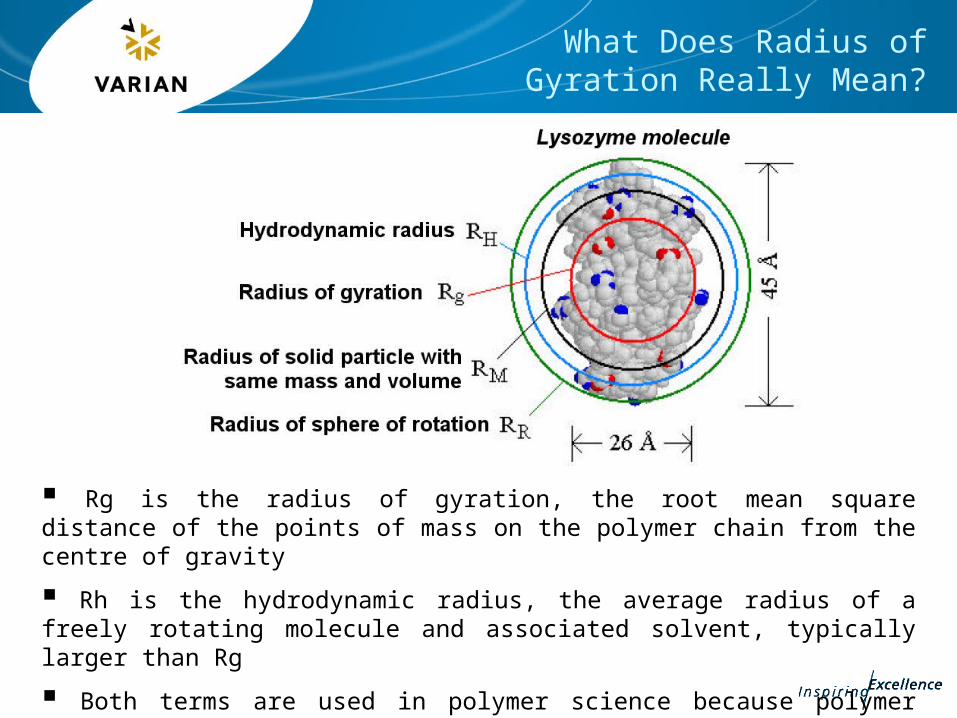
Rg is the radius of gyration, the root mean square distance of the points of mass on the polymer chain from the centre of gravity
Rh is the hydrodynamic radius, the average radius of a freely rotating molecule and associated solvent, typically larger than Rg
Both terms are used in polymer science because polymer molecules in solution do not conform to the static hard sphere model
Why Does Pθ Change with Big Molecules?
When the scattering molecule is small, Pθ is equal to unity
As the molecule grows in size compared to the wavelength of the light, Pθ falls below one
This is because the molecule stops acting like a single point scattering light, and starts acting like a collection of points
This causes interference in the light scattered from the different points which affects the total amount of scattered light we can measure
The degree of interference is extremely angular dependent
Trying to measure this interference affect is why light scattering measurements are often performed at different angles or at more than one angle
Angular Dependence of Scattering from Large Molecules
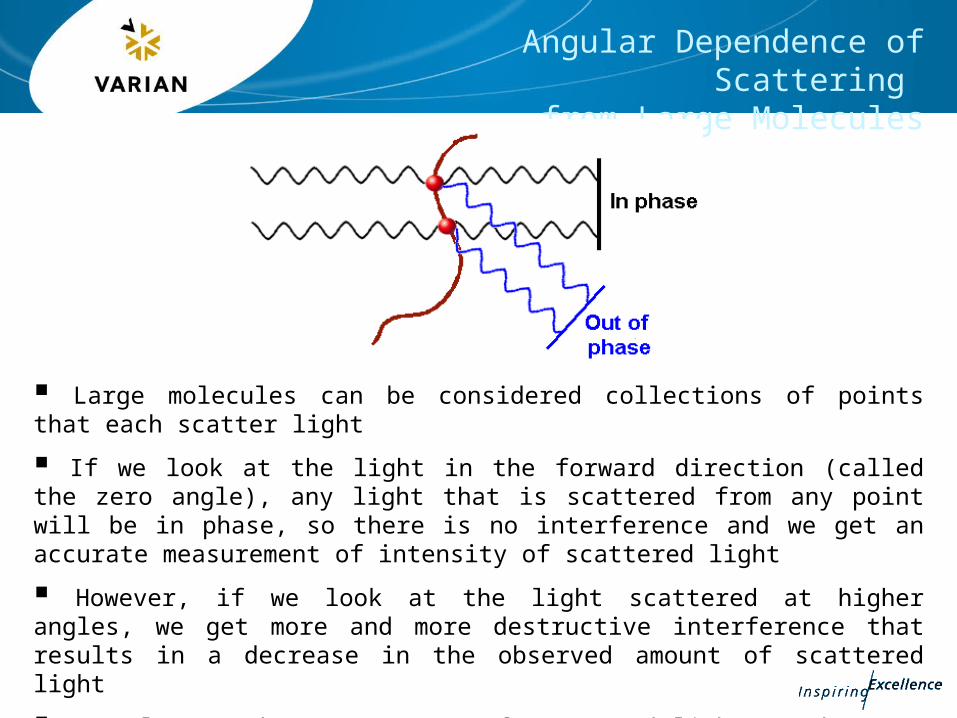
Large molecules can be considered collections of points that each scatter light
If we look at the light in the forward direction (called the zero angle), any light that is scattered from any point will be in phase, so there is no interference and we get an accurate measurement of intensity of scattered light
However, if we look at the light scattered at higher angles, we get more and more destructive interference that results in a decrease in the observed amount of scattered light
We only get the true amount of scattered light at the zero angle
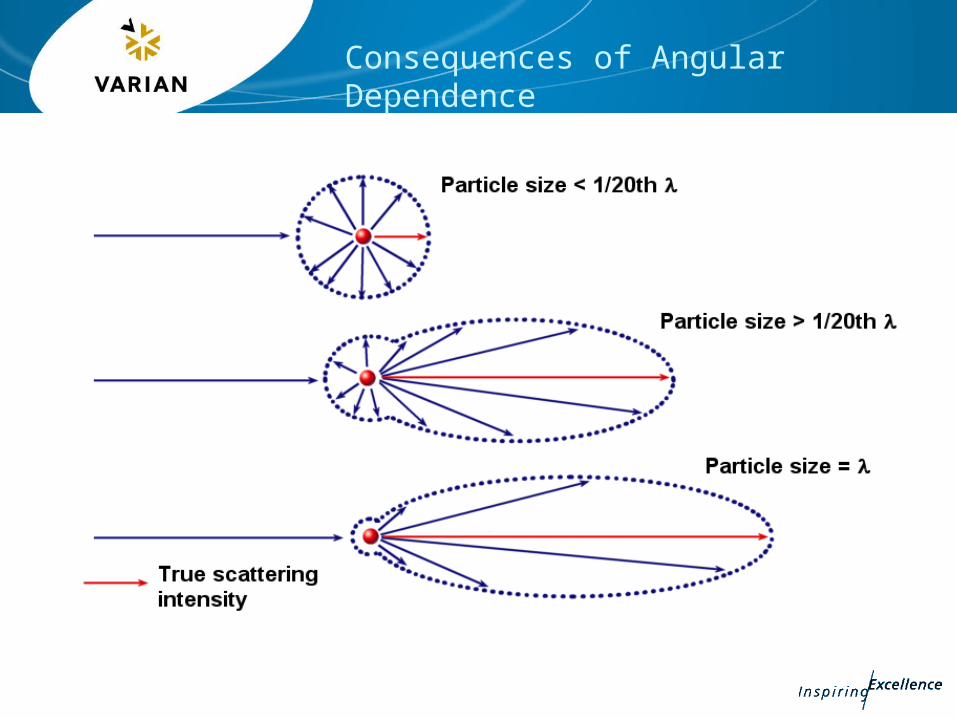
Consequences of Angular Dependence
Results and Angular Dependence
Angular dependence can affect the accuracy of the calculated results, especially at high molecular weight (large molecular sizes)
If we measure at a single angle, the closer to the zero angle, the less angular dependence in the scattered light intensity and the greater the accuracy of the calculated result
We can’t measure at the zero angle, as the rest of the unscattered laser beam comes through at that point!
We must choose another angle
Generally, the closer to the zero angle the better the accuracy of the result as we obtain closer to the true scattering intensity, but the noisier the data and the lower the precision of the result
The higher the angle of measurement the lower the accuracy due to interference effects, but the better the quality of data and the higher the precision in the result
We have a dilemma!
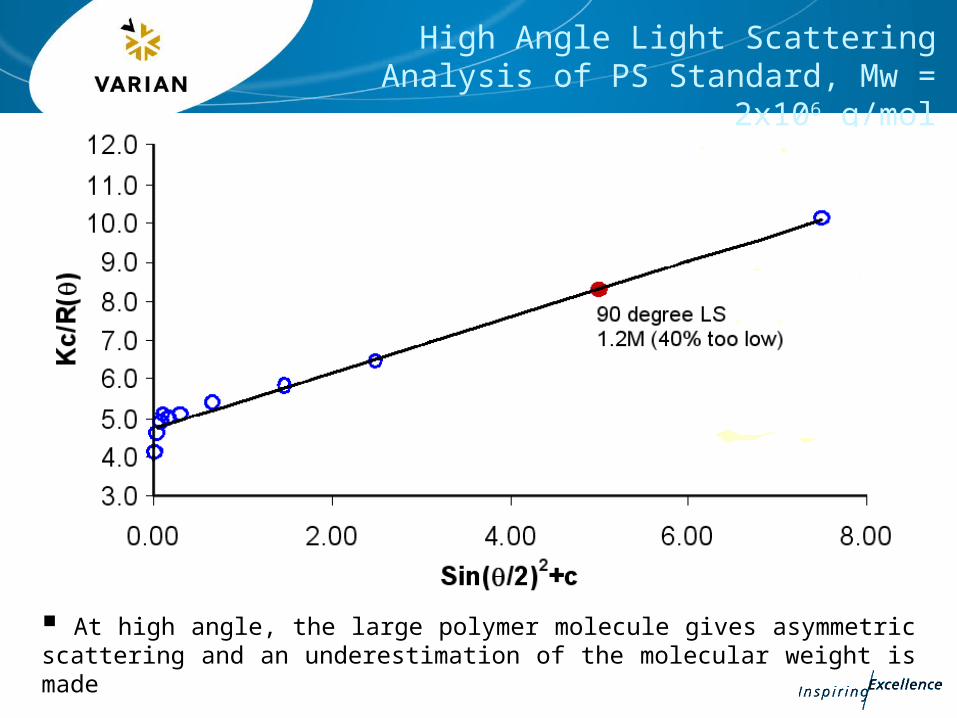
High Angle Light Scattering Analysis of PS Standard, Mw = 2x10⁶ g/mol
At high angle, the large polymer molecule gives asymmetric scattering and an underestimation of the molecular weight is made
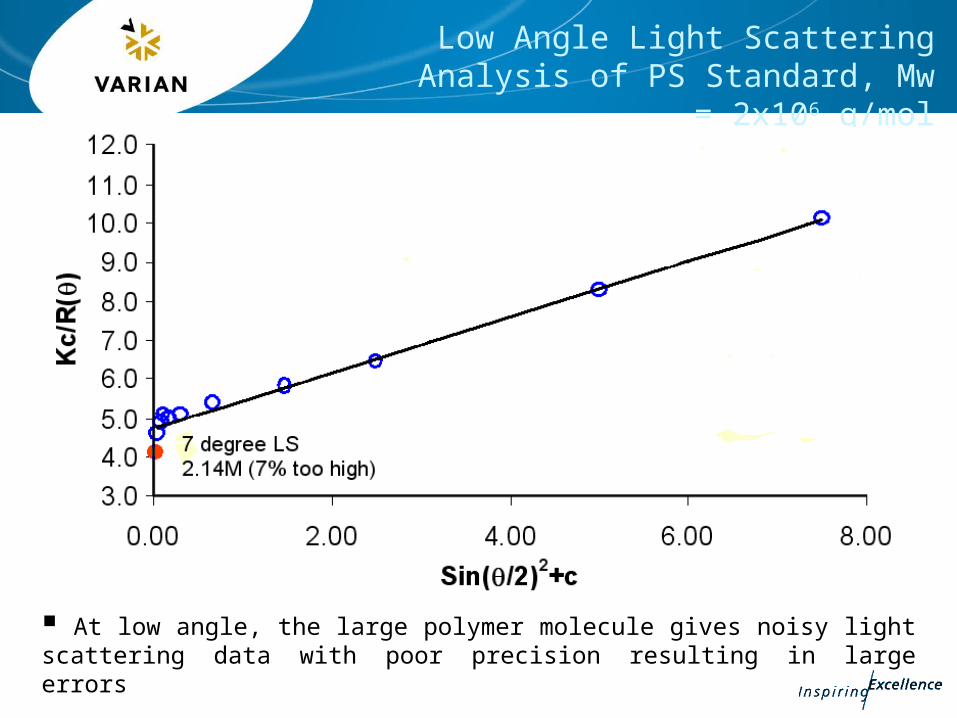
Low Angle Light Scattering Analysis of PS Standard, Mw = 2x10⁶ g/mol
At low angle, the large polymer molecule gives noisy light scattering data with poor precision resulting in large errors
Multi Angle Extrapolations and the Dissymmetry Technique
These problems are alleviated by the use of a multi angle system
In these systems, irrespective of the type of calculation performed, multi data points are used to extrapolate to the zero angle
Errors tend to be much lower than single angle calculations
Different designs of instrument employ different numbers of data points to make the extrapolation
The Dissymmetry method employs two or three angles, typically 135°, 90° and 45°, if other angles are used further corrections are required
The ratio of these intensities, Zd, is known as the dissymmetry of scattered light
Assuming we know the shape of the molecules under analysis, we can used Zd to determine the particle scattering function, Pθ
From this value we can correct the scattering value at 90° to give accurate molecular weight and allow us to calculate radius of gyration
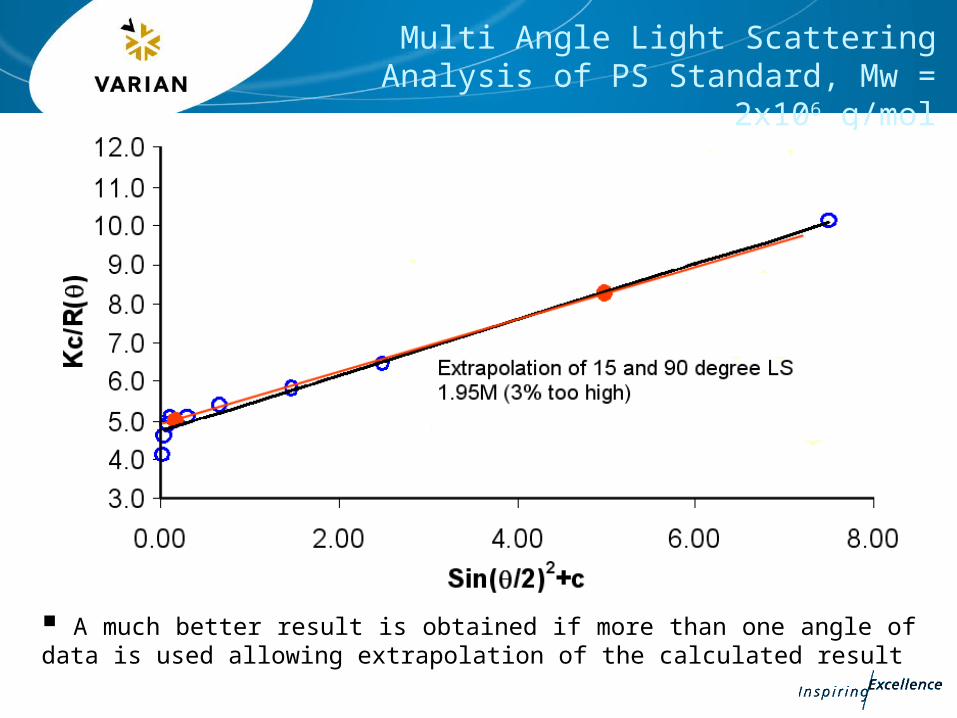
Multi Angle Light Scattering Analysis of PS Standard, Mw = 2x10⁶ g/mol
A much better result is obtained if more than one angle of data is used allowing extrapolation of the calculated result
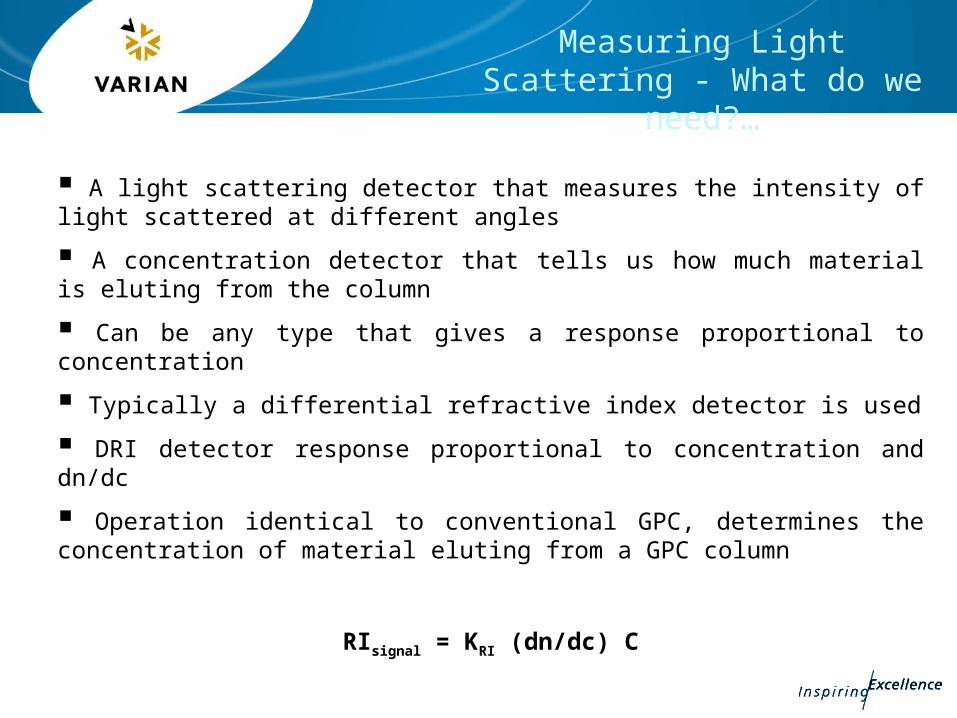
A light scattering detector that measures the intensity of light scattered at different angles
A concentration detector that tells us how much material is eluting from the column
Can be any type that gives a response proportional to concentration
Typically a differential refractive index detector is used
DRI detector response proportional to concentration and dn/dc
Operation identical to conventional GPC, determines the concentration of material eluting from a GPC column
RIsignal = KRI (dn/dc) C
Measuring Light Scattering - What do we need?…
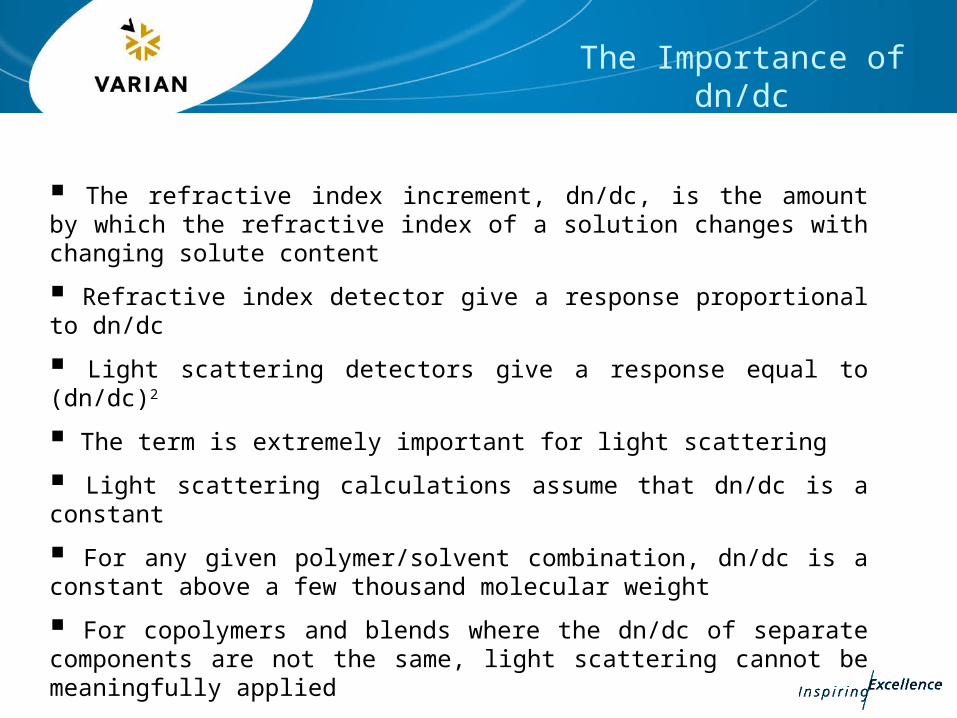
The refractive index increment, dn/dc, is the amount by which the refractive index of a solution changes with changing solute content
Refractive index detector give a response proportional to dn/dc
Light scattering detectors give a response equal to (dn/dc)2
The term is extremely important for light scattering
Light scattering calculations assume that dn/dc is a constant
For any given polymer/solvent combination, dn/dc is a constant above a few thousand molecular weight
For copolymers and blends where the dn/dc of separate components are not the same, light scattering cannot be meaningfully applied
The values of dn/dc are listed for a range of polymers and solvents
The Importance of dn/dc
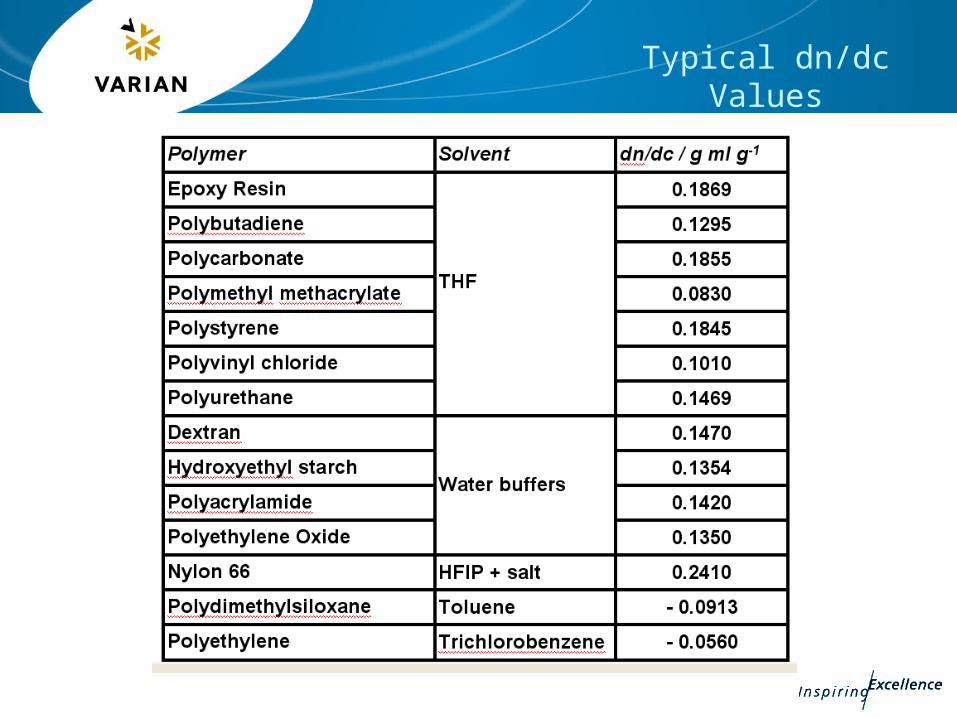
Typical dn/dc Values
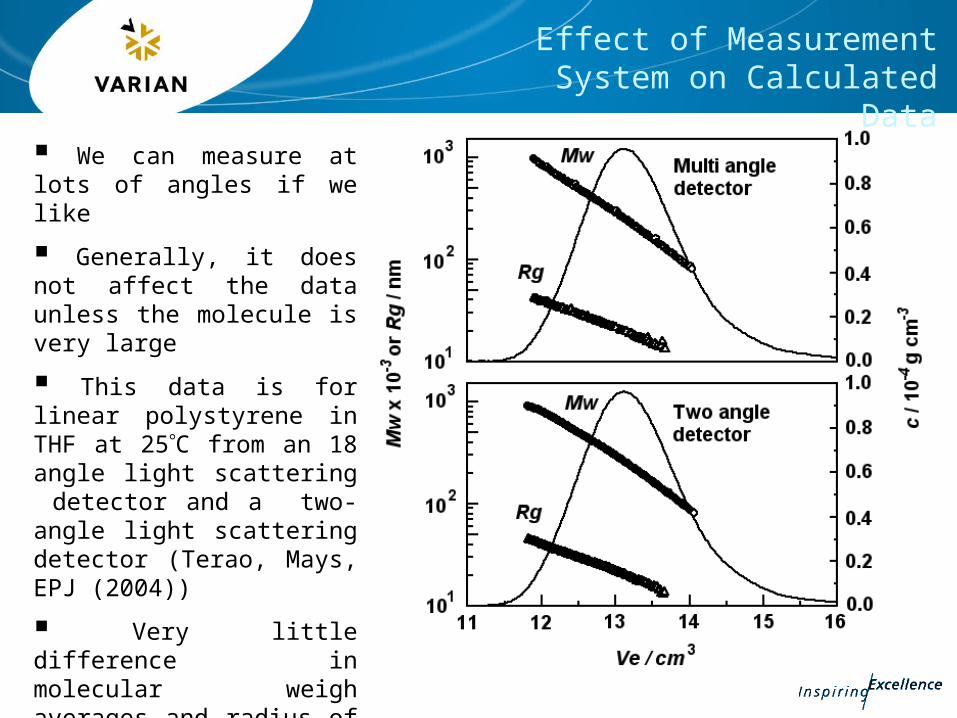
We can measure at lots of angles if we like
Generally, it does not affect the data unless the molecule is very large
This data is for linear polystyrene in THF at 25C from an 18 angle light scattering detector and a two-angle light scattering detector (Terao, Mays, EPJ (2004))
Very little difference in molecular weigh averages and radius of gyration data between the multi angle and the two angle data sets
Effect of Measurement System on Calculated Data
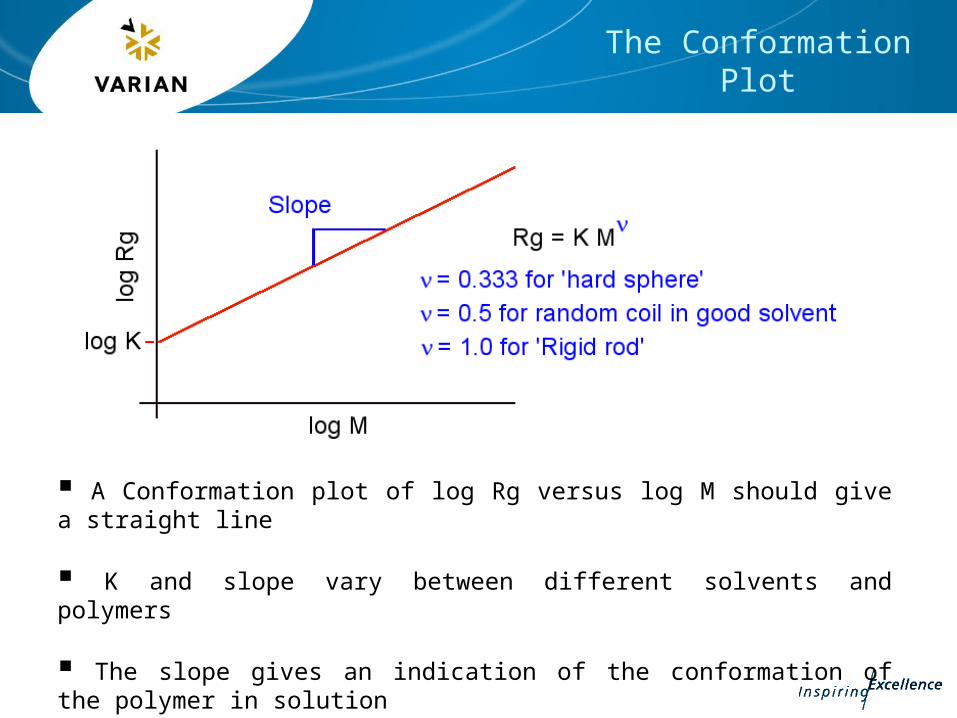
The Conformation Plot
A Conformation plot of log Rg versus log M should give a straight line
K and slope vary between different solvents and polymers
The slope gives an indication of the conformation of the polymer in solution
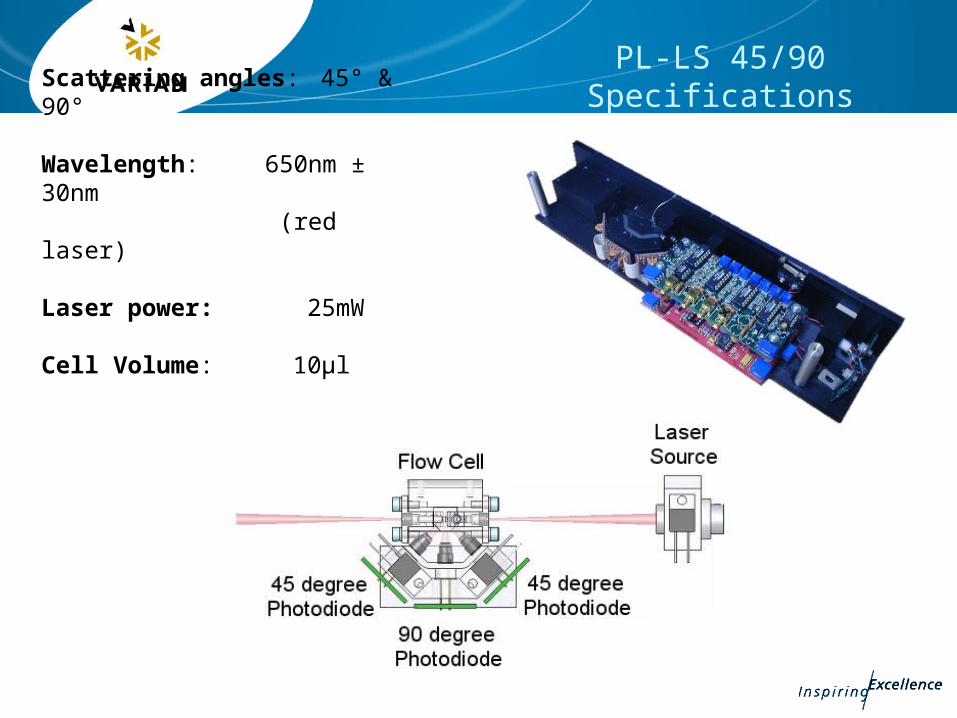
PL-LS 45/90 Specifications
Scattering angles: 45° & 90°
Wavelength: 650nm ± 30nm (red laser)
Laser power: 25mW
Cell Volume: 10µl
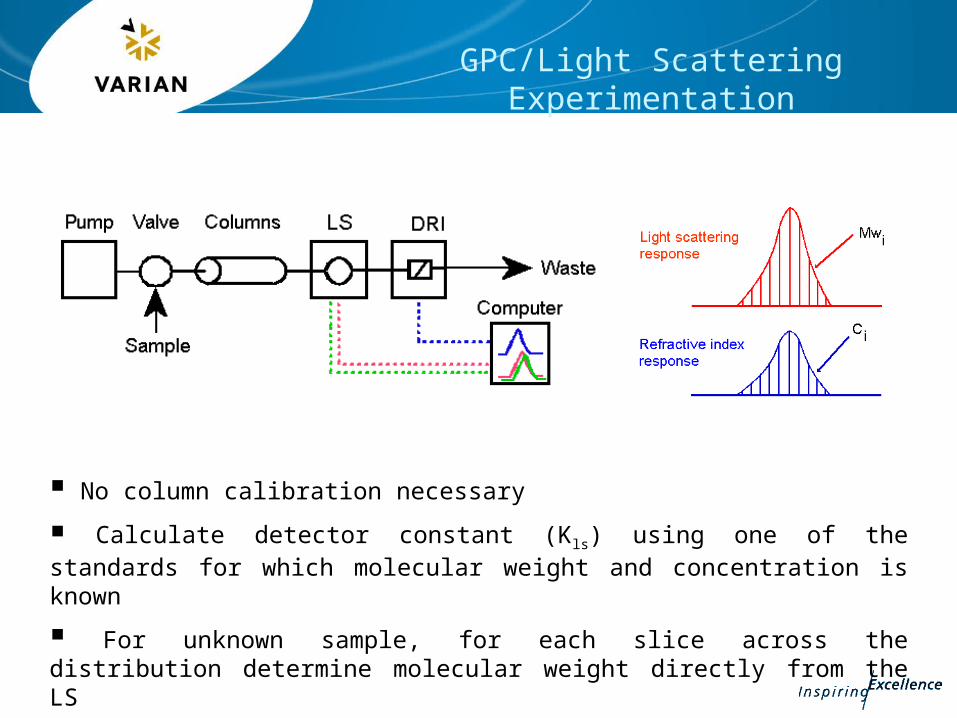
GPC/Light Scattering Experimentation
No column calibration necessary
Calculate detector constant (Kls) using one of the standards for which molecular weight and concentration is known
For unknown sample, for each slice across the distribution determine molecular weight directly from the LS
GPC/Light Practical Considerations
Eluent - Use high quality solvent, filter before use to remove particulates (e.g. 0.02um). Choose solvent to give good dn/dc for optimum LS detector response
Injector - Dirty rotor seal can contribute to excess noise immediately after switching valve from load to inject position
Columns - Column shedding can contribute to baseline noise, bleed decreases with time, special low shedding columns available (e.g. PLgel MIXED LS)
Sample preparation - Polymer solutions must be prepared at accurate concentration, take care with samples containing solvents or fillers. Use higher concentrations for lower molecular weight polymers
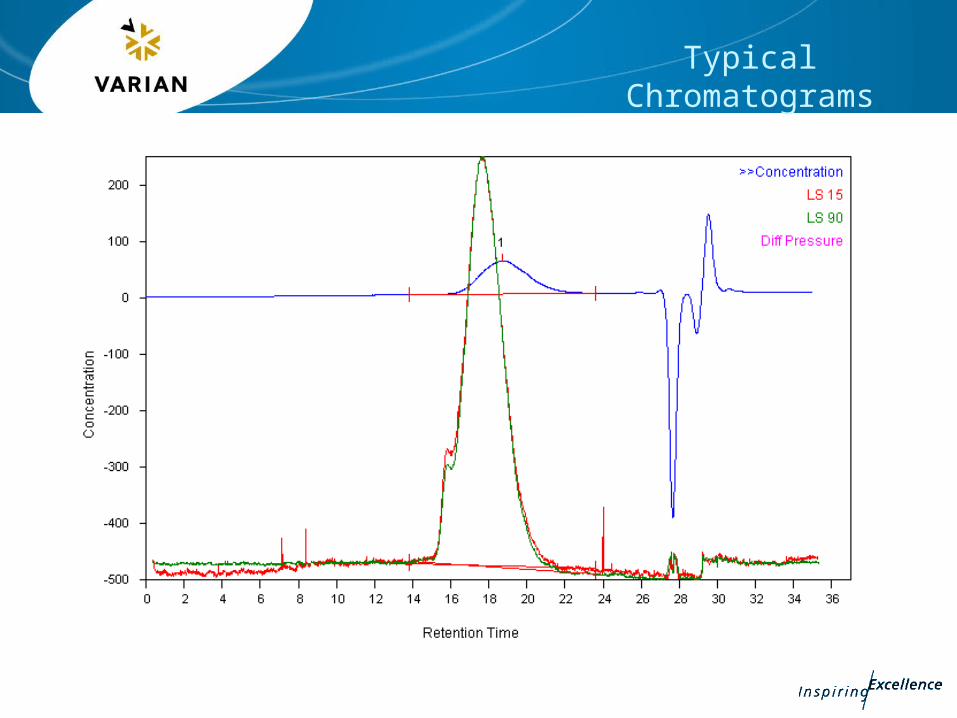
Typical Chromatograms
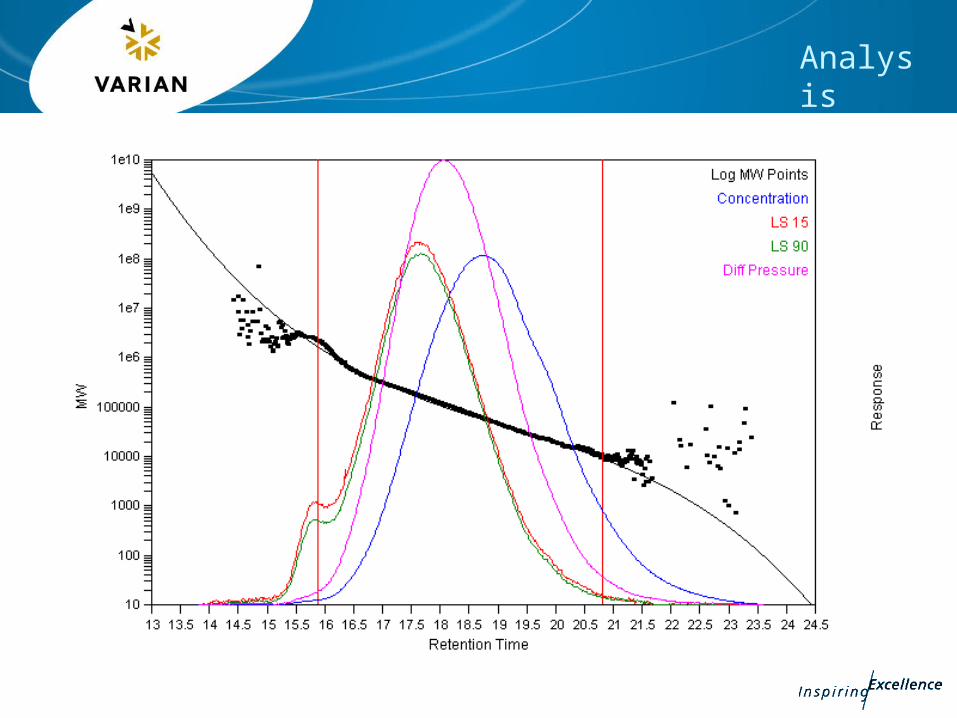
Analysis
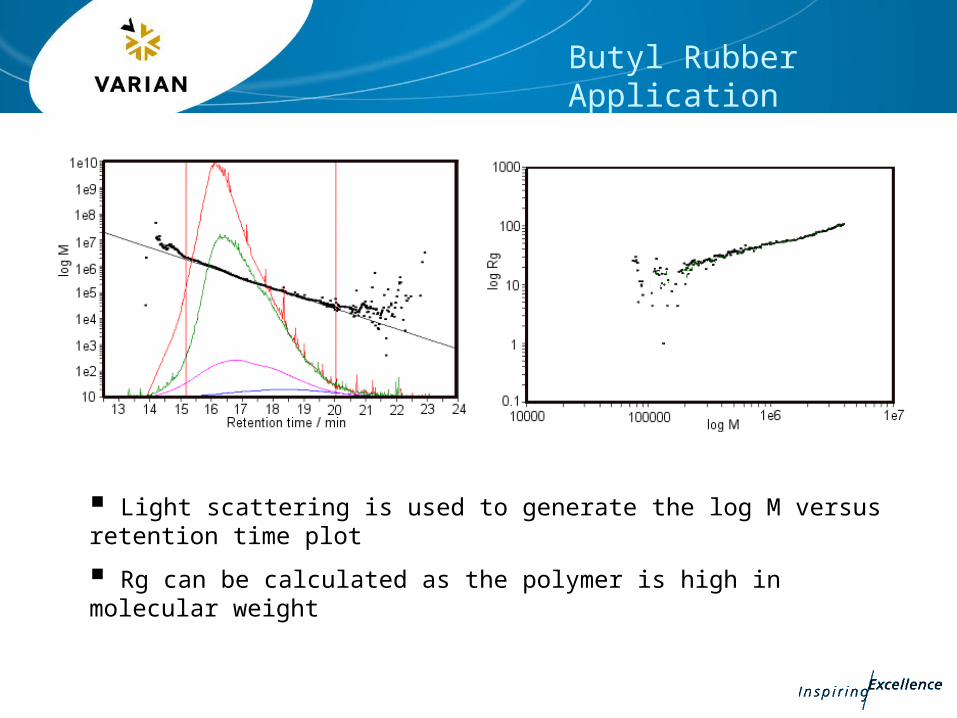
Butyl Rubber Application
Light scattering is used to generate the log M versus retention time plot
Rg can be calculated as the polymer is high in molecular weight
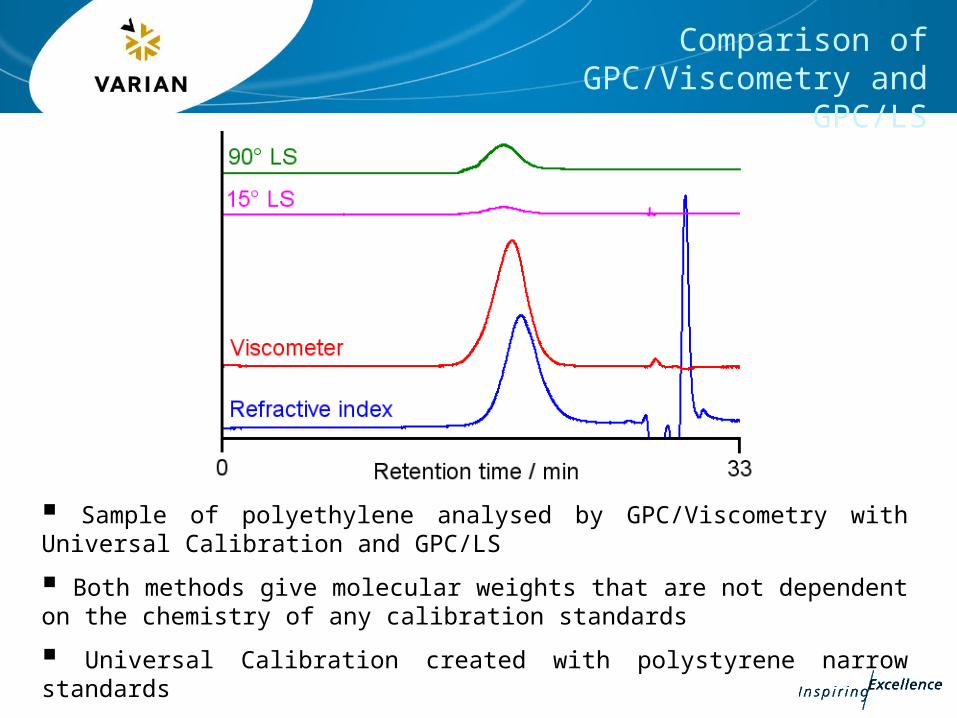
Comparison of GPC/Viscometry and GPC/LS
Sample of polyethylene analysed by GPC/Viscometry with Universal Calibration and GPC/LS
Both methods give molecular weights that are not dependent on the chemistry of any calibration standards
Universal Calibration created with polystyrene narrow standards
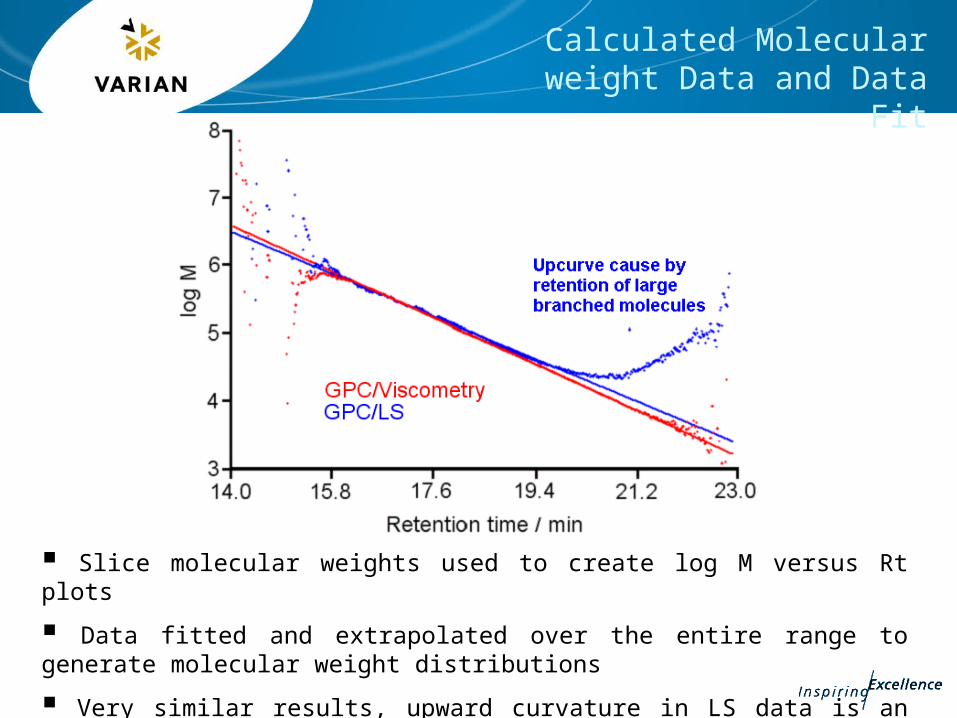
Slice molecular weights used to create log M versus Rt plots
Data fitted and extrapolated over the entire range to generate molecular weight distributions
Very similar results, upward curvature in LS data is an artefact
Calculated Molecular weight Data and Data Fit
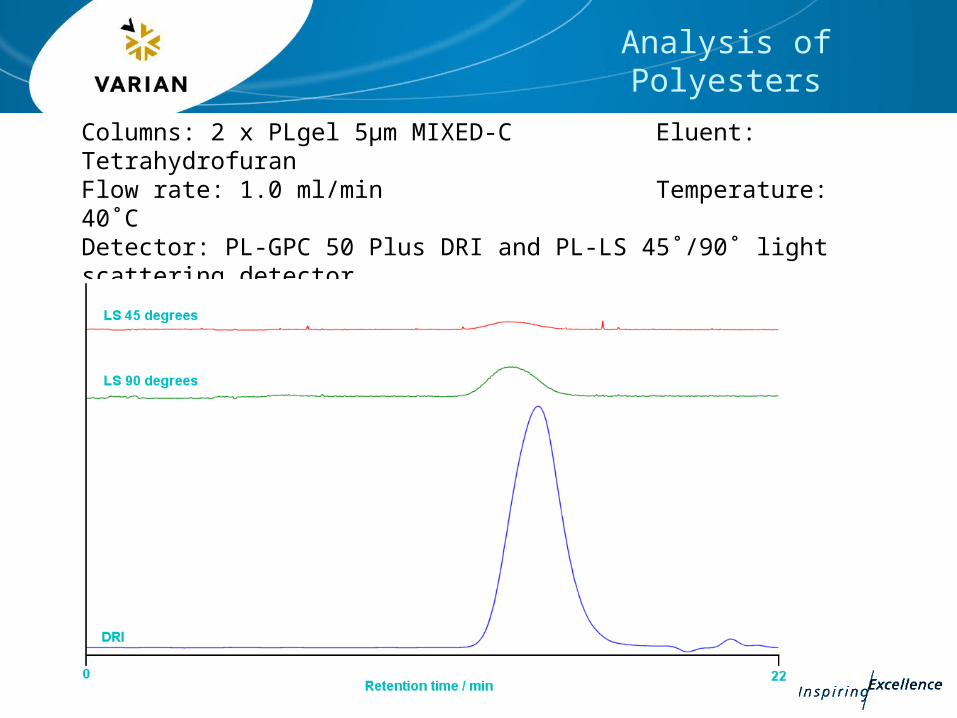
Analysis of Polyesters
Columns: 2 x PLgel 5µm MIXED-C Eluent: TetrahydrofuranFlow rate: 1.0 ml/min Temperature: 40˚CDetector: PL-GPC 50 Plus DRI and PL-LS 45˚/90˚ light scattering detector
Example chromatogram of one sample
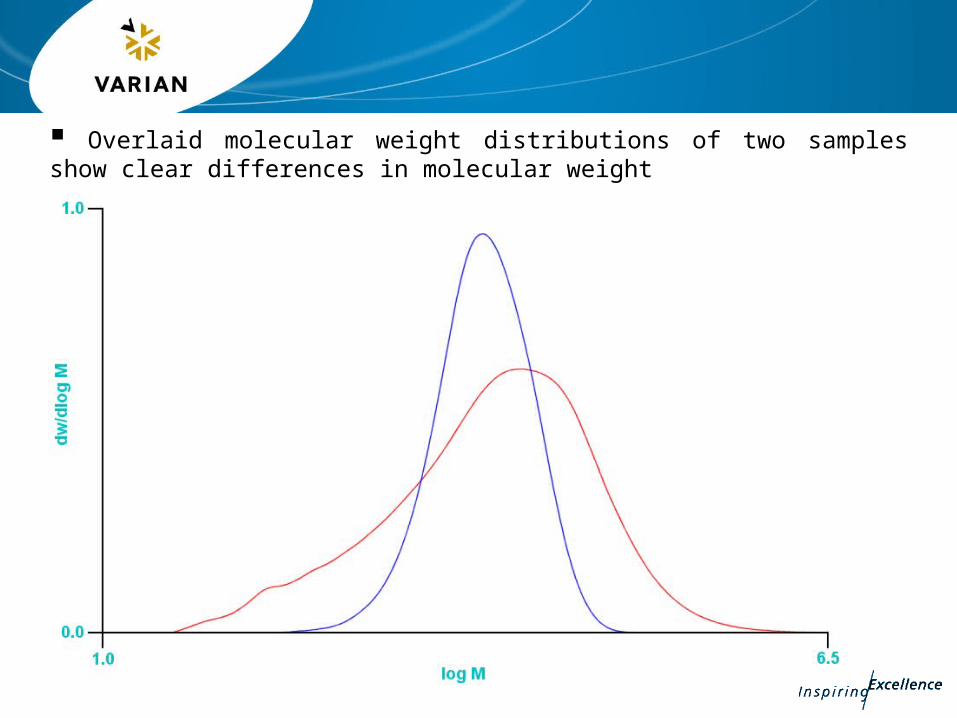
Overlaid molecular weight distributions of two samples show clear differences in molecular weight
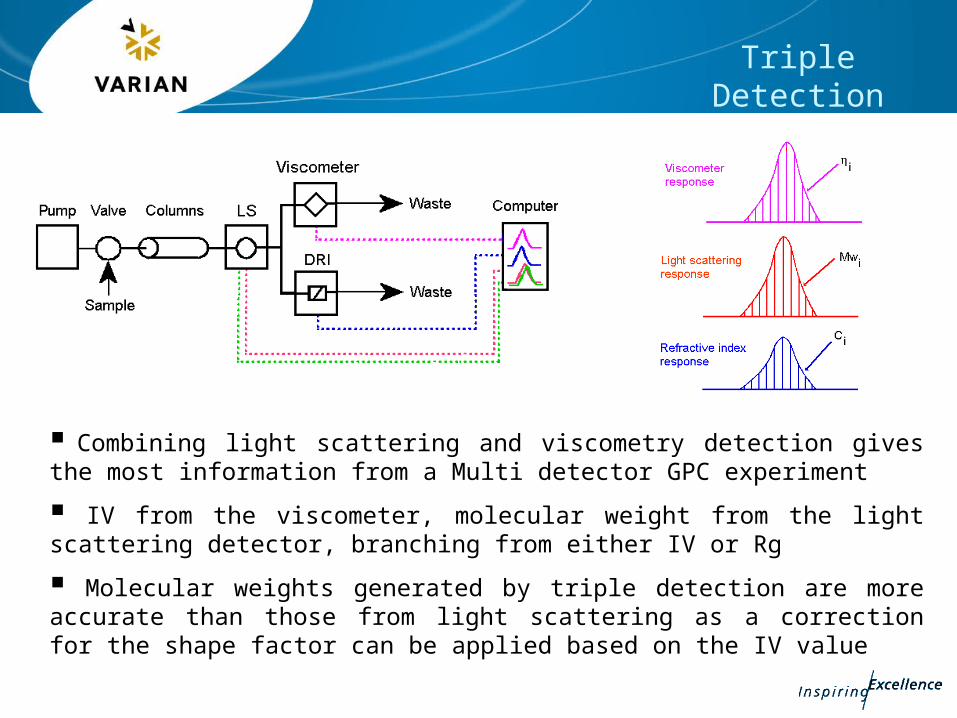
Triple Detection
Combining light scattering and viscometry detection gives the most information from a Multi detector GPC experiment
IV from the viscometer, molecular weight from the light scattering detector, branching from either IV or Rg
Molecular weights generated by triple detection are more accurate than those from light scattering as a correction for the shape factor can be applied based on the IV value
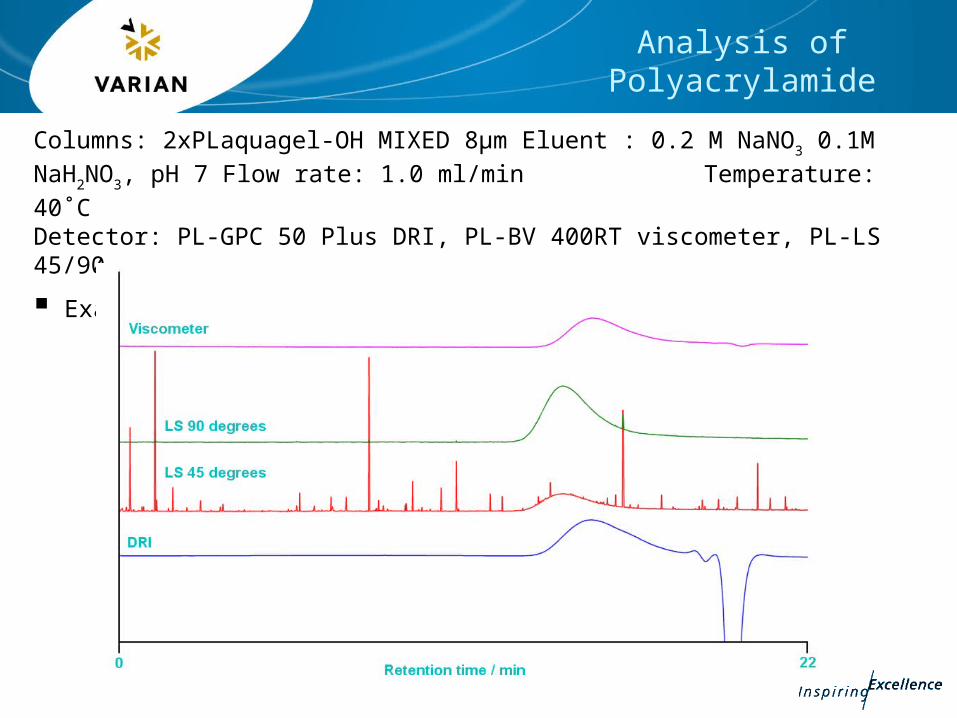
Columns: 2xPLaquagel-OH MIXED 8µm Eluent : 0.2 M NaNO3 0.1M NaH2NO3, pH 7
Flow rate: 1.0 ml/min Temperature: 40˚CDetector: PL-GPC 50 Plus DRI, PL-BV 400RT viscometer, PL-LS 45/90
Example chromatograms of a sample
Analysis of Polyacrylamide
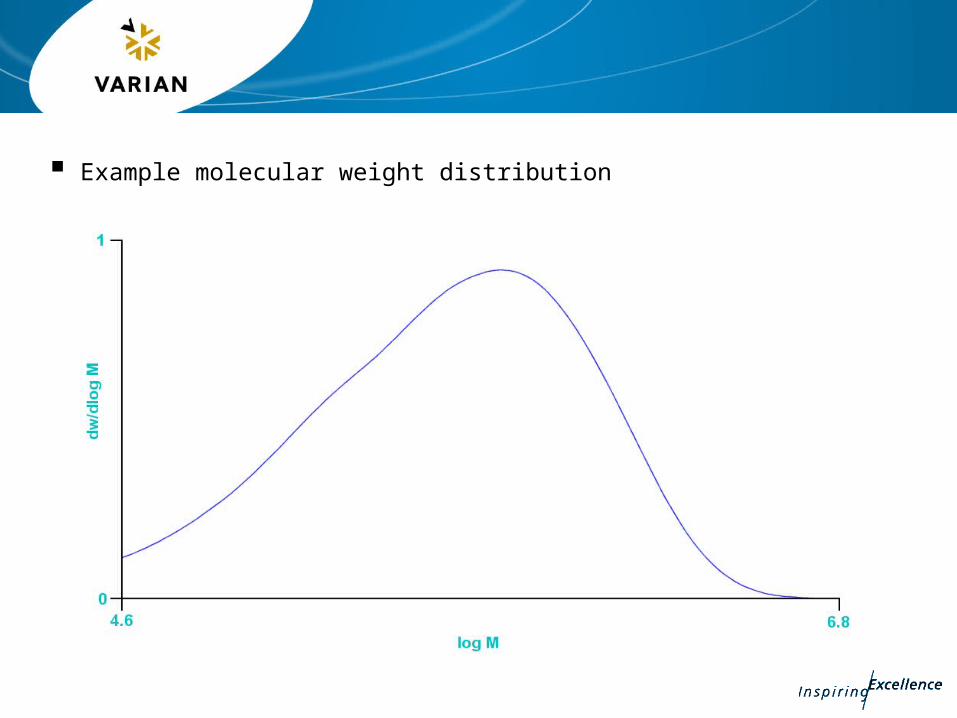
Example molecular weight distribution
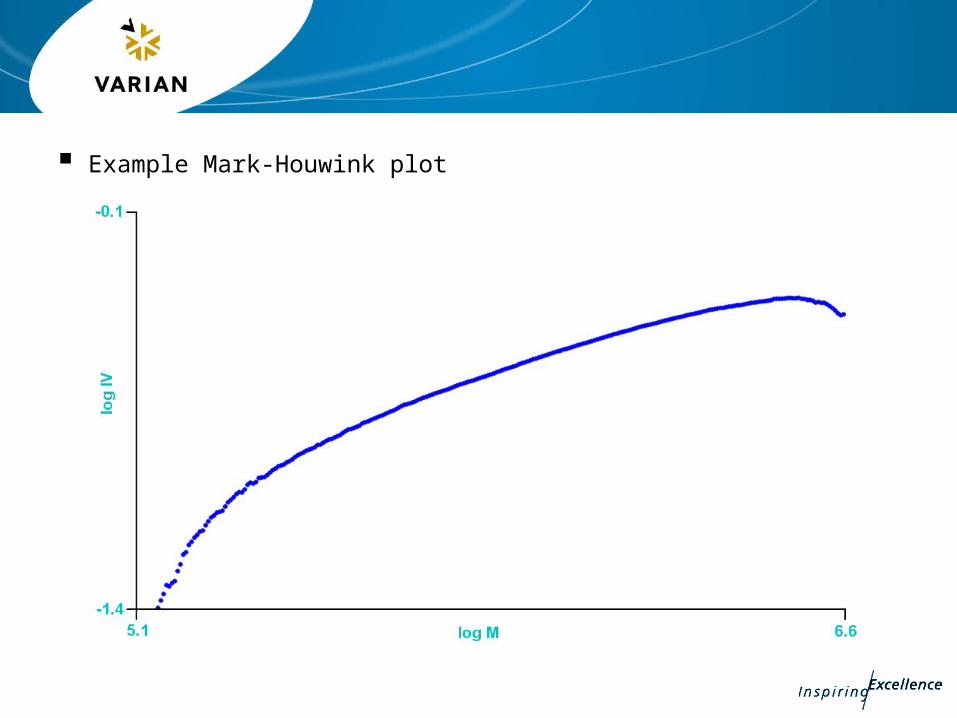
Example Mark-Houwink plot
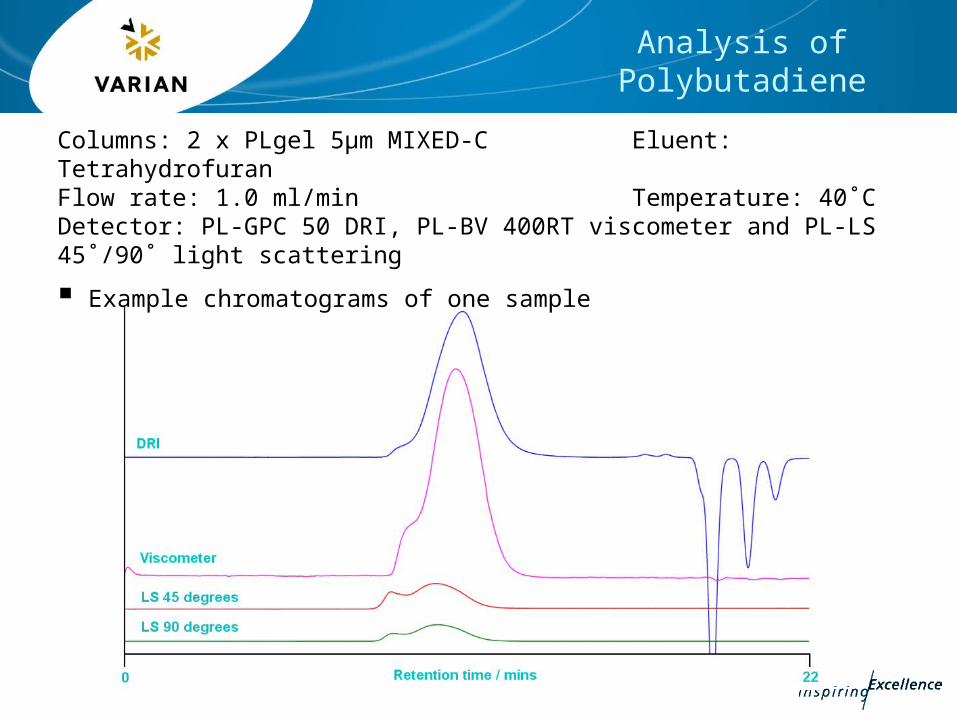
Columns: 2 x PLgel 5µm MIXED-C Eluent: TetrahydrofuranFlow rate: 1.0 ml/min Temperature: 40˚CDetector: PL-GPC 50 DRI, PL-BV 400RT viscometer and PL-LS 45˚/90˚ light scattering
Example chromatograms of one sample
Analysis of Polybutadiene
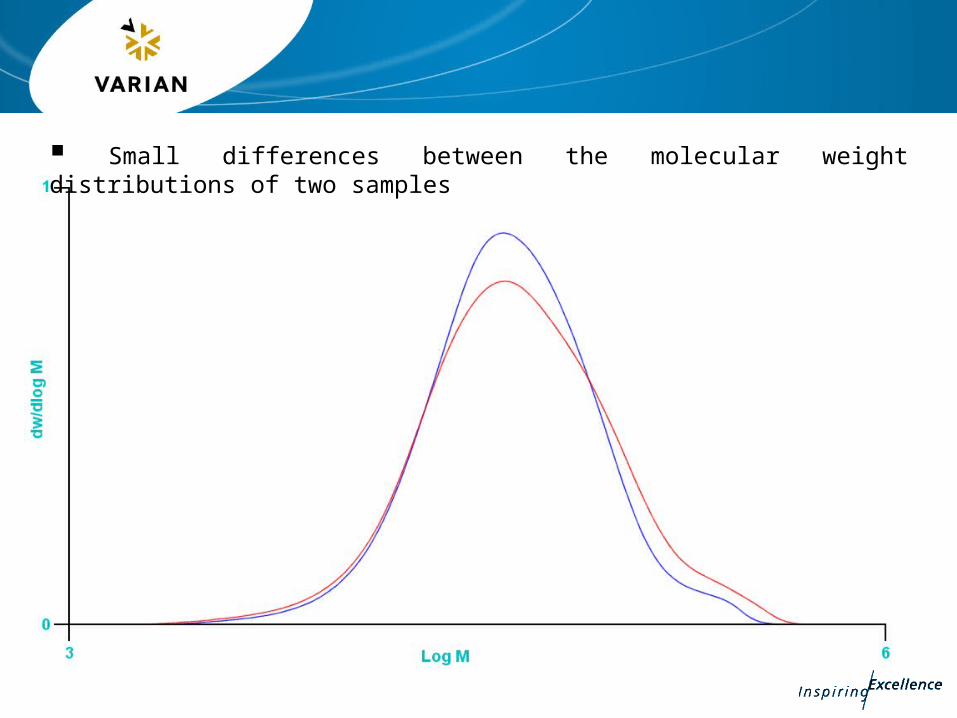
Small differences between the molecular weight distributions of two samples
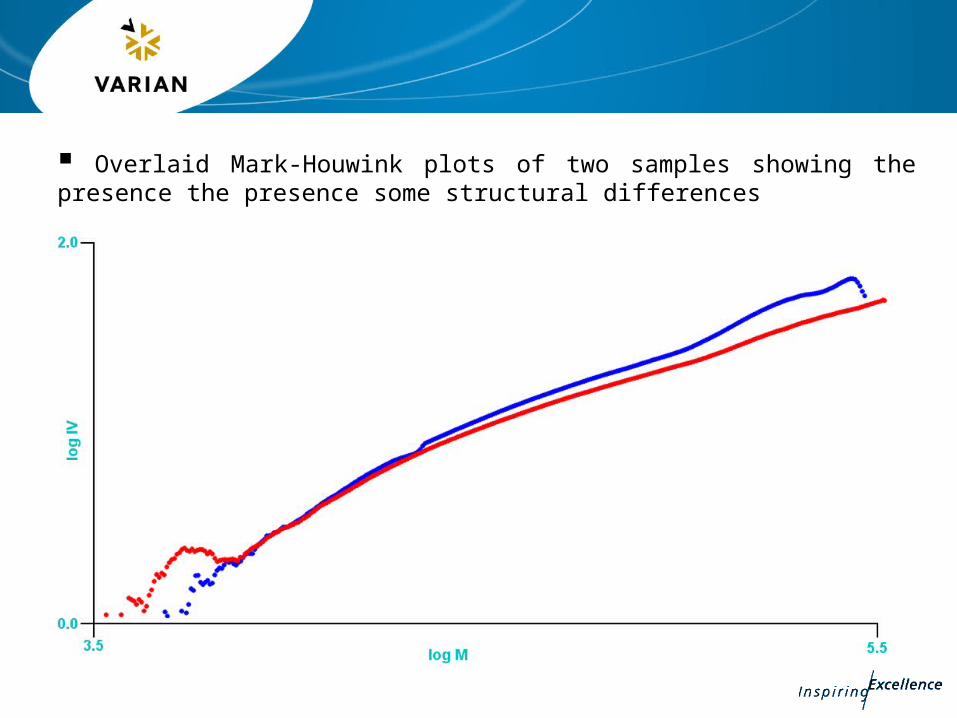
Overlaid Mark-Houwink plots of two samples showing the presence the presence some structural differences
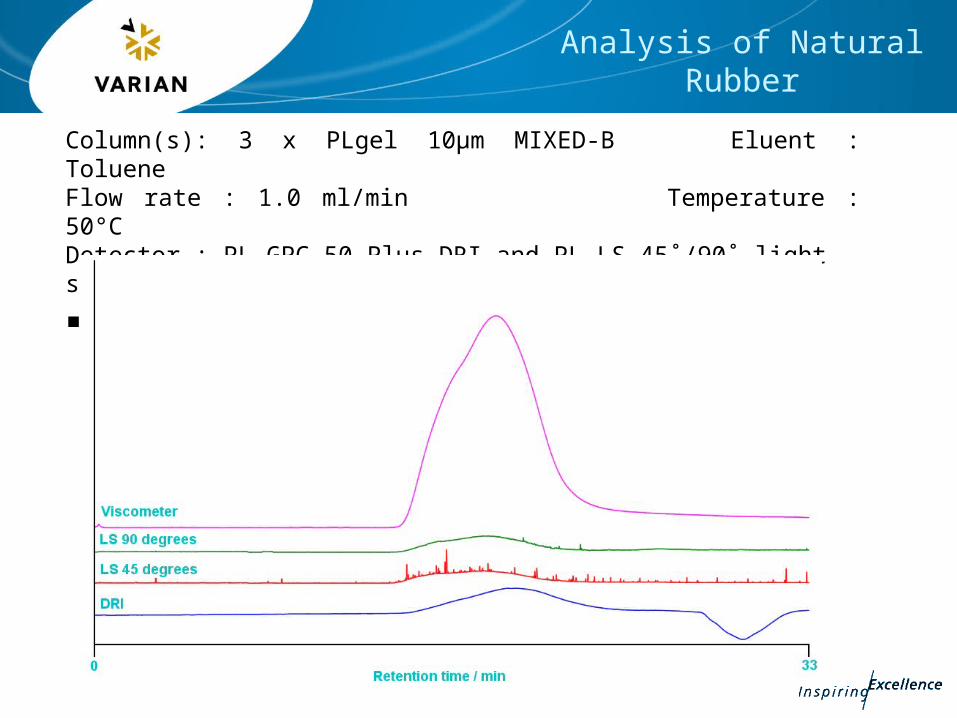
Column(s): 3 x PLgel 10µm MIXED-B Eluent : TolueneFlow rate : 1.0 ml/min Temperature : 50°CDetector : PL-GPC 50 Plus DRI and PL-LS 45˚/90˚ light scattering detector
Example chromatograms of one sample
Analysis of Natural Rubber
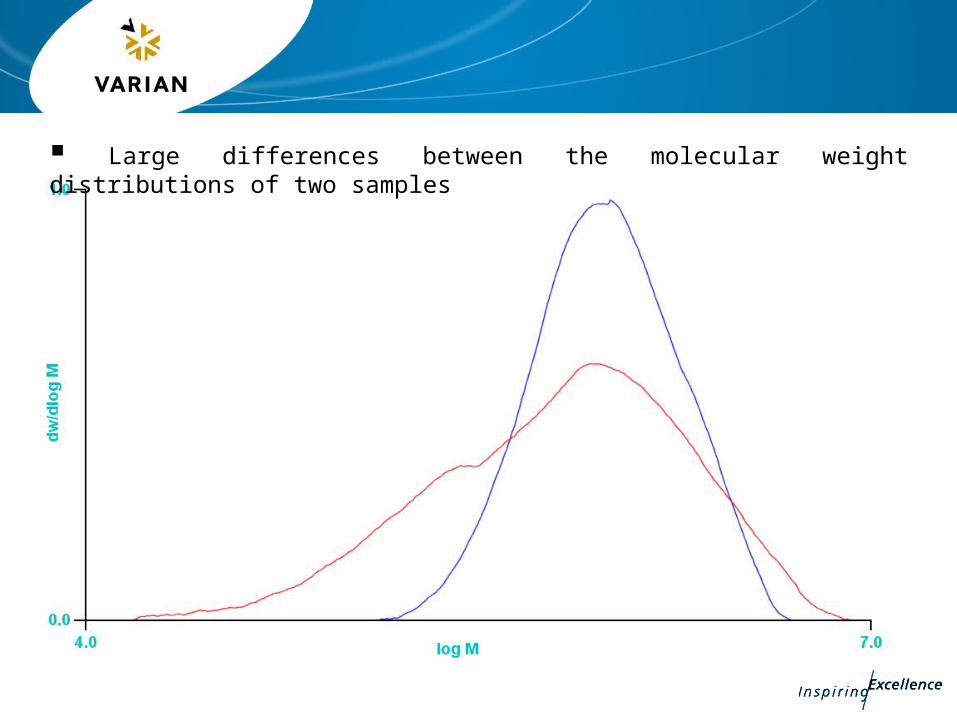
Large differences between the molecular weight distributions of two samples
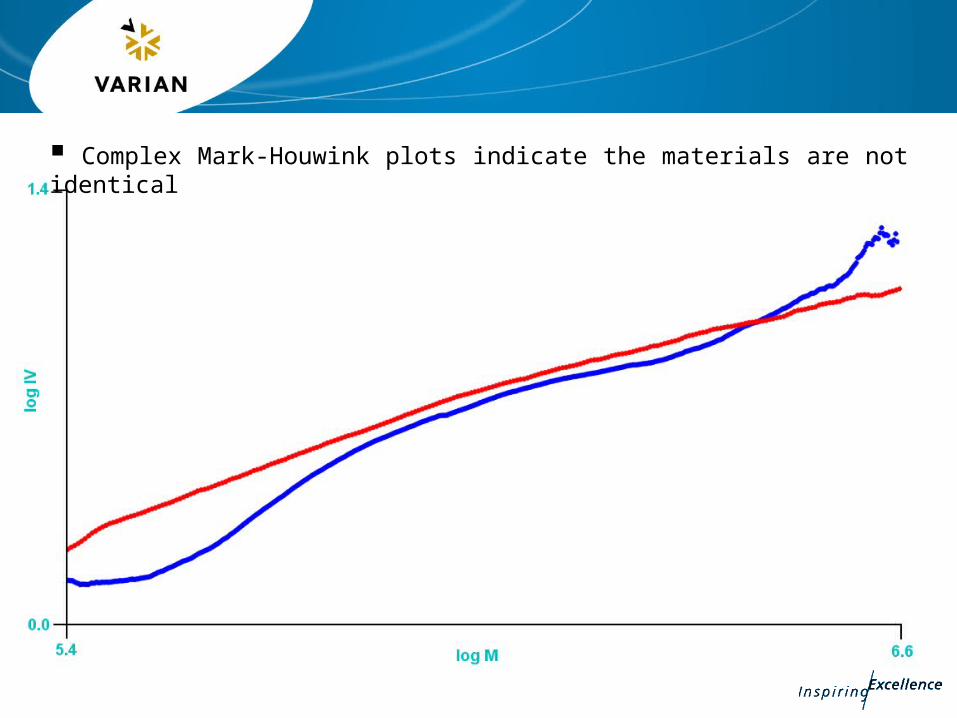
Complex Mark-Houwink plots indicate the materials are not identical
Summary
Light scattering is a powerful tool for the analysis of polymers allowing the calculation of molecular weight without the need for a column calibration
The theory of light scattering is complex and the treatment of the data is very mathematical
Different light scattering systems treat the data in different ways
Multi angles have a strong advantage over single angle systems
Combinations of light scattering with viscometry expands the GPC experiment considerably