Advanced Data Based Decision Making
61
Advanced Data Based Decision Making Kimberly Ingram, Ph.D. Professional Development Coordinator Oregon Dept. of Education February 2008 Southern Oregon PBS Network Conference
-
Upload
anika-salas -
Category
Documents
-
view
64 -
download
1
description
Advanced Data Based Decision Making. Kimberly Ingram, Ph.D. Professional Development Coordinator Oregon Dept. of Education February 2008 Southern Oregon PBS Network Conference. Agenda. Part 1 Look at your SET data – Is your Correction Feature at 80% - PowerPoint PPT Presentation
Transcript of Advanced Data Based Decision Making

Advanced Data Based Decision Making
Kimberly Ingram, Ph.D.Professional Development CoordinatorOregon Dept. of Education
February 2008Southern Oregon PBS Network Conference

Agenda Part 1
Look at your SET data – Is your Correction Feature at 80%• If Yes, the next few slide will be very meaningful• In No, the next few slides will be meaningful and we need to discuss
ways to enhance that Feature – “corrections Packet” Examine Data Decision Rules for
• School-wide Interventions• Targeted Group Interventions• Individualized Interventions
Practice Data-based Decision-Making Additional Data for further prevention efforts
• Ethnicity reports• Special education
Part 2 – Prepare for First Day of School

Primary Prevention/Universal
Interventions:School/Classroom-Wide Systems for
All Students,Staff, & Settings
Secondary Prevention:Specialized Group
Systems for Students with At-Risk Behavior
Tertiary Prevention:FBABSP for Students with High-Risk Behavior
~80% of Students0-1 Referrals
~15%2-5 ODR
~5%
CONTINUUM OFSCHOOL-WIDE
POSITIVE BEHAVIORSUPPORT

SYSTEMS
PRACTICES
INFORMATION
SupportingStaff Behavior
SupportingDecisionMaking
SupportingStudent Behavior
School-wide Positive Behavior Support

Improving Decision-Making
Problem SolutionFrom
To ProblemProblem
SolvingSolution
Information

Using Data for On-Going Problem Solving
Start with the decisions not the data Use data in “decision layers” (Gilbert, 1978)
Is there a problem? (overall rate of ODR)Localize the problem
• (location, problem behavior, students, time of day)
Get specific Use data to guide asking of “the right questions” Don’t drown in the data It’s “OK” to be doing well Be efficient

Using Discipline Data for Decision Making

Use Referral data to Inform Intervention
In order to maximize school resources, it is important to know where the majority of behavior problems are occurring
Prevention measures, such as:• Re-teaching expectations• increasing supervision and monitoring• increased use of acknowledgments, or• environmental restructuring
are often the best interventions for misbehavior especially when referrals are not successfully addressing the problem

Using Discipline Data There are many different data systems for tracking,
organizing, and presenting discipline data: You can either make your current system work for
you, or SWIS (School Wide Information System) is one of the
best systems for flexibility in manipulating data and ease of presenting data to maximize the use of your data
eSIS has some similar graphing abilities (Big 5, and a few others). It is not as flexible as SWIS, however, it can still offer excellent data for decision-making
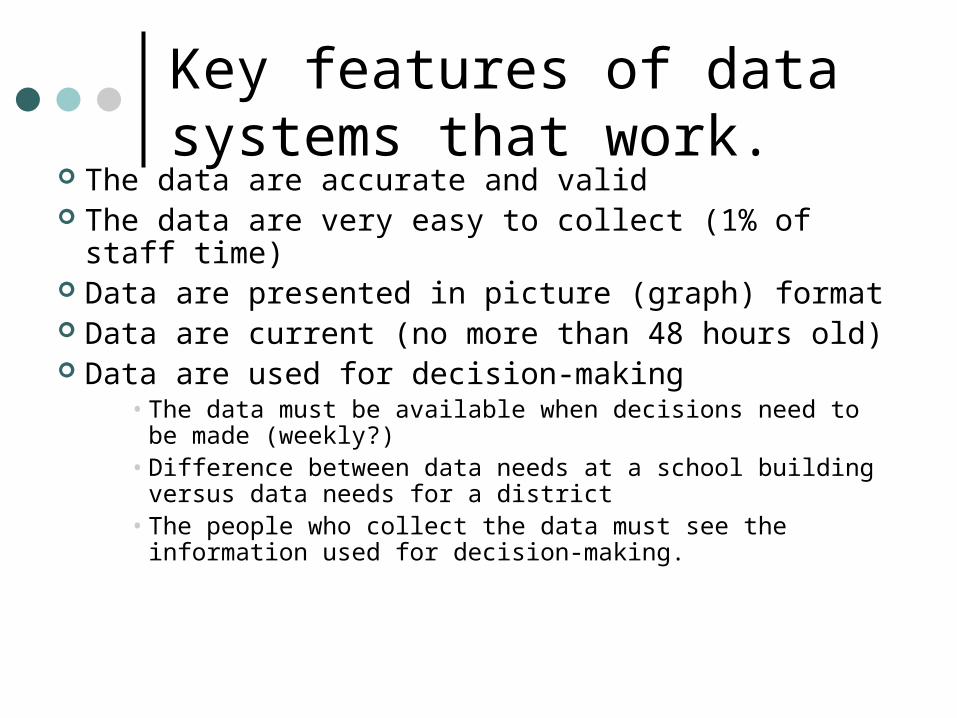
Key features of data systems that work.
The data are accurate and valid The data are very easy to collect (1% of staff time) Data are presented in picture (graph) format Data are current (no more than 48 hours old) Data are used for decision-making
• The data must be available when decisions need to be made (weekly?)
• Difference between data needs at a school building versus data needs for a district
• The people who collect the data must see the information used for decision-making.
Using Data for Decision Making
PBS Teams use data for
School-wide, universal, interventions Targeted group, secondary,
interventions Individual, tertiary, interventions

Nonclass
room
Setting S
ystems
ClassroomSetting Systems
Individual Student
Systems
School-wideSystems
School-wide PositiveBehavior Support
Systems
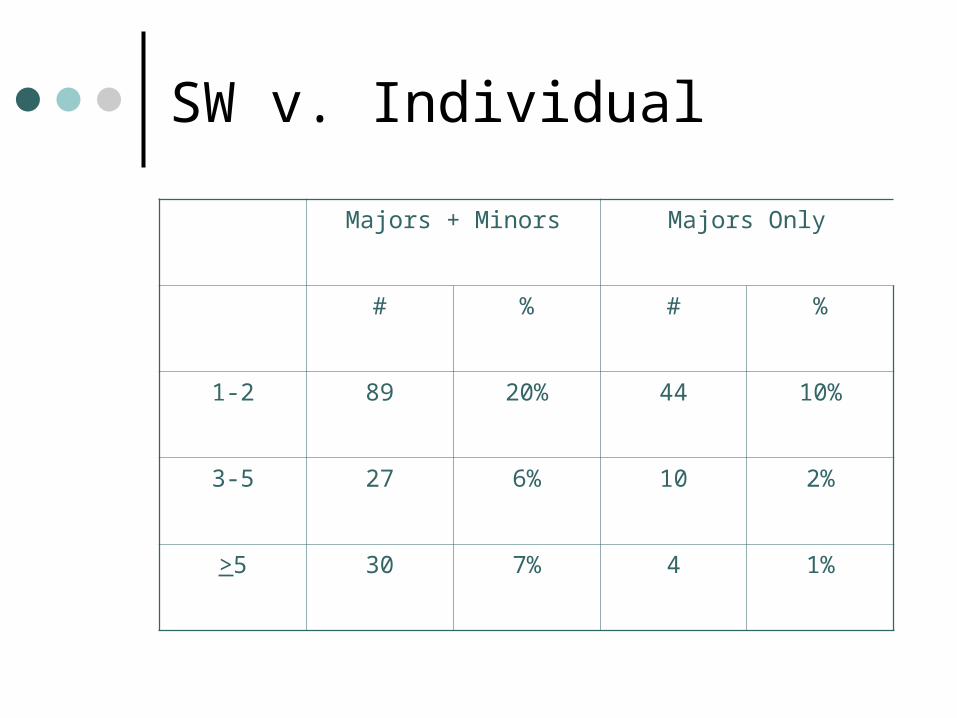
SW v. Individual
Majors + Minors Majors Only
# % # %
1-2 89 20% 44 10%
3-5 27 6% 10 2%
>5 30 7% 4 1%

What about CLEO?
12 By Dec. 2000 – Jun. 2001 19 By Sep. 2001 – Dec. 2001
Suspensions/Expulsions Per Year
2000-01 2001-02
Events Days Events Days
In School Suspensions 0 0 2 2
Out of School Suspensions 1 1 3 2.5
Expulsions 0 0 0 0

CLEO: # By/Day/Month
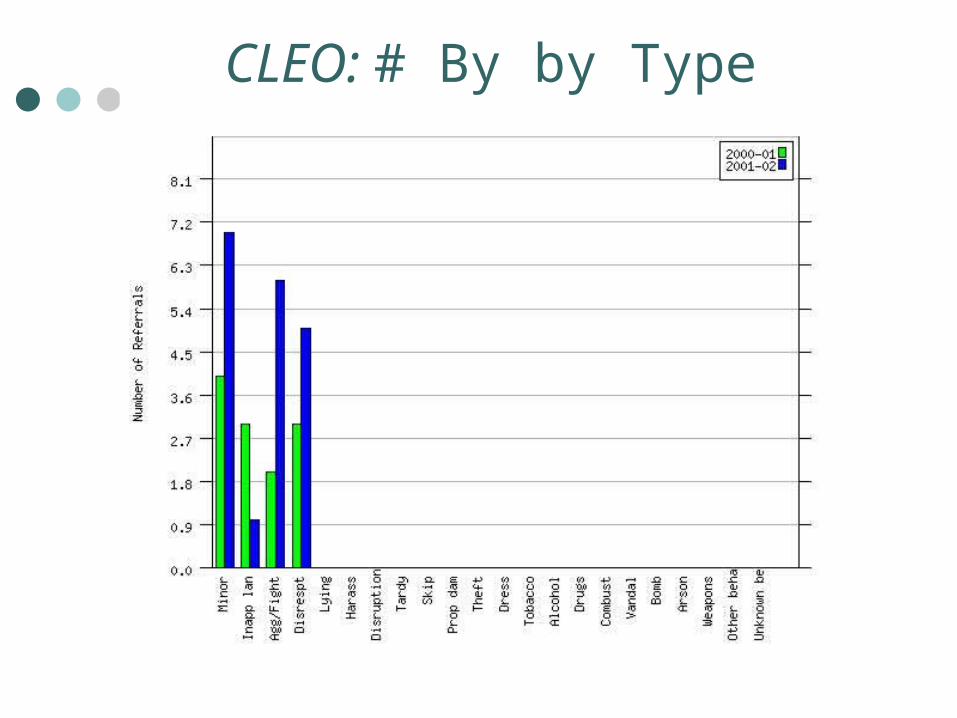
CLEO: # By by Type
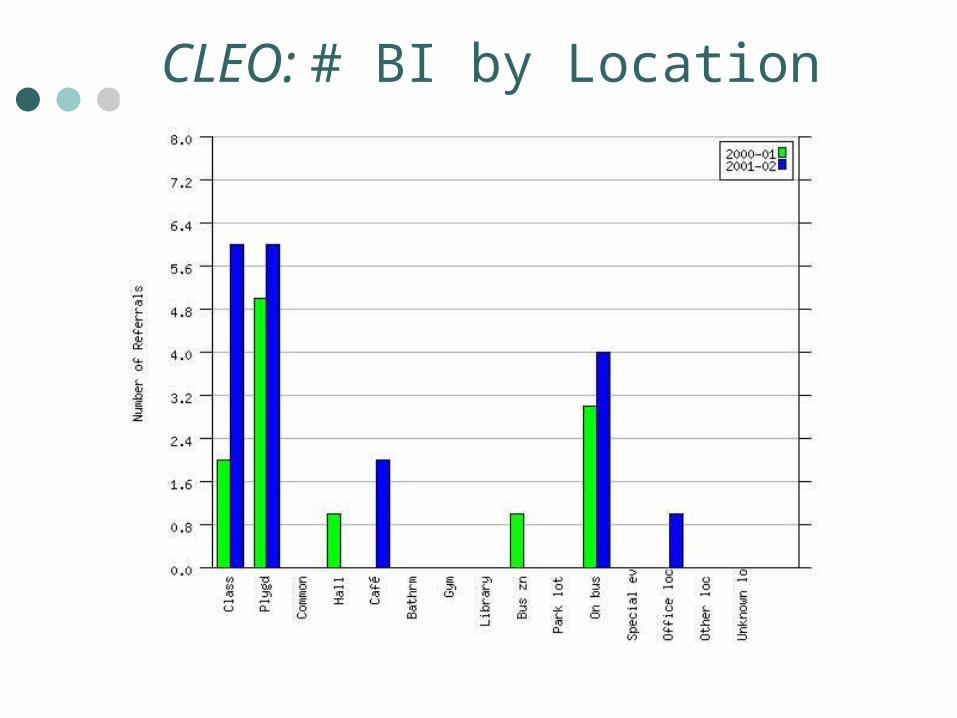
CLEO: # BI by Location
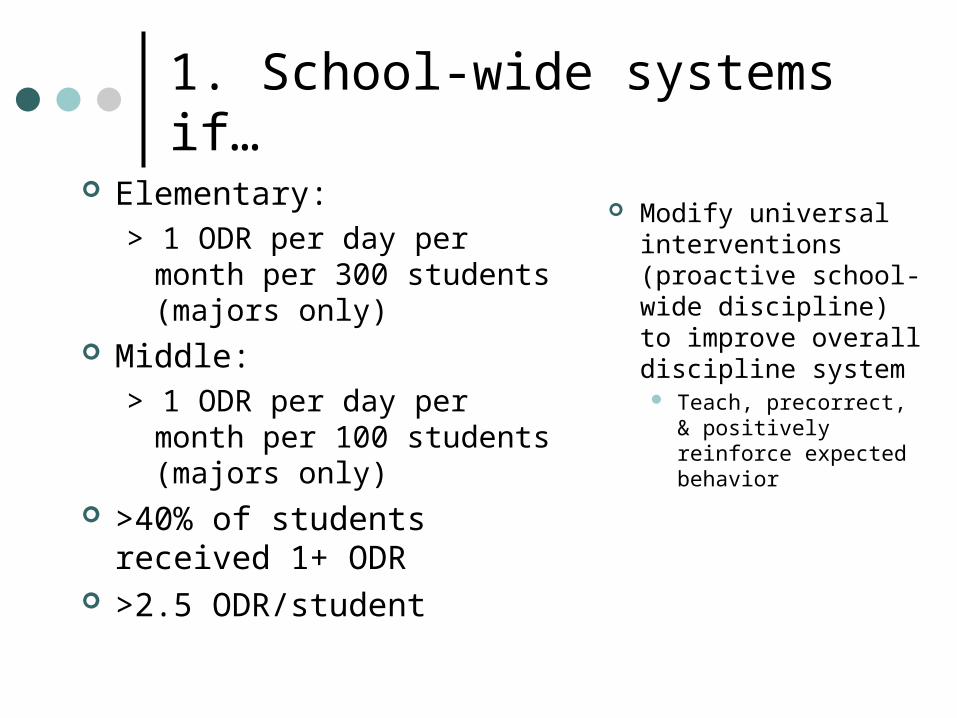
1. School-wide systems if…
Elementary:> 1 ODR per day per month
per 300 students (majors only)
Middle:> 1 ODR per day per month
per 100 students (majors only)
>40% of students received 1+ ODR
>2.5 ODR/student
Modify universal interventions (proactive school-wide discipline) to improve overall discipline system Teach, precorrect, &
positively reinforce expected behavior

SWIS summary 06-07 (Majors Only)1974 schools; 1,025,422 students; 948,874 ODRs
Grade Range
Number of Schools
Mean Enrollment per school
Mean ODRs per 100 per school day
K-6 1288 446 .34 (sd=.37)
(1 / 300 / day)
6-9 377 658 .98 (sd=1.36)
(1/ 100 / day)
9-12 124 1009 .93 (sd=.83)
(1/ 107 / day)
K-(8-12) 183 419 .86 (sd=1.14)
(1/ 120 / day
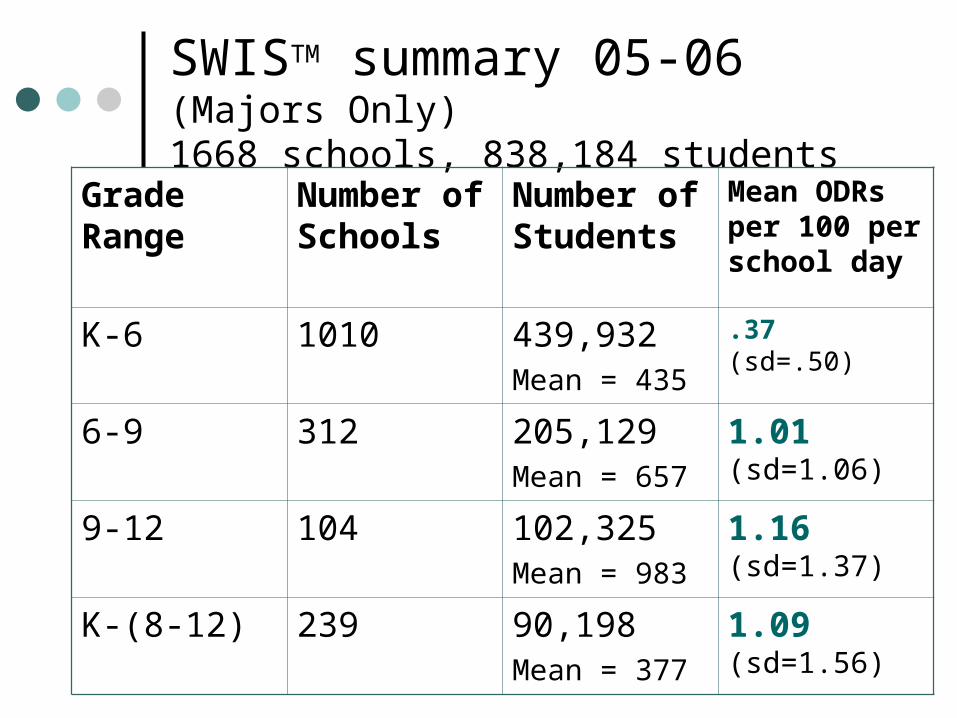
SWISTM summary 05-06 (Majors Only)1668 schools, 838,184 students
Grade Range
Number of Schools
Number of Students
Mean ODRs per 100 per school day
K-6 1010 439,932Mean = 435
.37 (sd=.50)
6-9 312 205,129Mean = 657
1.01 (sd=1.06)
9-12 104 102,325Mean = 983
1.16 (sd=1.37)
K-(8-12) 239 90,198Mean = 377
1.09 (sd=1.56)
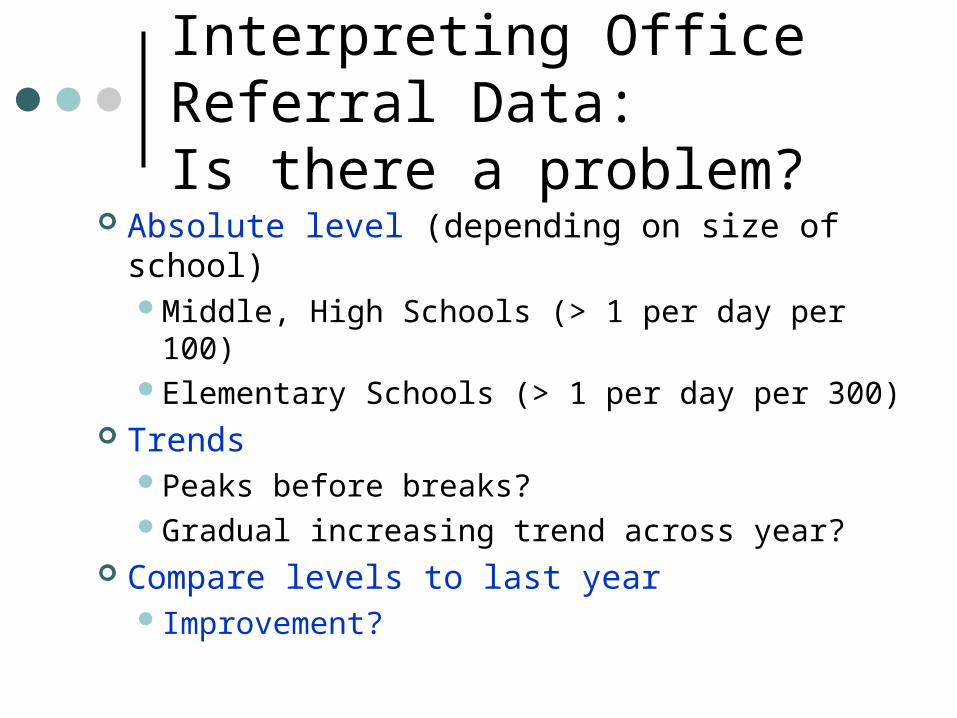
Interpreting Office Referral Data:Is there a problem?
Absolute level (depending on size of school)Middle, High Schools (> 1 per day per 100)Elementary Schools (> 1 per day per 300)
TrendsPeaks before breaks?Gradual increasing trend across year?
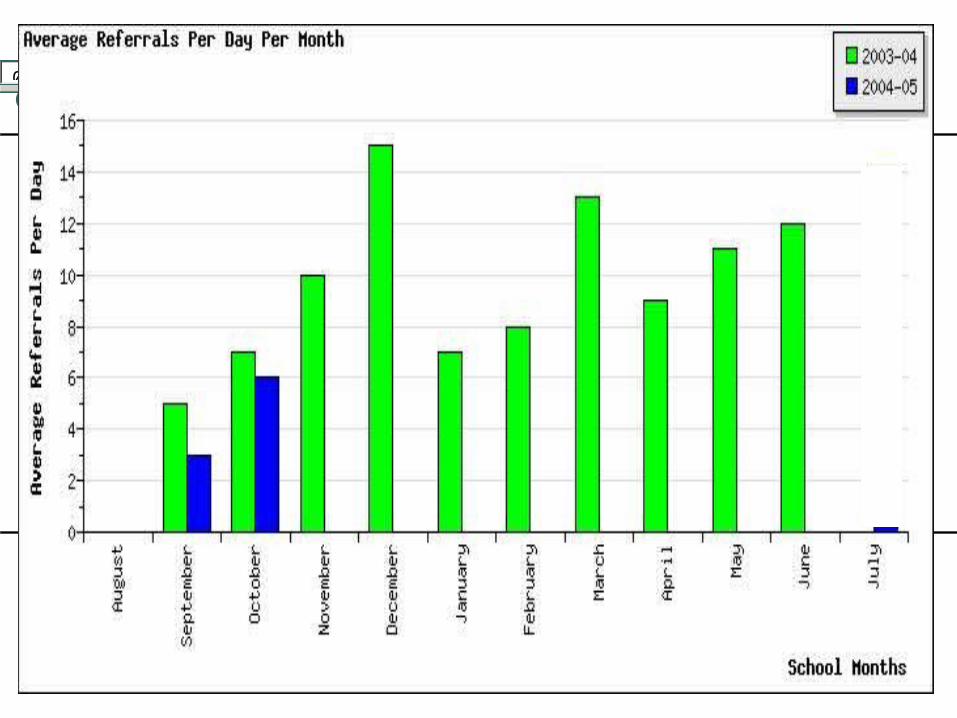
Compare levels to last yearImprovement?
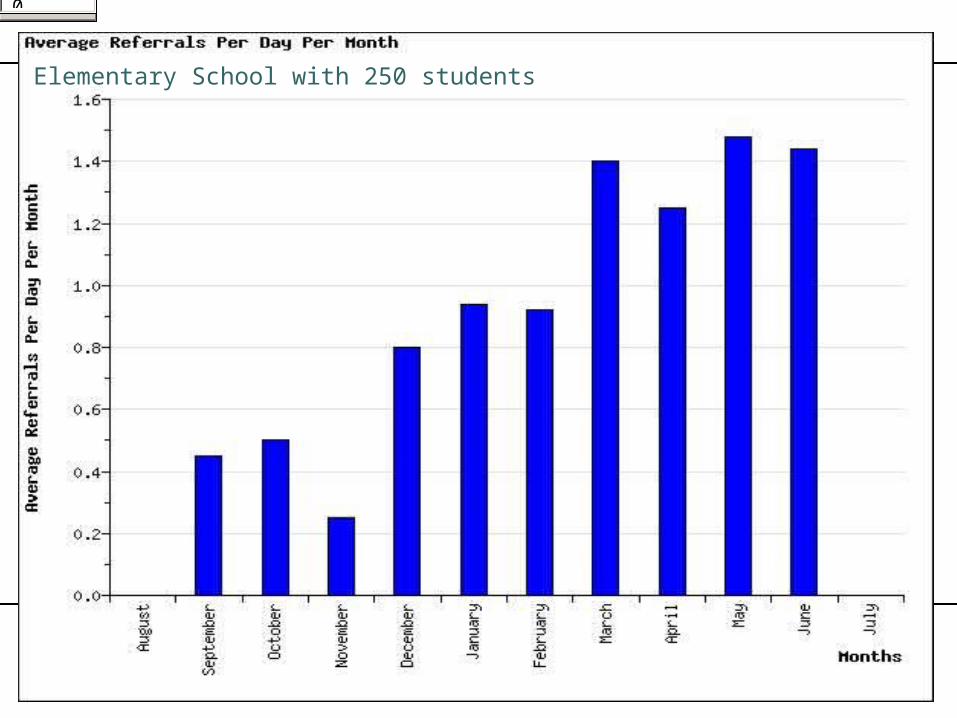
Change Report OptionsChange Report Options0.000.450.500.250.800.940.921.401.251.481.440.000
Elementary School with 250 students

Average Referrals per Day per MonthMiddle School of 600 students

Change Report OptionsChange Report Options0.004.56.249811121114130.000
Middle School with 500 students

Change Report OptionsChange Report Options0.000.000.000.000.000.000.000.000.000.000.000.000.003.006.000.000.000.000.000.000.000.000.00140 Middle school with 500 students
Change Report OptionsChange Report Options0.005710157813911120.000.003.006.000.000.000.000.000.000.000.000.0014.000

Change Report OptionsChange Report Options0.005.007.0010.0015.007.008.0013.009.0011.0012.000.000.003.006.0055.342.532.5430Middle School with 500 students
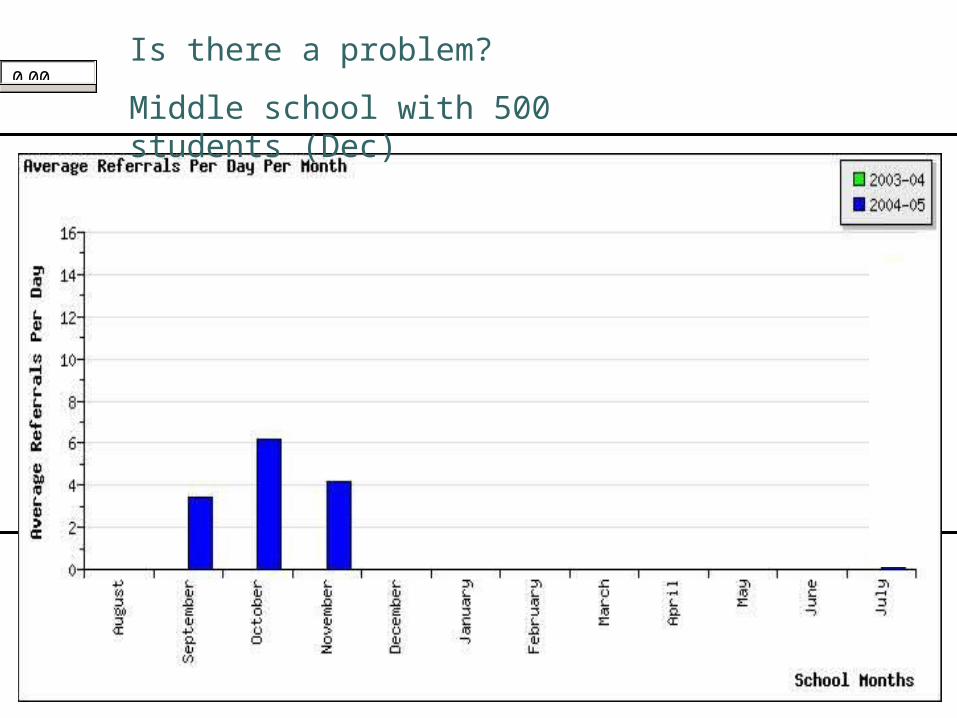
Change Report OptionsChange Report Options0.000.000.000.000.000.000.000.000.000.000.000.000.003.406.204.200.000.000.000.000.00Is there a problem?
Middle school with 500 students (Dec)

0.000.000.000.000.000.000.00
Is there a problem?
Middle School with 500 students

0.007.008.008.5213.008.009.0015.008.007.009.000.000.003.406.204.200.000.000.000.000.000.000.000.000
Is there a problem?
Middle School with 500 students (Dec 04-05)

Change Report OptionsChange Report Options0.007.008.006.5213.008.009.0015.008.007.009.000.000.003.406.207.2011.509.200.000.000.000.000.000.000
Is there a problem?
Middle School with 500 students (Feb 3, 04-05)
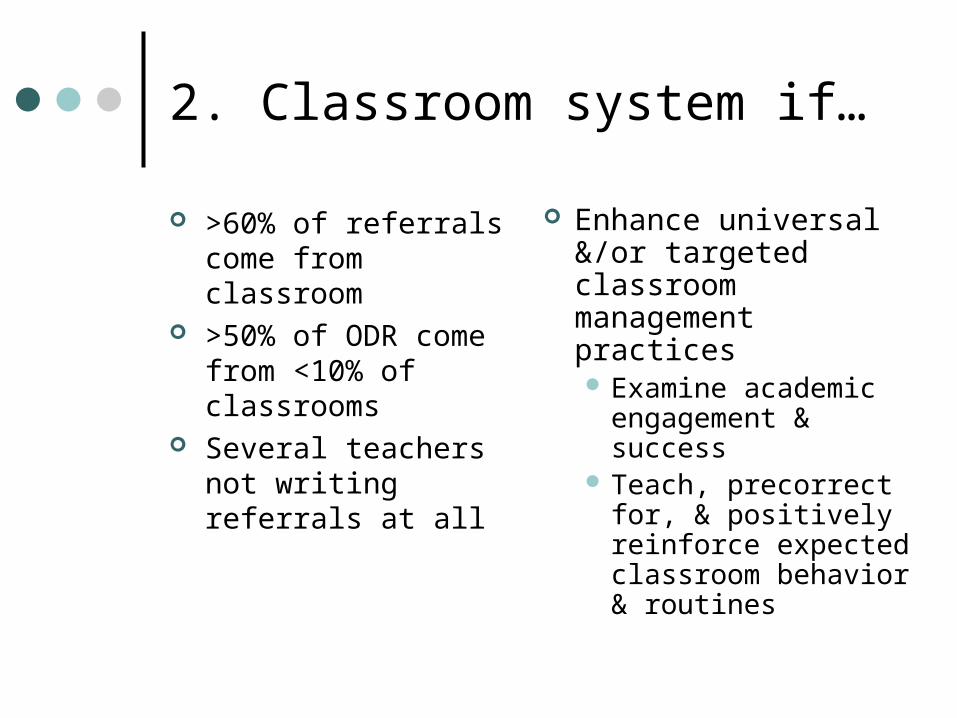
2. Classroom system if…
>60% of referrals come from classroom
>50% of ODR come from <10% of classrooms
Several teachers not writing referrals at all
Enhance universal &/or targeted classroom management practices Examine academic
engagement & success
Teach, precorrect for, & positively reinforce expected classroom behavior & routines

3. Non-classroom systems if…
>35% of referrals come from non-classroom settings
>15% of students referred from non-classroom settings
Enhance universal behavior management practices teach, precorrect for,
& positively reinforce expected behavior & routines
increase active supervision (move, scan, interact)
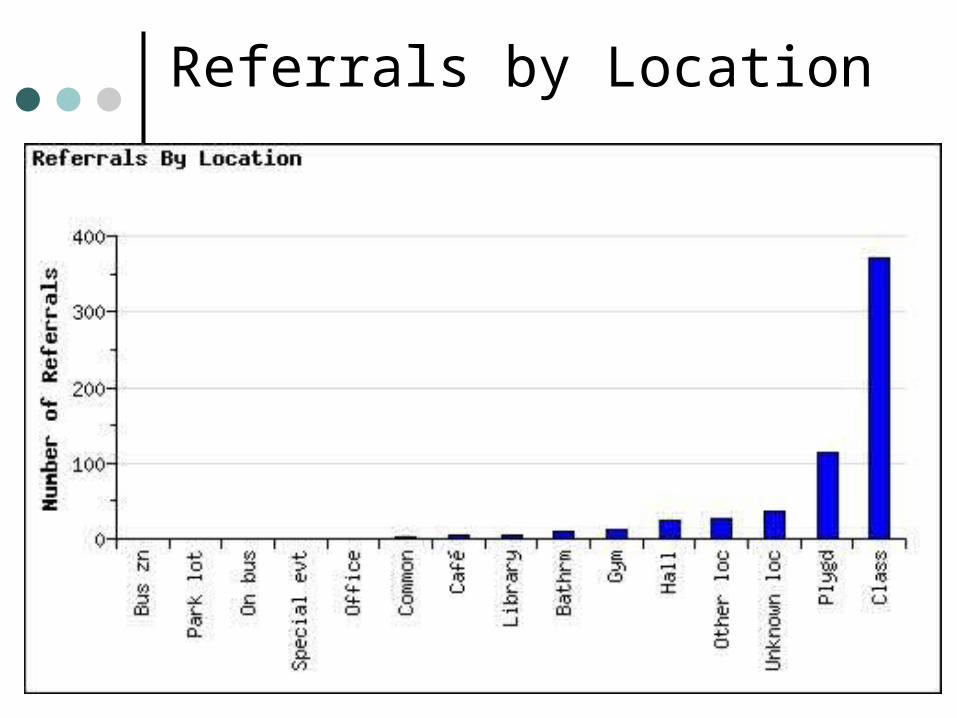
Referrals by Location
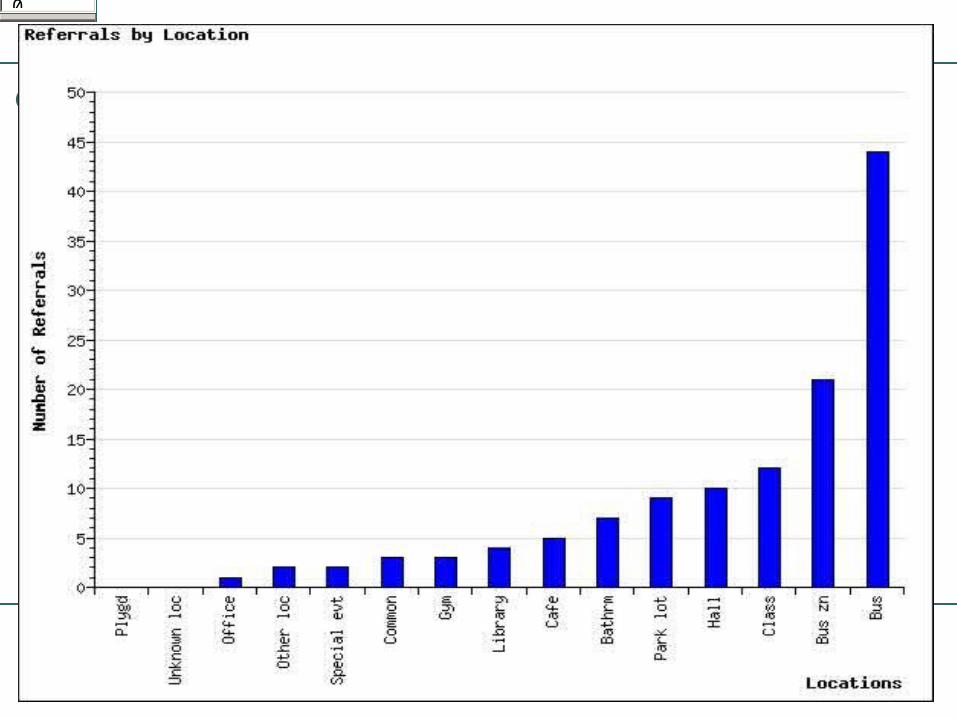
Change Report OptionsChange Report Options1231057342194421200

Change Report OptionsChange Report Options38038247442321200
Middle School

Change Report OptionsChange Report Options123123242494420321200
Elementary School

Referrals by Time
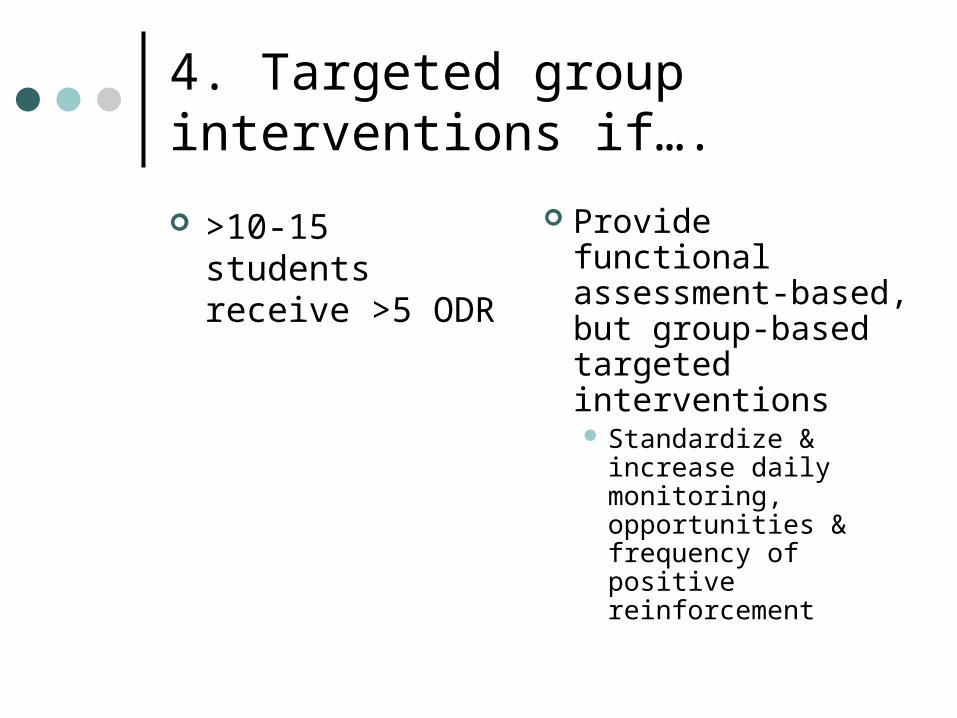
4. Targeted group interventions if….
>10-15 students receive >5 ODR
Provide functional assessment-based, but group-based targeted interventions Standardize &
increase daily monitoring, opportunities & frequency of positive reinforcement

5. Individualized action team system if...
<10 students with >10 ODR
<10 students continue rate of referrals after receiving targeted group support
Provide highly individualized functional-assessment-based behavior support planning

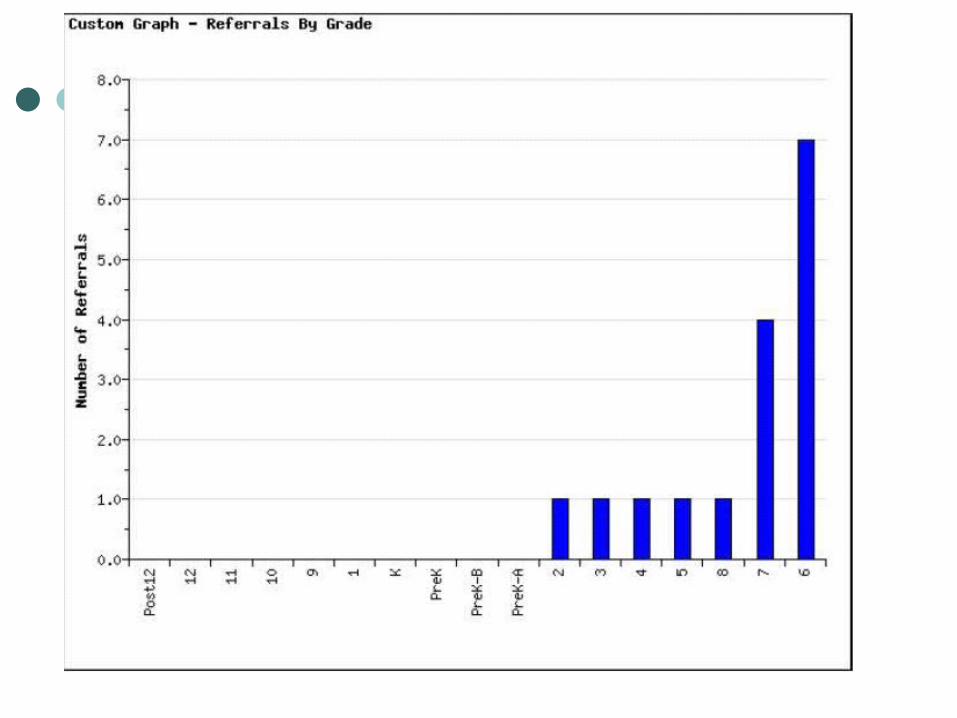
Referrals by Student

Student Referral Report
Date Staff Time LocationProblem Behavior
MotivationOthers Involved
Admin Decision
1 03/10/2004 43866 12:15PM Plygd Agg/Fight Unknown mot Peers Parent
2 03/01/2004 62390 12:30PMUnknown loc
Disrespt DK Peers Parent
3 02/10/2004 47522 01:30PM Class Agg/Fight Unknown mot UnknownO Office AD
4 12/18/2003 47522 10:30AM Class Agg/Fight Unknown mot PeersOut-sch susp
5 12/08/2003 47522 10:00AM ClassOther behav
Unknown mot NoneOut-sch susp
6 12/08/2003 47522 01:15PM Class Disrespt Ob p attn None Office AD
7 11/20/2003 62390 10:00AMUnknown loc
Agg/Fight Unknown mot PeersOut-sch susp
8 11/20/2003 47522 10:30AM Class Agg/Fight Unknown mot PeersOut-sch susp

School Example
A middle school getting ready to implement targeted group interventions. They had been implementing school-wide interventions for one school year.

Some Questions ABC Middle School had re: student needs
How many students in the middle of the triangle? How many need at the top of the triangle? How many students in the targeted group have 2,
3, 4, 5, thru 25 referrals? What types of behaviors are targeted group
students and tip of triangle students engaging in? What percent of students in targeted and tip are
Sped? What percent of students in targeted and tip met
AYP the previous year?

ABC Middle School
541 students 1314 total number of referrals for SY 04-
05 Pre and Post Set completed Team attended 4 PBS trainings
throughout year and implemented along the way
Team leader attended district leadership meeting consistently throughout year
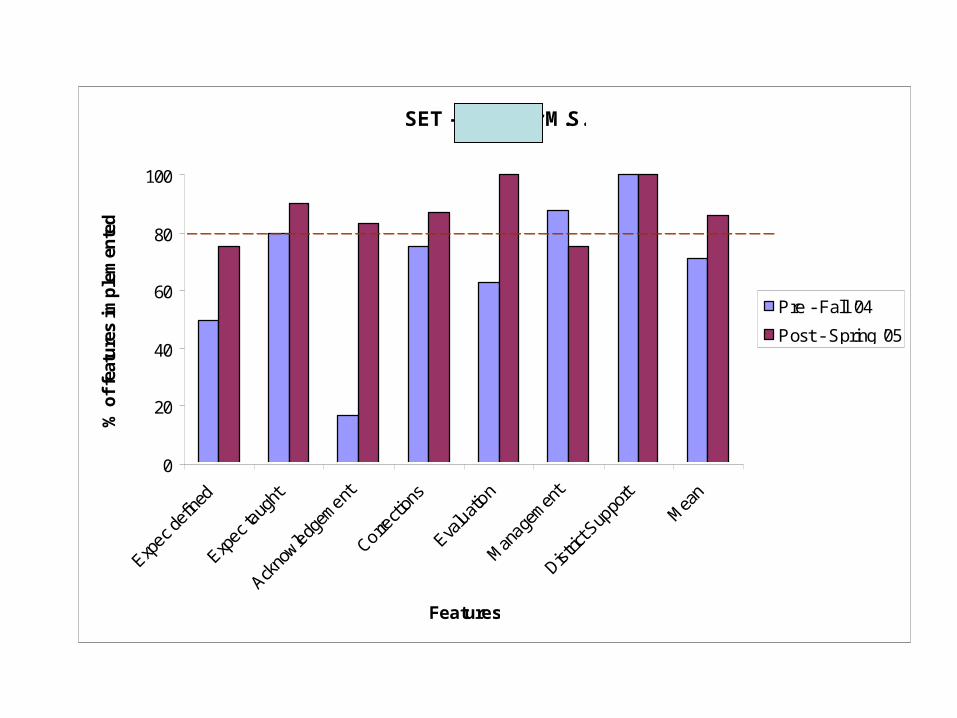
SET - Gardiner M.S.
0
20
40
60
80
100
Features
% o
f fe
atu
res
imp
lem
ente
d
Pre - Fall '04
Post - Spring '05

Triangle Data
0-1 referral: 381 (65% of students) 2-5 referrals: 124 (21% of students) 6+ referrals: 82 (14% of students)
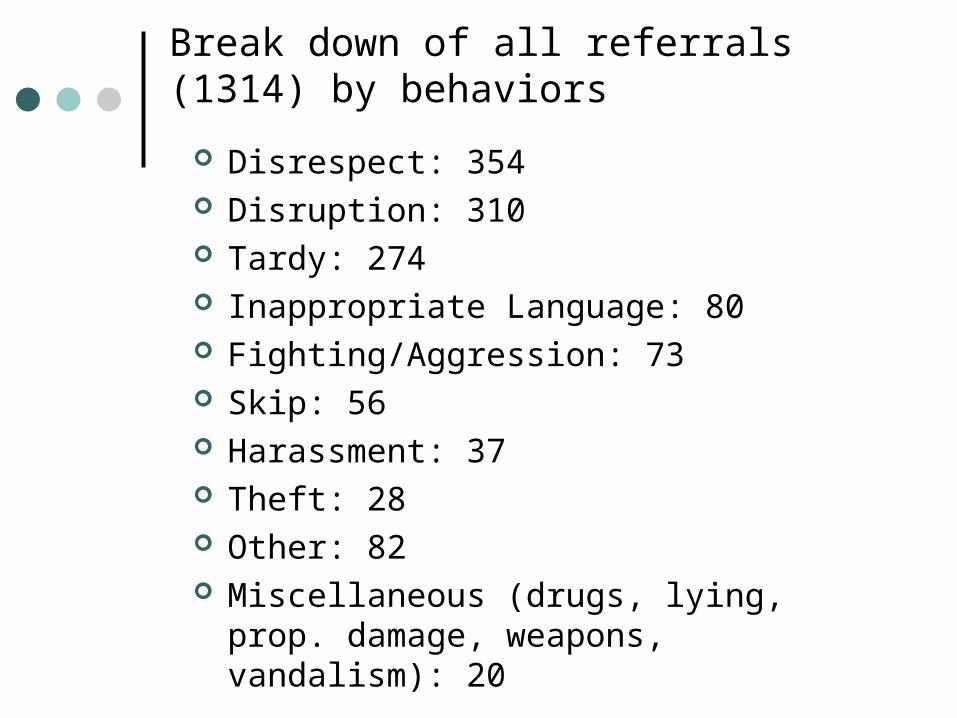
Break down of all referrals (1314) by behaviors
Disrespect: 354 Disruption: 310 Tardy: 274 Inappropriate Language: 80 Fighting/Aggression: 73 Skip: 56 Harassment: 37 Theft: 28 Other: 82 Miscellaneous (drugs, lying, prop. damage,
weapons, vandalism): 20
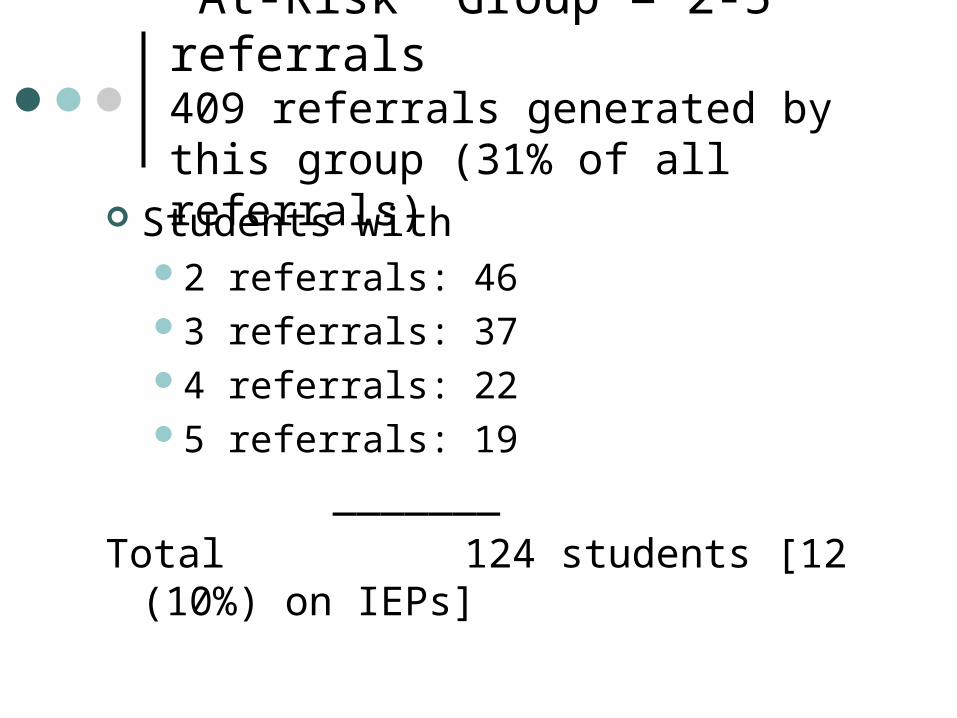
‘At-Risk’ Group = 2-5 referrals409 referrals generated by this group (31% of all referrals)
Students with2 referrals: 463 referrals: 374 referrals: 225 referrals: 19
_______
Total 124 students [12 (10%) on IEPs]
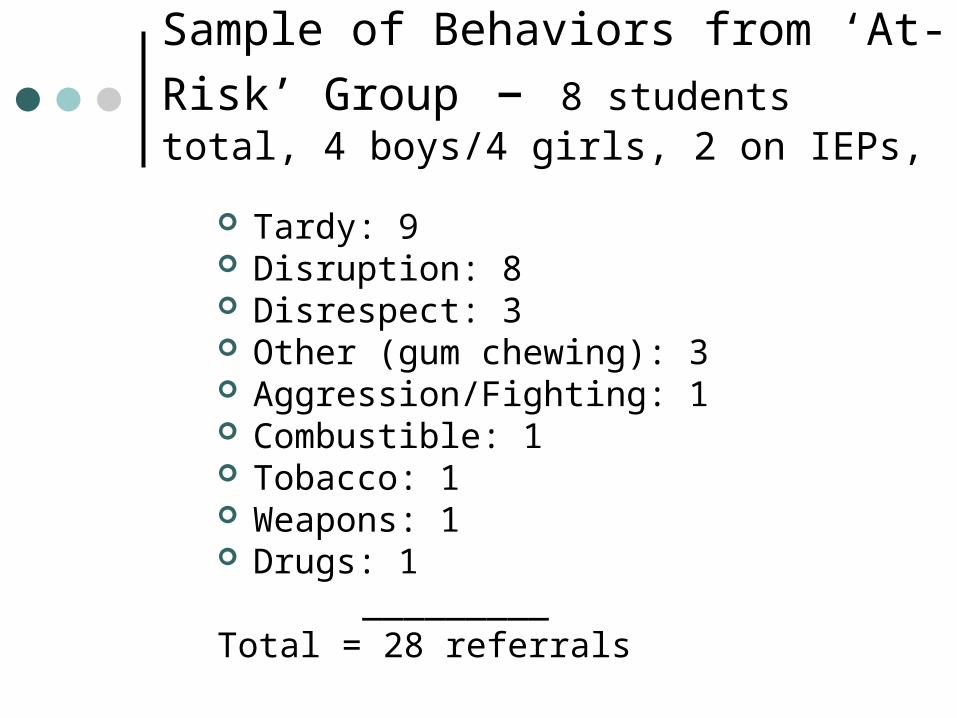
Sample of Behaviors from ‘At-Risk’
Group – 8 students total, 4 boys/4 girls, 2 on IEPs,
Tardy: 9 Disruption: 8 Disrespect: 3 Other (gum chewing): 3 Aggression/Fighting: 1 Combustible: 1 Tobacco: 1 Weapons: 1 Drugs: 1 _________Total = 28 referrals

‘Tip of Triangle’ – 6+ referrals859 referrals generated by this group (65% of all referrals)
Students with 6 referrals: 11 7 referrals: 11 8 referrals: 9 9 referrals: 9 10 referrals: 11 11 referrals: 4 12 referrals: 7
Students with 13 referrals: 3 14 referrals: 5 15 referrals: 5 17 referrals: 3 18 referrals: 2 19 referrals: 1 24 referrals: 1 _________ Total = 82 students
[18 (22%) on IEPs]
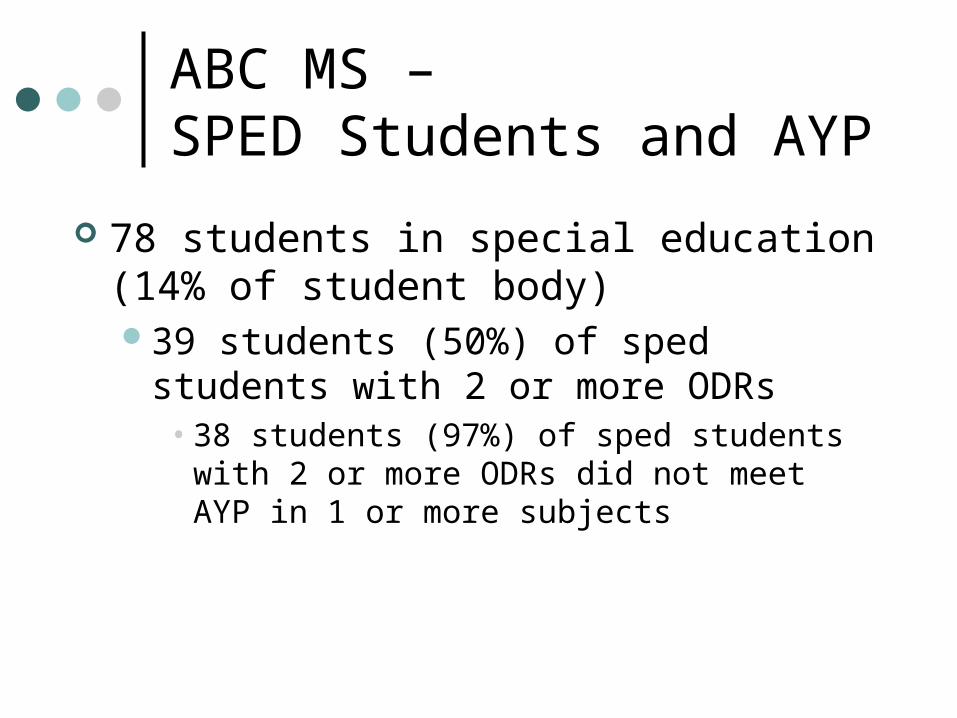
ABC MS –SPED Students and AYP
78 students in special education (14% of student body)39 students (50%) of sped students with 2
or more ODRs• 38 students (97%) of sped students with 2 or
more ODRs did not meet AYP in 1 or more subjects

Additional Information
Ethnicity ReportsAvailable on SWIS and eSIS
Special Education
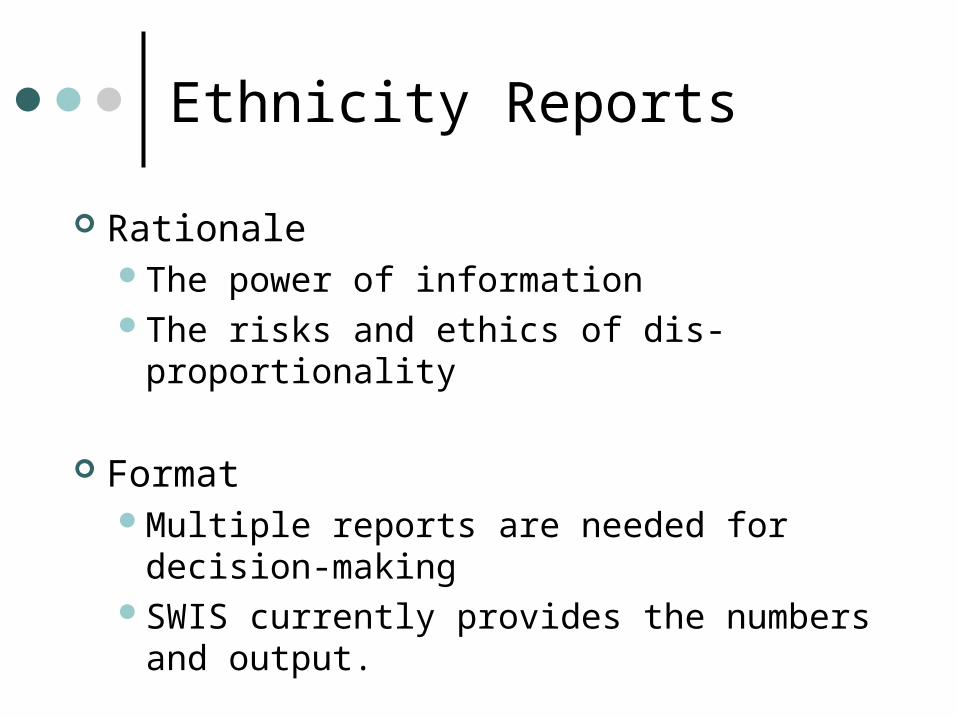
Ethnicity Reports
RationaleThe power of informationThe risks and ethics of dis-proportionality
FormatMultiple reports are needed for decision-
makingSWIS currently provides the numbers and
output.

Ethnicity Reports Key Questions
What proportion of enrolled students in school are from each ethnicity?
What proportion of referrals are contributed from students in each ethnicity?
What proportion of students with at least one referral are from each ethnicity?
What proportion of students within each ethnicity have received at least one office discipline referral?
Ethnicity #1Ethnicity #2 Ethnicity #3
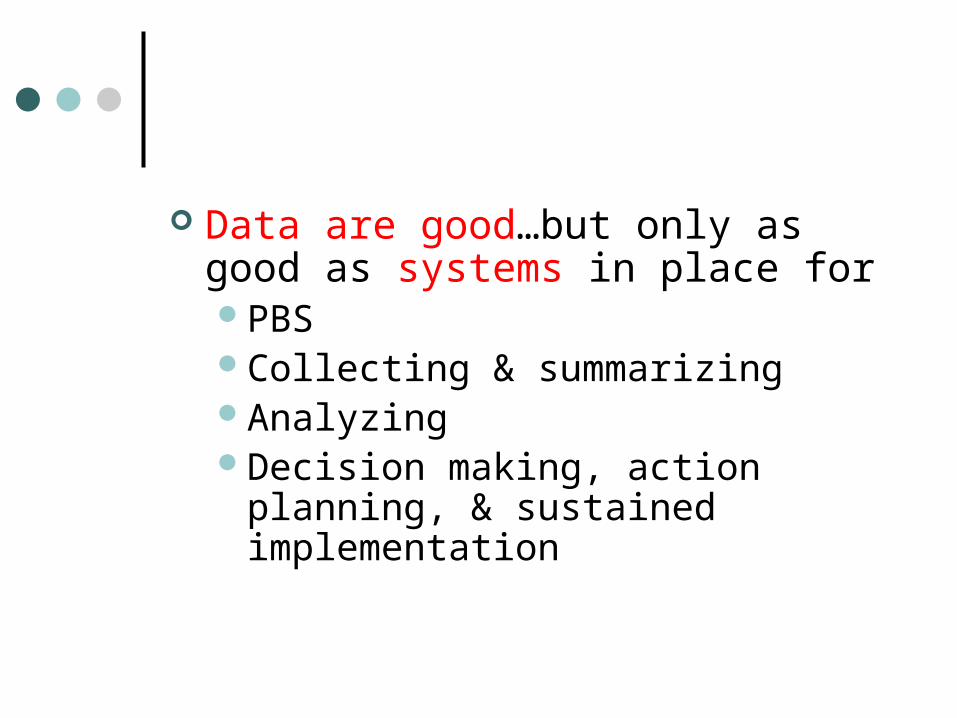
Data are good…but only as good as systems in place forPBSCollecting & summarizingAnalyzingDecision making, action planning, &
sustained implementation

Monthly E-mails (December)
Dear Staff, Thought I’d send this along before we go home ‘till 1999. Through 11/30/98 there were 179 referrals involving 62
students (6.7%). 858 students (99.3%) have no referrals. 27 students (2.9%) are responsible for 80% of all referrals
through 11/30. The top 13 have earned 59% of the referrals. Thank you for your efforts this fall in helping to carry a
positive surge in momentum through the year’s end. Have a refreshing break.
Happiest Holiday Wishes!
Monthly E-mails (February) Ever have that feeling like you wondered if someone had gotten
the license plate of the truck that hit you? February had a bit of that feel to it. Approximately 1/3 of the year’s referrals to date (143 out of 457) took place in February…In perspective, the month was truly out of character with the rest of the year. Thank you for your perseverance.
85% of our students continue their good work and have no referrals.
The 457 referrals (9/98-2/99) are down 22% from the 581 referrals last year.
In April we will be seeking staff input through our EBS survey to help build a focus for next school year. Keep up your good work--

Summary Transform data into “information” that is
used for decision-making Present data within a process of problem
solving.Use the trouble-shooting tree logicBig Five first (how much, who, what, where, when)
Data should be collected to answer specific questions
Ensure the accuracy and timeliness of data.