

The World of the Sixth Billionth Child. Each day, the world’s population continues to grow…

Advanced Color Machine Vision and Applications
Dr. Romik Chatterjee V. P. Business Development
Graftek Imaging Inc.
V09 March 26, 2014
Outline
• Why is color machine vision useful? Motivations
• Physics of color imaging Lights, camera, action
• Human color vision Biology for engineers
• Color machine vision systems Hardware selection
• Basic color machine vision algorithms Software tools and strategies
• Color based MV solutions
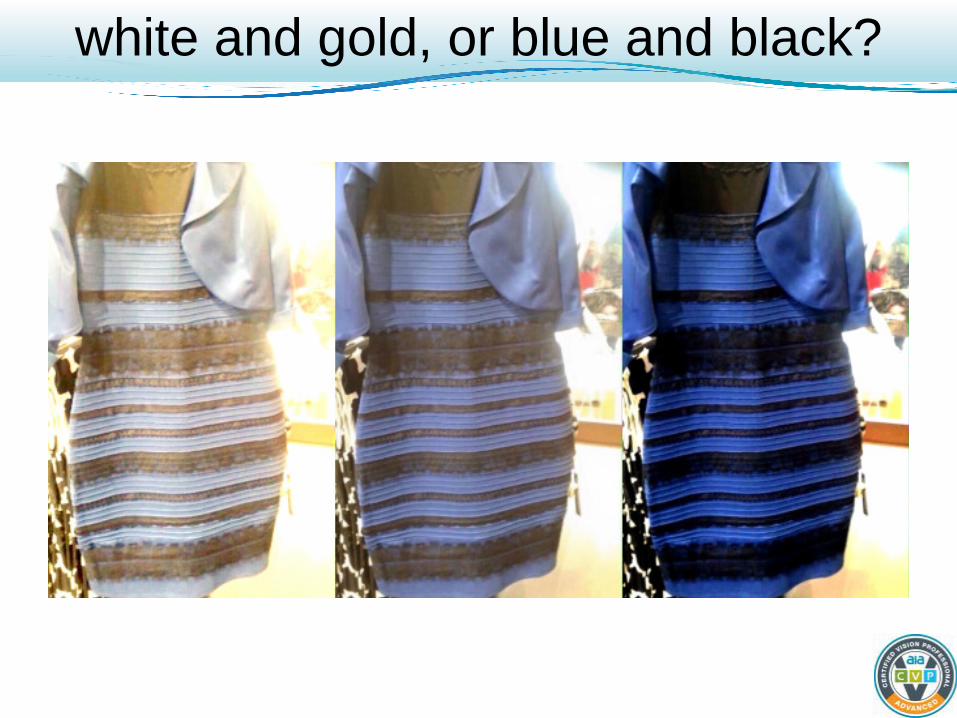
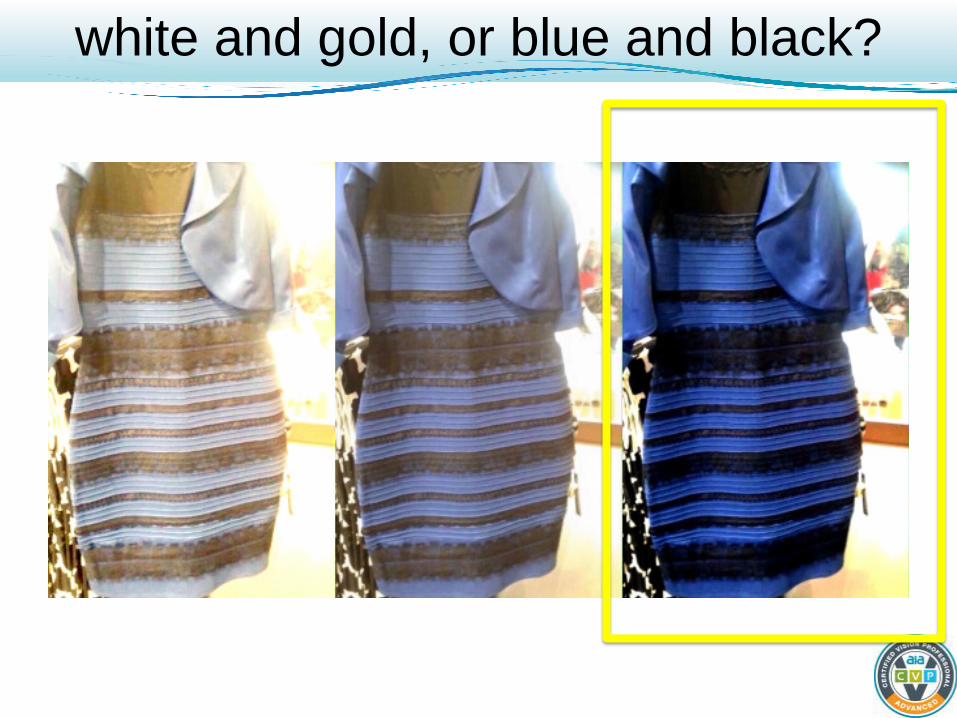
white and gold, or blue and black?

INTRODUCTION
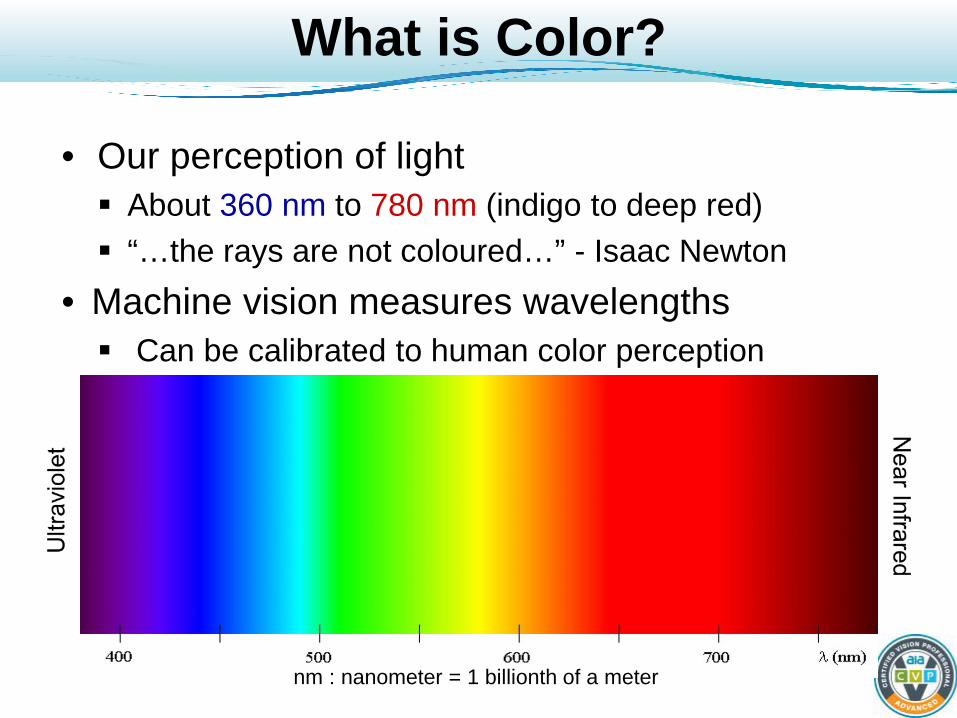
What is Color?
• Our perception of light About 360 nm to 780 nm (indigo to deep red) “…the rays are not coloured…” - Isaac Newton
• Machine vision measures wavelengths Can be calibrated to human color perception
nm : nanometer = 1 billionth of a meter

Color: Introduction
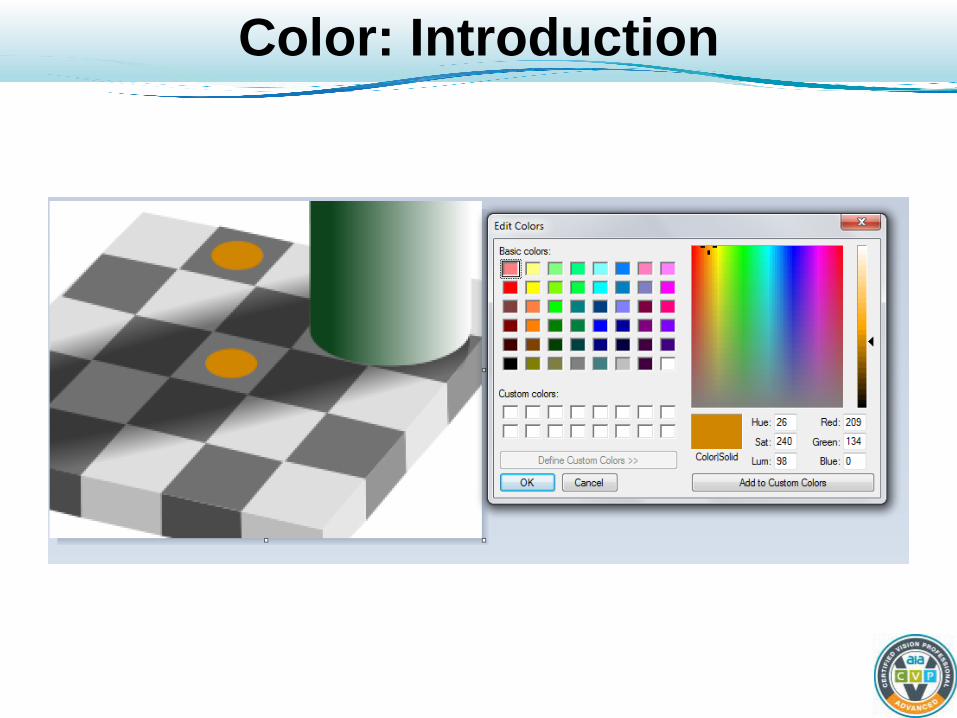
• Color is a perception, not the physical property of an object.
• Both circles are the exact same color
Color: Introduction
Color: Introduction
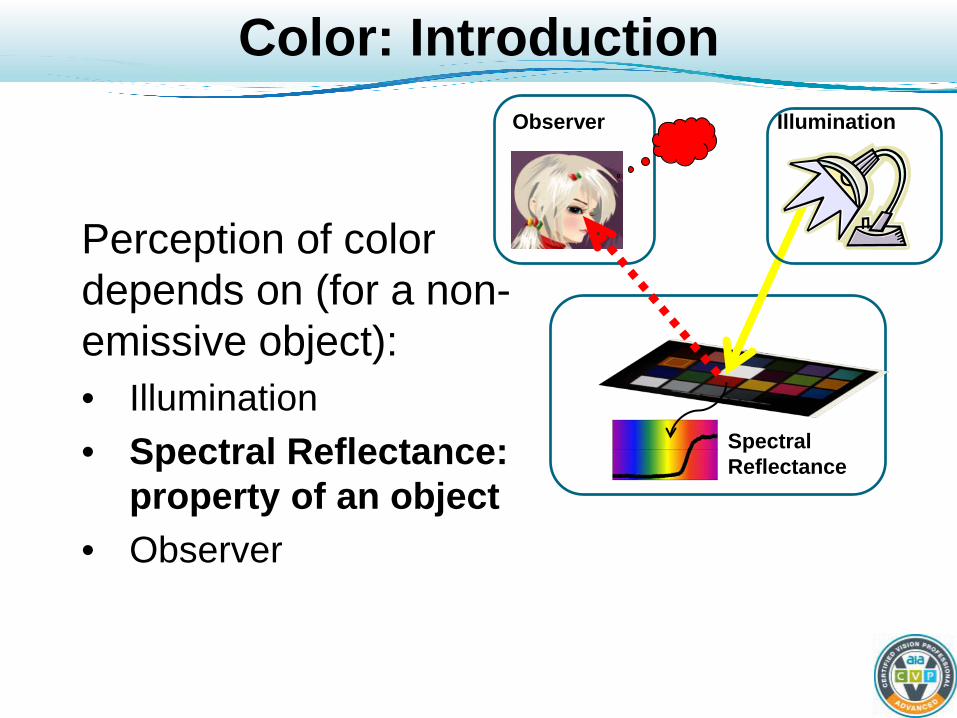
Perception of color depends on (for a non-emissive object): • Illumination • Spectral Reflectance:
property of an object • Observer
Spectral Reflectance
Illumination Observer
Color: what do we measure?
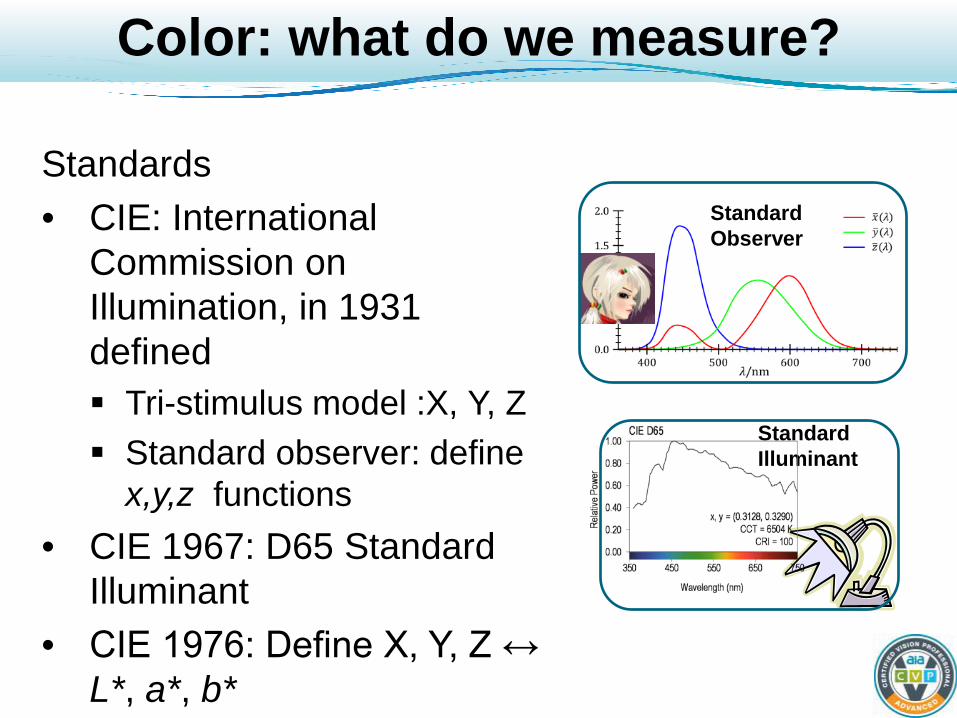
Standards • CIE: International
Commission on Illumination, in 1931 defined Tri-stimulus model :X, Y, Z Standard observer: define
x,y,z functions • CIE 1967: D65 Standard
Illuminant • CIE 1976: Define X, Y, Z ↔
L*, a*, b*
Standard Observer
Standard Illuminant

Color: what do we measure?
Standard observer and illuminant are not real • Need to measure
spectral reflectance • X, Y, Z and L*, a*, b*
can then be computed Spectral
Reflectance
Standard Observer
Standard Illuminant
L*, a*, b*
L*: -black, +white a*: -green, +magenta b*: -blue, +yellow

Color: how do we measure it?
X, Y, Z or L*, a*, b*
Multi-spectral imaging Measure response at each wavelength for each pixel
Photo-spectrometers Measure response at each wavelength for a spot
Color Cameras Measure R, G, B→ X, Y, Z
Spectral Reflectance
R, G, B
Color Camera: 3 Filters
Illumination
X, Y, Z or L*, a*, b*
Illumination
X, Y, Z or L*, a*, b*
Spectral Reflectance

IMPORTANT USES OF COLOR VISION
Important Uses of Color Vision
• Determining material property – help identify what something is made of or its state What is that? Safe to eat it?
• Inspection and Sorting Is the printing defective? Is the fruit damaged?
• Searching and Locating Location? Orientation? Presence-absence?
• Measuring and Matching What color is it? Right color? Does it match?
• Coding – Color labels and codes
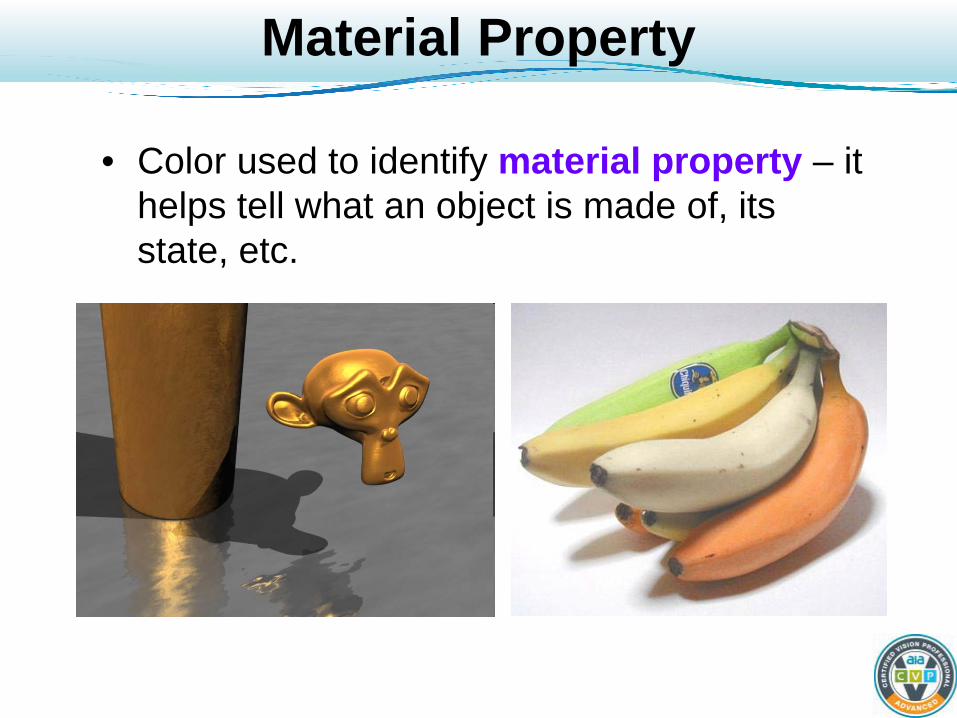
Material Property
• Color used to identify material property – it helps tell what an object is made of, its state, etc.

Which Cherries are Ripe?
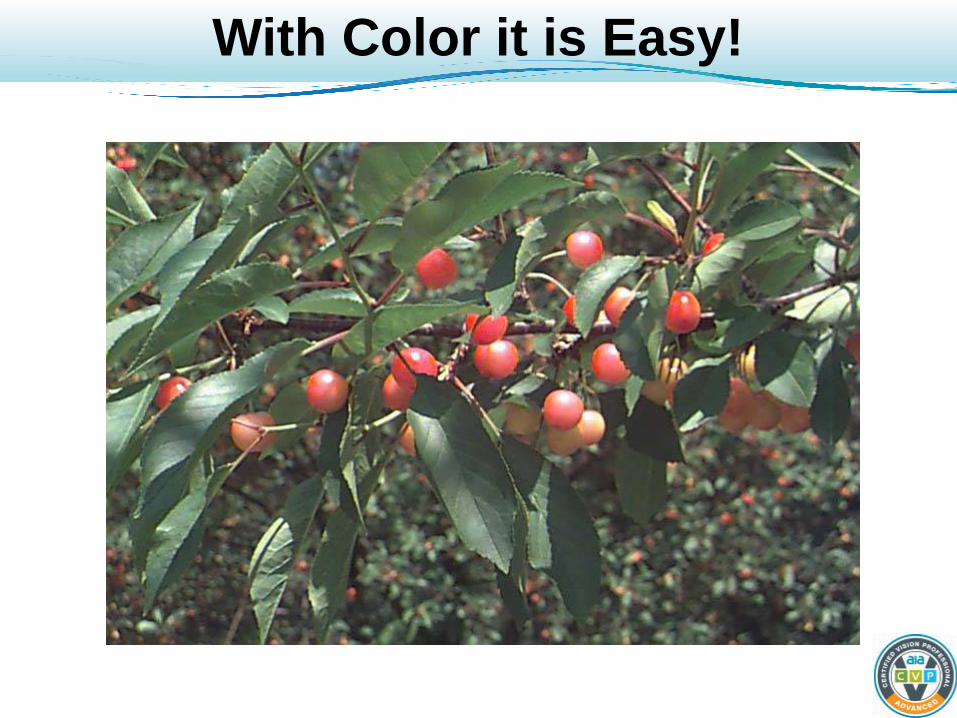
With Color it is Easy!
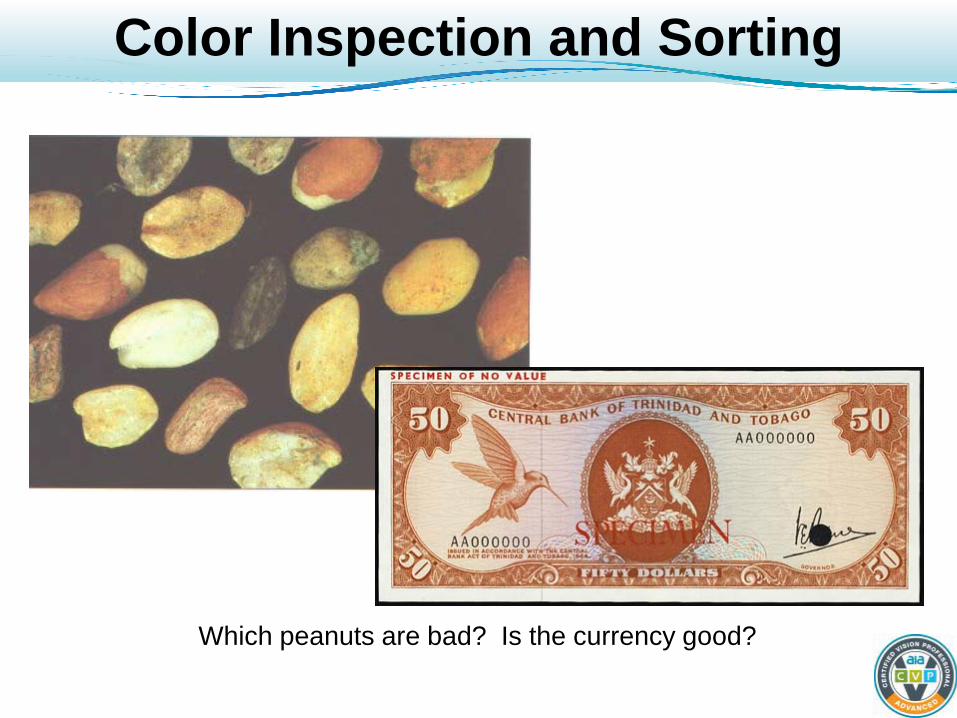
Color Inspection and Sorting
Which peanuts are bad? Is the currency good?

Searching and Locating
Which Sneakers are Light Blue?

Color Measuring and Matching
Medical diagnostics Color matching on car interior

Uses – Summary
• Sorting Discrimination based on color
• Color based quality Change in material characteristic
• Color based identification

Human Color Vision
The standard for many machine color vision tasks Stable perceptions of objects despite
uncontrolled lighting and viewing geometry Easy to train, flexible, “understands” images
Slow, quickly tires, individuals differ, low resolution, hard to calibrate Color (not intensity!) is low spatial resolution Influenced by surroundings in time and space – color contrast
• Optical illusions show problems and give us clues as to how biological vision works
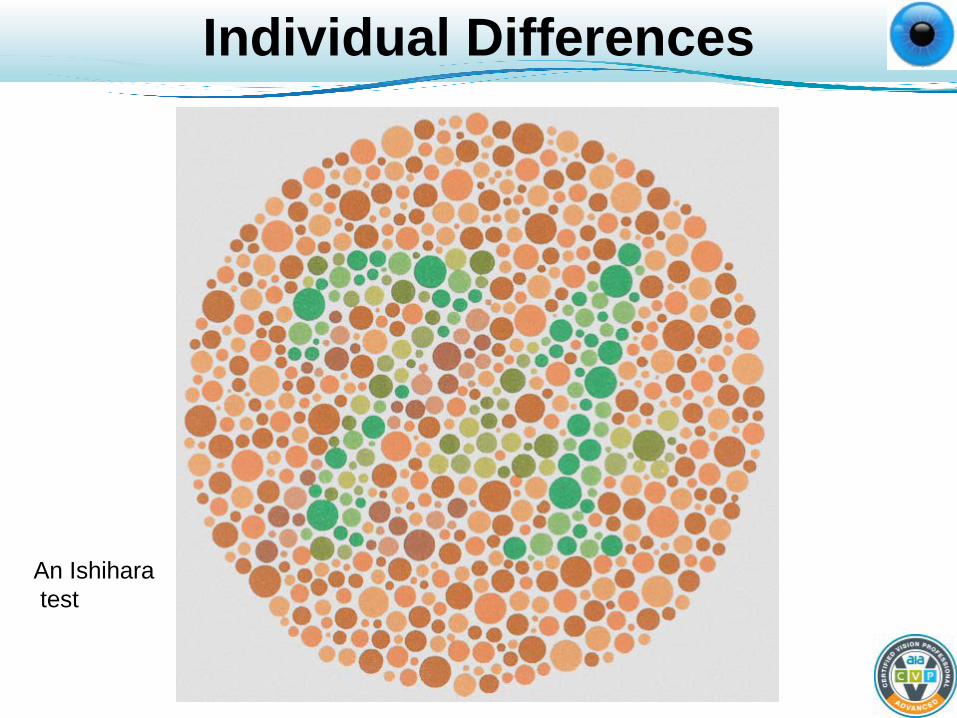
Individual Differences
An Ishihara test

Influenced by Surroundings
Dramatic example of color contrast effects “Side effect” of our color constancy abilities?

Color Machine Vision (CMV)
Replaces human vision on tasks that require fast, repeatable color vision. Never tires.
Can calibrate to human color vision (sort of!) Can “see” wavelengths we can’t (IR, UV, etc.)
Teledyne DALSA
Color Machine Vision
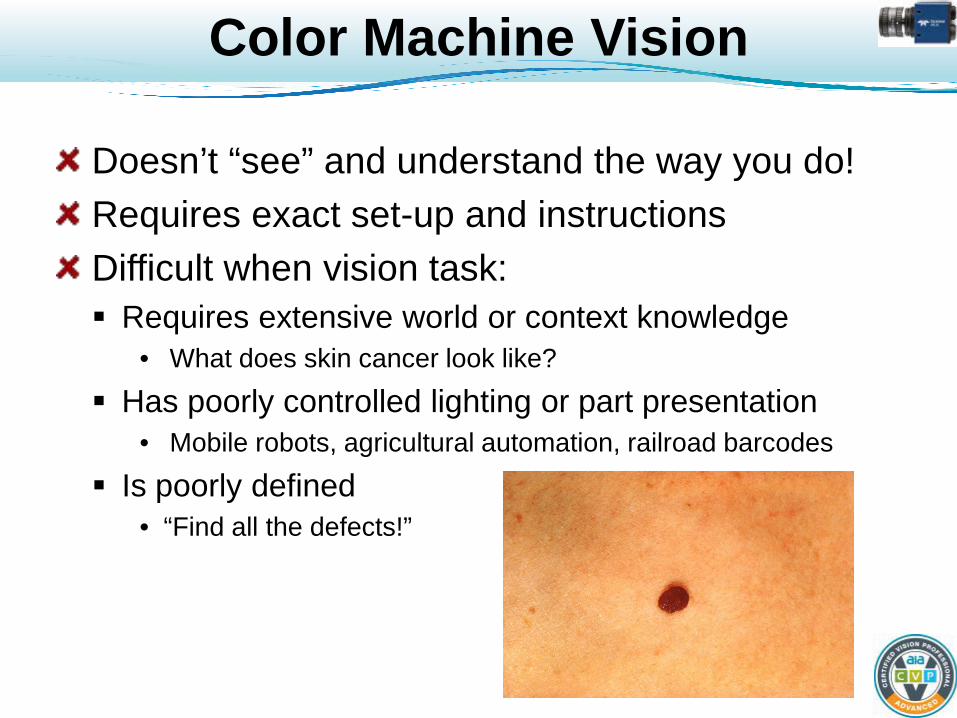
Doesn’t “see” and understand the way you do! Requires exact set-up and instructions Difficult when vision task: Requires extensive world or context knowledge
• What does skin cancer look like?
Has poorly controlled lighting or part presentation • Mobile robots, agricultural automation, railroad barcodes
Is poorly defined • “Find all the defects!”

Some Markets for Color MV
• Food production and processing • Pharmaceutical inspection • Parts identification • Inspecting or matching colored material • Medical diagnostics • Print and label inspection • Sorting recycled materials • Remote sensing, tracking • Biometrics, traffic monitoring • Measuring paints and pigments

PHYSICS OF COLOR IMAGING
Light
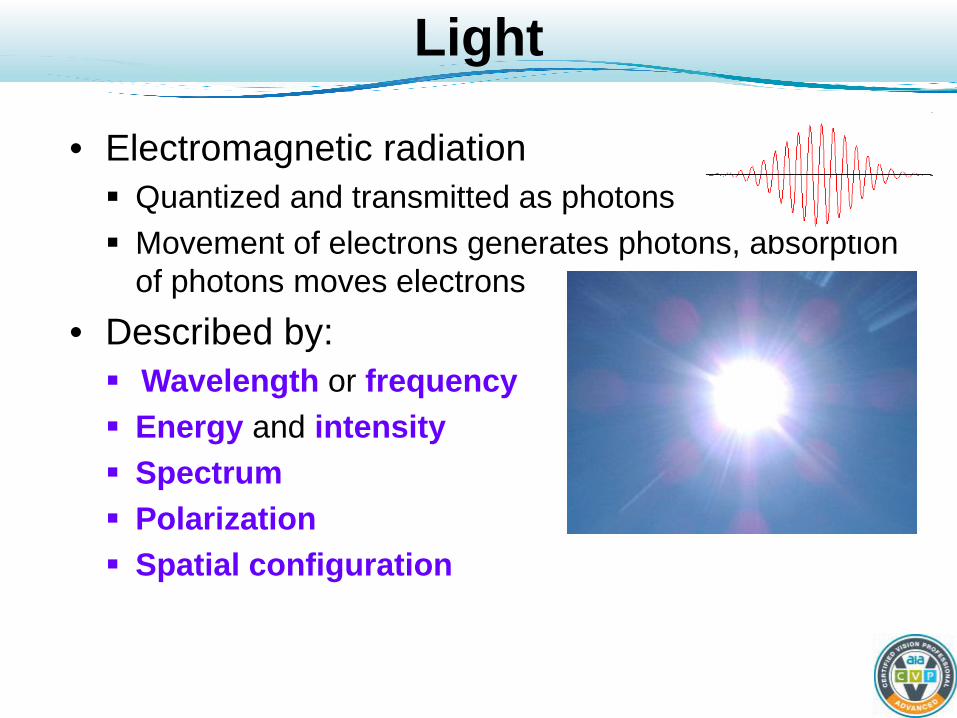
• Electromagnetic radiation Quantized and transmitted as photons Movement of electrons generates photons, absorption
of photons moves electrons • Described by: Wavelength or frequency Energy and intensity Spectrum Polarization Spatial configuration

Wavelength or Frequency
• vp = c/n = λf c: Velocity of light in vacuum or ~air (3 x 10⁸ m/sec) n: Index of refraction. e.g., 1 in vacuum, ~1.5 in glass λ: Wavelength (780 to 360 nm – red through blue) f: Frequency (4 x 10¹⁴ to 8 x 10¹⁴ Hz)
• Usually use wavelength 600 THz

Energy and Intensity
• Photon energy is a function of wavelength • Energy transfer rate increases with: Photon energy (decreasing wavelength) Photon flux: photons per second (intensity)
• Spectral power: E(λ) * flux Watts per wavelength = J / sec / λ
• Irradiance = Watts / square area (W/m2) • These are RADIOMETRIC measures
Red, 650 nm => 1.9 electron volts (eV)
1 eV = 1.6 x 10⁻¹⁹ joules (J)

Radiometric vs. Photometric
• Radiometric = Physical measurement of light Spectrometer
• Photometric = Human response to light – perceptual brightness per wavelength. Tristimulus colorimeter (or just colorimeter) Photometer
• Many different measures (~60?)
Spectrum (Radiometric)
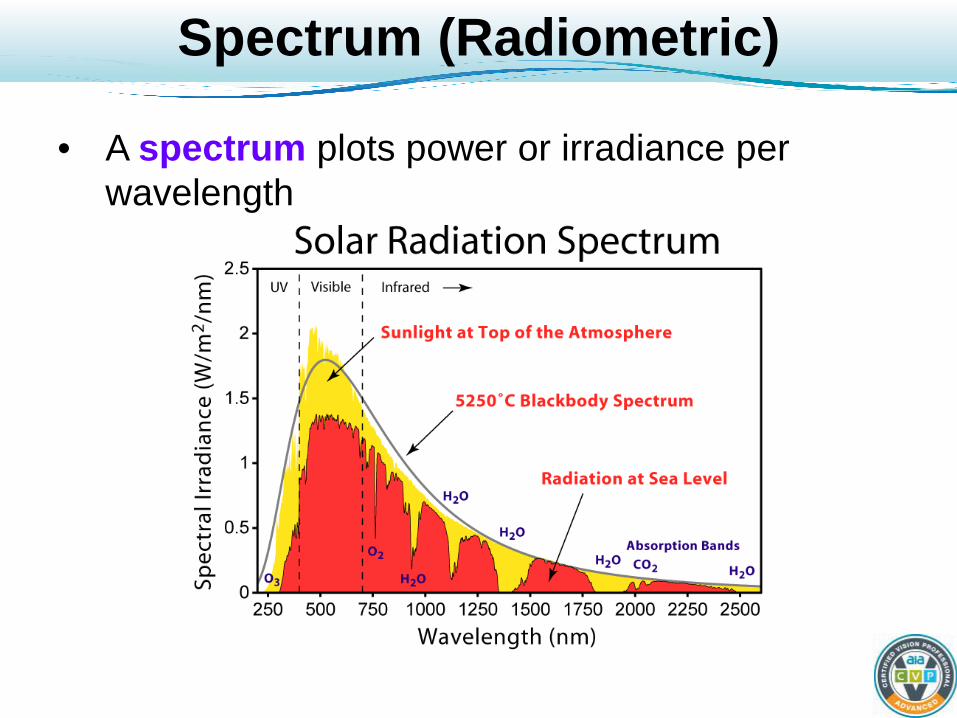
• A spectrum plots power or irradiance per wavelength
Spatial Configuration
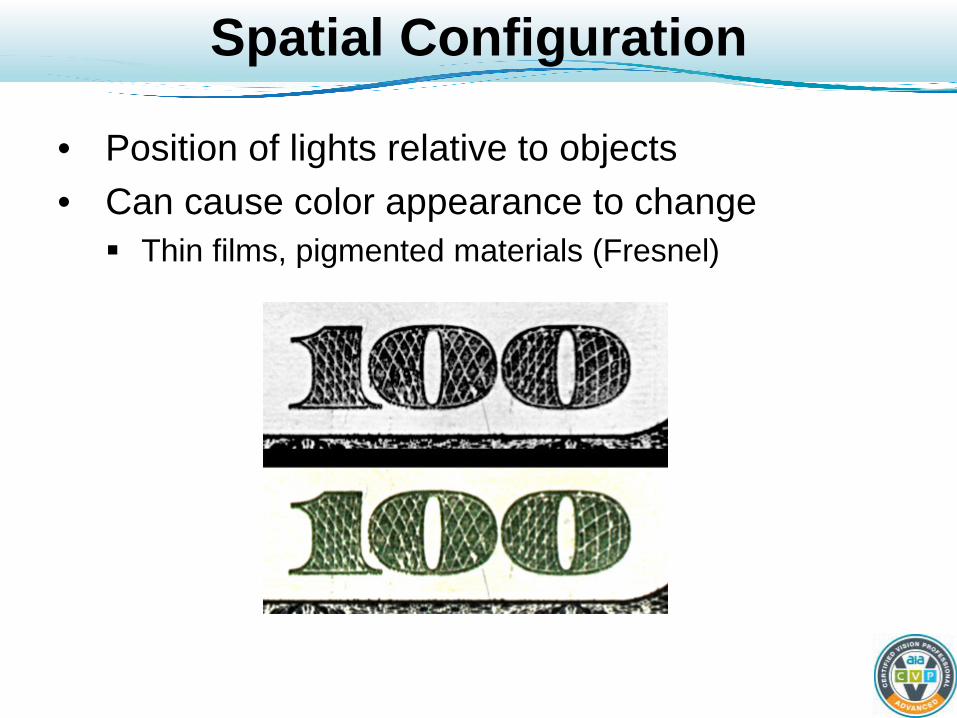
• Position of lights relative to objects • Can cause color appearance to change Thin films, pigmented materials (Fresnel)

Ratios of Color Sensor Types
• Color vision requires two or more light sensors types with different spectral responses
Spectral Responses are NORMALIZED!
Metamers
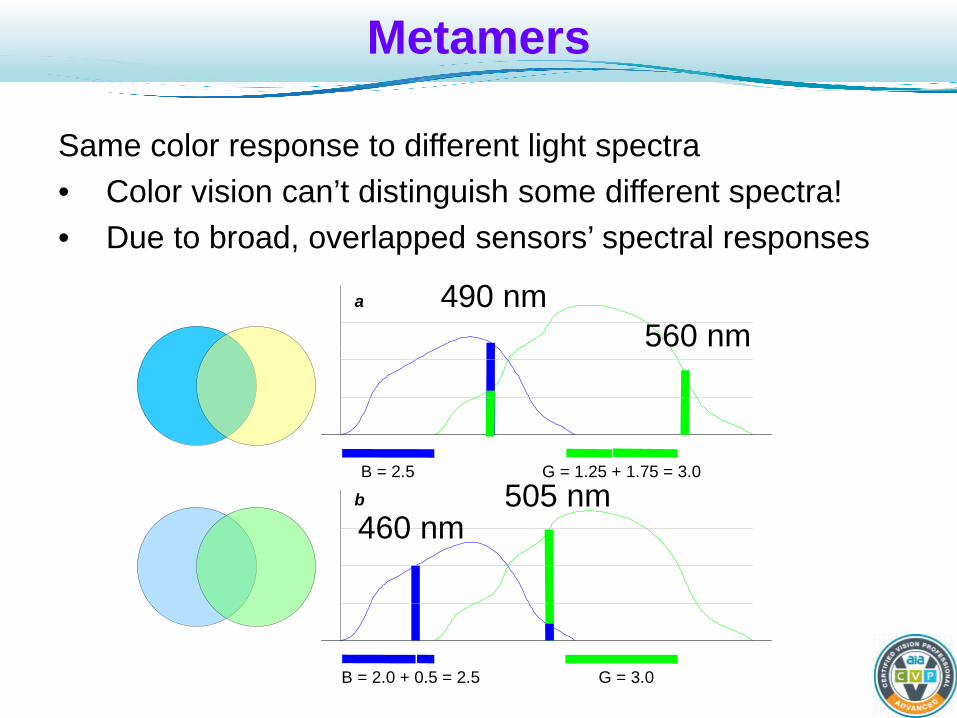
Same color response to different light spectra • Color vision can’t distinguish some different spectra! • Due to broad, overlapped sensors’ spectral responses
a
bB = 2.5 G = 1.25 + 1.75 = 3.0
B = 2.0 + 0.5 = 2.5 G = 3.0
490 nm 560 nm
460 nm 505 nm
Model of Color Image Formation
• Modeled as the product of: Illumination spectrum Object transmission or reflection spectrum Sensors’ spectral responses
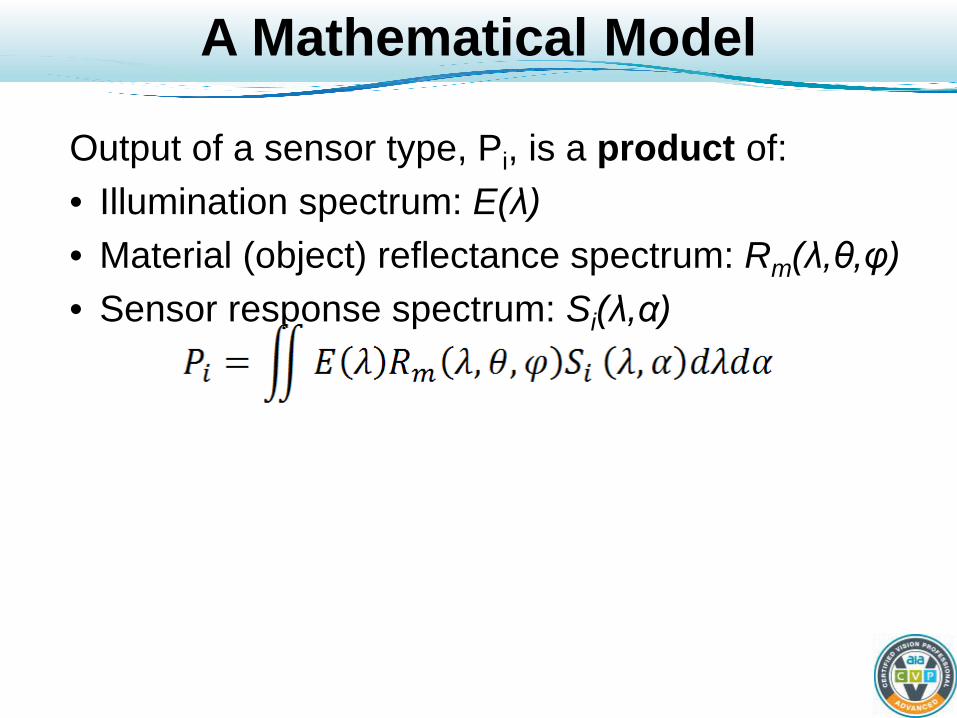
A Mathematical Model
Output of a sensor type, Pi, is a product of: • Illumination spectrum: E(λ) • Material (object) reflectance spectrum: Rm(λ,θ,φ) • Sensor response spectrum: Si(λ,α)

Diagram of Imaging Model
Illumination
Object
SensorProcessingSamples
Answers
Physics
Si(λ,α)
Computational Factors

The Color Vision Problem
• Given broadband sensor types’ outputs, Pi, recover object’s spectrum, Rm
• Must know or estimate E(λ) and (θ,φ)
Is the material or light yellow??! Pi Sensor Readings:
E(λ) {θ,φ,α}

Recovering the Illuminant
• We know sensor responses and can know or estimate the imaging geometry (θ,φ)
We must know or recover the illuminant, E(λ) • Vision uses constraints and assumptions to
“factor out” illumination and get object color Example: MV uses constrained lighting and assumptions to color balance the image

Illumination
Elements in color image formation starting with illumination
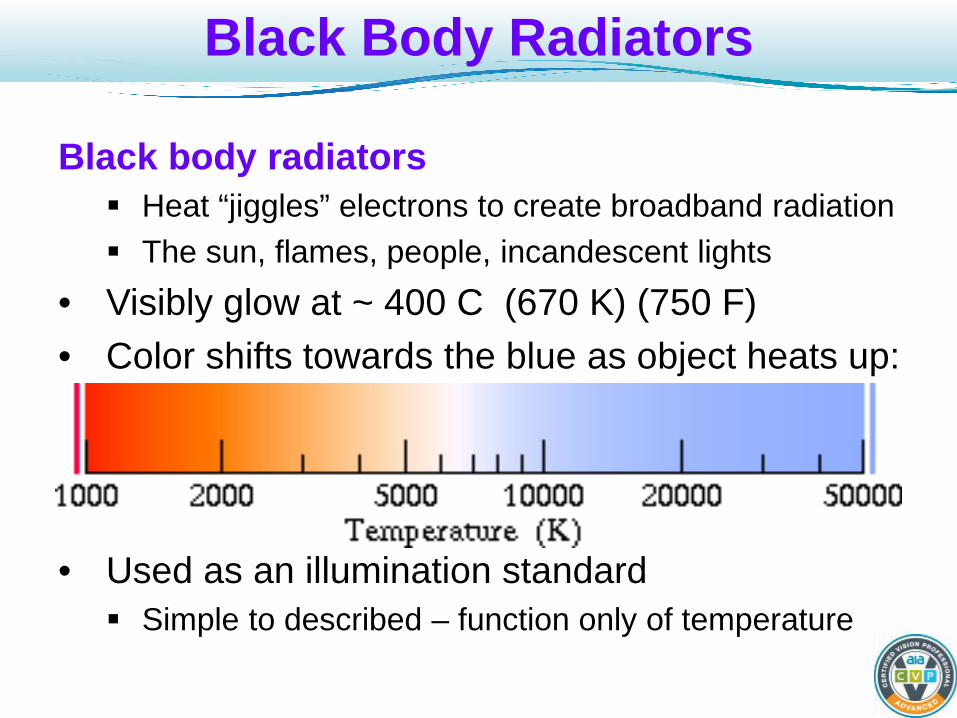
Black Body Radiators
Black body radiators Heat “jiggles” electrons to create broadband radiation The sun, flames, people, incandescent lights
• Visibly glow at ~ 400 C (670 K) (750 F) • Color shifts towards the blue as object heats up:
• Used as an illumination standard Simple to described – function only of temperature

Black Body Radiation
• Spectrum is a function only of temperature, T
10 Microns (Mid-IR) K = Temperature in Kelvin
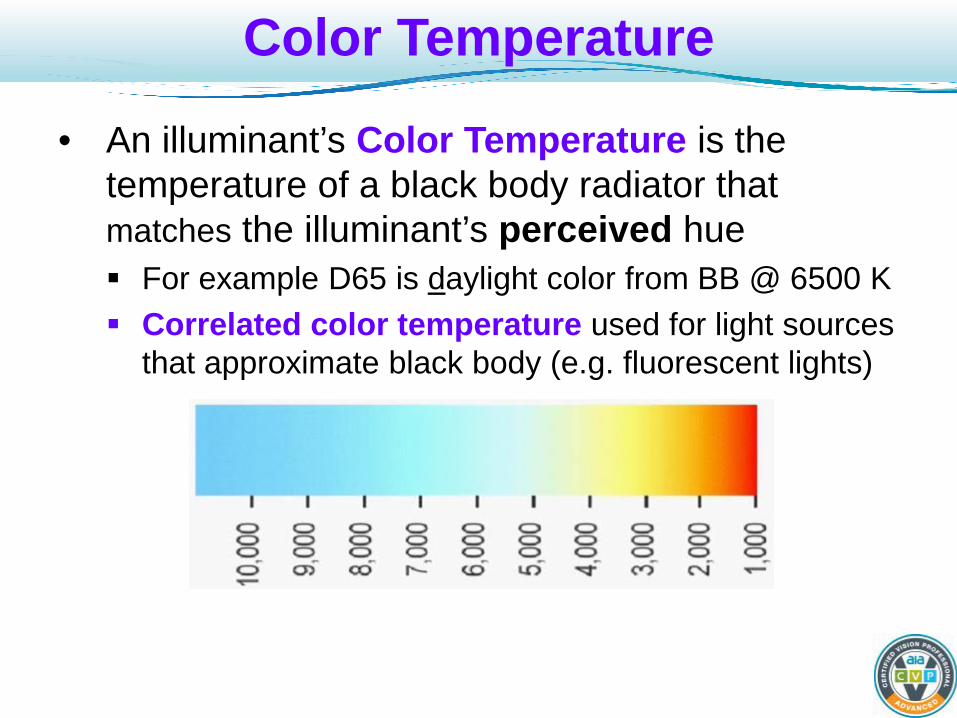
Color Temperature
• An illuminant’s Color Temperature is the temperature of a black body radiator that matches the illuminant’s perceived hue For example D65 is daylight color from BB @ 6500 K Correlated color temperature used for light sources
that approximate black body (e.g. fluorescent lights)

Objects
• Object color arises from the wavelengths (λ) the
object reflects or transmits • Color is also a function of the angles of object
illumination and view (θ,φ) Object color can vary
with temperature (thermochromic). Very small effect for most (cool) materials.
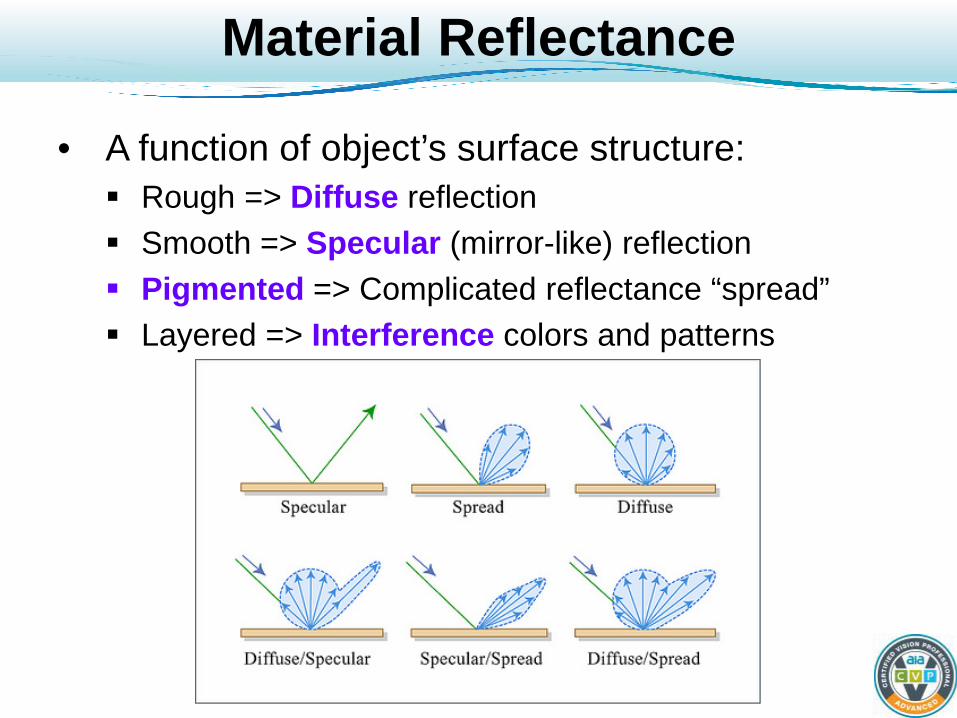
Material Reflectance
• A function of object’s surface structure: Rough => Diffuse reflection Smooth => Specular (mirror-like) reflection Pigmented => Complicated reflectance “spread” Layered => Interference colors and patterns

Diffuse Reflectance
• Machine vision likes Diffuse Reflection Incident light is reflected (nearly uniformly) over a
wide range of angles Rm(λ,θ,φ) (intensity) less dependant on θ,φ So imaging geometry less of an issue
θ φ

Specular Reflection
• MV generally doesn’t like Specular Reflection Angle of incidence = angle of reflection (mirror) Gives “highlights”, “hot-spots”, “gloss”, “shine”
Shows the illuminant color which can be useful if it is consistent (very sensitive to angle)

Pigmented Reflection (Fresnel) • Paint, skin, agricultural products, printed labels • Pigments in a binder absorb and reflect light Could also have interference colors
• Color varies with illumination and view angles, illumination wavelength, and polarization

Interference Colors
• Thin layers of material can generate interference colors (iridescence) Color (wavelength) variation with geometry Coatings, semiconductors, some insects and birds In controlled situations, can use to measure film thickness
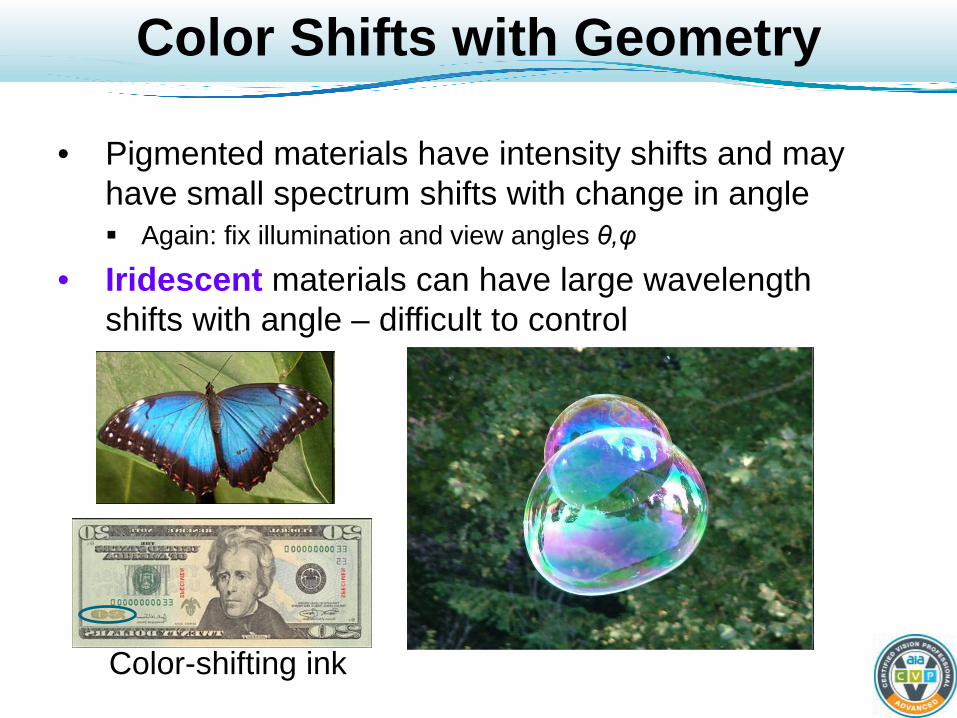
Color Shifts with Geometry
• Pigmented materials have intensity shifts and may have small spectrum shifts with change in angle Again: fix illumination and view angles θ,φ
• Iridescent materials can have large wavelength shifts with angle – difficult to control
Color-shifting ink

Combination of Reflectance Types
• Most materials have a combination of reflectance types
• As examples, plastic and unpolished metal have both diffuse and specular components

Sensor
Si(λ,α)
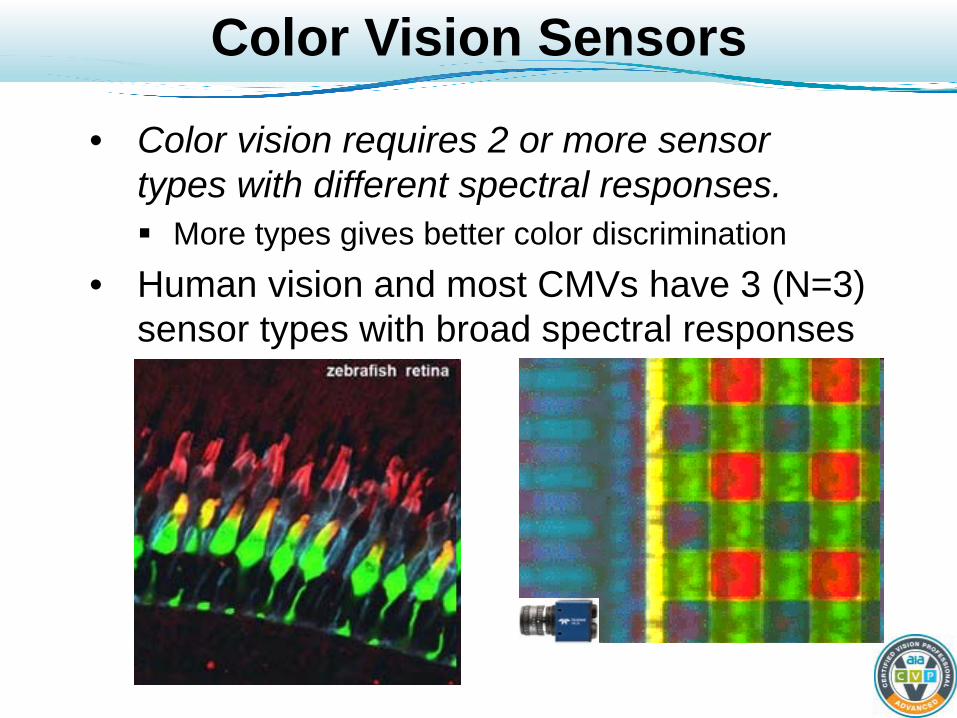
Color Vision Sensors
• Color vision requires 2 or more sensor types with different spectral responses. More types gives better color discrimination
• Human vision and most CMVs have 3 (N=3) sensor types with broad spectral responses
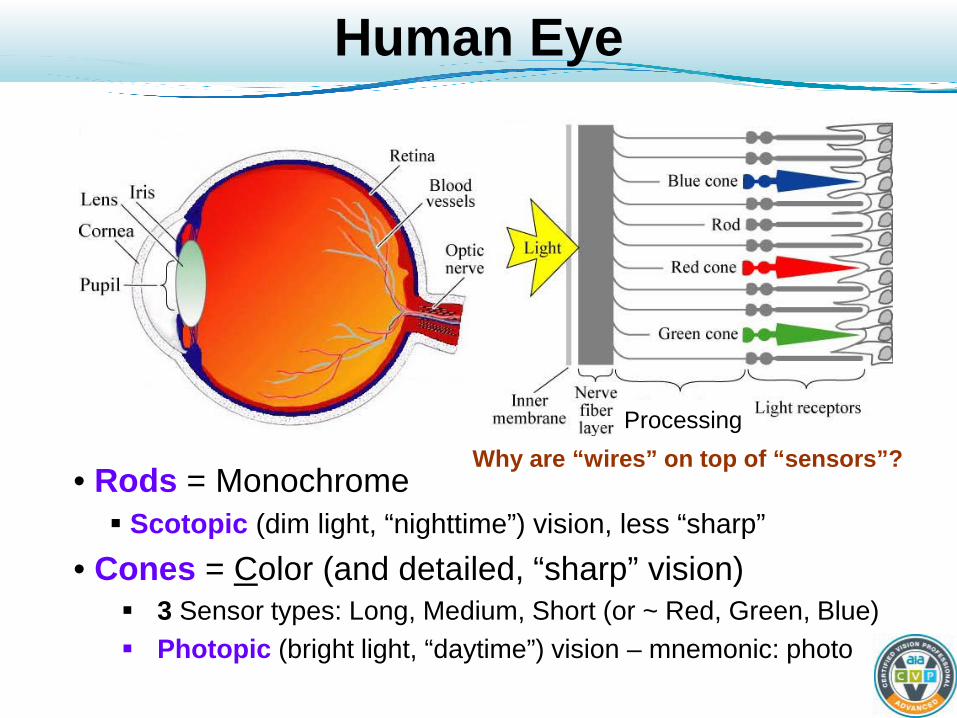
Human Eye
• Rods = Monochrome Scotopic (dim light, “nighttime”) vision, less “sharp”
• Cones = Color (and detailed, “sharp” vision) 3 Sensor types: Long, Medium, Short (or ~ Red, Green, Blue) Photopic (bright light, “daytime”) vision – mnemonic: photo
Why are “wires” on top of “sensors”? Processing

Cone Distribution
Random distribution, ~hexagonal packing Individual differences, blue cones are special

Camera Color Sensors
• Color sensors use a monochrome sensor overlaid with (typically) 3 types of color filters Bayer pattern of color filters most common
a.Microlenses b.Color filter mosaic c. Sensor pixels d.Packaging (IC)
- Fill Factor - Acceptance angle

Camera Sensors’ Responses
“Bump” in IR causes
problems!
Limit of human vision
Teledyne DALSA Spyder™ 3

Color imaging physics- summary
• Image data depends on Spectral reflectance of object Lighting geometry Camera view Integrated over a band
• Metamerism
Simplifying assumptions to relate observed image color to object reflectance
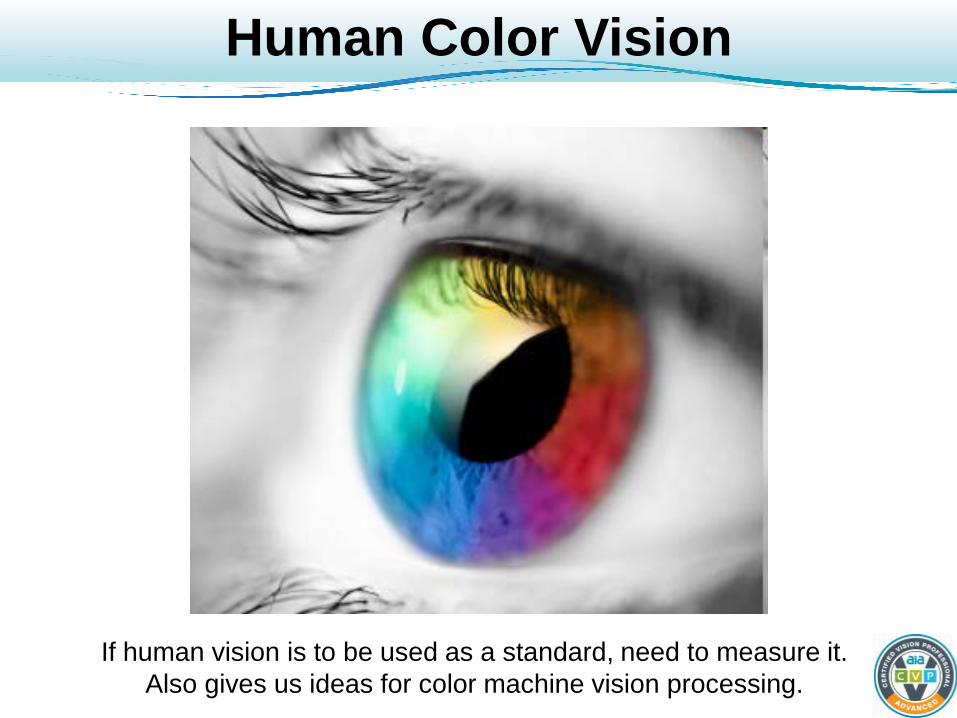
Human Color Vision
If human vision is to be used as a standard, need to measure it. Also gives us ideas for color machine vision processing.

Perceptual Color Terms
• Hue = “pure” color • Saturation or Chroma = colorfulness relative
to the brightness of a similarly illuminated white
• Brightness or Luma = intensity of light • Unfortunately, these are not consistently used In particular, Chroma can mean Hue + Saturation
• My use of the term color should be clear from the context…

Retinal and Cortical Processing
• Recovery of (factoring out) the illumination is done, in part, at the retina Color aftereffects suggest retinal adaptation
• Not always, as we will see
• Color influenced by surroundings (color contrast) suggests retinal and cortical processing

Dependence on Field of View
• Human color vision response depends on the size and position of the field of view (FOV) used Measured in degrees of visual angle (arc) 2 and 10 degrees of arc are common FOV sizes
Held at arm’s length: fingernail = ~1 degree thumbnail = ~1.5 degrees thumb width = ~2 degrees (retinal size of most detailed vision)

CIE Color Matching Functions
• Constructed from many observers’ matches Think of them as the spectral sensitivity curves of 3
linear light sensor types, yielding XYZ values provided as numerical tables
Given a light with S(λ) power (radiometric) distribution, these equations give the XYZ coordinates for that light. Note: 2 degree (1931) and 10 degree (1964) versions
)(),(),( λλλ zyx
Y is, effectively, LUMA ~= green response
Inner products of matching functions and S(λ)

Color Space
• A color space represents (maps) possible colors vision system can detect Possible colors (gamut) might not fill the space
• Axes are color space’s primaries, e.g. R,G,B • Can be a non-linear space, e.g. cylindrical • Term also used for graphic display of colors
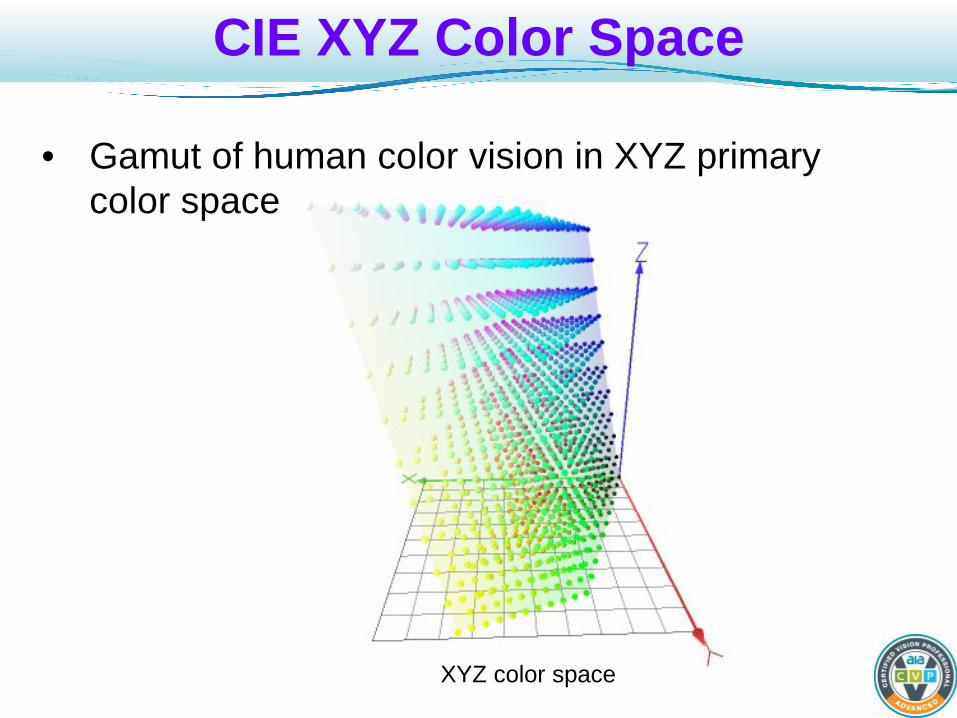
CIE XYZ Color Space
• Gamut of human color vision in XYZ primary color space
XYZ color space

CIE xyY Color Space
• Divide X,Y by (X+Y+Z) to get xyY Chromaticity (x,y) and luma (Y)
• Separates color (chromaticity) and luma

CIE Chromaticity Diagram
• 2D representation of just (x,y) color space • A convenient way to show device gamut
CIE = Commission Internationale de l'Éclairage
What wavelength is magenta? Brown?
Color background is “theoretical” because display gamut is limited
Spectral colors around “horseshoe” edge Strictly convex

Gamut
• Gamut – range of colors that a device (light, camera, human etc.) can generate or detect
• Often plotted in CIE Chromaticity space.
What happens to gamut as the color image is processed through a “chain” of devices? e.g. camera, printer, eye
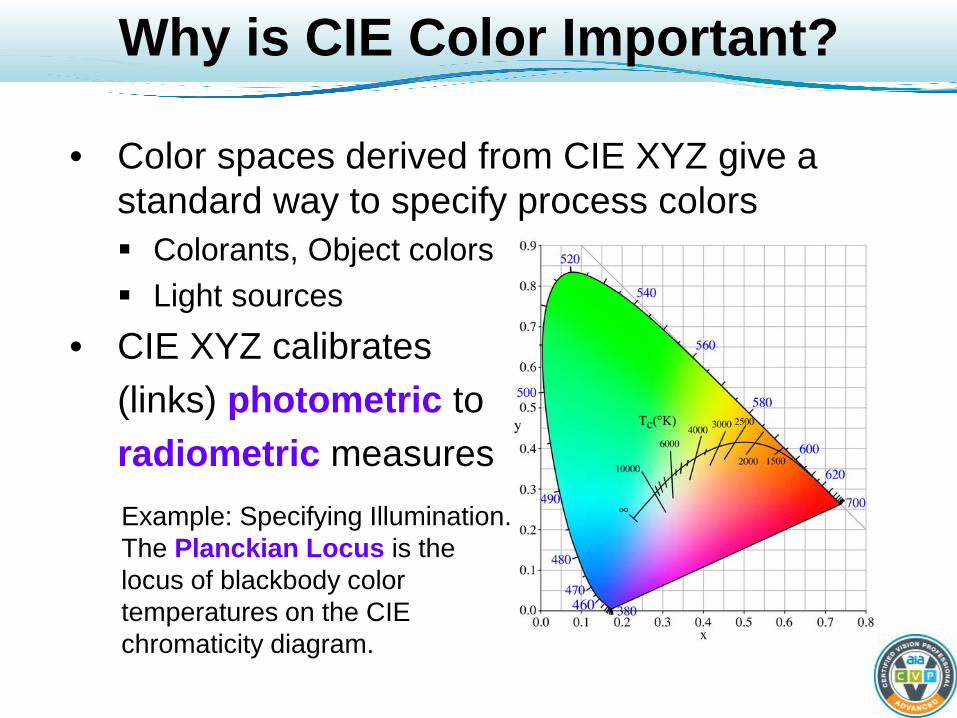
Why is CIE Color Important?
• Color spaces derived from CIE XYZ give a standard way to specify process colors Colorants, Object colors Light sources
• CIE XYZ calibrates (links) photometric to radiometric measures
Example: Specifying Illumination. The Planckian Locus is the locus of blackbody color temperatures on the CIE chromaticity diagram.

Example: CIE L*a*b*
• An color opponent and perceptually uniform color space derived from CIE XYZ Common way to specify process color L* = Lightness; a*,b* = color components
Xr ,Yr , Zr are reference white values used
−
=
−
=
−
=
3/13/1
3/13/1
3/1
200*
500*
16116*
rr
rr
r
ZZ
YYb
YY
XXa
YYL
Simplified!
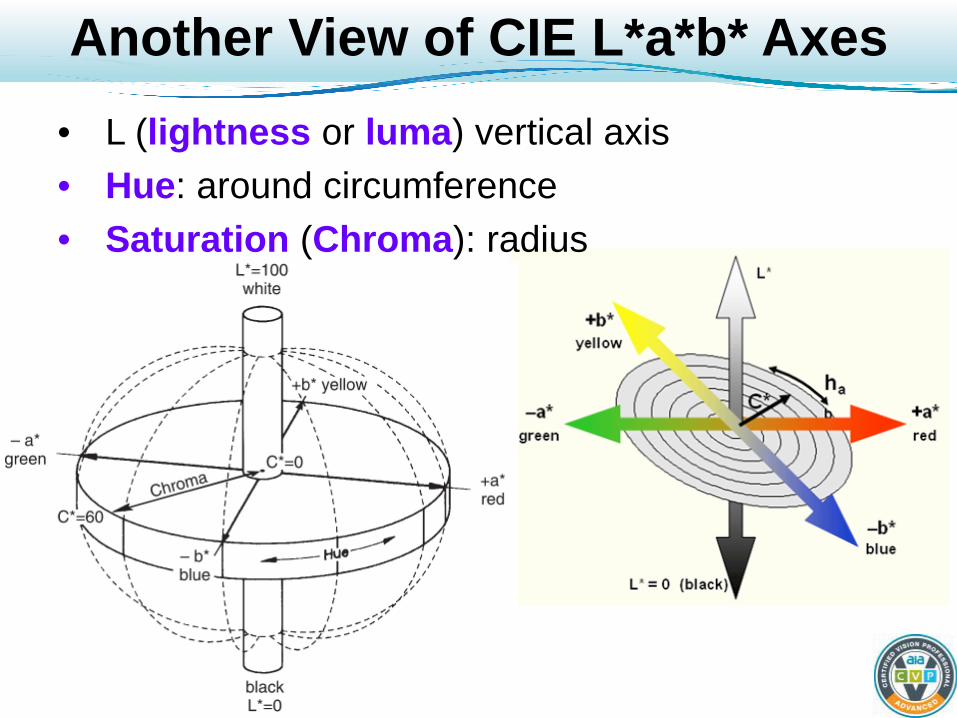
Another View of CIE L*a*b* Axes • L (lightness or luma) vertical axis • Hue: around circumference • Saturation (Chroma): radius
Calibrating MV to CIE
• Difficult! Variations in illumination, geometry, optical and
camera response over image area and time. Camera’s spectral response is different than CIE’s
• Try using a tristimulus colorimeter to calibrate RGB limits around colors of interest
• Some tips: Use an IR block filter (discussed later)! Limit the field of view (FOV) to center of image! Control your lighting and geometry! Periodically recalibrate!
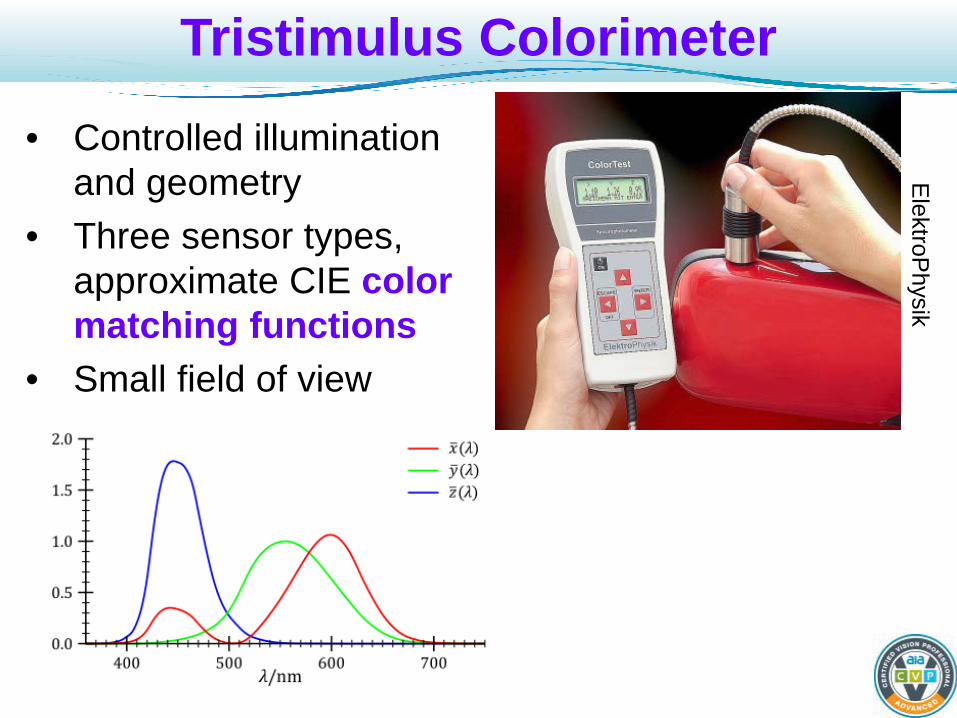
Tristimulus Colorimeter
• Controlled illumination and geometry
• Three sensor types, approximate CIE color matching functions
• Small field of view
ElektroP
hysik

Inspecting Baked Goods
• Cooked in continuous process • Check 3D shape and color(s)
www.montrose-tech.com

English Muffin “Toast Mark”
• Check toast mark color, specified in L*a*b* • Difficult with an RGB color MV camera Why do we care about a toast mark anyway?

Muffin Inspection Details
• RGB camera, white LED illumination Controlled using a white reference patch
• RGB limits set by CIE L*a*b* specifications • Not full calibration Periodic recalibration of RGB limits using tristimulus
photometer RGB limits might not = L*a*b* limits, but close enough
• Browns are difficult colors to measure Low brightness and desaturated red-orange
• Toast mark is to meet consumer expectations!
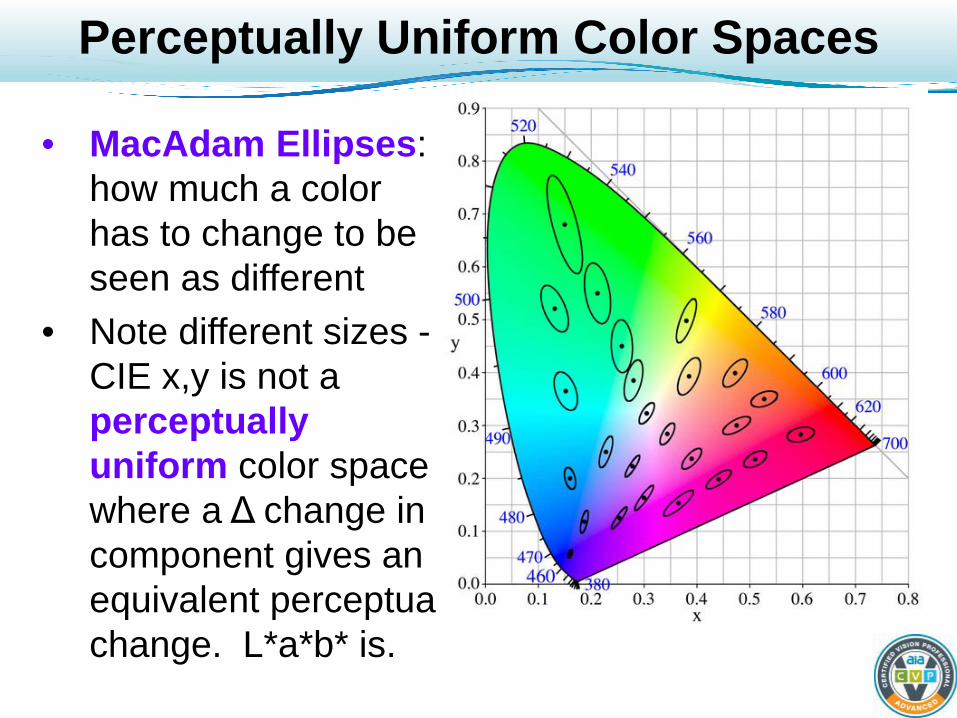
Perceptually Uniform Color Spaces
• MacAdam Ellipses: how much a color has to change to be seen as different
• Note different sizes -CIE x,y is not a perceptually uniform color space where a Δ change in component gives an equivalent perceptual change. L*a*b* is.

Making xy Perceptually Uniform
• Transformations make CIE chromaticity more perceptually uniform CIE 1960 u,v – a linear transform CIE 1976 u’,v’ – a similar linear transform
• But non-linear representations can do better

Non-Linear, Perceptually Uniform
HSV (Hue, Saturation, Value) V = Intensity Similar: HSI, I = Intensity Similar: HSL, L = Intensity Large number of variations!
Non-linear spaces claim to have better perceptual uniformity L*a*b* is one we’ve discussed… Here is another:
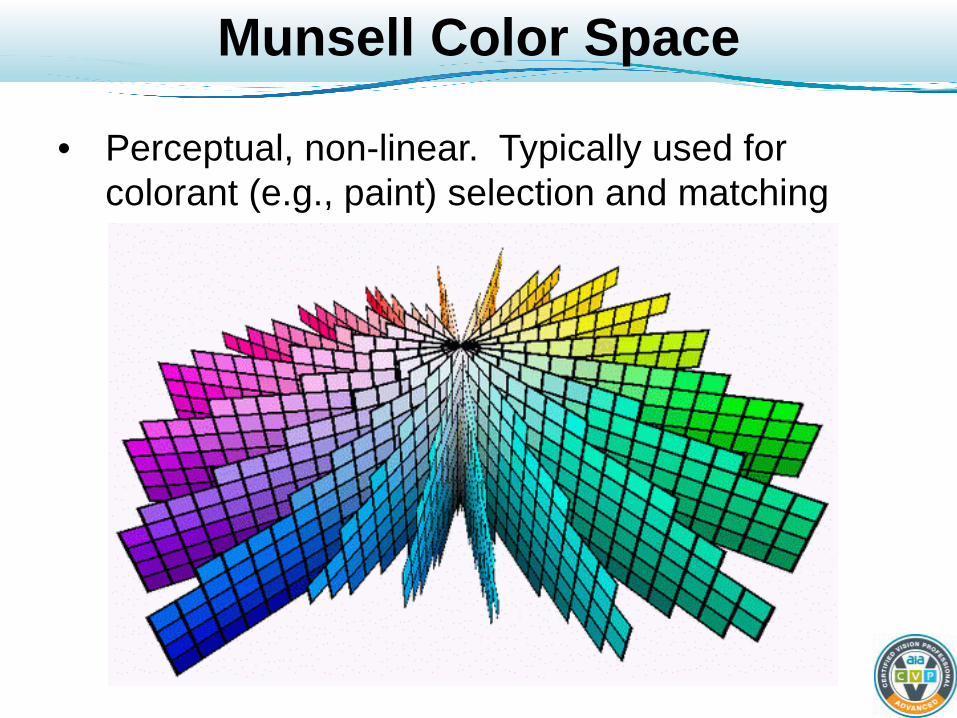
Munsell Color Space
• Perceptual, non-linear. Typically used for colorant (e.g., paint) selection and matching

Converting from MV’s RGB
• Cameras output R,G,B values from sensors with poorly specified spectral responses
• Can transform camera RGB to any color space Limited by RGB’s gamut and range of digital values Costs: computation time and added noise Many transforms; based on gamma, lighting, display
• Transformation does not mean calibration
Color Machine Vision Systems

Color Machine Vision Pitfalls
• Can I use my digital camera? No.
• Every image has proprietary “color balance” applied- NOT raw pixel data
• Not on market next year- no two cameras of the same model may be alike
• Unknown pixel interpolation, smoothing and edge enhancement
• Can I use room light? No.
• No control on color, flicker, uniformity, etc. • Not same at other deployment locations
• Is ambient light going to affect my image? Yes.
Color Measurement Tools
• Tristimulus Colorimeter already described Calibrated to CIE, controlled light & geometry Measures color at a single point on object Paints, pigments, etc.
• Spectrometer – detailed color spectrum Recover object’s reflection or transmission spectrum Moisture, cure, chemicals, remote sensing etc.
• Color sensors and vision systems Measure color at point or area Can be approximately calibrated to human vision Have to control lighting and imaging geometry

Spectrometer and Hyperspectral Hyperspectral:
False Color Single spot
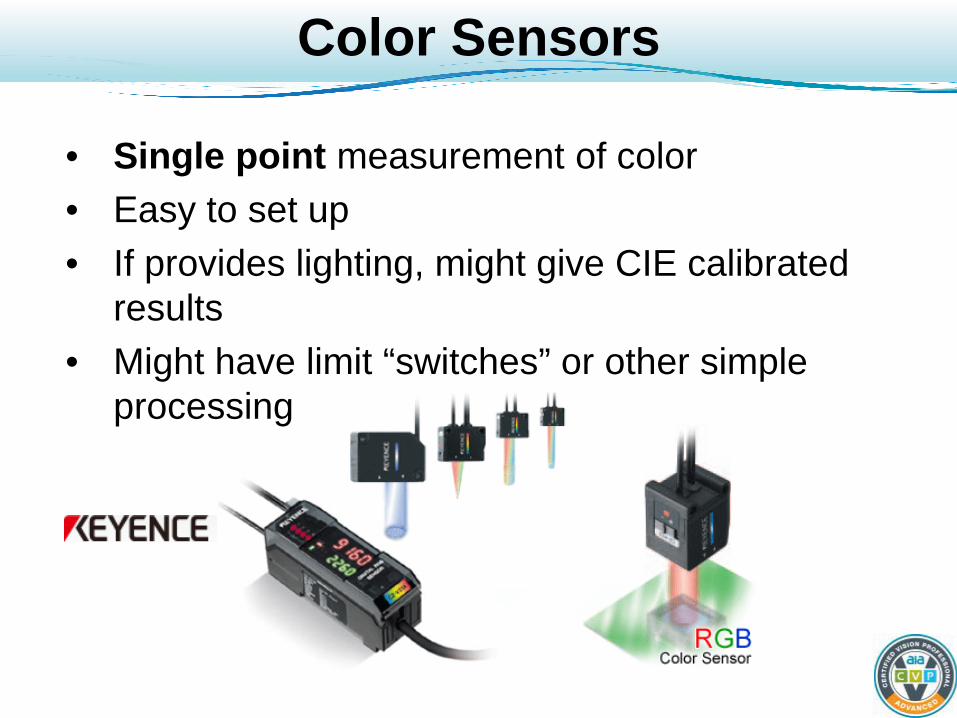
Color Sensors
• Single point measurement of color • Easy to set up • If provides lighting, might give CIE calibrated
results • Might have limit “switches” or other simple
processing
Color Machine Vision Systems
• Color camera measures color over an area Usually not CIE calibrated measures
• “Smarts” built in or in an attached processor Can have very sophisticated decision making
• Some CMVS components: Part presentation, environmental control Lighting, filters, lenses Processors, algorithms (might include hardware) Software, developer interface, user interface Reporting, factory integration (not covered here)

CMVS Example: Gelcap Inspection
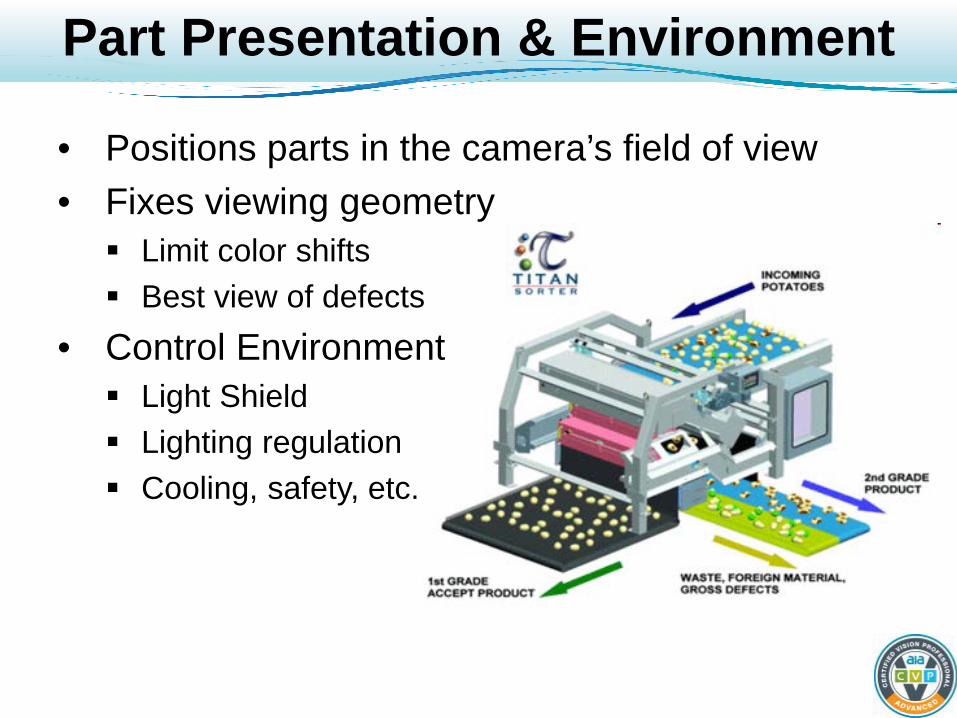
Part Presentation & Environment
• Positions parts in the camera’s field of view • Fixes viewing geometry Limit color shifts Best view of defects
• Control Environment Light Shield Lighting regulation Cooling, safety, etc.
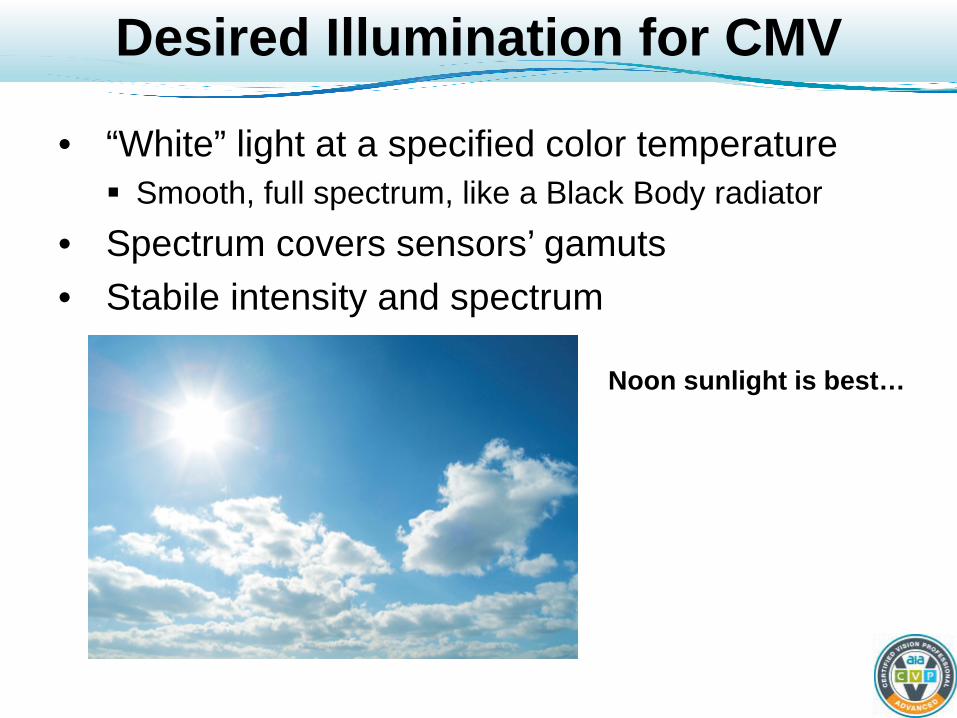
Desired Illumination for CMV
• “White” light at a specified color temperature Smooth, full spectrum, like a Black Body radiator
• Spectrum covers sensors’ gamuts • Stabile intensity and spectrum
Noon sunlight is best…
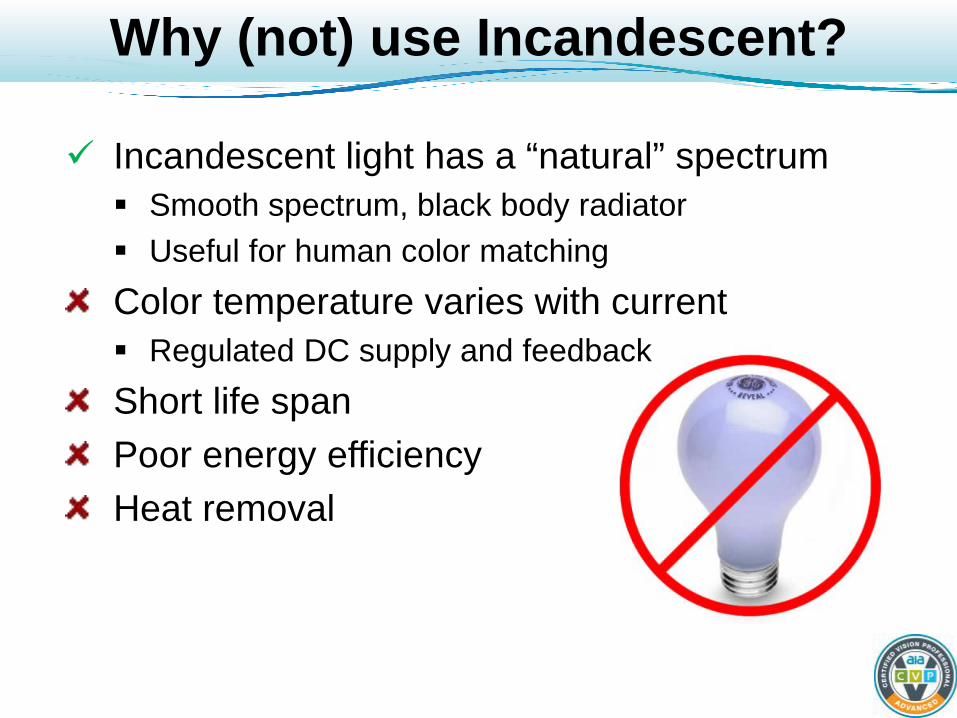
Why (not) use Incandescent?
Incandescent light has a “natural” spectrum Smooth spectrum, black body radiator Useful for human color matching Color temperature varies with current Regulated DC supply and feedback Short life span Poor energy efficiency Heat removal

Fluorescent Lights
• Spectrum is OK for many CMV tasks Not Black Body but characterized by correlated
color temperature – again, perceptual color match Spectrum depends on phosphors used Spectrum shifts over time (UV phosphor damage?)
Use high frequency drive to avoid beating against camera’s shutter. Still a problem if using fast line-scan cameras.
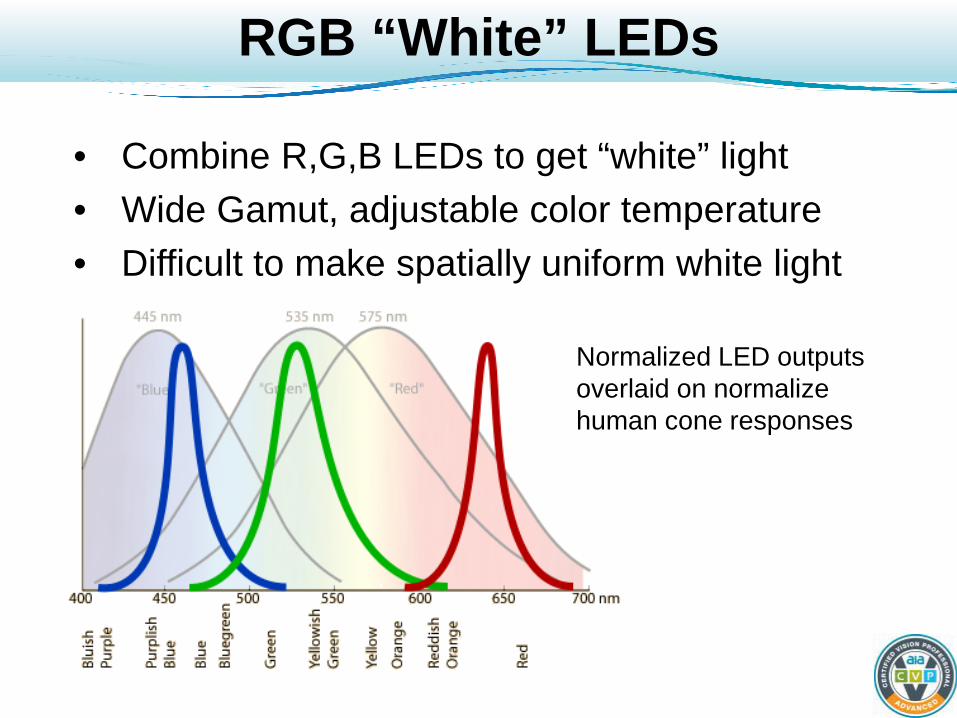
RGB “White” LEDs
• Combine R,G,B LEDs to get “white” light • Wide Gamut, adjustable color temperature • Difficult to make spatially uniform white light
Normalized LED outputs overlaid on normalize human cone responses

White Phosphor LEDs
• LED emits at ~ 440 nm, phosphor “down converts” some light to longer wavelengths
• Peaks in blue and yellow; dip in blue-green
Higher color temperature than sun; very different spectrum. Spectrum is OK for many CMV tasks.
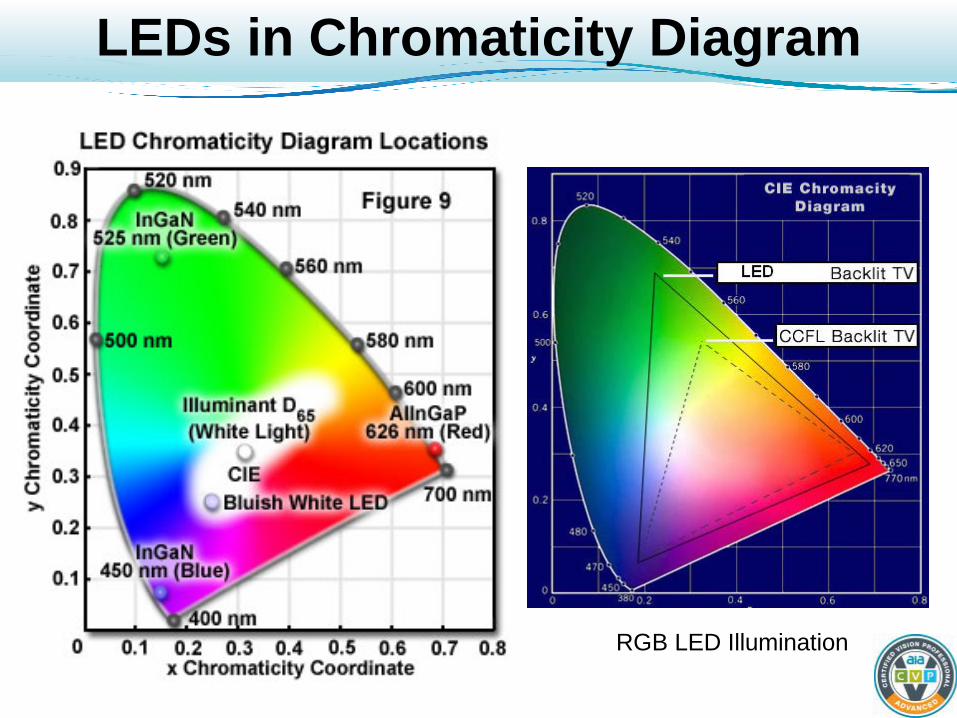
LEDs in Chromaticity Diagram
RGB LED Illumination

Why (not) LEDs?
Long life, low power Good gamut on RGB, acceptable on white
R,G,B colors shift with current, temp. and time White LED color changes with time (phosphors) White LED has limited gamut Life span decreased by heat White: ~10K hours (~1 year), R,G,B: ~50K hours Strobe lights to increase flux and lifetime
Use RGB LEDs for high gamut color tasks, white LEDs for just about everything else

LED Color Changes with Current

Some White LED Lights
Advanced illumination www.advill.com

Filters
• Limit spectrum as a function of wavelength
Midwest Optical Systems www.midopt.com

Why Filter a Color Image!?
• White balance – change illumination spectrum • Remove or allow IR, UV, or selected color
range. Silicon sensors respond out to 900+ nm Remember “IR Bump” on camera response? Makes camera white or color balance impossible!
• Color filters and monochrome camera(s) Higher spatial, spectral resolution

Monochrome “Color Imaging”
Color Image Monochrome Monochrome Camera with Green Filter
A single filter makes an inexpensive, limited “color” detector
What if part light intensity or part reflectance changes?
Midwest Optical Systems www.midopt.com
All metamers!
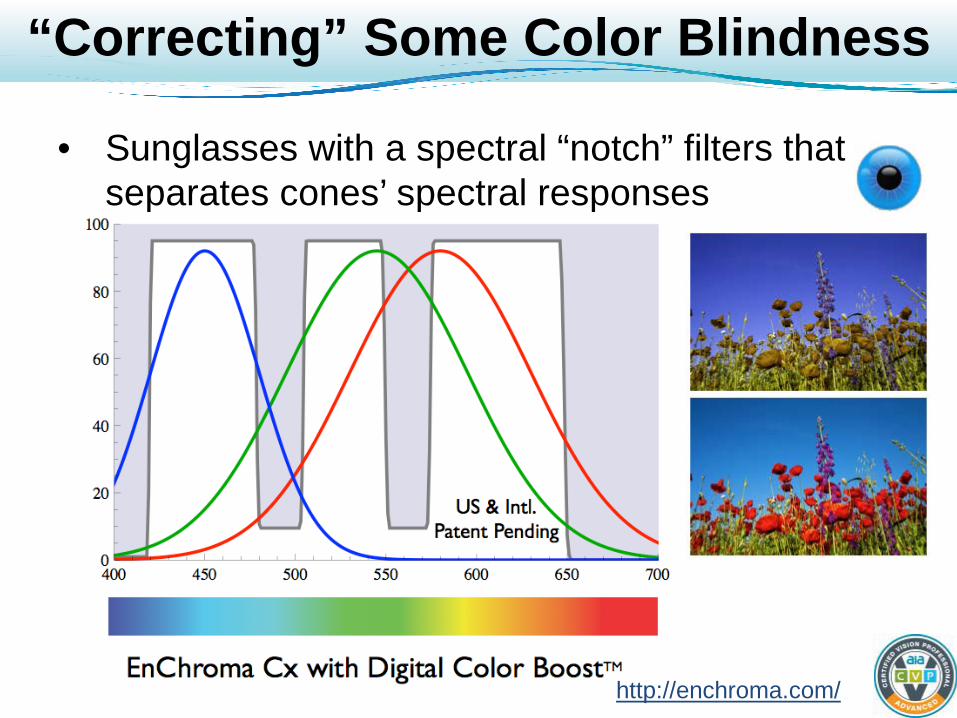
“Correcting” Some Color Blindness
• Sunglasses with a spectral “notch” filters that separates cones’ spectral responses
http://enchroma.com/
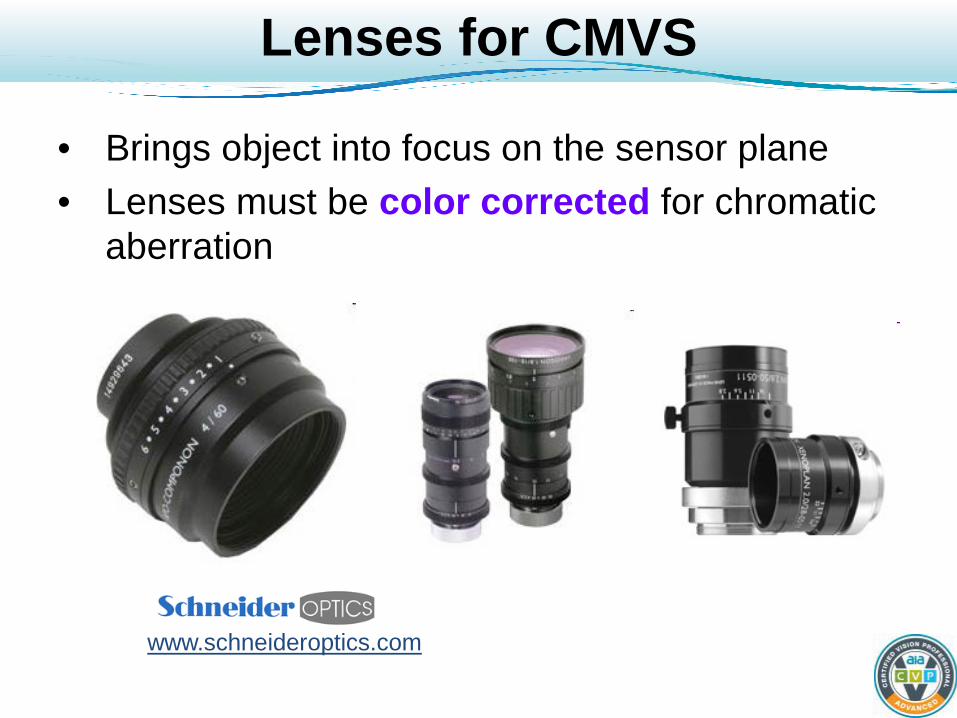
Lenses for CMVS
• Brings object into focus on the sensor plane • Lenses must be color corrected for chromatic
aberration
www.schneideroptics.com

Lens Chromatic Aberration
• Chromatic Aberration: Focus point shifts with wavelength Most MV lenses are well color corrected for visible
light, so usually not a problem • Near IR and UV light are “fuzzy” and attenuated Block IR by filter; UV usually blocked by lens glass
Eye has limited blue cones and has a yellow filter in central fovea
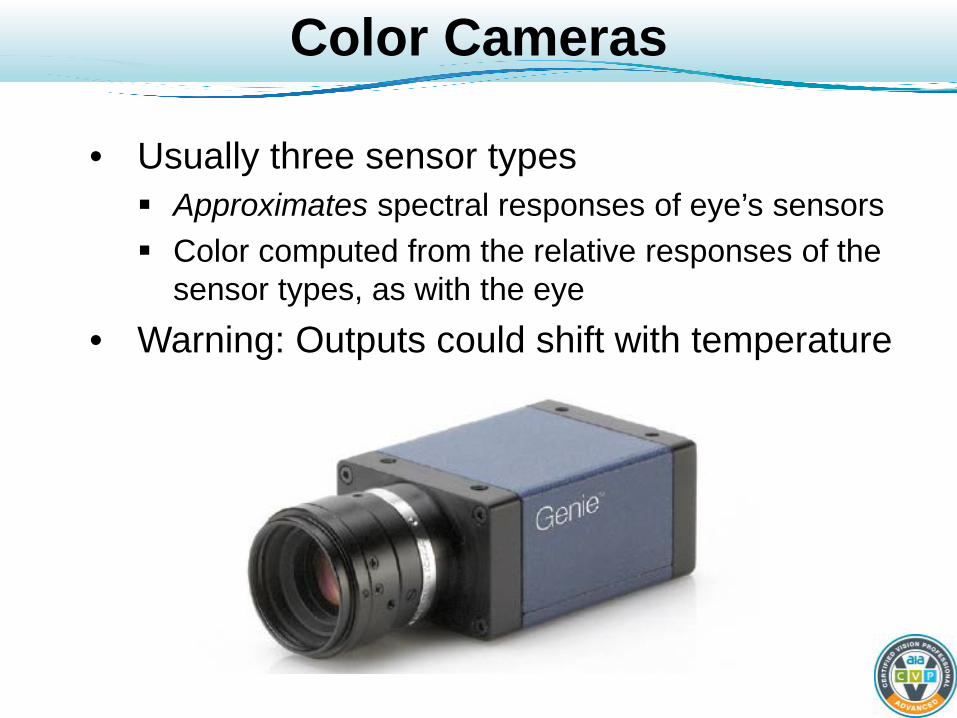
Color Cameras
• Usually three sensor types Approximates spectral responses of eye’s sensors Color computed from the relative responses of the
sensor types, as with the eye • Warning: Outputs could shift with temperature
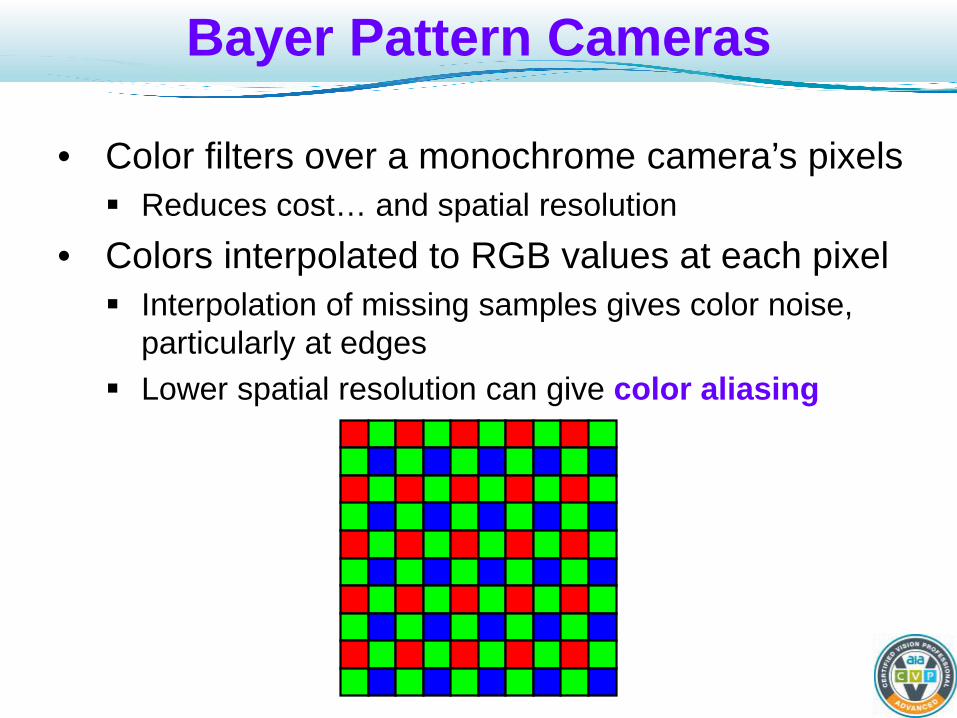
Bayer Pattern Cameras
• Color filters over a monochrome camera’s pixels Reduces cost… and spatial resolution
• Colors interpolated to RGB values at each pixel Interpolation of missing samples gives color noise,
particularly at edges Lower spatial resolution can give color aliasing

Bayer Pattern “Removal”
• Interpolate colors to get “full” RGB color image But really at ½ resolution
• Done in the camera or in CPU Many algorithms available, none can be perfect…

Bayer Pattern Color Noise
• Interpolating color generates color “noise”, especially noticeable across intensity edges
An innocent-looking section of conveyer belt
Zoomed in shows color artifacts from Bayer pattern

Spatial Frequency Response
• Imaging systems can be characterized by their spatial frequency response Higher spatial frequencies correspond to more details
or more “sharpness” in the image
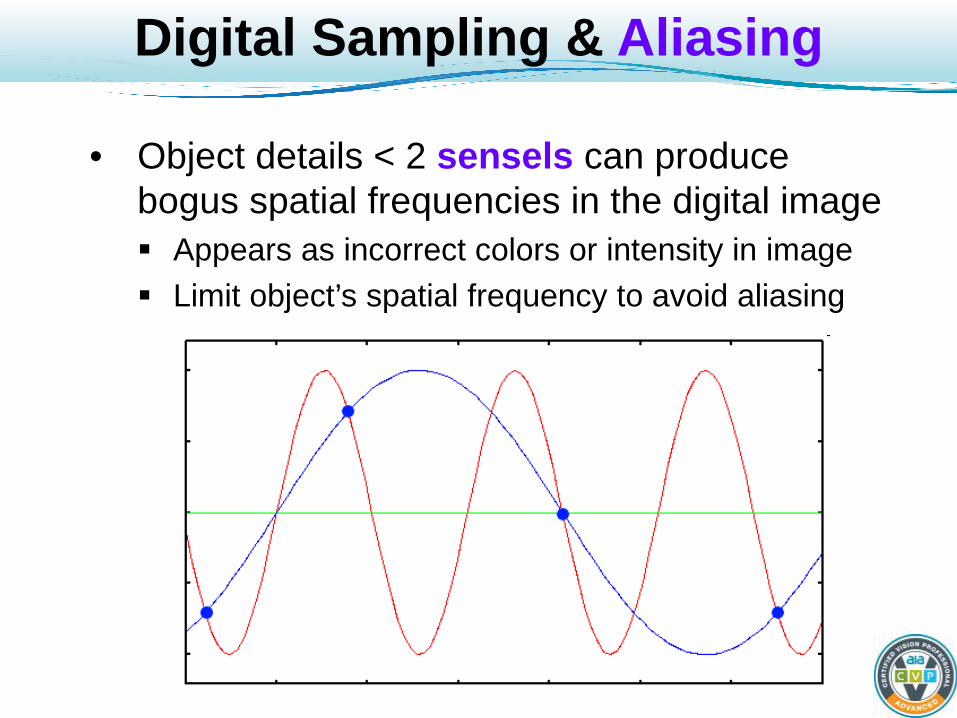
Digital Sampling & Aliasing
• Object details < 2 sensels can produce bogus spatial frequencies in the digital image Appears as incorrect colors or intensity in image Limit object’s spatial frequency to avoid aliasing

Color Aliasing
• Bayer filter pattern cameras can exhibit aliasing Beat or color moiré patterns on high spatial frequencies
• Some cameras include an optical low-pass filter Spreads light rays into a 2x2 pixel square

Color vs. Resolution
• Bayer pattern cameras trade spatial resolution (details) for spectral resolution
• In human vision, color “fills in” edges defined by intensity so lower color resolution looks OK But not to a machine vision system!
• Bayer pattern makes it difficult to use edges for dimensioning objects Reduced resolution Color artifacts when computing edge position More likely to get color aliasing

3 CCD Cameras (1)
• A 3-sensor (CCD) camera has no spatial sub-sampling and so reduces the chance of aliasing
www.jai.com/en
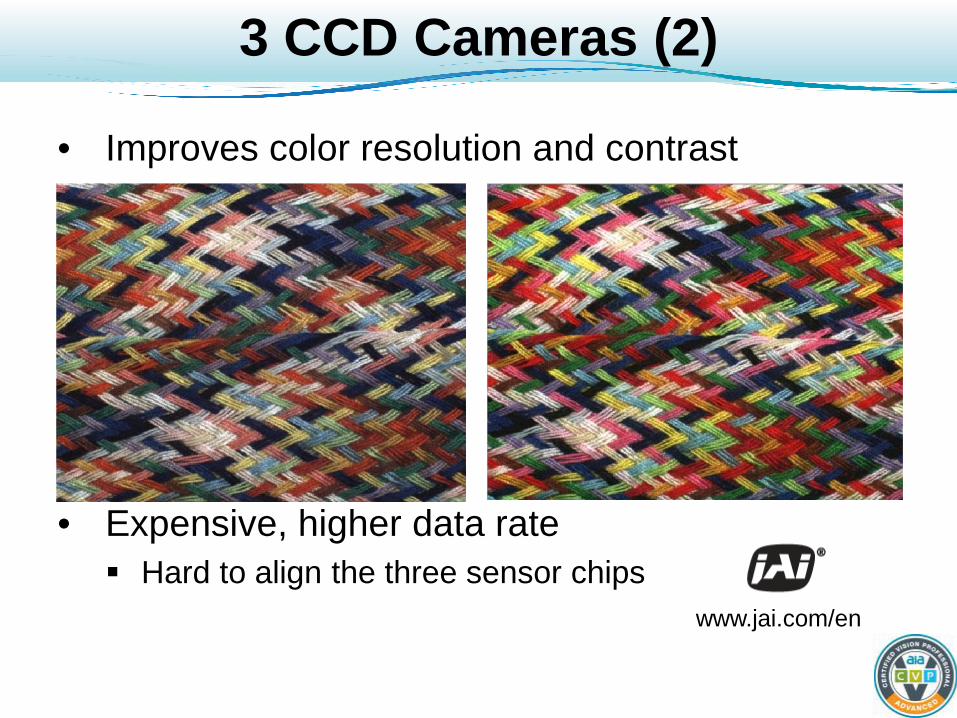
3 CCD Cameras (2)
• Improves color resolution and contrast
• Expensive, higher data rate Hard to align the three sensor chips
www.jai.com/en
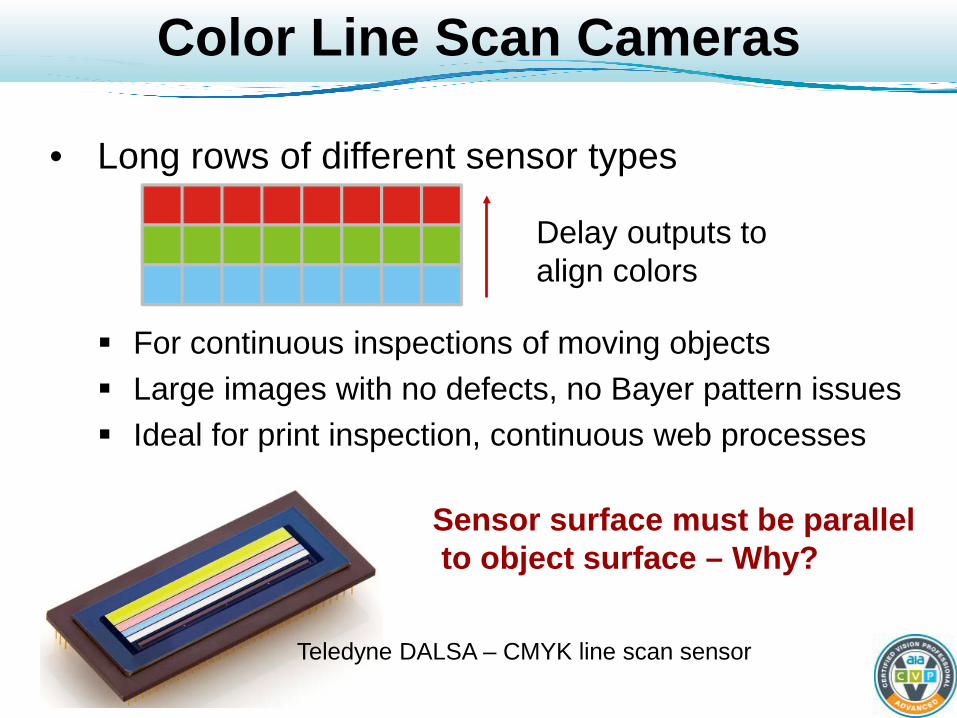
Color Line Scan Cameras
• Long rows of different sensor types
For continuous inspections of moving objects Large images with no defects, no Bayer pattern issues Ideal for print inspection, continuous web processes
Delay outputs to align colors
Sensor surface must be parallel to object surface – Why?
Teledyne DALSA – CMYK line scan sensor

Living with the Bayer
• It’s low cost • Use a better camera if you need edge or detail
measures (e.g. print defect detection) Higher resolution, line-scan, or 3-sensor
• Customized interpolation software • Measure areas and averages, not details
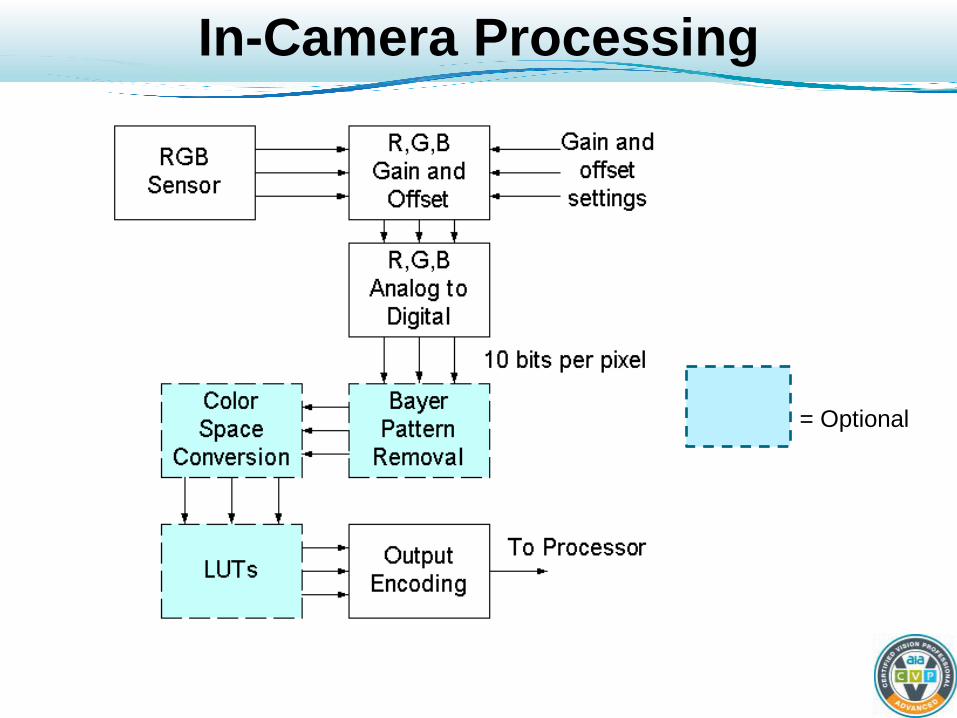
In-Camera Processing
= Optional

Gain and Offset, A to D
• Changes gain and offset for each channel Out = gain * input + offset Done in analog to preserve maximum working range Adjust for maximum output gamut
• Used to approximately white balance or color balance the image (discussed later)
• Analog to digital conversion of 10 bits gives you “headroom” for Bayer pattern removal, etc. Each digital multiply introduce ~0.5 bit of error Digital dynamic range is limited
0000
6
10
567
...
0
10
10
12345
0
78910
...
IN OUT
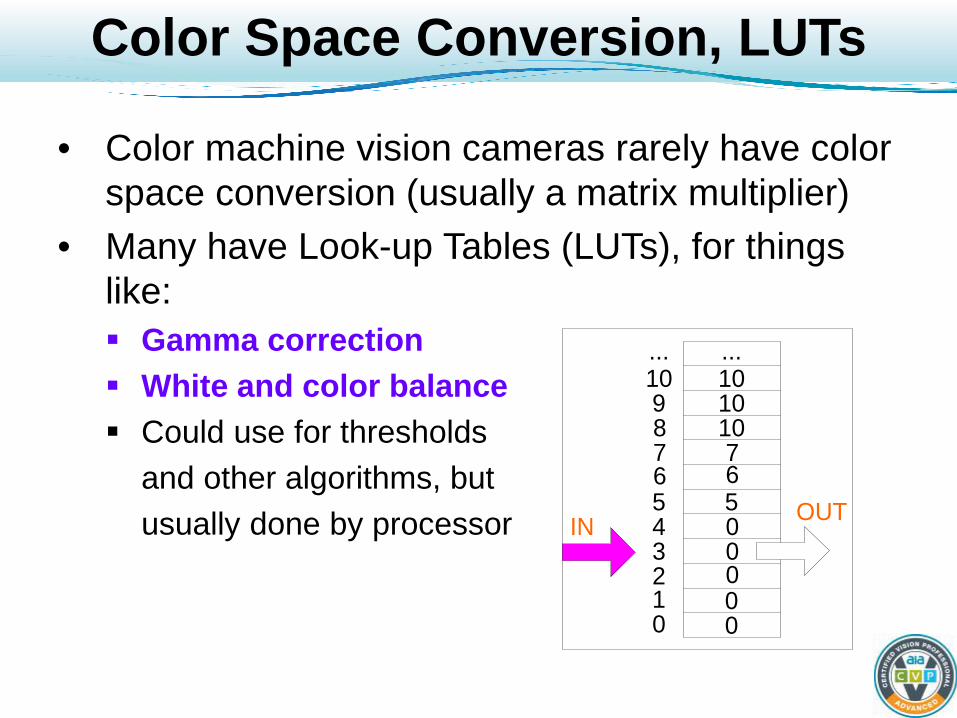
Color Space Conversion, LUTs
• Color machine vision cameras rarely have color space conversion (usually a matrix multiplier)
• Many have Look-up Tables (LUTs), for things like: Gamma correction White and color balance Could use for thresholds and other algorithms, but usually done by processor

The Curse of Gamma
• Old TV cameras compressed intensity • Uncompressed by CRT “triode” response LCD displays fake a CRT response with LUTs
• Digital cameras can mimic old TV cameras • Messes up MV – turn it off in most cases Will make the displayed image “dark”
Gamma off Gamma on
Color MV Processors
• Smart cameras Low cost, good performance, easy to set up
• PC Based Higher performance, familiar work environment
• Attached processor (boards) For high-speed applications such as web inspection FPGAs, large LUTs, parallel processors, etc.
• High-speed, custom processors CT, MRI, remote sensing Huge data rates

Basic Color MV Algorithms
• Algorithms are implemented by Software

Camera Setup
• Three terms, often confused: • White Balance (or gray or neutral balance) Removes color cast so whites appear white Compensate for illumination’s color temperature
• Color Balance As above, but applied to correcting range of colors
Used for human viewing (usually with gamma on) • Color Calibration Adjusts camera’s outputs to get values expected from
known colors. Standard (e.g. CIE) or Comparative (to object colors)
• These are my terms and not generally in use!
Lighting Setup

White Balance
• To R=G=B Use exposure and then gain
• No gamma • On camera or application

White Balance Example

Color Balance for Human Viewing
• CMV presents images for human viewing High-speed printing, remote sensing
• We use a color chart and adjust gain, offset and gamma of R,G,B channels so display closely matches the chart’s colors

Comparative Calibration
• Compare measured colors with color values of known good parts Avoids standardized calibration Good enough for many MV tasks
• Example: Color on can label Customers won’t buy if “faded” color Compare production colors to colors measured on a know good can Reject cans that are outside limits Fix the ink supply!

All need to Recover the Illuminant
• To White Balance, Color Balance or Calibrate color we need to know or recover the illuminant Use color temperature, if known Use a white reference patch in the field of view, to
reflect illumination spectrum • Preferred method in machine vision • Adapts to lighting changes
Computational methods for color constancy try to “factor out” the illuminant
X-Rite

White Balance Methods
• Assume maximums of R,G,B are the color of the illuminant Limited camera range usually clips Can be confused by unstable highlights
• Assume gray average world color (gray world) Average of R,G,B image values: Ra, Ga, Ba Assume any differences between these averages are
due to illumination color (e.g. “world” should average to gray, Ra=Ga=Ba, if lighting is white)
Scale image values so averages are equal, thus removing effects of illumination color
When (and why) will this fail?
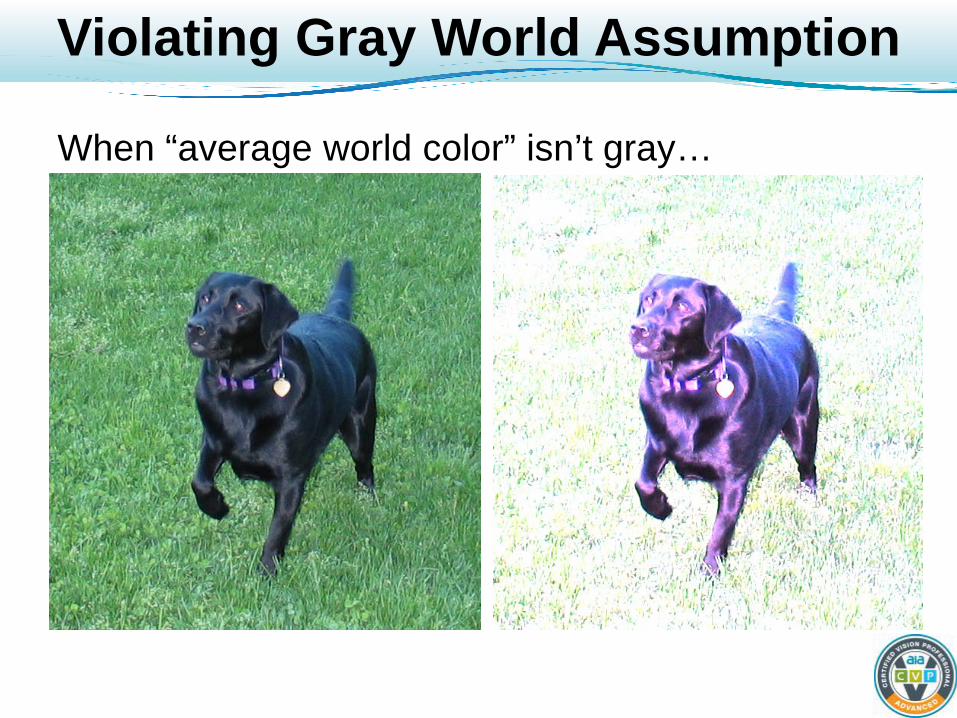
Violating Gray World Assumption
When “average world color” isn’t gray…
Color Balance Methods
• Includes white balance • Seek function(s) to minimize the difference
between camera output and color standards Usually automated and provided by vendor
• Some minimization functions: Adjust gain and offset and gamma (in camera) Matrix multiplication (3x3 or 4x4)
• Rotates and scales input color space
Piecewise linear look-up table (LUT) Full R x G x B lookup
• Does a good job but hard to set 16 million values
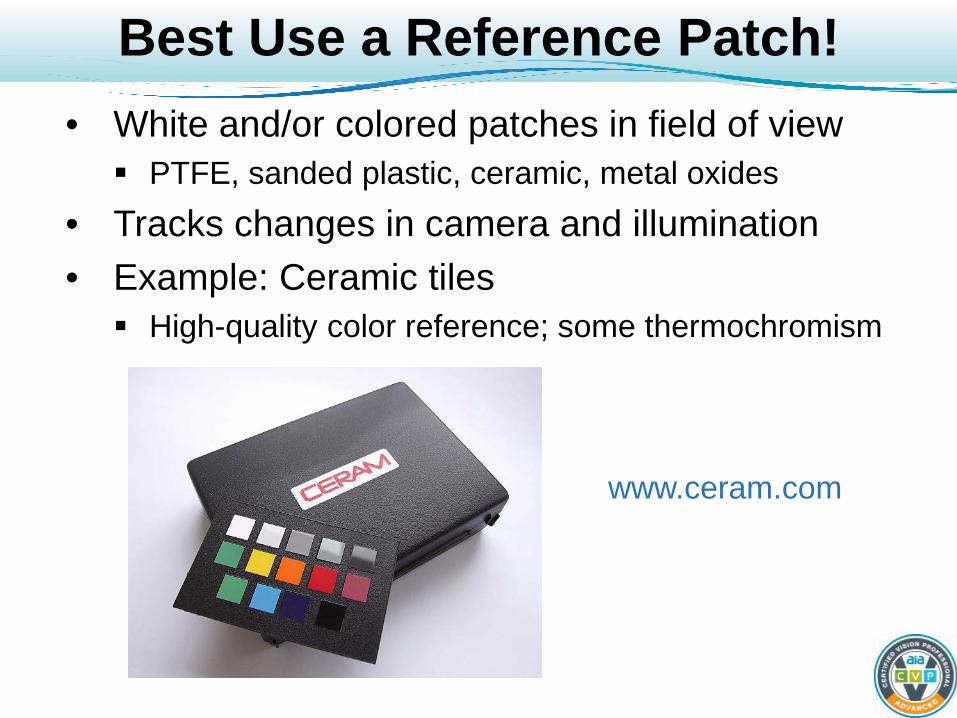
Best Use a Reference Patch! • White and/or colored patches in field of view PTFE, sanded plastic, ceramic, metal oxides
• Tracks changes in camera and illumination • Example: Ceramic tiles High-quality color reference; some thermochromism
www.ceram.com
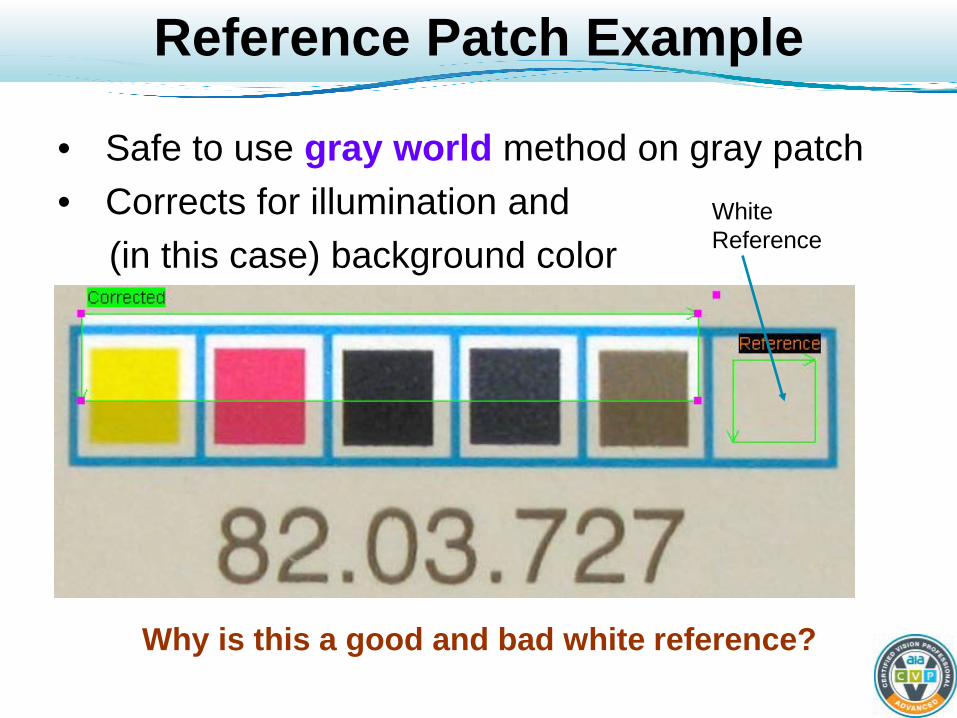
Reference Patch Example
• Safe to use gray world method on gray patch • Corrects for illumination and (in this case) background color
White Reference
Why is this a good and bad white reference?

Color Space Conversions
• Sometimes want a color space other than RGB Three common types: • Linear, 3 color RGB, CIE XYZ etc.
• Luma + 2 color components Linear: YCrCb, YUV, etc. Non-Linear: CIE xyY
• Non-linear, perceptually uniform L*a*b, HIS, HSL, HSV, Munsell, etc.

Linear, 3 Color
• RGB space is most commonly used in CMV No loss of data from R,G,B sensor outputs Easy to process and display; familiar

Non-Linear, Perceptually Uniform
• Attempt to match “metrics” of human vision • Natural spaces for color matching & adjustment? • HSI, HSL, HSV : Hue, Saturation, and {Intensity, Lightness, Value} Many variations!
With
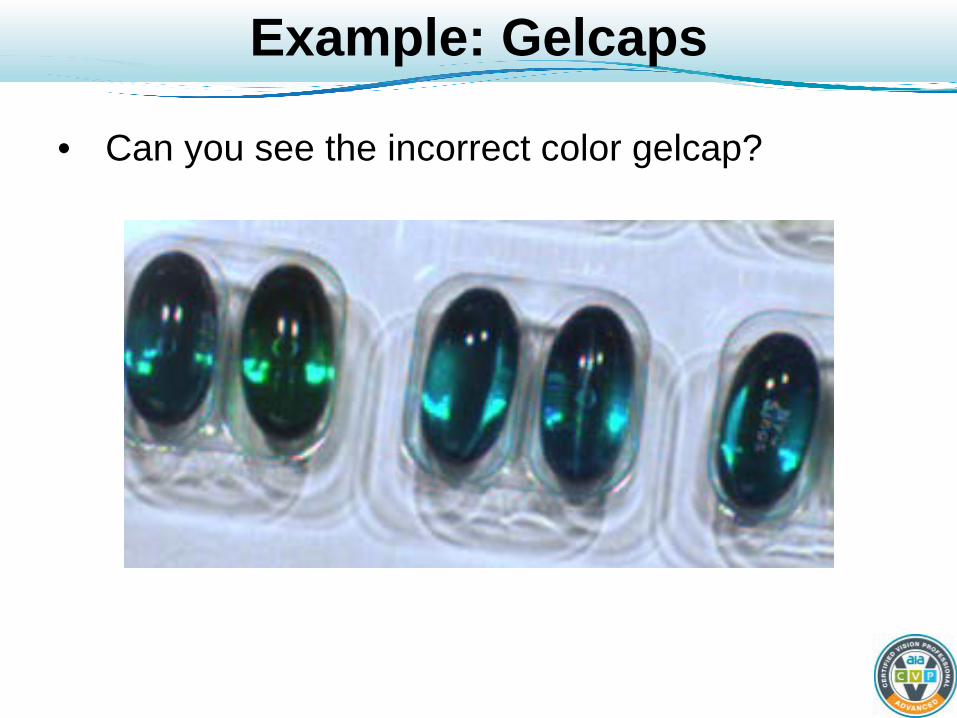
Example: Gelcaps
• Can you see the incorrect color gelcap?
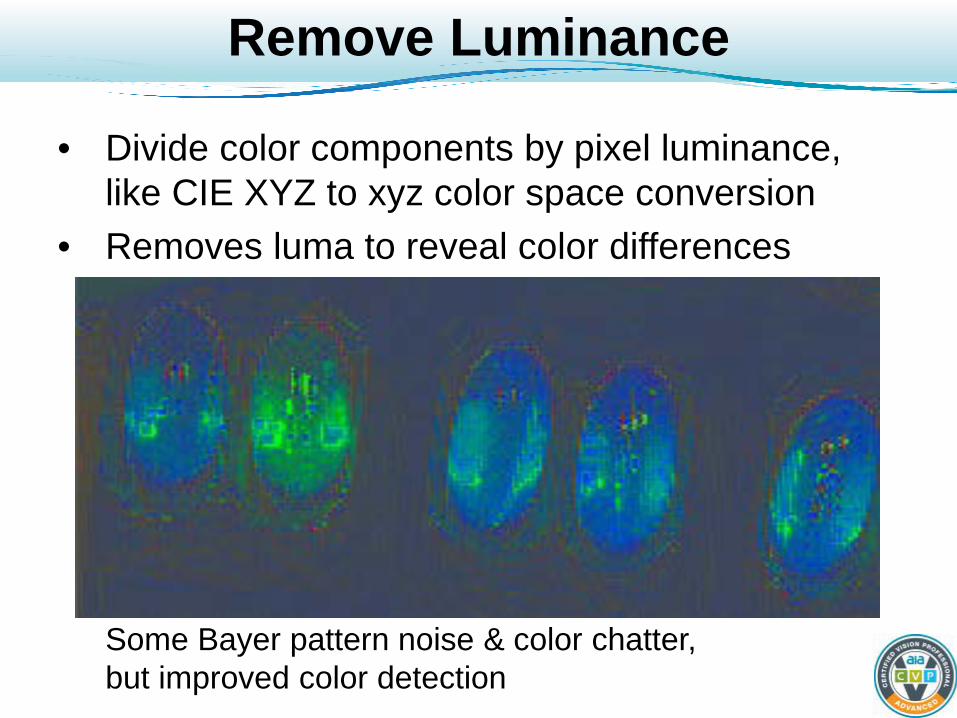
Remove Luminance
• Divide color components by pixel luminance, like CIE XYZ to xyz color space conversion
• Removes luma to reveal color differences
Some Bayer pattern noise & color chatter, but improved color detection

Tips (2)
• Comparative calibration OK for many MV tasks • White balance: Use reference patch in FOV Used to remove lighting and camera variations
• Color (and white) balance Generally done “off line” and for human viewing Unless done in camera analog doesn’t improve data
• Use RGB space when possible Color space conversion adds noise and time
• Separate luma + 2 color components Reduces effects of luma change Can introduce color chatter at low luma
Algorithms - Summary
• Camera and Lighting setup Uniformity and repeatability
• White Balance Application specific
• Color Calibration Within image Relative Absolute
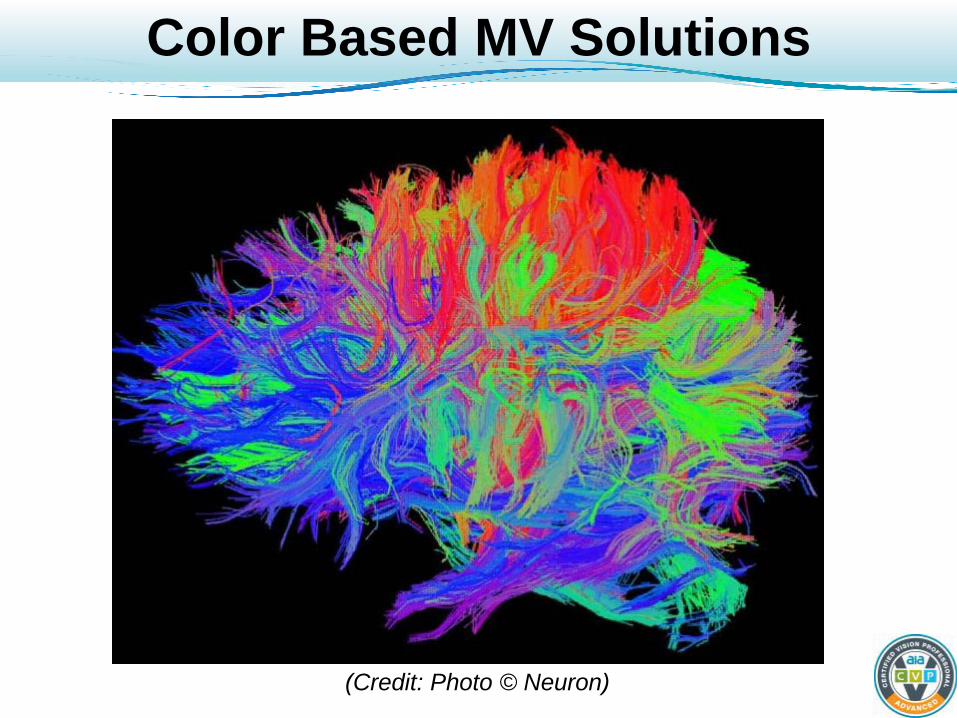
Color Based MV Solutions
(Credit: Photo © Neuron)
Color Statistics
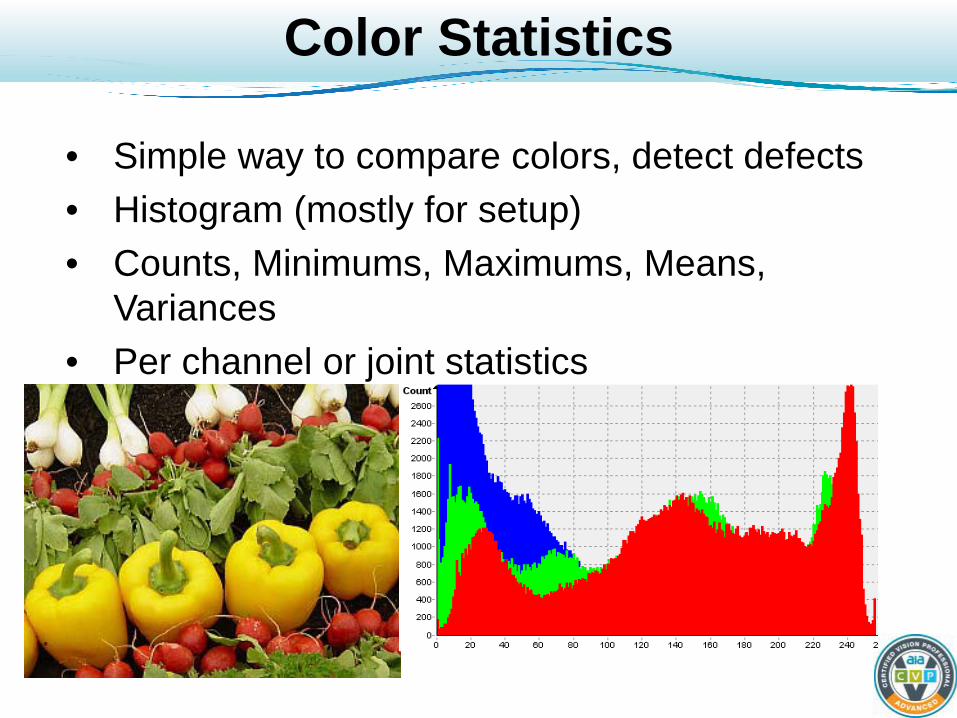
• Simple way to compare colors, detect defects • Histogram (mostly for setup) • Counts, Minimums, Maximums, Means,
Variances • Per channel or joint statistics
Color Spot Meter
• Color statistics over an area of image Computed on a per-component (RGB) basis Measures means, maximums, and variances
• Used for: Checking color range (go / no-go) Correct part present, based on color Matching colors (not very accurate) Checking part orientation by color “swatch” location
• Good When: Parts have uniform color areas at known positions Large color differences between parts’ colors
Example: Mouthwash
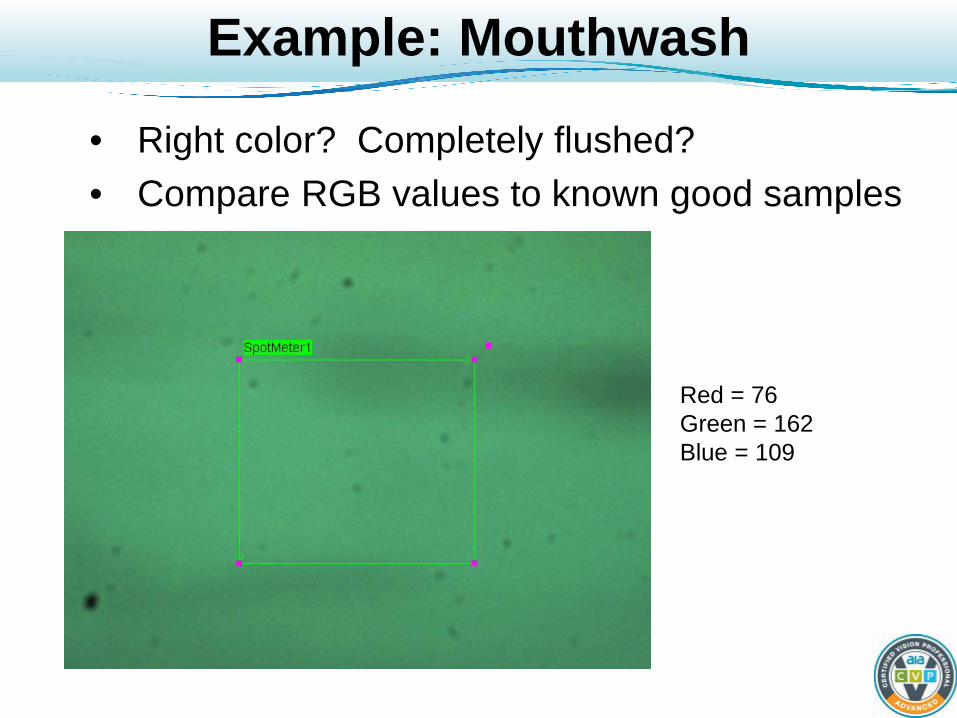
• Right color? Completely flushed? • Compare RGB values to known good samples
Red = 76 Green = 162 Blue = 109

More Mouthwash
• Set limits to distinguish green vs. magenta
Red = 180 Green = 96 Blue = 129
What are those dark spots?

Part Location by Color
• Counting chicken breasts • Threshold CAF works OK because only red
channel drives classification

Color Classification- Training
• Pick examples of each part color you want to train • Show the classifier each set of examples and give
each set a class name (e.g., “red”, “good”, etc.) • How many examples to use? Too many => “over train” so poor generalization Too few => some wanted colors might not be classified
• Have an “out class” for colors that haven’t been trained (usually provided by algorithm)
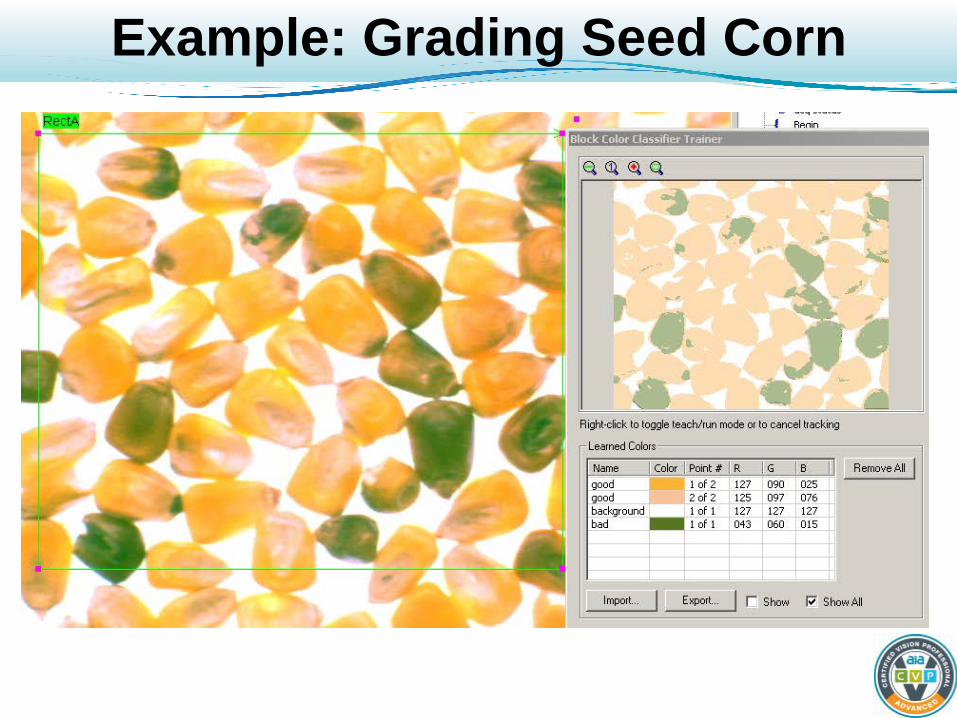
Example: Grading Seed Corn
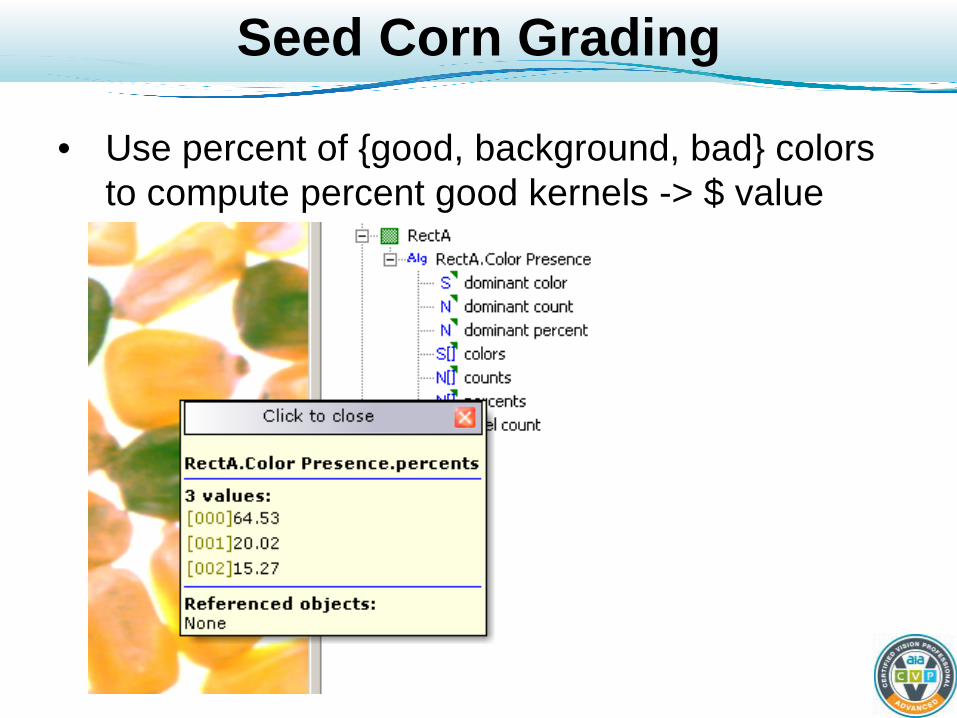
Seed Corn Grading
• Use percent of {good, background, bad} colors to compute percent good kernels -> $ value

Assembly Verification
• Are the wire colors correct? Is the housing present? Is the ferrite bead in place?
What about using this as a white reference?

Counting Bows
• Count bows as they fly by (6’ a second) • All colors, various sizes, right-side or upside down • Variable position, can be touching or piled up • Got any ideas how?
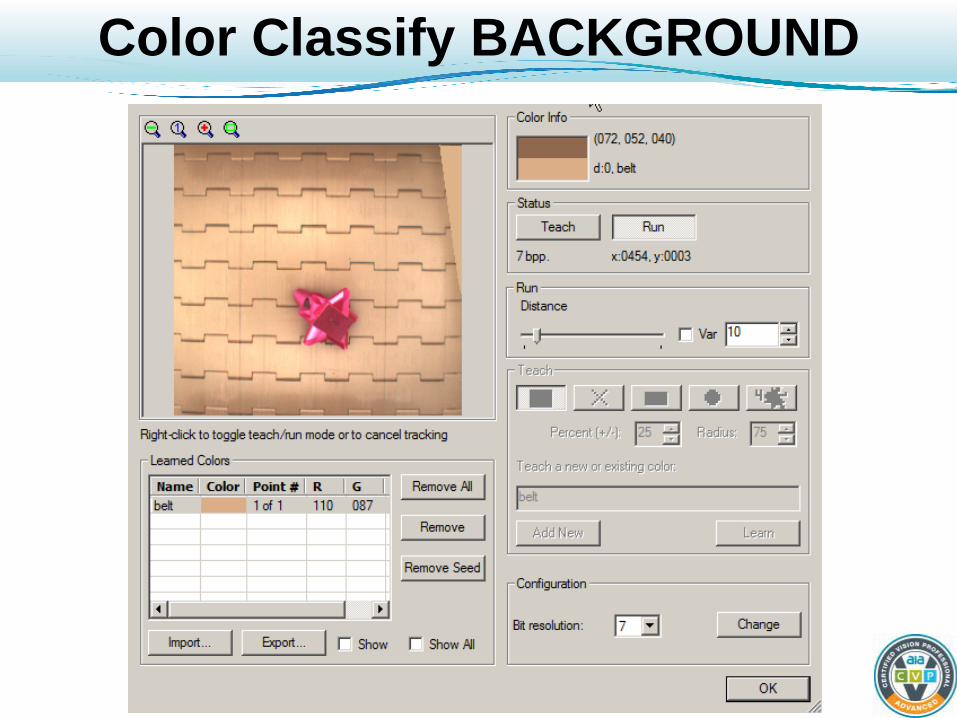
Color Classify BACKGROUND
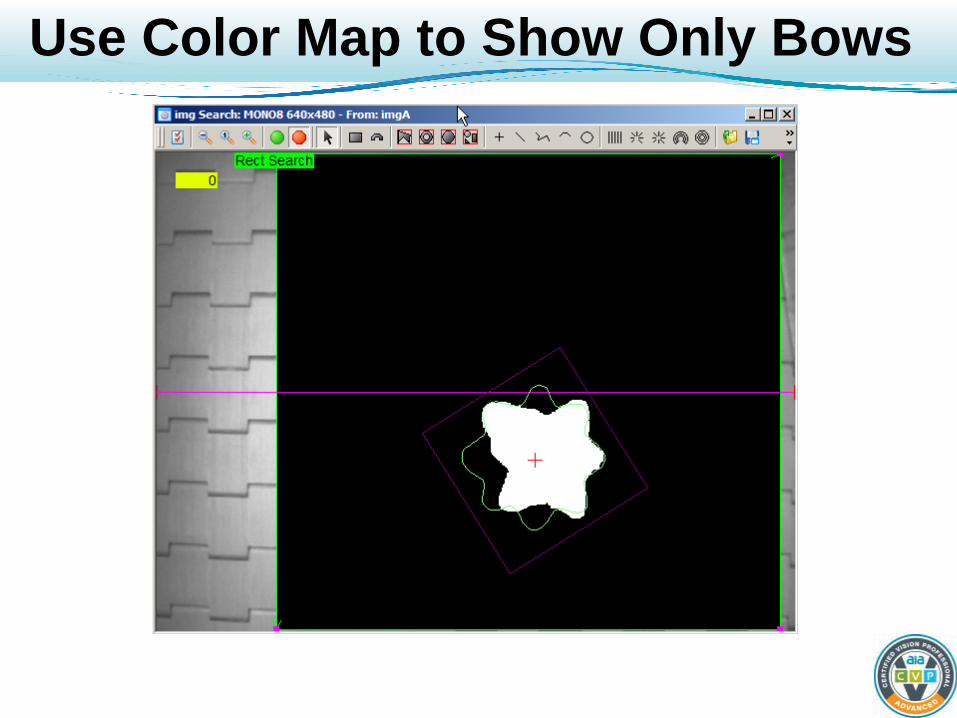
Use Color Map to Show Only Bows
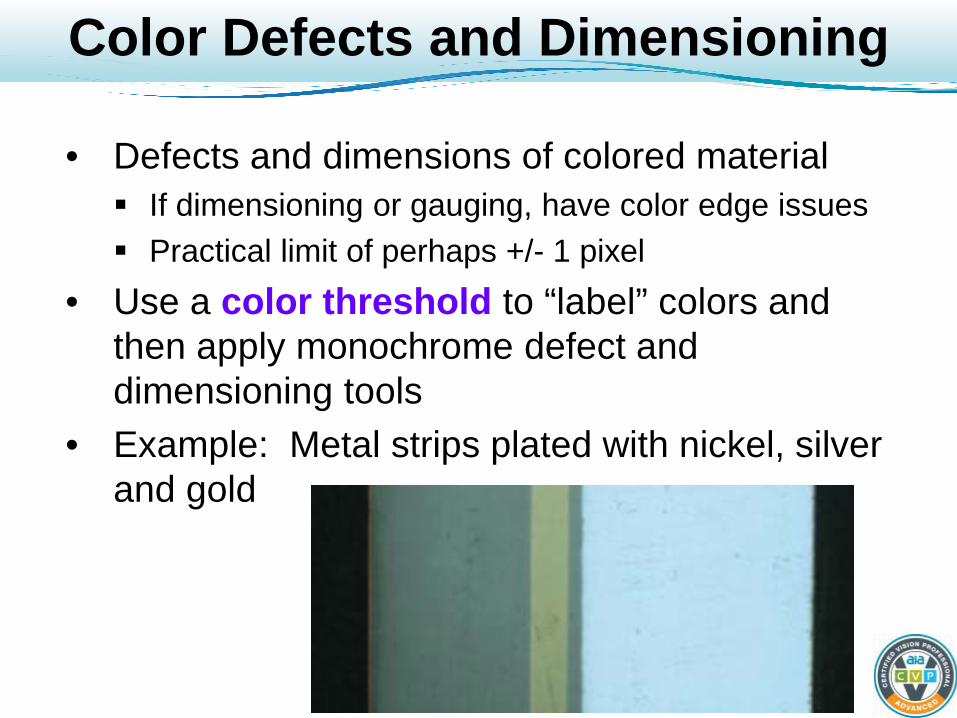
Color Defects and Dimensioning
• Defects and dimensions of colored material If dimensioning or gauging, have color edge issues Practical limit of perhaps +/- 1 pixel
• Use a color threshold to “label” colors and then apply monochrome defect and dimensioning tools
• Example: Metal strips plated with nickel, silver and gold

Plating Inspection – White Balance
Why is this white reference unreliable?

Plating Inspection – Find Defects
• Threshold to display color map label values • Use monochrome blob and edge detectors for
dimensioning and defect detection
Silver
Gold
Background

Applications- Summary
• Color Statistics • Color Threshold • Color Classification • Can use RGB, HSV, Lab, or other color space • Use color to identify features • Use color to separate from background • Color images can pose challenges for
dimensional measurements Convert to monochrome
white and gold, or blue and black?


![THE ORIENTED SWAP PROCESS AND LAST PASSAGE …romik/data/uploads/papers/... · 2020. 5. 9. · THE ORIENTED SWAP PROCESS. This process [AHR12] describes randomly sort-ing a list of](https://static.fdocuments.in/doc/165x107/61312b841ecc5158694490ce/the-oriented-swap-process-and-last-passage-romikdatauploadspapers-2020.jpg)


![Funktionentheorie - Vorlesungsnotizenmath.ucdavis.edu/~romik/data/uploads/notes/complex-ana... · 2020. 9. 2. · Abbildung 2: Die Mandelbrotmenge. [Quelle:Wikipedia] Es gbt viele](https://static.fdocuments.in/doc/165x107/610ca2973b060c7a086371e6/funktionentheorie-v-romikdatauploadsnotescomplex-ana-2020-9-2-abbildung.jpg)