Advanced Clean Transit Battery Cost for Heavy-Duty ... · PDF fileAdvanced Clean Transit...
21
Advanced Clean Transit Battery Cost for Heavy-Duty Electric Vehicles (Discussion Draft) Revised August 22, 2016 (The errata have been corrected on August 14, 2017 and are shown in the last page) California Air Resources Board
Transcript of Advanced Clean Transit Battery Cost for Heavy-Duty ... · PDF fileAdvanced Clean Transit...

Advanced Clean Transit
Battery Cost for Heavy-Duty Electric Vehicles
(Discussion Draft)
Revised August 22, 2016
(The errata have been corrected on August 14, 2017 and are shown in the last page)
California Air Resources Board

Disclaimer
This document has been prepared by staff of the California Air Resources Board (ARB)
as a discussion draft document. It is part of the total cost of ownership analysis that
ARB is conducting for Advanced Clean Transit. Please send any comments about this
discussion draft to Fang Yan at [email protected].

i
Table of Contents
A. Electric Vehicle Batteries .......................................................................................... 1
B. Background on Lithium-ion Battery Chemistries ....................................................... 2
C. Batteries for Heavy-Duty Applications ...................................................................... 3
D. Factors Contributing to Battery Cost ......................................................................... 5
E. Battery Cost Estimates ............................................................................................. 8
1. CE Delft ............................................................................................................ 10
2. Boston Consulting Group ................................................................................. 11
3. Nykvist and Nilsson .......................................................................................... 11
4. Estimates from Electric Bus OEMs .................................................................. 12
5. Summary of Costs ............................................................................................ 14

ii
List of Figures
Figure 1: Trade-offs Among Different Lithium-ion Batteries ............................................ 3
Figure 2: Cost Dependence on Battery Production Volume with Assumptions ............... 7
Figure 3: Cost of Lithium-ion Battery Packs in Light-Duty Battery Electric Vehicles ...... 12
Figure 4: Battery Cost Estimates and Projections from Different Sources .................... 15

1
This discussion draft document is a summary of a literature review of available
information to answer questions from the Advanced Clean Transit Workgroup about
heavy duty battery costs and their projections. Battery cost projections can be used to
estimate the impact on future bus prices and to estimate the costs of future battery mid-
life replacements where applicable. This document and other related discussion
documents are available at www.arb.ca.gov/msprog/bus/actmeetings.htm.
A. Electric Vehicle Batteries
Batteries are the most significant cost component for a battery electric vehicle (BEV).
Lithium-ion batteries are currently the battery choice for light- and heavy-duty BEVs and
are widely available commercially; however, there are multiple lithium-ion battery
chemistries that are used in different heavy duty applications. This paper summarizes
available information from published studies that relate to questions about battery cost
projections.
Battery requirements for heavy-duty BEVs are different from those for light-duty ones,
due to different weights, life expectancy, and driving cycles. Compared with light-duty
vehicles, heavy-duty vehicles are heavier, need more horsepower, have greater
expected lifetime mileages, and require more demanding duty cycles which vary widely.
For example, urban transit buses incorporate a lot of stop-and-go driving with low
average speed, while long-haul trucks make few stops, maintains a relatively constant
speed, and requires high power for long period of grade climbing. Differences between
heavy-duty and light-duty vehicles also result in different battery requirement in power,
energy, and life span1. Though batteries for heavy-duty BEVs sometimes use similar
battery chemistry as light duty ones, they are packaged differently and are not produced
or purchased in high volumes like they are for light-duty vehicles.
Most of the studies with battery cost estimates are for all types of lithium-ion batteries
lumped into one group, without distinguishing specifics chemistries. However, it is
important to understand the battery chemistry because of differences in material costs,
technology maturity, production volume which are crucial factors influencing battery
cost. Data limitations of current studies make it challenging to estimate projections for
specific chemistries of lithium-ion batteries for heavy-duty vehicle applications like
transit buses, but the studies can be used to estimate general battery price trends for
heavy duty vehicles and likely battery cost reductions. This analysis will be updated
when additional battery technology cost information becomes available for specific
chemistries.
1 National Research Council (2012), Review of the 21st Century Truck Partnership, Second Report (web link: http://www.nap.edu/catalog/13288/review-of-the-21st-century-truck-partnership-second-report, last accessed May 2016).

2
The purpose of this discussion paper is to provide a literature review and overview of
battery cost for heavy-duty BEVs with a focus on buses. The following questions are
discussed:
1. What are the major chemistries for batteries in buses?
2. What are the driving factors for battery cost?
3. What are the limitations of current cost studies?
4. What are the best estimates of battery cost at the present and in the future?
B. Background on Lithium-ion Battery Chemistries
There are a variety of lithium-ion chemistries with trade-offs for each. Table 1 shows a
variety of lithium-ion chemistries with their associated specific energy densities and
existing applications2,3,4.
Table 1: Lithium-ion Battery Chemistry Characteristics and Applications
Battery Chemistries Specific Energy (Wh/kg)
Life span (cycles)
Applications
Nickel Cobalt Aluminum (NCA)
160 2000+ Used in cars (e.g., Toyota Prius plug-in hybrid, Tesla)
Nickel Manganese Cobalt Oxide (NMC)
150 2000+ Used in consumer goods, cars, and buses(e.g., Nissan Leaf, Chevrolet Bolt, Proterra, New Flyer)
Lithium Manganese Oxide (LMO)
150 1500+
Used in cars; most LMO blends with NMC to improve the specific energy and prolong the life span (e.g. Nissan Leaf)
Lithium Titanate (LTO)
90 5000+ Used in cars and buses (e.g., Honda Fit, Proterra)
Lithium Iron Phosphate (LFP)
140 5000+
Used in cars, buses, and trucks (e.g., BYD, TransPower, Siemens, Nova Bus, Volvo) and stationary energy storage systems
2 Air Resources Board (ARB) (2015), Technology Assessment: Medium- and Heavy-Duty Battery Electric Trucks and Buses, October 2015 (web link: www.arb.ca.gov/msprog/tech/techreport/bev_tech_report.pdf, last accessed March 2016). 3 Element Energy (2012), Cost and Performance of EV Batteries: Final Report for the Committee on Climate Change, March 2012 (web link: www.element-energy.co.uk/wordpress/wp-content/uploads/2012/06/CCC-battery-cost_-Element-Energy-report_March2012_Finalbis.pdf, last accessed March 2016). 4 Battery University, Safety of Lithium-ion Batteries (web link: http://batteryuniversity.com/learn/article/safety_of_lithium_ion_batteries, last accessed April 2016)

3
Boston Consulting Group (BCG) (2012)5 identified six battery characteristics including:
safety, life span (measured in terms of both number of charge/discharge cycles, and
overall battery age), performance (peak power at low temperatures, state-of-charge
measurement, and thermal management), specific energy (the nominal battery energy
per unit mass), specific power (the maximum available power per unit mass), and
battery cost. The results are shown in Figure 1. Each technology has its advantages
and disadvantages when considering all six dimensions. It is important to note that
when analyzing this figure, the farther the shape extends along a given axis, the better
the performance is in the dimension. As an example, LTO is generally more expensive
than LFP batteries but provide better performance.
Figure 1: Trade-offs Among Different Lithium-ion Batteries
Source: BCG (2012)
C. Batteries for Heavy-Duty Applications
Three types of batteries, LFP, LTO, and NMC, show promise in the application of
medium- and heavy-duty vehicles2,6,7 due to the strengths of long life span, high power
and/or energy specific, and high safety performance.
LFP batteries use graphite as the anode, and LiFePO4 as the cathode. The electrolyte
is a lithium salt in an organic solvent. In addition, the use of phosphate as a positive
electrode significantly reduces the potential for thermal runaway. These batteries are
5 Boston Consulting Group (BCG) (2012), Batteries for Electric Cars: Challenges, Opportunities, and the Outlook to 2020 (www.bcg.com/documents/file36615.pdf, last accessed May 2016) 6 Navigant Research (2014), The Lithium Ion Battery Market: Supply and Demand. ARPA E RANGE Conference (www.arpa-e.energy.gov/sites/default/files/documents/files/Jaffe_RANGE_Kickoff_2014.pdf, last accessed March, 2016). 7 BYD (2016), personal communication with Michael Austin, Vice President of BYD America, March 9, 2016.

4
typically good for many cycles, with BYD claiming up to 7,200 charge/discharge cycles,
corresponding to nearly 20 years if cycled once daily, to degrade the battery to 80
percent of its original capacity. LFP is one of the selections for a high power density
lithium battery. It means that LFP has higher discharge current and requires smaller
battery size to achieve a given performance target, which is important for the vocational
application that requires space for its payload. In addition, LFP has a superior thermal
and chemical stability, which provides better safety8. According to energy storage
related patent activity from 1999 through 2008, LFP technology has been the focus of at
least twice as much as LTO technology, and four times as much as NMC technology5.
This battery technology is used in the TransPower BEV drayage truck and electric
school bus demonstrations. BYD uses self-developed “fire safe” iron phosphate
batteries on their electric buses.
LTO batteries use lithium titanate as the anode, and usually manganese-based material
as the cathode. They use a non-aqueous electrolyte. LTO battery has the advantage
of being faster to charge than other lithium-ion batteries9, because of lower ratio of
heating energy during charging and higher fraction of the Ah capacity that could be
returned without current taper, yet it is more expensive. The battery has a long life span
and some models have been reported to be more than 10,000 cycles at 80 percent
depth of discharge10. While the energy density is lower than other lithium-ion batteries,
they can be safely operated over a wide discharge range, so the effective available
energy is comparable to LFP batteries. LTO batteries are used on the Proterra electric
fast charging buses.
NMC is another type of lithium-ion battery that shows promise in electric buses. These
batteries have a better specific energy and longer lives compared to many other
lithium-ion approaches. The increased energy can contribute to a longer range. For the
same range, this chemistry allows the battery pack to be lighter and take up less space.
Compared with LFP, NMC has lower safety level, yet IDTechEx Research predicted that
NMC suppliers would search advanced battery management systems to match LFP’s
safety levels and create superior batteries. This battery chemistry has been widely
used in many light-duty plug-in electric vehicles such as the Nissan Leaf, Chevrolet Volt,
Chevrolet Spark EV, and Hyundai Sonata plug-in hybrid electric vehicle. It also has
8 IDTechEx (2016), Electric bus sector is game changer for battery market (web link: http://www.idtechex.com/research/articles/electric-bus-sector-is-game-changer-for-battery-market-00009175.asp , last accessed March, 2016). 9 CACTUS (2015), Models and Methods for the Evaluation and Optimal Application of Battery Charging and Switching Technologies for Electric Busses (web link: http://www.cactus-emobility.eu/CACTUS_Deliverable_1.2_Technologies-to-enable-fully-electric-busses.pdf, last accessed, March 2016). 10 NEI Corporation (2016), Lithium Titanate Based Batteries for High Rate and High Cycle Life Applications (web link: http://neicorporation.com/white-papers/NEI_White_Paper_LTO.pdf, last accessed May 2016)
5
been used on New Flyer’s Xcelsior XE40 electric transit bus and Proterra’s
extended-range electric buses.
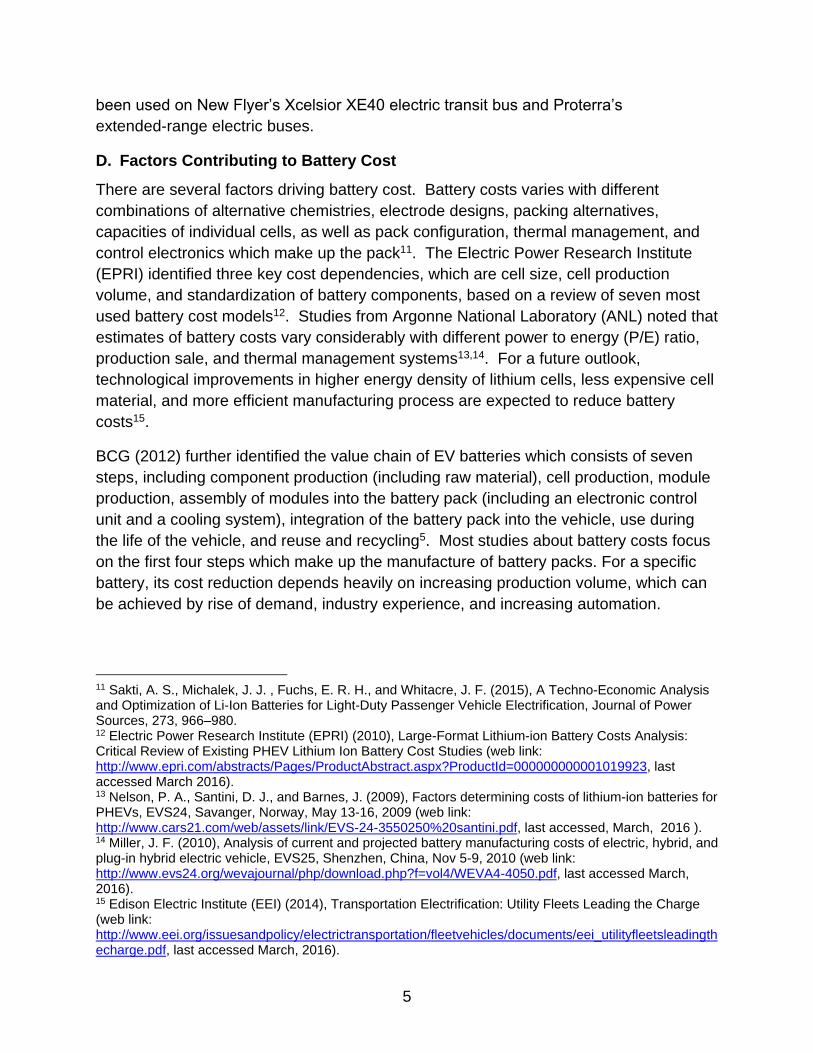
D. Factors Contributing to Battery Cost
There are several factors driving battery cost. Battery costs varies with different
combinations of alternative chemistries, electrode designs, packing alternatives,
capacities of individual cells, as well as pack configuration, thermal management, and
control electronics which make up the pack11. The Electric Power Research Institute
(EPRI) identified three key cost dependencies, which are cell size, cell production
volume, and standardization of battery components, based on a review of seven most
used battery cost models12. Studies from Argonne National Laboratory (ANL) noted that
estimates of battery costs vary considerably with different power to energy (P/E) ratio,
production sale, and thermal management systems13,14. For a future outlook,
technological improvements in higher energy density of lithium cells, less expensive cell
material, and more efficient manufacturing process are expected to reduce battery
costs15.
BCG (2012) further identified the value chain of EV batteries which consists of seven
steps, including component production (including raw material), cell production, module
production, assembly of modules into the battery pack (including an electronic control
unit and a cooling system), integration of the battery pack into the vehicle, use during
the life of the vehicle, and reuse and recycling5. Most studies about battery costs focus
on the first four steps which make up the manufacture of battery packs. For a specific
battery, its cost reduction depends heavily on increasing production volume, which can
be achieved by rise of demand, industry experience, and increasing automation.
11 Sakti, A. S., Michalek, J. J. , Fuchs, E. R. H., and Whitacre, J. F. (2015), A Techno-Economic Analysis and Optimization of Li-Ion Batteries for Light-Duty Passenger Vehicle Electrification, Journal of Power Sources, 273, 966–980. 12 Electric Power Research Institute (EPRI) (2010), Large-Format Lithium-ion Battery Costs Analysis: Critical Review of Existing PHEV Lithium Ion Battery Cost Studies (web link: http://www.epri.com/abstracts/Pages/ProductAbstract.aspx?ProductId=000000000001019923, last accessed March 2016). 13 Nelson, P. A., Santini, D. J., and Barnes, J. (2009), Factors determining costs of lithium-ion batteries for PHEVs, EVS24, Savanger, Norway, May 13-16, 2009 (web link: http://www.cars21.com/web/assets/link/EVS-24-3550250%20santini.pdf, last accessed, March, 2016 ). 14 Miller, J. F. (2010), Analysis of current and projected battery manufacturing costs of electric, hybrid, and plug-in hybrid electric vehicle, EVS25, Shenzhen, China, Nov 5-9, 2010 (web link: http://www.evs24.org/wevajournal/php/download.php?f=vol4/WEVA4-4050.pdf, last accessed March, 2016). 15 Edison Electric Institute (EEI) (2014), Transportation Electrification: Utility Fleets Leading the Charge (web link: http://www.eei.org/issuesandpolicy/electrictransportation/fleetvehicles/documents/eei_utilityfleetsleadingthecharge.pdf, last accessed March, 2016).

6
While most projections only estimate cost without describing production volume, or use
a single volume production in their estimates, volume effects should be considered as
there is an expected change in production volume per plant with time3. Models have
been developed to estimate cost and performance of battery packs3. BatPac model16 is
one of them. BatPac model uses a bottom up approach of cell design, as well as the
links between production costs, cell design, and volume. Designs of a battery with
specified power, energy, and type of vehicle battery (PHEV or EV) are used as input of
this model. The cost of the designed battery is then calculated by accounting for every
step in the lithium-ion battery manufacturing process. The assumed annual production
level directly affects each process step. The total cost to the original equipment
manufacturer calculated by the model includes the materials, manufacturing, and
warranty costs. BatPac model assumes a highly optimized manufacturing plant built for
production in 2020 to provide for a consolidated EV market. This model was designed
to estimate the cost of batteries manufacturing in large quantities at a plant specifically
designed to only produce those batteries. Paul Nelson and Shabbir Ahmed, scientists
at ANL17, provided a demonstration of how battery cost decline with the increase of
batteries produced, using a 324 kWh (3 packs) LFP battery in a case study, as shown in
Figure 2. This example is given to provide an indication of the effect of production
volume on the cost, and it is not intended to predict cost of a specific battery design. A
cost reduction of 41 percent is shown if the production volume increases from 300
battery systems to 10,000 battery systems per year.
16 Argonne National Laboratory (2016), BatPaC: A Lithium-ion Battery Performance and Cost Model for Electric-Drive Vehicles (web link: http://www.cse.anl.gov/batpac/, last accessed May 2016) 17 Argonne National Laboratory (2016), personal and email communication with Paul Nelson and Shabbir Ahmed, Chemical Engineers, May 5, 2016.

7
Figure 2: Cost Dependence on Battery Production Volume with Assumptions
Source: Argonne BatPac Model
Research work around the world is examining other potential technologies that can yield
higher energy density and/or lower cost per unit of energy. None of these more
futuristic battery systems has achieved enough maturity to become commercial yet.
Solid-state lithium-ion batteries use solid electrolytes, instead of conventional liquid
ones. Solid electrolyte could not only increase battery life, but also storage capacity
and safety, as liquid electrolytes are the leading cause of battery fire18,19,20. Lithium-
silicon batteries employ a new type of silicon anode that would be used in place of a
conventional graphite anode. The silicon anode has a theoretical specific capacity ten
times more than that of anodes such as graphite, while it swells to more than three
times its volume when fully charged and this swelling quickly breaks the electrical
contacts in the anode21. Tesla has taken a baby step by shifting the cell chemistry for
Model S’ updated battery pack, which provides a 6% increase in range, to partially use
18 Guoqiang Tan, Feng Wu, Chun Zhan, Jing Wang, Daobin Mu, Jun Lu, and Khalil Amine (2016), Solid-State Li-Ion Batteries Using Fast, Stable, Glassy Nanocomposite Electrolytes for Good Safety and Long Cycle-Life, Nano Letter, 16 (3), 1960–1968. 19 Yan Wang, William Davidson Richards, Shyue Ping Ong, Lincoln J. Miara, Jae Chul Kim, Yifei Mo, and Gerbrand Ceder (2015), Design Principles for Solid-State Lithium Superionic Conductors, Nature Materials, 14, 1026–1031. 20 MIT News (2015), Going Solid-State Could Make Batteries Safer and Longer-Lasting (web link: http://news.mit.edu/2015/solid-state-rechargeable-batteries-safer-longer-lasting-0817, Last accessed July 2016) 21 Fathy M. Hassan, Rasim Batmaz, Jingde Li, Xiaolei Wang, Xingcheng Xiao, Aiping Yu, and Zhongwei Chen (2015), Evidence of Covalent Synergy in Silicon-Sulfur-Graphene Yielding Highly Efficient and Long-Life Lithium-Ion Batteries, Nature Communications, doi:10.1038/ncomms9597.
Cell Chemistry: LFP/graphite
Large
Cells
Small
Cells
Number of packs in parallel 3 3
Cells per pack 336 504
Cell capacity, Ah 99 66
Number of cells in parallel 2 3
Nominal battery voltage, V 551 551
Pack power, kW 133.3 133.3
Total pack energy, kWh 108 108
Useable battery energy, % of total 85 85
% OCV at full power 97.1 97.2
Bus energy requirement, Wh/mile 1,775 1,775
Pack dimensions, mm
Length
Width
Height
1,647
1,740
169
2,425
1,457
147
Battery weight (3 packs), kg 2,525 2,636
Battery volume (3 packs), L 1,474 1,579

8
silicon in the anode22. Lithium-sulfur chemistry utilizes a lithium metal anode and a
cathode based on sulfur compounds. This system could theoretically double the
specific energy of lithium-ion batteries and offer a competitive cost. Lithium-air battery
utilizes lithium-metal anodes and an air electrode so that the cathodic active material,
oxygen, is taken from the air and at the charged state does not add to the weight of the
battery. However, National Research Council (NRC)23 predicts that even if these new
technologies can be successfully developed, they probably will not be widely available
soon. Besides, the scale-up and mass production of batteries from research laboratory
to market is slow24. Therefore, potential cost reductions achieved by new technologies
are not considered in this discussion paper.
E. Battery Cost Estimates
Battery costs for light-duty BEVs has been declining rapidly during the last 10 years,
and similar trends are expected for heavy-duty batteries especially with increasing
heavy-duty BEV deployment. Although some batteries used for heavy-duty electric
vehicles share similar chemistry as light-duty ones, battery pack costs per kWh for
heavy-duty BEVs are currently higher, mainly because of different packaging, thermal
management systems, and lower purchase volumes.
Currently, it is somewhat challenging to estimate battery cost for heavy-duty BEVs due
to the following three reasons: (1) battery costs vary widely with chemistry, yet most
estimates are for all types of lithium-ion batteries lumped into one group; (2) most
published estimates are applicable for light-duty BEVs and not for heavy duty vehicle
applications; and (3) there is lack of information about explicit relationships between
production volume and battery cost for heavy duty vehicle applications. However, the
estimated costs from various studies can be used as a reference to project the trend of
battery costs over time.
We evaluated battery cost ranges from different literature sources. The following
studies were reviewed and considered for the estimates of battery costs that might be
applicable to transit buses, including CE Delft (2013)25, CACTUS (2015)9, CALSTART
22 Christian Ruoff (2015), Tesla Tweaks Its Battery Chemistry: A Closer Look at Silicon Anode Development (web link: https://chargedevs.com/features/tesla-tweaks-its-battery-chemistry-a-closer-look-at-silicon-anode-development/, last accessed July 2016) 23 National Research Council (NRC) (2013), Transitions to Alternative Vehicles and Fuels (web link: http://www.oregon.gov/energy/TRANS/docs/NRC-Report.pdf, last accessed March 2016) 24 Venkat Srinivasan (2015), The Future of (Electrochemical) Energy Storage, Lawrence Berkeley National Lab, (web link: http://www.arb.ca.gov/research/seminars/srinivasan/srinivasan.htm, last accessed May 2016). 25 CE Delft (2013), Zero Emissions Trucks: An Overview of State-of-the-Art Technologies and Their Potential (web link: http://www.theicct.org/sites/default/files/publications/CE_Delft_4841_Zero_emissions_trucks_Def.pdf, last accessed March 2016).

9
(2012)26, Rocky Mountain Institute (RMI) (2015)27, Navigant Research (2014)6, and cost
estimates from OEMs 28, 29,30, as summarized in Table 2. Studies by BCG (2012)5 and
Nykvist and Nisson(2015)31 are discussed as well, since they provide insight about
changes of battery cost over time. However, these two studies are not used for the final
cost estimates because they focus more on batteries for light-duty BEVs. All the
references shown in Table 2 were chosen, because they have either specified battery
chemistry and/or application, or systematically integrated information from studies.
Table 2: Battery Cost Estimates and Projections from Different Sources
Reference Chemistry Application Cost Estimates and Projection a
CE Delft (2013)b Not Specified Distribution and long haul trucks
$600/kWh (2012); $320/kWh (2020); $210/kWh (2030)
LFP Not Specified $350/kWh (2015)
LTO Not Specified $2000/kWh (2015)
CALSTART (2012)
Not Specified Trucks $500-600/kWh (2015); 450/kWh (2020); $300/kWh (2025)
Rocky Mountain Institute (2015)c
Not Specified Residential and commercial battery storage system
$540/kWh (2015); $405/kWh (2020); $225/kWh (2030); $200/kWh (2040)
Boston Consulting Group (2012)
NCA Not Specified $990-$1220/kWh (2009); $360-$440/kWh (2020)
LFP Not Specified $400-$1200/kWh (2014)
LTO Not Specified $800-$2000/kWh (2014)
NMC Not Specified $700-$900/kWh (2014)
Nykvist and Nisson (2015)d
Not Specified Not Specified Whole industry: $410/kWh(2015); Market leader: $300/kWh (2015)
BYD (2016) LFP Buses (depot charging)
$900/kWh (2016); $600/kWh (2025)e
Proterra (2016) LTO Buses (on-route charging)
Upwards of $1000/kWh (2016); $700/kWh (2022)f
New Flyer (2016) NMC Buses (depot charging)
$750-$850/kWh (2016)g
26 CALSTART (2012), Best Fleet Uses, Key Challenges and the Early Business Case For E-Trucks: Findings and Recommendations of the E-Truck Task Force (web link: http://www.calstart.org/Libraries/E-Truck_Task_Force_Documents/Best_Fleet_Uses_Key_Challenges_and_the_Early_Business_Case_for_E-Trucks_Findings_and_Recommendations_of_the_E-Truck_Task_Force.sflb.ashx, last accessed April 2016) 27 Rocky Mountain Institute (2015), The Economics of Load Defection: How Grid-Connected Solar-Plus-Battery Systems Will Compete with Traditional Electric Service, Why It Matters, and Possible Paths Forward (web link: http://www.rmi.org/electricity_load_defection, last accessed March, 2016). 28 New Flyer (2016), email communication with David Warren, Director of Sustainable Transportation, June 13, 2016. 29 Proterra (2016), email communication with Dustin Grace, Director of Battery Engineering, June 9, 2016. 30 Transit Agency Subcommittee (2016), email and personal communications with cost subgroup, Steven Miller, Director of Maintenance at Golden Gate Bridge, Highway and Transportation District. 31 Nykvist and Nilsson (2015), Rapidly Falling Costs of Battery Packs for Electric Vehicles, Nature Climate Change, doi: 10.1038/NCLIMATE2564.

10
ACTIA(2016)
LTO Buses (on-route charging)
$1500-$2000/kWh (2016)h
Not Specified Buses (depot charging)
$750-$1000/kWh (2016)h
a Original data from references; not adjusted by CPI. b A Euro to US exchange rate of 1.33 was used to convert the cost from €2010. c Average value used for analysis in the report; based on various studies. d Cost estimates from this paper are based on 85 references, including peer reviewed papers in
international scientific journals, the most cited grey literature (e.g. estimates from agencies, consultancy and industry analysts), news items of individual accounts from industry representatives and experts, and some further novel estimates for leading BEV manufactures.
e Rough estimate derived from bus price information reflecting the assumption that the price difference between BYD’s 40 foot bus price and a conventional diesel bus price in 2016 is primarily from the battery cost as described in section E.4.
f Based on discussion with Dustin Grace, Director of Battery Engineering of Proterra, as described in section E.4.
g Based on discussion with David Warren, Director of Sustainable Transportation of New Flyer, as described in E.4
h Based on ACTIA’s presentation and discussion with Greg Fritz, EV Business Unit Manager of ACTIA.
1. CE Delft
CE Delft (2013)25 stated that future costs are difficult to predict, but estimated that
battery costs will decrease due to effects on production volume as well as introducing
new technologies. This report assumed that the battery system cost for both light- and
heavy-duty battery electric vehicles as well as for the battery used by fuel cell electric
vehicles to be equivalent. Cost ranges in this report have been determined with
different literature sources, most of which rely on studies for light-duty BEVs, including
McKinsey32, ICF33, Howell34, Element Energy3, and Roland Berger35, and implicated
rising production rates of up to 100,000 units as well as continual increasing of future
investments. They estimated that the battery systems cost $600/kWh in 2012,
$320/kWh in 2020, and $210/kWh in 2030 (all costs are shown in 2010 dollars, and a
Euro to US exchange rate of 1.33 was used to convert from Euro). The projection
estimates a 7.6 percent and 3.9 percent annual reduction from 2012 to 2020 and 2020
to 2030, respectively.
32 McKinsey (2012), Urban Buses: Alternative Powertrains for Europe, A Fact-Based Analysis of the Role of Diesel Hybrid, Hydrogen Fuel Cell, Trolley and Battery Electric Powertrains (web link: http://www.fch.europa.eu/node/790, last accessed May 2016) 33 ICF (2011), Impacts of Electric Vehicles – Deliverable 2, Assessment of Electric Vehicle and Battery Technology (web link: http://ec.europa.eu/clima/policies/transport/vehicles/docs/d2_en.pdf, last accessed May 2016) 34 Howell (2012), Battery Status and Cost Reduction Prospects, EV Everywhere Grand Challenge: Battery Workshop, Chicago, IL, July 26, 2012 (web link: http://energy.gov/sites/prod/files/2014/03/f8/5_howell_b.pdf, last accessed May 2016) 35 Roland Berger (2012), Technology & Market Drivers for Stationary and Automotive Battery Systems, Nice, France, October 24-26, 2012, (web link: http://www.rechargebatteries.org/wp-content/uploads/2013/04/Batteries-2012-Roland-Berger-Report1.pdf, last accessed May 2016)

11
2. Boston Consulting Group
BCG (2012) presented a case study of battery cost analysis. They assumed a typical
supplier of 15 kWh NCA batteries, which generally apply to light-duty vehicles such as
plug-in Prius, using modestly automated production to make 50,000 cells and highly
manual assembly to produce 500 battery packs in 2009. It was estimated that the costs
to an OEM would range from $990 to $1220/kWh, and this price will decrease by
roughly 60 to 65 percent from 2009 to 2020, that is 8-9 percent annually, resulting a
price of $360-$440/kWh with the annual production of 73 million cells and 1.1 million
batteries in 2020. This study provides a conceptual idea about how NCA battery cost
changes with annual production, but is applicable to light-duty BEV production volumes.
3. Nykvist and Nilsson
Nykvist and Nilsson (2015) presented cost estimates of all variants of lithium-ion
technology used for BEVs, shown in Figure 3, as the aim is to track the progress of BEV
technology in general and data is too scarce for individual lithium-ion cell chemistry
variants. They evaluated that the average estimated battery cost for the industry as a
whole declined by 14 percent annually from 2007 to 2014, and costs for market-leading
manufacturers declined by 8 percent annually for the same period, leading to an
estimated current cost range in 2014, given as the mean of $410/kWh, and $300/kWh,
respectively. This paper demonstrated that the annual global sale of light-duty BEVs
increased more than 7 times from 2011 to 2014, and the cumulative battery capacity
also increased from 600 MWh to 13,000 MWh during this period of time36. The authors
believed that the 8 percent annual cost decline for market-leading actors is more likely
to represent the probable future cost improvement for lithium-ion battery packs in BEV
and revealed that the costs of lithium-ion battery packs continue to decline. The
limitation of this study is that it does not specify battery chemistry or battery vocation
application, though the data sources indicate that most of them are light-duty BEVs.
Despite limited applications of this study, it demonstrates that substantial reduction in
the cost of battery packs for light-duty BEVs is possible and that the reduction has
occurred more rapidly than originally projected.
36 Nykvist and Nilsson (2015), Rapidly Falling Costs of Battery Packs for Electric Vehicles, Supplementary Sheet 2 (cumulative volume data), Nature Climate Change, doi: 10.1038/NCLIMATE2564.

12
Figure 3: Cost of Lithium-ion Battery Packs in Light-Duty Battery Electric Vehicles
Source: Nykvist and Nisson, Nature Climate Change, 2015
4. Estimates from Electric Bus OEMs
Battery electric bus manufacturers have also provided information to ARB about current
and projected battery costs or about projected bus costs.
Proterra’s battery electric CATALYST Fast ChargeTM transit bus operates with on-route
fast charging technology and utilizes a 105 kWh LTO chemistry battery. Proterra
estimates that the current LTO battery pack cost is upwards of $1000/kWh but did not
provide a specific cost estimate. A midlife battery replacement of this battery, which is
recommended after 6 years of heavy use (~40,000 miles per year), is projected to cost
$75,00029. Proterra’s battery electric CATALYST Extended RangeTM transit bus uses
an NMC battery with 330kWh of onboard energy storage37. According to Proterra, with
the same 6 year midlife replacement schedule, the battery pack replacement is
expected to yield significantly more onboard energy than today’s offering while costing
less than $200/kWh. Proterra also indicates there is a potential synergy with batteries
for light-duty vehicles which utilize a tri-metal battery chemistry (such as NMC) that
37 Proterra (2016), Proterra Announces Advancements in Battery Technology for Heavy Duty Transit (web link: http://www.proterra.com/proterra-announces-advancements-in-battery-technology-for-heavy-duty-transit/, last accessed June, 2016)

13
could reach a cell cost at or lower than $145/kWh – as was recently announced by GM
for the upcoming Chevy Bolt battery38.
BYD has indicated that the price of its 40-foot bus with a 324 kWh LFP battery is
$770,000 in 2016 and is expected to decline year-over-year through 2025. Although
BYD did not provide battery pricing, it does expect that battery pricing will fall by up to
33 percent in that same time period. To make a comparison to other battery cost
estimates, we can approximate the battery costs by assuming the incremental cost of
the BYD electric bus above a conventional diesel bus that costs $480,000 in 2016 is
primarily from the battery cost. A rough estimate is $900/kWh in 2016 and around
$600/kWh in 202539.
New Flyer indicates that the cost of lithium-ion battery systems for heavy-duty BEVs is
expected to continue to have a premium compared to light-duty BEVs but may still
benefit from lower battery cell costs with expansion of the light duty BEV market28. New
Flyer’s Xcelsior XE40 electric transit bus can be driven up to 130 miles per charge with
a 300 kWh battery40. They state that the full-cost of battery systems for buses has
previously been on the order of $750 to $850/kWh28. New Flyer explained that cost
drivers for the premium over light duty vehicles include:
Heavy-duty BEVs has lower purchasing volumes compared to light duty BEVs;
Battery thermal management systems (heating and cooling) are used in transit to
ensure high performance and prevent thermal battery deterioration and
shortened life;
Battery rack packaging and securement structures are designed for a 12-year
warrantable transit life;
Individual power distribution units (PDUs) and battery management controllers
(BCUs) are needed for each battery module added to achieve extended transit
range.
Gillig also applied a 100kWh NMC battery to its first 30-foot battery electric bus from a
third party supplier and expects to have a better estimate of their battery costs at scale
when more buses are produced29.
38 Ayre (2015), Chevy Bolt battery cells = $145/kWh, new Chevy Volt with autonomous driving, CleanTechnica (web link: http://cleantechnica.com/2015/10/05/chevy-bolt-battery-cells-145kwh-new-chevy-volt-with-autonomous-driving/, last accessed March, 2016) 39 Reflects expected battery price reduction of 33% by 2025. 40 New Flyer (2016), New Flyer’s Xcelsior Electric Bus Brochure (web link: https://www.newflyer.com/index.php?option=com_content&view=article&id=234&Itemid=149, last accessed July, 2016)

14
5. Summary of Costs
Figure 4 shows a plot of the battery cost estimates in nominal dollars per kWh from in
Table 2 from various studies and indicates their applications and chemistries if
available. “NS” is used if such information is not specified. Circles mean LTO batteries,
squares mean LFP batteries, and diamonds mean NMC batteries. The median battery
costs in 2015, 2020, and 2030 are calculated separately for LTO versus other battery
technologies based on the data points in the figure. Note that the median of values for
2014, 2015, and 2016 is used to represent the median cost in 2015.
The battery costs for heavy-duty BEVs from these studies are currently in a very wide
range of $350 to $2000/kWh, depending on battery chemistry. For 2015, LFP battery
costs range from $350 to $1200/kWh, NMC battery costs are about $700 to $900/kWh
and both are commonly used for depot charging.
For depot charging buses, we aggregate cost estimates for LFP and NMC together.
The median battery costs from all estimates (excluding LTO) decline from $725/kWh in
2015 to $405/kWh in 2020 and to $218/kWh in 2030. By using these median values, a
324 kWh battery that is used in a bus that charges at a depot could have a price
decrease of about $100,000 between 2016 and 2020 and is expected to decline further
in price by 2030. The estimated battery price reduction from the aggregated data is
also in-line with the bus price projection provided by BYD for their 40 foot depot
charging bus where the bus price is expected to decline by about $100,000 ($770,000
in 2016 to an estimated $675,000 in 2025)41. Similarly, Proterra’s extended range depot
charging bus is expected to decline by about $130,000 in four years. Its incremental
cost over a conventional CNG bus today is $234,000 and is expected to narrow to
$104,000 over a conventional CNG bus in four years42.
41 Assumes a 33 percent battery price decline to $600/kWh*324 kWh=674,400. 42 This estimate is based on bus price projections from Proterra to the cost subgroup of Transit Agency Subcommittee, Steven Miller, Director of Maintenance at Golden Gate Bridge, Highway and Transportation District. The price declines are determined by comparing the incremental cost for a Proterra’s buses to that of a CNG bus in a 4 year period.

15
Figure 4: Battery Cost Estimates and Projections from Different Sources
Sources: CE Delft, 2013; CACTUS, 2015; CALSTART, 2012; RMI, 2015; Navigant Research,
2014; Proterra, 2016; New Flyer, 2016; ACTIA, 2016
LTO batteries are generally used for on-route charging buses with relatively small
battery packs (compared to buses designed for depot charging) and their current costs
range from $800 to $2000/kWh. There is only one LTO battery cost projection for 2022
from Proterra, based on its projected midlife replacement cost of $75,000 for its existing
105 kWh battery, as shown on the graph. Although there is insufficient data to develop
a separate price trend for LTO batteries, Proterra confirms LTO battery prices are
expected to continue to decline substantially. The battery cost reduction is reflected in
the price of their on-route charging bus that is expected to decline about $130,000 in 4
years.
Batteries represent one of the most significant costs for battery electric buses. There is
a clear expectation from the studies we evaluated that the trend in battery price
reductions for heavy duty applications will continue for the foreseeable future. The
median of the expected battery price reductions are consistent with bus price
725
405
218
2000
714
0
500
1000
1500
2000
2500
2010 2015 2020 2025 2030 2035 2040 2045
$/k
Wh
Year
CE Delft (2013): Trucks; NS
CACTUS (2015): NS; LFP
CACTUS (2015): NS; LTO
CALSTART(2012): Trucks; NS
RMI (2015): Res.&Com.; NS
Navigant Research (2014): NS; LFP
Navigant Research (2014): NS; NMC
Navigant Research (2014): NS; LTO
Proterra (2016): Buses (on-route charging); LTO
New Flyer (2016): Buses (depot charging); NMC
ACTIA (2016): Buses (depot charging); NS
ACTIA (2016): Buses (on-route charging); LTO
Median (NMC, LFP, and others)
Median (LTO)

16
projections from Proterra and the battery cost reduction estimate from BYD. Lower
battery costs per kWh are expected to result in significantly lower battery electric bus
prices, longer range (for the same battery pack volume), or both depending on market
factors. Although midlife battery replacements aren’t expected for some buses, battery
cost reductions are also expected to lower the cost for midlife battery replacements in
about 6 to 8 years, when needed.
17
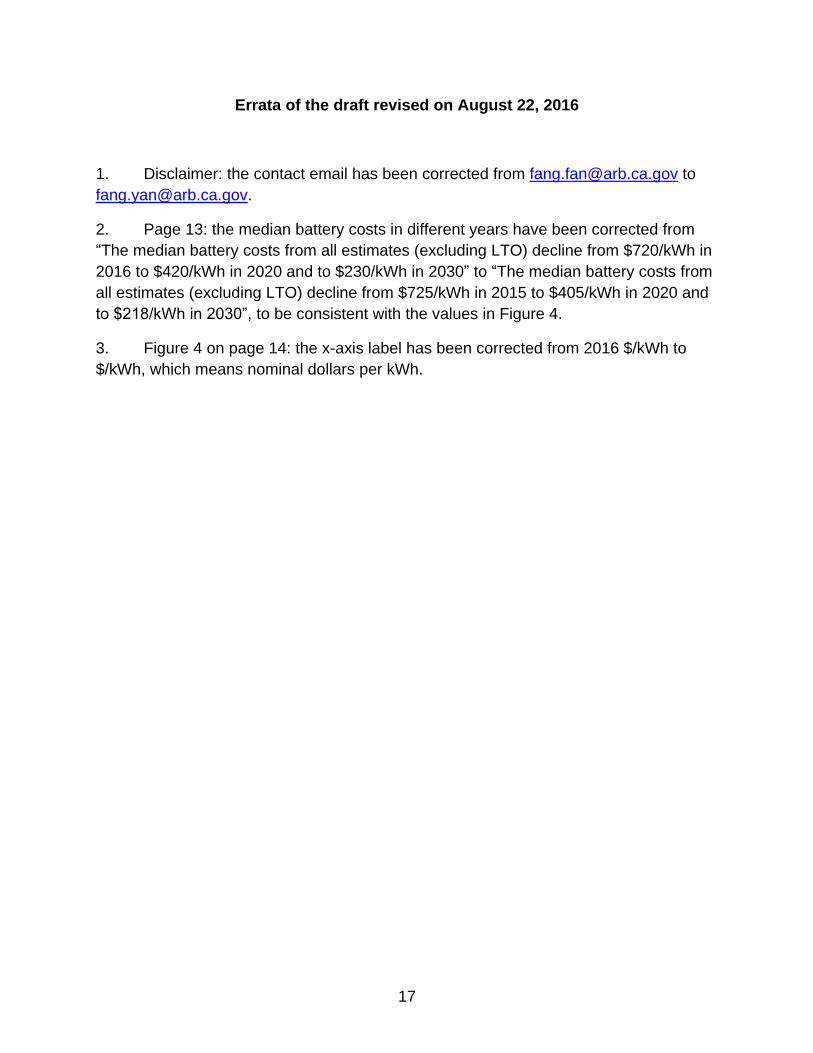
Errata of the draft revised on August 22, 2016
1. Disclaimer: the contact email has been corrected from [email protected] to
2. Page 13: the median battery costs in different years have been corrected from
“The median battery costs from all estimates (excluding LTO) decline from $720/kWh in
2016 to $420/kWh in 2020 and to $230/kWh in 2030” to “The median battery costs from
all estimates (excluding LTO) decline from $725/kWh in 2015 to $405/kWh in 2020 and
to $218/kWh in 2030”, to be consistent with the values in Figure 4.
3. Figure 4 on page 14: the x-axis label has been corrected from 2016 $/kWh to
$/kWh, which means nominal dollars per kWh.