Advanced Centrifugal Compression and Pumping for CO2...
43
Advanced Centrifugal Compression and Pumping for CO 2 Applications Southwest Research Institute Team: J. Jeffrey Moore, Ph.D. Hector Delgado Andrew Lerche Timothy Allison, Ph.D. Brian Moreland Project Funded by DOE NETL DOE PM: Mr. Timothy Fout Co-Funded by Dresser-Rand and BP
Transcript of Advanced Centrifugal Compression and Pumping for CO2...

Advanced Centrifugal Compression and Pumping for CO2 Applications
Southwest Research Institute Team:J. Jeffrey Moore, Ph.D.
Hector DelgadoAndrew Lerche
Timothy Allison, Ph.D.Brian Moreland
Project Funded by DOE NETLDOE PM: Mr. Timothy Fout
Co-Funded by Dresser-Rand and BP
Project Motivation
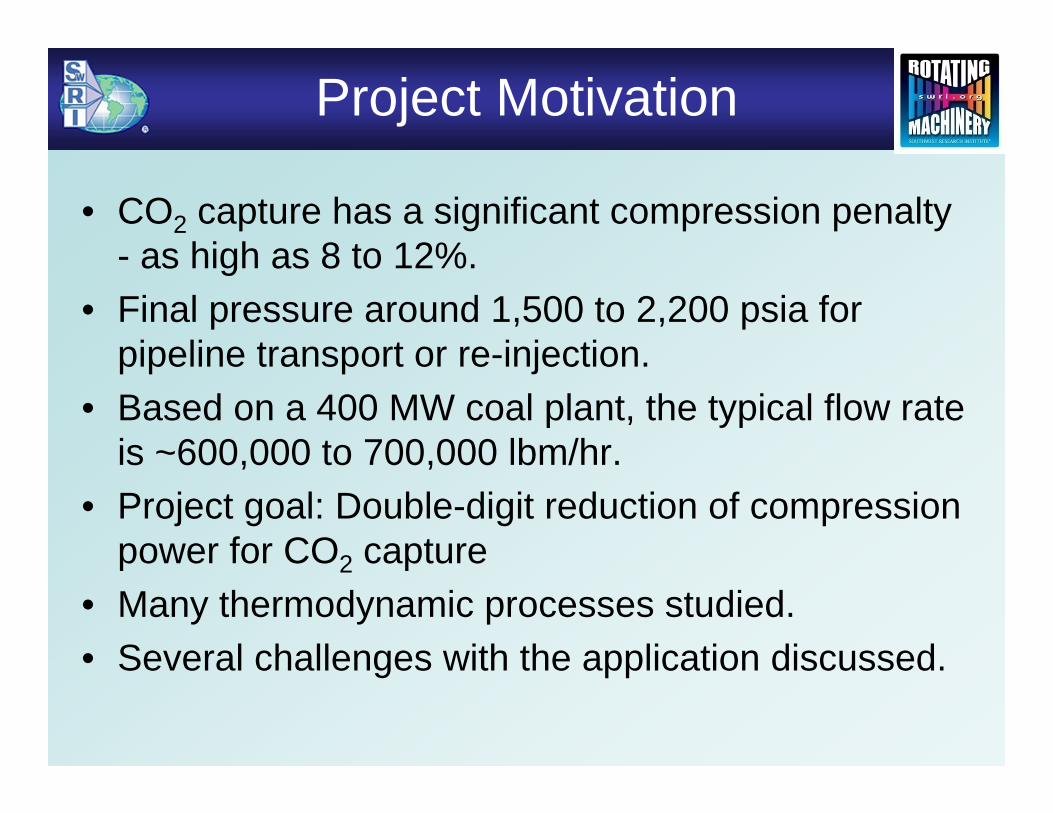
• CO2 capture has a significant compression penalty - as high as 8 to 12%.
• Final pressure around 1,500 to 2,200 psia for pipeline transport or re-injection.
• Based on a 400 MW coal plant, the typical flow rate is ~600,000 to 700,000 lbm/hr.
• Project goal: Double-digit reduction of compression power for CO2 capture
• Many thermodynamic processes studied.• Several challenges with the application discussed.
Project Overview
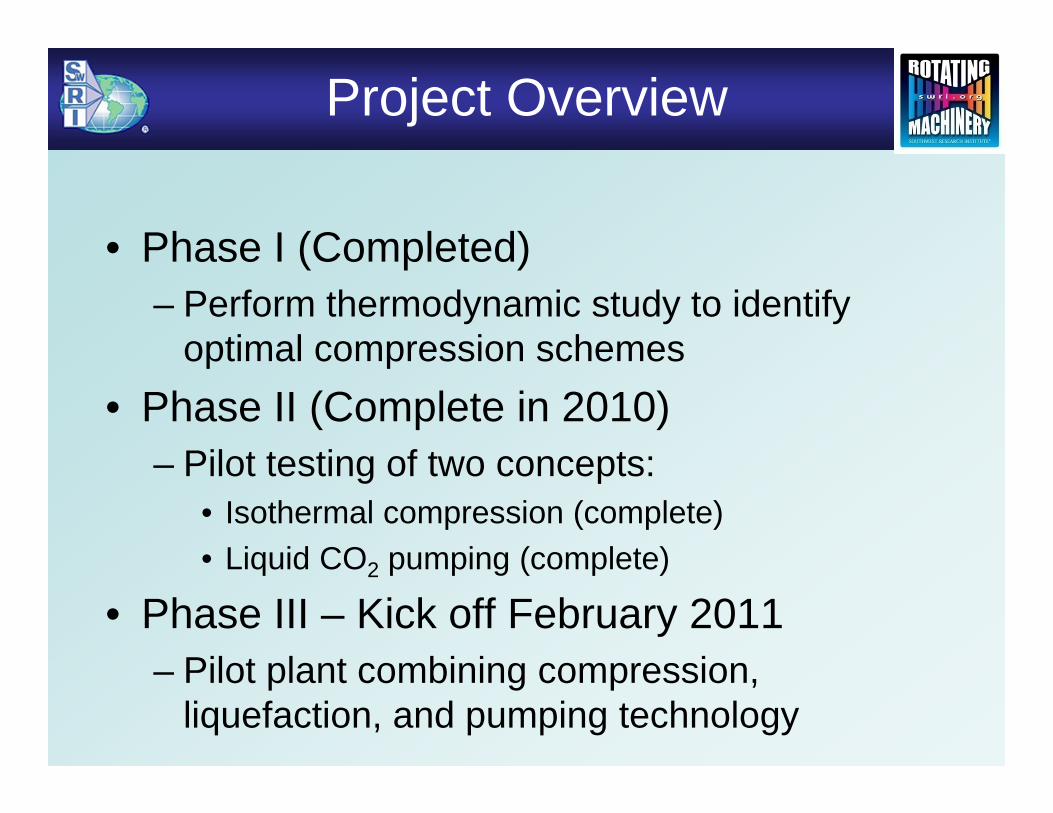
• Phase I (Completed)– Perform thermodynamic study to identify
optimal compression schemes• Phase II (Complete in 2010)
– Pilot testing of two concepts: • Isothermal compression (complete)• Liquid CO2 pumping (complete)
• Phase III – Kick off February 2011– Pilot plant combining compression,
liquefaction, and pumping technology

Southwest Research Institute
DOE PC Reference Case
• Only CO2 stream considered
DOE/NETL report 401/110907

Proposed Solution for Optimal Efficiency
Optimal solution combines inter-stage cooling and a liquefaction approach.
Compression Technology Options for IGCC Waste Carbon Dioxide Streams
10
100
1000
10000
0 50 100 150 200 250 300 350 400
Enthalpy (Btu/lbm)
Pres
sure
(psi
a)
Conventional "Option A"Proposed Solution
"Option E.2"
Summary of Thermodynamic Analysis for IGCC Plant
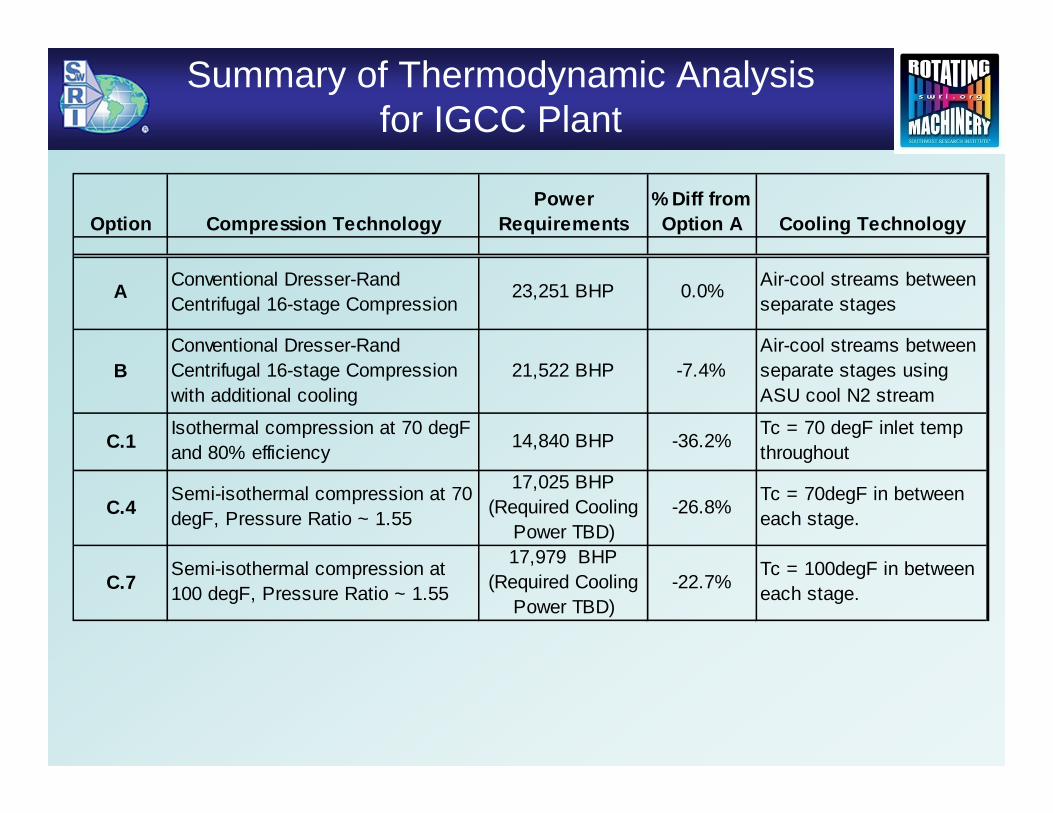
Option Compression TechnologyPower
Requirements% Diff from Option A Cooling Technology
A Conventional Dresser-Rand Centrifugal 16-stage Compression
23,251 BHP 0.0% Air-cool streams between separate stages
BConventional Dresser-Rand Centrifugal 16-stage Compression with additional cooling
21,522 BHP -7.4%Air-cool streams between separate stages using ASU cool N2 stream
C.1Isothermal compression at 70 degF and 80% efficiency 14,840 BHP -36.2%
Tc = 70 degF inlet temp throughout
C.4Semi-isothermal compression at 70 degF, Pressure Ratio ~ 1.55
17,025 BHP (Required Cooling
Power TBD)-26.8%
Tc = 70degF in between each stage.
C.7Semi-isothermal compression at 100 degF, Pressure Ratio ~ 1.55
17,979 BHP (Required Cooling
Power TBD)-22.7%
Tc = 100degF in between each stage.

Summary of Thermodynamic Analysis for IGCC Plant Cont.
Option Compression TechnologyPower
Requirements% Diff from Option A Cooling Technology
D.3High ratio compression at 90% efficiency - no inter-stage cooling 34,192 BHP 47.06% Air cool at 2215 psia only
D.4High ratio compression at 90% efficiency - intercooling on final compression stage
24,730 BHP 6.36%Air cool at 220 and 2215 psia
E.1Centrifugal compression to 250 psia, Liquid cryo-pump from 250-2215 psia
16,198 BHP (Includes 7,814
BHP for Refrigeration) 1
-30.33%Air cool up to 250 psia, Refrigeration to reduce CO2 to -25degF to liquify
E.2
Centrifugal compression to 250 psia with semi-isothermal cooling at 100 degF, Liquid cryo-pump from 250-2215 psia
15,145 BHP (Includes 7,814
BHP for Refrigeration) 1
-34.86%
Air cool up to 250 psia between centrifugal stages, Refrigeration to reduce CO2 to -25degF to liquify
Note: Heat recovery not accounted for.
Summary of Thermodynamic Analysis
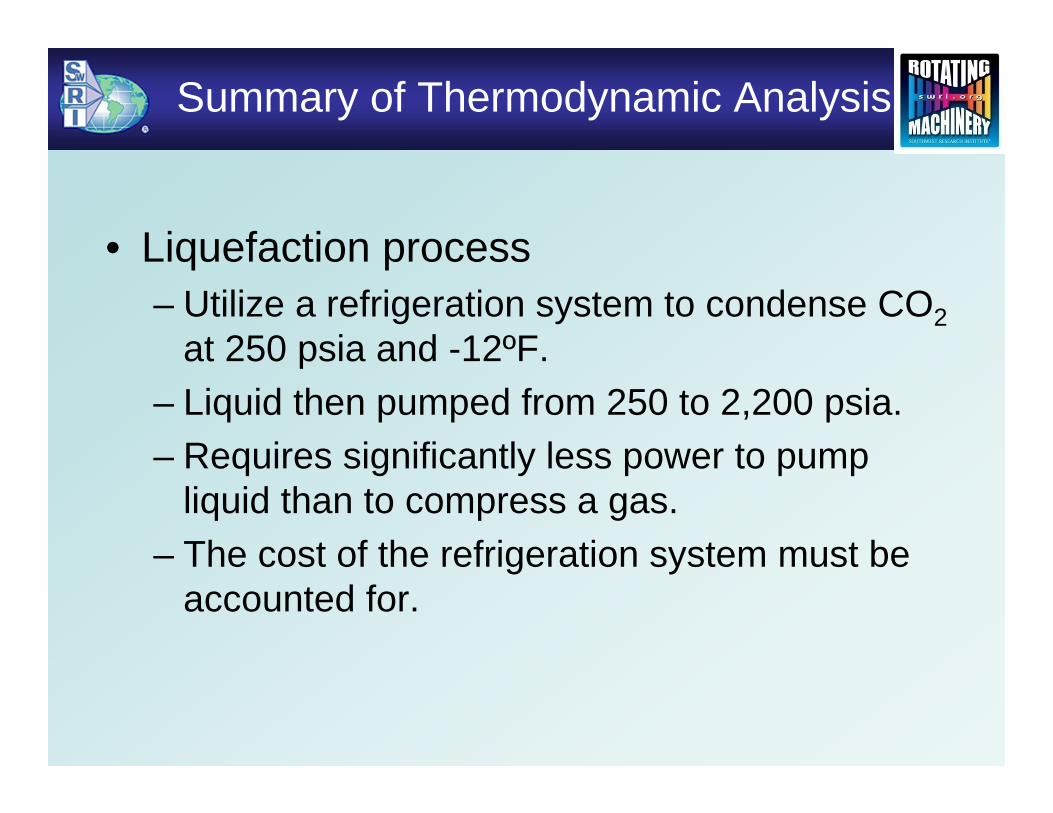
• Liquefaction process– Utilize a refrigeration system to condense CO2
at 250 psia and -12ºF.– Liquid then pumped from 250 to 2,200 psia.– Requires significantly less power to pump
liquid than to compress a gas.– The cost of the refrigeration system must be
accounted for.
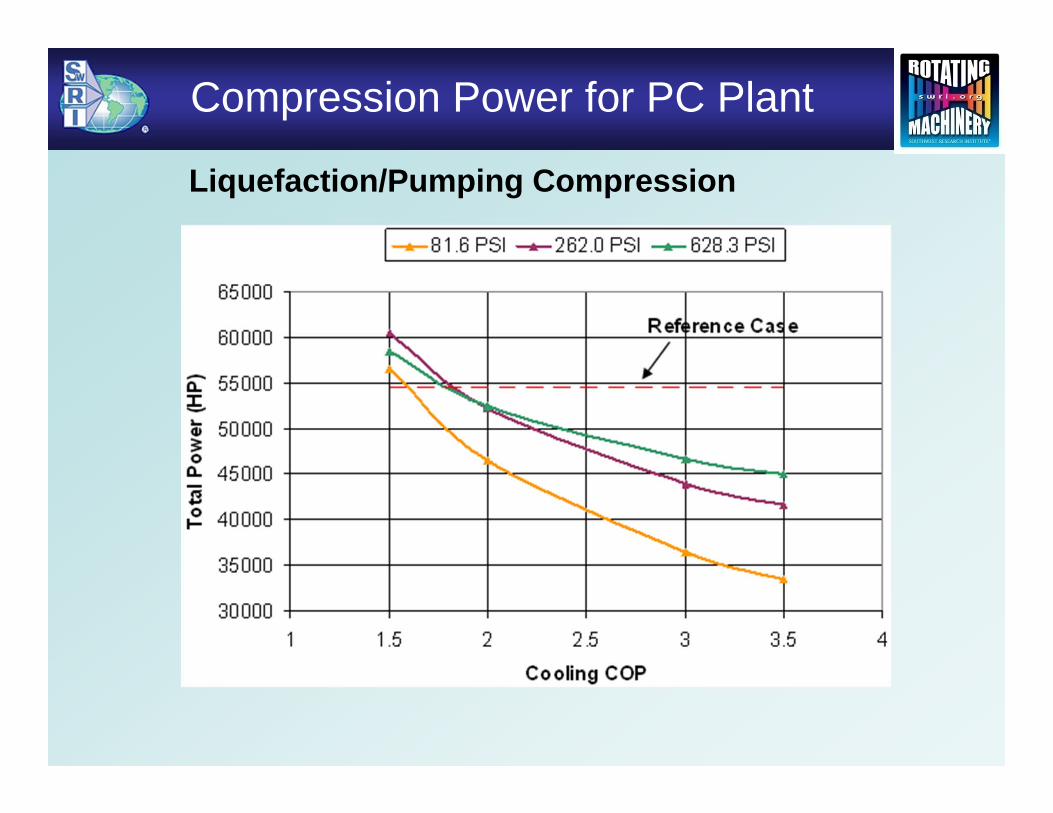
Compression Power for PC Plant
Liquefaction/Pumping Compression

Southwest Research Institute
Challenges: High Reliability
• Integrally geared can achieve near isothermal compression
• Can contain up to 12 bearings, 10 gas seals plus gearbox
• Typically driven by electric motor• Impellers spin at different rates
– Maintain optimum flow coef.
Integrally Geared Isothermal Compressor
Single-Shaft Multi-stage Centrifugal Compressor
• Multi-stage centrifugal proven reliable and used in many critical service applications currently (oil refining, LNG production, etc.)
• Fewer bearings and seals – (4 brgs & seals for 2 body train)
• Can be direct driven by steam turbine or high speed motor
Courtesy of MAN
Courtesy of Dresser-Rand

Southwest Research Institute
Project Goals
• Develop internally cooled compressor stage that:– Provides performance of an integrally geared
compressor– Has the reliability of a in-line centrifugal compressor– Reduces the overall footprint of the package– Has less pressure drop than a external intercooler
• Perform qualification testing of a refrigerated liquid CO2 pump

Southwest Research Institute
Phase 2 Project Plan
• Experimentally validate thermodynamic predictions.
• Two test programs envisaged:– Liquid CO2 pumping loop– Closed-loop CO2 compressor test with internal
cooling• Power savings will be quantified in both
tests.

Southwest Research Institute
Internally Cooled Compressor Concept
• Investigate an internally-cooled compressor concept.– Red - CO2 flow path
through compressor stage
– Blue - Liquid cooling in the diaphragm
– Grey - Solid
Courtesy of Dresser-Rand

Southwest Research Institute
Conjugate Heat Transfer CFD Model
• Predicted temperature in return channel with and without internal cooling.
Without Heat Transfer With Heat Transfer

Final DesignCase 4- Conjugate heat transfer model with enhanced heat transfer coefficients to simulate ribbed surfaces for the cooling liquid

Final Design• Conjugate heat transfer model with enhanced heat transfer coefficients to simulate ribbed surfaces for the cooling liquid• Two radius ratios shown

0
1
2
3
4
5
6
7
8
9
10
0
10
20
30
40
50
60
70
80
90
adiabatic
full conjugate model
smooth liquid‐smooth gas
ribbed
liquid‐smooth gas
ribbed
liquid‐dim
pled
gas,
smooth blades
ribbed
liquid‐dim
pled
gas,
grooved blades
ΔPressure [psi]
ΔTem
perature [
F]
Temperature Rise and Pressure Drop of CFD Models
Inlet to Stage Exit ΔTtotal
Impeller Exit to Stage Exit |ΔPtotal|
Summary of CFD Results
ΔT |ΔP|

Test Rig Construction

Closed Loop Test Facility
• Driven by 700 hp electric motor through gearbox
• Torque meter installed to measure power
• Loop rated to 300 psi suction and 500 psi discharge
• Test speeds up to 14,300 rpm

Instrumentation
Half-Shielded Thermocouple Probe
Near Impeller Exit
Combination Kiel Head Pressure/Temperature Probe at Suction and Discharge Bridge-over
• 28 Temperature Probes• 30 Pressure Measurements• Flow Rate (CO2 and Cooling)• Speed• Shaft Torque• Axial Thrust• Gas Samples Taken
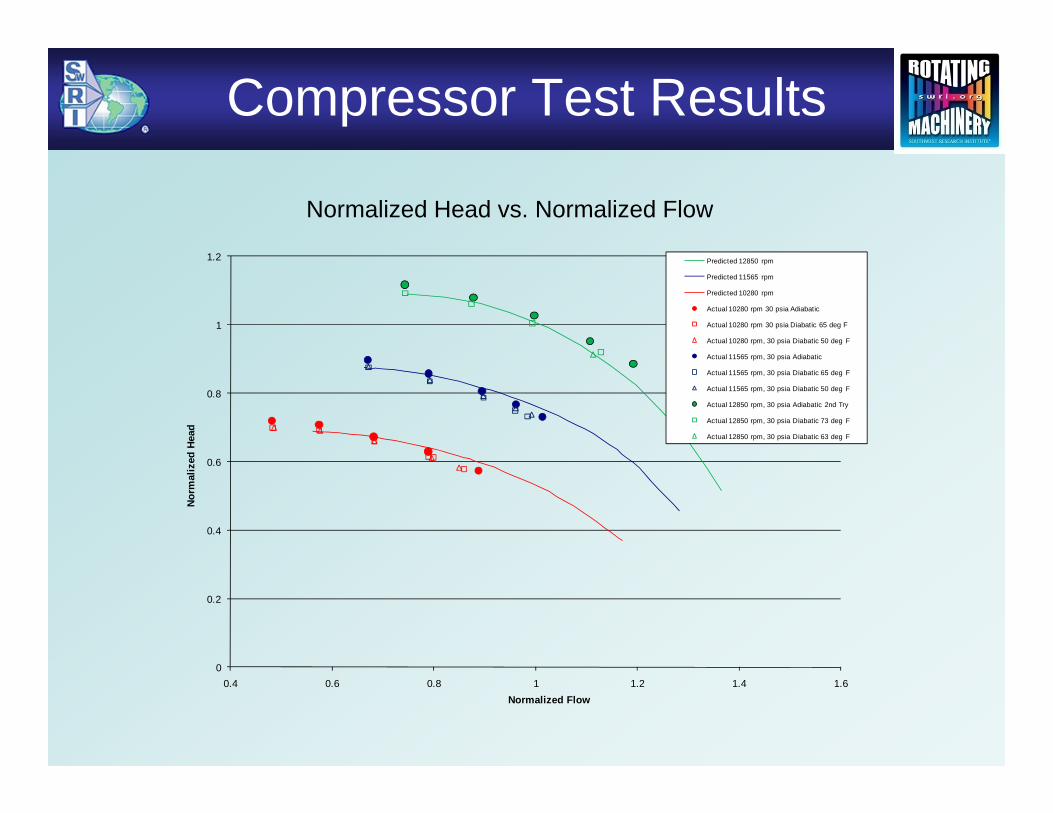
Compressor Test Results
0
0.2
0.4
0.6
0.8
1
1.2
0.4 0.6 0.8 1 1.2 1.4 1.6
Norm
aliz
ed H
ead
Normalized Flow
Predicted 12850 rpm
Predicted 11565 rpm
Predicted 10280 rpm
Actual 10280 rpm 30 psia Adiabatic
Actual 10280 rpm 30 psia Diabatic 65 deg F
Actual 10280 rpm, 30 psia Diabatic 50 deg F
Actual 11565 rpm, 30 psia Adiabatic
Actual 11565 rpm, 30 psia Diabatic 65 deg F
Actual 11565 rpm, 30 psia Diabatic 50 deg F
Actual 12850 rpm, 30 psia Adiabatic 2nd Try
Actual 12850 rpm, 30 psia Diabatic 73 deg F
Actual 12850 rpm, 30 psia Diabatic 63 deg F
Normalized Head vs. Normalized Flow

Compressor Test Results
0.7
0.8
0.9
1
1.1
1.2
1.3
0.4 0.6 0.8 1 1.2 1.4
Norm
aliz
ed P
olyt
ropi
c E
ffici
ency
Normalized Flow
Predicted 12850 rpm
Predicted 11565 rpm
Predicted 10280 rpm
Actual 10280 rpm 30 psi Adiabatic
Actual 11565 rpm, 30 psia Adiabatic
Actual 12850 rpm, 30 psia Adiabatic 2nd Try
Normalized Efficiency vs. Normalized Flow

Compressor Test Results
0.87
0.89
0.91
0.93
0.95
0.97
0.99
1.01
(Tot
al T
empe
ratu
re)
/ (Im
pelle
r Di
scha
rge
Tota
l Tem
pera
ture
)
10280 rpm, 30 psia Adiabatic 10280 rpm 30 psia Diabatic 65 deg F10280 rpm, 30 psia Diabatic 50 deg F 11565 rpm, 30 psia Adiabatic11565 rpm, 30 psia Diabatic 65 deg F 11565 rpm, 30 psia Diabatic 50 deg F11565 rpm, 60 psia Adiabatic 11565 rpm, 60 psia Diabatic 65 deg F12850 rpm, 30 psia Adiabatic 12850 rpm, 30 psia Adiabatic 2nd try12850 rpm, 30 psia Diabatic 73 deg F 12850 rpm, 60 psia Adiabatic12850 rpm, 60 psia Diabatic 70 deg F 12850 rpm, 90 psia Diabatic 77 deg F12850 rpm, 60 psia Diabatic 77 deg F 20 gpm 12850 rpm, 90 psia Diabatic 78 deg F 20 gpm
Suction Bridgeover
ImpellerExit
Diffuser Vane Exit
Return Channel Bend
Discharge Bridgeover
Normalized Temperature Throughout Stage

Compressor Test Results
Fraction of Heat Removal in the Stage
0
0.1
0.2
0.3
0.4
0.5
0.6
0.4 0.6 0.8 1 1.2 1.4 1.6 1.8
Tem
pera
ture
Red
uctio
n Ra
tio
Flow, ACFM
Actual 10280 rpm, 30 psia Diabatic 65 deg F
Actual 11565 rpm, 30 psia Diabatic 65 deg F
Actual 12850 rpm, 30 psia Diabatic 73 deg F
Actual 10280 rpm, 30 psia Diabatic 50 deg F
Actual 11565 rpm, 30 psia Diabatic 50 deg F
Actual 11565 rpm, 60 psia Diabatic 65 deg F
Actual 12850 rpm, 60 psia Diabatic 70 deg F
Actual 12850 rpm, 90 psia Diabatic 77 deg F
Actual 12850 rpm, 30 psia Diabatic 63 deg F
12850 rpm, 60 psia Diabatic 77 deg F 20 gpm
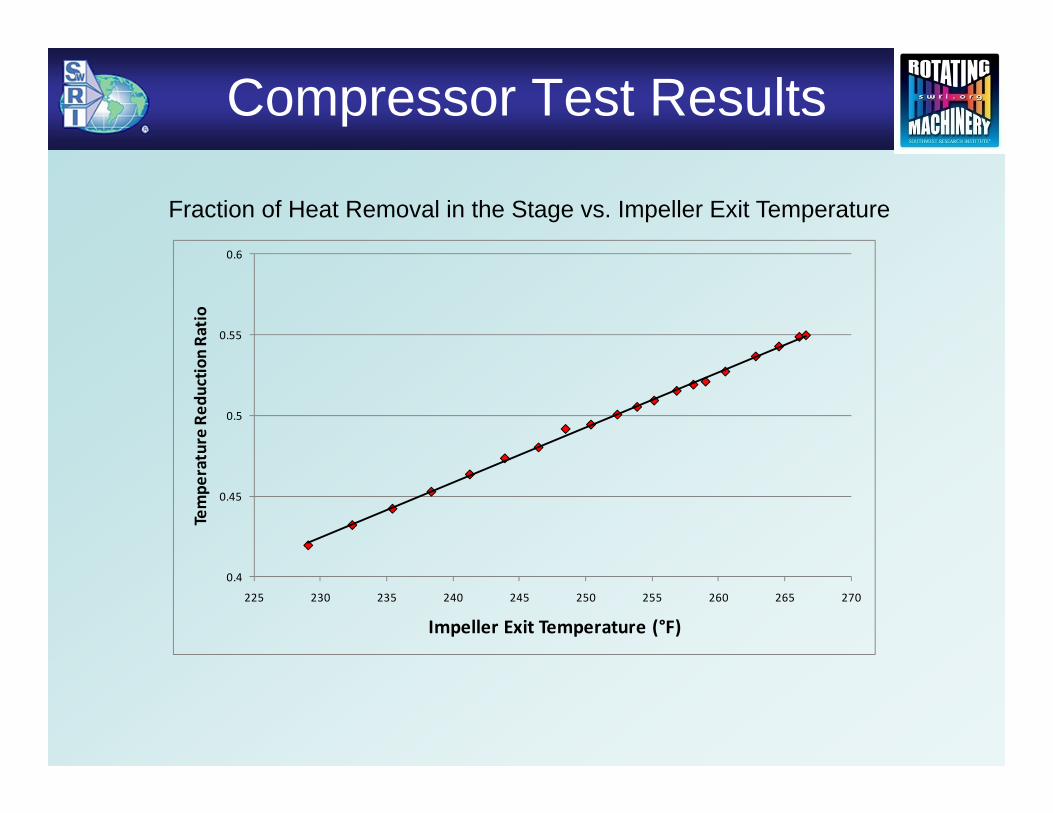
Compressor Test Results
0.4
0.45
0.5
0.55
0.6
225 230 235 240 245 250 255 260 265 270
Tempe
rature Red
uctio
n Ra
tio
Impeller Exit Temperature (°F)
Fraction of Heat Removal in the Stage vs. Impeller Exit Temperature

Comparison to Predictions
0.87
0.89
0.91
0.93
0.95
0.97
0.99
1.01
(Tot
al T
empe
ratu
re)
/ (Im
pelle
r Di
scha
rge
Tem
pera
ture
)
12850 rpm, 30 psia Adiabatic 2nd try
12850 rpm, 30 psia Diabatic 73 deg F 12 gpm
CFD 12850 rpm, 30 psia Adiabatic
CFD 12850 rpm, 30 psia Diabatic 70 deg F 20 gpm
Suction Bridgeover
ImpellerExit
Diffuser Vane Exit
Return Channel Bend
Discharge Bridgeover
Normalized Temperature Throughout Stage
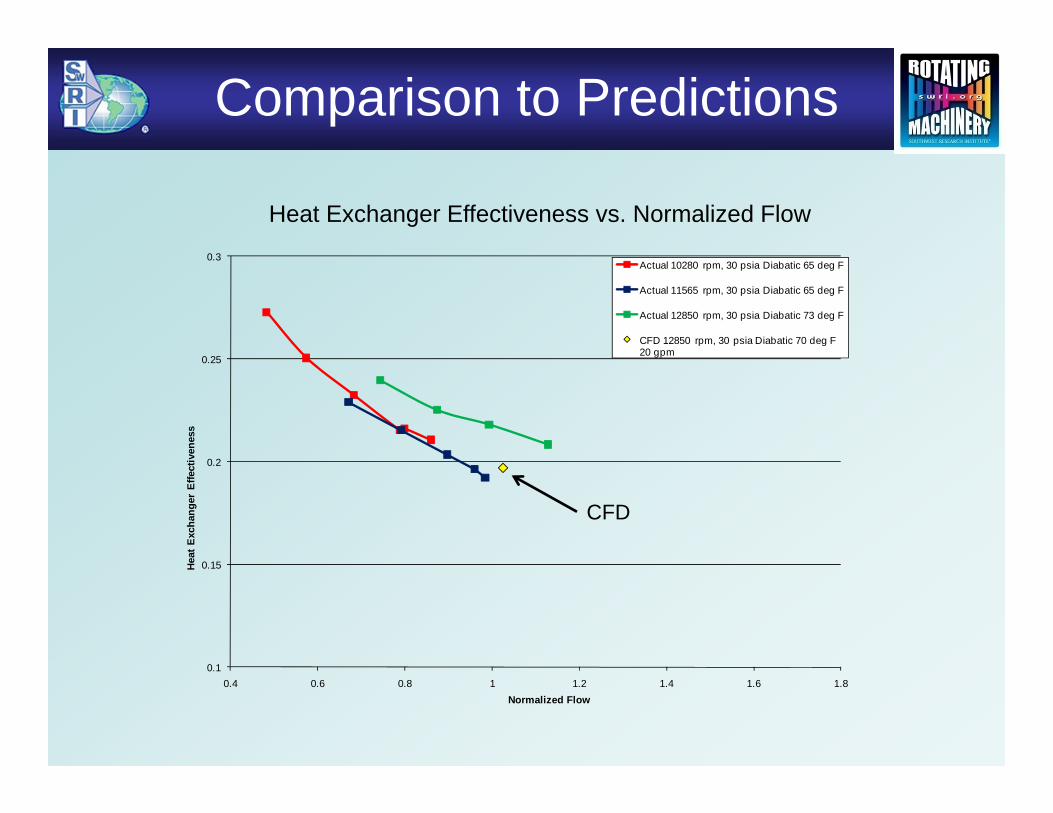
Comparison to Predictions
0.1
0.15
0.2
0.25
0.3
0.4 0.6 0.8 1 1.2 1.4 1.6 1.8
Heat
Exc
hang
er E
ffect
iven
ess
Normalized Flow
Actual 10280 rpm, 30 psia Diabatic 65 deg F
Actual 11565 rpm, 30 psia Diabatic 65 deg F
Actual 12850 rpm, 30 psia Diabatic 73 deg F
CFD 12850 rpm, 30 psia Diabatic 70 deg F 20 gpm
CFD
Heat Exchanger Effectiveness vs. Normalized Flow

Cryogenic Turbopump Validation Testing

Liquid CO2 Pumping Pilot Scale Testing
• Testing will measure pump efficiency • Validate pump design• Measure NPSH requirements looking for signs of cavitation• An industrial pump manufacturer supplied the pump
– 250 KW, 100 gpm, 53,000 lbm/hr
Motor
Valve
GB CO2Pump
Knock-out Drum
Tank

• Vessel layout showing elevated reservoir and knock-out drum
• Pump is mounted at ground level.
• Orifice run located between pump and control valve (in supercritical regime)
Liquid CO2 Loop Design
Pump
SeparatorReceiver

Pump Loop Construction
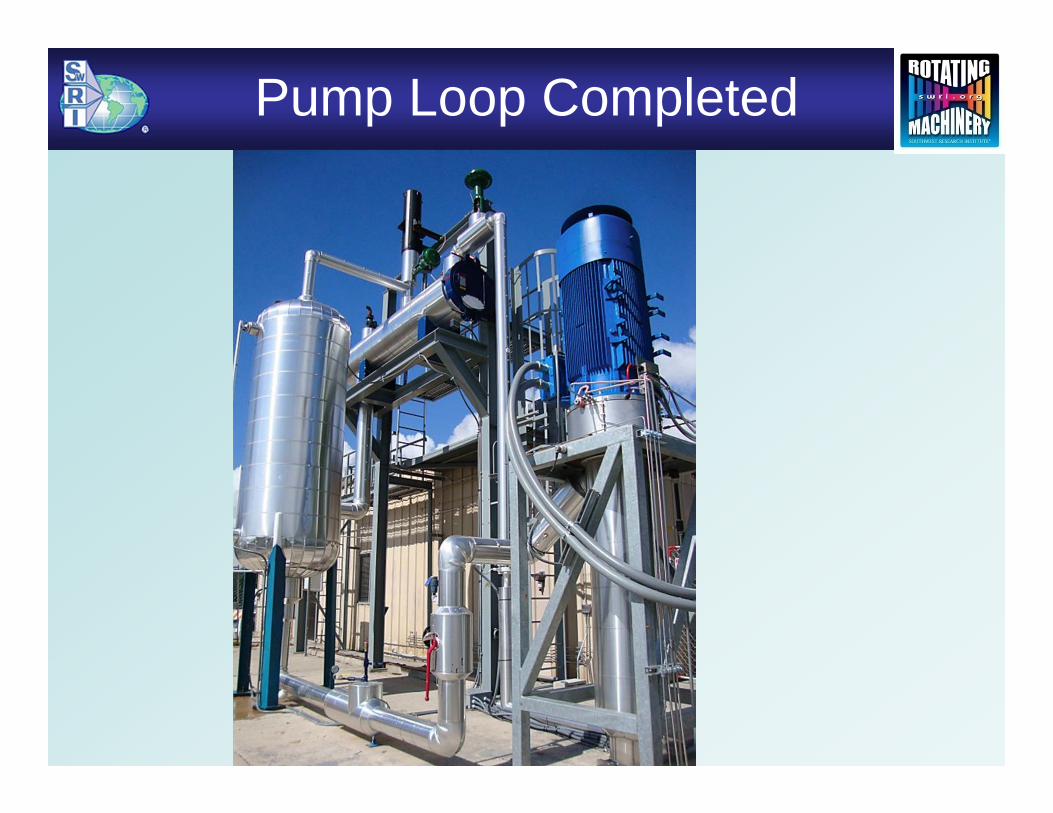
Pump Loop Completed

Data Acquisition Code

Test Results
0.00
500.00
1000.00
1500.00
2000.00
2500.00
3000.00
3500.00
4000.00
4500.00
5000.00
0.00 20.00 40.00 60.00 80.00 100.00 120.00 140.00 160.00 180.00
Head, ft
Flow, GPM
1578 RPM Predicted
2500 RPM Predicted
3510 RPM Predicted
Test 1 1578 RPM
Test 1 2500 RPM
Test 1 3510 RPM
Test 2 1520 RPM
Test 2 2500 RPM
Test 2 3510 RPM

Test Results
0.00%
10.00%
20.00%
30.00%
40.00%
50.00%
60.00%
0 20 40 60 80 100 120 140 160 180
Efficiency
Flow, GPM
Cryostar Prediction 3510 RPM
6‐24‐2010 Measured Data 3510 RPM
7‐9‐2010 Measured Data 3510 RPM
6‐24‐2010 Measured Data 2500 RPM
7‐9‐2010 Measured Data 2500 RPM

Dynamic Data – Design Point
Suction Dynamic PressureCasing Vibration - X
Casing Vibration - Y

Dynamic Data – Minimum Flow Point
Suction Dynamic PressureCasing Vibration - X
Casing Vibration - YSubsynchronousComponent
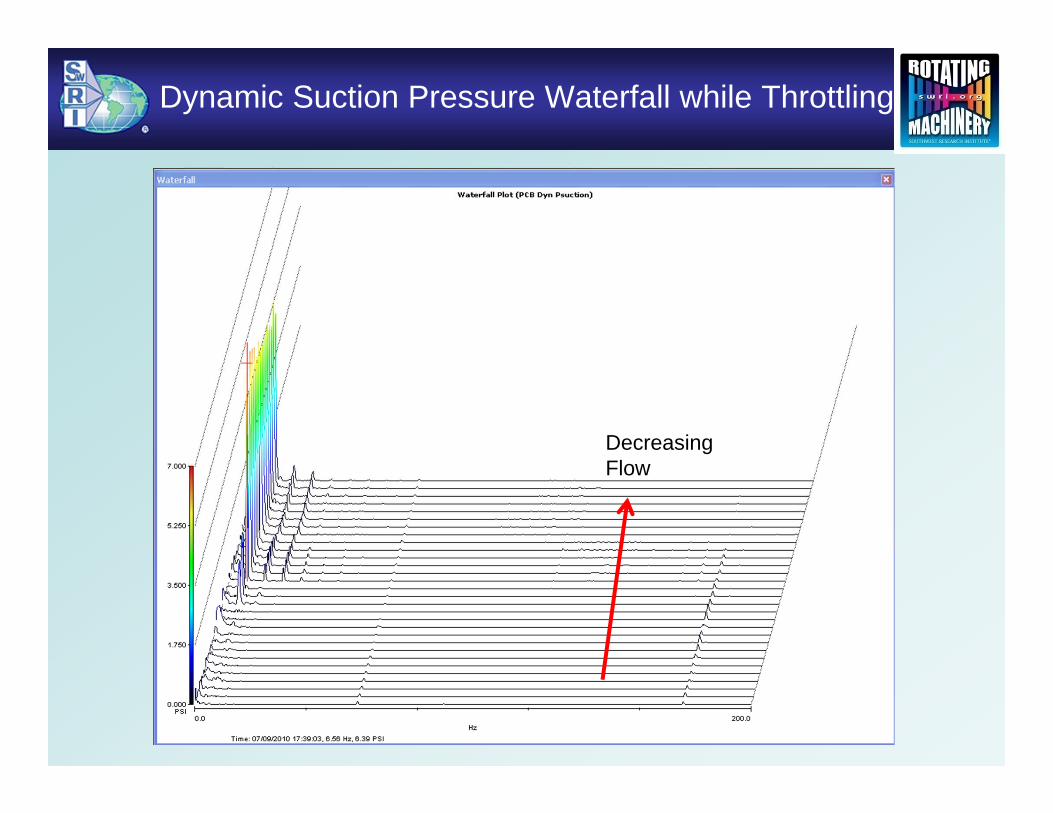
Dynamic Suction Pressure Waterfall while Throttling
DecreasingFlow

Phase 2 Testing Summary
• Compressor Testing– Testing performed for a range of speeds, flows, suction pressure,
suction temperature, cooling water flow and temperature– Testing performed both adiabatic and diabatic (with cooling)– Results show cooled diaphragm can remove up to 55% of the heat of
compression in each stage– Heat removal improves in latter stages of a multi-stage compressor– Over 20% reduction in power is possible for a multi-stage application
• Pump Testing– Pump performed match the measured performance during factory
testing on LN2– Met discharge pressure goals– LCO2 introduced no mechanical issues for the pump– Vibration levels were acceptable– A subsynchronous vibration occurred at minimum flow point but only at
very low flow rates• Both Technologies are Ready for Pilot Plant Demonstration
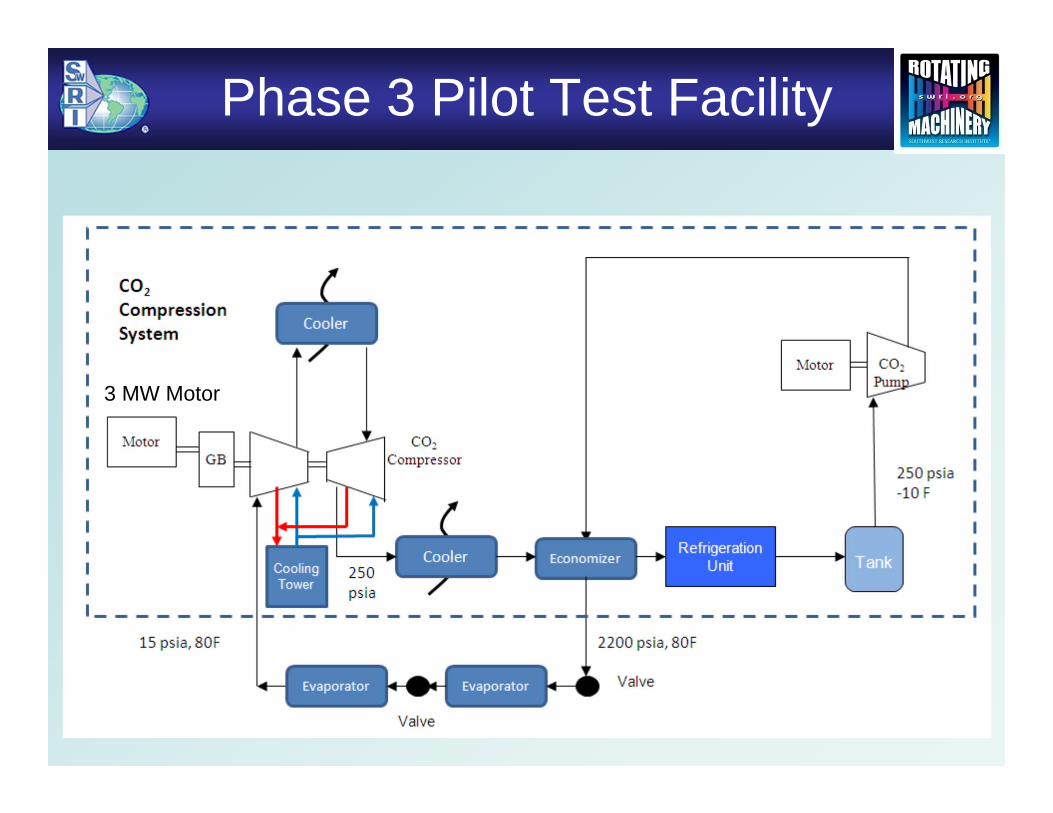
Phase 3 Pilot Test Facility
3 MW Motor
Phase 3 Proposal
• Deliverables:– The cooled diaphragm concept will be extended to a multi-stage
design. Many design challenges remain to mature the design for commercialization. Since the cooled diaphragm concept works by reducing the power required in the downstream stages, actual power reduction will be measured.
– The refrigeration system, including an economizer, will be designed and tested. The actual power required for the refrigeration system will be quantified. The effect of entrained gases found in actual carbon capture and sequestration applications will be tested by injecting nitrogen upstream of the liquefaction process and separating this gas.
– The system dynamics and interaction between the compressor and the pump will be measured, including required recycle lines.
– An overall power balance will be measured, including all coolers and chillers.