Advance Real State GDP Statistics for 2017 · 2018-08-24 · Real state GDP gre w 2.1 percent on...
22
June 2018 Volume 98, Number 6 The statistics discussed in this Regional Quarterly Report include the following: (1) advance real state gross domestic product (GDP) statistics for 2017 and revised GDP statistics for 2014–2016, (2) regional price parities and real per capita personal income for 2016, and (3) Arts and Cultural Production Satellite Account statistics for 2015 and updated statistics for 2013 and 2014. For the first time, the Bureau of Economic Analysis included state-level statistics for value added by arts and cultural industries for 2001 to 2015. David G. Lenze prepared the section on real GDP by state, Bryan M. Vengelen and Krishna Parajuli prepared the section on regional price parities, and Nayana Kollanthara and David Guo prepared the section on the Arts and Cultural Production Satellite Account. Advance Real State GDP Statistics for 2017 Real state GDP grew 2.1 percent on average in 2017, ranging from 4.4 percent in the state of Washington to –0.2 percent in Connecticut and Louisiana according to the advance estimates of GDP by state. Washington’s growth rate accelerated in 2017 from its trend growth rate of 3.3 percent (the average annual percent change from 2011 to 2016). In both periods (2017 and 2011–2016), Washington grew at a faster pace than the nation (table 1) (the average annual growth rate from 2011 to 2016 for the United States was 2.0 percent). Retail trade contributed 1.4 percentage points to Washington’s real GDP growth rate in 2017, and information services contributed 1.0 percentage point. These industries each contributed 0.2 percentage point to growth nationally. California, Florida, Texas, and six other states also grew faster than the nation in both periods.
Transcript of Advance Real State GDP Statistics for 2017 · 2018-08-24 · Real state GDP gre w 2.1 percent on...

June2018 Volume98,Number6
The statistics discussed in thisRegionalQuarterlyReport include the following: (1) advance realstategrossdomesticproduct (GDP)statistics for2017andrevisedGDPstatistics for2014–2016,(2)regionalpriceparitiesandrealpercapitapersonalincomefor2016,and(3)ArtsandCulturalProductionSatelliteAccountstatisticsfor2015andupdatedstatisticsfor2013and2014.Forthefirst time, theBureauofEconomicAnalysis included state-level statistics forvalueaddedbyartsandculturalindustriesfor2001to2015.
DavidG.LenzepreparedthesectiononrealGDPbystate,BryanM.VengelenandKrishnaParajulipreparedthesectiononregionalpriceparities,andNayanaKollantharaandDavidGuopreparedthesectionontheArtsandCulturalProductionSatelliteAccount.
AdvanceRealStateGDPStatisticsfor2017Real state GDP grew 2.1 percent on average in 2017, ranging from 4.4 percent in the state ofWashingtonto–0.2percentinConnecticutandLouisianaaccordingtotheadvanceestimatesofGDPbystate.Washington’sgrowthrateaccelerated in2017 from its trendgrowthrateof3.3percent(theaverageannualpercentchangefrom2011to2016). Inbothperiods(2017and2011–2016),Washingtongrewata fasterpacethanthenation(table1)(theaverageannualgrowthrate from2011to2016fortheUnitedStateswas2.0percent).Retailtradecontributed1.4percentagepointstoWashington’srealGDPgrowthratein2017,andinformationservicescontributed1.0percentagepoint. These industries each contributed 0.2 percentage point to growth nationally. California,Florida,Texas,andsixotherstatesalsogrewfasterthanthenationinbothperiods.

New York and 26 other states grew slower than the United States in both periods. Notably, thedecline in Connecticut’s and Louisiana’s real GDP in 2017was a continuation of the declines inthosestatesoverthepreviousfiveyears.Thefinance,management,andstateandlocalgovernmentindustriesinConnecticutreducedrealGDPgrowthin2017by0.8percentagepoint. InLouisiana,nondurablegoodsmanufacturingsubtracted0.9percentagepointfromrealGDPgrowth.1

Table1.RealGrossDomesticProduct(GDP)byState[Percentchangeatannualrates]
States 2011to2016 2016to2017FasterthanU.S.growthinboth2011–2016and2016–2017
California 3.4 3.0Colorado 3.0 3.6Florida 2.5 2.2Georgia 2.4 2.7Idaho 2.3 2.7SouthCarolina 2.1 2.3Tennessee 2.5 2.5Texas 3.6 2.6Utah 3.0 3.1Washington 3.3 4.4
SlowerthanU.S.growthinboth2011–2016and2016–2017 Alabama 0.8 1.2Alaska −1.6 0.2Arkansas 1.1 1.1Connecticut −0.3 −0.2Delaware 0.9 1.6Hawaii 1.8 1.7Illinois 1.1 1.2Kansas 1.2 −0.1Kentucky 0.7 1.8Louisiana −0.1 −0.2Maine 0.7 1.4Maryland 1.2 1.5Mississippi 0.8 0.3Missouri 0.8 1.1Montana 1.6 0.6NewHampshire 1.6 1.9NewJersey 1.1 0.9NewMexico 0.6 0.8NewYork 1.4 1.1Ohio 1.6 1.9Pennsylvania 1.8 1.8RhodeIsland 0.8 1.6SouthDakota 1.0 0.3Vermont 0.5 1.1Virginia 0.6 2.0Wisconsin 1.6 1.7Wyoming −0.9 2.0
Otherstates Arizona 1.7 3.2Indiana 1.6 2.1Iowa 2.8 0.5Massachusetts 1.7 2.6Michigan 1.9 2.3Minnesota 2.0 1.9Nebraska 2.0 0.6Nevada 1.4 3.5NorthCarolina 1.5 2.3NorthDakota 4.4 1.0Oklahoma 2.9 0.5Oregon 0.9 2.5WestVirginia −0.2 2.6
Note.TheUnitedStatesgrew2.0percent(2011–2016)and2.1percent(2016–2017).
RevisedGDPstatisticsfor2014–2016The advance state GDP statistics for 2017 are based primarily on the national GDP statistics byindustry and BEA estimates of earnings by state and industry. Substantially richer state sourcedataarenowavailable forearlieryearsandhavebeen incorporated in revisedGDPstatistics for2014–2016. In addition to a disaggregation by industry, the state GDP statistics for 2014–2016showthedistributionofincomefromproductiontolabor(compensation),capital(grossoperatingsurplus),andgovernment(taxesonproductionandimportslesssubsidies).
Nominal GDP fell in 6 states in 2016—North Dakota (5.2 percent), Oklahoma (4.3 percent),Wyoming(3.9percent),Alaska(3.6percent),Louisiana(1.8percent),andTexas(0.6percent)(table2).RealGDP fell in thosestatesaswellas inDelaware(1.0percent),WestVirginia (0.8percent),Connecticut(0.3percent),andNewMexico(0.1percent).
2

InAlaska,taxesonproductionandimportsaccountedforalmosthalfofthedeclineinnominalGDPin2016(table3),reflectingareductionintaxreceiptsfromtheminingindustry.InAlaska’sminingindustry, taxes on production and imports fell $933 million, gross operating surplus fell $603million,andcompensationofemployeesfell$514millionin2016.
InOklahoma,NorthDakota,andLouisiana,incontrast,grossoperatingsurplusaccountedformostof the decline in nominal GDP. In Oklahoma, for example, GDP fell $8.1 billion, gross operatingsurplus fell $6.8 billion, and compensation of employees fell $1.5 billion in 2016. Taxes onproductionandimportsrose$0.2billion(table3).
InTexas,compensationgrew$10.1billionandtaxesonproductionandimportsrose$3.0billionin2016. Nevertheless, nominal GDP fell $10.4 billion because of a $23.4 billion decline in grossoperating surplus. In themining industry alone, gross operating surplus fell $33.5 billion. Texasaccountedfor43percentofU.S.miningGDPin2016.
Thedecline inWyoming’sGDPwas accounted forby compensation andgross operating surplus:GDP fell $1.5 billion, compensation fell $0.8 billion, and gross operating surplus fell $0.7 billion;taxesonproductionandimportslesssubsidieswereessentiallyunchanged.

Table2.GrossDomesticProductbyState[Percentchange]
Nominal Real
2015 2016 2015 2016UnitedStates 4.0 2.8 2.7 1.5Alabama 3.0 2.2 1.2 1.1Alaska −9.9 −3.6 −1.6 −3.6Arizona 4.4 3.8 2.1 2.0Arkansas 1.0 1.8 0.4 1.0California 6.4 4.4 4.6 3.0Colorado 3.3 2.6 3.6 1.4Connecticut 3.6 1.4 1.1 −0.3Delaware 5.4 1.5 3.0 −1.0DistrictofColumbia 4.5 3.4 1.9 1.5Florida 6.8 4.4 4.2 2.6Georgia 5.5 5.3 3.0 3.4Hawaii 6.3 3.7 3.6 2.0Idaho 3.7 4.5 2.6 3.5Illinois 3.6 2.4 1.2 0.9Indiana 2.3 3.5 0.0 2.6Iowa 5.3 3.2 3.8 2.1Kansas 2.2 2.1 1.4 1.7Kentucky 2.7 2.5 0.5 1.1Louisiana −0.7 −1.8 1.1 −0.4Maine 3.2 3.9 0.6 2.0Maryland 4.0 4.3 1.5 2.5Massachusetts 6.7 3.1 4.0 1.2Michigan 5.6 3.5 2.6 1.9Minnesota 2.7 3.8 0.8 2.7Mississippi 1.6 2.7 0.1 2.0Missouri 3.3 1.8 0.9 0.2Montana 2.4 0.6 2.9 0.7Nebraska 3.5 2.4 2.5 1.9Nevada 6.8 4.3 4.1 2.1NewHampshire 5.4 3.6 2.9 2.0NewJersey 3.8 2.2 1.3 0.6NewMexico −1.7 0.3 1.6 −0.1NewYork 4.8 2.9 2.0 0.5NorthCarolina 5.6 3.2 2.8 1.2NorthDakota −5.5 −5.2 −2.5 −4.9Ohio 2.7 2.1 1.0 0.8Oklahoma −4.5 −4.3 2.9 −3.8Oregon 6.8 5.1 4.8 3.8Pennsylvania 3.5 2.0 2.6 0.9RhodeIsland 4.6 2.3 1.9 0.5SouthCarolina 6.1 4.0 3.2 2.2SouthDakota 3.5 3.0 2.5 1.6Tennessee 6.2 4.7 3.3 2.8Texas −0.1 −0.6 4.4 −0.4Utah 6.0 5.3 4.2 3.3Vermont 3.0 3.3 0.7 1.5Virginia 4.4 2.4 1.8 0.5Washington 6.1 5.2 3.8 3.9WestVirginia −1.6 0.0 0.2 −0.8Wisconsin 4.3 3.4 1.9 1.9Wyoming −4.9 −3.9 1.2 −3.4
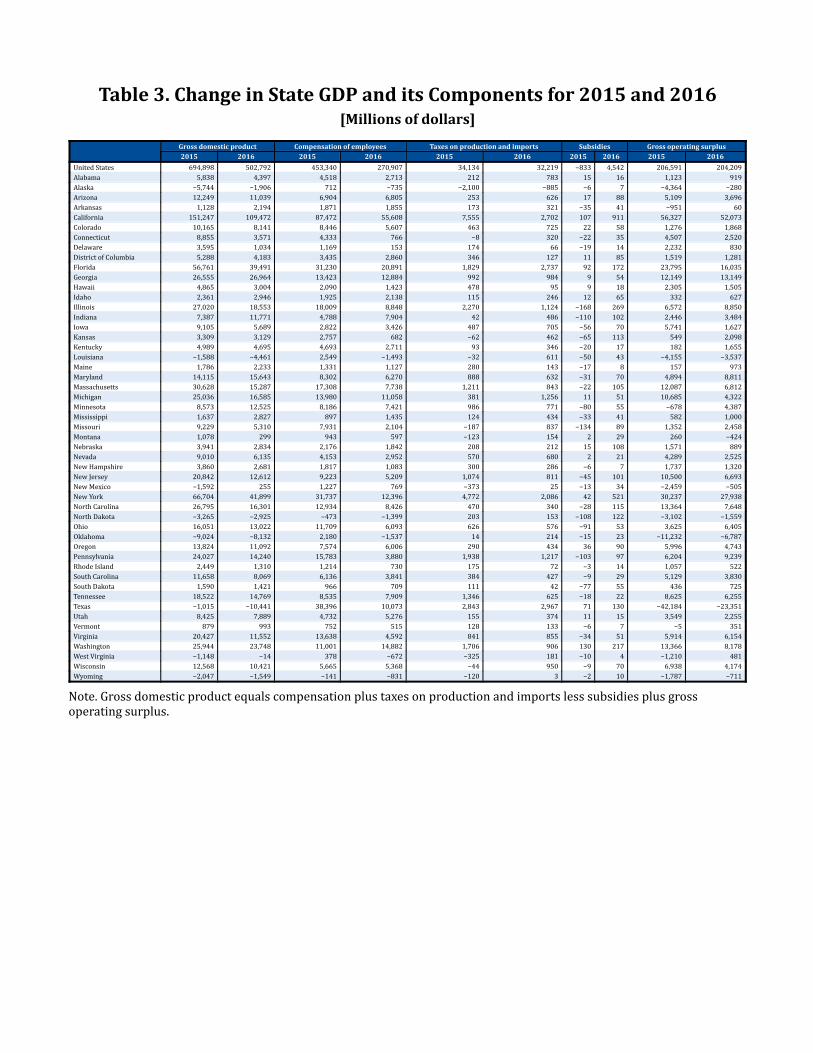
Table3.ChangeinStateGDPanditsComponentsfor2015and2016[Millionsofdollars]
Grossdomesticproduct Compensationofemployees Taxesonproductionandimports Subsidies Grossoperatingsurplus2015 2016 2015 2016 2015 2016 2015 2016 2015 2016
UnitedStates 694,898 502,792 453,340 270,907 34,134 32,219 −833 4,542 206,591 204,209Alabama 5,838 4,397 4,518 2,713 212 783 15 16 1,123 919Alaska −5,744 −1,906 712 −735 −2,100 −885 −6 7 −4,364 −280Arizona 12,249 11,039 6,904 6,805 253 626 17 88 5,109 3,696Arkansas 1,128 2,194 1,871 1,855 173 321 −35 41 −951 60California 151,247 109,472 87,472 55,608 7,555 2,702 107 911 56,327 52,073Colorado 10,165 8,141 8,446 5,607 463 725 22 58 1,276 1,868Connecticut 8,855 3,571 4,333 766 −8 320 −22 35 4,507 2,520Delaware 3,595 1,034 1,169 153 174 66 −19 14 2,232 830DistrictofColumbia 5,288 4,183 3,435 2,860 346 127 11 85 1,519 1,281Florida 56,761 39,491 31,230 20,891 1,829 2,737 92 172 23,795 16,035Georgia 26,555 26,964 13,423 12,884 992 984 9 54 12,149 13,149Hawaii 4,865 3,004 2,090 1,423 478 95 9 18 2,305 1,505Idaho 2,361 2,946 1,925 2,138 115 246 12 65 332 627Illinois 27,020 18,553 18,009 8,848 2,270 1,124 −168 269 6,572 8,850Indiana 7,387 11,771 4,788 7,904 42 486 −110 102 2,446 3,484Iowa 9,105 5,689 2,822 3,426 487 705 −56 70 5,741 1,627Kansas 3,309 3,129 2,757 682 −62 462 −65 113 549 2,098Kentucky 4,989 4,695 4,693 2,711 93 346 −20 17 182 1,655Louisiana −1,588 −4,461 2,549 −1,493 −32 611 −50 43 −4,155 −3,537Maine 1,786 2,233 1,331 1,127 280 143 −17 8 157 973Maryland 14,115 15,643 8,302 6,270 888 632 −31 70 4,894 8,811Massachusetts 30,628 15,287 17,308 7,738 1,211 843 −22 105 12,087 6,812Michigan 25,036 16,585 13,980 11,058 381 1,256 11 51 10,685 4,322Minnesota 8,573 12,525 8,186 7,421 986 771 −80 55 −678 4,387Mississippi 1,637 2,827 897 1,435 124 434 −33 41 582 1,000Missouri 9,229 5,310 7,931 2,104 −187 837 −134 89 1,352 2,458Montana 1,078 299 943 597 −123 154 2 29 260 −424Nebraska 3,941 2,834 2,176 1,842 208 212 15 108 1,571 889Nevada 9,010 6,135 4,153 2,952 570 680 2 21 4,289 2,525NewHampshire 3,860 2,681 1,817 1,083 300 286 −6 7 1,737 1,320NewJersey 20,842 12,612 9,223 5,209 1,074 811 −45 101 10,500 6,693NewMexico −1,592 255 1,227 769 −373 25 −13 34 −2,459 −505NewYork 66,704 41,899 31,737 12,396 4,772 2,086 42 521 30,237 27,938NorthCarolina 26,795 16,301 12,934 8,426 470 340 −28 115 13,364 7,648NorthDakota −3,265 −2,925 −473 −1,399 203 153 −108 122 −3,102 −1,559Ohio 16,051 13,022 11,709 6,093 626 576 −91 53 3,625 6,405Oklahoma −9,024 −8,132 2,180 −1,537 14 214 −15 23 −11,232 −6,787Oregon 13,824 11,092 7,574 6,006 290 434 36 90 5,996 4,743Pennsylvania 24,027 14,240 15,783 3,880 1,938 1,217 −103 97 6,204 9,239RhodeIsland 2,449 1,310 1,214 730 175 72 −3 14 1,057 522SouthCarolina 11,658 8,069 6,136 3,841 384 427 −9 29 5,129 3,830SouthDakota 1,590 1,421 966 709 111 42 −77 55 436 725Tennessee 18,522 14,769 8,535 7,909 1,346 625 −18 22 8,625 6,255Texas −1,015 −10,441 38,396 10,073 2,843 2,967 71 130 −42,184 −23,351Utah 8,425 7,889 4,732 5,276 155 374 11 15 3,549 2,255Vermont 879 993 752 515 128 133 −6 7 −5 351Virginia 20,427 11,552 13,638 4,592 841 855 −34 51 5,914 6,154Washington 25,944 23,748 11,001 14,882 1,706 906 130 217 13,366 8,178WestVirginia −1,148 −14 378 −672 −325 181 −10 4 −1,210 481Wisconsin 12,568 10,421 5,665 5,368 −44 950 −9 70 6,938 4,174Wyoming −2,047 −1,549 −141 −831 −120 3 −2 10 −1,787 −711
Note.Grossdomesticproductequalscompensationplustaxesonproductionandimportslesssubsidiesplusgrossoperatingsurplus.

NewsourcedataThe updated state GDP estimates reflect the incorporation of newly available and revised statesource data. The major source data incorporated as part of this year’s annual update aresummarizedintable4;additionalinformationisprovidedinthestateGDPmethodologyontheBEAwebsite.
The estimates of compensation of employees and gross operating surplus now incorporate theannual update of the state personal income statistics released in September 2017. Among otherthings,thatupdateincorporated(1)completeQuarterlyCensusofEmploymentandWages(QCEW)data for2016 from theBureauofLaborStatistics (BLS) into compensationand (2)new InternalRevenueService(IRS)data for2015forthe incomeofsoleproprietorshipsandpartnershipsandforrentalincomeofpersons(componentsofgrossoperatingsurplus).
Theestimatesoftaxesonproductionandimportsnowincorporatestategovernmentfinancedata(includinggeneralsalesandgrossreceiptstaxes)forfiscalyear2016fromtheCensusBureau.
Other estimates incorporate new oil, gas, and coal production and price data for 2016 from theEnergy InformationAdministration, valueaddeddata for2016 from theCensusBureau’sAnnualSurveyofManufactures,airtransportationfinancedataandrailroadfreightton–milesdatafor2016from the Department of Transportation, income and expense data for 2016 from the FederalDeposit Insurance Corporation (FDIC), and premium and loss data for 2016 from the NationalAssociationofInsuranceCommissioners(NAIC).
In general, for the goods producing industries, GDP, compensation, taxes on production andimports,andsubsidiesareestimatedwhilegrossoperatingsurplusisderivedasaresidual.Fortheservicesproducingindustries,however,grossoperatingsurplusisestimatedandGDPisderivedasthesumofthefourcomponents.
3

BEADODDOIDOTEIAFDICFHLBBFRBNAICNARPOTSUSDAUSGS
Table4.MajorNeworRevisedStateSourceDataIncorporatedinGrossDomesticProduct(GDP)byState
Goods-producingindustriesComponent SourcedataGrossdomesticproduct
FarmincomeandexpensesfromUSDA;oil,gasproductionandprices,coalreportsfromEIA;mineraldatafromUSGS;valueaddedandpayrolldatafromCensusBureau
Compensationofemployees CompensationofemployeesfromstatepersonalincomeatBEA
Taxesonproductionandimports
Governmentfinancedata,taxrevenuedata,buildingpermitsfromCensusBureau;individualstate’sdepartmentsofrevenueand/orfinance;coalminepriceandproduction,refinerycapacityfromEIA;federallandusagefromDOI
Services-producingindustriesComponent SourcedataCompensationofemployees CompensationofemployeesfromstatepersonalincomeatBEA
Taxesonproductionandimports
Governmentfinance,taxrevenuefromCensusBureau;individualstate’sdepartmentsofrevenueand/orfinance;nuclearpowergeneration,aviationdata fromEIA;air freightdata,highwayusagedata fromDOT;assessmentdatafromFRB;mineralleases,revenues,rents,androyaltiesdatafromDOI
Grossoperatingsurplus
Proprietors’incomefromstatepersonalincomeatBEA;electricityrevenue,naturalgasdeliverydatafromEIA;receipts, revenue, and payroll data from Census Bureau; transportation finance, passengers, and freight datafrom DOT; rail profits, interest, depreciation data from Amtrak; rail passenger data from NARP; income andexpensesfromFDIC,FRB,OTS,andFHLBB;premiumsandlossesfromNAIC;IndiangamingrevenuedatafromCasinoCityPress;mortgageactivitydatafromInsideMortgageFinancePublications;governmentfinancedatafromCensusBureautoestimatesurplus/deficitofgovernmententerprises
BureauofEconomicAnalysisU.SDepartmentofDefenseU.S.DepartmentofInteriorU.S.DepartmentofTransportationEnergyInformationAdministration,U.S.DepartmentofEnergyFederalDepositInsuranceCorporationFederalHomeLoanBankBoardFederalReserveBankNationalAssociationofInsuranceCommissionersNationalAssociationofRailroadPassengersOfficeofThriftSupervisionU.SDepartmentofAgricultureU.S.GeologicalSurvey
RegionalPriceParitiesandRealPerCapitaPersonalIncome,2016
RegionalpriceparitiesInMay2018,theBureauofEconomicAnalysis(BEA)released2016regionalpriceparities(RPPs)forstatesandmetropolitanstatisticalareas(MSAs). RPPsprovideameasureofthedifferencesinpricelevelsacrosseachstateandMSArelativetothenationalaverageforaspecificyear. Foreach
4
5

area, BEA publishes an all items RPP that covers all consumption goods and services and threecomponentRPPsthatcovergoods,rents,andotherservices—allofwhichareindexedtotheU.S.allitemsRPP.
States
StateallitemsRPPsfor2016rangedfrom118.4for Hawaii to 86.4 for Mississippi (table 5).Hawaii’sprice level is18.4percenthigher thanthenational price level, andMississippi’s pricelevelis13.6percentlower.Pricelevelscanalsobedirectlycomparedacrossstatesbytakingtheratio of the RPPs. Hawaii’s price level is 37.0percenthigherthanMississippi’s.
Among component RPPs, rents had thewidestrange(94.2indexpoints),from63.2inAlabamaand West Virginia to 157.4 in Hawaii. Rangeswere considerably narrower for goods RPPs(16.7 indexpoints)andotherservicesRPPs(21.9 indexpoints).ThewiderangeofrentsRPPsacrossstatesisanimportantsourceofthevariationinstateallitemsRPPs(chart1).
States with above average all items RPPs generally have rents RPPs that are higher than theothercomponentRPPs.Inaddition,theygenerallyhaveotherservicesRPPshigherthangoodsRPPs. States like California, Connecticut, Maryland, New York, New Jersey, and the District ofColumbia have higher average wages, consistent with having higher price levels for otherservices, compared with price levels for goods. Hawaii’s geographical isolation and addedtransportation anddistribution costs led to ahigherprice level for goods, comparedwith thepricelevelforotherservices.
States with below average all items RPPs have rents RPPs that are lower than the othercomponents.Additionally,thesestates’otherservicesRPPsaretypicallylowerthantheirgoodsRPPs.
6

Table5.StateRealPerCapitaPersonalIncomeandImplicitRegionalPriceDeflatorfor2015and2016andRegionalPriceParitiesfor2016
Percapitapersonalincome(dollars) Realpercapitapersonalincome(chained(2009)dollars) Implicitregionalpricedeflator Regionalpriceparities2016
2015 2016 Percentchange 2015 2016 Percentchange 2015 2016 Percentchange Allitems GoodsServices
Rents OtherUnitedStates 48,429 49,204 1.6 44,235 44,412 0.4 109.5 110.8 1.2 100.0 99.4 101.2 100.0 Alabama 38,238 38,918 1.8 40,356 40,689 0.8 94.7 95.6 1.0 86.6 96.2 63.2 93.3Alaska 56,507 55,674 −1.5 48,949 47,831 −2.3 115.4 116.4 0.9 105.4 101.1 137.5 96.6Arizona 39,731 40,546 2.1 37,889 38,265 1.0 104.9 106.0 1.0 95.9 97.4 91.8 97.2Arkansas 39,060 39,722 1.7 40,967 41,371 1.0 95.3 96.0 0.7 86.9 94.7 63.8 93.3California 54,664 56,308 3.0 44,022 44,562 1.2 124.2 126.4 1.8 114.4 103.6 148.4 106.8Colorado 51,956 52,097 0.3 46,324 45,806 −1.1 112.2 113.7 1.3 103.0 99.8 117.6 98.5Connecticut 68,155 69,094 1.4 57,380 57,554 0.3 118.8 120.1 1.1 108.7 104.5 115.3 109.1Delaware 47,069 47,837 1.6 43,036 43,223 0.4 109.4 110.7 1.2 100.2 99.1 97.1 103.2DistrictofColumbia 73,834 75,756 2.6 57,609 59,163 2.7 128.2 128.0 −0.2 115.9 105.4 145.3 110.6Florida 45,388 45,855 1.0 41,752 41,623 −0.3 108.7 110.2 1.4 99.7 98.3 106.1 97.0Georgia 41,020 42,146 2.7 40,545 41,407 2.1 101.2 101.8 0.6 92.1 96.7 81.2 94.7Hawaii 48,823 50,358 3.1 37,583 38,514 2.5 129.9 130.8 0.7 118.4 110.5 157.4 103.5Idaho 38,931 39,543 1.6 38,148 38,477 0.9 102.1 102.8 0.7 93.0 98.1 77.6 97.5Illinois 50,745 51,679 1.8 46,796 47,302 1.1 108.4 109.3 0.8 98.9 98.9 98.4 99.2Indiana 41,862 43,091 2.9 42,269 43,180 2.2 99.0 99.8 0.8 90.3 96.8 73.9 93.5Iowa 45,800 46,056 0.6 46,372 46,230 −0.3 98.8 99.6 0.8 90.2 95.2 75.1 91.8Kansas 47,009 47,221 0.5 47,483 47,221 −0.6 99.0 100.0 1.0 90.5 95.8 74.6 93.7Kentucky 38,504 38,934 1.1 39,805 40,161 0.9 96.7 96.9 0.2 87.8 94.3 67.1 93.1Louisiana 42,835 42,257 −1.3 43,315 42,337 −2.3 98.9 99.8 0.9 90.4 96.5 76.2 93.3Maine 42,875 44,094 2.8 39,772 40,570 2.0 107.8 108.7 0.8 98.4 98.5 94.4 100.5Maryland 56,197 57,972 3.2 46,879 47,936 2.3 119.9 120.9 0.8 109.5 103.4 122.0 107.0Massachusetts 62,755 64,122 2.2 53,529 53,860 0.6 117.2 119.1 1.6 107.8 101.1 122.9 105.8Michigan 43,072 44,231 2.7 42,252 42,931 1.6 101.9 103.0 1.1 93.3 97.3 81.0 96.3Minnesota 51,139 51,990 1.7 48,049 48,283 0.5 106.4 107.7 1.2 97.5 100.9 95.4 94.9Mississippi 34,804 35,524 2.1 37,007 37,222 0.6 94.0 95.4 1.5 86.4 93.8 65.0 93.3Missouri 42,406 42,939 1.3 43,325 43,445 0.3 97.9 98.8 0.9 89.5 95.3 73.1 92.6Montana 42,637 43,107 1.1 41,025 41,457 1.1 103.9 104.0 0.1 94.1 98.9 80.9 95.6Nebraska 49,572 50,016 0.9 50,052 50,043 0.0 99.0 99.9 0.9 90.5 95.6 76.2 92.0Nevada 43,128 43,579 1.0 40,461 40,510 0.1 106.6 107.6 0.9 97.4 96.1 94.7 101.1NewHampshire 54,543 55,945 2.6 47,310 47,837 1.1 115.3 116.9 1.4 105.9 100.4 118.3 104.4NewJersey 60,069 61,240 1.9 48,567 48,984 0.9 123.7 125.0 1.1 113.2 102.7 132.5 113.4NewMexico 37,938 38,393 1.2 36,910 37,145 0.6 102.8 103.4 0.6 93.6 97.0 80.2 99.8NewYork 58,324 59,289 1.7 46,281 46,416 0.3 126.0 127.7 1.3 115.6 109.0 133.2 111.6NorthCarolina 41,351 42,203 2.1 41,546 42,020 1.1 99.5 100.4 0.9 90.9 96.3 78.6 93.3NorthDakota 55,643 54,801 −1.5 55,110 54,213 −1.6 101.0 101.1 0.1 91.5 95.0 82.8 91.6Ohio 43,803 44,561 1.7 44,825 45,176 0.8 97.7 98.6 0.9 89.3 96.1 72.8 91.9Oklahoma 43,999 42,717 −2.9 44,879 43,458 −3.2 98.0 98.3 0.3 89.0 95.5 70.1 93.3Oregon 44,424 45,482 2.4 41,112 41,266 0.4 108.1 110.2 1.9 99.8 98.9 106.0 97.2Pennsylvania 49,815 50,730 1.8 46,458 46,672 0.5 107.2 108.7 1.4 98.4 99.4 88.8 102.7RhodeIsland 49,744 50,373 1.3 45,768 45,795 0.1 108.7 110.0 1.2 99.6 98.3 100.6 100.3SouthCarolina 38,802 39,527 1.9 39,362 39,613 0.6 98.6 99.8 1.2 90.3 96.7 77.1 93.3SouthDakota 47,882 48,051 0.4 49,620 49,243 −0.8 96.5 97.6 1.1 88.3 94.9 69.3 91.5Tennessee 42,156 43,338 2.8 42,980 43,496 1.2 98.1 99.6 1.5 90.2 96.2 75.8 93.3Texas 46,787 46,204 −1.2 44,211 43,148 −2.4 105.8 107.1 1.2 96.9 97.2 93.7 98.6Utah 39,775 41,018 3.1 37,657 38,142 1.3 105.6 107.5 1.8 97.3 96.7 94.3 100.3Vermont 49,002 50,084 2.2 43,830 44,611 1.8 111.8 112.3 0.4 101.6 98.4 113.2 100.3Virginia 52,189 52,941 1.4 46,544 46,856 0.7 112.1 113.0 0.8 102.3 99.6 109.7 100.8Washington 53,119 54,632 2.8 46,304 46,863 1.2 114.7 116.6 1.7 105.5 103.7 116.1 101.9WestVirginia 36,566 36,673 0.3 37,734 37,906 0.5 96.9 96.7 −0.2 87.6 94.4 63.2 94.9Wisconsin 46,025 46,809 1.7 45,202 45,679 1.1 101.8 102.5 0.7 92.8 95.9 84.8 93.4Wyoming 56,322 55,172 −2.0 53,456 51,634 −3.4 105.4 106.9 1.4 96.7 98.7 92.9 96.1 Maximum 73,834 75,756 3.2 57,609 59,163 2.7 129.9 130.8 1.9 118.4 110.5 157.4 113.4Minimum 34,804 35,524 −2.9 36,910 37,145 −3.4 94.0 95.4 −0.2 86.4 93.8 63.2 91.5Range 39,030 40,232 6.1 20,699 22,018 6.1 35.9 35.4 2.1 32.0 16.7 94.2 21.9
1.TheimplicitpricedeflatorfortheUnitedStatesisequaltothenationalpersonalconsumptionexpenditurespriceindex,withabaseof2009.
2.TheU.S.allitemsregionalpriceparityistheaveragepricelevelacrossallstatesandtheDistrictofColumbia.Note.PercapitapersonalincomeusesCensusBureaumidyearpopulationestimatesavailableasofDecember2017.
Metropolitanareas
1
2
All items RPPs for large metropolitan areas—MSAs with a 2016 population greater than 2million—rangedfrom124.7forSanFrancisco-Oakland-Hayward,CA,to89.6forCincinnati,OH-KY-IN(table6).SanFrancisco-Oakland-Hayward,CA’spricelevelis24.7percenthigherthanthenational price level, and Cincinnati, OH-KY-IN’s is 10.4 percent lower. Taking the ratio of theRPPs, San Francisco-Oakland-Hayward, CA’s price level is 39.2 percent higher thanCincinnati,OH-KY-IN’s.

Among component RPPs for large MSAs, rentshadthewidestrange(113.0indexpoints),from77.9 in Cleveland-Elyria, OH, to 190.9 in SanFrancisco-Oakland-Hayward, CA. Across largeMSAs, the ranges were considerably narrowerfor goods RPPs (16.4 index points) and otherservices RPPs (25.0 index points). Rents RPPsand other services RPPs had wider ranges forlarge MSAs, compared with states, suggestingthat price levels vary more for more detailedgeographies(tables5and6).
Aswasseenwithstates,largeMSAswithhigherall items price levels generally have other servicesRPPs that are higher than the goodsRPPs(chart2).LargeMSAswith lower-than-averageprice levelsgenerallyhaveotherservicesRPPsthatarelowerthanthegoodsRPPs.

Table6.LargeMetropolitanAreasRealPerCapitaPersonalIncomeandImplicitRegionalPriceDeflatorfor2015and2016andRegionalPrice
Paritiesfor2016
Percapitapersonalincome(dollars)
Realpercapitapersonalincome(chained(2009)dollars)
Implicitregionalpricedeflator
Regionalpriceparities2016
2015 2016 Percentchange 2015 2016 Percentchange 2015 2016 PercentchangeAllitems Goods
ServicesRents Other
UnitedStates 48,451 49,246 1.6 44,255 44,450 0.4 109.5 110.8 1.2 100.0 99.0 101.7 100.1UnitedStatesnonmetropolitanportion 37,861 38,239 1.0 39,544 39,630 0.2 95.7 96.5 0.8 87.6 93.9 63.8 93.8 Atlanta-SandySprings-Roswell,GA 45,934 47,348 3.1 43,814 44,598 1.8 104.8 106.2 1.3 96.3 98.3 93.5 95.9Austin-RoundRock,TX 51,128 51,566 0.9 47,171 46,820 −0.7 108.4 110.1 1.6 100.0 97.9 117.2 93.4Baltimore-Columbia-Towson,MD 55,468 57,189 3.1 47,360 48,393 2.2 117.1 118.2 0.9 107.2 102.8 116.0 105.2Boston-Cambridge-Newton,MA-NH 68,712 70,157 2.1 57,067 57,317 0.4 120.4 122.4 1.7 111.1 101.4 141.0 107.2Charlotte-Concord-Gastonia,NC-SC 45,609 46,679 2.3 44,798 45,297 1.1 101.8 103.0 1.2 93.5 97.4 86.5 93.4Chicago-Naperville-Elgin,IL-IN-WI 54,518 55,621 2.0 48,177 48,625 0.9 113.2 114.4 1.1 103.8 100.1 114.8 102.2Cincinnati,OH-KY-IN 47,787 48,668 1.8 48,836 49,278 0.9 97.9 98.8 0.9 89.6 94.6 78.7 90.9Cleveland-Elyria,OH 48,019 48,968 2.0 48,829 49,292 0.9 98.3 99.3 1.0 90.2 95.9 77.9 90.9Columbus,OH 46,904 47,725 1.8 46,335 46,550 0.5 101.2 102.5 1.3 93.0 96.9 84.2 93.4Dallas-FortWorth-Arlington,TX 51,062 51,099 0.1 46,868 46,270 −1.3 108.9 110.4 1.4 100.2 99.0 103.2 99.9Denver-Aurora-Lakewood,CO 57,081 56,892 −0.3 49,837 48,728 −2.2 114.5 116.8 2.0 106.0 100.8 127.9 99.3Detroit-Warren-Dearborn,MI 47,310 48,692 2.9 45,119 46,061 2.1 104.9 105.7 0.8 95.9 98.2 86.7 99.3Houston-TheWoodlands-SugarLand,TX 53,859 51,913 −3.6 48,845 46,378 −5.1 110.3 111.9 1.5 101.6 96.2 103.2 107.3Indianapolis-Carmel-Anderson,IN 48,207 49,681 3.1 47,673 48,602 1.9 101.1 102.2 1.1 92.8 97.2 83.0 93.5KansasCity,MO-KS 48,394 48,514 0.2 47,250 47,011 −0.5 102.4 103.2 0.8 93.7 96.5 82.4 97.1LasVegas-Henderson-Paradise,NV 41,915 42,284 0.9 39,216 39,247 0.1 106.9 107.7 0.7 97.8 95.4 96.5 102.0LosAngeles-LongBeach-Anaheim,CA 55,585 57,160 2.8 43,409 44,087 1.6 128.0 129.7 1.3 117.7 104.8 165.4 107.4Miami-FortLauderdale-WestPalmBeach,FL 51,454 52,210 1.5 44,034 44,037 0.0 116.9 118.6 1.5 107.6 100.6 129.4 100.9Minneapolis-St.Paul-Bloomington,MN-WI 55,599 56,723 2.0 49,894 50,311 0.8 111.4 112.7 1.2 102.3 103.9 110.1 96.7NewYork-Newark-JerseyCity,NY-NJ-PA 64,679 65,846 1.8 48,846 48,992 0.3 132.4 134.4 1.5 122.0 109.9 154.9 115.9Orlando-Kissimmee-Sanford,FL 39,337 40,169 2.1 36,907 37,210 0.8 106.6 108.0 1.3 98.0 97.9 104.8 93.4Philadelphia-Camden-Wilmington,PA-NJ-DE-MD
57,327 58,589 2.2 49,654 50,209 1.1 115.5 116.7 1.0 105.9 101.2 111.3 107.9
Phoenix-Mesa-Scottsdale,AZ 41,443 42,218 1.9 39,235 39,455 0.6 105.6 107.0 1.3 97.1 97.2 97.7 96.5Pittsburgh,PA 50,622 51,187 1.1 49,296 49,264 −0.1 102.7 103.9 1.2 94.3 98.1 78.9 98.1Portland-Vancouver-Hillsboro,OR-WA 49,217 50,489 2.6 44,660 45,034 0.8 110.2 112.1 1.7 101.7 99.0 117.7 97.5Riverside-SanBernardino-Ontario,CA 35,762 36,807 2.9 30,619 31,088 1.5 116.8 118.4 1.4 107.4 101.6 117.6 106.8Sacramento--Roseville--Arden-Arcade,CA 50,026 51,370 2.7 45,079 45,693 1.4 111.0 112.4 1.3 102.0 95.4 117.6 102.0St.Louis,MO-IL 48,876 49,519 1.3 49,347 49,480 0.3 99.0 100.1 1.1 90.8 94.3 82.7 91.4SanAntonio-NewBraunfels,TX 44,127 44,284 0.4 42,912 42,595 −0.7 102.8 104.0 1.2 94.4 97.5 90.2 93.4SanDiego-Carlsbad,CA 53,963 55,168 2.2 42,663 43,063 0.9 126.5 128.1 1.3 116.3 100.1 167.6 105.6SanFrancisco-Oakland-Hayward,CA 81,241 84,675 4.2 60,324 61,639 2.2 134.7 137.4 2.0 124.7 110.7 190.9 111.0Seattle-Tacoma-Bellevue,WA 62,883 64,553 2.7 52,574 53,003 0.8 119.6 121.8 1.8 110.5 106.3 134.0 104.0Tampa-St.Petersburg-Clearwater,FL 43,352 43,807 1.0 39,917 39,843 −0.2 108.6 109.9 1.2 99.8 96.5 103.5 101.8Washington-Arlington-Alexandria,DC-VA-MD-WV
65,155 66,733 2.4 50,150 50,861 1.4 129.9 131.2 1.0 119.1 105.4 166.4 110.7
Maximum 81,241 84,675 4.2 60,324 61,639 2.2 134.7 137.4 2.0 124.7 110.7 190.9 115.9Minimum 35,762 36,807 −3.6 30,619 31,088 −5.1 97.9 98.8 0.7 89.6 94.3 77.9 90.9Range 45,479 47,868 7.8 29,705 30,551 7.3 36.8 38.6 1.3 35.1 16.4 113.0 25.0
1.TheimplicitpricedeflatorfortheUnitedStatesisequaltothenationalpersonalconsumptionexpenditurespriceindex,withabaseof2009.
2.TheU.S.allitemsregionalpriceparityistheaveragepricelevelacrossallmetropolitanareasandtheU.S.nonmetropolitanportion.
Note.PercapitapersonalincomeusesCensusBureaumidyearpopulationestimatesavailableasofMarch2017.
PercapitapersonalincomePercapitapersonal income(PCPI) isnominalpersonal incomedividedbypopulation.EstimatingrealPCPIforstatesandMSAsrequirestwopriceadjustments.ThefirstadjustmentestimatesPCPIatRPPsbycontrollingforrelativepricedifferencesacrossregions.Thesecondadjustmentusesthenational personal consumption expenditures (PCE) price index to control for price changes overtime.Theproductofaregion’sRPPandthePCEpriceindexforagivenyearistheregion’simplicitregionalpricedeflator(IRPD).ChangeintheIRPDisanimplicitmeasureofregionalinflation.Foramore detailed example of how real PCPI is estimated, see the box “UsingRegional Price Parities(RPPs)toEstimateRealPersonalIncome.”
1
2

UsingRegionalPriceParities(RPPs)toEstimateRealPersonalIncome
AnimportantapplicationoftheRPPsistheadjustmentofconsumption-relateddatatocontrolfordifferencesinpricelevelsacrossregions.Inthisarticle,theRPPsareusedtoadjustcurrent-dollarpersonalincomeonapercapitabasis.Theadjustmentbeginsbycalculatingpersonalincomeatregionalpriceparitiesbydividingcurrent-dollarpersonalincomebytheregionalpriceparityforagivenyearandregion. Realpersonalincomeistheincomeatregionalpriceparitiesdividedbythenationalpersonalconsumptionexpenditures(PCE)priceindex. Dividingbythepopulationyieldsrealpercapitapersonalincome.Realpersonalincomeestimatesarecalculatedinchaineddollars,with2009asthereferenceyear.
TheexampleinthetableshowshowregionalpriceparitiescanbeusedinconjunctionwiththePCEpriceindextocalculaterealestimatesofregionalpersonalincome.
RealPerCapitaPersonalIncomeforHawaii,2016
Personalincome
(billionsofdollars)
Regionalpriceparities(RPPs)
Balancingfactor
Personalincomeat
RPPs(billionsofdollars)
PCEpriceindex(baseyear=2009)
Realpersonalincome(billionsofchained(2009)
dollars)
Populations(persons)
Realpercapitapersonalincome(thousandsofchained(2009)
dollars)71.9 1.184 0.997 61.0 1.10789 55.0 1,428,683 38.5
Notes.Thisarticleusescurrent-dollarstatepersonalincomeestimatesthatwerereleasedbytheBureauofEconomicAnalysisonMarch22,2018,andlocalareapersonalincomeestimatesthatwerereleasedonNovember16,2017.PersonalconsumptionexpenditurespriceindexeswerereleasedonAugust3,2017.Personalincomeistheincomereceivedbyallpersonsfromallsources.Itisthesumofnetearningsbyplaceofresidence,propertyincome,andpersonalcurrenttransferreceipts.Formoreinformation,seeStatePersonalIncomeandEmploymentandLocalAreaPersonalIncomeonBEA’swebsite.
1.Thesumacrossallregionsoftheadjustedresultsshouldequalthesumofcurrent-dollarestimates;however,smalldifferencesarise.Tocorrectthis,theadjusteddataaredividedbyabalancingfactorequaltotheratiooftheadjustedpersonalincomesumtotheunadjustedpersonalincomesum.Thesefactorsarespecifictotheregions,referenceperiod,anddataseriesbeingadjusted."
2.Theorderofadjustmentdoesnotmatter;thatis,onecouldfirstdividebythenationalpriceindexandthendividetheresultingconstantdollarsbytheRPPs.
States
Charts 3, 4, and 5 show the impact of the two adjustments for the United States, Hawaii, andMississippifor2008to2016,respectively.TheUnitedStatesshowsnodifferencebetweenthePCPIandPCPIatRPPs,becausetheU.S.allitemsRPP—theaverageacrossallstatesandcomponents—is100.0forallyears.Hawaii’s2016PCPIatRPPs($42,669)islowerthanitsPCPI($50,358)becauseithasanRPPgreaterthan100.0(table7).Aboveaveragepricelevelsyieldadownwardadjustment.By contrast, Mississippi’s 2016 PCPI at RPPs ($41,238) is higher than its PCPI ($35,524).Mississippi’s lowerprice levelyieldsanupwardadjustment.Theapplicationof theRPPsnarrowstherangeofincomesacrossstatesfrom$40,232forPCPIto$24,394forPCPIatRPPs.
1
2
ThedifferencebetweenPCPIatRPPsandrealPCPI foranystatereflects theadjustmentusingthePCEpriceindex.Charts3through5shownodifferencebetweenthePCPIatRPPsandrealPCPIinthebaseyear2009,becausethePCEpriceindexis100.0.Hawaii’s2016PCPIishigherthanitsrealPCPI($38,514).Mississippi’s2016PCPIislowerthanitsrealPCPI($37,222).Theserelationshipsholdforeveryyearfrom2008to2016,reflectingeachstate’srelativepricelevels

Table7.PerCapitaPersonalIncome,PersonalIncomeatRegionalPriceParities(RPPs),andRealPersonalIncomeforSelectStates,2016
Percapita
personalincome(currentdollars)
PercapitapersonalincomeatRPPs
(currentdollars)
Realpercapitapersonalincome
(chained(2009)dollars)UnitedStates 49,204 49,204 44,412 Hawaii 50,358 42,669 38,514Mississippi 35,524 41,238 37,222 Acrossallstates Maximum 75,756 65,547 59,163Minimum 35,524 41,153 37,145Range 40,232 24,394 22,018
Notes.RealpersonalincomedataforallstatesareavailableonBEA’swebsite.PercapitapersonalincomeusesCensusBureaumidyearpopulationestimatesavailableasofDecember2017.
and national price levels over time. Adjustingstate PCPI at RPPs with the PCE price indexnarrowstherangeto$22,018forrealPCPI.

Largemetropolitanareas
TheadjustmentprocessfortheSanFrancisco-Oakland-HaywardCA,andforCincinnati,OH-KY-IN,for2008to2016areshownincharts6and7,respectively.SanFrancisco-Oakland-Hayward,CA’s2016PCPIatRPP ($68,289) is lower than itsPCPI ($84,675)because ithasanRPPabove100.0(table8).Cincinnati,OH-KY-IN’s2016PCPIatRPPs($54,595)ishigherthanitsPCPI($48,668);itslower price level yields an upward adjustment. Across large MSAs, the application of the RPPsnarrowstherangefrom$47,868forPCPIto$33,847forPCPIatRPPs.
ThedifferencebetweenPCPIatRPPsandrealPCPIforanyMSAreflectstheadjustmentusingthePCE price index. San Francisco-Oakland-Hayward, CA’s 2016 PCPI is higher than its real PCPI($61,639).Cincinnati,OH-KY-IN’s2016PCPIislowerthanitsrealPCPI($49,278).Aswiththestateexamplesabove,theserelationshipsholdforeveryyearfrom2008to2016,reflectingtheir lowerrelativepricesandnationalpricelevelsovertime.TheapplicationofthePCEpriceindexnarrowstherangeofincomesto$30,551forrealPCPI.

Table8.PerCapitaPersonalIncome,PersonalIncomeatRegionalPriceParities(RPPs),andRealPersonalIncomeforSelectLargeMetropolitan
Areas,2016
Percapita
personalincome(currentdollars)
Percapitapersonalincomeat
RPPs(currentdollars)
Realpercapitapersonalincome
(chained(2009)dollars)
UnitedStates 49,246 49,246 44,450UnitedStatesnonmetropolitanportion 38,239 43,906 39,630 SanFrancisco-Oakland-Hayward,CA 84,675 68,289 61,639Cincinnati,OH-KY-IN 48,668 54,595 49,278 Acrosslargemetropolitanareas Maximum 84,675 68,289 61,639Minimum 36,807 34,442 31,088Range 47,868 33,847 30,551
Notes.RealpersonalincomedataforallmetropolitanareasareavailableonBEA’swebsite.PercapitapersonalincomeusesCensusBureaumidyearpopulationestimatesavailableasofMarch2017.
DataAvailability
Realpersonalincomedata,regionalpriceparities,andimplicitregionalpricedeflatorsareavailableonBEA’swebsite.Dataareavailablefor2008to2016forstates,statemetropolitanandnonmetropolitanportions,andmetropolitanareas.
Theregionalpriceparitiesfor2014and2015,releasedinJuly2016,wererevisedtoincorporateupdatedpricelevelsandexpenditureweights.Asaresult,realpersonalincomeandimplicitregionalpricedeflatorsfor2014and2015,releasedforstatesinSeptember2017andforlocalareasinNovember2017,werealsorevised.Inaddition,realpercapitapersonalincomeforstatesfor2010to2015,releasedinSeptember2017,wasrevisedtoincorporaterevisedpopulationestimates.
Forfurtherinformationaboutthesedata,[email protected].
Acknowledgments
WegratefullyacknowledgethecollaborationoftheBureauofLaborStatistics(BLS)andtheCensusBureauforallowingustoaccesstheirdata.Inparticular,wethankthestaffoftheConsumerPriceIndexprogramintheOfficeofPricesandLivingConditionsatBLSandthestaffoftheSocial,Economic,andHousingStatisticsDivisionoftheCensusBureaufortheirtechnicalandprogrammaticassistance.
1.TheBEARegionalPriceParitystatisticsarebasedinpartonrestrictedaccessConsumerPriceIndexdatafromtheBureauofLaborStatistics.TheBEAstatisticsexpressedhereinareproductsofBEAandnotBLS.
1

ArtsandCulturalProductionSatelliteAccountOnMarch6,2018, theBureauofEconomicAnalysis (BEA)releasedArtsandCulturalProductionSatelliteAccount(ACPSA)datafor2015;italsoreleasedupdateddatafor2013and2014.Withthemostrecentdatarelease,BEA, for the first time, includedstate-levelstatistics forvalueaddedbyartsandculturalindustriesfor2001to2015.
Valueaddedisdefinedasthegrossoutputofanindustryorsectorlessits intermediateinputs.Itmeasures the contribution of an industry or a sector to gross domestic product (GDP). Itsusefulnessliesinitsabilitytoprovideabroadmeasureofvaluecreatedbyaspecificsectorwithintheeconomy.
Nationally, ACPSA value added increased 6.3 percent in 2015 to $763.6 billion dollars (table 9).ACPSAvalueaddedcanbesplitintotwocategories:(1)coreartsandculturalproductionindustriesand (2) supporting arts and cultural production industries. The core industries increased 8.1percentin2015to$153.0billiondollars.Thecoreindustriesconsistofindustrieswhoseoutputisidentified as primarily contributing to arts and culture. The supporting industries increased 5.9percentin2015to$583.8billiondollars.Supportingindustriesconsistofindustrieswhoseoutputsupports the core category through publication, dissemination of the creative process, or othersupportivefunctions.

Table9.ValueAddedbyArtsandCulturalProductionIndustries[Millionsofdollars]
Industry 2014 2015 Dollarchange PercentchangeTotal 718,555 763,569 45,014 6.3Coreartsandculturalproduction 141,558 152,954 11,396 8.1
Performingarts 48,278 52,942 4,664 9.7Performingartscompanies 16,627 17,801 1,174 7.1Promotersofperformingartsandsimilarevents 9,045 10,453 1,408 15.6Agents/managersforartists 2,496 2,706 210 8.4Independentartists,writers,andperformers 20,110 21,982 1,872 9.3
Museums 5,176 5,261 85 1.6Designservices 79,783 86,109 6,326 7.9
Advertising 31,198 33,099 1,901 6.1Architecturalservices 15,288 17,168 1,880 12.3Landscapearchitecturalservices 2,650 2,779 129 4.9Interiordesignservices 8,019 8,875 856 10.7Industrialdesignservices 1,707 1,791 84 4.9Graphicdesignservices 7,473 8,073 600 8.0Computersystemsdesign 3,132 3,430 298 9.5Photographyandphotofinishingservices 9,630 10,150 520 5.4Allotherdesignservices 687 743 56 8.2
Fineartseducation 3,270 3,422 152 4.6Educationservices 5,050 5,219 169 3.3
Supportingartsandculturalproduction 551,007 583,765 32,758 5.9Artsupportservices 107,149 110,652 3,503 3.3Informationservices 341,331 363,051 21,720 6.4
Publishing 75,331 77,694 2,363 3.1Motionpictures 93,091 99,280 6,189 6.6Soundrecording 13,398 14,854 1,456 10.9Broadcasting 122,368 127,844 5,476 4.5Otherinformationservices 37,144 43,379 6,235 16.8
Manufacturing 14,430 15,039 609 4.2Construction 9,409 10,195 786 8.4Wholesaleandtransportationindustries 30,775 33,517 2,742 8.9Retailindustries 47,912 51,311 3,399 7.1
Allotherindustries 25,991 26,851 860 3.3
Within the core arts, the performing arts and design services industries were the leadingcontributorstogrowth.Performingarts,whichincreased$4.76billiondollars(9.7percent)in2015,includes performing arts companies, promoters of performing arts and similar events, andindependent artists, writers, and performers. Performing arts companies increased $1.2 billiondollars(7.1percent);promotersofperformingartsandsimilareventsincreased$1.4billiondollars(15.6 percent); while independent artists, writers, and performers increased $1.9 billion dollars(9.3percent).Designservices,whichincreased$6.3billiondollars(7.9percent)in2015,waspacedby increases in advertising and architectural services. The increase in supporting arts industrieswas led by increases in other information services and motion pictures, where both industriesincreased$6.2billiondollars(16.8percentand6.6percent,respectively)in2015.

PerformingartsIntermsofvalueadded,California,NewYork,Florida,andTennesseeaccountedfor63.6percentofthenationaltotalforperformingarts(table10).Amongthefourstates,Tennesseewastheoutlierasitseconomywassmallerthantheotherthree.IntermsofoverallGDPin2015,California,NewYork,andFloridawerealsoamongtopfourlargeststateswhileTennesseeranked18 .
Table10.PerformingArtsValueAdded,SelectStates,2015 Millionsofdollars PercentofU.S.performingartscompaniestotal
UnitedStates 52,942 100.0California 18,131 34.2NewYork 10,217 19.3Florida 2,749 5.2Tennessee 2,557 4.8Texas 1,879 3.5Nevada 1,387 2.6Illinois 1,188 2.2Ohio 1,086 2.1Massachusetts 1,084 2.0NewJersey 1,025 1.9
TennesseehasplayedacriticalroleinthedevelopmentofmanyformsofAmericanpopularmusic,including rock and roll, blues, country, and rockabilly. Beale Street inMemphis is considered bymanytobethebirthplaceoftheblues.MemphisisalsohometoSunRecords,wheremusicianssuchasElvisPresley, JohnnyCash,CarlPerkins, JerryLeeLewis,RoyOrbison, andCharlieRichbegantheirrecordingcareersandwhererockandrolltookshapeinthe1950s.WithMemphisbeingthebirthplaceofrock’nrollandNashvillenicknamed“MusicCity”becauseitisconsideredthecenterof the country music recording industry, Tennessee’s performing arts industry is driven by itsoutsizedroleinthemusicindustry.
th
Theperformingarts industry inTennesseehasseen large increases in value added,employment, and average compensation since2012.Between2012and2015, valueadded inTennessee grew 75.5 percent from $1.5 billionto $2.6 billion dollars (chart 8). Withinperforming arts, from 2012 to 2015, valueaddedforperformingartscompaniesincreased$589 million dollars (62.0 percent). Valuedadded for independent artists, writers, andperformers grew $409 million dollars (133.2percent)from2012to2015.

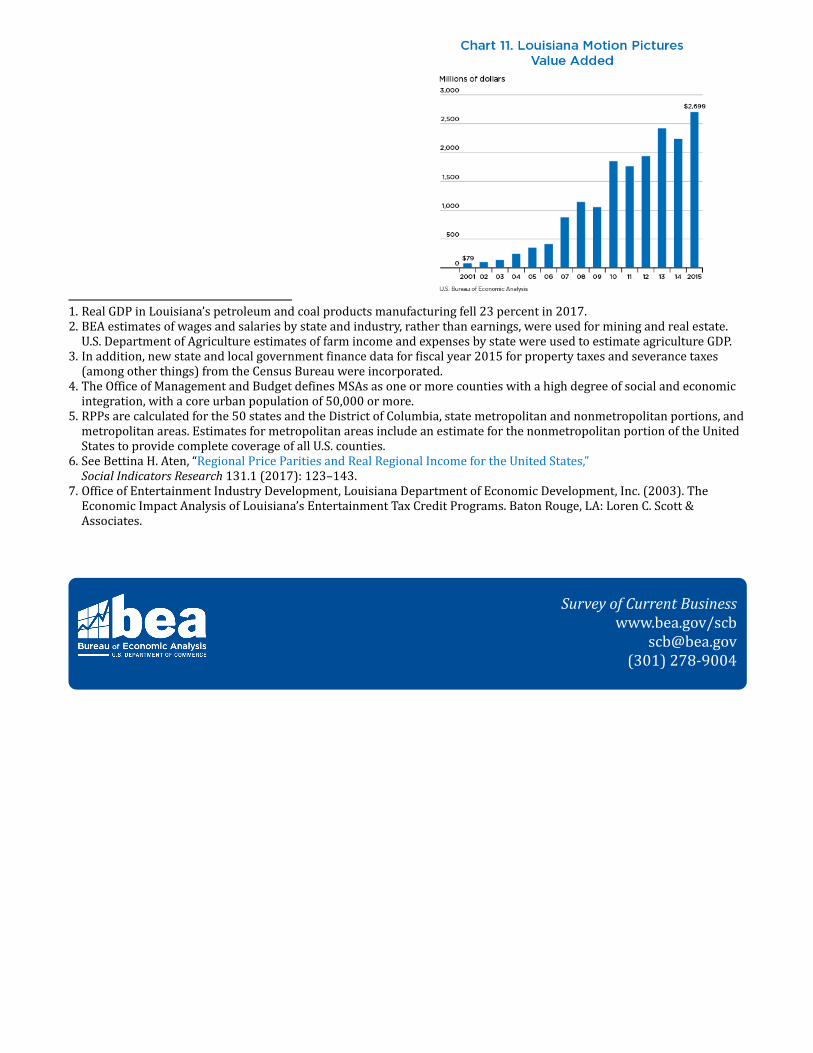
MotionpicturesUnsurprisingly, California and New York account for 77.8 percent of the national total of valueadded for themotionpictures industry in2015 (table11). In2015,motionpictures contributed$49.1billiondollars toCalifornia’seconomy, representing2.0percentofCalifornia’s totalGDP. InNewYork,motionpicturescontributed$28.2billiondollarstothestateeconomy,representing1.9percent of its economy. Louisiana, whose overall GDP is the 24th largest among states, had thethird-largestshareofvalueaddedinthemotionpicturesindustryat$2.7billiondollars(1.1percentofitseconomy).
Employment (the number of jobs) and the average compensation for those jobs in theperformingartsindustryhavealsoexperienceddouble-digitincreasesbetween2012and2015.Employmentincreasedfrom6,225to7,326(17.7percent),whileaveragecompensationinthoseperformingartsjobsincreasedfrom$99,390to$135,480(36.3percent)(chart9andchart10).The increase in employmentwas ledby increases in employment inpromoters of performingarts and similar events and performing arts companies with 37.8 percent and 9.5 percentgrowth, respectively, from 2012 to 2015. The increase in average compensation was led bysignificant increases in compensation in performing arts companies and independent artists,writers, and performers. From 2012 to 2015, average compensation in performing artscompaniesincreasedfrom$132,578to$189,097.Averagecompensationforindependentartists,writers,andperformersincreasedfrom$85,806to$143,049.

Table11.MotionPicturesValueAdded,SelectStates,2015 Millionsofdollars PercentofU.S.motionpicturetotal
UnitedStates 99,280 100.0California 49,120 49.5NewYork 28,150 28.4Louisiana 2,699 2.7Texas 2,122 2.1Florida 1,624 1.6Connecticut 1,583 1.6Georgia 1,463 1.5NewJersey 1,349 1.4Tennessee 1,220 1.2Pennsylvania 969 1.0
Severalfactorscontributetothedevelopmentofmotionpicturesandfilmwithinaspecificlocation.These factors include natural resources—such as the weather, landscape, and local scenery—aswell as access to capital, suchas the existing labor force (humancapital) andproduction-relatedinfrastructure (physical capital)—all of which impact the cost of production. New York was thecenterofearlyfilmproductionduetoaccesstoskilledlaborandexistinginfrastructure.Thegrowthin popularity of motion pictures contributed to the demand that necessitated year-roundproduction,andCaliforniaweatherwasuniquelysuitedtoprovideyear-roundproduction.
Whileadvancementsindigitaleffectshavedecreasedtherelianceoffilmproductiononaspecificphysical locale, the cost of production spending continues to be important in motion picturedevelopment.Onewaythatstatesorlocalitieshavetriedtoattractmotionpictureproductionhasbeenbyprovidingfinancialincentivestomitigatethecostofproduction.Theseincentivesincludegrants, rebates, or tax credits, with various additional requirements, such as minimum spendercaps. The rationale for offering these incentives is not only to entice out-of-state productioncompanies to film in-state and increase in-state spending but also to allow for the long-termdevelopment of themotion pictures industry, related infrastructure, and skilled laborwithin thestate.Louisianahasactivelyprovidedfinancialincentivesforthemotionpictureindustrybeginningin2002.That year, the Louisiana state legislature established (1) an incremental 10 percent taxcreditonbothproductionspendingandresidentpayrollforprojectstotaling$300,000–$1millionand(2)a15percentproductionspendingtaxcreditanda20percentresidentpayrolltaxcreditforprojectsover$1million.7
Since 2001, valued added in the motion pictures industry in Louisiana has increasedsignificantly, and the industry has become a bigger part of the state’s economy. In 2001, themotionpictures industrycontributed$79milliondollars toLouisiana’seconomy, representinglessthan0.1percentofLouisiana’stotalGDP(chart11).From2001to2015,valuedaddedinthemotion pictures industry has grown over 3,000 percentwith jumps in growth in 2007, 2010,2013,and2015.In2015,themotionpicturesindustrycontributed1.1percenttotheLouisianaeconomy.
1.RealGDPinLouisiana’spetroleumandcoalproductsmanufacturingfell23percentin2017.2.BEAestimatesofwagesandsalariesbystateandindustry,ratherthanearnings,wereusedforminingandrealestate.U.S.DepartmentofAgricultureestimatesoffarmincomeandexpensesbystatewereusedtoestimateagricultureGDP.
3.Inaddition,newstateandlocalgovernmentfinancedataforfiscalyear2015forpropertytaxesandseverancetaxes(amongotherthings)fromtheCensusBureauwereincorporated.
4.TheOfficeofManagementandBudgetdefinesMSAsasoneormorecountieswithahighdegreeofsocialandeconomicintegration,withacoreurbanpopulationof50,000ormore.
5.RPPsarecalculatedforthe50statesandtheDistrictofColumbia,statemetropolitanandnonmetropolitanportions,andmetropolitanareas.EstimatesformetropolitanareasincludeanestimateforthenonmetropolitanportionoftheUnitedStatestoprovidecompletecoverageofallU.S.counties.
6.SeeBettinaH.Aten,“RegionalPriceParitiesandRealRegionalIncomefortheUnitedStates,”SocialIndicatorsResearch131.1(2017):123–143.
7.OfficeofEntertainmentIndustryDevelopment,LouisianaDepartmentofEconomicDevelopment,Inc.(2003).TheEconomicImpactAnalysisofLouisiana’sEntertainmentTaxCreditPrograms.BatonRouge,LA:LorenC.Scott&Associates.
SurveyofCurrentBusinesswww.bea.gov/scb
[email protected](301)278-9004