
Chapter 8 -- Removal of Gaseous Pollutants from Effluent Streams
ADSORPTIVE REMOVAL OF INORGANIC POLLUTANTS FROM NUCLEAR POWER PLANT WASTEWATER USING A MODIFIED ZEOLITE NANOCOMPOSITE
A Major Qualifying Project Report
submitted to the Faculty
of the
WORCESTER POLYTECHNIC INSTITUTE
in partial fulfillment of the requirements for the
Degree of Bachelor of Science
By:
EDMUND CARL EDUAH
Date: March 7th, 2014
Approved by:
Professor Susan Zhou, Major Advisor
2
ACKNOWLEDGEMENT I would like to first thank Worcester Polytechnic Institute and Shanghai Jiao Tong
University for making this project and experience possible. I would also like to
extend a special thank you to my advisors Professor Zhou and Professor Xu for their
guidance and support and lastly to Timothy Wenzhong Zhang for assisting me
throughout the experimental phase of the project.
3
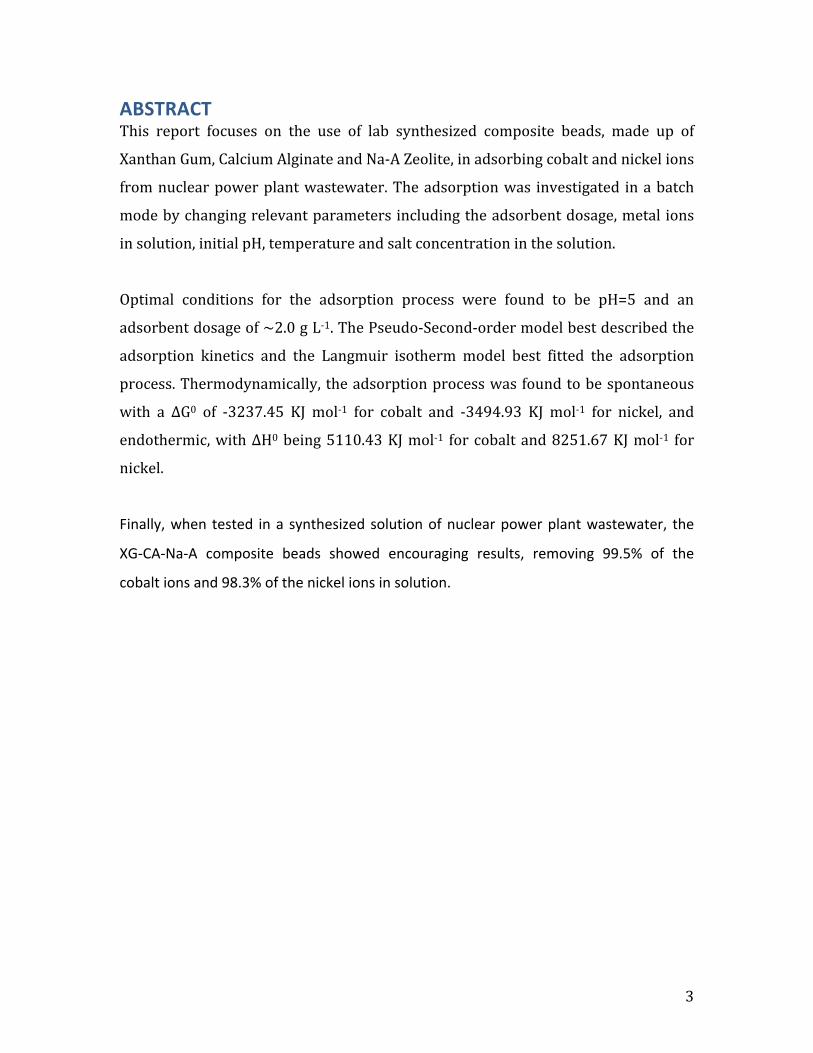
ABSTRACT This report focuses on the use of lab synthesized composite beads, made up of
Xanthan Gum, Calcium Alginate and Na-‐A Zeolite, in adsorbing cobalt and nickel ions
from nuclear power plant wastewater. The adsorption was investigated in a batch
mode by changing relevant parameters including the adsorbent dosage, metal ions
in solution, initial pH, temperature and salt concentration in the solution.
Optimal conditions for the adsorption process were found to be pH=5 and an
adsorbent dosage of ~2.0 g L-‐1. The Pseudo-‐Second-‐order model best described the
adsorption kinetics and the Langmuir isotherm model best fitted the adsorption
process. Thermodynamically, the adsorption process was found to be spontaneous
with a ΔG0 of -‐3237.45 KJ mol-‐1 for cobalt and -‐3494.93 KJ mol-‐1 for nickel, and
endothermic, with ΔH0 being 5110.43 KJ mol-‐1 for cobalt and 8251.67 KJ mol-‐1 for
nickel.
Finally, when tested in a synthesized solution of nuclear power plant wastewater, the
XG-‐CA-‐Na-‐A composite beads showed encouraging results, removing 99.5% of the
cobalt ions and 98.3% of the nickel ions in solution.
4
TABLE OF CONTENTS ACKNOWLEDGEMENT ........................................................................................................................... 2 ABSTRACT ................................................................................................................................................ 3 TABLE OF CONTENTS ............................................................................................................................ 4 LIST OF TABLES ...................................................................................................................................... 6 LIST OF FIGURES ..................................................................................................................................... 7 INTRODUCTION ...................................................................................................................................... 8 BACKGROUND ......................................................................................................................................... 9 INORGANIC POLLUTANTS OF INTEREST ................................................................................................................ 9 CURRENT WASTEWATER TREATMENT METHODS FOR INORGANIC POLLUTANTS .................................... 10 Chemical Precipitation .................................................................................................................................... 10 Membrane Filtration ........................................................................................................................................ 11 Ultrafiltration (UF) ........................................................................................................................................... 11 Reverse Osmosis .................................................................................................................................................. 12 Nanofiltration ..................................................................................................................................................... 12 Electrodialysis (ED) .......................................................................................................................................... 13 Adsorption ............................................................................................................................................................. 14 Choosing a Wastewater Treatment Method .......................................................................................... 15
ADSORPTIVE REMOVAL OF WASTEWATER POLLUTANTS USING XG-‐CA-‐NA-‐A COMPOSITE BEADS ..... 15 Zeolites .................................................................................................................................................................... 15 Xanthan Gum and Calcium Alginate ......................................................................................................... 16
PURPOSE OF THIS PROJECT ............................................................................................................. 17 OBJECTIVES .............................................................................................................................................................. 17
METHODOLOGY ................................................................................................................................... 18 MATERIALS AND INSTRUMENTS .......................................................................................................................... 18 METHOD ................................................................................................................................................................... 18 Preparation of XG-‐CA-‐Na-‐A Beads ............................................................................................................. 18 Batch Adsorption Procedure ......................................................................................................................... 19 Optimal conditions for the adsorption process ..................................................................................... 19 Kinetic Study ........................................................................................................................................................ 20 Isotherms and Thermodynamic Study ...................................................................................................... 21 Study of Competing Effects ............................................................................................................................ 23
RESULTS AND DISCUSSION .............................................................................................................. 25 OPTIMAL ADSORPTION CONDITIONS .................................................................................................................. 25 Effect of XG-‐CA-‐Na-‐A composite beads dosage ..................................................................................... 25 Effect of pH ........................................................................................................................................................... 26
ADSORPTION KINETICS ......................................................................................................................................... 29 ISOTHERM AND THERMODYNAMIC STUDY ......................................................................................................... 33 Adsorption isotherms and temperature effects .................................................................................... 33 Thermodynamics Studies ............................................................................................................................... 35
COMPETING EFFECTS ............................................................................................................................................. 37 The effect of ionic Strength ............................................................................................................................ 37 Competition due to presence of both Nickel and Cobalt ions ......................................................... 38
XG-‐CA-‐NA-‐A BEADS PERFORMANCE IN SYNTHESIZED NUCLEAR WASTEWATER ...................................... 39 COMPARISONS BETWEEN XG-‐CA-‐NA-‐A BEADS AND OTHER PREVIOUSLY STUDIED ADSORBENTS. ....... 40

5
CONCLUSION ......................................................................................................................................... 42 FUTURE PERSPECTIVES .................................................................................................................... 42 REFERENCES ......................................................................................................................................... 43 APPENDIX .............................................................................................................................................. 46 APPENDIX A: PH OF PRECIPITATION FOR 15 MG L-‐1 COBALT AND NICKEL AQUEOUS SOLUTIONS. ......... 46 Cobalt solution .................................................................................................................................................... 46 Nickel solution ..................................................................................................................................................... 46
6
LIST OF TABLES Table 1: Poisoning Effects and Groundwater QES for Co(II) and Ni(II) ions .......................... 10 Table 2: Composition of synthetic nuclear power plant wastewater ..................................... 24 Table 3: Adsorption Capacity, Rate constant and regression values of the kinetic models
............................................................................................................................................................... 30 Table 4: Weber and Morris model constants for each adsorption step. ............................... 31 Table 5: Adsorption isotherm constants and the regression values for the three
experimented temperatures ....................................................................................................... 35 Table 6: Thermodynamic constant values for the metal ions at all three temperatures
studied. ............................................................................................................................................... 36 Table 7: The hydrated Ionic radii and Free energy of Hydration for the metal ions in
solution. .............................................................................................................................................. 39 Table 8: Comparison between XG-‐CA-‐Na-‐A composite beads and other adsorbents in
removing nickel ions from solution .......................................................................................... 40 Table 9: Comparison between XG-‐CA-‐Na-‐A composite beads and other adsorbents in
removing cobalt ions from solution .......................................................................................... 41
7
LIST OF FIGURES Figure 1: Chemical Precipitation Process Schematic .................................................... 11 Figure 2: General Membrane Filtration Process Schematic ......................................... 12 Figure 3: Electrodialysis Process Schematic ................................................................ 13 Figure 4: Adsorption Process Schematic ..................................................................... 14 Figure 5A: Relationship between Adsorbent dosage and cobalt removed ……………… 25 Figure 5B: Relationship between adsorbent dosage and nickel removed ……..…..……. 25 Figure 6A: Effect of pH on metal ion adsorption …………………………………………………..…. 26 Figure 6B: A comparison of the final system pH to the pH of precipitation of cobalt ions in solution ………………………………………………………..………………………………………..……..…… 26 Figure 6C: A comparison of the final system pH to the pH of precipitation of nickel ions in solution …………………………………………………………………………..………………..……………….. 26 Figure 7A: Adsorption Kinetics for both metal ions ……………………………………..…………. 29 Figure 7B: Pseudo-‐first-‐order plots for both metal ions ..………………………………………… 29 Figure 7C: Pseudo-‐second-‐order plots for both metal ions ……………………………………… 29 Figure 8A: Weber Morris Model plot for cobalt adsorption ………………..……………….…. 31 Figure 8B: Weber Morris Model plot for nickel adsorption ………………………..…………… 31 Figure 9A: Cobalt Isotherm plots at 293K, 308K and 323K ……………….………………....….. 33 Figure 9B: Nickel Isotherm plots at 293K, 308K and 323K …………..…………..….…………… 33 Figure 9C: Langmuir Isotherm Model plots for cobalt ion adsorption at 293K, 303K and 323K ……………………………………………………….………………………………….…………………..……… 33 Figure 9D: Langmuir Isotherm Model plots for nickel ion adsorption at 293K, 303K and 323K ……………………………………………………………………………………..……………………..………… 33 Figure 9E: Freundlich Isotherm model plots for cobalt ion adsorption at 293K, 303K and 323K ……………………………………………………………………………….………………………………. 34 Figure 9F: Freundlich Isotherm model plots for nickel ion adsorption at 293K, 303K and 323K ………………………………………………………………………………………………………………………. 34 Figure 9G: Tempkin Isotherm model plots for cobalt ion adsorption at 293K, 303K and 323K ……………………………………………………………………………………………. 34 Figure 9H: Tempkin Isotherm model plots for nickel ion adsorption at 293K, 303K and 323K ……………………………………………………………………………………………. 34 Figure 10A: Plot of ln(Cs/Ce) vs. Cs for cobalt adsorption at the three test temperatures ………………………………………….……………………………………………………………… 36 Figure 10B: Plot of ln(Cs/Ce) vs. Cs for nickel adsorption at the three test temperatures …………………………………………………………………………………………………………………..…………… 36 Figure 11A: Ionic Strength effect for cobalt adsorption ……………………….………………….. 37 Figure 11B: Ionic Strength effect for nickel adsorption ………………………………...………... 37 Figure 12: A comparison between the amount of nickel ions and cobalt ions removed from solution when both ions are present in solution ……….……………………………...…… 38 Figure 13: Plot showing the percentage removal of all metal ions present in the synthetic nuclear power plant wastewater solution ………………………………………………. 39
8
INTRODUCTION In industry today, there is a need for temperature control in various stages of the
production process due to temperature requirements of different equipment that come
together to make up the plant. In cases where temperature needs to be reduced, the
most commonly used coolant is high purity water due to its affordability, high heat
capacity and relative ease of disposal as compared to other fluids.
In nuclear power plants, electricity is generated from by steam turbines, nuclear fission,
a process where atoms are split into smaller atoms with the release of large amounts of
heat energy is used to create steam. During the nuclear fission process, many forms of
radioactive materials are generated as a result of the splitting of the unstable atoms.
These radioactive materials and hard metals seep into cooling water being used to keep
the reactor within operation temperatures (Nuclear Power Plant Radioactive Water
Remediation).
These hard metals and radioactive isotopes, in trace quantities will not be harmful to
living organisms and are sometimes beneficial to the environment (S. Rengaraj and
Seung-‐Hyeon, 2002). However, above permissible limits, these hard metals and
radioactive materials can be extremely harmful to aquatic life and to other living
organisms once ingested. (Babel and Kurniawan, 2004)
The dangers that these waste materials could cause to the environment have led to
increased attention on finding efficient and economical methods for the removal of
heavy metals and other radioactive materials from wastewater in the nuclear power
industry.
Several methods exist for the removal of heavy metals from wastewater including
chemical precipitation, membrane filtration, flotation, electrodialysis and adsorption.
This report focuses on the adsorption process, which has a competitive advantage to the
other processes once a low cost sorbent is used. With that in mind, the project for which
this report is based on investigates the use of a cheap, easily prepared nanocomposite
beads created from a mixture of Zeolite A, Calcium Alginate and Xanthan Gum, as the
adsorbent.
9
BACKGROUND In nuclear power plant wastewater, there are trace quantities of several radioactive
species. Most of these toxins present are heavy metals, with a few non-‐metallic species
present as well. The background section introduces the inorganic pollutants of interest
briefly, before delving into current wastewater treatment methods available. Once this
has been completed, a more detailed depiction of the particular adsorption method of
interest is given.
Inorganic Pollutants of interest
As suggested earlier, the major pollutant constituents of nuclear power plant
wastewater are heavy metals. Heavy metals, defined loosely, are elements having
atomic weights between 63.5 and 200.6, and a specific gravity greater than 5.0 (Fu and
Wang, 2011). This definition covers a large range of elements however for the purposes
of this project cobalt and nickel were given particular attention.
Cobalt is a hard ferromagnetic, silver-‐white, hard, lustrous, brittle element. It is needed
in marine environment by nitrogen-‐fixing organisms like blue algae. In humans it is
essential as it is part of vitamin B12, which is essential to human health (Cobalt – Co,
2014). However in large quantities it can be detrimental to human health and aquatic
life as shown in table 1.
Nickel, like cobalt, is a silvery white and hard element but differs from cobalt in that it is
malleable and ductile. It is easily absorbed by organic matter, which explains why coal
and oil contain considerable amounts. It appears in some beans as an essential enzyme
and in tea as well (Nickel – Ni, 2014). However in large quantities it can be detrimental
to human health as shown in table 1.
The ability of living organisms to absorb and accumulate these heavy metals makes it
likely for these metals to exist beyond permitted concentrations in the living organism
hence leading to various illnesses and disorders as shown in table 1.
10
Table 1: Poisoning Effects and Groundwater QES for Co(II) and Ni(II) ions
Heavy Metals Effects of poisoning Groundwater Quality Enforcement Standards (QES) (mg/L)
Cobalt (Co2+) Heart, liver and thyroid Damage. May cause mutations.
0.04
Nickel (Ni2+) Dermatitis, nausea, chronic asthma, coughing, human carcinogen
0.10
(US EPA, 2013), (US DNR, 2012) and (S Rengaraj and Seung-‐Hyeon, 2002)
Due to the high solubility of heavy metals in aquatic environment they cannot be easily
separated from wastewater and hence attention needs to be given to efficient
separation methods.
Current Wastewater Treatment Methods for Inorganic Pollutants The danger posed by these toxins has led to considerable research into the separation
of heavy metals and toxic non-‐metals from wastewater streams introduced below.
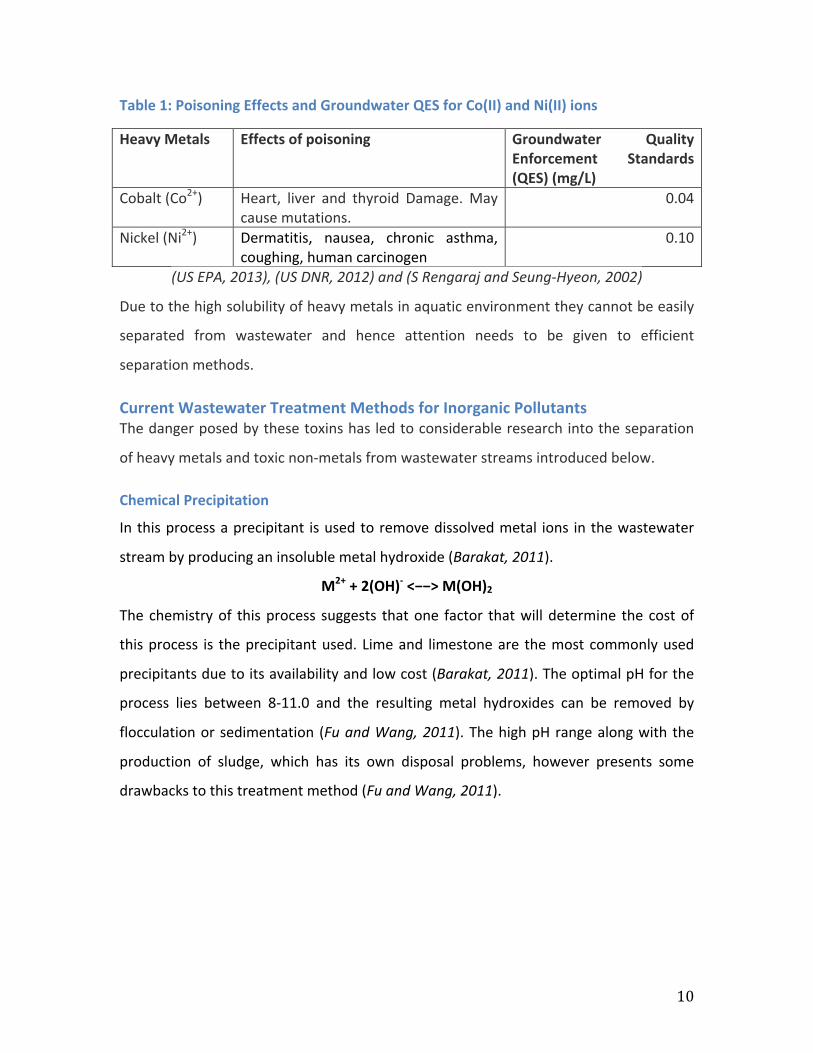
Chemical Precipitation
In this process a precipitant is used to remove dissolved metal ions in the wastewater
stream by producing an insoluble metal hydroxide (Barakat, 2011).
M2+ + 2(OH)-‐ <−−> M(OH)2
The chemistry of this process suggests that one factor that will determine the cost of
this process is the precipitant used. Lime and limestone are the most commonly used
precipitants due to its availability and low cost (Barakat, 2011). The optimal pH for the
process lies between 8-‐11.0 and the resulting metal hydroxides can be removed by
flocculation or sedimentation (Fu and Wang, 2011). The high pH range along with the
production of sludge, which has its own disposal problems, however presents some
drawbacks to this treatment method (Fu and Wang, 2011).
11
(Wang et al, 2004)
Figure 1: Chemical Precipitation Process Schematic
Membrane Filtration
Membrane filtration is used to describe a group of treatment methods that make use of
filtration methods. Depending on the size of the particle that needs to be retained,
ultrafiltration, reverse osmosis, and micro or nano filtration can be employed for heavy
metal removal from wastewater (Barakat, 2011).
Ultrafiltration (UF) This is a low-‐pressure membrane process used to separate high molecular weight
compounds from a liquid stream (Fu and Wang, 2011). The large pores used in this
method results in ultrafiltration (UF) requiring fewer membrane elements and lower
pressures however this also means that low molecular weight substances including
heavy metals will pass through. Hence in order to increase the efficiency of the metal
ion removal, the process is enhanced by the introduction of surfactants or water-‐soluble
polymers, which form large metal-‐surfactant structures or macromolecular complexes
respectively with the metallic ions. (Fu and Wang, 2011). These surfactants or polymers
however add to the operating costs of the process. The membranes are also prone to
fouling and radiation damage (Rahman et al, 2011).
12
Reverse Osmosis In the reverse osmosis process, a semi-‐permeable membrane is used to allow fluid being
treated through it whiles rejecting its contaminants with an efficiency of up to 99.5%.
However its high power consumption due to pumping pressures and restoration of the
membranes makes it a less favorable option (Fu and Wang, 2011).
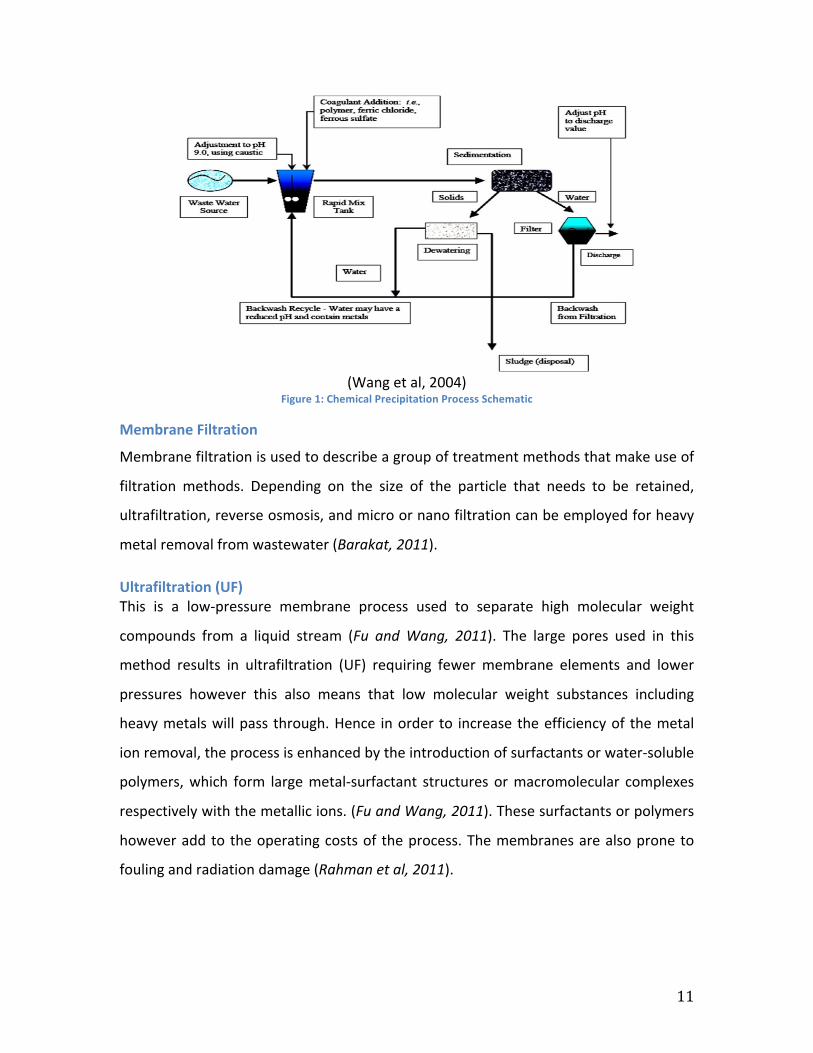
Nanofiltration Nanofiltration is the intermediate process between Ultrafiltration and Reverse Osmosis.
It is a relatively easy to operate and reliable treatment method and has comparatively
low energy consumption whiles maintaining high efficiency (Fu and Wang, 2011).
(Dhale and Mahajani, 2000)
Figure 2: General Membrane Filtration Process Schematic
Generally membrane filtration methods are highly efficient methods of removing heavy
metal ions. However, as seen in the descriptions and schematic above, high costs,
complexity and membrane fouling can make it an undesirable technique. Also low
permeate flux makes the membrane filtration technique a slow treatment option on the
industry level (Fu and Wang, 2011).
13
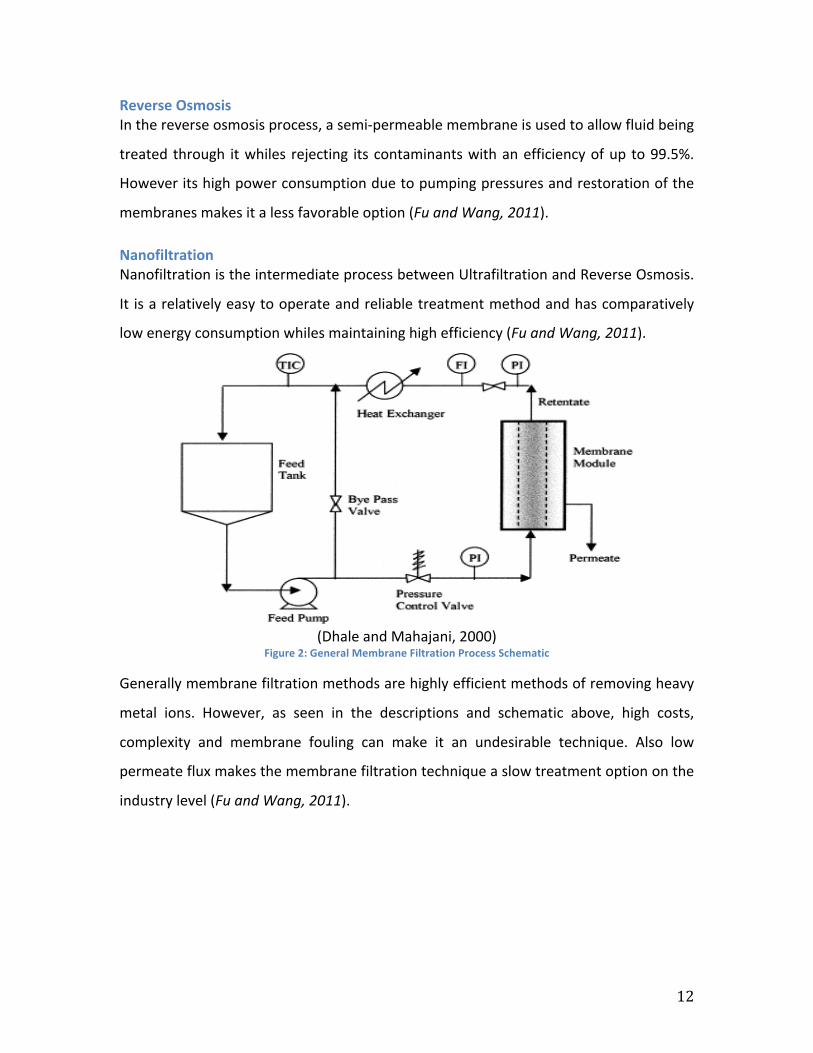
Electrodialysis (ED)
This process involves the separation of ions across charged membranes from one
solution to another using an electric field as the driving force (Fu and Wang, 2011).
(Stephen R. Schulte, 2011)
Figure 3: Electrodialysis Process Schematic
In this treatment process, the contaminated wastewater is passed through cell
compartments, which results in the anions migrating towards an anode and the cations
migrating towards a cathode through anion exchange and cation exchange membranes.
This movement results in the separation of the heavy metal ions from the wastewater
stream as shown in figure 3.
14
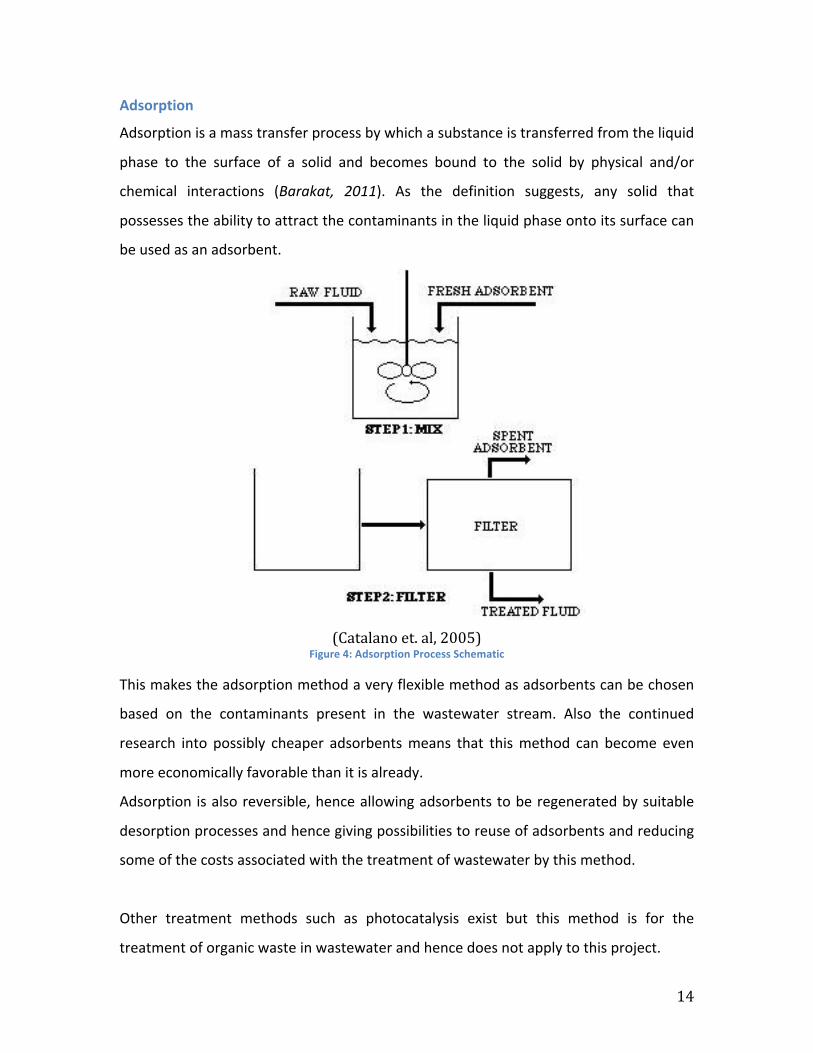
Adsorption
Adsorption is a mass transfer process by which a substance is transferred from the liquid
phase to the surface of a solid and becomes bound to the solid by physical and/or
chemical interactions (Barakat, 2011). As the definition suggests, any solid that
possesses the ability to attract the contaminants in the liquid phase onto its surface can
be used as an adsorbent.
(Catalano et. al, 2005)
Figure 4: Adsorption Process Schematic
This makes the adsorption method a very flexible method as adsorbents can be chosen
based on the contaminants present in the wastewater stream. Also the continued
research into possibly cheaper adsorbents means that this method can become even
more economically favorable than it is already.
Adsorption is also reversible, hence allowing adsorbents to be regenerated by suitable
desorption processes and hence giving possibilities to reuse of adsorbents and reducing
some of the costs associated with the treatment of wastewater by this method.
Other treatment methods such as photocatalysis exist but this method is for the
treatment of organic waste in wastewater and hence does not apply to this project.
15
Choosing a Wastewater Treatment Method As observed in the above background on the available wastewater treatment options,
all options have their advantages and disadvantages. The most suitable procedure for
any plant will therefore be dependent on the funds, needs and specifications of the
particular plant that needs to treat its wastewater. Factors like initial metal
concentration, wastewater components, operating costs, plant flexibility, reliability and
environmental impact will need to be taken into consideration in making a decision on
which treatment method to use (Kurniawan et al., 2006).
Adsorptive Removal of Wastewater Pollutants using XG-‐CA-‐Na-‐A composite Beads As mentioned in the adsorption method description, any substance that possesses the
ability to attract pollutants in the liquid phase onto its surface can be used as an
adsorbent. In this project, the adsorbent that was studied was a lab-‐synthesized bead
made out of a mixture of zeolite Na-‐A, Xanthan Gum (XG) and Calcium Alginate (CA).
Zeolites Zeolites are crystalline materials made up of structures based on three-‐dimensional
frameworks of alumina and silica tetahedra. Theses typically anionic frameworks are
populated by charge compensating cations to maintain neutrality. These compensating
cations can participate in ion-‐exchange processes (Price). The polarity, shape and size
selective properties of zeolites as a result of their tetrahedron framework and the ion-‐
exchange ability of zeolites present attractive adsorbent possibilities for zeolites.
The loosely bound nature of extra-‐framework metal ions such as the Na ions means that
they are often readily exchanged for other types of metal ions when in aqueous
solution. In Zeolite Na-‐A, the zeolite used in this project, the charge compensating
cation is Sodium and the zeolite has the molecular formula Na12((AlO2)12(SiO2)12)·∙27H2O.
Hence in this project, it is expected that when present in aqueous solutions, the sodium
ions will be exchanged out of the zeolite for hard metal ions such as Cobalt and Nickel
present in the water.
16
Xanthan Gum and Calcium Alginate Despite the attractive properties of zeolites for adsorption in wastewater treatment,
their crystalline nature implies the need for a separation procedure after they have
been introduced into the wastewater stream and this could possibly increase the
operation costs of this method. This problem can however be solved, without affecting
the ion exchange ability and the tetrahedron, by forming beads through the coating of
the zeolites with natural polysaccharides (Zhang et al, 2013).
In this project, Xanthan gum, a common thickening agent, and Calcium Alginate, a water
insoluble and gelatinous substance, are the polysaccharides used. Both polysaccharides
are used in the food industry as emulsifiers and to increase viscosity. Most importantly,
the water-‐insoluble nature property of Calcium Alginate makes it possible for the
synthesized beads to be easily removed from the wastewater stream once the
adsorption process is complete.
17
PURPOSE OF THIS PROJECT Now that the wastewater treatment method of interest has been identified and
described, the aim of this project will be to study the factors that affect the
effectiveness of the adsorption process as well as the effectiveness of zeolites as
adsorbents
Objectives More specifically, the objectives of this project will be to:
1. Find the optimal conditions for the adsorption process.
A. Effect of adsorbent dosage on the adsorption process.
B. Effect of pH on adsorption process.
2. Investigate the adsorption capacity of the zeolites for different kinds of heavy
metal ions using flame atomic adsorption spectrometry and inductive coupled
plasma optical emission spectrometry.
A. Find the kinetics of the adsorption process
B. Perform a thermodynamic study of the adsorption process
i. Find the effect of temperature on the adsorption process.
ii. Analyze adsorption isotherms.
3. Find the effect of competing adsorbates in the wastewater on the adsorption
process.
A. Competition due to presence of background electrolytes.
B. Competition due to multiple metal ion presence.
C. Find the behavior of adsorbent in synthesized nuclear power plant
wastewater.
18
METHODOLOGY
Materials and Instruments The XG-‐CA-‐Na-‐A beads, synthesized in the lab, were used as the adsorbent for all of the
batch adsorption experiments carried out in this project. In all of the tests, the
performance of the beads in adsorbing Ni2+ and Cu2+ ions, the adsorbates, was studied
by the use of Flame Atomic Adsorption Spectroscopy or, in the case of latter
experiments, Induced Coupled Plasma Optical Emission Spectroscopy. The pH of all
solutions was controlled using diluted Nitric Acid (HNO3) or Sodium hydroxide (NaOH).
Method
Preparation of XG-‐CA-‐Na-‐A Beads First, a desired amount of dried zeolite Na-‐A (meshed through 50-‐screen sieve) was re-‐
suspended in water under stir and ultrasonication to create a 33% weight percent
zeolite solution. Then, 1 % (w/w) sodium alginate (SA) (190 cps viscosity) was prepared
by mixing the SA with water under ultrasonication. 0.5% (w/w) Xanthan gum (XG) was
also prepared by mixing XG powder with water under stir and ultrasonication. Lastly, a
0.2 mol L-‐1 solution of Calcium Chloride was prepared.
The solution that makes up the Zeolite beads is then prepared in a gram ratio of 1g of
zeolite solution to 6g of 1% sodium alginate solution to 10g of 0.5% Xanthan gum
solution. It is important to note that the solution must be created in the given order, the
sodium alginate is added to the zeolite A solution before the xantum gum solution is
added to the previous mixture. It is also important to know that at each point of
solution preparation and mixing, thorough mixing must be achieved by use of a stirrer
and all air bubbles must be removed by using an ultrasound shaker.
Using an injector, the Zeolite A-‐sodium Alginate-‐Xantum gum mixture is then added
drop wise to the calcium chloride solution to obtain the desired beads. The beads are
kept overnight in the calcium chloride solution and the filtered and thoroughly washed
with D.I water. Once that is done, they are placed on a plate in one layer and placed in
an oven at 60 oC overnight.
19
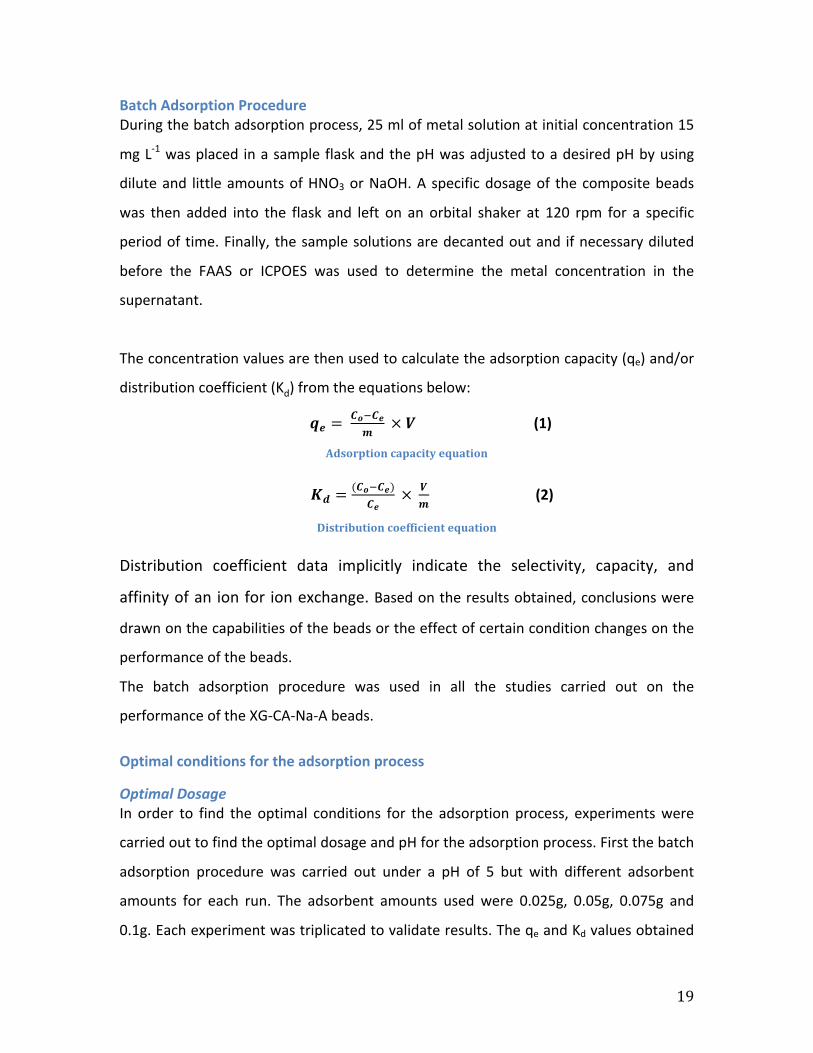
Batch Adsorption Procedure During the batch adsorption process, 25 ml of metal solution at initial concentration 15
mg L-‐1 was placed in a sample flask and the pH was adjusted to a desired pH by using
dilute and little amounts of HNO3 or NaOH. A specific dosage of the composite beads
was then added into the flask and left on an orbital shaker at 120 rpm for a specific
period of time. Finally, the sample solutions are decanted out and if necessary diluted
before the FAAS or ICPOES was used to determine the metal concentration in the
supernatant.
The concentration values are then used to calculate the adsorption capacity (qe) and/or
distribution coefficient (Kd) from the equations below:
𝒒𝒆 = 𝑪𝒐!𝑪𝒆𝒎
× 𝑽 (1)
Adsorption capacity equation
𝑲𝒅 =(𝑪𝒐!𝑪𝒆)
𝑪𝒆 × 𝑽
𝒎 (2)
Distribution coefficient equation
Distribution coefficient data implicitly indicate the selectivity, capacity, and
affinity of an ion for ion exchange. Based on the results obtained, conclusions were
drawn on the capabilities of the beads or the effect of certain condition changes on the
performance of the beads.
The batch adsorption procedure was used in all the studies carried out on the
performance of the XG-‐CA-‐Na-‐A beads.
Optimal conditions for the adsorption process
Optimal Dosage In order to find the optimal conditions for the adsorption process, experiments were
carried out to find the optimal dosage and pH for the adsorption process. First the batch
adsorption procedure was carried out under a pH of 5 but with different adsorbent
amounts for each run. The adsorbent amounts used were 0.025g, 0.05g, 0.075g and
0.1g. Each experiment was triplicated to validate results. The qe and Kd values obtained
20
from the above experiments were used to determine the optimal dosage for the
adsorption process.
Optimal pH and pH effect Once this had been achieved, another set of batch adsorption experiments were carried
out, this time using the optimal adsorbent amounts determined in the first set of
experiments and varying the pH for each run. A pH range of 3-‐9 was tested and the
resulting qe and Kd values were used to determine the optimal pH and the effect of pH
on the adsorption process.
Once the optimal pH and dosage were obtained, they were used as the pH and dosage
in all of the other studies carried out during the project.
Kinetic Study The kinetic study was performed using 25 ml of solution with an initial metal
concentration of 15 ppm and ~0.05g of adsorbent. The bottles were agitated at 120 rpm
at ~23oC. Samples were withdrawn for analysis by the FAAS at periods of 5, 10, 15, 20,
30, 40, 50, 60, 90, 120, 180, 240, 300, 360, 420, 480 minutes and one sample was
withdrawn after being left overnight.
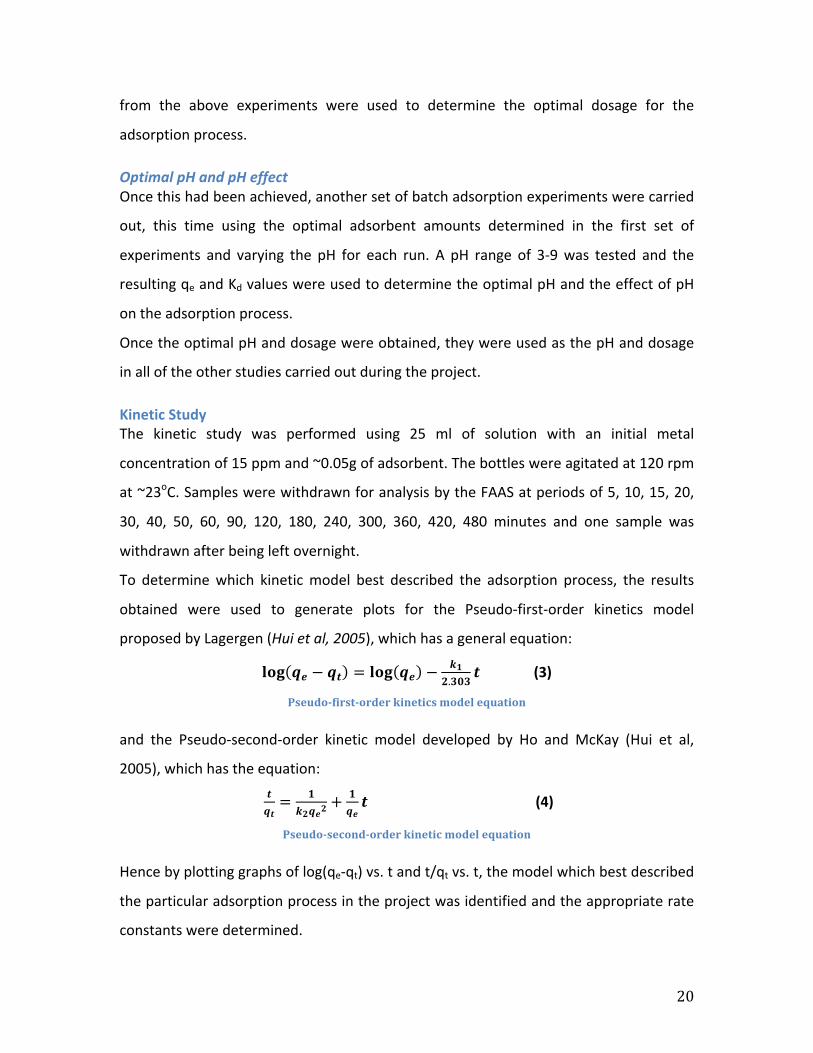
To determine which kinetic model best described the adsorption process, the results
obtained were used to generate plots for the Pseudo-‐first-‐order kinetics model
proposed by Lagergen (Hui et al, 2005), which has a general equation:
𝐥𝐨𝐠 𝒒𝒆 − 𝒒𝒕 = 𝐥𝐨𝐠 𝒒𝒆 − 𝒌𝟏𝟐.𝟑𝟎𝟑
𝒕 (3)
Pseudo-‐first-‐order kinetics model equation
and the Pseudo-‐second-‐order kinetic model developed by Ho and McKay (Hui et al,
2005), which has the equation:
𝒕𝒒𝒕= 𝟏
𝒌𝟐𝒒𝒆𝟐+ 𝟏
𝒒𝒆𝒕 (4)
Pseudo-‐second-‐order kinetic model equation
Hence by plotting graphs of log(qe-‐qt) vs. t and t/qt vs. t, the model which best described
the particular adsorption process in the project was identified and the appropriate rate
constants were determined.
21
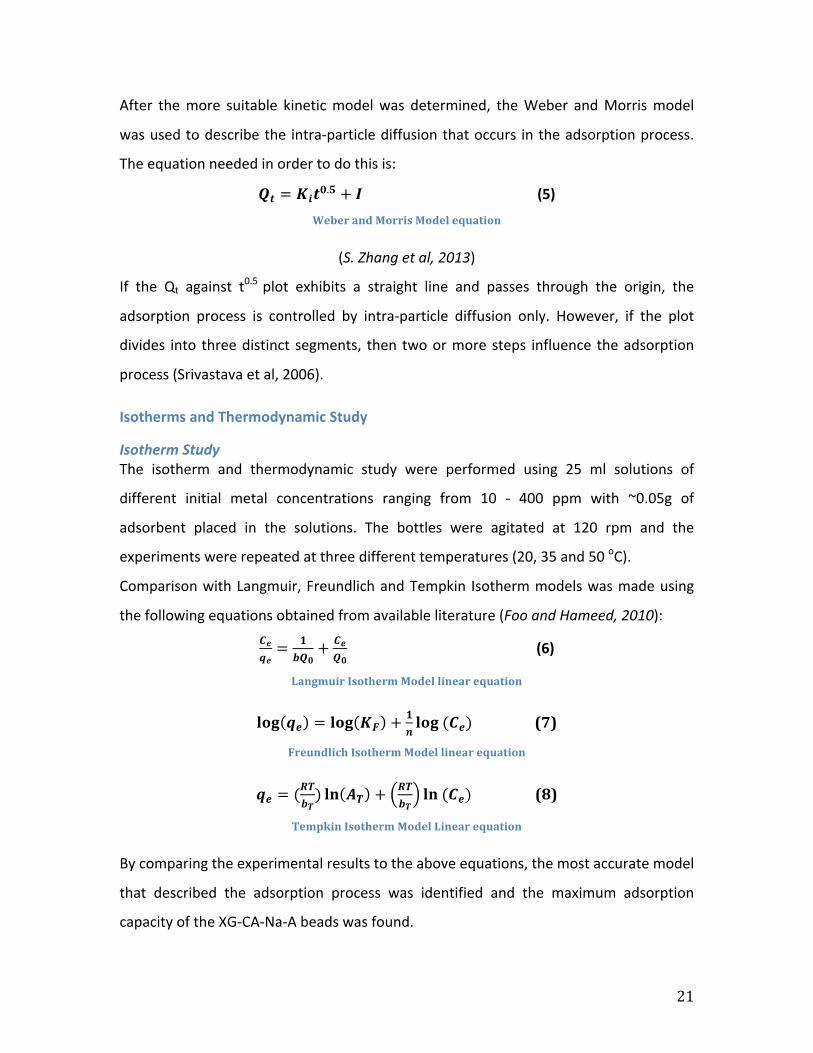
After the more suitable kinetic model was determined, the Weber and Morris model
was used to describe the intra-‐particle diffusion that occurs in the adsorption process.
The equation needed in order to do this is:
𝑸𝒕 = 𝑲𝒊𝒕𝟎.𝟓 + 𝑰 (5)
Weber and Morris Model equation
(S. Zhang et al, 2013)
If the Qt against t0.5 plot exhibits a straight line and passes through the origin, the
adsorption process is controlled by intra-‐particle diffusion only. However, if the plot
divides into three distinct segments, then two or more steps influence the adsorption
process (Srivastava et al, 2006).
Isotherms and Thermodynamic Study
Isotherm Study The isotherm and thermodynamic study were performed using 25 ml solutions of
different initial metal concentrations ranging from 10 -‐ 400 ppm with ~0.05g of
adsorbent placed in the solutions. The bottles were agitated at 120 rpm and the
experiments were repeated at three different temperatures (20, 35 and 50 oC).
Comparison with Langmuir, Freundlich and Tempkin Isotherm models was made using
the following equations obtained from available literature (Foo and Hameed, 2010): 𝑪𝒆𝒒𝒆= 𝟏
𝒃𝑸𝟎+ 𝑪𝒆
𝑸𝟎 (6)
Langmuir Isotherm Model linear equation
𝐥𝐨𝐠 𝒒𝒆 = 𝐥𝐨𝐠 𝑲𝑭 + 𝟏𝒏𝐥𝐨𝐠 (𝑪𝒆) (7)
Freundlich Isotherm Model linear equation
𝒒𝒆 = (𝑹𝑻𝒃𝑻) 𝐥𝐧 𝑨𝑻 + 𝑹𝑻
𝒃𝑻𝐥𝐧 (𝑪𝒆) (8)
Tempkin Isotherm Model Linear equation
By comparing the experimental results to the above equations, the most accurate model
that described the adsorption process was identified and the maximum adsorption
capacity of the XG-‐CA-‐Na-‐A beads was found.
22
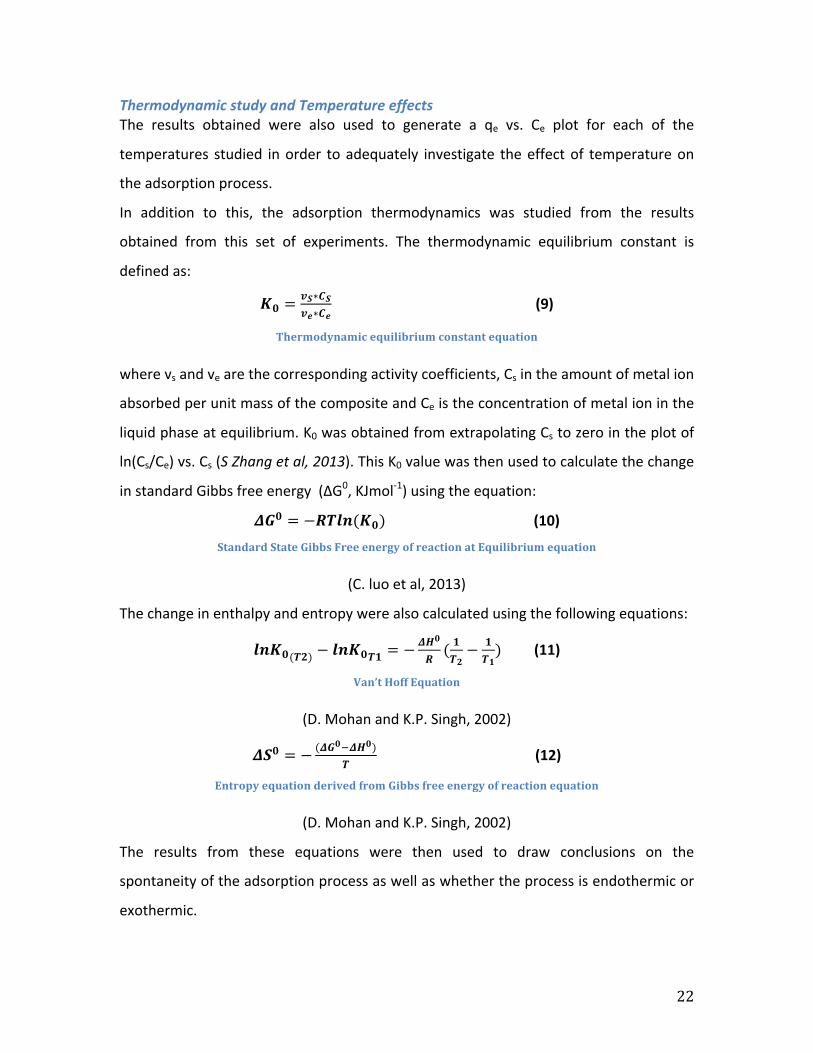
Thermodynamic study and Temperature effects The results obtained were also used to generate a qe vs. Ce plot for each of the
temperatures studied in order to adequately investigate the effect of temperature on
the adsorption process.
In addition to this, the adsorption thermodynamics was studied from the results
obtained from this set of experiments. The thermodynamic equilibrium constant is
defined as:
𝑲𝟎 =𝒗𝑺∗𝑪𝑺𝒗𝒆∗𝑪𝒆
(9)
Thermodynamic equilibrium constant equation
where vs and ve are the corresponding activity coefficients, Cs in the amount of metal ion
absorbed per unit mass of the composite and Ce is the concentration of metal ion in the
liquid phase at equilibrium. K0 was obtained from extrapolating Cs to zero in the plot of
ln(Cs/Ce) vs. Cs (S Zhang et al, 2013). This K0 value was then used to calculate the change
in standard Gibbs free energy (ΔG0, KJmol-‐1) using the equation:
𝜟𝑮𝟎 = −𝑹𝑻𝒍𝒏(𝑲𝟎) (10) Standard State Gibbs Free energy of reaction at Equilibrium equation
(C. luo et al, 2013)
The change in enthalpy and entropy were also calculated using the following equations:
𝒍𝒏𝑲𝟎(𝑻𝟐) − 𝒍𝒏𝑲𝟎𝑻𝟏 = − 𝜟𝑯𝟎
𝑹( 𝟏𝑻𝟐− 𝟏
𝑻𝟏) (11)
Van’t Hoff Equation
(D. Mohan and K.P. Singh, 2002)
𝜟𝑺𝟎 = − (𝜟𝑮𝟎!𝜟𝑯𝟎)𝑻
(12)
Entropy equation derived from Gibbs free energy of reaction equation
(D. Mohan and K.P. Singh, 2002)
The results from these equations were then used to draw conclusions on the
spontaneity of the adsorption process as well as whether the process is endothermic or
exothermic.
23
Study of Competing Effects
Competition due to presence of background electrolytes The presence of background electrolytes may affect the adsorption of the Co2+ and Ni2+
ions by the XG-‐CA-‐Na-‐A composites in aquatic media. In order to test this effect batch
adsorption experiments were run with ~0.05g of adsorbent added to 25 ml solutions
containing ~15 ppm of metal ion and varied concentrations of NaCl, KCl, MgCl2 and CaCl2
(0.0025-‐0.1000M). The resulting concentrations were obtained using the FAAS and
conclusions drawn based on these results.
Competition due to presence of both Nickel and Cobalt ions The adsorption of the metal ions by the XG-‐CA-‐Na-‐A composite beads was also
studied in the scenario where both metal ions are present in the aqueous solution.
This presence of both metal ions may affect the adsorption capacity due to
competition for adsorption space. In order to test this effect, batch adsorption
experiments were run with ~0.05g of adsorbent added to 25 ml solutions
containing varied concentrations of both metal ions (10 ppm – 50 ppm). Batch
adsorption experiments were also run with ~0.05g of adsorbent added to 25 ml
solutions containing only one of the two metal ions being studied at the same range
of concentrations (10 ppm – 50 ppm). The resulting concentrations obtained from
FAAS were used to draw conclusion on the competing effects of the coexisting metal
ions in the aqueous media.
Simulated nuclear power plant waste water To investigate how the XG-‐CA-‐Na-‐A composite beads will fair in real life situation,
batch adsorption experiments were run with about ~2.0g of adsorbent with a litre
of metal ion solution containing various heavy metals at various concentrations
obtained from literature (Rengaraj and Seung-‐Hyeon, 2002). The concentration and
metal ion present in the solution are presented in table 2 below.
24
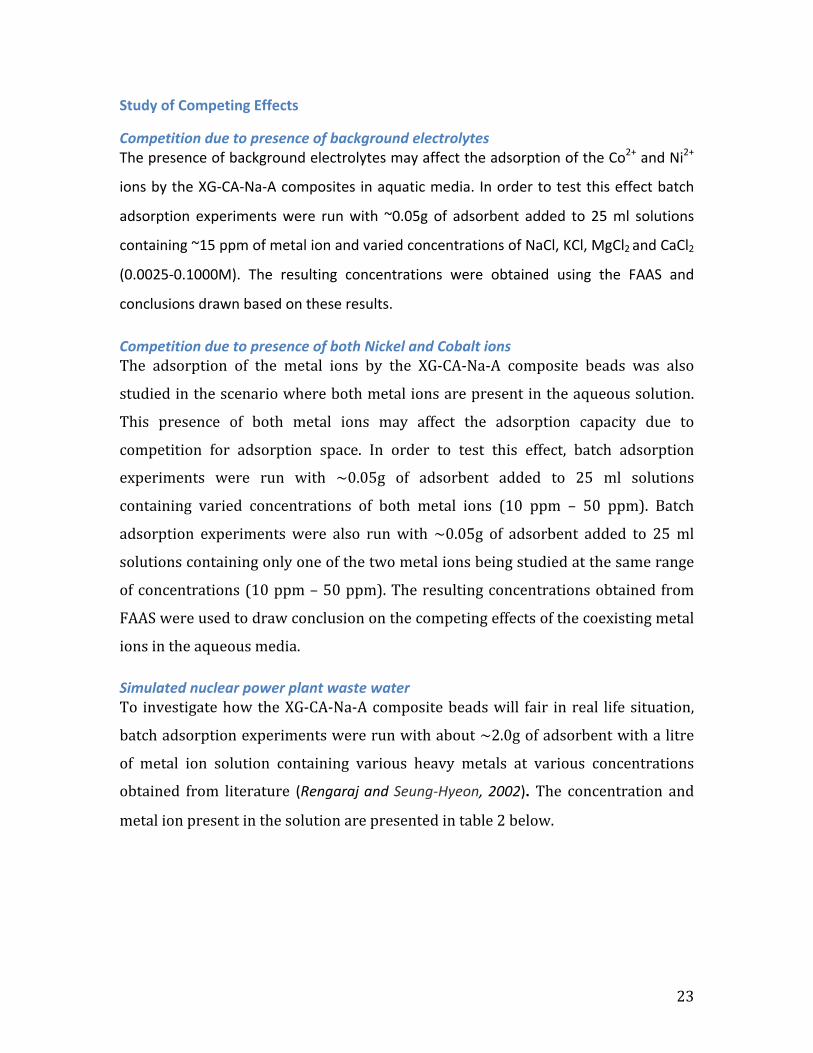
Table 2: Composition of synthetic nuclear power plant wastewater
Compound Concentration (mg L-‐1) Co(NO3)2 . 6H2O 1 Ni(NO3)2 . 6H2O 15 Fe(NO3)3 . 9H2O 30 Sb2O5 5 AgNO3 5 H3BO3 20 Cr(NO3)3 -‐ 9H2O 4 LiOH . H2O 0.5 CsNO3 0.5
(Rengaraj and Seung-‐Hyeon, 2002)
25
RESULTS and DISCUSSION
Optimal Adsorption Conditions
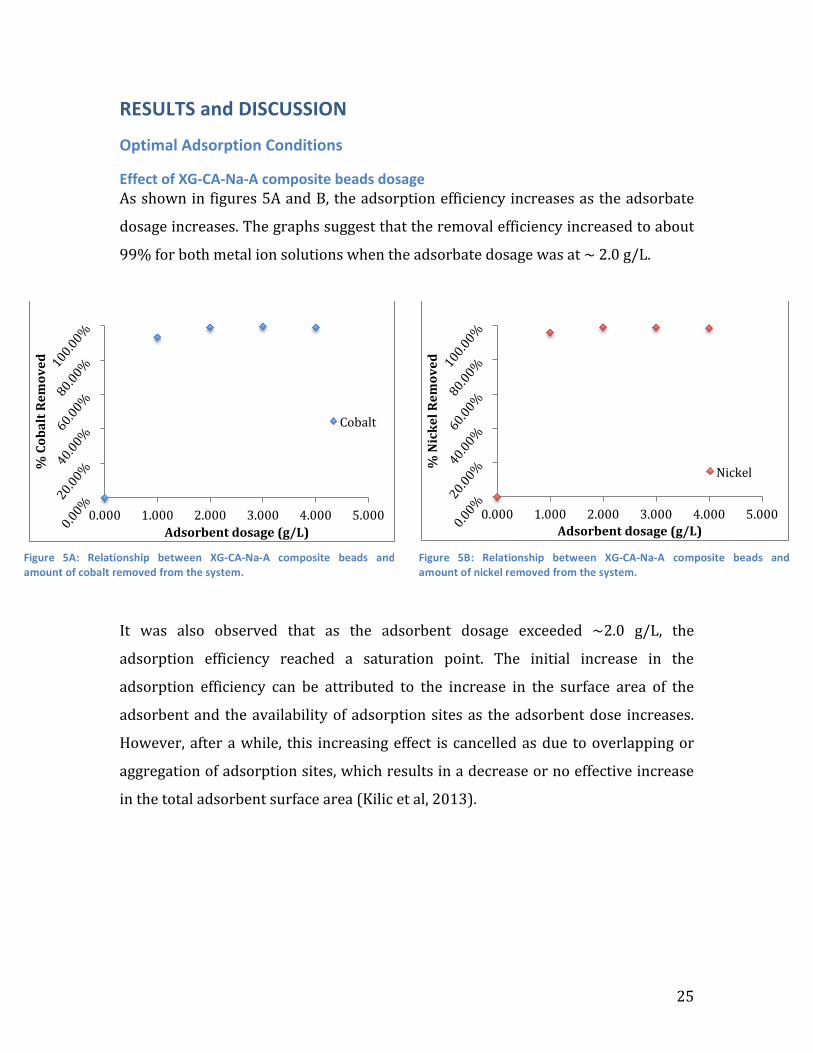
Effect of XG-‐CA-‐Na-‐A composite beads dosage As shown in figures 5A and B, the adsorption efficiency increases as the adsorbate
dosage increases. The graphs suggest that the removal efficiency increased to about
99% for both metal ion solutions when the adsorbate dosage was at ~ 2.0 g/L.
It was also observed that as the adsorbent dosage exceeded ~2.0 g/L, the
adsorption efficiency reached a saturation point. The initial increase in the
adsorption efficiency can be attributed to the increase in the surface area of the
adsorbent and the availability of adsorption sites as the adsorbent dose increases.
However, after a while, this increasing effect is cancelled as due to overlapping or
aggregation of adsorption sites, which results in a decrease or no effective increase
in the total adsorbent surface area (Kilic et al, 2013).
0.000 1.000 2.000 3.000 4.000 5.000
% Cobalt Rem
oved
Adsorbent dosage (g/L)
Cobalt
0.000 1.000 2.000 3.000 4.000 5.000
% Nickel Rem
oved
Adsorbent dosage (g/L)
Nickel
Figure 5A: Relationship between XG-‐CA-‐Na-‐A composite beads and amount of cobalt removed from the system.
Figure 5B: Relationship between XG-‐CA-‐Na-‐A composite beads and amount of nickel removed from the system.
26
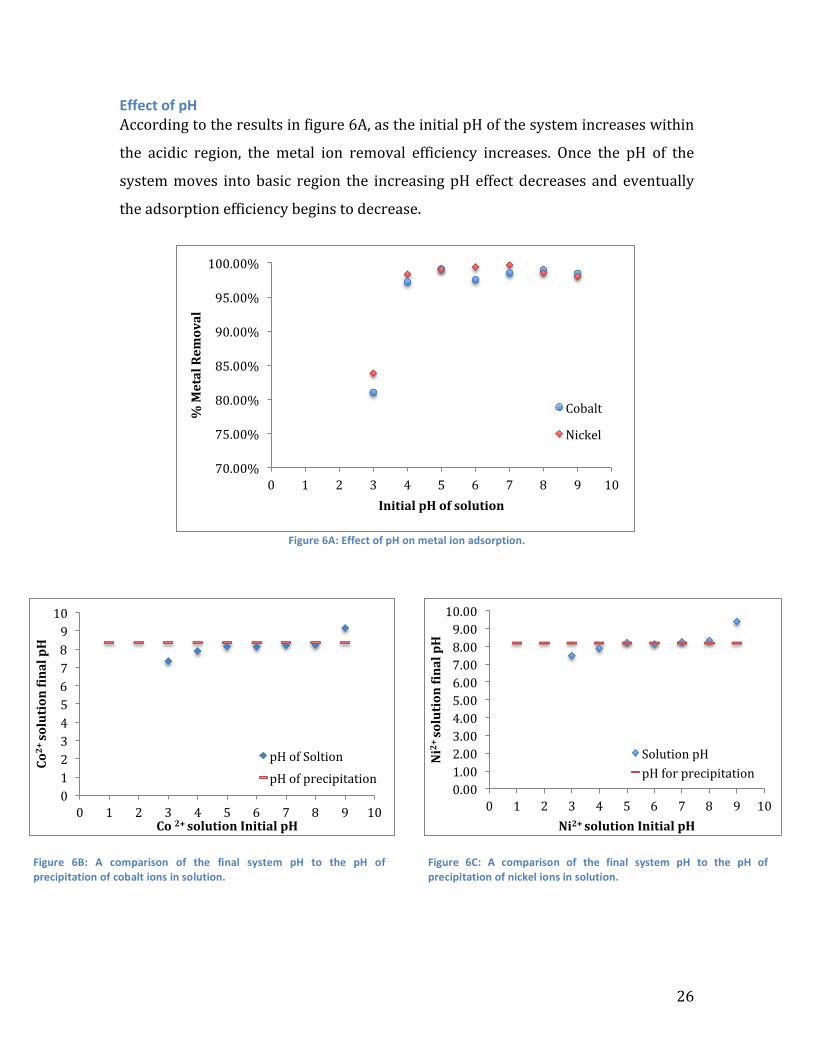
Effect of pH According to the results in figure 6A, as the initial pH of the system increases within
the acidic region, the metal ion removal efficiency increases. Once the pH of the
system moves into basic region the increasing pH effect decreases and eventually
the adsorption efficiency begins to decrease.
Figure 6A: Effect of pH on metal ion adsorption.
70.00%
75.00%
80.00%
85.00%
90.00%
95.00%
100.00%
0 1 2 3 4 5 6 7 8 9 10
% Metal Rem
oval
Initial pH of solution
Cobalt
Nickel
0 1 2 3 4 5 6 7 8 9 10
0 1 2 3 4 5 6 7 8 9 10
Co2+ solution dinal pH
Co 2+ solution Initial pH
pH of Soltion pH of precipitation
0.00 1.00 2.00 3.00 4.00 5.00 6.00 7.00 8.00 9.00 10.00
0 1 2 3 4 5 6 7 8 9 10
Ni2+ solution dinal pH
Ni2+ solution Initial pH
Solution pH pH for precipitation
Figure 6B: A comparison of the final system pH to the pH of precipitation of cobalt ions in solution.
Figure 6C: A comparison of the final system pH to the pH of precipitation of nickel ions in solution.
27
In terms of optimal pH, as represented in figure 6A, the maximum uptake of Ni2+
ions occurred at a pH of 7, although the difference between adsorption efficiencies
at pH of 5,6, and 7 is almost insignificant. For Co2+, the maximum adsorption
efficiency was obtained at a pH of 5.
In an attempt to explain the effect of the initial pH of the system on the adsorption
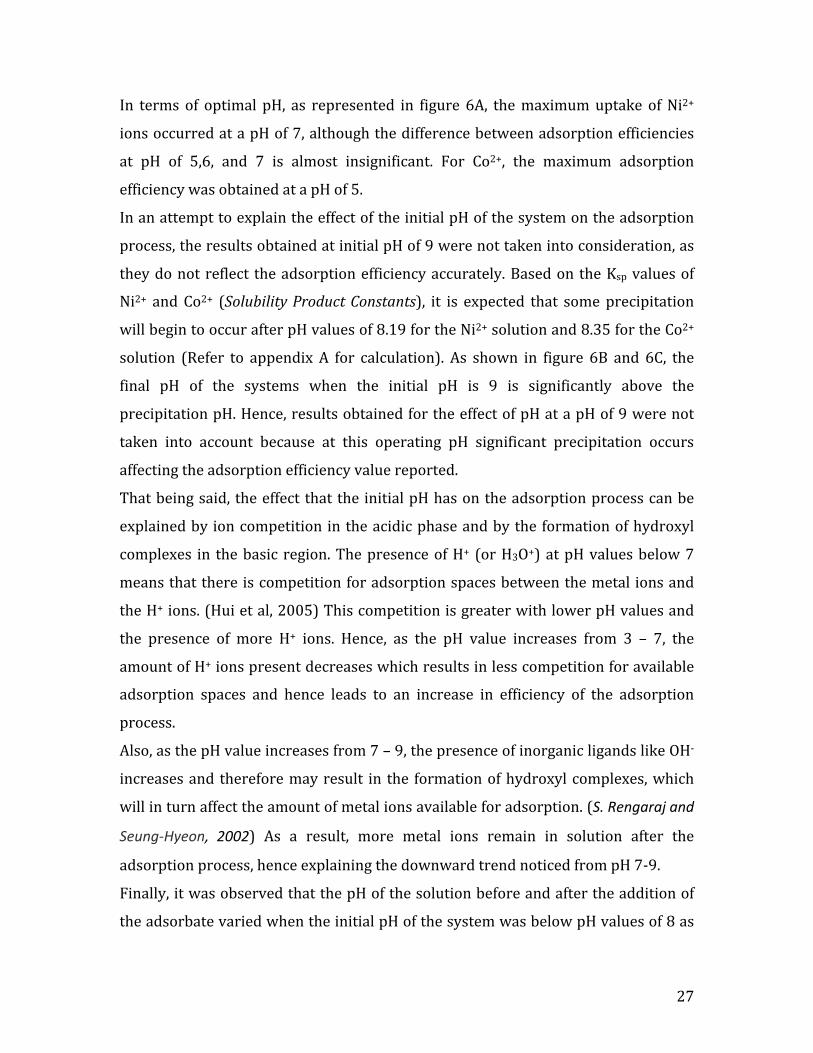
process, the results obtained at initial pH of 9 were not taken into consideration, as
they do not reflect the adsorption efficiency accurately. Based on the Ksp values of
Ni2+ and Co2+ (Solubility Product Constants), it is expected that some precipitation
will begin to occur after pH values of 8.19 for the Ni2+ solution and 8.35 for the Co2+
solution (Refer to appendix A for calculation). As shown in figure 6B and 6C, the
final pH of the systems when the initial pH is 9 is significantly above the
precipitation pH. Hence, results obtained for the effect of pH at a pH of 9 were not
taken into account because at this operating pH significant precipitation occurs
affecting the adsorption efficiency value reported.
That being said, the effect that the initial pH has on the adsorption process can be
explained by ion competition in the acidic phase and by the formation of hydroxyl
complexes in the basic region. The presence of H+ (or H3O+) at pH values below 7
means that there is competition for adsorption spaces between the metal ions and
the H+ ions. (Hui et al, 2005) This competition is greater with lower pH values and
the presence of more H+ ions. Hence, as the pH value increases from 3 – 7, the
amount of H+ ions present decreases which results in less competition for available
adsorption spaces and hence leads to an increase in efficiency of the adsorption
process.
Also, as the pH value increases from 7 – 9, the presence of inorganic ligands like OH-‐
increases and therefore may result in the formation of hydroxyl complexes, which
will in turn affect the amount of metal ions available for adsorption. (S. Rengaraj and
Seung-‐Hyeon, 2002) As a result, more metal ions remain in solution after the
adsorption process, hence explaining the downward trend noticed from pH 7-‐9.
Finally, it was observed that the pH of the solution before and after the addition of
the adsorbate varied when the initial pH of the system was below pH values of 8 as
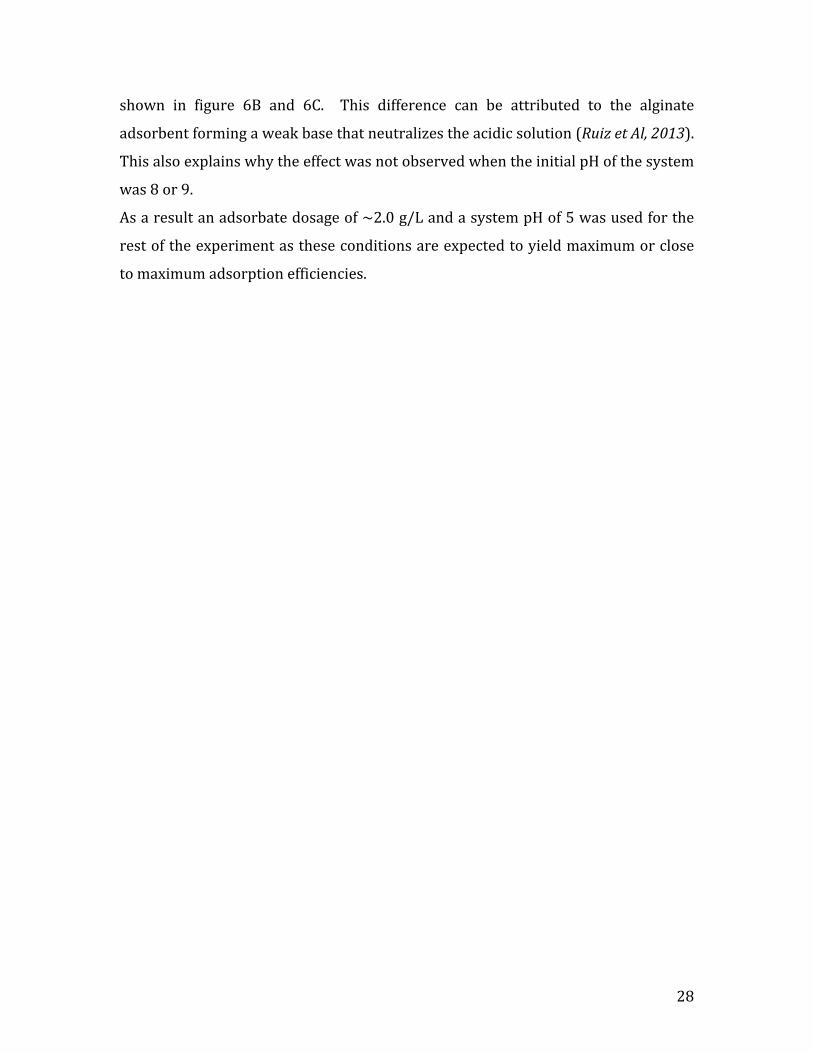
28
shown in figure 6B and 6C. This difference can be attributed to the alginate
adsorbent forming a weak base that neutralizes the acidic solution (Ruiz et Al, 2013).
This also explains why the effect was not observed when the initial pH of the system
was 8 or 9.
As a result an adsorbate dosage of ~2.0 g/L and a system pH of 5 was used for the
rest of the experiment as these conditions are expected to yield maximum or close
to maximum adsorption efficiencies.
29
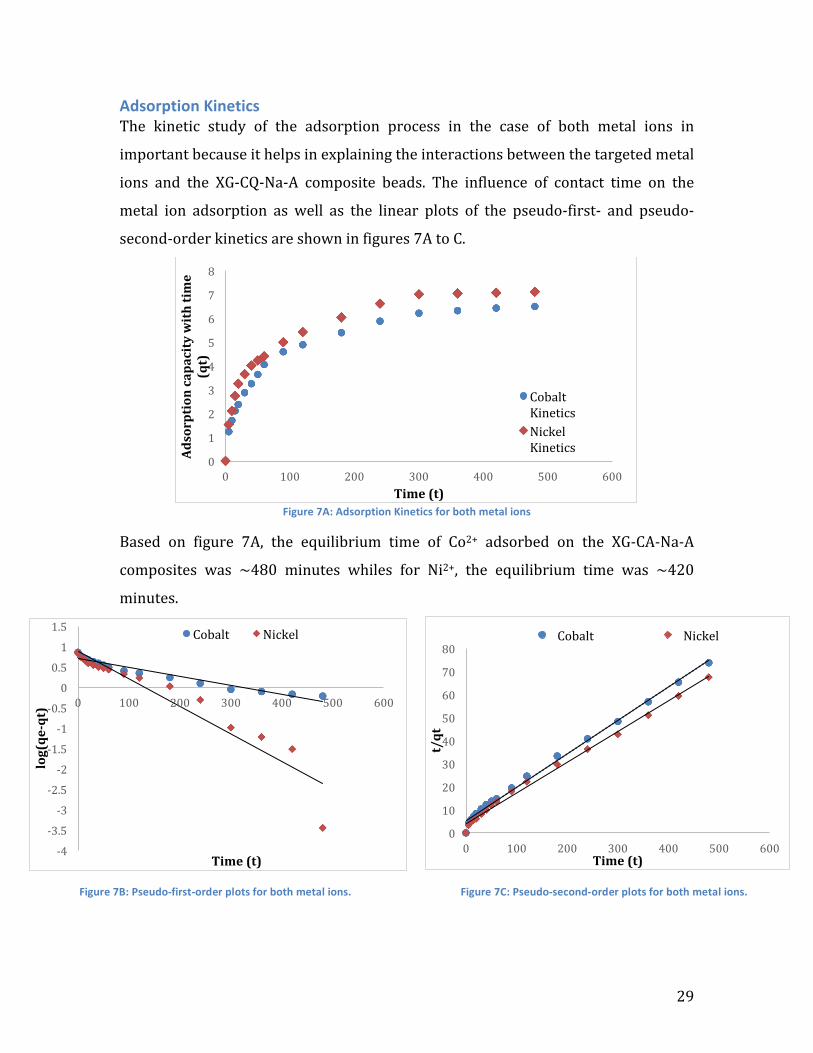
Adsorption Kinetics The kinetic study of the adsorption process in the case of both metal ions in
important because it helps in explaining the interactions between the targeted metal
ions and the XG-‐CQ-‐Na-‐A composite beads. The influence of contact time on the
metal ion adsorption as well as the linear plots of the pseudo-‐first-‐ and pseudo-‐
second-‐order kinetics are shown in figures 7A to C.
Figure 7A: Adsorption Kinetics for both metal ions
Based on figure 7A, the equilibrium time of Co2+ adsorbed on the XG-‐CA-‐Na-‐A
composites was ~480 minutes whiles for Ni2+, the equilibrium time was ~420
minutes.
0
1
2
3
4
5
6
7
8
0 100 200 300 400 500 600
Adsorption capacity with time
(qt)
Time (t)
Cobalt Kinetics Nickel Kinetics
-‐4
-‐3.5
-‐3
-‐2.5
-‐2
-‐1.5
-‐1
-‐0.5
0
0.5
1
1.5
0 100 200 300 400 500 600
log(qe-‐qt)
Time (t)
Cobalt Nickel
0
10
20
30
40
50
60
70
80
0 100 200 300 400 500 600
t/qt
Time (t)
Cobalt Nickel
Figure 7B: Pseudo-‐first-‐order plots for both metal ions. Figure 7C: Pseudo-‐second-‐order plots for both metal ions.
30
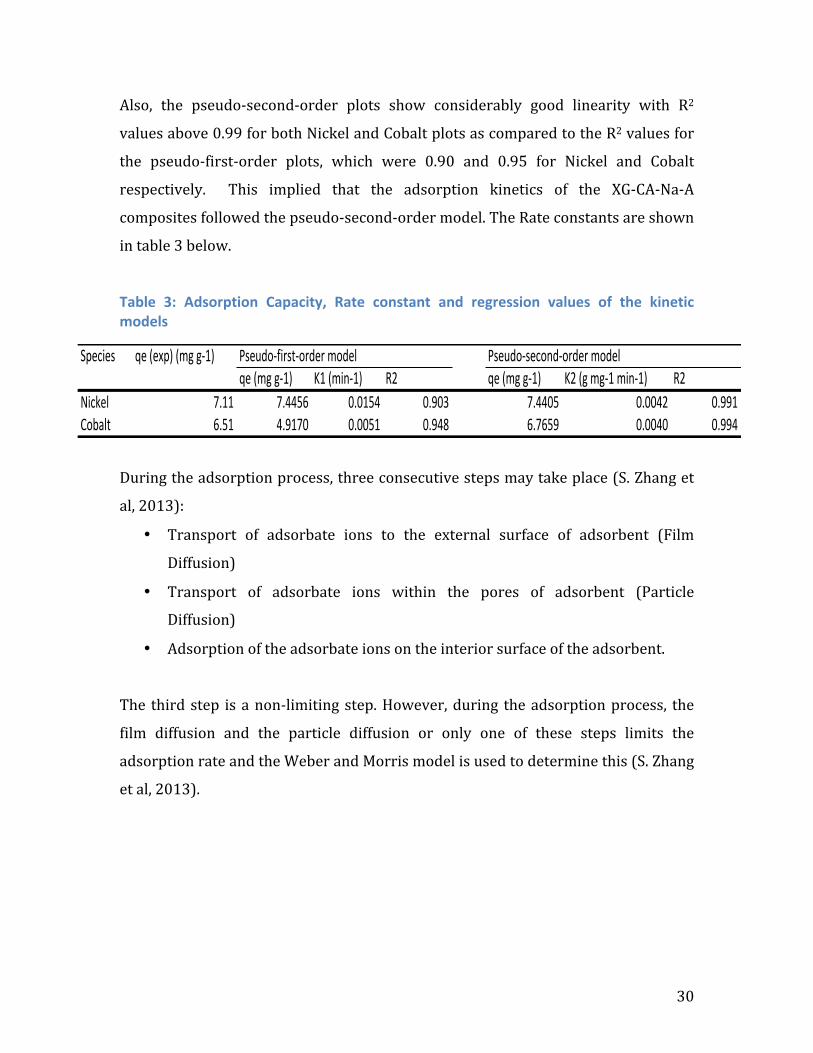
Also, the pseudo-‐second-‐order plots show considerably good linearity with R2
values above 0.99 for both Nickel and Cobalt plots as compared to the R2 values for
the pseudo-‐first-‐order plots, which were 0.90 and 0.95 for Nickel and Cobalt
respectively. This implied that the adsorption kinetics of the XG-‐CA-‐Na-‐A
composites followed the pseudo-‐second-‐order model. The Rate constants are shown
in table 3 below.
Table 3: Adsorption Capacity, Rate constant and regression values of the kinetic models
During the adsorption process, three consecutive steps may take place (S. Zhang et
al, 2013):
• Transport of adsorbate ions to the external surface of adsorbent (Film
Diffusion)
• Transport of adsorbate ions within the pores of adsorbent (Particle
Diffusion)
• Adsorption of the adsorbate ions on the interior surface of the adsorbent.
The third step is a non-‐limiting step. However, during the adsorption process, the
film diffusion and the particle diffusion or only one of these steps limits the
adsorption rate and the Weber and Morris model is used to determine this (S. Zhang
et al, 2013).
Species qe((exp)((mg(g.1) Pseudo.first.order(model Pseudo.second.order(modelqe((mg(g.1) K1((min.1) R2 qe((mg(g.1) K2((g(mg.1(min.1) R2
Nickel 7.11 7.4456 0.0154 0.903 7.4405 0.0042 0.991Cobalt 6.51 4.9170 0.0051 0.948 6.7659 0.0040 0.994
31
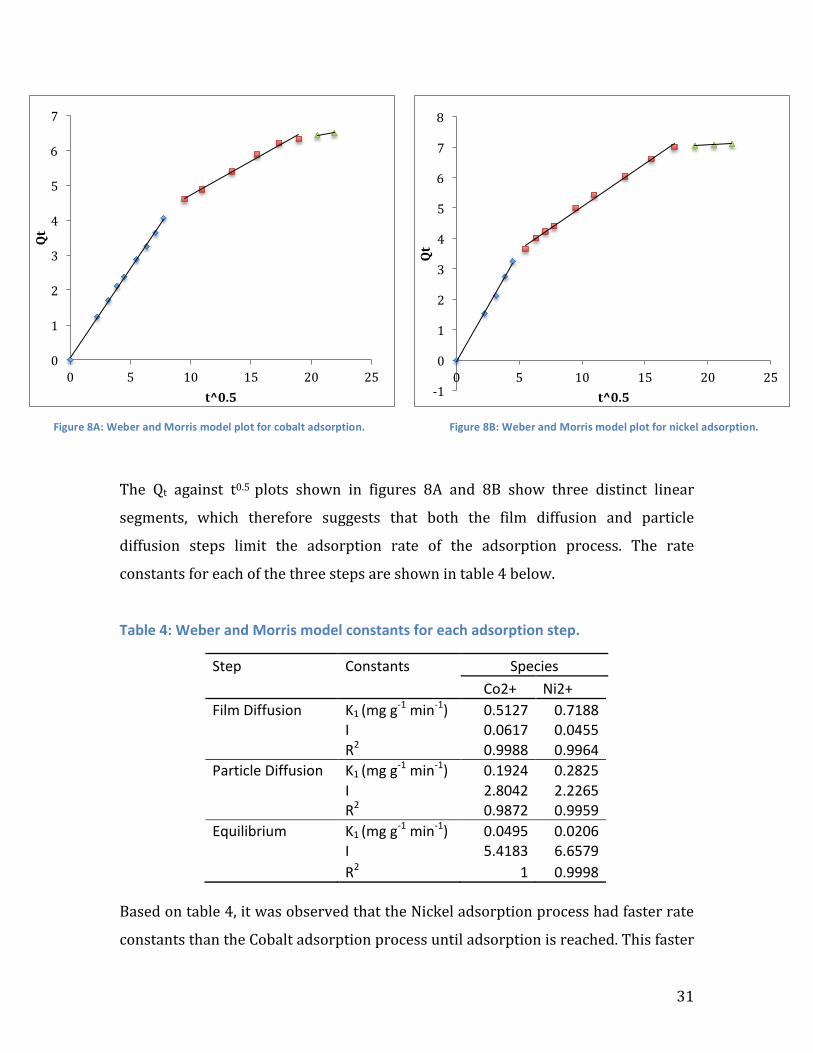
The Qt against t0.5 plots shown in figures 8A and 8B show three distinct linear
segments, which therefore suggests that both the film diffusion and particle
diffusion steps limit the adsorption rate of the adsorption process. The rate
constants for each of the three steps are shown in table 4 below.
Table 4: Weber and Morris model constants for each adsorption step.
Step Constants Species Co2+ Ni2+ Film Diffusion K1 (mg g-‐1 min-‐1) 0.5127 0.7188
I 0.0617 0.0455
R2 0.9988 0.9964 Particle Diffusion K1 (mg g-‐1 min-‐1) 0.1924 0.2825
I 2.8042 2.2265
R2 0.9872 0.9959 Equilibrium K1 (mg g-‐1 min-‐1) 0.0495 0.0206
I 5.4183 6.6579
R2 1 0.9998 Based on table 4, it was observed that the Nickel adsorption process had faster rate
constants than the Cobalt adsorption process until adsorption is reached. This faster
0
1
2
3
4
5
6
7
0 5 10 15 20 25
Qt
t^0.5 -‐1
0
1
2
3
4
5
6
7
8
0 5 10 15 20 25
Qt
t^0.5
Figure 8A: Weber and Morris model plot for cobalt adsorption. Figure 8B: Weber and Morris model plot for nickel adsorption.
32
rate compliments results shown in table 3, which suggest that the adsorption
capacity of nickel is greater than that of cobalt.
Also, the K1 values in the equilibrium step were expected to be zero. However, the
results suggest that the adsorption process was not necessarily at equilibrium yet.
This could be a possible explanation for the disparity between the experimental
adsorption capacities and the expected adsorption capacities under the pseudo-‐
second-‐order model as shown in Table 3.
33
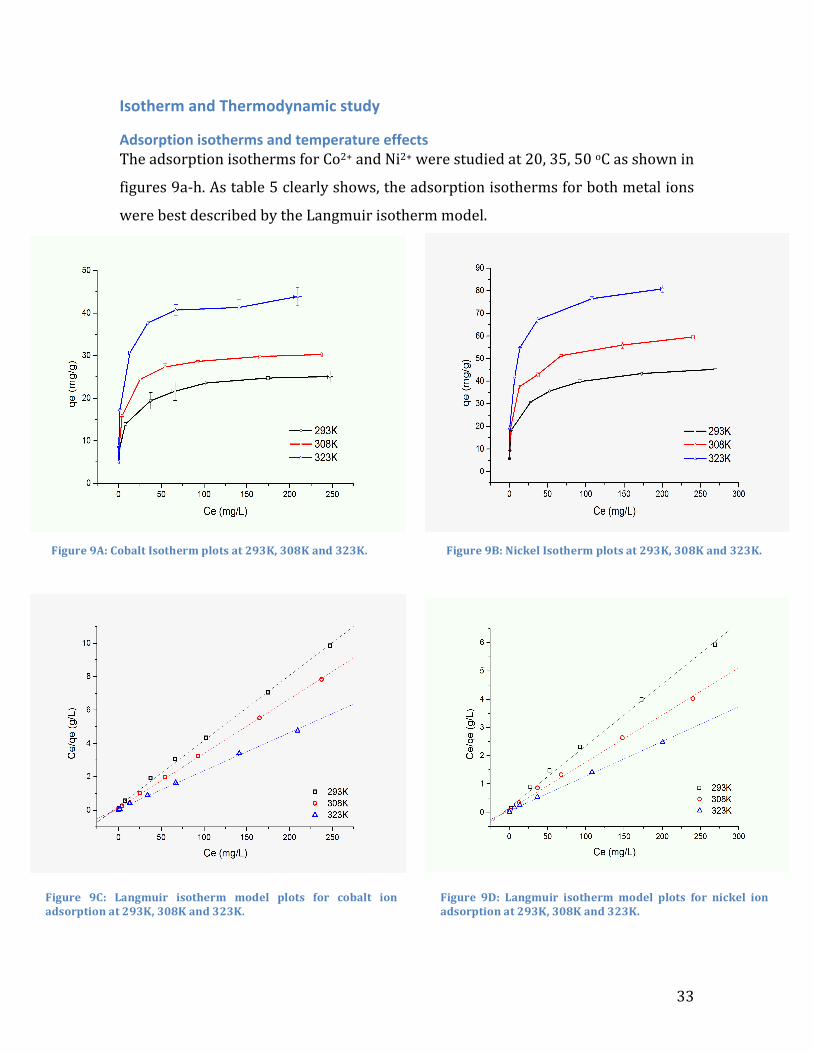
Isotherm and Thermodynamic study
Adsorption isotherms and temperature effects The adsorption isotherms for Co2+ and Ni2+ were studied at 20, 35, 50 oC as shown in
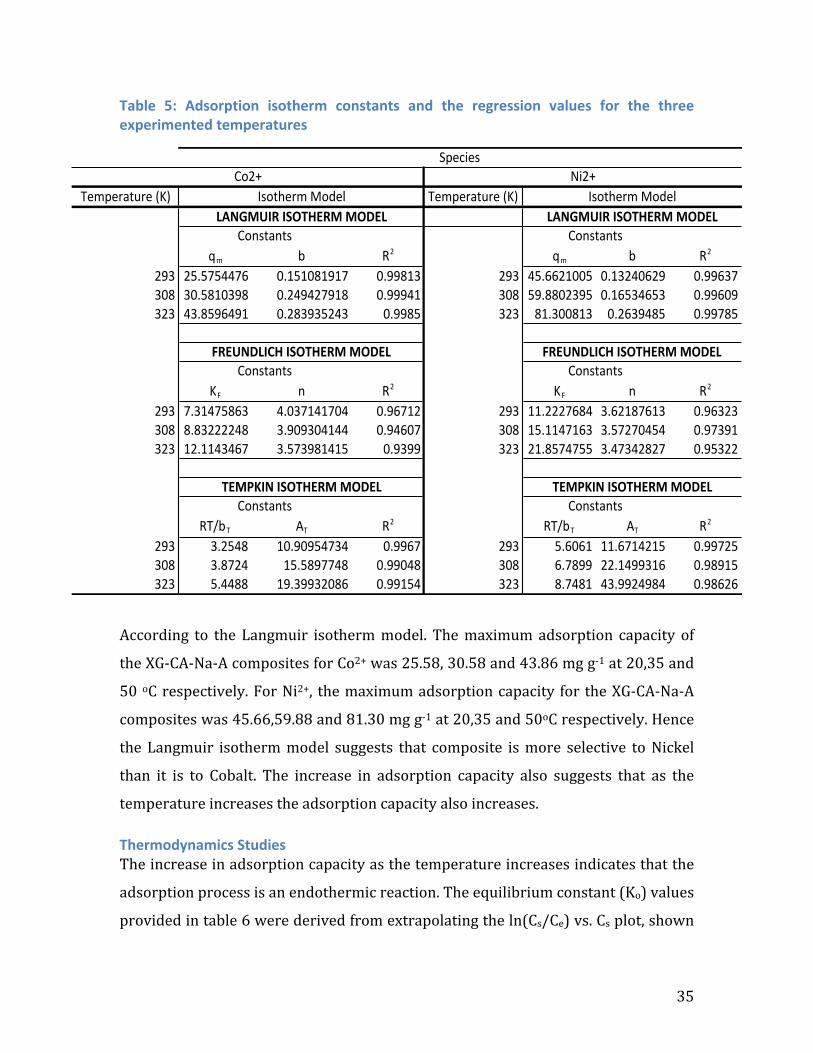
figures 9a-‐h. As table 5 clearly shows, the adsorption isotherms for both metal ions
were best described by the Langmuir isotherm model.
Figure 9A: Cobalt Isotherm plots at 293K, 308K and 323K. Figure 9B: Nickel Isotherm plots at 293K, 308K and 323K.
Figure 9C: Langmuir isotherm model plots for cobalt ion adsorption at 293K, 308K and 323K.
Figure 9D: Langmuir isotherm model plots for nickel ion adsorption at 293K, 308K and 323K.
34
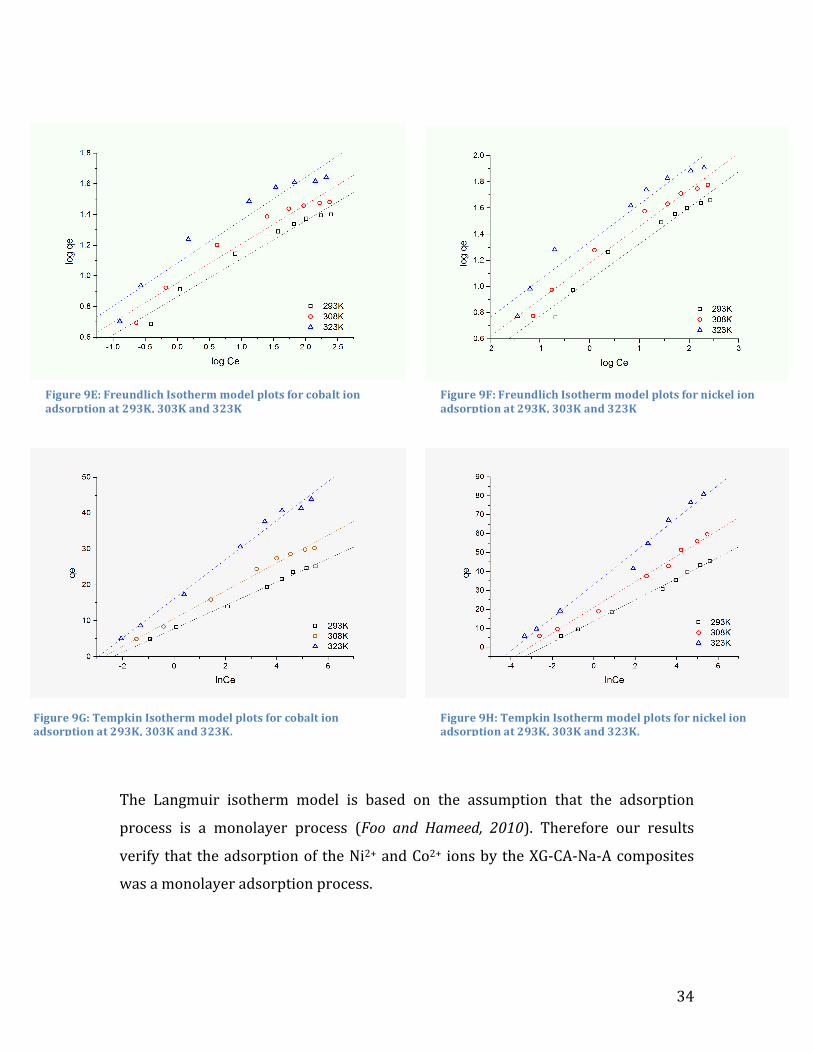
The Langmuir isotherm model is based on the assumption that the adsorption
process is a monolayer process (Foo and Hameed, 2010). Therefore our results
verify that the adsorption of the Ni2+ and Co2+ ions by the XG-‐CA-‐Na-‐A composites
was a monolayer adsorption process.
Figure 9E: Freundlich Isotherm model plots for cobalt ion adsorption at 293K, 303K and 323K
Figure 9F: Freundlich Isotherm model plots for nickel ion adsorption at 293K, 303K and 323K
Figure 9G: Tempkin Isotherm model plots for cobalt ion adsorption at 293K, 303K and 323K.
Figure 9H: Tempkin Isotherm model plots for nickel ion adsorption at 293K, 303K and 323K.
35
Table 5: Adsorption isotherm constants and the regression values for the three experimented temperatures
According to the Langmuir isotherm model. The maximum adsorption capacity of
the XG-‐CA-‐Na-‐A composites for Co2+ was 25.58, 30.58 and 43.86 mg g-‐1 at 20,35 and
50 oC respectively. For Ni2+, the maximum adsorption capacity for the XG-‐CA-‐Na-‐A
composites was 45.66,59.88 and 81.30 mg g-‐1 at 20,35 and 50oC respectively. Hence
the Langmuir isotherm model suggests that composite is more selective to Nickel
than it is to Cobalt. The increase in adsorption capacity also suggests that as the
temperature increases the adsorption capacity also increases.
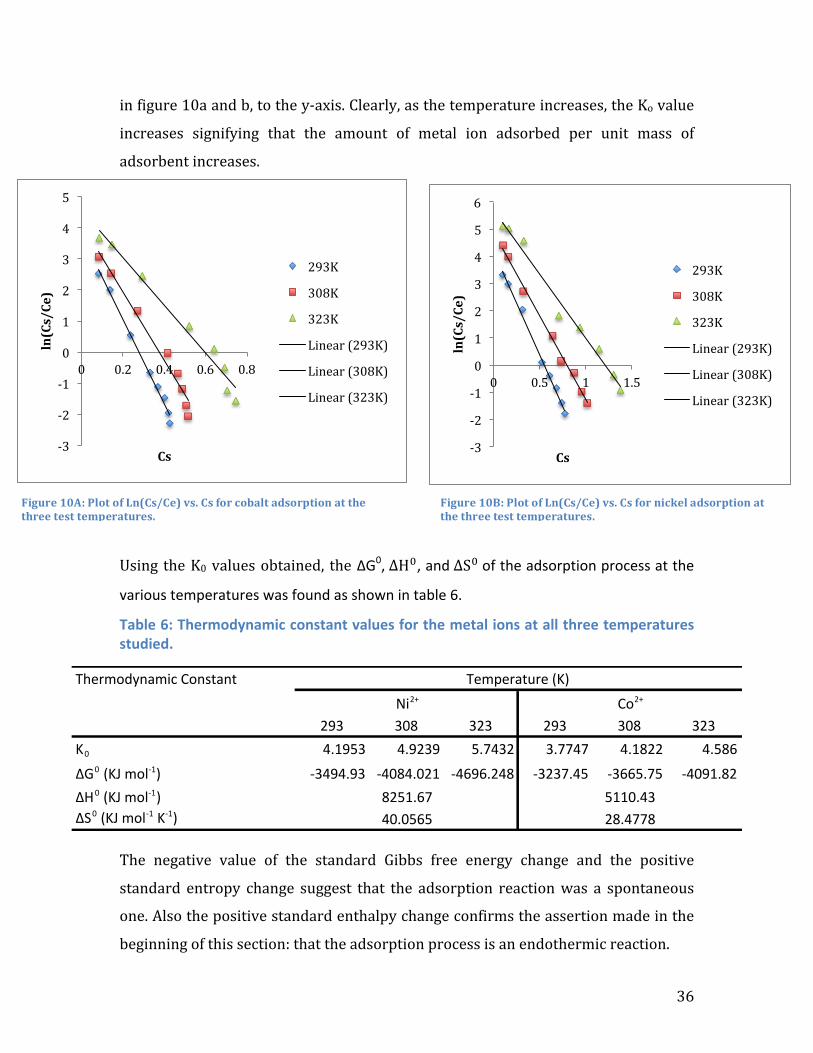
Thermodynamics Studies The increase in adsorption capacity as the temperature increases indicates that the
adsorption process is an endothermic reaction. The equilibrium constant (Ko) values
provided in table 6 were derived from extrapolating the ln(Cs/Ce) vs. Cs plot, shown
Temperature)(K) Temperature)(K)
qm b R2 qm b R2
293 25.5754476 0.151081917 0.99813 293 45.6621005 0.13240629 0.99637308 30.5810398 0.249427918 0.99941 308 59.8802395 0.16534653 0.99609323 43.8596491 0.283935243 0.9985 323 81.300813 0.2639485 0.99785
KF n R2 KF n R2
293 7.31475863 4.037141704 0.96712 293 11.2227684 3.62187613 0.96323308 8.83222248 3.909304144 0.94607 308 15.1147163 3.57270454 0.97391323 12.1143467 3.573981415 0.9399 323 21.8574755 3.47342827 0.95322
RT/bT AT R2 RT/bT AT R2
293 3.2548 10.90954734 0.9967 293 5.6061 11.6714215 0.99725308 3.8724 15.5897748 0.99048 308 6.7899 22.1499316 0.98915323 5.4488 19.39932086 0.99154 323 8.7481 43.9924984 0.98626
Isotherm)ModelLANGMUIR)ISOTHERM)MODEL
Constants Constants
FREUNDLICH)ISOTHERM)MODELFREUNDLICH)ISOTHERM)MODELConstants
Constants Constants
Constants
TEMPKIN)ISOTHERM)MODEL TEMPKIN)ISOTHERM)MODEL
Species
LANGMUIR)ISOTHERM)MODELIsotherm)Model
Co2+ Ni2+
36
in figure 10a and b, to the y-‐axis. Clearly, as the temperature increases, the Ko value
increases signifying that the amount of metal ion adsorbed per unit mass of
adsorbent increases.
Using the K0 values obtained, the ΔG0, ΔH!, and ΔS! of the adsorption process at the
various temperatures was found as shown in table 6.
Table 6: Thermodynamic constant values for the metal ions at all three temperatures studied.
The negative value of the standard Gibbs free energy change and the positive
standard entropy change suggest that the adsorption reaction was a spontaneous
one. Also the positive standard enthalpy change confirms the assertion made in the
beginning of this section: that the adsorption process is an endothermic reaction.
-‐3
-‐2
-‐1
0
1
2
3
4
5
0 0.2 0.4 0.6 0.8
ln(Cs/Ce)
Cs
293K
308K
323K
Linear (293K)
Linear (308K)
Linear (323K)
-‐3
-‐2
-‐1
0
1
2
3
4
5
6
0 0.5 1 1.5
ln(Cs/Ce)
Cs
293K
308K
323K
Linear (293K)
Linear (308K)
Linear (323K)
Thermodynamic-Constant
293 308 323 293 308 323K0 4.1953 4.9239 5.7432 3.7747 4.1822 4.586ΔG0-(KJ-molB1) B3494.93 B4084.021 B4696.248 B3237.45 B3665.75 B4091.82ΔH0-(KJ-molB1)ΔS0-(KJ-molB1-KB1)
8251.6740.0565
5110.4328.4778
Temperature-(K)Ni2+ Co2+
Figure 10A: Plot of Ln(Cs/Ce) vs. Cs for cobalt adsorption at the three test temperatures.
Figure 10B: Plot of Ln(Cs/Ce) vs. Cs for nickel adsorption at the three test temperatures.
37
Competing effects
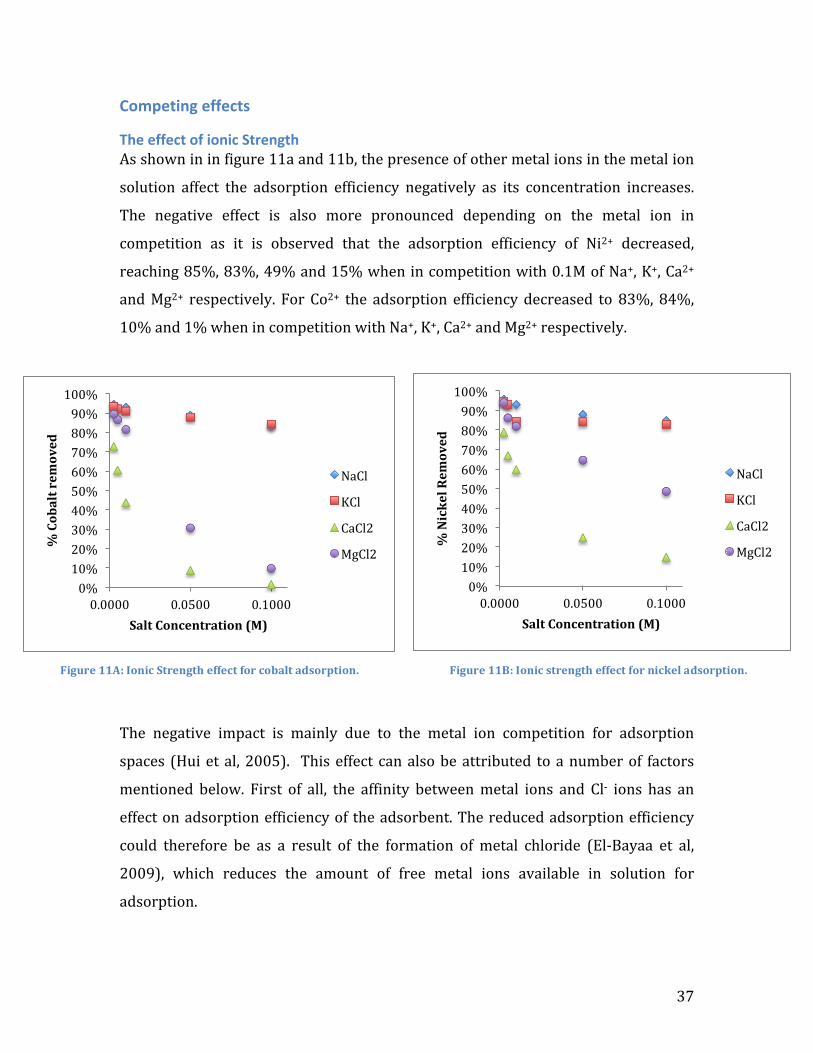
The effect of ionic Strength As shown in in figure 11a and 11b, the presence of other metal ions in the metal ion
solution affect the adsorption efficiency negatively as its concentration increases.
The negative effect is also more pronounced depending on the metal ion in
competition as it is observed that the adsorption efficiency of Ni2+ decreased,
reaching 85%, 83%, 49% and 15% when in competition with 0.1M of Na+, K+, Ca2+
and Mg2+ respectively. For Co2+ the adsorption efficiency decreased to 83%, 84%,
10% and 1% when in competition with Na+, K+, Ca2+ and Mg2+ respectively.
The negative impact is mainly due to the metal ion competition for adsorption
spaces (Hui et al, 2005). This effect can also be attributed to a number of factors
mentioned below. First of all, the affinity between metal ions and Cl-‐ ions has an
effect on adsorption efficiency of the adsorbent. The reduced adsorption efficiency
could therefore be as a result of the formation of metal chloride (El-‐Bayaa et al,
2009), which reduces the amount of free metal ions available in solution for
adsorption.
0% 10% 20% 30% 40% 50% 60% 70% 80% 90% 100%
0.0000 0.0500 0.1000
% Cobalt rem
oved
Salt Concentration (M)
NaCl
KCl
CaCl2
MgCl2
0% 10% 20% 30% 40% 50% 60% 70% 80% 90% 100%
0.0000 0.0500 0.1000
% Nickel Rem
oved
Salt Concentration (M)
NaCl
KCl
CaCl2
MgCl2
Figure 11A: Ionic Strength effect for cobalt adsorption. Figure 11B: Ionic strength effect for nickel adsorption.
38
Secondly, the increase in salt concentration results in an increase in the ionic
strength. This increase in ionic strength results in the increase in the ratio of
chelation to ion exchange (El-‐Bayaa et al, 2009). Hence as the salt concentration
increases there is a corresponding decrease in the ion exchange process, which
results in a decrease in the adsorption efficiency. There is also decreasing activity of
metal ions in solution due to increasing non-‐ideality of the solution with ionic
strength (El-‐Bayaa et al, 2009).
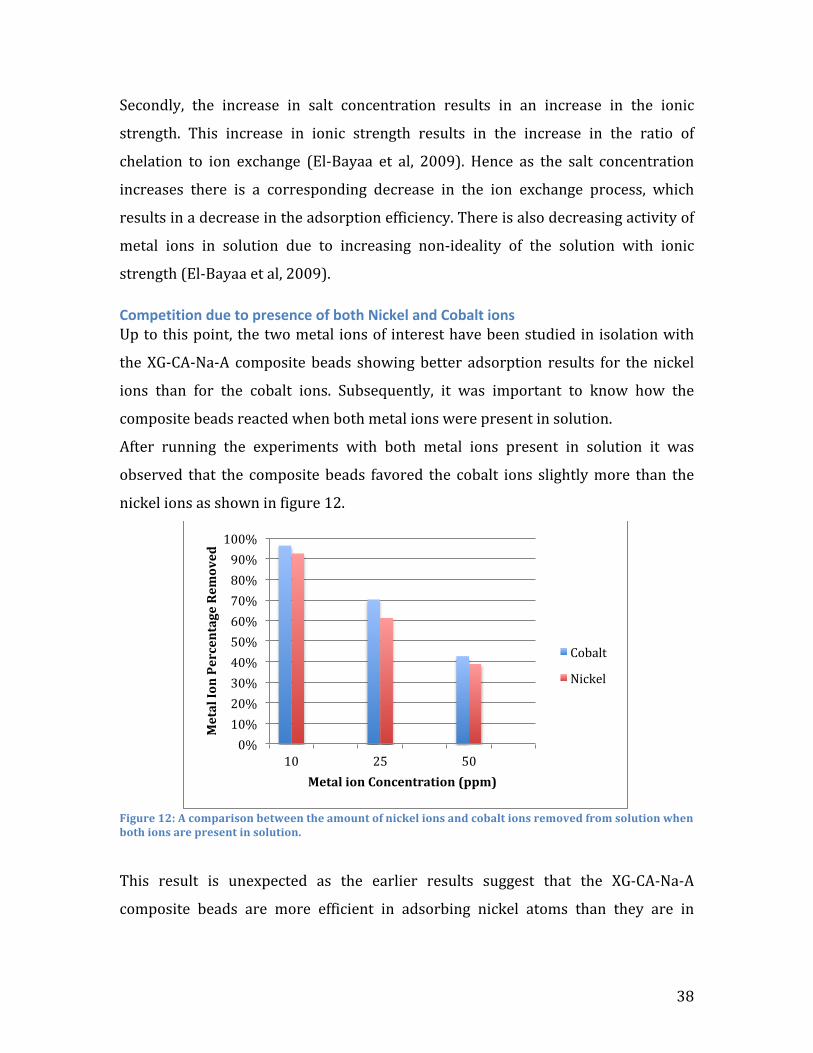
Competition due to presence of both Nickel and Cobalt ions Up to this point, the two metal ions of interest have been studied in isolation with
the XG-‐CA-‐Na-‐A composite beads showing better adsorption results for the nickel
ions than for the cobalt ions. Subsequently, it was important to know how the
composite beads reacted when both metal ions were present in solution.
After running the experiments with both metal ions present in solution it was
observed that the composite beads favored the cobalt ions slightly more than the
nickel ions as shown in figure 12.
Figure 12: A comparison between the amount of nickel ions and cobalt ions removed from solution when both ions are present in solution.
This result is unexpected as the earlier results suggest that the XG-‐CA-‐Na-‐A
composite beads are more efficient in adsorbing nickel atoms than they are in
0% 10% 20% 30% 40% 50% 60% 70% 80% 90% 100%
10 25 50
Metal Ion Percentage Rem
oved
Metal ion Concentration (ppm)
Cobalt
Nickel
39
adsorbing cobalt ions. The disparity can however be explained by looking closely at
the free energy of hydration shown in table 7.
Table 7: The hydrated Ionic radii and Free energy of Hydration for the metal ions in solution.
Metal Ion
Ionic Radii (Hydrated) (nm) Free Energy of Hydration (Kcal g-‐1 ion)
Co2+ 0.423 -‐479.5 Ni2+ 0.404 -‐494.2
(Volkov et. al, 1997) (Hui et. al, 2005)
Based on the free energy of hydration the metal with the highest free energy of
hydration should prefer to remain in the solution phase (Hui et al, 2005). Hence
even though the hydration ionic radii of the cobalt ion is greater than that of the
nickel ion, there is still more cobalt available for adsorption than nickel and that
therefore explains why more cobalt ions are adsorbed when both metal ions are
present in solution.
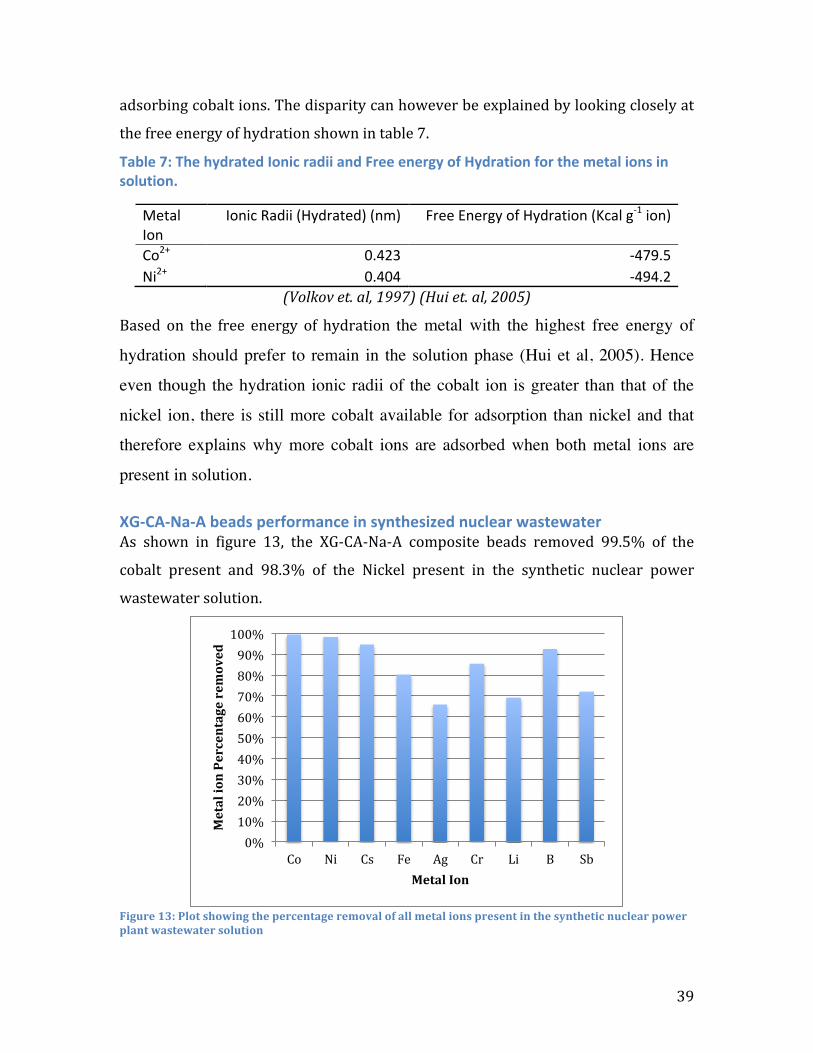
XG-‐CA-‐Na-‐A beads performance in synthesized nuclear wastewater As shown in figure 13, the XG-‐CA-‐Na-‐A composite beads removed 99.5% of the
cobalt present and 98.3% of the Nickel present in the synthetic nuclear power
wastewater solution.
Figure 13: Plot showing the percentage removal of all metal ions present in the synthetic nuclear power plant wastewater solution
0% 10% 20% 30% 40% 50% 60% 70% 80% 90% 100%
Co Ni Cs Fe Ag Cr Li B Sb
Metal ion Percentage rem
oved
Metal Ion
40
These results confirmed the XG-‐CA-‐Na-‐A composites’ ability in treating real
wastewater containing nickel and cobalt, as their removal percentages remain high
even with the presence of other competing metal ions.
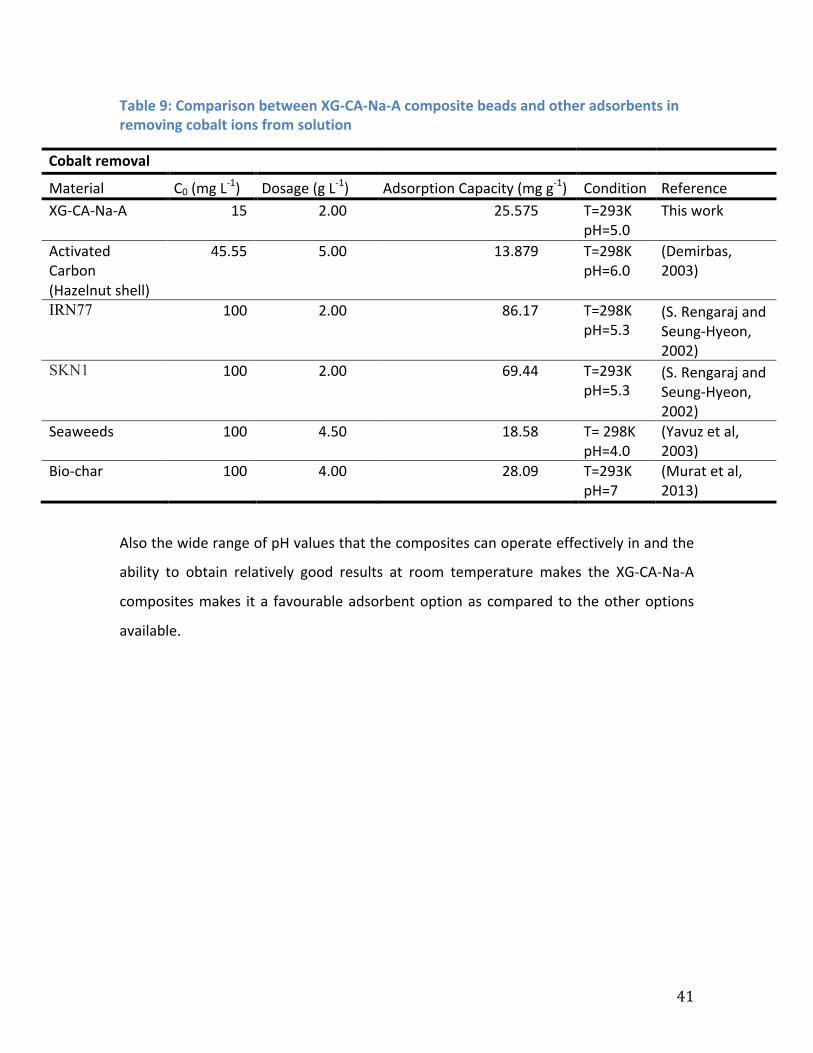
Comparisons between XG-‐CA-‐Na-‐A beads and other previously studied Adsorbents. With the results obtained above the efficiency of the XG-‐CA-‐Na-‐A beads can only be
qualified by comparing these results to results available for other potential adsorbents.
As tables 7 and 8, the XG-‐CA-‐Na-‐A composites beads look promising with respect to Ni2+
and Co2+ adsorption since it had relatively high adsorption capacities in the treatment of
wastewater containing low concentrations of Co2+ and Ni2+ ions.
Table 8: Comparison between XG-‐CA-‐Na-‐A composite beads and other adsorbents in removing nickel ions from solution
Nickel removal
Material C0 (mg L-‐1) Dosage (g L-‐1) Adsorption Capacity (mg g-‐1) Condition Reference XG-‐CA-‐Na-‐A 15 2.00 45.662 T=293K
pH=5 This work
GMZ Bentonite 2-‐24.03 0.50 14.396 T= 303K pH=5.4
(Yang et al, 2009)
Oxidized Carbon Nanotubes
10-‐200 0.20 49.261 T= 293K pH=6
(Munther and Meunier, 2007)
Modified Activated Carbon
25 5.00 37.175 T=293K pH=5
(Hasar, H, 2003)
Seaweed 100 4.50 20.63 T=293K pH=4.5
(Vijayaraghavan et al, 2004)
NFK-‐6 Zeolite
9.34
0.60
8.5202 T=293K pH=6.25
(Zhang et al, 2010)
Bio-‐char 100 7.00 22.22 T=293K pH=7
(Murat et al, 2013)
41
Table 9: Comparison between XG-‐CA-‐Na-‐A composite beads and other adsorbents in removing cobalt ions from solution
Cobalt removal
Material C0 (mg L-‐1) Dosage (g L-‐1) Adsorption Capacity (mg g-‐1) Condition Reference XG-‐CA-‐Na-‐A 15 2.00 25.575 T=293K
pH=5.0 This work
Activated Carbon (Hazelnut shell)
45.55 5.00 13.879 T=298K pH=6.0
(Demirbas, 2003)
IRN77 100 2.00 86.17 T=298K pH=5.3
(S. Rengaraj and Seung-‐Hyeon, 2002)
SKN1 100
2.00 69.44 T=293K pH=5.3
(S. Rengaraj and Seung-‐Hyeon, 2002)
Seaweeds
100
4.50
18.58 T= 298K pH=4.0
(Yavuz et al, 2003)
Bio-‐char 100
4.00 28.09 T=293K pH=7
(Murat et al, 2013)
Also the wide range of pH values that the composites can operate effectively in and the
ability to obtain relatively good results at room temperature makes the XG-‐CA-‐Na-‐A
composites makes it a favourable adsorbent option as compared to the other options
available.
42
CONCLUSION The present study showed that the XG-‐CA-‐Na-‐A composite beads, which is easily
available and can be easily prepared, were effective in removing both cobalt and nickel
metal ions from aqueous solutions compared to many other adsorbents. It was
discovered that the optimal condition for metal ion adsorption using these composite
beads were at a pH of 5 and an adsorbent dosage of 2g L-‐1. The study also revealed that
the adsorptive capacity of the composite beads increased with increasing temperature.
In terms of kinetics, the Pseudo-‐second-‐order model best described the adsorption
kinetics and based on the Weber and Morris model the adsorption process is limited by
both the film diffusion and particle diffusion step.
The Langmuir isotherm model best described the adsorption process and based on the
thermodynamic study, the adsorption process is an endothermic reaction and a
spontaneous one.
FUTURE PERSPECTIVES Now that this project has verified that the XG-‐CA-‐Na-‐A composites can be effective
adsorbents in the removal of heavy metals from nuclear power plant wastewater, it will
be important to test the behavior of these beads in a column. The behavior and the
effectiveness of the beads when they are in a pilot scale adsorption column will be
necessary in order to effectively conclude on the viability of these composite beads as
adsorbents in the industry.
43
REFERENCES 1. Nuclear Power Plant Radioactive Water Remediation. New Logic Research, Inc. -‐
Industries Water. Web. 21 Sept. 2013. <http://www.vsep.com/industries/nuclear.html>
2. S. Rengaraj, Seung-‐Hyeon Moon, Kinetics of adsorption of Co (II) removal from water and wastewater by ion exchange resins, Water Research, 2002, 36(7), pp. 1783-‐1793.
3. S. Babel, T.A. Kurniawan, Cr(VI) removal from synthetic wastewater using coconut shell charcoal and commercial activated carbon modified with oxidizing agents and/or chitosan. Chemosphere, 54 (7) (2004), pp. 951–967.
4. Fenglian Fu, Qi Wang, Removal of heavy metal ions from wastewaters: A review, Journal of Environmental Management, Volume 92, Issue 3, March 2011, pp 407-‐418.
5. Health and Ecological Criteria Division (HECD), Office of Science and Technology (OST), Office of Water (OW) for Office of Groundwater/Drinking Water (OGWDW), OW, United States Environmental Protection Agency (U.S. EPA). Drinking Water Health Advisory for Boron and Compounds, 2008.
6. United States Environmental Protection Agency (U.S. EPA). Drinking Water Contaminants. 3 June 2013. Web. 21 Sept. 2013. <http://water.epa.gov/drink/contaminants/index.cfm>
7. United States Department of Natural Resources (US DNR). Groundwater Quality Standards. 2012. [Data file]. Retrieved from http://docs.legis.wisconsin.gov/code/admin_code/nr/100/140.pdf
8. M.A. Barakat, New trends in removing heavy metals from industrial wastewater, Arabian Journal of Chemistry, Volume 4, Issue 4, October 2011, Pages 361-‐377 .
9. L.K. Wang, Y.T. Hung, N.K. Shammas (Eds.), Chemical precipitation Physicochemical Treatment Processes, vol. 3. Humana Press, New Jersey (2004), pp. 141–198.
10. Rahman et al, Liquid Radioactive Wastes Treatment: A review, Water, 12 May 2011, pp. 551-‐565.
11. Kurniawan, T.A., Chan, G.Y.S., Lo, W.H., Babel, S., Physicochemical treatment techniques for wastewater laden with heavy metals. Chemical Engineering Journal Vol. 118,May 2006., 83-‐98.
12. A.D. Dhale, V.V. Mahajani, Studies in treatment of disperse dye waste: membrane–wet oxidation process. Waste Management, Volume 20, Issue 1, February 2000, Pages 85-‐92.
13. Stephen R. Schulte, A guide to lowering pollution and recovering valuable process constituents. Products Finishing, September 2011. October 9th 2013. Retrieved from: http://www.pfonline.com/articles/recoveryrecycling-‐methods-‐for-‐platers
44
14. Sam Catalano, Jason Lawrence et al, Adsorbers, Encyclopedia of Chemical Engineering Equipment, 2005. October 9th 2013. Retrieved from: http://encyclopedia.che.engin.umich.edu/Pages/SeparationsChemical/Adsorbers/Adsorbers.html
15. Geoffrey L. Price, What is a Zeolite? Web. October 9TH 2013. Retrieved from: http://www.personal.utulsa.edu/~geoffrey-‐price/zeolite/zeo_narr.htm
16. Zhang, S, Xu Fang, Silica modified calcium alginate – xanthan gum hybrid bead composites for the removal and recovery of Pb(II) from aqueous solution. Chemical Engineering Journal Vol. 234, September 2013, Pages 33-‐42.
17. K.S. Hui, C.Y.H. Chao, S.C. Kot, Removal of mixed heavy metal ions in wastewater by zeolite 4A and residual products from recycled coal fly ash, Journal of Hazardous Materials, Volume 127, Issues 1–3, 9 December 2005, Pages 89-‐101.
18. V.C. Srivastava, M.M. Swamy, I.D. Mall, B. Prasad, I.M. Mishra, Adsorptive removal of phenol by bagasse fly ash and activated carbon: equilibrium, kinetics and thermodynamics, Colloids Surf., A 272 (2006) 89–104.
19. K.Y. Foo, B.H. Hameed, Insights into the modeling of adsorption isotherm systems, Chemical Engineering Journal Vol. 156, January 2010, Pages 2-‐10.
20. C. Luo, R. Wei, D. Guo, S. Zhang, S. Yan, Adsorption behavior of MnO2 functionalized multi-‐walled carbon nanotubes for the removal of cadmium from aqueous solutions, Chemical Engineering Journal Vol. 225, 1 June 2013, Pages 406–415.
21. D. Mohan, K.P. Singh, Single-‐and multi-‐component adsorption of cadmium and zinc using activated carbon derived from bagasse-‐an agricultural waste, Water Research Vol. 36, May 2002, Pages 2304–2318.
22. Halil Hasar, Adsorption of nickel(II) from aqueous solution onto activated carbon prepared from almond husk, Journal of Hazardous Materials, Volume 97, 28 February 2003, Pages 49-‐57.
23. Shitong Yang, Jiaxing Li, Yi Lu, Yixue Chen, Xiangke Wang, Sorption of Ni(II) on GMZ bentonite: Effects of pH, ionic strength, foreign ions, humic acid and temperature, Applied Radiation and Isotopes, Volume 67, Issue 9, September 2009, Pages 1600-‐1608.
24. Zhang Hui, Xianjin Yu, Lei Chen, Yongjie Jing, Zhiwei Ge, Study of Ni adsorption on NKF-‐6 zeolite, Journal of Environmental Radioactivity, Vol 101, 24 September 2010, Pages 1061-‐1069
25. Munther Issa Kandah, Jean-‐Luc Meunier, Removal of nickel ions from water by multi-‐walled carbon nanotubes, Journal of Hazardous Materials, Volume 146, Issues 1–2, 19 July 2007, Pages 283-‐288.
26. Xue-‐Song Wang, Juan Huang, Huai-‐Qiong Hu, Jing Wang, Yong Qin, Determination of kinetic and equilibrium parameters of the batch adsorption of Ni(II) from aqueous solutions by Na-‐mordenite, Journal of Hazardous Materials, Volume 142, 2 April 2007, Pages 468-‐476.
45
27. Erhan Demirbas, Adsorption of Cobalt (II) ions from Aqueous solution onto Activated Carbon Prepared from Hazelnut Shells, Adsorption Science and Technology Vol. 21, 22 August 2003, Pages 951-‐963.
28. Ömer Yavuz, Yalçin Altunkaynak, Fuat Güzel, Removal of copper, nickel, cobalt and manganese from aqueous solution by kaolinite, Water Research, Volume 37, Issue 4, February 2003, Pages 948-‐952
29. M. Ruiz, C. Tobalina, H. Demey-‐Cedeño, J.A. Barron-‐Zambrano, A.M. Sastre, Sorption of boron on calcium alginate gel beads, Reactive and Functional Polymers, Volume 73, Issue 4, April 2013, Pages 653-‐657, ISSN 1381-‐5148,
30. Solubility-‐Product Constants for compounds at 25oC. Web. February 14th 2014. Retrieved from: https://www.chem21labs.com/reference/SolubilityProductConstant.pdf
31. Murat Kılıç, Çisem Kırbıyık, Özge Çepelioğullar, Ayşe E. Pütün, Adsorption of heavy metal ions from aqueous solutions by bio-‐char, a by-‐product of pyrolysis, Applied Surface Science, Volume 283, 15 October 2013, Pages 856-‐862.
32. K. Vijayaraghavan, J. Jegan, K. Palanivelu, M. Velan, Biosorption of cobalt (II) and nickel(II) by seaweeds: batch and column studies, Separation and Purification Technology, 6 December 2004, Pages 53–59
33. A.A. El-‐Bayaa, N.A. Badawy, E. Abd AlKhalik, Effect of ionic strength on the adsorption of copper and chromium ions by vermiculite pure clay mineral, Journal of Hazardous Materials, Volume 170, Issues 2–3, 30 October 2009, Pages 1204-‐1209.
34. Cobalt – Co, Lenntech water treatment solutions. Web. March 6th 2014. Retrieved from: http://www.lenntech.com/periodic/elements/co.htm
35. Nickel – Ni, Lenntech water treatment solutions. Web. March 6th 2014. Retrieved from: http://www.lenntech.com/periodic/elements/ni.htm
36. Volkov, Adrian, Gourary, S. Paula, and D. W. Deamer, Two mechanisms of permeation of small neutral molecules and hydrated ions across phospholipid bilayers, Bioelectrochem. Bioenergetics 42:153-‐160, 1997. Retrieved from: http://www.electrobionics.org/ionic_radii.pdf
46
APPENDIX
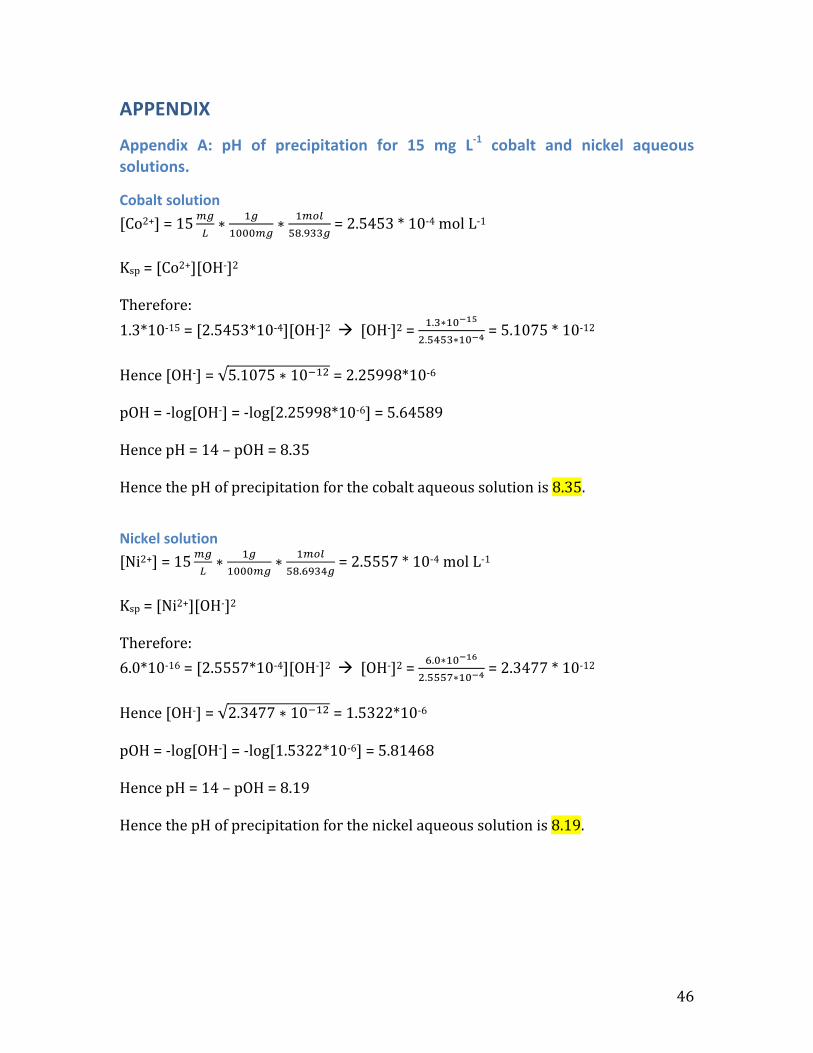
Appendix A: pH of precipitation for 15 mg L-‐1 cobalt and nickel aqueous solutions.
Cobalt solution [Co2+] = 15!"
!∗ !!!"""!"
∗ !!"#!".!""!
= 2.5453 * 10-‐4 mol L-‐1 Ksp = [Co2+][OH-‐]2 Therefore: 1.3*10-‐15 = [2.5453*10-‐4][OH-‐]2 ! [OH-‐]2 = !.!∗!"
!!"
!.!"!#∗!"!! = 5.1075 * 10-‐12
Hence [OH-‐] = 5.1075 ∗ 10!!" = 2.25998*10-‐6
pOH = -‐log[OH-‐] = -‐log[2.25998*10-‐6] = 5.64589 Hence pH = 14 – pOH = 8.35 Hence the pH of precipitation for the cobalt aqueous solution is 8.35.
Nickel solution [Ni2+] = 15!"
!∗ !!!"""!"
∗ !!"#!".!"#$!
= 2.5557 * 10-‐4 mol L-‐1 Ksp = [Ni2+][OH-‐]2 Therefore: 6.0*10-‐16 = [2.5557*10-‐4][OH-‐]2 ! [OH-‐]2 = !.!∗!"
!!"
!.!!!"∗!"!! = 2.3477 * 10-‐12
Hence [OH-‐] = 2.3477 ∗ 10!!" = 1.5322*10-‐6
pOH = -‐log[OH-‐] = -‐log[1.5322*10-‐6] = 5.81468 Hence pH = 14 – pOH = 8.19 Hence the pH of precipitation for the nickel aqueous solution is 8.19.


