Adsorption of Extracellular Matrix Protein Fibronectin on the … · Kemolaran kalsium hidroksida...
11
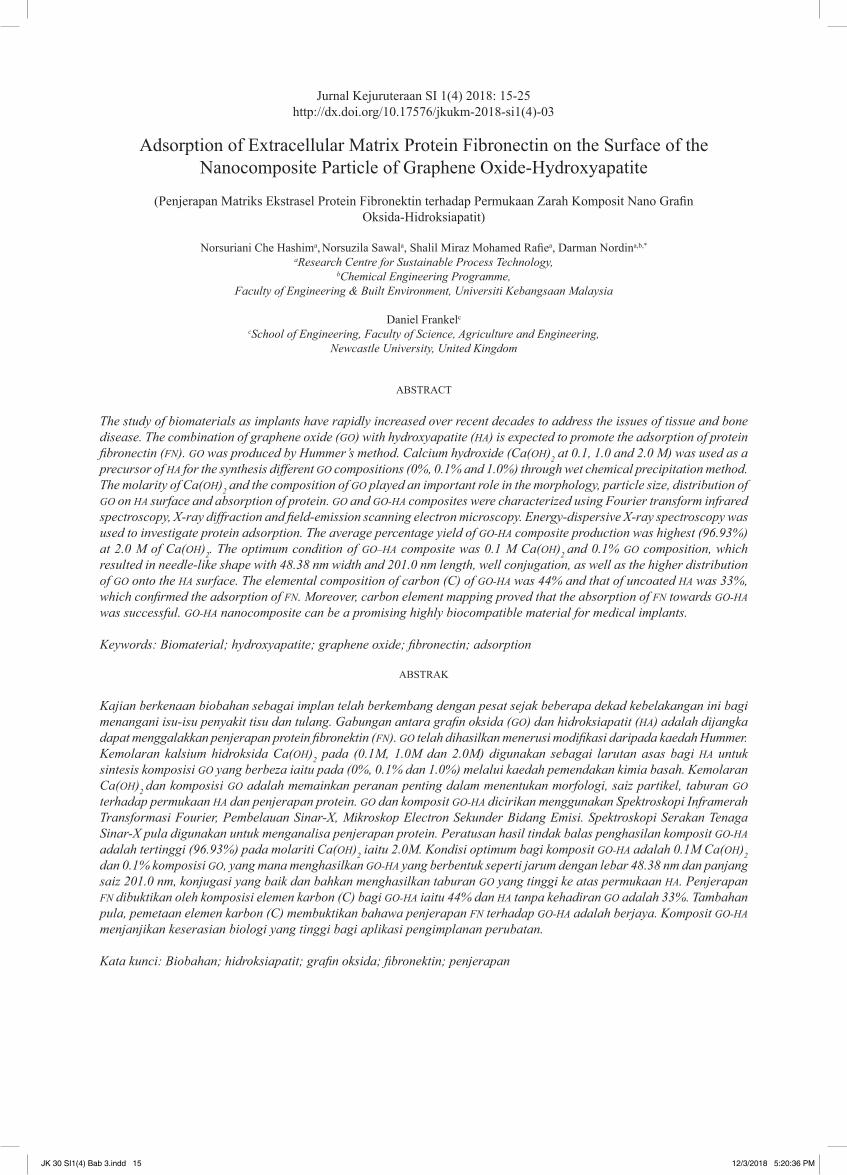
Jurnal Kejuruteraan SI 1(4) 2018: 15-25 http://dx.doi.org/10.17576/jkukm-2018-si1(4)-03 Adsorption of Extracellular Matrix Protein Fibronectin on the Surface of the Nanocomposite Particle of Graphene Oxide-Hydroxyapatite (Penjerapan Matriks Ekstrasel Protein Fibronektin terhadap Permukaan Zarah Komposit Nano Grafin Oksida-Hidroksiapatit) Norsuriani Che Hashim a , Norsuzila Sawal a , Shalil Miraz Mohamed Rafie a , Darman Nordin a,b,* a Research Centre for Sustainable Process Technology, b Chemical Engineering Programme, Faculty of Engineering & Built Environment, Universiti Kebangsaan Malaysia Daniel Frankel c c School of Engineering, Faculty of Science, Agriculture and Engineering, Newcastle University, United Kingdom ABSTRACT The study of biomaterials as implants have rapidly increased over recent decades to address the issues of tissue and bone disease. The combination of graphene oxide (GO) with hydroxyapatite (HA) is expected to promote the adsorption of protein fibronectin (FN). GO was produced by Hummer’s method. Calcium hydroxide (Ca(OH) 2 at 0.1, 1.0 and 2.0 M) was used as a precursor of HA for the synthesis different GO compositions (0%, 0.1% and 1.0%) through wet chemical precipitation method. The molarity of Ca(OH) 2 and the composition of GO played an important role in the morphology, particle size, distribution of GO on HA surface and absorption of protein. GO and GO-HA composites were characterized using Fourier transform infrared spectroscopy, X-ray diffraction and field-emission scanning electron microscopy. Energy-dispersive X-ray spectroscopy was used to investigate protein adsorption. The average percentage yield of GO-HA composite production was highest (96.93%) at 2.0 M of Ca(OH) 2 . The optimum condition of GO–HA composite was 0.1 M Ca(OH) 2 and 0.1% GO composition, which resulted in needle-like shape with 48.38 nm width and 201.0 nm length, well conjugation, as well as the higher distribution of GO onto the HA surface. The elemental composition of carbon (C) of GO-HA was 44% and that of uncoated HA was 33%, which confirmed the adsorption of FN. Moreover, carbon element mapping proved that the absorption of FN towards GO-HA was successful. GO-HA nanocomposite can be a promising highly biocompatible material for medical implants. Keywords: Biomaterial; hydroxyapatite; graphene oxide; fibronectin; adsorption ABSTRAK Kajian berkenaan biobahan sebagai implan telah berkembang dengan pesat sejak beberapa dekad kebelakangan ini bagi menangani isu-isu penyakit tisu dan tulang. Gabungan antara grafin oksida (GO) dan hidroksiapatit (HA) adalah dijangka dapat menggalakkan penjerapan protein fibronektin (FN). GO telah dihasilkan menerusi modifikasi daripada kaedah Hummer. Kemolaran kalsium hidroksida Ca(OH) 2 pada (0.1M, 1.0M dan 2.0M) digunakan sebagai larutan asas bagi HA untuk sintesis komposisi GO yang berbeza iaitu pada (0%, 0.1% dan 1.0%) melalui kaedah pemendakan kimia basah. Kemolaran Ca(OH) 2 dan komposisi GO adalah memainkan peranan penting dalam menentukan morfologi, saiz partikel, taburan GO terhadap permukaan HA dan penjerapan protein. GO dan komposit GO-HA dicirikan menggunakan Spektroskopi Inframerah Transformasi Fourier, Pembelauan Sinar-X, Mikroskop Electron Sekunder Bidang Emisi. Spektroskopi Serakan Tenaga Sinar-X pula digunakan untuk menganalisa penjerapan protein. Peratusan hasil tindak balas penghasilan komposit GO-HA adalah tertinggi (96.93%) pada molariti Ca(OH) 2 iaitu 2.0M. Kondisi optimum bagi komposit GO-HA adalah 0.1M Ca(OH) 2 dan 0.1% komposisi GO, yang mana menghasilkan GO-HA yang berbentuk seperti jarum dengan lebar 48.38 nm dan panjang saiz 201.0 nm, konjugasi yang baik dan bahkan menghasilkan taburan GO yang tinggi ke atas permukaan HA. Penjerapan FN dibuktikan oleh komposisi elemen karbon (C) bagi GO-HA iaitu 44% dan HA tanpa kehadiran GO adalah 33%. Tambahan pula, pemetaan elemen karbon (C) membuktikan bahawa penjerapan FN terhadap GO-HA adalah berjaya. Komposit GO-HA menjanjikan keserasian biologi yang tinggi bagi aplikasi pengimplanan perubatan. Kata kunci: Biobahan; hidroksiapatit; grafin oksida; fibronektin; penjerapan JK 30 SI1(4) Bab 3.indd 15 12/3/2018 5:20:36 PM
Transcript of Adsorption of Extracellular Matrix Protein Fibronectin on the … · Kemolaran kalsium hidroksida...
Jurnal Kejuruteraan SI 1(4) 2018: 15-25http://dx.doi.org/10.17576/jkukm-2018-si1(4)-03
Adsorption of Extracellular Matrix Protein Fibronectin on the Surface of the Nanocomposite Particle of Graphene Oxide-Hydroxyapatite
(Penjerapan Matriks Ekstrasel Protein Fibronektin terhadap Permukaan Zarah Komposit Nano Grafin Oksida-Hidroksiapatit)
Norsuriani Che Hashima, Norsuzila Sawala, Shalil Miraz Mohamed Rafiea, Darman Nordina,b,*
aResearch Centre for Sustainable Process Technology,bChemical Engineering Programme,
Faculty of Engineering & Built Environment, Universiti Kebangsaan Malaysia
Daniel Frankelc
cSchool of Engineering, Faculty of Science, Agriculture and Engineering, Newcastle University, United Kingdom
ABSTRACT
The study of biomaterials as implants have rapidly increased over recent decades to address the issues of tissue and bone disease. The combination of graphene oxide (GO) with hydroxyapatite (HA) is expected to promote the adsorption of protein fibronectin (FN). GO was produced by Hummer’s method. Calcium hydroxide (Ca(OH)2 at 0.1, 1.0 and 2.0 M) was used as a precursor of HA for the synthesis different GO compositions (0%, 0.1% and 1.0%) through wet chemical precipitation method. The molarity of Ca(OH)2 and the composition of GO played an important role in the morphology, particle size, distribution of GO on HA surface and absorption of protein. GO and GO-HA composites were characterized using Fourier transform infrared spectroscopy, X-ray diffraction and field-emission scanning electron microscopy. Energy-dispersive X-ray spectroscopy was used to investigate protein adsorption. The average percentage yield of GO-HA composite production was highest (96.93%) at 2.0 M of Ca(OH)2. The optimum condition of GO–HA composite was 0.1 M Ca(OH)2 and 0.1% GO composition, which resulted in needle-like shape with 48.38 nm width and 201.0 nm length, well conjugation, as well as the higher distribution of GO onto the HA surface. The elemental composition of carbon (C) of GO-HA was 44% and that of uncoated HA was 33%, which confirmed the adsorption of FN. Moreover, carbon element mapping proved that the absorption of FN towards GO-HA was successful. GO-HA nanocomposite can be a promising highly biocompatible material for medical implants.
Keywords: Biomaterial; hydroxyapatite; graphene oxide; fibronectin; adsorption
ABSTRAK
Kajian berkenaan biobahan sebagai implan telah berkembang dengan pesat sejak beberapa dekad kebelakangan ini bagi menangani isu-isu penyakit tisu dan tulang. Gabungan antara grafin oksida (GO) dan hidroksiapatit (HA) adalah dijangka dapat menggalakkan penjerapan protein fibronektin (FN). GO telah dihasilkan menerusi modifikasi daripada kaedah Hummer. Kemolaran kalsium hidroksida Ca(OH)2 pada (0.1M, 1.0M dan 2.0M) digunakan sebagai larutan asas bagi HA untuk sintesis komposisi GO yang berbeza iaitu pada (0%, 0.1% dan 1.0%) melalui kaedah pemendakan kimia basah. Kemolaran Ca(OH)2 dan komposisi GO adalah memainkan peranan penting dalam menentukan morfologi, saiz partikel, taburan GO terhadap permukaan HA dan penjerapan protein. GO dan komposit GO-HA dicirikan menggunakan Spektroskopi Inframerah Transformasi Fourier, Pembelauan Sinar-X, Mikroskop Electron Sekunder Bidang Emisi. Spektroskopi Serakan Tenaga Sinar-X pula digunakan untuk menganalisa penjerapan protein. Peratusan hasil tindak balas penghasilan komposit GO-HA adalah tertinggi (96.93%) pada molariti Ca(OH)2 iaitu 2.0M. Kondisi optimum bagi komposit GO-HA adalah 0.1M Ca(OH)2 dan 0.1% komposisi GO, yang mana menghasilkan GO-HA yang berbentuk seperti jarum dengan lebar 48.38 nm dan panjang saiz 201.0 nm, konjugasi yang baik dan bahkan menghasilkan taburan GO yang tinggi ke atas permukaan HA. Penjerapan FN dibuktikan oleh komposisi elemen karbon (C) bagi GO-HA iaitu 44% dan HA tanpa kehadiran GO adalah 33%. Tambahan pula, pemetaan elemen karbon (C) membuktikan bahawa penjerapan FN terhadap GO-HA adalah berjaya. Komposit GO-HA menjanjikan keserasian biologi yang tinggi bagi aplikasi pengimplanan perubatan.
Kata kunci: Biobahan; hidroksiapatit; grafin oksida; fibronektin; penjerapan
JK 30 SI1(4) Bab 3.indd 15 12/3/2018 5:20:36 PM

16
INTRODUCTION
Hydroxyapatite (HA) [Ca10 (PO4)6 (OH)2] is a bioceramic that ranks as one of the calcium phosphate groups that resemble the inorganic material composition of natural bone and naturally bioactive. In nature, HA primarily exists with a Ca/P ratio of 1.667 and a crystal size of nanometer range (Technol et al. 2013; Saeri et al. 2003). Similarities of HA with the biological properties of human bone help promote an osseointegration process, which constitute as generation and formation of new bone. Given its excellent biocompatibility, concerning both cell adhesion and encouraging protein adsorption, HA have been used extensively as biomaterial for the past decade.
Liu et al. (2014) has reported that even HA has good potential as biomaterial; however, its mechanical performance remained a major constraint because of the intrinsic brittleness and low strength. HA structure can be improved by combining reinforcement second phase, such as ethylene-polymer, titanium alloys, alumina, carbon nanotube and others. For example, other works proved that halloysite nanotubes are used in the reinforcement of the polymer matrix (polyvinyl alcohol), resulting in good mechanical properties of nanocomposites (Gaaz & Hussein 2017). Consideration of the selection of materials for HA-based composite should satisfy biocompatibility and sufficient strength to reinforce the structure of the HA. Ideal reinforcement materials not only impart mechanical integrity but also provide bioactivity properties. GOs are ideal and promising candidate fillers in biocomposites, enhancing interfacial bonds and bioactivity (Raucci, M et al. 2016). Carbonaceous materials (GO) with high chemical inertness are widely known because of their excellent biocompatibility (K. Wang et al. 2011). M. Li et al. 2014 revealed that graphene oxide (GO) added to the HA layer can reduce surface cracking and improve coating adhesion strength.
Several techniques have been applied for the synthesis of nano-sized HA powder, including wet chemical precipitation (Wp) and sol-gel (Sg) method. Wet Wp method is the most convenient technique because it can produce a large quantity of HA powder and produce smaller crystallite size compared with the Sg method. In addition, impurity elements are not involved in this method, and the by-product is water (Ramesh et al. 2015). The various morphologies of HA can be obtained by controlling the process conditions during the synthesis period (Afshar et al. 2003; P. Wang et al. 2010). Stewart et al. (2015) revealed that HA production method will directly affect the characterization of HA in terms of phase purity, morphology and particle size of the HA particles. The wet Wp method involves the following reaction, as shown in Equation (1).
10Ca(OH)2 + 6H3PO4 → Ca10(PO4)6(OH)2 + 18H2O (1)
The adsorption of proteins from body fluids occurred prior the process of cell attachment to the biomaterial surface. Shen et al. (2008) stated that adsorption of fibronectin will regulate the cell adhesion and cell behaviour. Fibronectin (FN)
is an adhesive protein that contributes to the structure stability of extracellular matrix and function as adhesion, growth, and differentiation. In bones, FN has the ability to carry out osteogenesis in early stage and nucleate mineralization. Adsorption of FN onto biomaterial surfaces lead to conformational changes and cellular responses (Ribeiro et al. 2010). The biocompatibility of HA with proteins at the surface interface is linked to the adsorption and surface activation of cell-anchoring biofluid proteins, FN (Dolatshahi–Pirouz et al. 2011).
Herein, the adsorption of FN on the surface of nano graphene-hydroxyapatite deposited through wet chemical precipitation method is studied. Protein adsorption on the surface of biomaterials play an important role in the determination of the biocompatibility level in the field of biomaterials science and medical implants (Pd 2013).
METHODOLOGY
PREPARATION OF GRAPHENE OxIDE (GO)
GO was prepared through modification of Hummer’s method using flaky graphite (Gr) as starting material (J. Li et al. 2014). Flaky Gr (2.0 g) was mixed with 100 mL of sulphuric acid (H2SO4) solution before the mixture is cooled to 5°C while stirring for 30 min. Potassium permanganate (KMnO4, 8.0 g) was added to the mixture at the temperature condition below 10°C, and 100 mL of distilled water was then poured to the mixture follow by 30% hydrogen peroxide (H2O2) until the pH value reached 6. After that, the suspensions were washed with 800 mL of 5% hydrochloric acid (HCl) followed by washing with distilled water until the pH reached 7. The mixture was dried for one week at a temperature of −4°C by using a freeze dryer; then GO was chemically produced (Subbiah et al. 2014).
SYNTHESIS OF GO-HA
In this study, the HA process is controlled under optimum conditions, where pH is fixed at a value of 9, the reaction temperature is at 90°C and calcination temperature is at 700°C in order to produce HA that possesses an outstanding morphology. Results obtained from the sintering process will produce HA with high degree of crystallinity (Deligianni et al. 2001).
Wet chemical approach was used to synthesize nano GO-HA by using the reaction between calcium hydroxide Ca(OH)2, (System Chemicals, Malaysia) and ortho-phosphoric acid, H3PO4 (Merck, Germany). Both substances were mixed as follows: 100 mL of 1.0 M Ca(OH)2 was added to the GO that has been provided followed by gradual addition of 100 mL of 0.6 M H3PO4 solution at a rate of 4 mL/min. Next, the mixture was mechanically stirred for 2 h at a speed of 300 rpm. The temperature was controlled at the range of 90–95°C. During this stage, pH should be controlled at 9.0 by using sodium hydroxide (NaOH, System Chemicals, Malaysia).
JK 30 SI1(4) Bab 3.indd 16 12/3/2018 5:20:36 PM

17
The resulting mixture was left overnight (24 h) for the precipitation process to occur at room temperature. After the precipitation was formed, the suspension was filtered with filter paper and rinsed with distilled water twice to remove NaOH. Next, the precipitated HA was dried in an oven at 95°C for 2 h. The sample of HA formed after the drying process was weighed and placed in a furnace for calcination at 700°C for 4 h.
Then, the step above is repeated at different molarities of 2.0 M Ca(OH)2–1.2 M H3PO4 and 0.1 M Ca(OH)2–0.06 M H3PO4 with different percentages of GO (0.1 and 1.0 wt%) as shown in Table 1. The molarity of reactant was maintained at a stoichiometric Ca/P ratio of 1.667.
and 2.0 M Ca(OH)2] and different weight percentages of GO (0.1 and 1.0 wt%) per sample. FESEM (SUPRA 55 VP Zeiss Germany, CRIM UKM) was used to visualise the HA and GO coated with HA. The adsorption of 50 µg/mL FN on all GO-HA were analysed using FESEM-EDx.
RESULTS AND DISCUSSION
MOLARITY FACTOR OF PRIOR SOLUTION AGAINST PERCENTAGE OF MASS SYNTHESIS
Molarity is the measured chemical concentration in a solution indicating the number of moles of solute dissolved in one litre of solution. Molarity or ionic strength provides a significant role in determining the properties of a chemical reaction (Cüneyt Tas 2000). The ionic strength of a reaction determines product yield. The percentage of reaction products measures the effectiveness of a response under any circumstances and can be defined as the amount of product formed from the reaction over the amount based on theoretical calculations (Bonilla-Petriciolet et al. 2013).
Based on Table 2, the highest percentage yield of the reaction obtained with highest molarity 2.0 M Ca(OH)2 were 96.93%, followed by 96.00% and 85.57% [1.0 M and 0.1 M Ca(OH)2]. Generally, in all runs, the yield was found to be higher than 80%. The production yield was found to increase as the reagent concentration increased (Al Qasas & Rohani 2005). The optimum reaction conditions were pH 9.0 and temperature 90°C. The data obtained show that the chemical reaction at high molarity is more efficient compared with a lower molarity (Bonilla–Petriciolet et al. 2013).
Nevertheless, the work carried out by a continuous method in an MSMPR thermostat reactor with pH of 9.0, temperature of 85°C, as well as reactants of CaCl2 and K2HPO4, revealed that the reagent molarity increased (0.5 M CaCl2, 0.65 M CaCl2, 0.80 M CaCl2 and 1.0 M CaCl2) with fluctuating yield production (97%, 99%, 91% and 82%) (Gomez–Morales et al. 2001). Thus, the yield production of 1.0 M calcium source by wet precipitation technique was found to be high, more convenient, simple, low cost, controllable, low temperature, time saving, and environment friendly.
In addition, the experimental results also showed that the mass produced by HA-coated GO was greater than uncoated HA in the prior solution and the mass produced increased as the GO percentage increased from 0.1 M to 1.0 and 2.0 M, consecutively. Thus, in addition to its role as reinforcement material for HA, GO also acts as catalyst that helps improve the efficiency of the reaction. This is because the GO has shown efficiency as catalyst for dehydration, oxidation and hydration (Sun et al. 2012). GO is a nanostructured composite that has a large active surface area, which enhances the electron transfer and electrocatalyst reaction (Yang et al. 2012).
TABLE 1. Synthesis parameters of GO-HA composite
Molarity of Molarity of Percentage of Ca(OH)2, (M) H3PO4, (M) GO (%)
0.1 0.06 0 0.1 0.06 0.1 0.1 0.06 1.0 1.0 0.6 0 1.0 0.6 0.1 1.0 0.6 1.0 2.0 1.2 0 2.0 1.2 0.1 2.0 1.2 1.0
PREPARATION OF FIBRONECTIN (FN) SOLUTION
FN from bovine plasma was obtained from Sigma, USA. The FN with concentration of 50 µg/mL was dissolved in phosphate buffered saline (System Chemicals, Malaysia), with addition of 138 mM sodium chloride (NaCl) and 2.7 mM potassium chloride (KCl) at pH 7 and temperature of 25°C before being used.
ABSORPTION OF FIBRONECTIN (FN)
The first step of the FN adsorption on the surface of GO-HA involved mixing of 10 mg of the GO-HA with 50 µg/mL of FN. The mixture was maintained at 37°C for 48 h in an incubator to dissolve. After 48 h of incubation process, the GO-HA-FN was recovered by centrifugation and freeze drying.
CHARACTERIZATION
FTIR analysis of GO spectra was performed using Nicolet 6700 FTIR spectrometer in the wavelength range of 650-4000 cm−1. The phase composition of the sample in terms of the crystalline phase and the degree of crystallinity were analysed by xRD (D8 Advance/Bruker, CRIM UKM) with type Cu Kα radiation (λ = 0.15406) at 40 kV and 40 mA. xRD data were collected in the 2θ at room temperature ranging from 5°C to 80°C. The samples analysed were GO and GO coated with HA at different molarities of HA [0.1 M Ca(OH)2, 1.0 M Ca(OH)2
JK 30 SI1(4) Bab 3.indd 17 12/3/2018 5:20:36 PM

18
CHARACTERISTIC OF GRAPHENE OxIDE (GO)
GO is a derivative of graphene and hydrophilic molecules, which have high tendency to dissolve in water. This is because GO contains a range of functional groups of active oxygen (Dreyer et al. 2010). Given the exceptional properties of GO, it has been used as an additive in the HA. However, the actual structure of HA is difficult to be identified, but it is an aromatic lattice disturbed with epoxy functional groups, alcohols, ketones and carboxylic carbonyl (Marcano et al. 2010).
The results of the analysis of xRD patterns of GO shown in Figure 1 reveals that GOs are nanosized particles. Based on the graph, the diffraction peaks for GO is usually formed at 2θ =11.2°, which can identify the prepared GO. Peak (002) has a strong and sharp intensity, proving that GO has a high degree of crystallinity. Coincidently, same phenomenon have been previously reported by (R. Li et al. 2011; Rajest et al. 2014; Zhou et al. 2017). FTIR spectra were used for the characterization of the product formed. Figure 2 shows the FTIR results of GO, which can be seen as a very broad −OH stretching vibration peak generated at wavelength 3201 cm−1.
In addition, GO exhibits a strong peak at 1721 cm−1, which corresponded to the C = O stretching band. The absorption peak of 1620 and 1361 cm−1 correspond to the aromatic C = C and C–OH stretching band, respectively. While the absorption peaks at 1234 and 1048 cm−1 correspond to epoxy C–O and alkoxy C–O stretching vibrations, respectively (Fahrul et al. 2015; Song et al. 2014). The presence of absorption peak at 977.3 cm−1 can be attributed to the aromatic C–H peak (Ma et al. 2012).
GO is used in this study as additive in HA to help improve the structure of powder. Microscopic studies of GO by FESEM are demonstrated in Figure 3. Figures 3a and 3b show that GO exhibited a stacked layered structure, which agrees with that from previous study (Rajest et al. 2014).
The FESEM images (Figure 3c) and (Figure 3d) clearly show the exfoliated GO (Paulchamy et al. 2015) and formation of thin wrinkled paper-like structure of GO (Ramani & Sastry, 2014) that occurs after the oxidation of graphene. GO has a different morphology compared with that of reduced GO (rGO), which has a smooth and a flat surface, probably due to the presence of functional groups consisting of oxygen (Sun et al. 2012) and typically folded morphologies at its edge and surface (Cao & Zhang 2015).
TABLE 2. Percentage yield (%) of GO-HA production
Molarity of Percentage of Final pH Experimental Theoretical Percentage Average Ca(OH)2 (M) GO (%) Mass (g) Mass (g) Yield (%) Yield (%)
0.1 0.0 9.12 0.7795 1.004 77.64 85.57 0.1 0.1 9.35 0.8990 1.004 89.46 0.1 1.0 9.12 0.9070 1.004 89.92 0.1 0.0 9.07 0.7735 1.004 77.04 0.1 0.1 9.29 0.8960 1.004 89.17 0.1 1.0 9.14 0.9131 1.004 90.17 1.0 0.0 9.03 8.9995 10.04 89.64 96.00 1.0 0.1 9.07 9.8584 10.04 98.09 1.0 1.0 9.00 10.0659 10.04 99.34 1.0 0.0 9.00 9.1740 10.04 91.37 1.0 0.1 9.07 9.9231 10.04 98.74 1.0 1.0 9.09 10.0130 10.04 98.82 2.0 0.0 9.02 19.3440 20.08 96.33 96.93 2.0 0.1 9.05 19.5075 20.08 97.05 2.0 1.0 9.04 19.7927 20.08 97.61 2.0 0.0 9.03 19.1255 20.08 95.25 2.0 0.1 9.06 19.5250 20.08 97.14 2.0 1.0 9.11 19.9125 20.08 98.20
FIGURE 1. xRD pattern of GO
FIGURE 2. FTIR analysis of GO
JK 30 SI1(4) Bab 3.indd 18 12/3/2018 5:20:43 PM

19
Based on Figures 4, 5 and 6, which represent the xRD patterns of different molarities [0.1 M Ca(OH)2, 1.0 M Ca(OH)2 and 2.0 M Ca(OH)2] with different percentages of GO (0%, 0.1% and 1.0%).
Based on the observations, no reflection of GO can be identified, indicating that GO are successfully exfoliated and uniformly dispersed in HA matrix (Feng et al. 2012; M. Li et al. 2013; Ramani & Sastry 2014; Wan et al. 2011). xRD patterns were also compared with HA-coated GO and HA-uncoated GO. However, the xRD pattern shown in Figure 4 [0.1 M Ca(OH)2] demonstrated that the peak intensity of 0.1% GO-HA decreased, and the peaks were broad compared with that of the uncoated HA, suggesting the successful conjugation of GO onto the surface of HA (Zhou et al. 2017). The intensity of 0.1% GO-HA is lower than that of pristine HA, indicating that the crystallinity of HA gradually decreased (Gong et al. 2017). Furthermore, the peak intensity (1.0% GO-HA) in the pattern increased, and the peaks became sharper with increasing amount of GO in GO-HA hybrids. The strong intensity and narrow width of diffraction peaks resulted in the high crystallinity of the products (Grenho et al. 2013). The peak intensity increased continuously with increasing GO content, suggesting the facilitated crystallinity of HA in composites (Zeng et al. 2016) and existence of GO in the composite.
Contrarily, Figures 5 [1.0 M Ca(OH)2] and 6 [2.0 M Ca(OH)2] depicted that the peak intensity of 0.1% GO-HA obviously increased and became narrower compared with uncoated HA, implying that the HA crystallizes well (Wen et al. 2017). While the intensity of peaks 1.0% GO-HA decreased and broadened with increasing amount of GO in HA. This result is indicative of a decreasing HA phase of the nanocomposites with addition of GO (Marques et al. 2012) and due to conjugation of GO at 1.0% instead of 0.1% GO in HA matrix. As the molarity of Ca(OH)2 increases, the GO content in the composites decreases, suggesting the successful introduction of a high content of GO in the composite.
FIGURE 3. FESEM images of GO at magnification 2 µm for a) and c) and magnification 1 µm for b) and d). Characterization of Nano Graphene Oxide-Hydroxyapatite (GO-HA)
FIGURE 4. xRD patterns of HA and GO-HA with molarity of 0.1 M Ca(OH)2
JK 30 SI1(4) Bab 3.indd 19 12/3/2018 5:20:49 PM

20
Recent reports of biomaterials research suggest that the best osteocompatibility can be found if the structure, size and morphology of the particle are similar to those of biological apatite crystals (Saito 2015). Thus, researches have paid considerable attention to nano-HA because it can affect the natural apatite formation that promotes osteointegration. The nanoparticles of HA can be obtained in various types of morphologies, such as needle-like or also known as nanorod and globular-like, which are formed depending on the production technique used.
FESEM images (Figure 8) show pure HA, 0.1 wt.% GO-HA composite and 1.0 wt.% GO-HA composite with a molecular-sized HA. Figure 8(a) clearly shows that the pure HA has agglomerated rod-like shape with particle size of 85.60 nm in length and width of 70.71 nm. While Figures 8(b) and 8(c) exhibit GO-HA composite with needle-like shape, and both have the same diameter 48.38 nm, as well as length 201 and 197.2 nm, respectively. The observation performed for the particle size matches with the HA that has been reported by previous researchers (Afshar et al. 2003; Saeri et al. 2003). This can be identified by observation of images showing that the HA grew by both adhesion and lateral growth modes that make the tip and edge round and with some smooth and flat planes (Saito 2015).
FIGURE 5. xRD patterns of HA and GO-HA with molarity of 1.0 M Ca(OH)2
FIGURE 6. xRD patterns of HA and GO-HA with molarity of 2.0 M Ca(OH)2
In Figure 7, we can see a comparison of xRD patterns for the preparation of HA using different molarities of Ca(OH)2. In terms of height and steepness of peak, the peak intensity and steepness clearly increased from Ca(OH)2 molarity 0.1 M to 1.0 M. However, the peak intensity and steepness declined in 2.0 M Ca(OH)2. This probably occurred because when molarity was too high, the concentration of OH− decreases in the solution due to the high acid concentration, where the final pH of the reaction is lower than the other molarities. In other words, the initial pH plays an important role in influencing the degree of crystallinity and other beneficial characteristics for producing HA (P. Wang et al. 2010).
FIGURE 7. xRD patterns of synthesized HA powders with different molarities Nanostructure and Morphology of Nano GO-HA
JK 30 SI1(4) Bab 3.indd 20 12/3/2018 5:21:07 PM

21
FIGURE 8. FESEM images with the length and width of nanoparticles of 0.1 M Ca(OH)2: a) pure HA b) 0.1 wt.% GO-HA composite c) 1.0 wt.% GO-HA composite (red arrows indicate agglomerates HA and yellow boxes presented existence of GO)
FIGURE 9. FESEM images of 1.0 M Ca(OH)2: a) pure HA b) 0.1 wt.% GO-HA composite c) 1.0 wt.% GO-HA composite (red arrows indicate agglomerates HA and yellow boxes presented existence
of GO)
Result evaluated that the synthesis for nano-HA with needle-like shape is more popular among others because it can be used in numerous applications and medical technology. This is because natural bone consists of nano-HA that has needle-like particles (Wijesinghe et al. 2014). HA-coated GO shows a very similar shape to the needle-like shape than that of pure HA, which is almost needle-like with smaller size. Needle-like particles are capable of enhancing sinterability and fracture toughness, which are required in bone implantation (Ramesh et al. 2015).
Pure HA is more likely to agglomerate as seen in Figure 8(a). The addition of GO reduces the tendency of particles to agglomerate as confirmed in Figures 8(b) and 8(c). Nanoparticle HA is attached to the surface of GO through Van Der Waals bonds (M. Li et al. 2014). The plane (300) HA can be naturally parallel to the bonding interface of GO with a strong and integrated bond. In addition, GO helps improving the structure by increasing surface roughness of HA due to features of GO that has wrinkled morphology as discussed in Section 3.2. According to Deligianni et al. (2001), the capability of cell on adhesion, proliferation and detachment strength is sensitive to the surface roughness, where the excellent behaviour of the cell increases with the increasing surface roughness of HA.
Based on the observation in Figures 9 [1.0 M Ca(OH)2] and 10 [2.0 M (Ca(OH)2], higher GO distribution/coated on the surface of HA when higher percentage of GO applied. By contrast, Figure 8 demonstrates higher distribution of GO in HA with lower percentage of GO composition. Suitable percentage of GO added is important to ensure optimal conditions for the attachment of cells. HA with rough surface is produced at high content of GO, which is probably due to the larger particle size and low stability with high percentage of GO (Li et al. 2014). In this work, the optimum molarity, M of Ca(OH)2 and composition of GO are 0.1M Ca(OH)2 and 0.1% of GO, respectively, due to well conjugation of GO onto HA surface based on xRD analysis as discussed in Section 3.2 and higher distribution of GO onto HA surface.
ADSORPTION OF FN ON THE NANOSURFACE OF GO-HA
Hydrophobic and electrostatic forces are the main interaction forces between ceramics and proteins. HA exhibits a hydrophilic character and in hydrophilic surfaces, the strongly bound water molecules form the repulsive solvation forces that prevents protein binding. FN interacts with positively charged calcium ions (C+) and negatively charged terminal carboxylate groups (CO3
2−) (Becerril et al. 2013). EDx results
JK 30 SI1(4) Bab 3.indd 21 12/3/2018 5:21:24 PM

22
FESEM images of HA and 0.1% wt GO-HA by 50 µg/ml FN absorption are illustrated in Figure 12. The red points indicated the carbon composition distribution on the HA and GO-HA surfaces. Figure 12 (a) shows that the uncoated HA demonstrated less carbon element mapping compared with GO coated HA [Figure 12 (b)]. GO-coated HA shows the more consistent and dense distribution of red points (carbon).
FIGURE 10. FESEM images of 2.0 M Ca(OH)2: a) 0.1 wt.% GO-HA composite b) 1.0 wt.% GO-HA composite (green highlights
indicate GO distribution)
shown in Figure 11 presents the elemental composition of carbon (C) proved that the absorption of FN towards both samples (HA and 0.1% wt GO-HA) was successful. The percentage of carbon composition is higher in GO-coated HA (44%) compared with the uncoated HA (33%). Accordingly, GO as agents, improved the adsorption of protein towards the HA surface.
FIGURE 11. EDx spectra of 50 µg/mL FN absorption towards a) HA b) 0.1% wt GO-HA
FIGURE 12. FESEM images and EDx mapping for carbon (C) of 50 µg/mL FN absorption towards a) HA b) 0.1% wt GO-HA (red dots
indicate carbon distribution)
JK 30 SI1(4) Bab 3.indd 22 12/3/2018 5:21:46 PM

23
GO promoted early adsorption and stretching state of FN, which in turn facilitates the attachment and spreading of the cells. This condition supports the phenomenon that GO, at a coating surface, promotes spreading and proliferation of cells (Liu et al. 2014). Plus, GO also improved the morphology of HA, thus enhanced bioactivity adaptation in vivo conditions (Janković et al. 2014).
CONCLUSION
GO was successfully coated on HA surface by wet precipitation method, producing an ideal GO-HA composite. Chemical precipitation method of synthesising GO-HA produces nanosized particles with sizes ranging 150–200 nm in length and 40–50 nm in width. The molarity of Ca(OH)2 and composition of added GO plays important roles in the morphology, particle size, distribution of GO on HA surface, as well as absorption of protein. The optimum molarity of Ca(OH)2 was 0.1 M and composition of GO was 0.1%. The absorption of FN on the nano surface of GO-HA composite was successful through EDx and FESEM analyses. Carbon (C) elemental composition through EDx analysis is 44% for GO-HA and 33% for uncoated HA. Carbon (C) element mapping through FESEM analysis proved that the absorption of FN towards GO-HA occurred. The results from this study revealed that the composite of GO-HA can promote the adhesion, proliferation and better interaction with proteins to produce biomaterials that have high biocompatibility for future implantation application.
ACKNOWLEDGEMENT
The authors acknowledge Universiti Kebangsaan Malaysia and Ministry of Education Malaysia for funding this research work through grants FRGS/1/2015/TK05/UKM/02/2.
REFERENCES
Afshar, A., Ghorbani, M., Ehsani, N., Saeri, M. R. & Sorrell, C. C. 2003. Some important factors in the wet precipitation process of hydroxyapatite. Materials & Design 24(3): 197-202.
Al Qasas, N. S. & Rohani, S. 2005. Synthesis of pure hydroxyapatite and the effect of synthesis conditions on its yield, crystallinity, morphology and mean particle size. Separation Science and Technology 40(15): 3187-3224.
Becerril, N. V., Tellez-Jurado, L. & Rodriguez-Lorenzo, L. M. 2013. Adsorption of fibronectin on hydroxyapatite functionalized with alendronate. Journal of the Australian Ceramic Society 49(2): 60-67.
Bonilla-Petriciolet, A., Fateen, S. E. K. & Rangaiah, G. P. 2013. Assessment of capabilities and limitations of stochastic global optimization methods for modeling mean activity coefficients of ionic liquids. Fluid Phase Equilibria 340: 15-26.
Cao, N. & Zhang, Y. 2015. Study of reduced graphene oxide preparation by hummers’ method and related characterization. Journal of Nanomaterials, 2015. http://dx.doi.org/10.1155/2015/168125.
Cüneyt Tas, A. 2000. Synthesis of biomimetic Ca-hydroxyapatite powders at 37°C in synthetic body fluids. Biomaterials 21(14): 1429-1438.
Deligianni, D. D., Katsala, N. D., Koutsoukos, P. G. & Missirlis, Y. F. 2001. Effect of surface roughness of hydroxyapatite on human bone marrow cell adhesion, proliferation, differentiation and detachment strength 22: 87-96.
Dolatshahi-Pirouz, A., Jensen, T. H. L., Kolind, K., Bünger, C., Kassem, M., Foss, M. & Besenbacher, F. 2011. Cell shape and spreading of stromal (mesenchymal) stem cells cultured on fibronectin coated gold and hydroxyapatite surfaces. Colloids and Surfaces B: Biointerfaces 84(1): 18-25.
Dreyer, D. R., Park, S., Bielawski, W. & Ruoff, R. S. 2010. The chemistry of graphene oxide. In Graphene Oxide. Springer, Cham
Fahrul, M., Hanifah, R., Jaafar, J., Aziz, M., Fauzi, A., Rahman, M. A. & Dzarfan, M. H. 2015. Synthesis of graphene oxide nanosheets via modified Hummers’ method and its physicochemical properties. Jurnal Teknologi 1: 189-192.
Feng, Y., Zhang, x., Shen, Y., Yoshino, K. & Feng, W. 2012. A mechanically strong, flexible and conductive film based on bacterial cellulose/graphene nanocomposite. Carbohydrate Polymers 87(1): 644-649.
Gaaz, T. S. & Hussein, E. K. 2017. Physical Properties of halloysite nanotubes-polyvinyl alcohol nanocomposites using malonic acid crosslinked. Jurnal Kejuruteraan 29(2): 71-77.
Gomez-Morales, J., Torrrent-Burgues, J., Boix, T., Fraile, J. & Rodriguez-Clemente, R. 2001. Precipitation of stoichiometric hydroxyapatite by a continuous method. Crystal Research and Technology: Journal of Experimental and Industrial Crystallography (36): 15-26.
Gong, M., Zhao, Q., Dai, L., Li, Y. & Jiang, T. 2017. Fabrication of polylactic acid / hydroxyapatite/graphene oxide composite and their thermal stability, hydrophobic and mechanical properties. Journal of Asian Ceramic Societies 5(2): 160-168.
Grenho, L., Monteiro, F. J. & Ferraz, M. P. 2014. In vitro analysis of the antibacterial effect of nanohydroxyapatite – ZnO composites. Journal of Biomedical Materials Research Part A 102(10): 3726-3733.
Janković, A., Eraković, S., Mitrić, M., Matić, I. Z., Juranić, Z. D., Tsui, G. C. P., Tang, C., Mišković-Stanković, V., Rhee, K. Y. & Park, S. J. 2014. Bioactive hydroxyapatite /graphene composite coating and its corrosion stability in simulated body fluid. Journal of Alloys and Compounds 624: 148-157.
Li, J., Zeng, x., Ren, T. & van der Heide, E. 2014. The preparation of graphene oxide and its derivatives and
JK 30 SI1(4) Bab 3.indd 23 12/3/2018 5:21:46 PM

24
their application in bio-tribological systems. Lubricants 2: 137-161.
Li, M., Liu, Q., Jia, Z., xu, x., Cheng, Y. & Zheng, Y. 2014. Graphene oxide/hydroxyapatite composite coatings fabricated by electrophoretic nanotechnology for biological applications. Carbon 67: 185-197.
Li, M., Wang, Y., Liu, Q., Li, Q., Cheng, Y., Zheng, Y., xi, T. & Wei, S. 2013. In situ synthesis and biocompatibility of nano hydroxyapatite on pristine and chitosan functionalized graphene oxide. J. Mater. Chem. B 1(4): 475-484.
Li, R., Liu, C. & Ma, J. 2011. Studies on the properties of graphene oxide-reinforced starch biocomposites. Carbohydrate Polymers 84(1): 631-637.
Liu, Y., Dang, Z., Wang, Y., Huang, J. & Li, H. 2014. Hydroxyapatite/graphene-nanosheet composite coatings deposited by vacuum cold spraying for biomedical applications: Inherited nanostructures and enhanced properties. Carbon 67: 250-259.
Ma, H. Bin, Su, W. x., Tai, Z. x., Sun, D. F., Yan, x. Bin, Liu, B. & xue, Q. J. 2012. Preparation and cytocompatibilityof polylactic acid/hydroxyapatite/graphene oxidenanocomposite fibrous membrane. Chinese ScienceBulletin 57(23): 3051-3058.
Marcano, D. C., Kosynkin, D. V, Berlin, J. M., Sinitskii, A., Sun, Z., Slesarev, A., Alemany, L. B., Lu, W. & Tour, J. M. 2010. Improved synthesis of graphene oxide. ACSNano 4(8): 4806-4814.
Marques, P. A. A. P., Gonçalves, G., Singh, M. K. & Grácio, J. 2012. Graphene oxide and hydroxyapatite as fillers of polylactic acid nanocomposites: preparation and characterization. Journal of Nanoscience and Nanotechnology 12(8): 6686-6692.
Paulchamy, B., Arthi, G. & Lignesh, B, D. 2015. A simple approach to stepwise synthesis of graphene oxide nanomaterial. Journal of Nanomedicine & Nanotechnology 6(1): doi:10.4172/2157-7439.1000253.
Parchi, P.D.,Vittorio, O.,Andreani, L., Piolanti, N., Cirillo,G., & Lisanti, M. 2013. How nanotechnology can really improve the future of orthopedic implants and scaffolds for bone and cartilage defects. Journal of Nanomedicine & Biotherapeutic Discovery 3(2): 114
Rajesh, A., Raja, M. M., Saha, S., Sinha, T. P. & Gurunathan, K. 2014. Synthesis, physico-chemical and electricalcharacterizations of graphene oxide – hydroxyapatitenanocomposites. Advanced Science, Engineering andMedicine 6(10): 1076-1081.
Ramani, D. & Sastry, T. P. 2014. Bacterial cellulose-reinforced hydroxyapatite functionalized graphene oxide : a potential osteoinductive composite. Cellulose 21: 3585-3595.
Ramesh, S., Natasha, A. N., Tan, C. Y., Bang, L. T., Niakan, A. & Purbolaksono, J. 2015. Characteristics and properties of hydoxyapatite derived by sol – gel and wet chemical precipitation methods. Ceramics International, 1-8.
Raucci, M, G., Giugliano, D., Longo, A., Zeppetelli, S., Carotenuto, G. & Ambrosio, L. 2016. Comparative facile
methods for preparing graphene oxide–hydroxyapatite for bone tissue engineering. Journal of Tissue Engineering and Regenerative Medicine 11(8): 2204-2216.
Ribeiro, N., Sousa, S. R. & Monteiro, F. J. 2010. Influence of crystallite size of nanophased hydroxyapatite on fibronectin and osteonectin adsorption and on MC3T3-E1 osteoblast adhesion and morphology. Journal of Colloid and Interface Science 351(2): 398-406.
Saeri, M. R., Afshar, A., Ghorbani, M., Ehsani, N. & Sorrell, C. C. 2003. The wet precipitation process of hydroxyapatite.Materials Letters 57(24-25): 4064-4069.
Shen, J., Ã, T. W., Ã, Q. W. & Pan, H. 2008. Molecular simulation of protein adsorption and desorption on hydroxyapatite surfaces. Biomaterials 29: 513-532.
Song, J., Wang, x. & Chang, C. 2014. Preparation and characterization of graphene oxide. Journal of Nanomaterials, http://dx.doi.org/10.1155/2014/276143.
Stewart, S., Bryant, S. J., Ahn, J. & Hankenson, K. D. 2015. Bone Regeneration. Translational Regenerative Medicine,. Elsevier Inc.
Subbiah, R., Du, P., Van, S. Y., Suhaeri, M., Hwang, M. P., Lee, K. & Park, K. 2014. Fibronectin-tethered graphene oxide as an artificial matrix for osteogenesis. Biomedical Materials 9(6): https://doi.org/10.1088/1748-6041/9/6/065003.
Sun, H., Liu, S., Zhou, G., Ang, H. M., Tadé, M. O. & Wang, S. 2012. Reduced graphene oxide for catalytic oxidationof aqueous organic pollutants. ACS Applied Materials& Interfaces 4(10): 5466-5471.
Technol, J. M. S., Sibte, S., Abidi, A. & Murtaza, Q. 2013. Synthesis and characterization of nano-hydroxyapatite powder using wet chemical precipitation reaction. Journal of Materials Science & Technology 30(4): 307-310.
Wan, C., Frydrych, M. & Chen, B. 2011. Strong and bioactive gelatin–graphene oxide nanocomposites. Soft Matter 7(13): 6159-6166.
Wang, K., Ruan, J., Song, H., Zahng, J., Wo, Y., Guo, S. & Cui, D. 2011. Biocompatibility of graphene oxide. Nanoscale Research Letters 1-8.
Wang, P., Li, C., Gong, H., Jiang, x., Wang, H. & Li, K. 2010. Effects of synthesis conditions on the morphology of hydroxyapatite nanoparticles produced by wet chemical process. Powder Technology 203(2): 315-321.
Wen, C., Zhan, x., Huang, x., xu, F., Luo, L. & xia, C. 2017. Characterization and corrosion properties of hydroxyapatite/graphene oxide bio-composite coating on magnesium alloy by one-step micro-arc oxidation method. Surface & Coatings Technology 317: 125-133.
Wijesinghe, W. P. S. L., Mantilaka, M. M. M. G. P. G., Premalal, E. V. A., Herath, H. M. T. U., Mahalingam, S., Edirisinghe, M., Rajapakse, R. P. V. J. & Rajapakse, R. M. G. 2014. Facile synthesis of both needle-likeand spherical hydroxyapatite nanoparticles : Effect ofsynthetic temperature and calcination on morphology,crystallite size and crystallinity. Materials Science &Engineering C 42: 83-90.
JK 30 SI1(4) Bab 3.indd 24 12/3/2018 5:21:46 PM

25
Yang, x., Yang, Q., xu, J. & Lee, C.-S. 2012. Bimetallic PtPd nanoparticles on Nafion–graphene film as catalyst for ethanol electro-oxidation. Journal of Materials Chemistry 22(16): 8057-8062.
Zeng, Y., Pei, x., Yang, S., Qin, H., Cai, H., Hu, S., Sui, L., Wan, Q. & Wang, J. 2016. Graphene oxide/hydroxyapatite composite coatings fabricated by electrochemical deposition. Surface and Coatings Technology 286: 72-79.
Zhou, K., Gao, R. & Jiang, S. 2017. Morphology, thermal and mechanical properties of poly (e-caprolactone) biocomposites reinforced with nano-hydroxyapatite decorated graphene. Journal of Colloid And Interface Science 496: 334-342.
*Darman NordinResearch Centre for Sustainable Process Technology, Chemical Engineering Programme,Faculty of Engineering & Built Environment, Universiti Kebangsaan Malaysia, 43600 UKM Bangi, Malaysia.
Norsuriani Che Hashim, Norsuzila Sawal, Shalil Miraz Mohamed RafieResearch Centre for Sustainable Process Technology, Faculty of Engineering & Built Environment, Universiti Kebangsaan Malaysia, Bangi, Malaysia.
Daniel FrankelSchool of Engineeing,Faculty of Science, Agriculture and Engineering, Newcastle University, NE1 7RU, United Kingdom.
*Corresponding author; email: [email protected]
Received date: 7th April 2018Accepted date: 10th August 2018Online First date: 1st October 2018Published date: 30th November 2018
JK 30 SI1(4) Bab 3.indd 25 12/3/2018 5:21:46 PM