ADOT Planning to Programming Scoring Guidebook
41
ADOT Planning to Programming Scoring Guidebook Contract No. : ADOT17-171970 Title: MPD0011-19 P2P Implementation Prepared by: May 2020
Transcript of ADOT Planning to Programming Scoring Guidebook

ADOTPlanningtoProgrammingScoringGuidebookContractNo.:ADOT17-171970Title:MPD0011-19P2PImplementationPreparedby:
May2020

May 2020 Planning to Programing Guidebook 1
Table of Contents
1.0 Introduction ...................................................................................................................................... 3 2.0 Project Identification ........................................................................................................................ 4 3.0 Data Update Requirements ............................................................................................................. 5 4.0 Technical Score Criteria .................................................................................................................. 6 4.1 Technical Score – Scoring Process ............................................................................................. 6 4.1.1 Pavement Preservation Projects ............................................................................................... 6 4.1.2 Bridge Preservation Projects .................................................................................................... 6 4.1.3 Modernization Projects ............................................................................................................. 7 4.1.4 Expansion Projects ................................................................................................................... 7 4.1.5 LOS and Speed AZTDM Calculations ...................................................................................... 7 4.1.6 Travel Time Reliability Calculations .......................................................................................... 8 4.1.7 Cost Effectiveness .................................................................................................................... 8 4.1.8 New Permanent Job Creation ................................................................................................... 8 5.0 Policy Score Criteria ........................................................................................................................ 9 5.1 Freight Flow Score ....................................................................................................................... 9 5.2 Corridor Significance / Functional Classification Score ................................................................ 9 5.3 External Funding Contribution Score ......................................................................................... 10 5.4 Policy Score – Scoring Process ................................................................................................. 10 5.4.1 New Project Scoring ............................................................................................................... 10 5.4.2 Previously Recommended Project Scoring ............................................................................. 10 6.0 Safety Score – Scoring Process .................................................................................................... 11 6.1 Step-by-Step Safety Score Application ...................................................................................... 11 6.2 Additional Expansion Project Consideration .............................................................................. 11 7.0 District Score Criteria .................................................................................................................... 13 7.1 District Score – Scoring Process ................................................................................................ 13 7.2 Preparation for District Workshop .............................................................................................. 13 8.0 Development of Final P2P List ...................................................................................................... 15 9.0 Planning Level Scoping ................................................................................................................. 15 10.0 Next Steps ..................................................................................................................................... 16 11.0 Arizona Management System Integration ..................................................................................... 16 Appendices
Appendix A – Planning to Programming Annual Schedule Appendix B – Technical Score Supplemental Materials Appendix C – Policy Score Supplemental Materials Appendix D – District Score Supplemental Materials Appendix E – P2P Communication List Appendix F – Guidance for Programming Expansion Projects in Greater Arizona Appendix G – Project Scoring Matrix
May 2020 Planning to Programing Guidebook 2
Acronyms
AADT Annual Average Daily Traffic AASHTO American Association of State Highway and Transportation Officials ADOT Arizona Department of Transportation AZTDM Arizona Travel Demand Model COG Council of Governments ECD Enforcement & Compliance Division E2C2 Estimated Engineering Construction Cost FHWA Federal Highway Administration Five-Year Program Five-Year Transportation Facilities Construction Program FY Fiscal Year GIS Geographic Information System IDO Infrastructure, Delivery, & Operations LOS Level of Service LOSS Level of Safety Service LOTTR Level of Travel Time Reliability MPD Multimodal Planning Division MPO Metropolitan Planning Organization NHS National Highway System P2P Planning to Programming RAM Responsibilities Assignment Matrix TMC Traffic Messaging Channel TSMO Transportation Systems Management and Operations TTTR Truck Travel Time Reliability V/C Volume/Capacity
May 2020 Planning to Programing Guidebook 3
1.0 Introduction This document provides the procedures for applying the Planning to Programming (P2P) scoring criteria which results in the Statewide Prioritized Project List. The P2P process is conducted annually by the Arizona Department of Transportation (ADOT) Multimodal Planning Division (MPD) to prioritize all prospective statewide facility improvements. The P2P process is a performance-based process resulting in the development of the Draft Five-Year Transportation Facilities Construction Program (Five-Year Program). The scoring criteria, weights, and process as identified in this P2P Guidebook (March 2020) were utilized to prioritize and recommend the top performing construction projects for consideration in ADOT’s FY 2021 – 2025 Five-Year Program.
The P2P scoring process is separated into scoring sub-categories: technical, policy, safety and district:
• Technical Score: Based on prioritization provided directly from the respective ADOT Technical Groups, the project’s originating study document or the MPD expansion project evaluation process.
• Policy Score: Derived from planning-level criteria including freight flow, corridor significance and local funding contributions.
• Safety Score: Based on the weighted Level of Safety Service (LOSS) values identified in the statewide database developed utilizing the American Association of State Highway and Transportation Officials (AASHTO) Safety Analyst tool.
• District Score: Derived from each ADOT District Engineer’s prioritization of projects and supported by a scoring evaluation of each project.
The following sections outline the overall P2P process as well as step-by-step procedures for the completion of the P2P scoring process, including annual updates to scoring criteria, scoring newly recommended projects and revising scoring for previously recommended projects.
Authority for the P2P Guidebook is provided by ARS Title 28, Chapter 2, Article 7 and 23 USC Section 135(d)(2); 49 USC Section 5304(d)(2).

May 2020 Planning to Programing Guidebook 4
2.0 Project Identification The P2P process begins with the identification of prospective projects. The identification is twofold, involving both the inclusion of previously recommended projects that were not selected in the Five-Year Program from the previous Fiscal Year (FY) and newly recommended projects. Projects accepted into the previous year’s Five-Year Program are noted as programmed projects removed from duplicative consideration.
Each May, the P2P Manager requests any new planning study recommendations from ADOT Planning staff, COGs, and MPOs, as well as any District project nominations. All recommended projects from completed planning studies between the current and previous year’s project identification process are collected. MPD’s Geographic Information System (GIS) Attribute Table submitted with each completed MPD planning study is a resource to identify project information relevant to the P2P Scoring Process.
The following planning studies are referenced to identify projects:
• Bicycle and Pedestrian Safety Plans • COG and MPO Studies
• Corridor Profile Studies • State Freight Plan
• Statewide Planning Studies • Other plans and studies, as applicable
The P2P Manager submits such study and District project nominations to the appropriate ADOT Technical Groups (see Table 1) for technical prioritization.
In July, the P2P Manager issues a Call for Projects to each Technical Group. Each Technical Group is required to submit a prioritized list of projects by July 31st and provide supporting backup data.
This identification process is structured to allow all project recommendations, including district originating recommendations, entering the P2P process to be competitive in the development of the Five-Year Program. In addition to newly developed recommended projects, all projects that were not accepted into the previous FY’s Five-Year Program will be listed to be reprioritized with newly proposed project recommendations.1
The following Technical Groups from ADOT’s Infrastructure, Delivery, & Operations Division (IDO), Transportation Systems Management and Operations Division (TSMO) and Enforcement & Compliance Division (ECD) are recipients of the MPD call-for-projects:
Table 1: ADOT Technical Groups / Division Technical Group Division ADA / Civil Rights IDO
Bridge IDO Geohazard/Rockfall IDO
Railroad Coordination IDO Rest Area IDO Roadway IDO
Stormwater & Erosion Control IDO Winter Operations Support IDO
Pavement Management TSMO Safety/Technology/TSMO TSMO
Port of Entry ECD
1 The call-for-projects may precede the final Five-Year Program completion, therefore the previously programmed projects determination may be based upon the Draft Five-Year Program

May 2020 Planning to Programing Guidebook 5
3.0 MPD Data Update Requirements The policy and safety criteria of the P2P Scoring Process require annually updated information, conducted by MPD staff, to accurately score proposed projects. The expansion technical score is conducted through a comprehensive analysis requiring inputs from multiple modeling sources as conducted by MPD staff. Other investment category’s technical scoring does not require modeling inputs. Table 2 notes the specific data sources and respective data fields required for updates as well as the frequency of data updates.
Table 2: Data Update Schedule Technical Criteria (Expansion)
Data Source Data Field Update Frequency
Arizona Travel Demand Model (AZTDM)
Projected Level of Service (LOS) / Volume/Capacity (V/C)
Annual Average System Speeds
Cost Effectiveness Calculations
INRIX Travel Time Reliability Vehicle Travel Time Reliability (TTR) Truck Travel Time Reliability (TTTR)
AZTDM & REMI TranSight New Permanent Jobs Created Policy Criteria
Data Source Data Field Update Frequency Annual Average Daily Traffic (AADT) Reports:
Traffic Counts2 T-Factor Annual
ADOT Map Book / Corridor Significance GIS Shapefile
Functional Classification Map/Shapefile3 Annual National Highway System (NHS)
Map/Shapefile3 MPD Discretion
Safety Criteria Data Source Data Field Update Frequency
AASHTO Safety Analyst Level of Safety Service Annual Note: District score does not use any data
The NHS remains relatively static on a year-to-year basis; therefore, it does not require an annual update to previously scored projects. However, in the event of known changes to the NHS system, such as the updates that have occurred at the end of 2019, updated classifications should be reassessed accordingly.
2 The Annual AADT Report is accessible at https://azdot.gov/planning/DataandAnalysis 3 The annually updated ADOT Map Book, functional classification and NHS maps are accessible at https://azdot.gov/maps

May 2020 Planning to Programing Guidebook 6
4.0 Technical Score Criteria
4.1 Technical Score – Scoring Process The first aspect of the P2P Scoring Process is the application of the Technical Score which makes up between 35 and 60 percent of the overall P2P final score depending on the applicable investment category. A Technical Score is calculated for all projects identified during the initial MPD call-for-projects as well as all projects collected from completed planning studies. The project information and scores, as calculated below, should be stored in the Call-for-Projects Template spreadsheet.
All project lists are ranked independent of other submitted lists, including projects categorized in the Modernization or Expansion categories which have various project submission sources because of the broader scopes of work for the projects.
4.1.1 Pavement Preservation Projects During the call-for-projects, the Pavement Group is tasked with recommending and evaluating all prospective pavement preservation projects. The Pavement Group will provide their prioritized score and associated ranking for both newly recommended projects and existing projects from previous FY submissions with a single, contiguous ranking or scoring schema.
Upon the return of this information, MPD staff normalizes these scores into the 35-point scale allocated to the P2P Pavement Preservation Technical Score. All scores are proportionally converted from the Pavement Group’s 100-point raw scoring scale to the Pavement Preservation Technical Score as determined by the following formula:
Pavement Preservation Technical Score = ((x/n)*100) * y x = raw technical score y = weighted Technical Score percentage (0.35) n = 100 (maximum number of projects considered)
Due to the limited available annual budget for pavement preservation project funding, the top 60 scoring projects are advanced to the other scoring criteria, to maintain efficiency with the scoring effort. All recommended projects outside of the top 60 are kept for record-keeping purposes and are updated, resubmitted and reassessed in subsequent years’ scoring processes.
4.1.2 Bridge Preservation Projects During the call-for-projects, the Bridge Group is tasked with recommending and evaluating all prospective bridge preservation projects. The Bridge Group will provide their prioritized score and associated ranking for both newly recommended projects and existing projects from previous FY submissions with a single, contiguous ranking or scoring schema derived from the 22-26 criteria bridge inspection/assessment process.
In order to normalize the scores to the 60-point scale allocated to the Bridge Preservation Technical Score, the top-ranking project achieves the maximum 60-points, and each subsequently ranked project is scored at an evenly descending rate determined by the following formula:
Bridge Preservation Technical Score = ((1+n) – x) * y x = rank order y = weighted District Score percentage (0.60) n = 100 (maximum number of projects considered)
Due to the limited available annual budget for bridge preservation project, this formula is applied to the top 100 ranked project recommendations. Therefore, the top-ranking project receives the maximum allocation of Bridge Preservation Technical Score points and subsequent projects descends on its linear scale.

May 2020 Planning to Programing Guidebook 7
4.1.3 Modernization Projects The same scoring methodology used for both Technical Groups is applied to the Modernization investment category. Most Modernization project recommendations are derived from ADOT Statewide Studies. Each of the following studies are treated as a Technical Group as each developed its own project prioritization methodology: Corridor Profile Studies, State Freight Plan, Statewide Climbing and Passing Lane Study, and Statewide Shoulders Study. Additionally, Technical Sub-group recommendations are considered as part of the Modernization recommendation project list.
In order to normalize all of the scores to the 35-point scale allocated to the Modernization Technical Score, the top-ranking project achieves the maximum 35-points, and each subsequently ranked project is scored at an evenly descending rate determined by the following formula:
Technical Score = ((1+n) – x) * y x = rank order y = weighted District Score percentage (0.35) n = 100 (maximum number of projects considered)
This formula is applied to the top 100 ranked project recommendations for each of the respective Statewide Studies or Technical Sub-group submission.
All other project recommendations from any other study source are requested by the P2P Manager in May each year and submitted to each Technical Group for inclusion in their prioritization process. For example, if a study recommendation identified a safety improvement, it would be submitted to ADOT’s Traffic Safety Section within the TSMO Division for prioritization. If a study recommendation identified an expansion project, it would be submitted to the P2P Manager to receive an Expansion Technical Score, as described in the following section, 4.1.3.
Due to the limited available annual budget for Modernization project funding, only the top 35 scoring projects are advanced to the other scoring criteria, to maintain efficiency with the scoring effort. All recommended projects outside of the top 35 are kept for record-keeping purposes and are updated, resubmitted and reassessed in subsequent years’ scoring processes.
4.1.4 Expansion Projects The expansion investment area is comprised of projects that do not originate from a consistent source; technical group, study recommendation or otherwise. Therefore, a separate technical score criteria is assigned specifically and exclusively to all projects categorized within the expansion investment area. The expansion technical score includes criteria measuring the Projected LOS, Projected Average System Speeds, System Reliability, Freight System Reliability, Cost Effectiveness and New Permanent Job Creation.
The individual scoring criteria is shown in Table 3 and are further detailed in the following sections.
Table 3: Expansion Technical Score Expansion Technical Score Criteria Score
Projected LOS 10 Projected Average System Speeds 5
System Reliability 10 Freight System Reliability 10
Cost Effectiveness 10 New Permanent Job Creation 5
4.1.5 LOS and Speed AZTDM Calculations Both the Projected LOS and Projected Average System Speed calculations use the resulting information from 2023 and 2040 outputs from the AZTDM statewide model. Given that project lengths and milepost limits often will not align directly with the model’s segmentation, the output values are determined using a weighted average of all segments fully or partially within the project limits. All model segments that only

May 2020 Planning to Programing Guidebook 8
partially intersect a project’s milepost limits are truncated at the project limits to avoid over-representing partial segments.
The average of the 2023 and 2040 projected LOS values was calculated for each project and related to a 0 – 1.0 scale prior to assessing the score. The range represents the continuum between LOS, with 0 representing free-flow traffic and subsequently a lower priority for expansion efforts, and 1.0 representing the highest degree of traffic congestion and a top priority for expansion efforts4. The following formula is used to determine this scoring component:
LOS Score = 2023/2040 Average LOS * 10
The average of the 2023 and 2040 projected speeds are calculated for each project and related inversely to the existing weighted average posted speed limit within each project’s limits. Therefore, project locations where projected average speeds are significantly lower than the existing posted speeds receive a higher score, whereas project locations where projected average speeds remain close to the posted speeds receive a lower score. The following formula is used to determine this scoring component:
Speed Score = 5 – (2023/2040 Average Speed# / Weighted Average Posted Speed * 5) # Average Speed = Vehicle Miles Traveled (VMT) / Vehicle Hours Traveled (VHT)
4.1.6 Travel Time Reliability Calculations The Travel Time Reliability measures are determined by assessing a weighted average of the data ratio derived from the values collected along Traffic Messaging Channel (TMC) locations located throughout the statewide ADOT system. These TMC locations calculate speed values which are subsequently translated into reliability ratios given the variation of vehicular speeds.
The System Reliability Score is determined by identifying the Level of Travel Time Reliability (LOTTR) ratio which is calculated by measuring the 80th percentile speed of all vehicles which is represented as a ratio between 1.0 – 1.5. A ratio of 1.0 represents completely reliable conditions for the represented roadway segment, whereas a ratio of 1.5 represents unreliable conditions for the represented roadway segment. The following formula is used to determine this scoring component:
System Reliability Score = LOTTR / 1.5 * 10
The Freight System Reliability Score is determined by identifying the Truck Travel Time Reliability (TTTR) ratio which is calculated by measuring the 95th percentile speed of freight vehicles which is represented as a ratio between 1.0 – 1.5. A ratio of 1.0 represents completely reliable conditions for the represented roadway segment, whereas a ratio of 1.5 represents unreliable conditions for the represented roadway segment. The following formula is used to determine this scoring component:
Freight System Reliability Score = TTTR / 1.5 * 10
4.1.7 Cost Effectiveness The Cost Effectiveness score is determined conducting a life-cycle cost analysis, comparing the cumulative capital and maintenance costs of a potential project to the annual travel time savings. This methodology emulates a standard benefit-cost analysis, with Annual Travel Time Savings being measured as the benefit. The following formula is used to determine this scoring component:
(Annualized Life-Cycle Capital Cost + Annual Operating/Maintenance Cost - Annualized External Contributions) / Annual Travel Time Savings * 10
4.1.8 New Permanent Job Creation New Permanent Job Creation is determined by AZTDM and REMI TranSight modeling outputs. These modeling outcomes are combined and scored by MPD modeling staff.
4 Although LOS conditions of roadways exist between 0 – 1, the model may output a value exceeding 1.0 which would indicate projected traffic volumes in excess of the existing roadway capacity.

May 2020 Planning to Programing Guidebook 9
5.0 Policy Score Criteria The second aspect of the P2P Scoring Process is the application of the Policy Score which makes up 10 percent of the overall P2P final score. A Policy Score is calculated for all the projects identified during the initial MPD call-for-projects, including all the projects collected from completed planning studies and all previously recommended projects submitted in a previous FY.
The Policy Score is comprised of three criteria: freight flow, corridor significance/functional classification and local funding contributions. The individual scoring criteria are further detailed in the following sections. Refer to Table 6 for the full point distribution of the Policy Score.
5.1 Freight Flow Score The Freight Flow Score is a measurement based on T-Factor values reported in the annual AADT: Traffic Counts report produced by MPD, as noted in Section 3.0. The T-Factor measures the percentage of the overall AADT volumes that freight vehicles represent. Table 4 shows the specific point values assigned to each project based upon the project range’s T-Factor value.
Table 4: Freight Flow Scoring Freight Flow Range Score
T-Factor > 25% 3 T-Factor 10% - 25% 2
T-Factor < 10% 1
Given project lengths and milepost limits often will not align directly with the T-Factor reporting segmentation, the T-Factor is determined using a weighted average of all segments fully or partially within the project limits. All T-Factor segments that only partially intersect a project’s milepost limits are truncated at the project limits to avoid over-representing partial segments. For further details regarding the identification of the project’s T-Factor value, including the calculation template, refer to Appendix C.
5.2 Corridor Significance / Functional Classification ScoreThe Corridor Significance / Functional Classification Score assigns specific point values to different roadway Functional Classifications and NHS designations as reported in the published ADOT Map Book (https://azdot.gov/maps/geographic-and-functional-maps) and expressed in the Roadway Features geodatabase. Roadways with a higher functional classification are awarded a higher point value. Table 5 shows the specific point values assigned to each project based upon the project range’s corresponding roadway functional classification.
Table 5: Functional Classification Scoring Functional Classification Score
Interstate 3 Non-Interstate NHS 2.5
Major Arterial 2 Minor Arterial 1.5
Major Collector 1 Minor Collector 0.5
The most recently published ADOT Map Book should be used as the preliminary reference for identifying the project’s location when determining each project’s Functional Classification Score. For more detailed differentiation between functional classifications, the Functional Classification feature class in the ADOT Features geodatabase can be overlaid with the ADOT Milepost feature class. In doing so, the changes between functional classifications as well as exact distinction between NHS and non-NHS route segments can be precisely determined to the milepost. In the event a project’s milepost limits extend across two or more different functional classifications, the higher point value amongst the selections should be assigned.
May 2020 Planning to Programing Guidebook 10
Similarly, in the event that only a portion of a project’s milepost limits is located along a NHS route segment, the full point allocation is awarded.5
5.3 External Funding Contribution Score Projects explicitly noted as partially or fully funded by local, regional or other secondary funding sources are awarded up to four (4) points for the External Funding Contribution Score. The percentage of funding contribution made towards the total project cost determines the proportion of the maximum available point value assigned to the project.
External Funding Contribution Score= (% of funding contribution) * 4
Most proposed projects submitted from an ADOT Technical Group will be funded through annually allocated state and/or federal funding sources and will not be awarded any points for External Funding Contributions. An Intergovernmental Agreement (IGA) between the external organization and ADOT must be executed prior to November 15th in order to receive an External Funding Contribution Score.
5.4 Policy Score – Scoring Process The application of the Policy Score includes accounting for each criterion, as noted in Section 5.1, Section 5.2 and Section 5.3. The total Policy Score has a maximum of 10 points. Table 6 shows the maximum point values for each scored component.
Table 6: Policy Scoring – Point Distribution Policy Score Criteria Score
External Funding Contribution 4 Freight Flow 3
Corridor Significance / Functional Classification 3
Use the Master Project List document within the Policy Reference to track each individual project’s Policy Score components and tabulate the normalized Policy Score.
The Policy Score category totals 10 points and represents 10% of the final P2P Project Score.
5.4.1 New Project Scoring All newly proposed projects undergo the full scoring process for the Policy Scoring portion of the overall P2P Score.
5.4.2 Previously Recommended Project Scoring Previously recommended projects will need to undergo a partial re-scoring of the Policy Scoring portion of the overall P2P Score. The necessity of updating individual project scoring will vary based upon the degree the scoring criteria components have been adjusted since the project was last scored. As referenced in Section 3.0 the Freight Flow is required to be updated on an annual basis at a minimum.6
5 Note that under certain circumstances, only a portion of Arizona State Route may be included on the National Highway System. 6 Local Funding Contribution should be noted if changes have occurred between Fiscal Year scoring cycles and Corridor Significance / Functional Classification is only reassessed where known changes have been made to the statewide system’s classifications.

May 2020 Planning to Programing Guidebook 11
6.0 Safety Score – Scoring Process The third aspect of the P2P scoring process is the application of the Safety Score which makes up 25 percent of the overall Modernization P2P final score, 15 percent of the overall Expansion P2P final score and is not considered in Pavement and Bridge Preservation final scores. The Safety Score is determined by the Level of Safety Score (LOSS) score derived from the Safety Analyst tool. The LOSS score is a measurement of each individual project limit’s safety performance relative to the capacity for further safety improvements dependent upon the roadway facility and environment type. Using this metric to measure safety allows the various roadway facilities and environments across the statewide transportation network to be normalized to a universal scale.
The LOSS output values from the Safety Analyst tool are displayed as LOSS 1 – 4, with a lower score indicating a safer facility (lower priority) relative to statistical norms of similar facility types and higher score indicating a less safe (higher priority) facility relative to statistical norms of similar facility types. Given the diverse variability in facility types and roadway environment conditions, these values are produced on segments with irregular lengths.
The Safety Score category of the P2P Scoring Process is annually updated for all previously recommended projects. This is due to the annual updates made to the Safety Analyst Database based on reported statewide crashes, incident cataloging and potential updates or changes in roadway facility types. Therefore, MPD staff is responsible for requesting the statewide LOSS export from the TSMO Division on an annual basis as noted in Section 3.0.
6.1 Step-by-Step Safety Score Application The LOSS score is calculated with a high degree of accuracy using GIS. The scoring process begins by georeferencing each prospective project. Each project is geographically referenced using the beginning and ending milepost limits precisely along the ADOT highway system. Once the projects have been georeferenced, the LOSS segmentation and associated segment scoring data (which is translated into a GIS compatible shapefile directly from Safety Analyst) is overlaid upon the newly created project location shapefile. The overlaid LOSS segmented values are then joined and attributed to the project location features by querying all intersecting LOSS segments. This process captures all LOSS segments partially or fully included within each project’s respective milepost limits. Given project lengths and milepost limits often will not align directly with the LOSS reporting segmentation, the LOSS score is determined using a weighted average of all segments fully or partially within the project limits. All LOSS segments that only partially intersect a project’s milepost limits are truncated at the project limits to avoid over-representing partial segments.
The following formula is used to determine this scoring component:
Modernization Safety Score = (x/4)*25 Expansion Safety Score = (x/4)*7.5 + Safety Countermeasure Score
x = Average LOSS Score
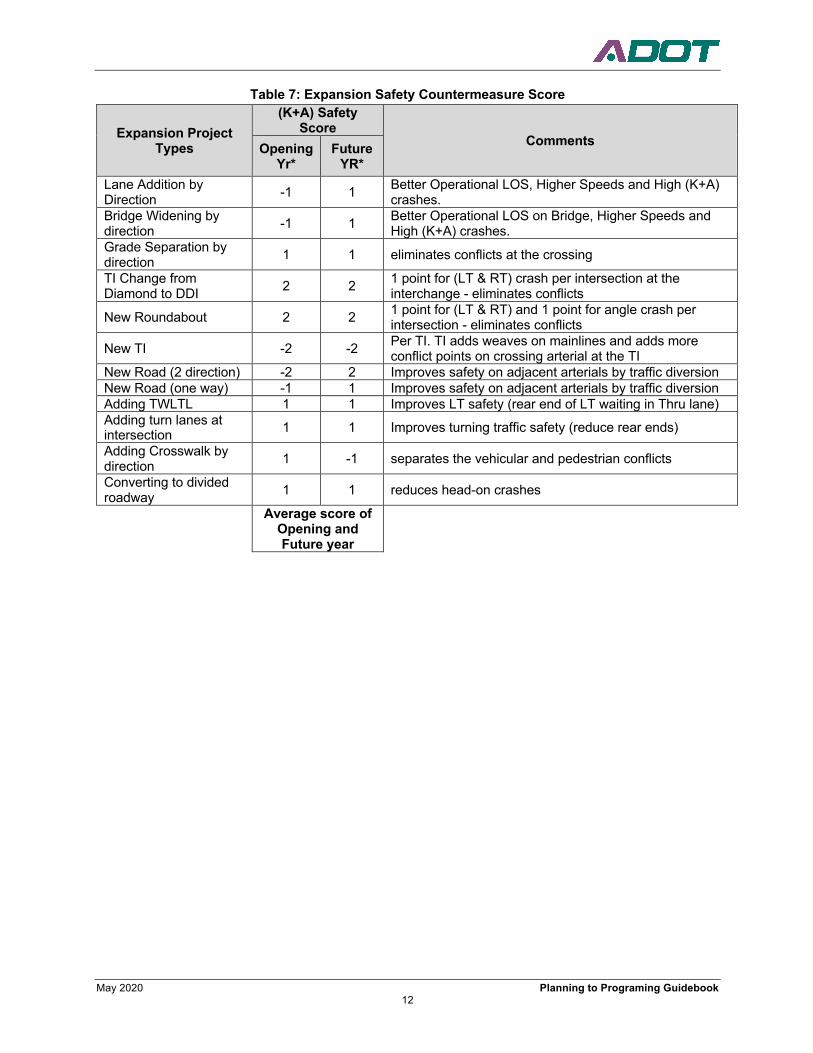
6.2 Additional Expansion Project Consideration The overall safety score for all Expansion projects is derived from a 7.5 percent weighting for the LOSS score and a 7.5 percent weighting for a Safety Countermeasure Score as determined by the ADOT Traffic Safety Group, as shown in Table 7. This additional analysis applies a set safety benefit, or detriment, for specific project scope elements. The final score is based on the average of the opening year and future year expected safety performance for all applicable scope elements. Due to the wide variety of outcomes attributed towards expansion scope, this score could be positive, negative or null.
May 2020 Planning to Programing Guidebook 12
Table 7: Expansion Safety Countermeasure Score
Expansion Project Types
(K+A) Safety Score
Comments Opening Yr*
Future YR*
Lane Addition by Direction -1 1 Better Operational LOS, Higher Speeds and High (K+A)
crashes. Bridge Widening by direction -1 1 Better Operational LOS on Bridge, Higher Speeds and
High (K+A) crashes. Grade Separation by direction 1 1 eliminates conflicts at the crossing
TI Change from Diamond to DDI 2 2 1 point for (LT & RT) crash per intersection at the
interchange - eliminates conflicts
New Roundabout 2 2 1 point for (LT & RT) and 1 point for angle crash per intersection - eliminates conflicts
New TI -2 -2 Per TI. TI adds weaves on mainlines and adds more conflict points on crossing arterial at the TI
New Road (2 direction) -2 2 Improves safety on adjacent arterials by traffic diversion New Road (one way) -1 1 Improves safety on adjacent arterials by traffic diversion Adding TWLTL 1 1 Improves LT safety (rear end of LT waiting in Thru lane) Adding turn lanes at intersection 1 1 Improves turning traffic safety (reduce rear ends)
Adding Crosswalk by direction 1 -1 separates the vehicular and pedestrian conflicts
Converting to divided roadway 1 1 reduces head-on crashes
Average score of Opening and Future year

May 2020 Planning to Programing Guidebook 13
7.0 District Score Criteria The fourth aspect of the overall P2P scoring process is the application of the District Score which makes up between 25 and 45 percent of the overall P2P final score, depending on the investment category. Each District Engineer and district staff is given an opportunity to prioritize prospective projects within their district. This prioritization is requested in advance of each respective District Workshop.7 Following the discussion occurring at the District Workshop, each District Engineer provides confirmation of final adjustment to their District Score priorities. Any changes at this time will overwrite the preliminary district prioritization provided prior to the District Workshop.
7.1 District Score – Scoring Process The district prioritization is given to each specific investment category (pavement preservation, bridge preservation, modernization and expansion) for all projects within each specific district boundary. Each district will have a singular project with a maximum applicable District Score for each investment area.
As noted in the determination of the Technical Score, each respective district prioritization submission is sorted from highest priority to lowest priority. In order to normalize all scores to the 30-point scale allocated to the District Score, the top-ranking score achieves the maximum 30 points, and each subsequently ranked project is scored at an evenly descending rate determined by the following formula:
District Score = ((1+n) – x) * y x = rank order y = weighted District Score percentage (0.3) n = 100 (maximum number of projects considered)
This formula is applied to each respective district projects list. Therefore, each top-ranking project within each investment category from all ADOT Engineering Districts prospective project lists receive the maximum allocation of District Score points and each list descend on their own respective scales, independent of the other submitted lists.
7.2 Preparation for District Workshop Upon the completion of the first three scoring aspects of the overall P2P Scoring Process, District Spreadsheets are developed in preparation for the District Workshops held in October. Each ADOT Engineering District is scheduled for a workshop to discuss all prospective projects within the district’s boundary.
To maximize the efficiency of this workshop, MPD distributes district-specific spreadsheets to each ADOT Engineering District to review and return the Preliminary District Score by prioritizing the prospective projects by their respective investment categories. MPD Staff requests that each District provide a Preliminary District Score for up to the following number of projects within each respective investment category:
• Pavement Preservation – 20 projects • Bridge Preservation – 10 projects • Modernization – 5 projects • Expansion – all projects
With all four scoring aspects provided, the draft final prioritization within each engineering district is presented at the respective District Workshops.
7 Further detail is provided describing the District Workshop process in Section 7.2.
May 2020 Planning to Programing Guidebook 14
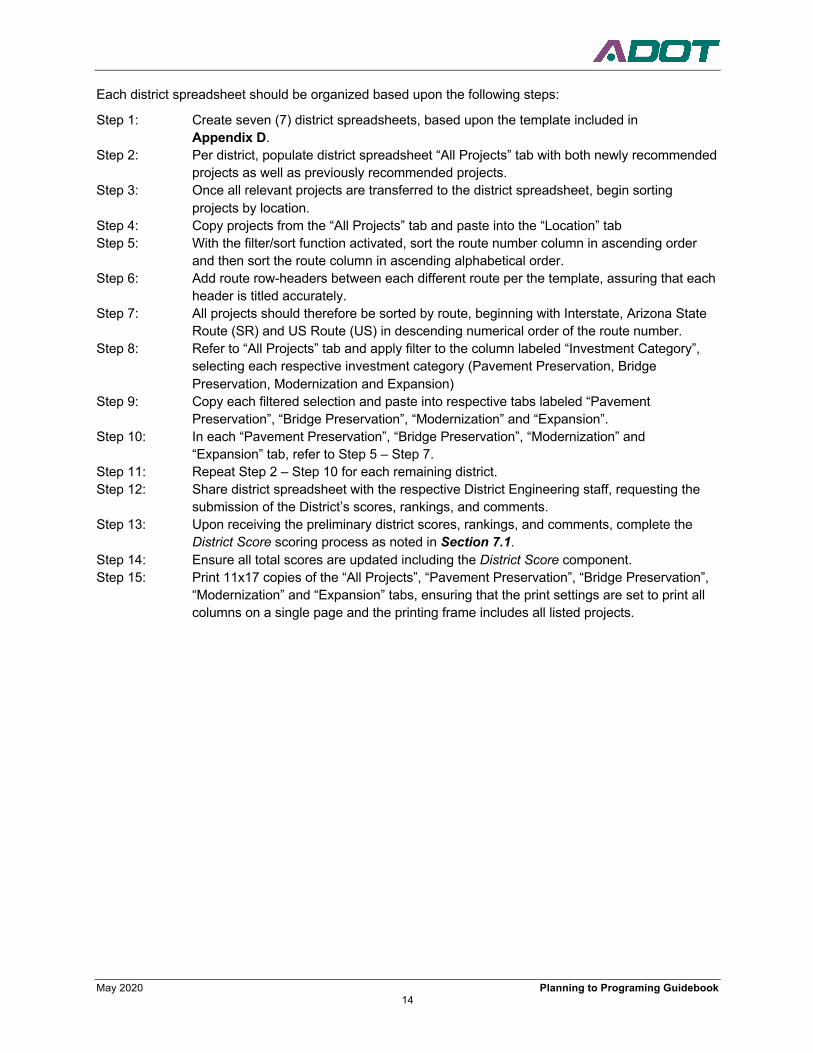
Each district spreadsheet should be organized based upon the following steps:
Step 1: Create seven (7) district spreadsheets, based upon the template included in Appendix D.
Step 2: Per district, populate district spreadsheet “All Projects” tab with both newly recommended projects as well as previously recommended projects.
Step 3: Once all relevant projects are transferred to the district spreadsheet, begin sorting projects by location.
Step 4: Copy projects from the “All Projects” tab and paste into the “Location” tab Step 5: With the filter/sort function activated, sort the route number column in ascending order
and then sort the route column in ascending alphabetical order. Step 6: Add route row-headers between each different route per the template, assuring that each
header is titled accurately. Step 7: All projects should therefore be sorted by route, beginning with Interstate, Arizona State
Route (SR) and US Route (US) in descending numerical order of the route number. Step 8: Refer to “All Projects” tab and apply filter to the column labeled “Investment Category”,
selecting each respective investment category (Pavement Preservation, Bridge Preservation, Modernization and Expansion)
Step 9: Copy each filtered selection and paste into respective tabs labeled “Pavement Preservation”, “Bridge Preservation”, “Modernization” and “Expansion”.
Step 10: In each “Pavement Preservation”, “Bridge Preservation”, “Modernization” and “Expansion” tab, refer to Step 5 – Step 7.
Step 11: Repeat Step 2 – Step 10 for each remaining district. Step 12: Share district spreadsheet with the respective District Engineering staff, requesting the
submission of the District’s scores, rankings, and comments. Step 13: Upon receiving the preliminary district scores, rankings, and comments, complete the
District Score scoring process as noted in Section 7.1. Step 14: Ensure all total scores are updated including the District Score component. Step 15: Print 11x17 copies of the “All Projects”, “Pavement Preservation”, “Bridge Preservation”,
“Modernization” and “Expansion” tabs, ensuring that the print settings are set to print all columns on a single page and the printing frame includes all listed projects.

May 2020 Planning to Programing Guidebook 15
8.0 Development of Final P2P List After each District Workshops is conducted and the final district priorities are received, each component of the overall P2P Scoring Criteria is completed. Upon updating each individual district spreadsheet based on the final district priorities and subsequent District Score, each district’s project lists must be compiled into one statewide prioritized list, resulting in the Draft Final P2P List.
The Draft Final P2P List should be separated into individual investment category lists in descending order of the total score. The sum of each component of the P2P Score equates to a maximum-possible project score of 100 points, and a minimum-possible score of 0 points. The full scoring breakdown, per investment category, is shown as follows in Table 8. Reference Appendix G for the full detailed scoring matrix.
Table 8: Final Scoring Breakdown
Category Pavement
Preservation Bridge
Preservation Modernization Expansion
Technical Score 45% 60% 35% 50% Safety Score - - 25% 15% Policy Score 10% 10% 10% 10% District Score 45% 30% 30% 25%
During the development of the Draft Final P2P List, the list is reviewed by the ADOT P2P Manager. Following this review, all comments and adjustments should be fully addressed. At this point, the Final P2P List is completed and resubmitted to the ADOT P2P Manager.
The P2P Manager then submits the Final P2P List to the ADOT STIP Manager, Major Projects Manager, Project Management Group Manager, and P2P Steering Committee for use in Programming and Planning Level Scoping. This step completes the performance-based planning prioritization process.
9.0 Planning Level Scoping Upon the finalization of the P2P Statewide Prioritized Project List, the highest scoring projects within a combined ranking of both pavement and bridge preservation projects are selected as candidates for the Major Projects Group’s Planning Level Scoping process. The number of projects selected varies depending on the number of preservation projects expected to enter the Five-Year Program each FY. Additionally, all Modernization projects are reviewed to identify overlapping project limits with the selected highest scoring preservation projects.
The highest scoring projects are submitted to the Major Projects Group to begin the Planning Level Scoping process. The Planning Level Scoping process is a three-month effort that produces a Planning Level Scoping document. The Planning Level Scoping document includes a checklist, cost estimates and coordination meeting minutes. The checklist provides engineering justification for the cost estimate and scope of work refinements. The cost estimates completed in this process are fully itemized cost estimates adhering to ADOT’s Estimated Engineering Construction Cost (E2C2) formatting. The final component of the Planning Level Scoping document is a collection of meeting minute records which document the coordination efforts engaged in with ADOT Technical Groups and ADOT Engineering District personnel. For additional detail regarding the Planning Level Scoping process, reference the Planning Level Scoping Guidelines produced by the Major Projects Group.
Upon completion, each Planning Level Scoping document is submitted to the ADOT P2P Manager and STIP Manager to update project scope of work and cost estimates in the Draft Five-Year Program. Additionally, the ADOT P2P Program Manager facilitates the update to the scope of work and cost estimates of projects not entering the current year’s Five-Year Program for use in the next FY-cycle of the P2P process.
May 2020 Planning to Programing Guidebook 16
10.0 Next Steps P2P Scoring is an annually completed process based upon the most recently updated data available. Upon the completion of each FY’s P2P process, improvements to the scoring implementation procedures, scoring criteria, eligibility and weights can be identified.
This ADOT Planning to Programming Scoring Guidebook is developed based upon the scoring criteria, eligibility, weights and processes used during the development of the Draft FY 2020 – 2024 Five Year Program. In order to maintain consistency amongst scored projects, any future improvements or adjustments made to the scoring criteria will require adjustments to all previously proposed and newly proposed projects. Similarly, this document will require periodic updates based upon any implemented improvements or adjustments made to the scoring criteria, eligibility, weights, or processes.
11.0 Arizona Management System Integration This Guidebook is being integrated into ADOT’s Arizona Management System (AMS) process and products. Accordingly, the procedures and guidelines included in this Guidebook should be treated essentially as “Standard Work” for P2P. In addition, a Plan-Do-Check-Act (PDCA) effort was undertaken in 2017 for Pavement Preservation Project Delivery, resulting in Standard Work. Phase 0 of the Pavement Preservation Project Delivery Standard Work applies to P2P, and the procedures and guidelines included in this Guidebook need to be coordinated with the PDCA Standard Work. Both Standard Work documents are being adjusted to be uniform and consistent.
May 2020 Planning to Programing Guidebook 17
Appendix A – P2P Responsibilities Assignment Matrix (RAM)

May 2020 Planning to Programing Guidebook 18
Task #
Assignment Responsibility Start Finish
1 P2P Manager Call for Projects Nominations – Board / Districts / COGs / MPOs / MPD May 1st May 1st 2 Board, COGs, MPOs, MPD
Project Managers, Districts Submit Project Nominations to the P2P Manager by May 15th May 1st May 30th
3 P2P Manager, Board, MPD, IDO, TSMO, Districts
Early Coordination Workshop - P2P updates / Early Project Coordination
June 1st June 30th
4 P2P Manager Call for Projects Nominations – Technical Groups Jul 1st Jul 1st 5 Technical Groups
Technical Groups to email list of prioritized project nominations to P2P Manager by July 31st
Jul 1st Jul 31st
6 P2P Manager Modernization projects submitted to Districts Aug 1st Aug 1st 7 MPD, Traffic Safety Section MPD applies Technical & Policy Scores / TSMO applies Safety Scores
(Preservation & Expansion) Aug 1st Aug 31st
8 Districts Districts submit ranking for Top 5 Modernization projects to P2P Manager Aug 1st Aug 31st 9 P2P Manager Pavement, Bridge, & Expansion lists submitted to Districts Aug 31st Aug 31st 10 Districts Districts submit rankings to P2P Manager by September 30th Sep 1st Sep 30th 11 P2P Manager, Regional
Planners Convert District Ranking to District Score and prepare District Workshop spreadsheets
Oct 1st Oct 15th
12 Board, MPD, IDO, TSMO, Districts, MPOs
District Workshops: Confirm project details and rankings; combine projects (as appropriate)
Oct 15th Oct 31st
13 P2P Manager, Regional Planners
Finalize P2P List Nov 1st Nov 15th
14 MPD P2P Manager Submit Final P2P List to STIP Manager and Major Projects Manager Nov 15th Nov 15th 15 STIP Manager, Executive
Management Develop Draft Tentative Five-Year Program / Review with ADOT Management
Nov 15th Dec 31st
16 Corridor Planning Group, Roadway Pre-Design, Technical Groups
Planning Level Scoping (top ranking priority projects) Nov 15th Feb 15th
17 STIP Manager, Executive Management, Board
Draft Tentative Five-Year Program Study Session Jan 1st Jan 31st
18 STIP Manager, Board
Draft Five Year Program Public Hearings Mar 1st May 31st
19 STIP Manager Revise Draft Five Year Program based on Public Comments June June 20 STIP Manager, Board Board Approval of Draft Five Year Program June June 21 STIP Manager, Governor’s
Office Governor’s Office Approval of Final Five-Year Program June June
22 STIP Manager Distribute Approved Five-Year Program July July 23 Technical Groups Field Inspections Year-round Year-round

May 2020 Planning to Programing Guidebook 19
Appendix B – Technical Score Supplemental Materials
May 2020 Planning to Programing Guidebook 20
Call-for-Projects Template Document The Call-for-Projects Template Document should be used for the following:
• The template for the call-for-projects request to the technical group • The call-for-projects response from the technical groups • The scoring of each technical groups’ provided rankings
Expansion Technical Scoring Template The expansion technical score is comprised of four components from two separate data sources. The Projected LOS and Projected Average System Speeds are calculated from the outputs from the current year’s AZTDM statewide traffic model. Additionally, the Travel Time Reliability and Truck Travel Time Reliability values are calculated by outputs derived from the INRIX speed data. Each of these values are calculated for each project categorized in the expansion investment category using the Expansion Technical Score Calculation formatting as explained below:
Open the ‘Scoring Worksheet’ Excel file.
In the ‘Expansion Technical Score’ tab, enter the segment identification, route name and the milepost limits in the beige cells (Columns A – D) for all eligible projects.
Update the ‘AZTDM Data’ tab with the most recently available data. Coordinate with the MPD Data Group to access the appropriate data in excel format.
Open ArcMap and project and symbolize the ‘AZ_2023_2040_VOC_VMT_VHT’ shapefile. Additionally, project, symbolize, and label the ‘a00m’ ADOT route milepost shapefile and orient on top of the ‘AZ_2023_2040_VOC_VMT_VHT’ file for use as a special reference guide.
Save the current ArcMap working file as ‘AZTDM_Reference.mxd’ file to refer back to when needed.
Use the newly created ‘AZTDM_Reference’ file to identify which Location IDs (‘ID’) correspond to each project limits.
- Within the ‘AZTDM_Reference’ file, use the selection tool and the milepost labels as a guide, select all applicable AZTDM segments within each respective project limits. Ensure that only mainline segments (excluding ramps, frontage roads, and intersecting and adjacent routes) are selected.
- Enter (or copy/paste) the appropriate Location IDs applicable to each project’s entire milepost limits into the beige cells in the ‘Expansion Technical Score’ tab (Column V). A Location ID applies to a segment if the Location ID’s milepost limits fall partially or completely within the milepost limits for the project. Do not delete extra/unused rows.
- In the event that rows need to be added to a segment to accommodate the number of Location ID’s, insert additional cells only in columns R-AG within the middle of the existing cells, as opposed to the end, and select the “shift cells down” option in order to maintain proper calculation formatting.
May 2020 Planning to Programing Guidebook 21
- If a specific Location ID spans beyond the exact project milepost limits, as seen in the ‘AZTDM_Reference’ selection, manually adjust the length of the segment accordingly in Column W. The length can be calculated using the measurement tool within ArcMap and should be applied for either the beginning or ending limits where the milepost limits need to be truncated according to the projects BMP or EMP shown in columns T and U respectively. This process is requires manual entry where applicable.
- The Locations IDs may not be consistent from year to year. Therefore, ensure that reoccurring project recommendations undergo the full scoring process including re-identifying the applicable ‘Location ID’ values.
Columns E – I indicates the weighted values for the V/C ratio (LOS) and the projected average speeds for both years, as well as the average posted speed limit for each project.
Columns L & M show the calculated scores using the average of both year’s V/C ratio values and using the average of both year’s average speeds related to the average posted speeds.
The processed INRIX speed data is and translated into travel time reliability for all vehicles as well as specifically for freight vehicles and should be updated in the INRIX’ tab.
In the ‘Expansion Technical Score’ tab, Columns N & O should indicate the LOTTR and TTTR scores, referencing the ‘INRIX’ tab data.
Column P represents the total expansion score for each Expansion investment area project.
May 2020 Planning to Programing Guidebook 22
Appendix C – Policy Score Supplemental Materials

May 2020 Planning to Programing Guidebook 23
Freight Flow Score The Freight Flow Score is a measure of the percentage of freight volume values for the associated MP ranges of the individual projects. This measure is expressed as the T-Factor value. The weighted average T-Factor value is calculated using the Policy Scoring T-Factor Calculation formatting as explained below:
Open the ‘Scoring Worksheet’ Excel file to compile T-Factor data from ADOT HPMS System.
In the ‘T-Factor Calc’ tab, enter the segment identification, route name and the milepost limits in the beige cells (Columns B – E) for all eligible projects.
Update the ‘Statewide Data’ tab with the most recently available data. Reference the AADT Reports: Traffic Counts developed by MPD and accessible on the Data and Analysis webpage (https://azdot.gov/planning/DataandAnalysis/average-annual-daily-traffic).
Use the ‘Statewide Data’ tab to identify which Location IDs (‘CNTLOCID’) correspond to each project limits.
- Using the Excel filter, filter the “Route” column (column C) to show only the specific corridor and use column T to ensure you are using the most recently available data year.
- Enter (or copy/paste) the appropriate Location IDs applicable to each project’s entire milepost limits into the beige cells in the ‘T-Factor Calc’ tab (column M). A Location ID applies to a segment if the Location ID’s milepost limits fall partially or completely within the milepost limits for the project. Do not delete extra/unused rows.
- In the event that rows need to be added to a segment to accommodate the number of Location ID’s, insert additional cells only in columns I-R within the middle of the existing cells, as opposed to the end, and select the “shift cells down” option in order to maintain proper calculation formatting.
- If a specific Location ID spans beyond the exact project milepost limits for either the beginning or ending limits, the milepost limits will need to be truncated according to the projects BMP or EMP in columns N and P respectively. This process is requires manual entry where applicable.
- The Locations IDs may not be consistent from year to year. Therefore, ensure that reoccurring project recommendations undergo the full scoring process including re-identifying the applicable ‘Location ID’ values.
Column R indicates the weighted T-Factor values.
Columns B – F show the T-Factor summary table, which represents the weighted average T-Factor values in a consolidated format, which is used as a reference for the ‘Scoring’ tab, which tabulates the full Policy Score.

May 2020 Planning to Programing Guidebook 24
Appendix D – District Score Extra Materials
May 2020 Planning to Programing Guidebook 25
District Workshop Template Document
The District Workshop Template Document should be used for the following:
• The template for each of the seven district workshop spreadsheets • The returned preliminary district project ranking • The development of the preliminary district project score • The returned final district project ranking • The development of the final district project score

May 2020 Planning to Programing Guidebook 26
Appendix E – P2P Communication List
May 2020 Planning to Programing Guidebook 27
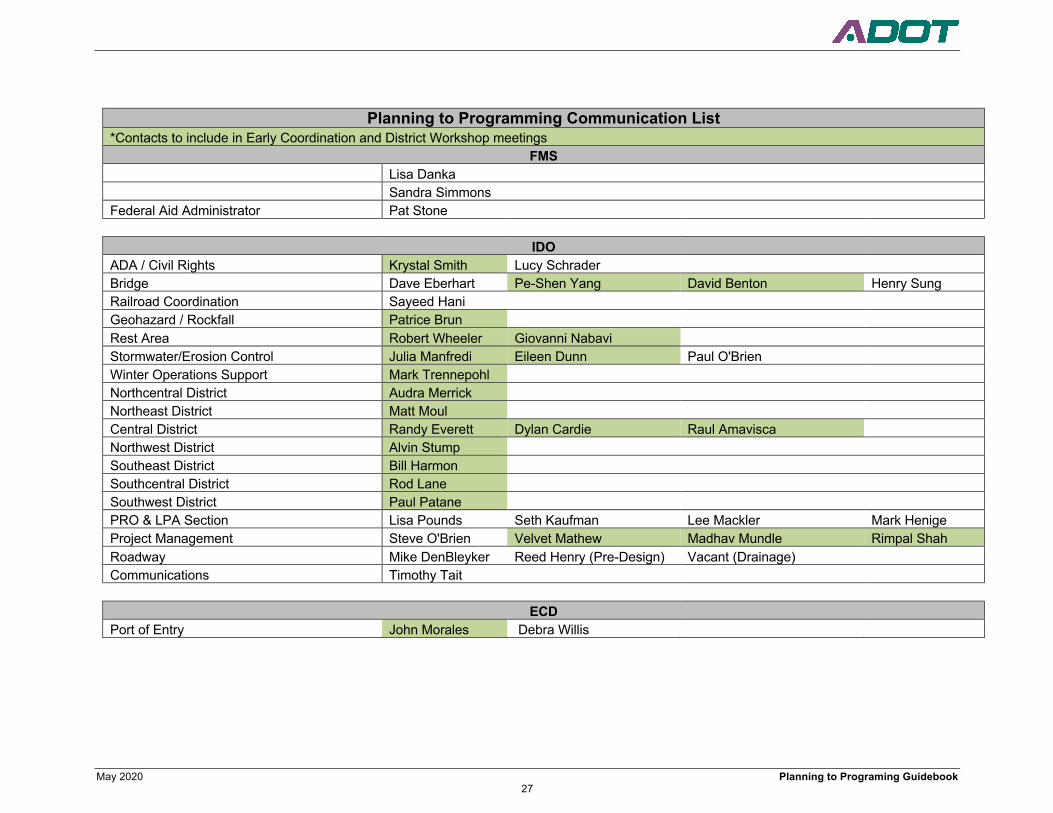
Planning to Programming Communication List *Contacts to include in Early Coordination and District Workshop meetings
FMS Lisa Danka Sandra Simmons Federal Aid Administrator Pat Stone
IDO ADA / Civil Rights Krystal Smith Lucy Schrader Bridge Dave Eberhart Pe-Shen Yang David Benton Henry Sung Railroad Coordination Sayeed Hani Geohazard / Rockfall Patrice Brun Rest Area Robert Wheeler Giovanni Nabavi Stormwater/Erosion Control Julia Manfredi Eileen Dunn Paul O'Brien Winter Operations Support Mark Trennepohl Northcentral District Audra Merrick Northeast District Matt Moul Central District Randy Everett Dylan Cardie Raul Amavisca Northwest District Alvin Stump Southeast District Bill Harmon Southcentral District Rod Lane Southwest District Paul Patane PRO & LPA Section Lisa Pounds Seth Kaufman Lee Mackler Mark Henige Project Management Steve O'Brien Velvet Mathew Madhav Mundle Rimpal Shah Roadway Mike DenBleyker Reed Henry (Pre-Design) Vacant (Drainage) Communications Timothy Tait
ECD Port of Entry John Morales Debra Willis

May 2020 Planning to Programing Guidebook 28
MPD P2P Management Dan Gabiou Clem Ligocki Regional Planning Mark Hoffman Jason Bottjen John Wennes Freight Heidi Yaqub
Bike/Ped Donna Lewandowski
Tribal Planning Ermalinda Gene Don Sneed Programming Bret Anderson Myrna Bondoc Lynn Sugiyama Transit Jill Dusenberry Aeronautics Don Kriz Major Projects/Planning-Level Scoping Carlos Lopez Asad Karim Tazeen Dewan Asset/Performance Management Thor Andreson Transportation Analysis Keith Killough Baloka Belezamo Tracy Clark
TSM&O Deputy State Engineer Jim Windsor
Safety/Technology/TSMO Susan Anderson Kerry Wilcoxon Saroja Devarakonda Emmanuel Huerta
Regional Traffic Engineer Tony Abbo Central and SW Districts Regional Traffic Engineer James Gomes SC & SE Districts
Regional Traffic Engineer Robert LaJeunesse NE, NC, and NW Districts
Pavement Jerry James Yongqui Li Mafiz Mian Kevin Robertson
Executive Management Director John Halikowski SEO Dallas Hammit CFO Kristine Ward MPD Director Greg Byres ECD Director Tim Lane Policy Director Kevin Biesty IDO Director Steve Boschen IDO Assist Dir (Delivery) Todd Emery TSM&O Director Brent Cain Ops Scott Omer

May 2020 Planning to Programing Guidebook 29
PRB Manager Barry Crockett IDO Assist Dir (Districts) Jesse Guitierrez
State Transportation Board
Governor's Office
FHWA Senior Planner Ed Stillings Planner Romare Truly PEAR Manager Alan Hanson Division Director Karla Petty
COG & MPO *District Workshops only CAG Travis Ashbaugh CYMPO Chris Bridges Daniel Harmonick FMPO Dave Wessel Martin Ince LHMPO Vinny Gallegos MAG Eric Anderson Tim Strow Roger Herzog Teri Kennedy NACOG Chris Fetzer Vacant Jason James PAG Farhad Moghimi Paul Casertano Vacant SCMPO Irene Higgs Jason Hafner SEAGO Randy Heiss Jim Russell SVMPO Andrea Castanon Vacant WACOG Brian Babiars Justin Hembree YMPO Paul Ward Charles Gutierrez
May 2020 Planning to Programing Guidebook 30
Appendix F – Guidance for Programming Expansion Projects in Greater Arizona

May 2020 Planning to Programing Guidebook 31
Guidance for Programming Expansion Projects in Greater Arizona 1.01 PURPOSE
To present the Arizona Department of Transportation (ADOT) guidance for recommending expansion projects to the State Transportation Board for programming consideration in ADOT’s Five-Year Construction Program and Six-Ten Year Development Program for Greater Arizona.
1.02 SCOPE
This guidance is intended for all ADOT staff involved in developing and recommending adoption of ADOT’s Five-Year Construction Program, or any subsequent State Transportation Improvement Program (STIP) Amendments.
1.03 AUTHORITY
Authority for the P2P Guidebook is provided by ARS Title 28, Chapter 2, Article 7 and 23 USC Section 135(d)(2); 49 USC Section 5304(d)(2).
1.04 BACKGROUND
ADOT’s 2016-2040 Long-Range Transportation Plan (LRTP), What Moves You Arizona 2040, identifies the following policy statement, which applies to ADOT’s ability to fund expansion projects in Greater Arizona: “[ADOT], subject to State Transportation Board approval, may identify up to 5% of [Recommended Investment Choice (RIC)] funding in a given Five-Year Program year to provide ‘seed money’ to consider future highway expansion projects under one or more of the following scenarios:
• A federal grant is made; • A third party provides a funding contribution; and/or • A public-private partnership is arranged.
Consideration of such funding will be contingent on the associated project(s) scoring high enough in ADOT’s Planning to Programming (P2P) Link process to be eligible for funding. Additional funding from legislative appropriations or other sources may also enable ADOT to consider new system expansion projects.”

May 2020 Planning to Programing Guidebook 32
1.05 DEFINITIONS Cost Effectiveness Ratio The Cost Effectiveness Ratio is a Technical Evaluation Criteria for expansion projects within
ADOT’s P2P process, calculated as: (Annualized Life-Cycle Capital Cost + Annual Operating & Maintenance Cost – Annualized External Contributions) / (Annual Travel Time Savings).
Expansion Projects which add capacity through the addition of new facilities and/or services. Performance Targets Moving Ahead for Progress in the 21st Century Act (MAP-21) of 2012 established six national
transportation goal areas: Safety, Infrastructure Conditions, Congestion Reduction, System Reliability, Freight Movement & Economic Vitality and Environmental Sustainability. The Fixing America’s Surface Transportation Act of 2015 (FAST Act) further requires State Departments of Transportation to establish targets for up to 17 performance measures associated with these goal areas.
Greater Arizona All State Highway Systems that are not included within the Maricopa Association of Governments (MAG) and Pima Association of Governments (PAG) boundaries.
Modernization Projects that upgrade efficiency, functionality, and safety without adding capacity. Preservation Projects that preserve infrastructure by sustaining asset condition or extending asset service life. Recommended Investment Choice The percentage of funds identified within ADOT’s LRTP to be applied to each investment
category: preservation, modernization, and expansion. Third Party An agency or entity external from ADOT.
1.06 PROGRAMMING GUIDANCE
A. Eligibility In order for ADOT to recommend to the State Transportation Board inclusion of a new expansion project in Greater Arizona via the Draft Five-Year Construction Program or Six-to-Ten-Year Development Program, the project must meet the following parameters: 1. The project must be on the State Highway System within Greater Arizona. 2. The project must meet the eligibility requirements of its funding source(s). For Surface Transportation Block Grant Program
(STBG) funds, refer to the list of eligible activities, as identified by the Federal Highway Administration (FHWA): https://www.fhwa.dot.gov/specialfunding/stp/160307.cfm.
3. An Intergovernmental Agreement (IGA) or contract between ADOT and the external entity (or entities) must by executed (signed by all authorized parties).
4. External funding contribution must include a minimum non-ADOT contribution (including federally allocated funds to ADOT) of 25% of the expansion project’s total cost.
5. The expansion project nomination must be submitted to ADOT’s P2P Manager no later than May 31st, for consideration in the subsequent year’s Draft Five-Year Construction Program.
6. An expansion project nomination, at minimum, must include the following data: a. Route Name (Ex: I-10) b. Project Begin and End Limits (Ex: milepost (MP) 1.00 to MP 2.00, or First Street to Second Street) c. Proposed Project Name (Ex: I-10 Widening, MP 1.00 to MP 2.00)

May 2020 Planning to Programing Guidebook 33
d. Scope of Work, detailing the specific improvements of the project (number of additional lanes, lane widths, and direction of travel)
e. Total Project Cost (as estimated by a Professional Engineer, Civil) 7. The total funds contributed by ADOT to the expansion project must not exceed 5% of ADOT’s Five-Year Construction Program
STBG budget for Greater Arizona.
B. RESPONSIBILITIES 1. ADOT’s Multimodal Planning Division (ADOT MPD) must complete the P2P process on an annual basis, according to the P2P
schedule as outlined in the P2P Responsibilities Assignment Matrix (RAM) Chart. 2. Both internal and external Greater Arizona expansion project nominations must be submitted to ADOT’s P2P Manager by May
31st of each year to be considered in the following year’s P2P process. External expansion project nominations must be submitted by a recognized Metropolitan Planning Organization (MPO), Council of Government (COG), or Tribal Government to be considered.
3. The reallocation of funding from ADOT’s Greater Arizona preservation and/or modernization investment categories to fund the expansion project may not hinder ADOT’s ability to meet its minimum performance targets as required by the FAST Act. ADOT MPD would be responsible for analyzing the performance impacts of programming an expansion project.

May 2020 Planning to Programing Guidebook 34
Appendix G – Project Scoring Matrix

May 2020 Planning to Programing Guidebook 35
Pavement Preservation P2P - Pavement Preservation Scoring
Technical (45%)
Performance Target (2021) Measure / Criterion Metric / Formula Weighting
% Interstate Good Condition = 48% % Interstate Poor Condition = 2% % Non-Interstate Good Condition = 31% % Non-Interstate Poor Condition = 6%
Pavement Condition: IRI, Cracking, & Rutting
International Roughness Index (IRI), Cracking, & Rutting 45%
Total Technical Score 45%
District (45%)
Performance Target Measure / Criterion Metric / Formula Weighting
N/A District Engineer Evaluation
Weighted score based on District Engineer Project Rank 45%
Total District Score 45%
Policy (10%)
Performance Target Measure / Criterion Metric / Formula Weighting
TTTR on Interstate = 1.23 (2021) Freight Percentage (T-Factor)
T-Factor > 25% (3 pts) T-Factor = 10% - 25% (2 pts) T-Factor < 10% (1 pt)
3%
N/A Functional Classification
Interstate (3 pts), Non-Interstate NHS (2.5 pts), Major Arterial (2.0 pts), Minor Arterial (1.5 pts), Major Collector (1.0 pts), Minor Collector (0.5 pts)
3%
N/A External Funding Contribution % of external (non-federal) contribution 4%
Total Policy Score 10% Total P2P Score 100%
May 2020 Planning to Programing Guidebook 36
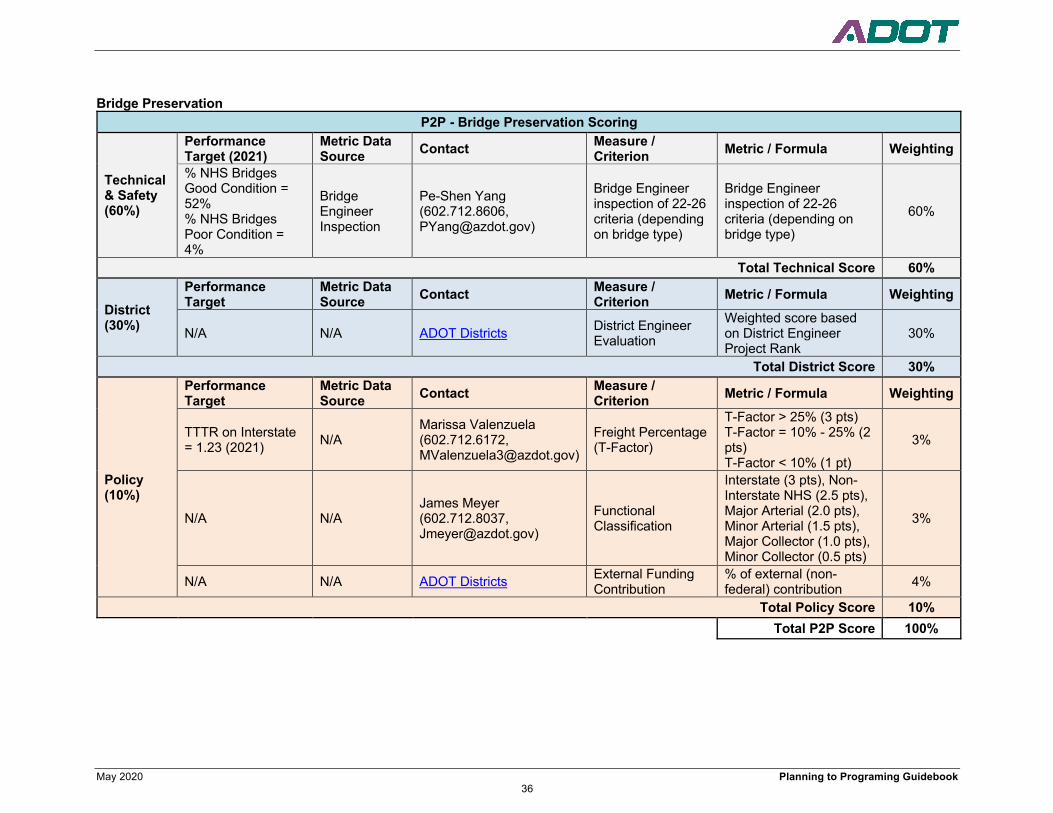
Bridge Preservation P2P - Bridge Preservation Scoring
Technical & Safety (60%)
Performance Target (2021)
Metric Data Source Contact Measure /
Criterion Metric / Formula Weighting
% NHS Bridges Good Condition = 52% % NHS Bridges Poor Condition = 4%
Bridge Engineer Inspection
Pe-Shen Yang (602.712.8606, [email protected])
Bridge Engineer inspection of 22-26 criteria (depending on bridge type)
Bridge Engineer inspection of 22-26 criteria (depending on bridge type)
60%
Total Technical Score 60%
District (30%)
Performance Target
Metric Data Source Contact Measure /
Criterion Metric / Formula Weighting
N/A N/A ADOT Districts
District Engineer Evaluation
Weighted score based on District Engineer Project Rank
30%
Total District Score 30%
Policy (10%)
Performance Target
Metric Data Source Contact Measure /
Criterion Metric / Formula Weighting
TTTR on Interstate = 1.23 (2021) N/A
Marissa Valenzuela (602.712.6172, [email protected])
Freight Percentage (T-Factor)
T-Factor > 25% (3 pts) T-Factor = 10% - 25% (2 pts) T-Factor < 10% (1 pt)
3%
N/A N/A James Meyer (602.712.8037, [email protected])
Functional Classification
Interstate (3 pts), Non-Interstate NHS (2.5 pts), Major Arterial (2.0 pts), Minor Arterial (1.5 pts), Major Collector (1.0 pts), Minor Collector (0.5 pts)
3%
N/A N/A ADOT Districts
External Funding Contribution
% of external (non-federal) contribution 4%
Total Policy Score 10% Total P2P Score 100%

May 2020 Planning to Programing Guidebook 37
Modernization P2P - Modernization Scoring
Technical (35%)
Performance Target Metric Data Source
Contact Measure / Criterion Metric / Formula Weighting
Varies Varies See P2P Contact List within P2P Guidebook
Technical Group Project Ranking (Statewide)
Weighted score based on Technical Project Rank 35%
Total Technical Score 35%
District (30%)
Performance Target Metric Data Source
Contact Measure / Criterion Metric / Formula Weighting
N/A N/A ADOT Districts
District Engineer Evaluation
Weighted score based on District Engineer Project Rank
30%
Total District Score 30%
Safety (25%)
Performance Target (2019)
Metric Data Source
Contact Measure / Criterion Metric / Formula Weighting
Fatalities = 5% increase Fatality Rate = 2% increase Serious Injuries = 1% decrease Serious Injury Rate = 4% decrease Non-Motorized = 3% increase
Safety Analyst Tool
Saroja Devarakonda (602.712.8283, [email protected])
Level of Safety Service (LOSS)
Average weighted LOSS Score (I - IV) 25%
Total Safety Score 25%

May 2020 Planning to Programing Guidebook 38
P2P - Modernization Scoring
Policy (10%)
Performance Target Metric Data Source
Contact Measure / Criterion Metric / Formula Weighting
TTTR on Interstate = 1.23 (2021) N/A
Marissa Valenzuela (602.712.6172, [email protected])
Freight Percentage (T-Factor)
T-Factor > 25% (3 pts) T-Factor = 10% - 25% (2 pts) T-Factor < 10% (1 pt)
3%
N/A N/A James Meyer (602.712.8037, [email protected])
Functional Classification
Interstate (3 pts), Non-Interstate NHS (2.5 pts), Major Arterial (2.0 pts), Minor Arterial (1.5 pts), Major Collector (1.0 pts), Minor Collector (0.5 pts)
3%
N/A N/A ADOT Districts
External Funding Contribution
% of external (non-federal) contribution 4%
Total Policy Score 10% Total P2P Score 100%

May 2020 Planning to Programing Guidebook 39
Expansion P2P - Expansion Scoring
Technical (50%)
Performance Target
Metric Data Source Contact Measure /
Criterion Metric / Formula Weighting
N/A
Arizona Travel Demand Model (AZTDM)
Baloka Belezamo (602.712.7961, [email protected])
Level of Service (LOS) Volume / Capacity 10%
Peak Hour Excessive Delay per Capita = 10.9 hrs (2021)
AZTDM Baloka Belezamo (602.712.7961, [email protected])
Average System Speed
Vehicle Miles Traveled (VMT) / Vehicle Hours Traveled (VHT)
5%
TTR on Interstate = 85.8% (2021) TTR Non-Interstate NHS = 74.9% (2021)
INRIX Tracy Clark (602.712.8137, [email protected])
System Reliability Travel Time Reliability (TTR) Ratio 10%
TTTR on Interstate = 1.23 (2021)
INRIX Tracy Clark (602.712.8137, [email protected])
System Reliability (freight)
Truck Travel Time Reliability (TTTR) Ratio 10%
N/A Calculation Keith Killough (602.712.6407, [email protected])
Cost Effectiveness
(Annualized Life-Cycle Capital Cost + Annual Operating/Maintenance Cost - Annualized External Contributions) / (Annual Travel Time Savings)
10%
N/A AZTDM & REMI TranSight
Tracy Clark (602.712.8137, [email protected])
New Permanent Jobs Created
Output of AZTDM & REMI TranSight 5%
Total Technical Score 50%
District (25%)
Performance Target
Metric Data Source Contact Measure /
Criterion Metric / Formula Weighting
N/A N/A ADOT Districts
District Engineer Evaluation
Weighted score based on District Engineer Project Rank
25%
Total District Score 25%

May 2020 Planning to Programing Guidebook 40
P2P - Expansion Scoring
Safety (15%)
Performance Target (2019)
Metric Data Source Contact Measure /
Criterion Metric / Formula Weighting
Fatalities = 5% increase Fatality Rate = 2% increase Serious Injuries = 1% decrease Serious Injury Rate = 4% decrease Non-Motorized = 3% increase
Safety Analyst Tool
Saroja Devarakonda (602.712.8283, [email protected])
Level of Safety Service (LOSS)
Average weighted LOSS Score (I - IV) 7.5%
Traffic Safety Engineer
Saroja Devarakonda (602.712.8283, [email protected])
Safety Benefit
Traffic Safety Engineer evaluation of project type safety benefit and conflict reduction
7.5%
Total Safety Score 15%
Policy (10%)
Performance Target
Metric Data Source Contact Measure /
Criterion Metric / Formula Weighting
TTTR on Interstate = 1.23 (2021)
ADOT MPD AADT Annual Report
Marissa Valenzuela (602.712.6172, [email protected])
Freight Percentage (T-Factor)
T-Factor > 25% (3 pts) T-Factor = 10% - 25% (2 pts) T-Factor < 10% (1 pt)
3%
N/A ADOT MPD Functional Classification Maps
James Meyer (602.712.8037, [email protected])
Functional Classification
Interstate (3 pts), Non-Interstate NHS (2.5 pts), Major Arterial (2.0 pts), Minor Arterial (1.5 pts), Major Collector (1.0 pts), Minor Collector (0.5 pts)
3%
N/A N/A ADOT Districts
External Funding Contribution
% of external (non-federal) contribution 4%
Total Policy Score 10% Total P2P Score 100%