Adolescent Outlook and Outcomes FY 2010 Maryland Alcohol and Drug Abuse Administration (ADAA) Thomas...
31
Adolescent Outlook and Outcomes FY 2010 Maryland Alcohol and Drug Abuse Administration (ADAA) Thomas P. Cargiulo, Pharm. D., Director
-
Upload
phebe-perkins -
Category
Documents
-
view
213 -
download
0
Transcript of Adolescent Outlook and Outcomes FY 2010 Maryland Alcohol and Drug Abuse Administration (ADAA) Thomas...
Adolescent Outlook and Outcomes
FY 2010Maryland Alcohol and
Drug Abuse Administration (ADAA)
Thomas P. Cargiulo, Pharm. D., Director
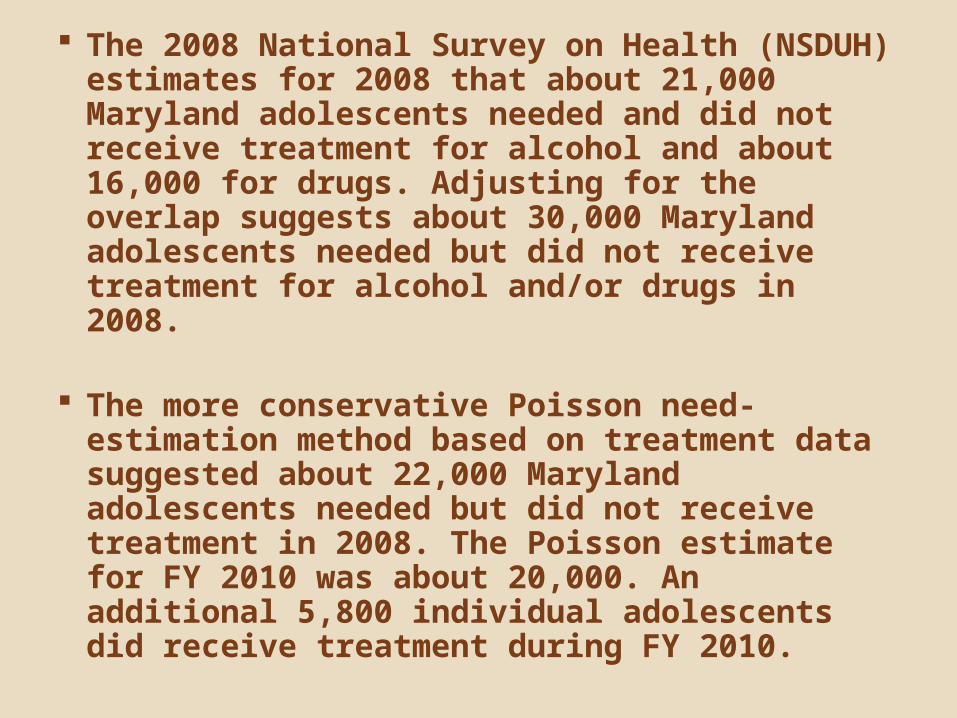
The 2008 National Survey on Health (NSDUH) estimates for 2008 that about 21,000 Maryland adolescents needed and did not receive treatment for alcohol and about 16,000 for drugs. Adjusting for the overlap suggests about 30,000 Maryland adolescents needed but did not receive treatment for alcohol and/or drugs in 2008.
The more conservative Poisson need-estimation method based on treatment data suggested about 22,000 Maryland adolescents needed but did not receive treatment in 2008. The Poisson estimate for FY 2010 was about 20,000. An additional 5,800 individual adolescents did receive treatment during FY 2010.

Total adolescent admissions have been relatively stable for the past three fiscal years, although those reported as primary patients increased 9 percent during that period.
About two-thirds of adolescents admitted during FY 2010 were 16 or 17 years of age. Less than 4 percent were under 14.
Only 18 percent of adolescent admissions involved females, whereas about one-third of adult admissions were females.

Adolescent Admissions to State-Funded Alcohol and Drug Abuse Treatment ProgramsFY 2008 - FY 2010
33163514 3616
431305 176
FY 2008 FY 2009 FY 20100
1000
2000
3000
4000
Primary Patients
Non-Primary Patients
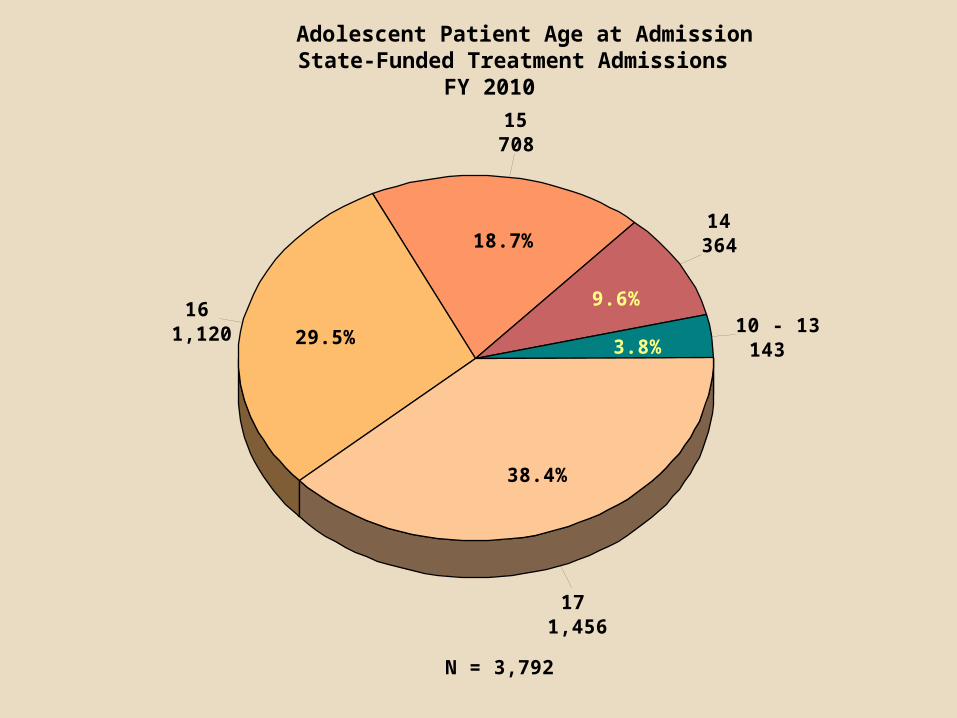
Adolescent Patient Age at AdmissionState-Funded Treatment Admissions
FY 2010
10 - 13143
14364
15708
161,120
171,456
3.8%
9.6%
18.7%
29.5%
38.4%
N = 3,792
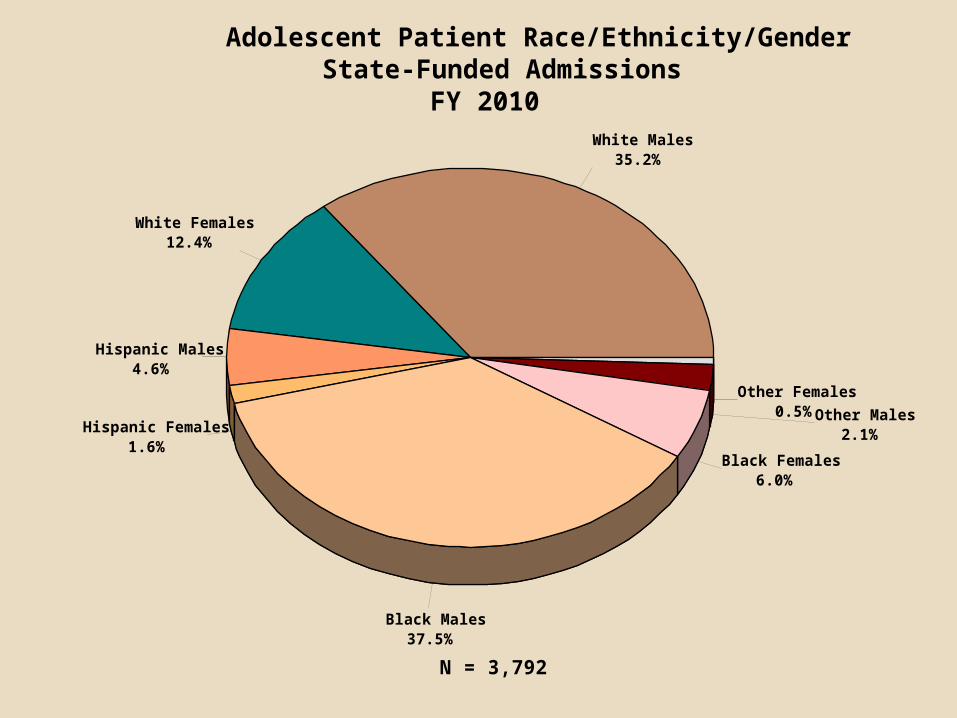
Adolescent Patient Race/Ethnicity/GenderState-Funded Admissions
FY 2010White Males
35.2%
White Females12.4%
Hispanic Males4.6%
Hispanic Females1.6%
Black Males37.5%
Black Females6.0%
Other Males2.1%
Other Females 0.5%
N = 3,792
About 94 percent of adolescents admitted were involved in school, a job and/or skills training.
It is estimated about 9 percent of adolescents admitted were high-school drop-outs.
About half of adolescents admitted reported Medicaid eligibility; nearly a third had private insurance (not necessarily supporting the current treatment).
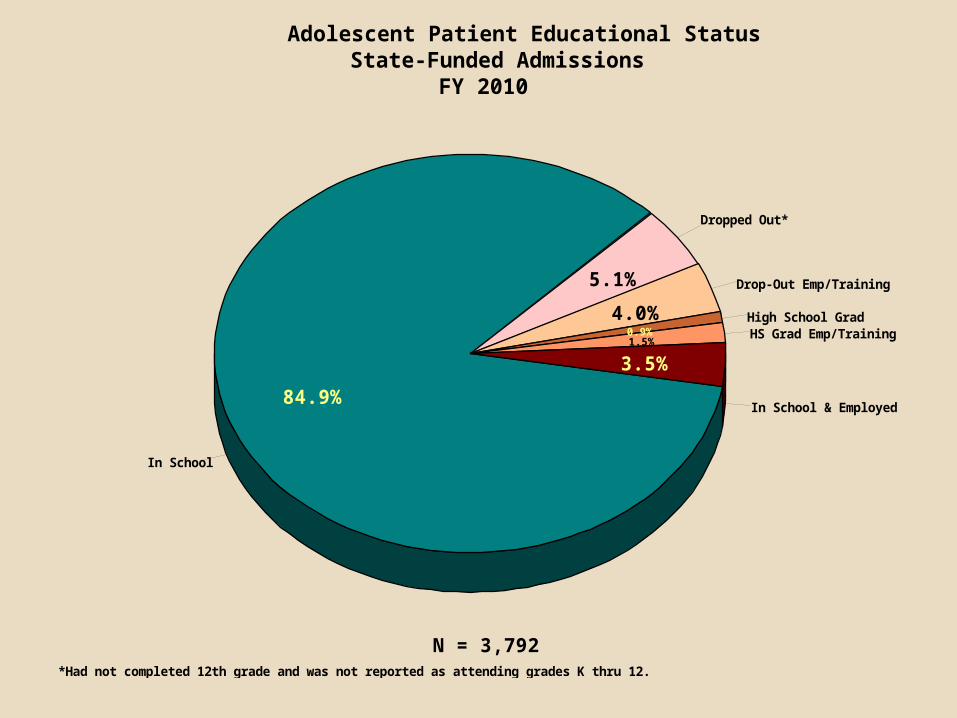
Adolescent Patient Educational StatusState-Funded Admissions
FY 2010
In School
In School & Employed
HS Grad Emp/TrainingHigh School Grad
Drop-Out Emp/Training
Dropped Out*
84.9%
3.5%1.5%0.9%
4.0%
5.1%
N = 3,792*Had not completed 12th grade and was not reported as attending grades K thru 12.
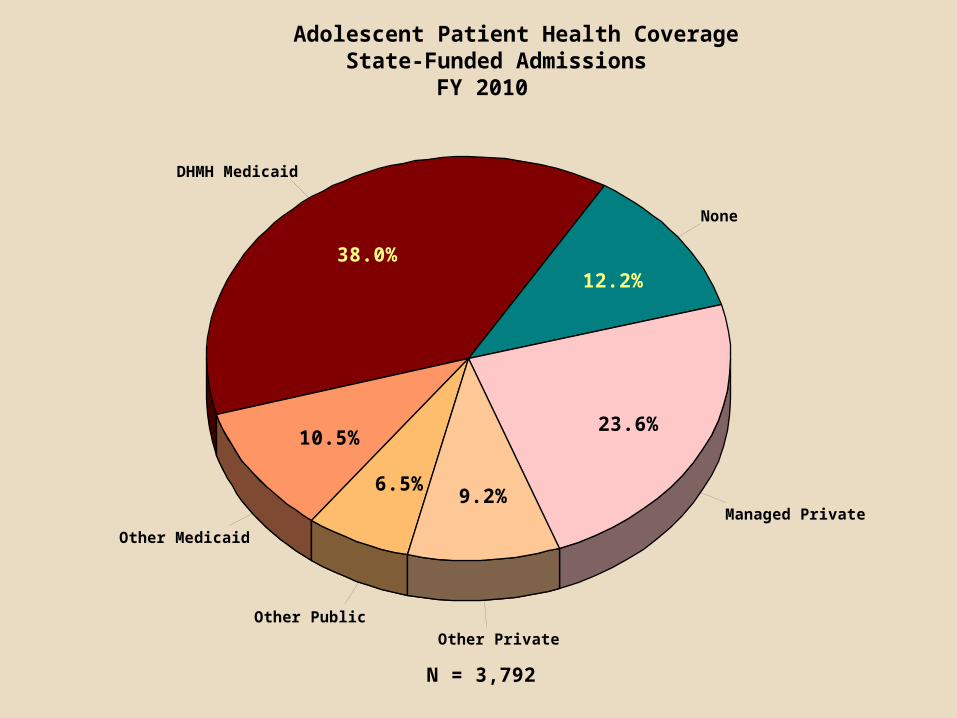
Adolescent Patient Health CoverageState-Funded Admissions
FY 2010
None
DHMH Medicaid
Other Medicaid
Other Public
Other Private
Managed Private
12.2%38.0%
10.5%
6.5%9.2%
23.6%
N = 3,792
From FY 2008 to FY 2010 admissions of adolescents residing in Allegany, Anne Arundel, Cecil, Harford, St. Mary’s, Somerset, Talbot, Washington and Worcester counties declined sharply.
Substantial increases occurred among residents of Baltimore, Howard and Wicomico counties; otherwise adolescent admissions were fairly stable.
Whereas 30 percent of adults admitted resided in Baltimore City, only 20 percent of adolescents did.

2008 2009 2010
Allegany 164 83 65
Anne Arundel 159 126 106
Baltimore City 560 696 770
Baltimore County 362 378 513
Calvert 118 102 97
Caroline 61 122 90
Carroll 137 155 138
Cecil 76 74 54
Charles 103 111 123
Dorchester 91 83 87
Frederick 217 242 228
Garrett 53 61 44
Harford 204 168 139
Howard 90 109 121
Kent 52 53 51
Montgomery 214 174 195
Prince George's 290 277 310
Queen Anne's 82 84 70
St. Mary's 151 131 85
Somerset 99 88 41
Talbot 106 86 62
Washington 140 140 106
Wicomico 88 179 185
Worcester 83 53 66
Out-of-State 47 44 46
Total 3747 3819 3792
Reported Residence
Residence of Adolescents Admitted to State-Funded Alcohol and Drug Abuse Treatment
FY 2008 to FY 2010Fiscal Year of Admission
Over 56 percent of FY 2010 adolescent admissions originated in the juvenile and criminal-justice system; the adult percentage coming from the criminal-justice system was 41.
Seventeen percent of adolescent admissions were referred by schools and student-assistance programs.
Over 90 percent of adolescent admissions at the start of episodes were to outpatient levels of care compared with about 66 percent for adults. Nearly three-fourths of adolescents entered Level I initially.

Adolescent Patient Source of ReferralState-Funded Admissions
FY 2010
Juvenile Justice
Other Criminal Justice
Self/Parent/Guardian
Other AOD Provider
School/SAP
Other Community
48.5%
7.9%
12.6%
7.6%16.9%
6.6%
N = 3,792
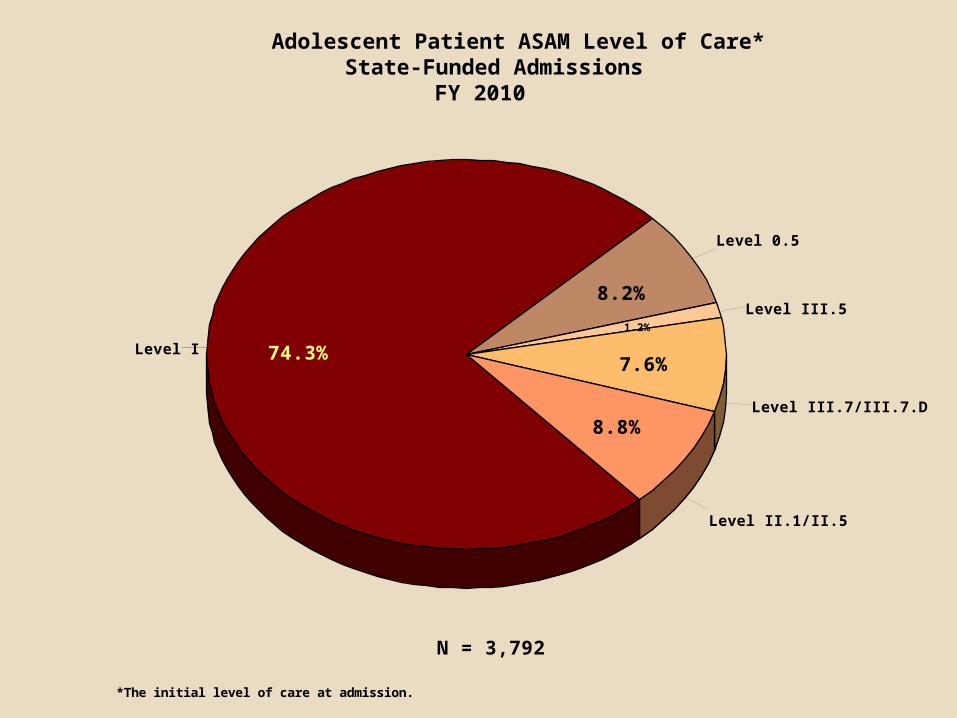
Adolescent Patient ASAM Level of Care*State-Funded Admissions
FY 2010
Level 0.5
Level I
Level II.1/II.5
Level III.7/III.7.D
Level III.58.2%
74.3%
8.8%
7.6%
1.2%
N = 3,792
*The initial level of care at admission.

Adolescents were less likely than adults to be reported as having mental-health problems – 35 percent of adolescents and 41 percent of adults were in that category. In FY 2009 only 29 percent of adolescents had reported mental-health problems.
Adolescents were also less likely than adults to be tobacco users, 45 versus 72 percent, having decreased from 52 percent the previous year.
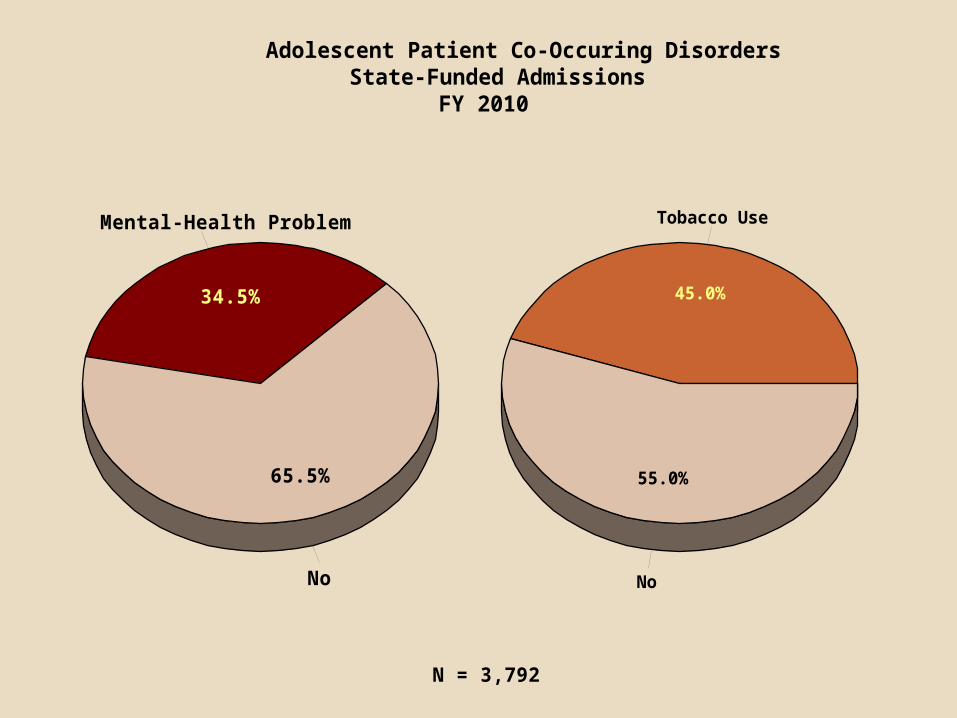
Adolescent Patient Co-Occuring DisordersState-Funded Admissions
FY 2010
Mental-Health Problem
No
34.5%
65.5%
Tobacco Use
No
45.0%
55.0%
N = 3,792

Nine in every ten adolescent admissions involved marijuana; 45 percent involved alcohol.
Admissions rarely had alcohol as the only reported substance problem (4.4 percent), but 44 percent had marijuana as the lone-problem substance.
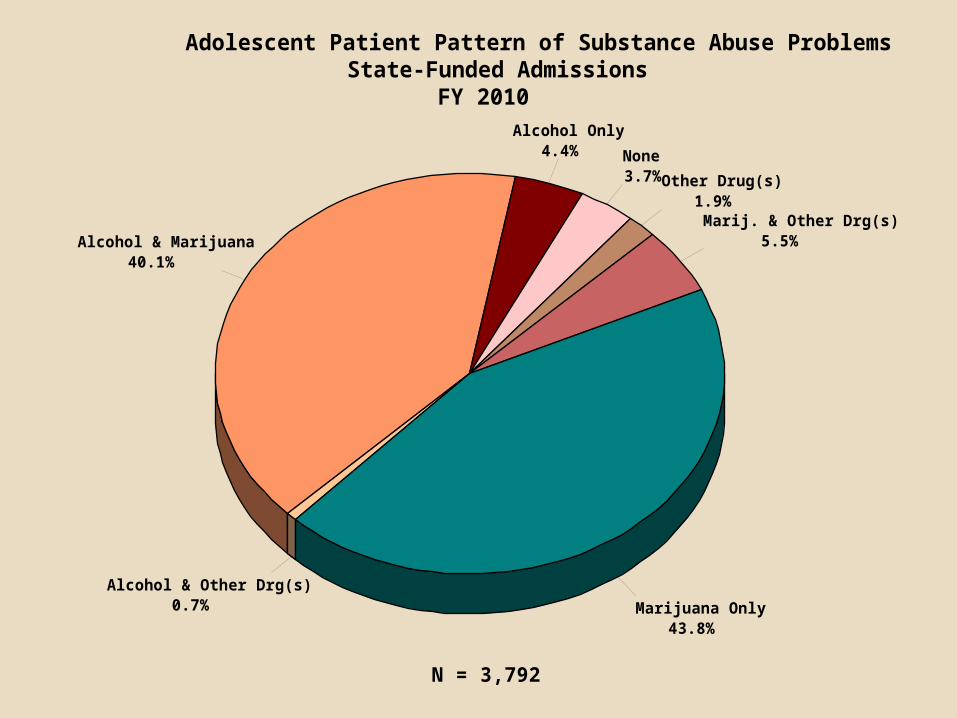
Adolescent Patient Pattern of Substance Abuse ProblemsState-Funded Admissions
FY 2010
None3.7%
Alcohol Only4.4%
Alcohol & Marijuana40.1%
Alcohol & Other Drg(s)0.7% Marijuana Only
43.8%
Marij. & Other Drg(s)5.5%
Other Drug(s)1.9%
N = 3,792

Over the past several years the fastest growing substance problems among adolescent admissions were the same as among adults – prescription opiates and other pharmaceuticals.
From FY 2008 to 2010 Oxycodone-related admissions increased 77 percent, other opiate painkillers 35 percent, and benzodiazepines 92 percent.
Marijuana-related admissions increased 10 percent; admissions involving both marijuana and alcohol fell by 5 percent while those not involving alcohol increased 27 percent.
Cocaine-related admissions decreased nearly 80 percent, heroin fell by 22 percent and alcohol by nearly a third.

Reported Substance Problems* among Adolescent Admissions to State-Funded Treatment ProgramsFY 2008 to FY 2010
FY 2008 FY 2009 FY 20100
500
1000
1500
2000
Alcohol & Marijuana
Other Marijuana
Other Alcohol
Cocaine
Prescription Opiates
*Up to three substance problems are reported for each admission.
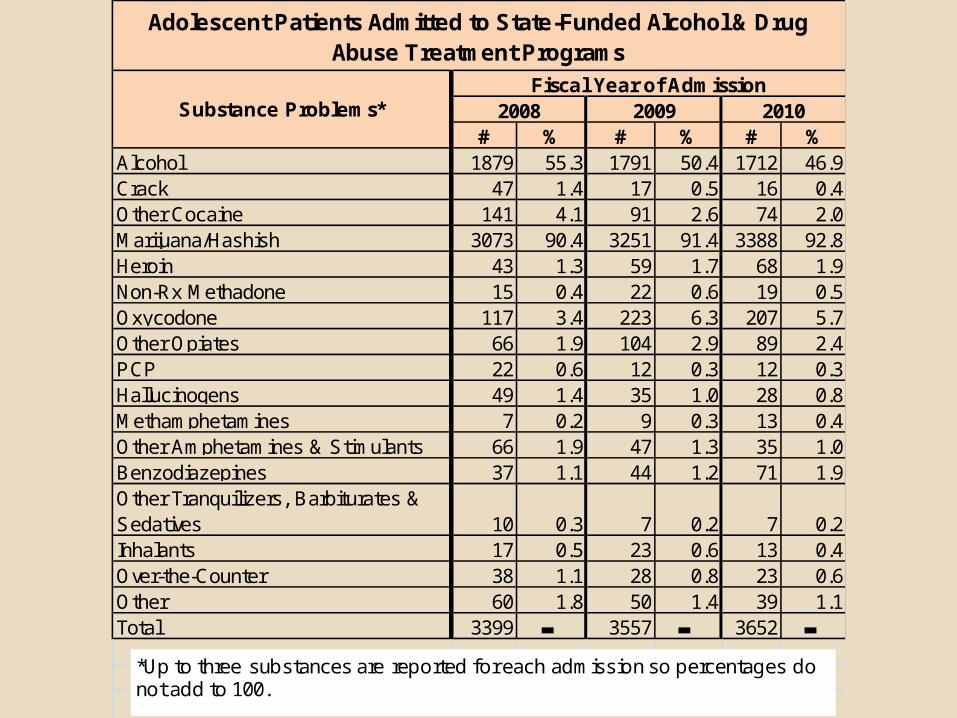
# % # % # %Alcohol 1879 55.3 1791 50.4 1712 46.9Crack 47 1.4 17 0.5 16 0.4Other Cocaine 141 4.1 91 2.6 74 2.0Marijuana/Hashish 3073 90.4 3251 91.4 3388 92.8Heroin 43 1.3 59 1.7 68 1.9Non-Rx Methadone 15 0.4 22 0.6 19 0.5Oxycodone 117 3.4 223 6.3 207 5.7Other Opiates 66 1.9 104 2.9 89 2.4PCP 22 0.6 12 0.3 12 0.3Hallucinogens 49 1.4 35 1.0 28 0.8Methamphetamines 7 0.2 9 0.3 13 0.4Other Amphetamines & Stimulants 66 1.9 47 1.3 35 1.0Benzodiazepines 37 1.1 44 1.2 71 1.9Other Tranquilizers, Barbiturates & Sedatives 10 0.3 7 0.2 7 0.2Inhalants 17 0.5 23 0.6 13 0.4Over-the-Counter 38 1.1 28 0.8 23 0.6Other 60 1.8 50 1.4 39 1.1Total 3399 ▬ 3557 ▬ 3652 ▬
2010Fiscal Year of Admission
Adolescent Patients Admitted to State-Funded Alcohol & Drug Abuse Treatment Programs
Substance Problems* 2008 2009
*Up to three substances are reported for each admission so percentages do not add to 100.
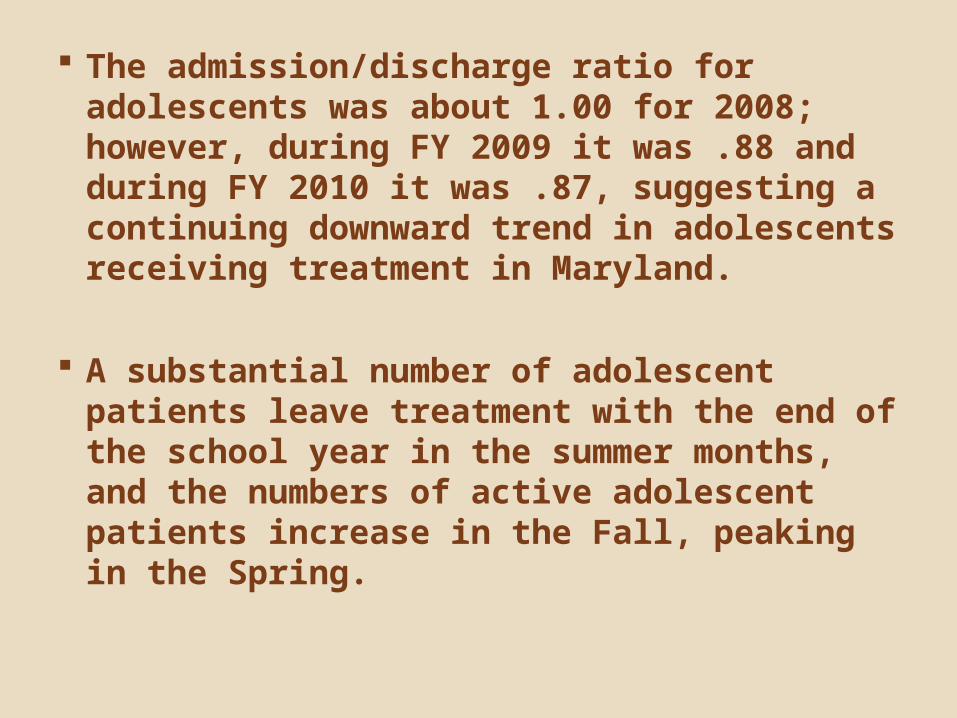
The admission/discharge ratio for adolescents was about 1.00 for 2008; however, during FY 2009 it was .88 and during FY 2010 it was .87, suggesting a continuing downward trend in adolescents receiving treatment in Maryland.
A substantial number of adolescent patients leave treatment with the end of the school year in the summer months, and the numbers of active adolescent patients increase in the Fall, peaking in the Spring.

Adolescent Patients Active in State-Funded Treatment on the Last Day of the MonthFY 2008 - FY 2010
JulAug
SepOct
NovDec
JanFeb
Mar
AprM
ayJun
JulAug
SepOct
NovDec
JanFeb
Mar
AprM
ayJun
JulAug
SepOct
NovDec
JanFeb
Mar
AprM
ayJun
0
200
400
600
800
1000
1200
1400
1600
FY 2008 FY 2009 FY 2010
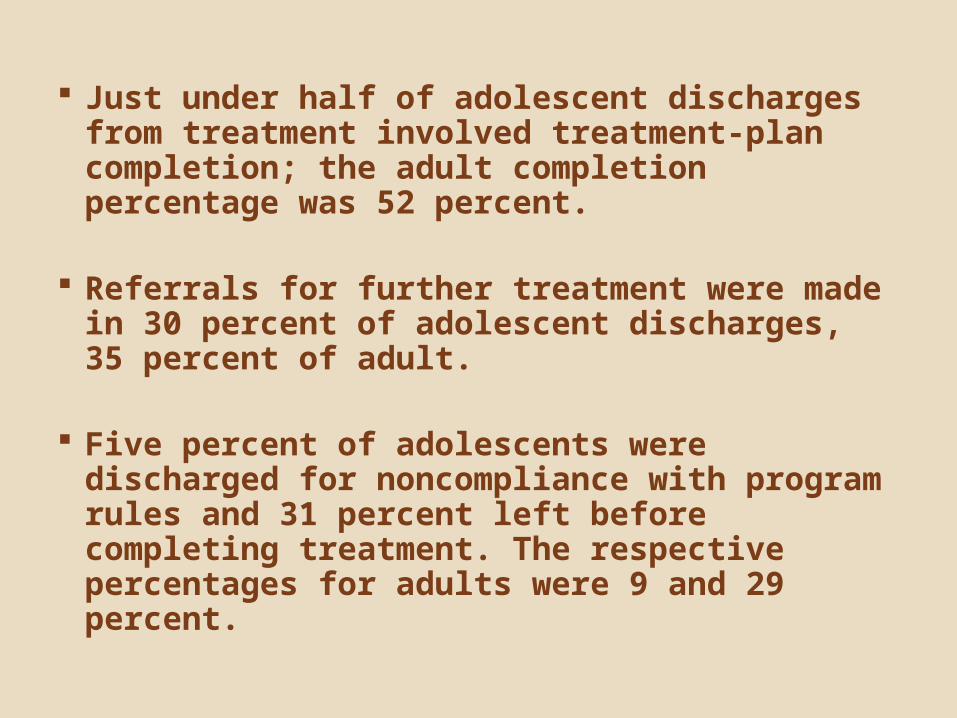
Just under half of adolescent discharges from treatment involved treatment-plan completion; the adult completion percentage was 52 percent.
Referrals for further treatment were made in 30 percent of adolescent discharges, 35 percent of adult.
Five percent of adolescents were discharged for noncompliance with program rules and 31 percent left before completing treatment. The respective percentages for adults were 9 and 29 percent.
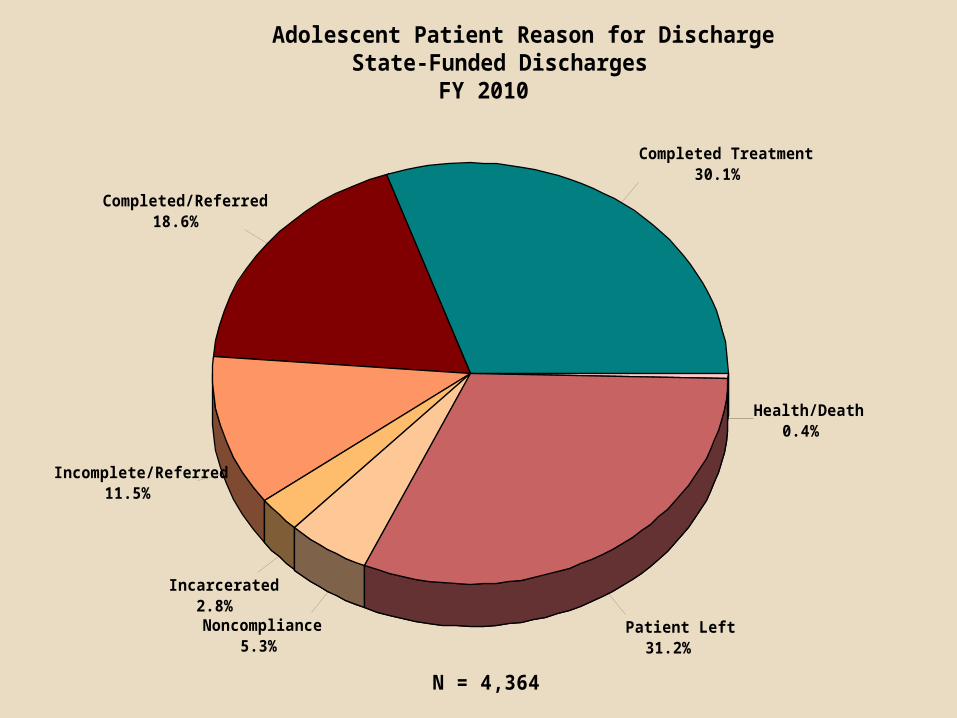
Adolescent Patient Reason for DischargeState-Funded Discharges
FY 2010
Completed Treatment30.1%
Completed/Referred18.6%
Incomplete/Referred11.5%
Incarcerated2.8%Noncompliance
5.3%Patient Left
31.2%
Health/Death0.4%
N = 4,364
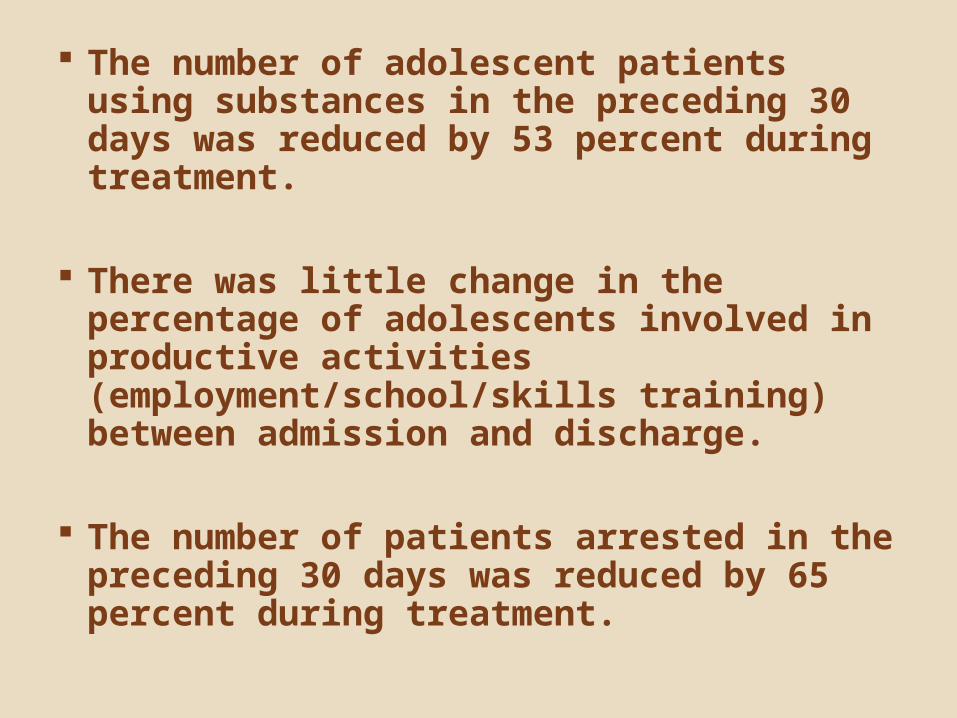
The number of adolescent patients using substances in the preceding 30 days was reduced by 53 percent during treatment.
There was little change in the percentage of adolescents involved in productive activities (employment/school/skills training) between admission and discharge.
The number of patients arrested in the preceding 30 days was reduced by 65 percent during treatment.

Adolescent Patient Outcomes of State-Funded TreatmentPercentages Using Substances, Employed or In School and Arrested in the 30 Days
Preceding Admission and DischargeFY 2010
77.5
5.1
92.9
10.4
36.6
7.1
91.0
3.6
Using Substances Employed Employed/In School Arrested0.0
20.0
40.0
60.0
80.0
100.0
Admission
Discharge
N = 4364
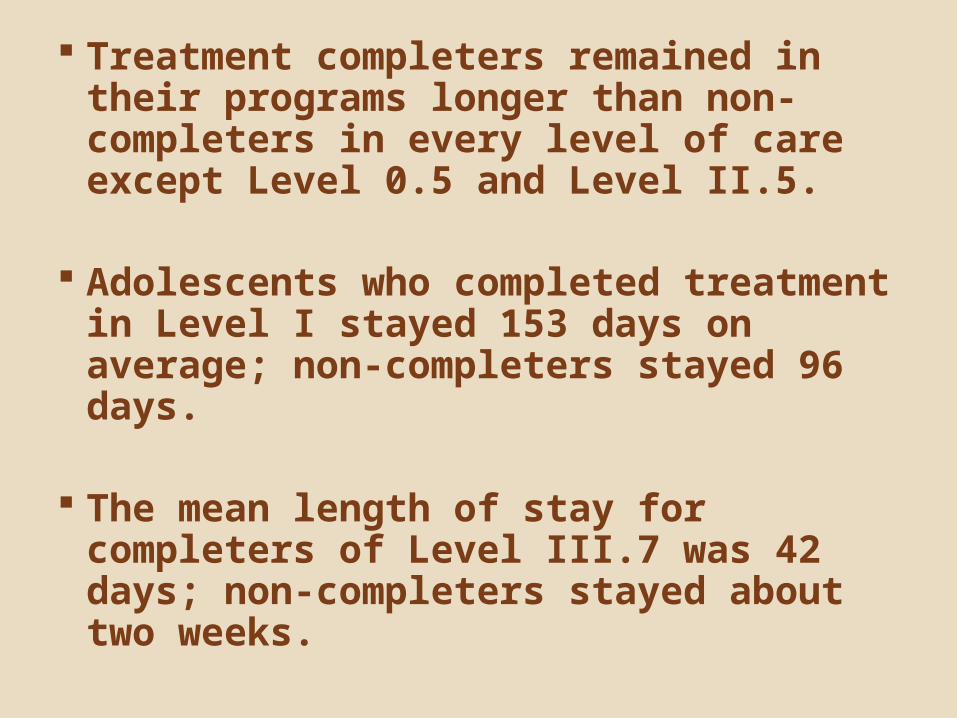
Treatment completers remained in their programs longer than non-completers in every level of care except Level 0.5 and Level II.5.
Adolescents who completed treatment in Level I stayed 153 days on average; non-completers stayed 96 days.
The mean length of stay for completers of Level III.7 was 42 days; non-completers stayed about two weeks.

Adolescent Patient Dis-Enrollments from State-Funded Alcohol & Drug Abuse Treatment
Mean Length of Stay (Days)FY 2010
74.02
152.59
98.76
14.34
155.31
41.51
15.63
119.19
96.20
93.86
51.00
76.65
13.89
10.83
84.16
124.74
97.24
18.23
127.21
36.17
14.25
Level 0.5
Level I
Level II.1
Level II.5
Level III.5
Level III.7
Level III.7.D
0.00 20.00 40.00 60.00 80.00 100.00 120.00 140.00 160.00 180.00
Completed/Transferred/Referred
Incomplete
Total
N = 321
N = 2968
N = 314
N = 113
N = 719
N = 125
N = 56

Adolescents were less likely than adults to enter another level of care within 30 days of completion/transfer/referral from Levels III.7, III.7.D and Level II.1.
Twenty-three percent of Level III.7, 44 percent of Level III.7.D and 56 percent of Level II.1 adolescent completion/transfer/referral dis-enrollments, entered other levels of care within 30 days.
Percentages of Unduplicated Patients with FY 2010 Completion/Transfer/Referral Dis-Enrollments from State-Funded Treatment Entering Another Level of Care
within 30 Days
22.5
43.9
56.1
33.0
84.0
69.8
Level III.7 Level III.7.D Level II.10.0
20.0
40.0
60.0
80.0
100.0 Adolescents
Adults
N = 485 N = 5333 N = 82 N = 4111 N = 148 N = 2667