Adobe Systems Incorporated World Headquarters - … · Adobe Systems Incorporated World...
21
Rev B 2012-06-19 Adobe Systems Incorporated World Headquarters Study of Facility Management and Operations Best Practices Research Supporting National Science Foundation Project: Educating Technicians for Building Automation and Sustainability National Science Foundation Advanced Technological Education Program Award #0802595 This material is based upon work supported by the National Science Foundation under Grant No. 0802595. Any opinions, findings, conclusions or recommendations expressed in this material are those of the authors and do not necessarily reflect the views of the National Science Foundation.
Transcript of Adobe Systems Incorporated World Headquarters - … · Adobe Systems Incorporated World...

Rev B 2012-06-19
Adobe Systems Incorporated
World Headquarters Study of Facility Management and Operations Best Practices
Research Supporting
National Science Foundation Project:
Educating Technicians for Building Automation and Sustainability
National Science Foundation
Advanced Technological Education Program
Award #0802595
This material is based upon work supported by the National Science Foundation under Grant No. 0802595. Any opinions, findings, conclusions or recommendations expressed in this material are those of the authors and do not necessarily reflect the views of the National Science Foundation.

Rev B 2012-06-19 2
Prepared by Building Intelligence Group LLC (651) 204-0105
www.buildingintelligencegroup.com
For more information
on this project please
contact:
Peter Crabtree
Dean of Instruction
Peralta Community
College District
(510) 464-3218
Rev B 2012-06-19 3
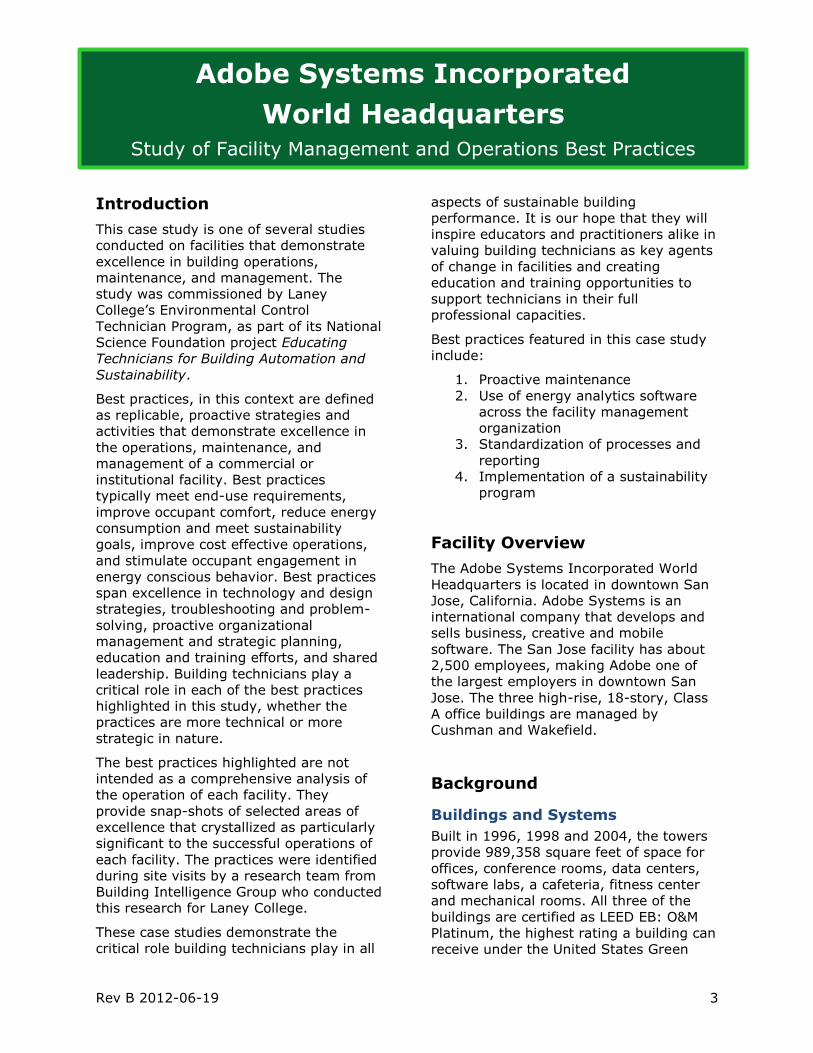
Introduction
This case study is one of several studies
conducted on facilities that demonstrate
excellence in building operations,
maintenance, and management. The
study was commissioned by Laney
College’s Environmental Control
Technician Program, as part of its National
Science Foundation project Educating
Technicians for Building Automation and
Sustainability.
Best practices, in this context are defined
as replicable, proactive strategies and
activities that demonstrate excellence in
the operations, maintenance, and
management of a commercial or
institutional facility. Best practices
typically meet end-use requirements,
improve occupant comfort, reduce energy
consumption and meet sustainability
goals, improve cost effective operations,
and stimulate occupant engagement in
energy conscious behavior. Best practices
span excellence in technology and design
strategies, troubleshooting and problem-
solving, proactive organizational
management and strategic planning,
education and training efforts, and shared
leadership. Building technicians play a
critical role in each of the best practices
highlighted in this study, whether the
practices are more technical or more
strategic in nature.
The best practices highlighted are not
intended as a comprehensive analysis of
the operation of each facility. They
provide snap-shots of selected areas of
excellence that crystallized as particularly
significant to the successful operations of
each facility. The practices were identified
during site visits by a research team from
Building Intelligence Group who conducted
this research for Laney College.
These case studies demonstrate the
critical role building technicians play in all
aspects of sustainable building
performance. It is our hope that they will
inspire educators and practitioners alike in
valuing building technicians as key agents
of change in facilities and creating
education and training opportunities to
support technicians in their full
professional capacities.
Best practices featured in this case study
include:
1. Proactive maintenance
2. Use of energy analytics software
across the facility management
organization
3. Standardization of processes and
reporting
4. Implementation of a sustainability
program
Facility Overview
The Adobe Systems Incorporated World
Headquarters is located in downtown San
Jose, California. Adobe Systems is an
international company that develops and
sells business, creative and mobile
software. The San Jose facility has about
2,500 employees, making Adobe one of
the largest employers in downtown San
Jose. The three high-rise, 18-story, Class
A office buildings are managed by
Cushman and Wakefield.
Background
Buildings and Systems
Built in 1996, 1998 and 2004, the towers
provide 989,358 square feet of space for
offices, conference rooms, data centers,
software labs, a cafeteria, fitness center
and mechanical rooms. All three of the
buildings are certified as LEED EB: O&M
Platinum, the highest rating a building can
receive under the United States Green
Adobe Systems Incorporated
World Headquarters
Study of Facility Management and Operations Best Practices
Rev B 2012-06-19 4
Building Council (USGBC) Leadership in
Energy and Environmental Design,
Existing Buildings Operations and
Maintenance rating system. The three
buildings also have earned ENERGY STAR
labeling each year since 2003.
Facility Staff
Given the recognition received,
sustainability and energy efficiency are
clearly core focus areas of the facility
management and building operations
team. The team works diligently to
maintain the LEED EB: O&M and ENERGY
STAR ratings at the highest levels.
As stated by George Denise, Global
Account Manager at Adobe Systems, the
overall mission of the facility management
and operations team is “to provide a neat,
clean, safe, healthy, productive,
sustainable, and uninterruptable work
environment at the lowest cost possible.”
Denise suggests that these items are
listed in order of importance. The goal is
first to meet the basic needs of the
building occupants and to determine how
to provide these needs at the lowest cost.
Best Practices
Best Practice #1: Proactive
Maintenance
Proactive maintenance is planned work
completed to reduce the number of
reactive and emergency repairs.
Daily Rounds
At Adobe Systems, proactive maintenance
is completed by staff performing both
physical and virtual rounds. Physical
rounds are completed by walking into
each mechanical or electrical space and
determining the current operating
conditions of equipment. Physical rounds
are important to help prevent larger
problems and to maintain occupant
satisfaction. If large problems are not
identified quickly, they can take more
time and money to repair.
All building engineers are required to
understand and be able to maintain HVAC,
plumbing and electrical systems (except
high voltage electrical systems). Virtual
rounds are completed by observing
different operating parameters on the
building automation system (BAS)
workstation. Both types of rounds provide
a different, but complementary, view of
building operating conditions. Daily rounds
for both HVAC and electrical equipment
are completed by one building engineer
each day and daily round duties are
rotated amongst the building engineers.
Completing physical rounds generally
consists of determining the operating
conditions of different equipment listed on
the rounds sheet and looking for abnormal
operating conditions, such as leaks, hot
equipment and observations of unusual
smells or sounds. Data collected during
physical rounds is written on a rounds
sheet and then stored in a binder. The
daily rounds sheets are used when it is
necessary to troubleshoot abnormal
operating conditions and to provide
information for third-party contractors.
Equipment that is inspected during daily
physical rounds at Adobe Systems include,
but is not limited to, chillers, boilers, fire
pumps, the domestic water pressure
station and air handling units. Some
specific inspection tasks include:
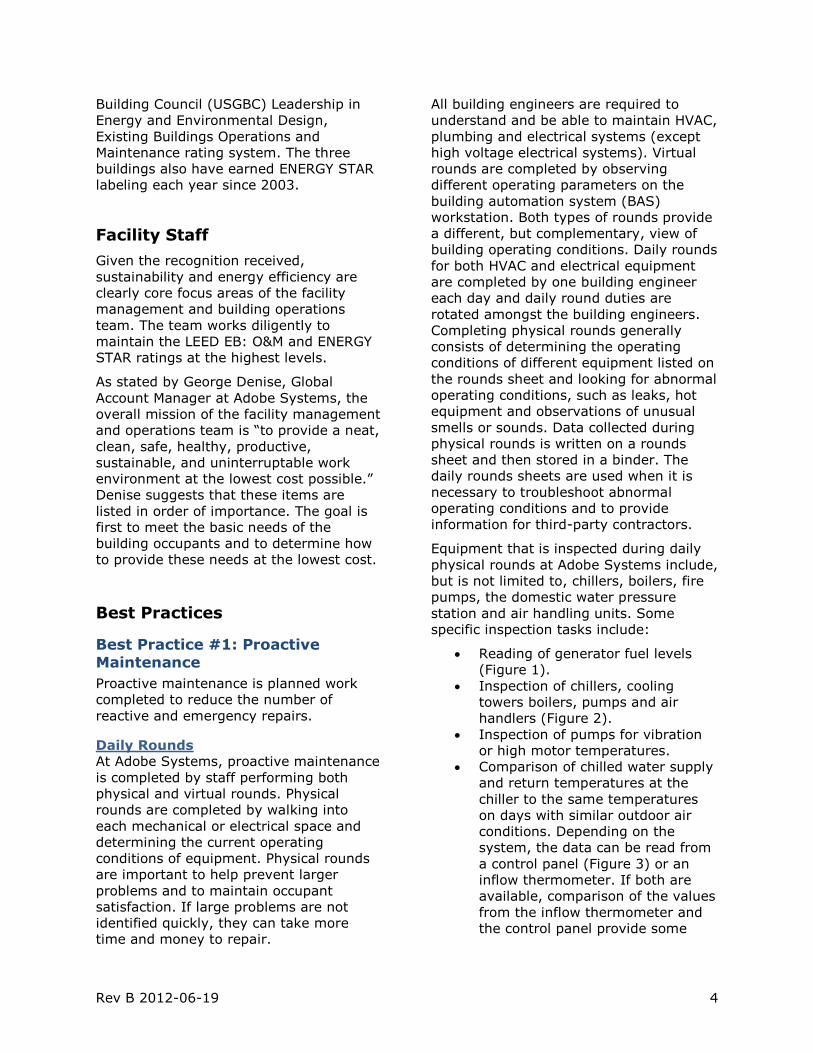
Reading of generator fuel levels
(Figure 1).
Inspection of chillers, cooling
towers boilers, pumps and air
handlers (Figure 2).
Inspection of pumps for vibration
or high motor temperatures.
Comparison of chilled water supply
and return temperatures at the
chiller to the same temperatures
on days with similar outdoor air
conditions. Depending on the
system, the data can be read from
a control panel (Figure 3) or an
inflow thermometer. If both are
available, comparison of the values
from the inflow thermometer and
the control panel provide some
Rev B 2012-06-19 5
insight into calibration of
instrumentation.
Reading of run load amp values of
chillers.
Inspection of air handling unit
filters to determine when
replacement is necessary.
Checking the water level in the
ground water storage tank.
Reading electric and natural gas
meters.
Figure 1: Enclosure with generator fuel
indicators
Figure 2: Utility engineer checking pH levels of cooling tower water
Figure 3: Chiller control panel
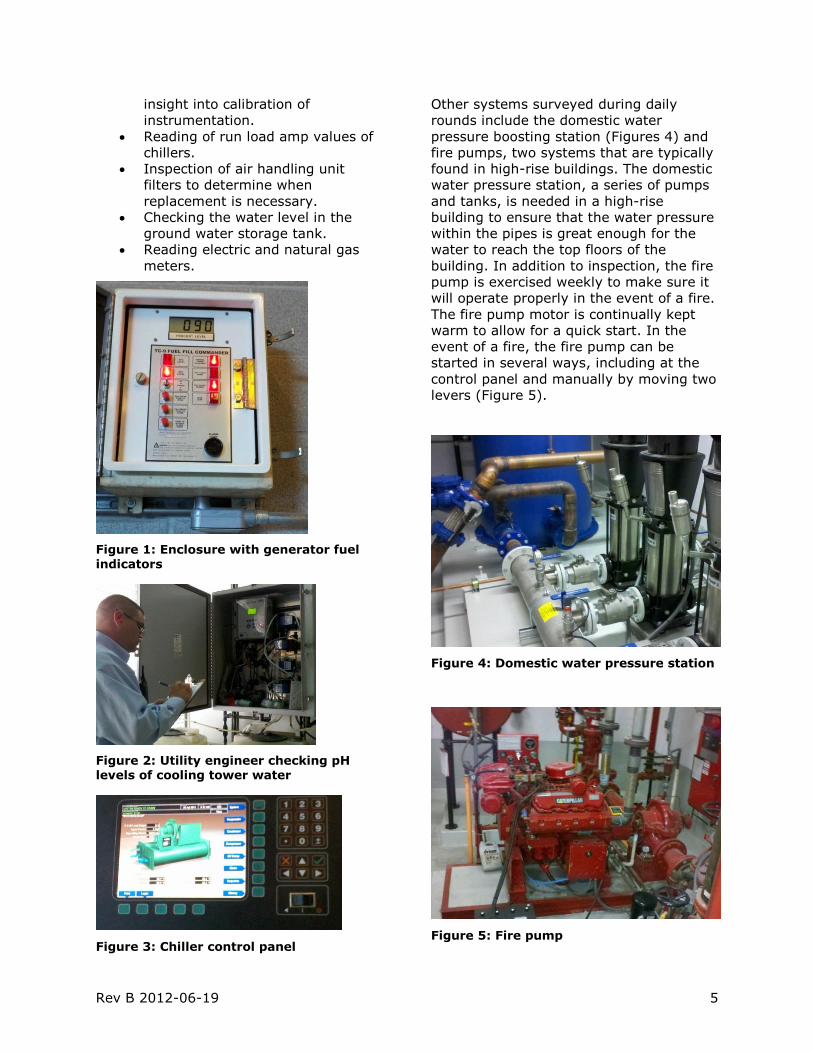
Other systems surveyed during daily
rounds include the domestic water
pressure boosting station (Figures 4) and
fire pumps, two systems that are typically
found in high-rise buildings. The domestic
water pressure station, a series of pumps
and tanks, is needed in a high-rise
building to ensure that the water pressure
within the pipes is great enough for the
water to reach the top floors of the
building. In addition to inspection, the fire
pump is exercised weekly to make sure it
will operate properly in the event of a fire.
The fire pump motor is continually kept
warm to allow for a quick start. In the
event of a fire, the fire pump can be
started in several ways, including at the
control panel and manually by moving two
levers (Figure 5).
Figure 4: Domestic water pressure station
Figure 5: Fire pump
Rev B 2012-06-19 6
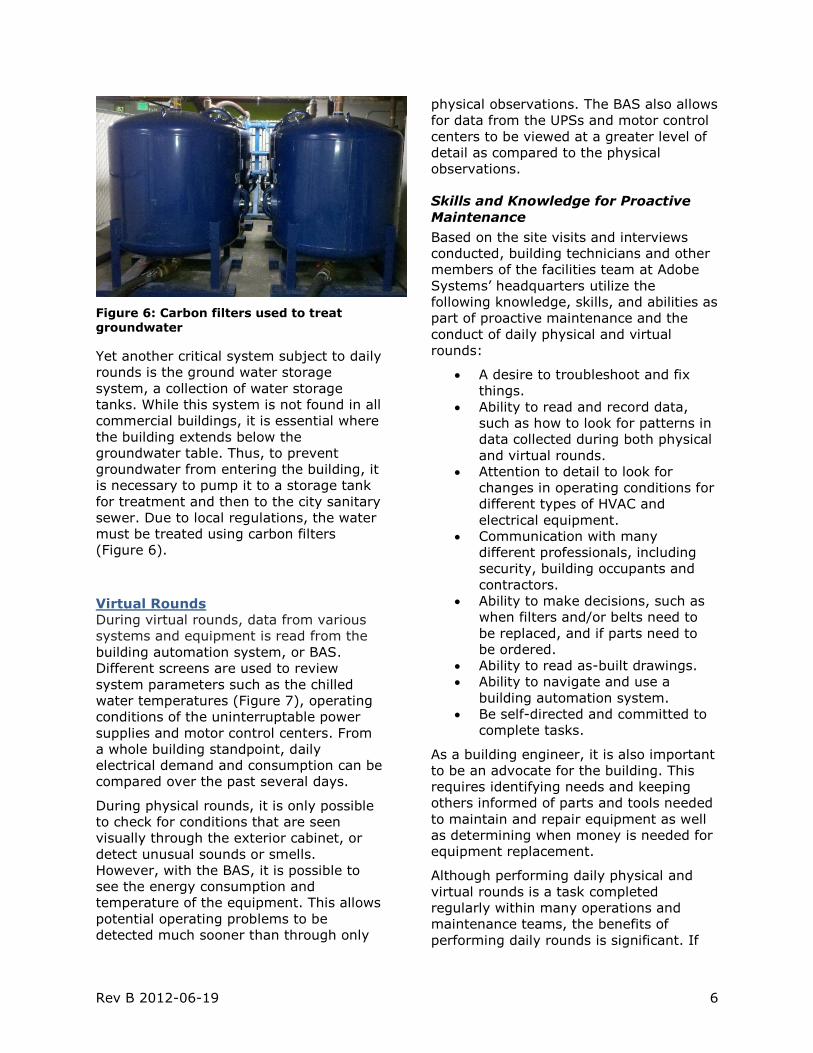
Figure 6: Carbon filters used to treat groundwater
Yet another critical system subject to daily
rounds is the ground water storage
system, a collection of water storage
tanks. While this system is not found in all
commercial buildings, it is essential where
the building extends below the
groundwater table. Thus, to prevent
groundwater from entering the building, it
is necessary to pump it to a storage tank
for treatment and then to the city sanitary
sewer. Due to local regulations, the water
must be treated using carbon filters
(Figure 6).
Virtual Rounds
During virtual rounds, data from various
systems and equipment is read from the
building automation system, or BAS.
Different screens are used to review
system parameters such as the chilled
water temperatures (Figure 7), operating
conditions of the uninterruptable power
supplies and motor control centers. From
a whole building standpoint, daily
electrical demand and consumption can be
compared over the past several days.
During physical rounds, it is only possible
to check for conditions that are seen
visually through the exterior cabinet, or
detect unusual sounds or smells.
However, with the BAS, it is possible to
see the energy consumption and
temperature of the equipment. This allows
potential operating problems to be
detected much sooner than through only
physical observations. The BAS also allows
for data from the UPSs and motor control
centers to be viewed at a greater level of
detail as compared to the physical
observations.
Skills and Knowledge for Proactive
Maintenance
Based on the site visits and interviews
conducted, building technicians and other
members of the facilities team at Adobe
Systems’ headquarters utilize the
following knowledge, skills, and abilities as
part of proactive maintenance and the
conduct of daily physical and virtual
rounds:
A desire to troubleshoot and fix
things.
Ability to read and record data,
such as how to look for patterns in
data collected during both physical
and virtual rounds.
Attention to detail to look for
changes in operating conditions for
different types of HVAC and
electrical equipment.
Communication with many
different professionals, including
security, building occupants and
contractors.
Ability to make decisions, such as
when filters and/or belts need to
be replaced, and if parts need to
be ordered.
Ability to read as-built drawings.
Ability to navigate and use a
building automation system.
Be self-directed and committed to
complete tasks.
As a building engineer, it is also important
to be an advocate for the building. This
requires identifying needs and keeping
others informed of parts and tools needed
to maintain and repair equipment as well
as determining when money is needed for
equipment replacement.
Although performing daily physical and
virtual rounds is a task completed
regularly within many operations and
maintenance teams, the benefits of
performing daily rounds is significant. If
Rev B 2012-06-19 7
daily rounds were not performed,
abnormal equipment operating conditions
may occur and go unnoticed. Over time,
such conditions could lead to
uncomfortable space conditions for
building occupants, poor reliability of
critical equipment, or catastrophic failures.
Best Practice #2: Use of Energy
Analytics Software across the Facility Organization
A common challenge in building
operations and facility management today
is the availability of data. As the potential
to integrate different systems increases,
the amount of data available also
increases. However, data is only valuable
if it can be turned into information that
can be used for taking action or making
decisions.
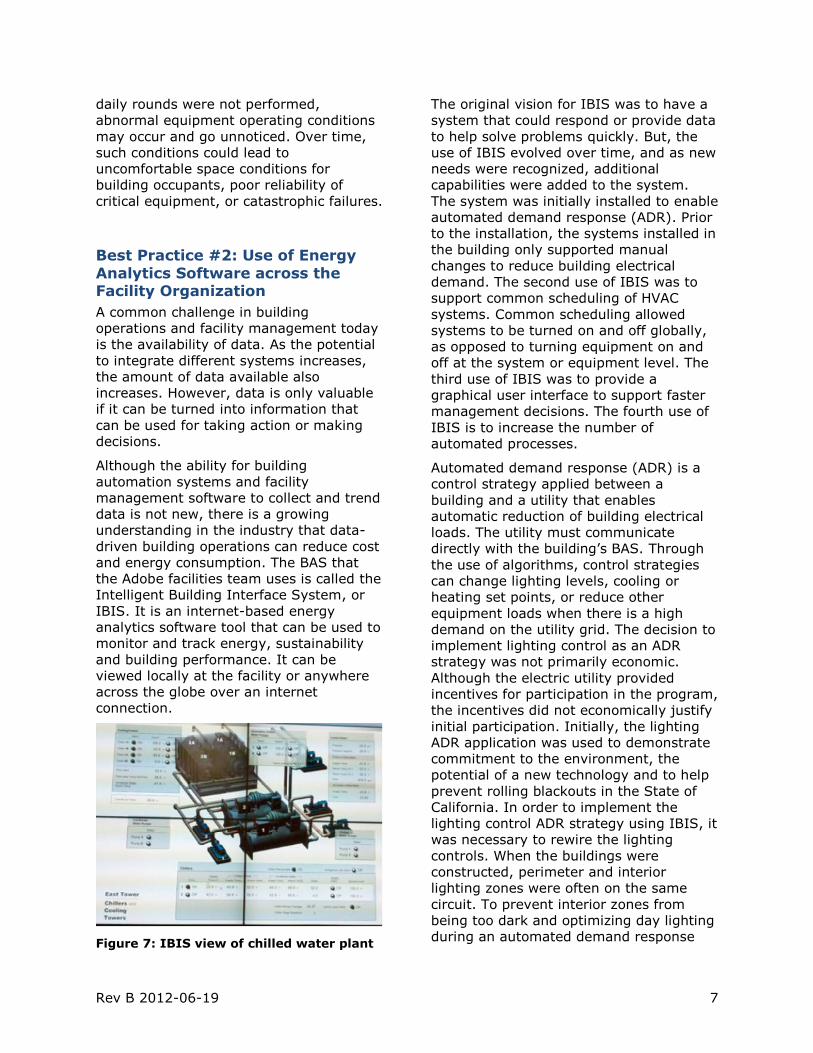
Although the ability for building
automation systems and facility
management software to collect and trend
data is not new, there is a growing
understanding in the industry that data-
driven building operations can reduce cost
and energy consumption. The BAS that
the Adobe facilities team uses is called the
Intelligent Building Interface System, or
IBIS. It is an internet-based energy
analytics software tool that can be used to
monitor and track energy, sustainability
and building performance. It can be
viewed locally at the facility or anywhere
across the globe over an internet
connection.
Figure 7: IBIS view of chilled water plant
The original vision for IBIS was to have a
system that could respond or provide data
to help solve problems quickly. But, the
use of IBIS evolved over time, and as new
needs were recognized, additional
capabilities were added to the system.
The system was initially installed to enable
automated demand response (ADR). Prior
to the installation, the systems installed in
the building only supported manual
changes to reduce building electrical
demand. The second use of IBIS was to
support common scheduling of HVAC
systems. Common scheduling allowed
systems to be turned on and off globally,
as opposed to turning equipment on and
off at the system or equipment level. The
third use of IBIS was to provide a
graphical user interface to support faster
management decisions. The fourth use of
IBIS is to increase the number of
automated processes.
Automated demand response (ADR) is a
control strategy applied between a
building and a utility that enables
automatic reduction of building electrical
loads. The utility must communicate
directly with the building’s BAS. Through
the use of algorithms, control strategies
can change lighting levels, cooling or
heating set points, or reduce other
equipment loads when there is a high
demand on the utility grid. The decision to
implement lighting control as an ADR
strategy was not primarily economic.
Although the electric utility provided
incentives for participation in the program,
the incentives did not economically justify
initial participation. Initially, the lighting
ADR application was used to demonstrate
commitment to the environment, the
potential of a new technology and to help
prevent rolling blackouts in the State of
California. In order to implement the
lighting control ADR strategy using IBIS, it
was necessary to rewire the lighting
controls. When the buildings were
constructed, perimeter and interior
lighting zones were often on the same
circuit. To prevent interior zones from
being too dark and optimizing day lighting
during an automated demand response
Rev B 2012-06-19 8
event, the building was rewired to have
perimeter and interior zones on separate
circuits. After the implementation, the
$98,000 capital cost to complete the
lighting retrofit resulted in a 30 month
payback, equivalent to a 38 percent
return on investment.
An intuitive graphical user interface was a
key design element of IBIS, allowing large
amounts of data to be viewed through a
common, easy-to-use interface. The
graphical interface is generally “view
only”, which means that set points and
other operating parameters cannot be
changed through IBIS, but only through
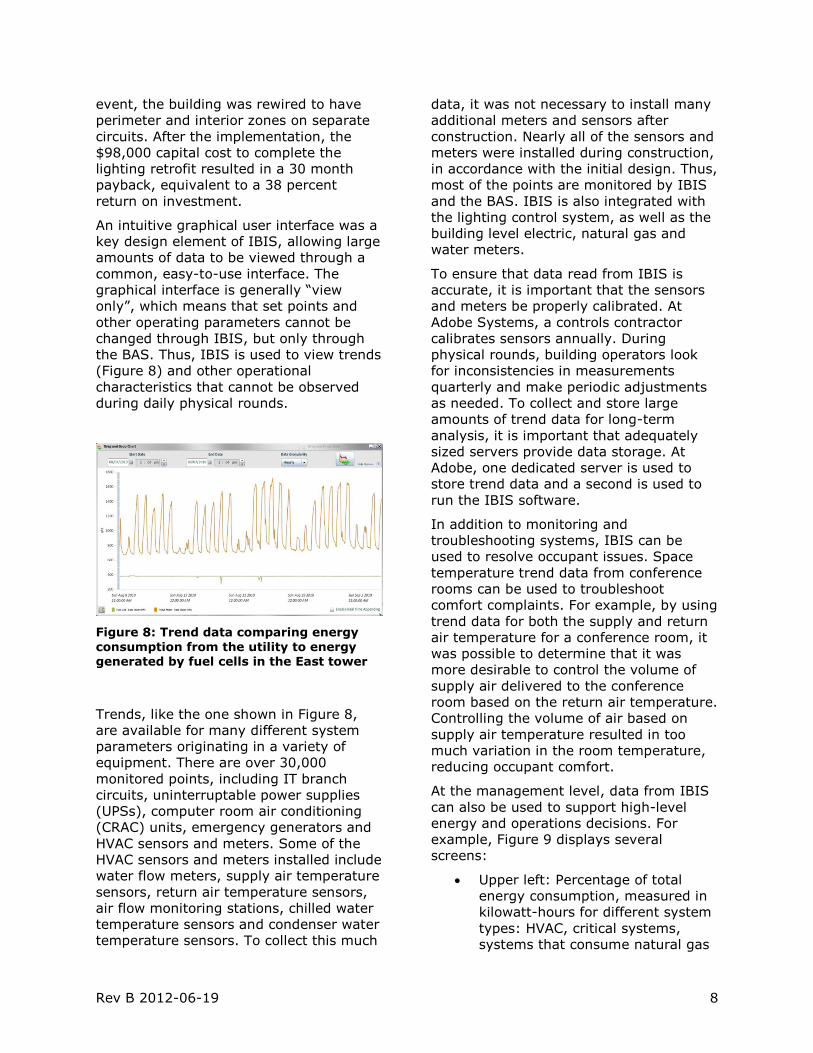
the BAS. Thus, IBIS is used to view trends
(Figure 8) and other operational
characteristics that cannot be observed
during daily physical rounds.
Figure 8: Trend data comparing energy
consumption from the utility to energy generated by fuel cells in the East tower
Trends, like the one shown in Figure 8,
are available for many different system
parameters originating in a variety of
equipment. There are over 30,000
monitored points, including IT branch
circuits, uninterruptable power supplies
(UPSs), computer room air conditioning
(CRAC) units, emergency generators and
HVAC sensors and meters. Some of the
HVAC sensors and meters installed include
water flow meters, supply air temperature
sensors, return air temperature sensors,
air flow monitoring stations, chilled water
temperature sensors and condenser water
temperature sensors. To collect this much
data, it was not necessary to install many
additional meters and sensors after
construction. Nearly all of the sensors and
meters were installed during construction,
in accordance with the initial design. Thus,
most of the points are monitored by IBIS
and the BAS. IBIS is also integrated with
the lighting control system, as well as the
building level electric, natural gas and
water meters.
To ensure that data read from IBIS is
accurate, it is important that the sensors
and meters be properly calibrated. At
Adobe Systems, a controls contractor
calibrates sensors annually. During
physical rounds, building operators look
for inconsistencies in measurements
quarterly and make periodic adjustments
as needed. To collect and store large
amounts of trend data for long-term
analysis, it is important that adequately
sized servers provide data storage. At
Adobe, one dedicated server is used to
store trend data and a second is used to
run the IBIS software.
In addition to monitoring and
troubleshooting systems, IBIS can be
used to resolve occupant issues. Space
temperature trend data from conference
rooms can be used to troubleshoot
comfort complaints. For example, by using
trend data for both the supply and return
air temperature for a conference room, it
was possible to determine that it was
more desirable to control the volume of
supply air delivered to the conference
room based on the return air temperature.
Controlling the volume of air based on
supply air temperature resulted in too
much variation in the room temperature,
reducing occupant comfort.
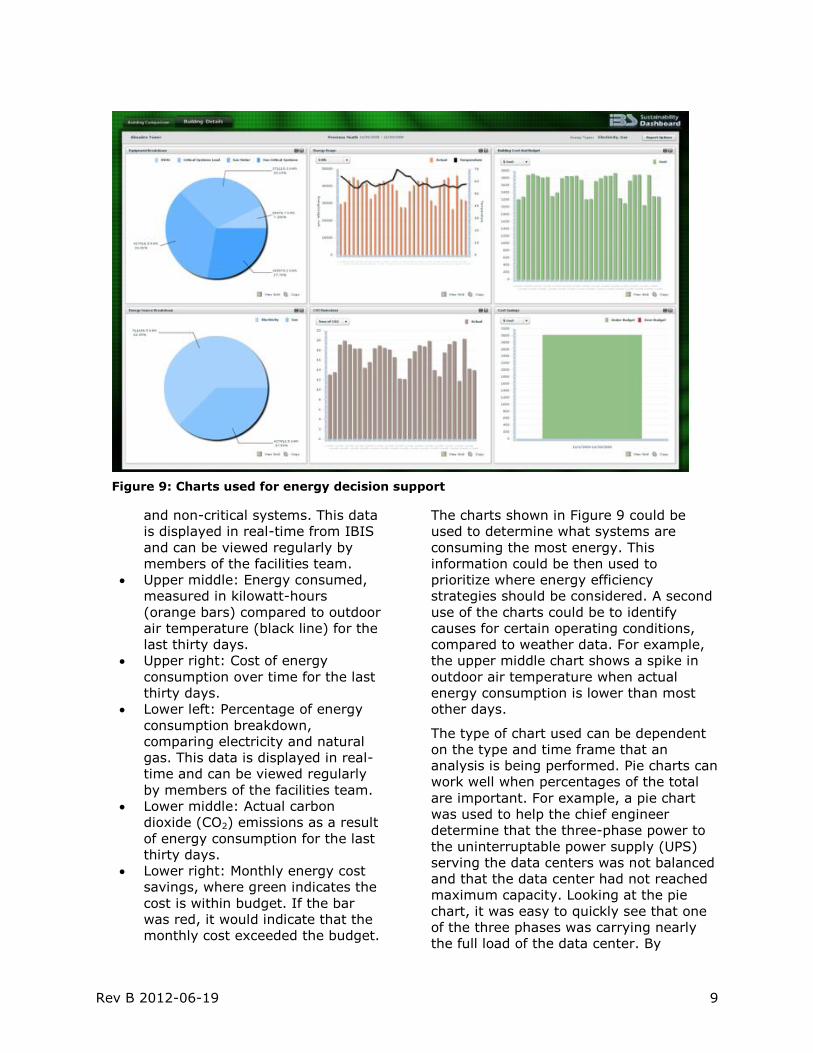
At the management level, data from IBIS
can also be used to support high-level
energy and operations decisions. For
example, Figure 9 displays several
screens:
Upper left: Percentage of total
energy consumption, measured in
kilowatt-hours for different system
types: HVAC, critical systems,
systems that consume natural gas
Rev B 2012-06-19 9
and non-critical systems. This data
is displayed in real-time from IBIS
and can be viewed regularly by
members of the facilities team.
Upper middle: Energy consumed,
measured in kilowatt-hours
(orange bars) compared to outdoor
air temperature (black line) for the
last thirty days.
Upper right: Cost of energy
consumption over time for the last
thirty days.
Lower left: Percentage of energy
consumption breakdown,
comparing electricity and natural
gas. This data is displayed in real-
time and can be viewed regularly
by members of the facilities team.
Lower middle: Actual carbon
dioxide (CO2) emissions as a result
of energy consumption for the last
thirty days.
Lower right: Monthly energy cost
savings, where green indicates the
cost is within budget. If the bar
was red, it would indicate that the
monthly cost exceeded the budget.
The charts shown in Figure 9 could be
used to determine what systems are
consuming the most energy. This
information could be then used to
prioritize where energy efficiency
strategies should be considered. A second
use of the charts could be to identify
causes for certain operating conditions,
compared to weather data. For example,
the upper middle chart shows a spike in
outdoor air temperature when actual
energy consumption is lower than most
other days.
The type of chart used can be dependent
on the type and time frame that an
analysis is being performed. Pie charts can
work well when percentages of the total
are important. For example, a pie chart
was used to help the chief engineer
determine that the three-phase power to
the uninterruptable power supply (UPS)
serving the data centers was not balanced
and that the data center had not reached
maximum capacity. Looking at the pie
chart, it was easy to quickly see that one
of the three phases was carrying nearly
the full load of the data center. By
Figure 9: Charts used for energy decision support
Rev B 2012-06-19 10
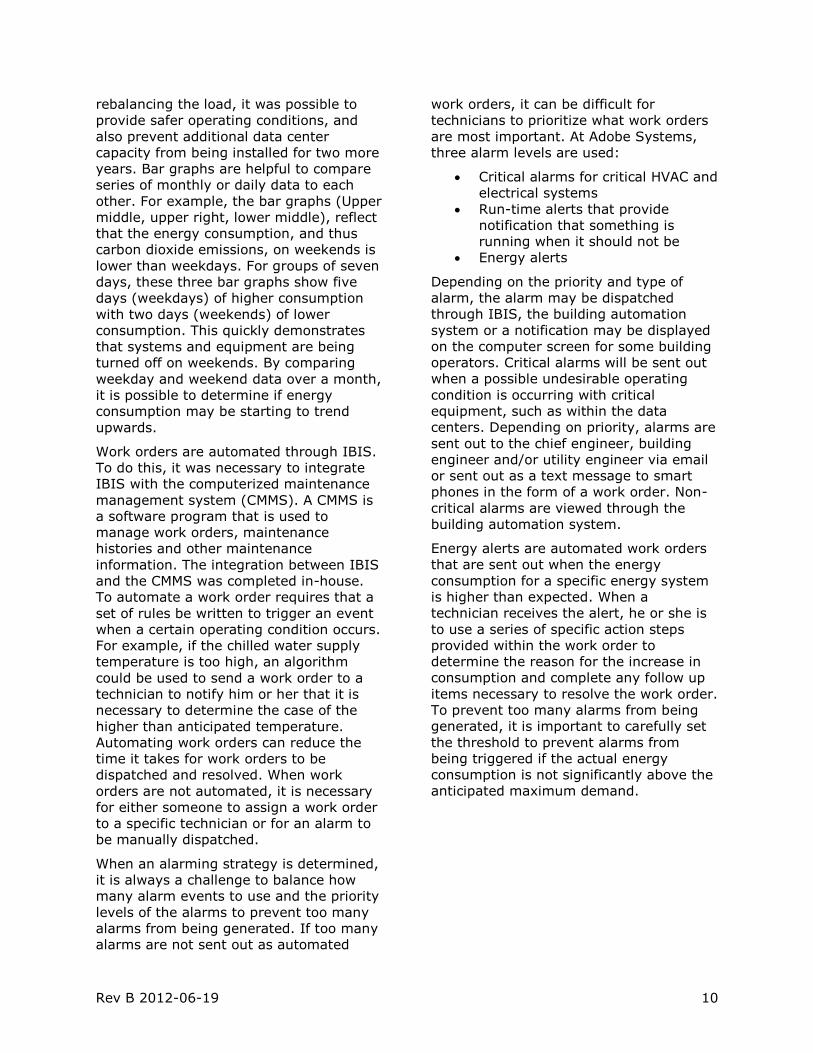
rebalancing the load, it was possible to
provide safer operating conditions, and
also prevent additional data center
capacity from being installed for two more
years. Bar graphs are helpful to compare
series of monthly or daily data to each
other. For example, the bar graphs (Upper
middle, upper right, lower middle), reflect
that the energy consumption, and thus
carbon dioxide emissions, on weekends is
lower than weekdays. For groups of seven
days, these three bar graphs show five
days (weekdays) of higher consumption
with two days (weekends) of lower
consumption. This quickly demonstrates
that systems and equipment are being
turned off on weekends. By comparing
weekday and weekend data over a month,
it is possible to determine if energy
consumption may be starting to trend
upwards.
Work orders are automated through IBIS.
To do this, it was necessary to integrate
IBIS with the computerized maintenance
management system (CMMS). A CMMS is
a software program that is used to
manage work orders, maintenance
histories and other maintenance
information. The integration between IBIS
and the CMMS was completed in-house.
To automate a work order requires that a
set of rules be written to trigger an event
when a certain operating condition occurs.
For example, if the chilled water supply
temperature is too high, an algorithm
could be used to send a work order to a
technician to notify him or her that it is
necessary to determine the case of the
higher than anticipated temperature.
Automating work orders can reduce the
time it takes for work orders to be
dispatched and resolved. When work
orders are not automated, it is necessary
for either someone to assign a work order
to a specific technician or for an alarm to
be manually dispatched.
When an alarming strategy is determined,
it is always a challenge to balance how
many alarm events to use and the priority
levels of the alarms to prevent too many
alarms from being generated. If too many
alarms are not sent out as automated
work orders, it can be difficult for
technicians to prioritize what work orders
are most important. At Adobe Systems,
three alarm levels are used:
Critical alarms for critical HVAC and
electrical systems
Run-time alerts that provide
notification that something is
running when it should not be
Energy alerts
Depending on the priority and type of
alarm, the alarm may be dispatched
through IBIS, the building automation
system or a notification may be displayed
on the computer screen for some building
operators. Critical alarms will be sent out
when a possible undesirable operating
condition is occurring with critical
equipment, such as within the data
centers. Depending on priority, alarms are
sent out to the chief engineer, building
engineer and/or utility engineer via email
or sent out as a text message to smart
phones in the form of a work order. Non-
critical alarms are viewed through the
building automation system.
Energy alerts are automated work orders
that are sent out when the energy
consumption for a specific energy system
is higher than expected. When a
technician receives the alert, he or she is
to use a series of specific action steps
provided within the work order to
determine the reason for the increase in
consumption and complete any follow up
items necessary to resolve the work order.
To prevent too many alarms from being
generated, it is important to carefully set
the threshold to prevent alarms from
being triggered if the actual energy
consumption is not significantly above the
anticipated maximum demand.
Rev B 2012-06-19 11
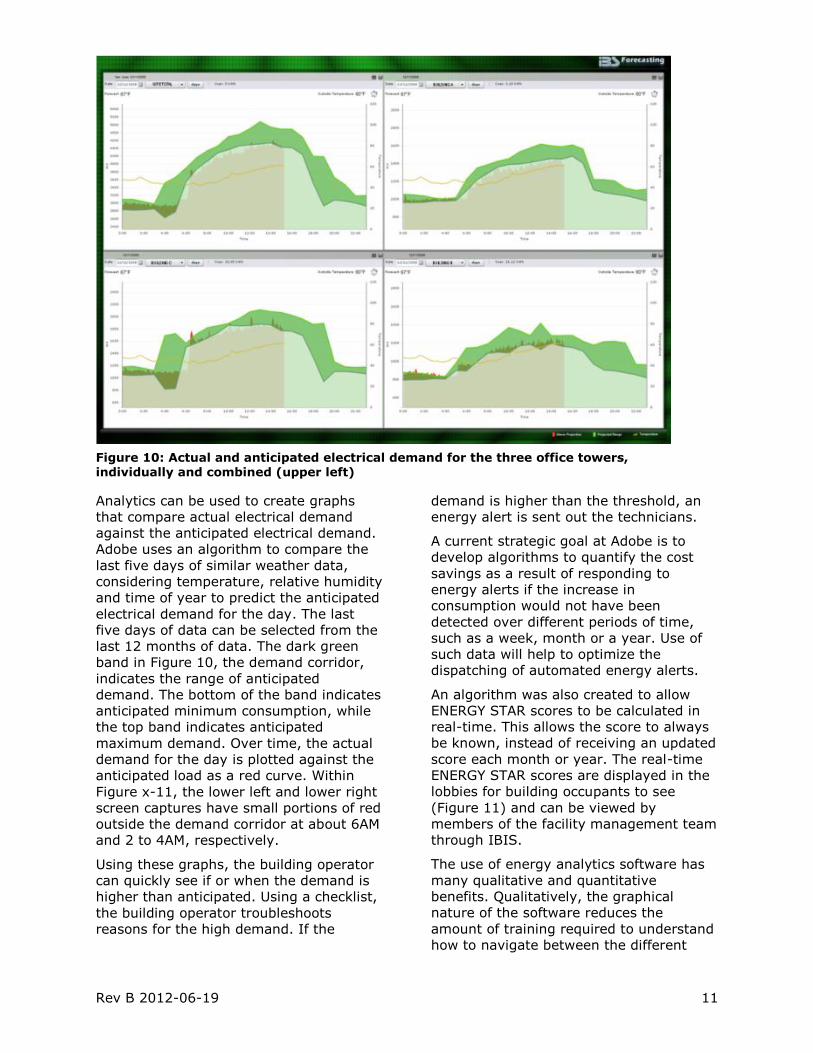
Analytics can be used to create graphs
that compare actual electrical demand
against the anticipated electrical demand.
Adobe uses an algorithm to compare the
last five days of similar weather data,
considering temperature, relative humidity
and time of year to predict the anticipated
electrical demand for the day. The last
five days of data can be selected from the
last 12 months of data. The dark green
band in Figure 10, the demand corridor,
indicates the range of anticipated
demand. The bottom of the band indicates
anticipated minimum consumption, while
the top band indicates anticipated
maximum demand. Over time, the actual
demand for the day is plotted against the
anticipated load as a red curve. Within
Figure x-11, the lower left and lower right
screen captures have small portions of red
outside the demand corridor at about 6AM
and 2 to 4AM, respectively.
Using these graphs, the building operator
can quickly see if or when the demand is
higher than anticipated. Using a checklist,
the building operator troubleshoots
reasons for the high demand. If the
demand is higher than the threshold, an
energy alert is sent out the technicians.
A current strategic goal at Adobe is to
develop algorithms to quantify the cost
savings as a result of responding to
energy alerts if the increase in
consumption would not have been
detected over different periods of time,
such as a week, month or a year. Use of
such data will help to optimize the
dispatching of automated energy alerts.
An algorithm was also created to allow
ENERGY STAR scores to be calculated in
real-time. This allows the score to always
be known, instead of receiving an updated
score each month or year. The real-time
ENERGY STAR scores are displayed in the
lobbies for building occupants to see
(Figure 11) and can be viewed by
members of the facility management team
through IBIS.
The use of energy analytics software has
many qualitative and quantitative
benefits. Qualitatively, the graphical
nature of the software reduces the
amount of training required to understand
how to navigate between the different
Figure 10: Actual and anticipated electrical demand for the three office towers, individually and combined (upper left)
Rev B 2012-06-19 12
screens. Technicians can use a mouse to
click on different screens to quickly view
how different equipment is operating. It is
anticipated that the use of IBIS reduces
labor costs, increases technician
productivity, provides access to
information not previously available and
improves availability of reports. One
example of the quantitative benefits of the
data from IBIS is the use of digital water
meter data to identify a leak in the
irrigation system. By having the meters
installed and connected to IBIS, the
building operators found a water leak that
would not have been caught because the
leak only resulted in a small increase in
water consumption, compared to the total
water consumption of the facility. Having
the detailed monitoring data allowed the
leak to be detected, saving $12, 000.
Although $12,000 is not a large portion of
the budget, multiple small savings add up
– the identification of ten $12,000 cost
reduction opportunities results in
$120,000. Some additional cost saving
opportunities identified through IBIS to
help support “strategic decision-making”
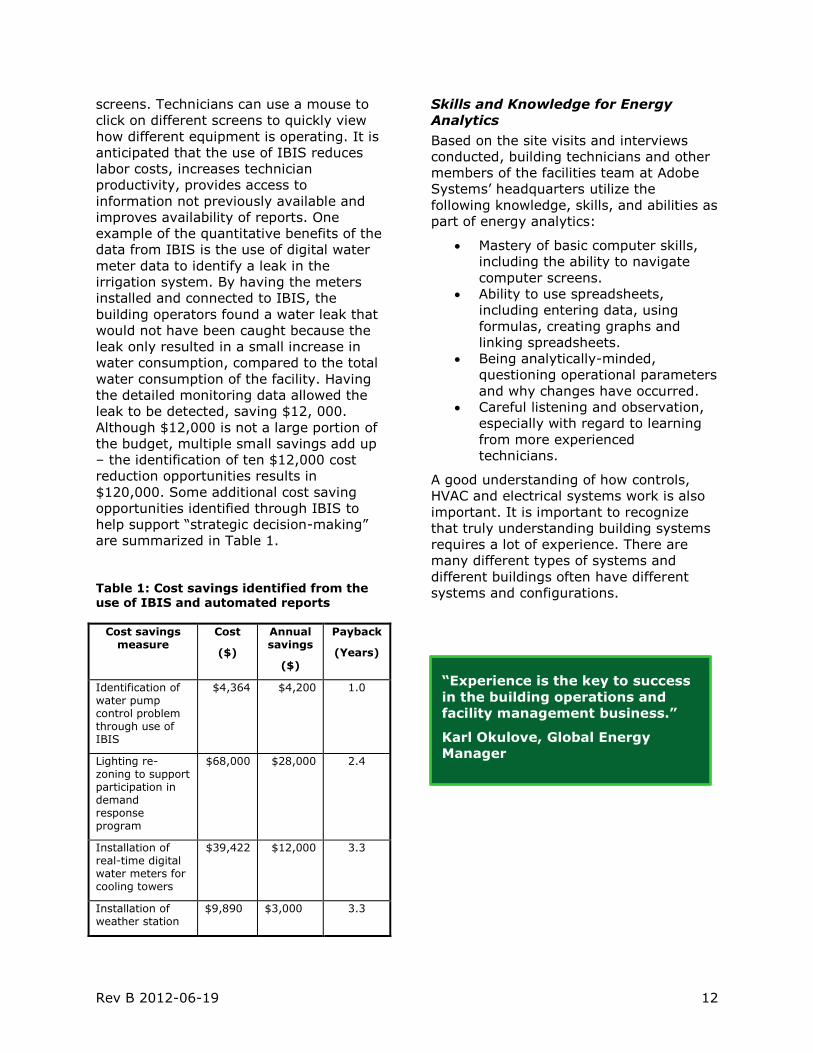
are summarized in Table 1.
Table 1: Cost savings identified from the use of IBIS and automated reports
Cost savings measure
Cost
($)
Annual savings
($)
Payback
(Years)
Identification of water pump control problem through use of IBIS
$4,364 $4,200 1.0
Lighting re-zoning to support participation in demand response program
$68,000 $28,000 2.4
Installation of real-time digital water meters for cooling towers
$39,422 $12,000 3.3
Installation of weather station
$9,890 $3,000 3.3
Skills and Knowledge for Energy
Analytics
Based on the site visits and interviews
conducted, building technicians and other
members of the facilities team at Adobe
Systems’ headquarters utilize the
following knowledge, skills, and abilities as
part of energy analytics:
Mastery of basic computer skills,
including the ability to navigate
computer screens.
Ability to use spreadsheets,
including entering data, using
formulas, creating graphs and
linking spreadsheets.
Being analytically-minded,
questioning operational parameters
and why changes have occurred.
Careful listening and observation,
especially with regard to learning
from more experienced
technicians.
A good understanding of how controls,
HVAC and electrical systems work is also
important. It is important to recognize
that truly understanding building systems
requires a lot of experience. There are
many different types of systems and
different buildings often have different
systems and configurations.
“Experience is the key to success
in the building operations and
facility management business.”
Karl Okulove, Global Energy
Manager
Rev B 2012-06-19 13
Best Practice #3: Standardized Processes and Reporting
Facilities operations management reports
are distributed monthly. The report
contains a summary of the contents of the
report, operational highlights, summaries
of metrics, and electricity, gas and water
usage data. Information contained in the
summary presents building data, including
the square footage of the facilities,
monthly operating expenses, square
footage per occupant, operating expenses
per square foot and other metrics and site
highlights.
Twenty-five monthly key performance
indicators, or KPIs, are included. As Adobe
Systems is a global company, the KPIs are
reported globally, meaning the data for all
facilities is aggregated to report a single
value. Several of the KPIs are cost
metrics: monthly operating expenses,
total capital expenses, operating expense
per occupant, operating expense per
square foot and total copy paper spend.
Other KPIs are intended to help
understand occupancy patterns: Percent
occupancy, total moves, annualized churn
rate and customer satisfaction rating. Yet
other KPIs quantify maintenance
practices: Number of work and
preventative maintenance orders, on-time
completion rate of work orders and the
number of corrective action versus on-
demand work orders. The goal for “on-
time completion and corrective action”
versus “on-demand work orders” is listed
following the monthly data to provide a
benchmark against which to compare the
data. Finally, energy KPIs are listed:
average ENERGY STAR score, purchased
energy consumption per square foot, and
total energy use reported in energy
consumption per square foot. Similar to
the maintenance KPIs, a benchmark is
provided as a meaningful comparison to
the monthly data.
Some of the KPIs are also included in the
report per building (Figure 12). As shown,
the figure includes the size of the building
in square feet, the number of occupants
(head count), operating costs, operating
cost per occupant, percent occupancy,
annualized churn rate, total work
requests, work requests per occupant,
percentage of work orders completed on
time and customer service rating. The
bottom of the figure provides an average
for all of the sites. By comparing the
average to specific buildings, it is possible
to gauge general performance for metrics
that are normalized per occupant.
Since the report for Adobe Systems is
created to summarize and compare all
Adobe Systems facilities across the world,
operational highlights of specific facilities
are mentioned. New members of the staff
team are mentioned, as well as successes,
such as increases in ENERGY STAR scores
and the implementation of new programs,
such as green cleaning or installation of
electric vehicle recharging stations.
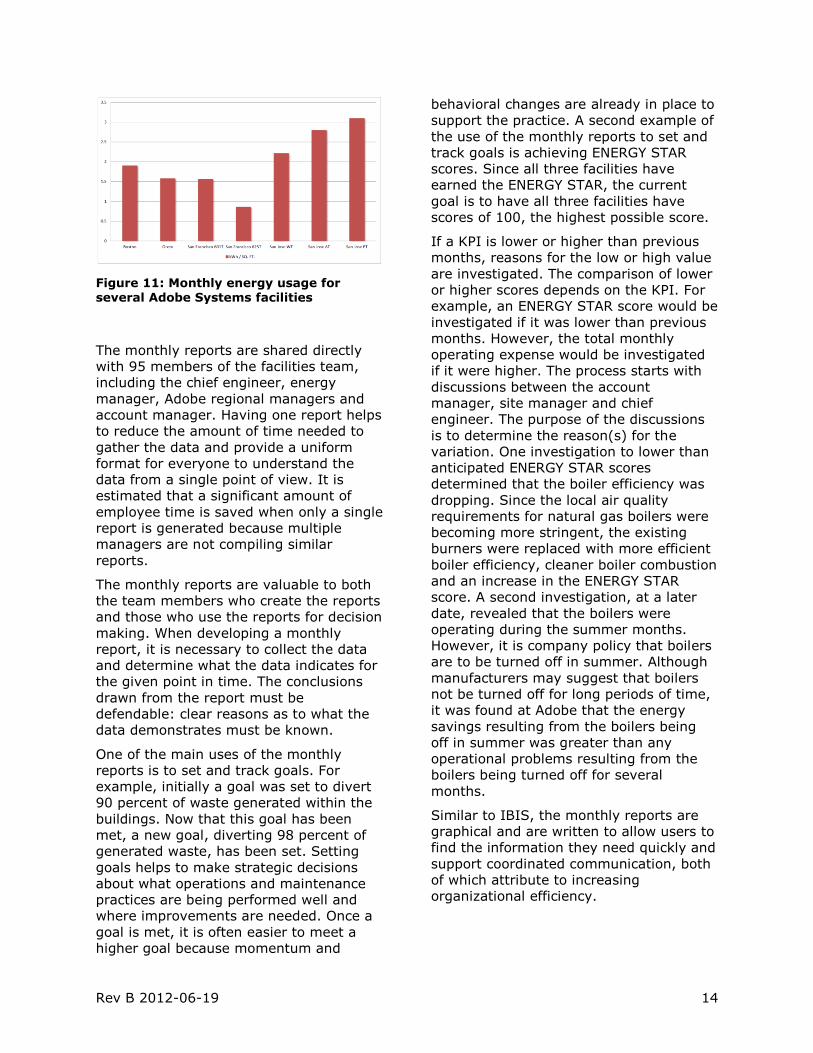
Within the KPI section of the report, the
electricity, natural gas and water
consumption for several different facilities
are compared. Figure 13 provides an
example of electricity consumption
measured in kilowatts per square foot for
several different facilities. The three bars
to the far right are for the Adobe San Jose
buildings. When comparing the energy
consumption per unit area for several
different buildings, it is important to
consider the function of the building and
activities occurring in the building before
drawing conclusions. For example, the
three San Jose high rise buildings have
more data centers and software labs than
the Boston, Orem and San Francisco
buildings. The San Jose east tower (ET)
has two data centers, while the other two
San Jose buildings only have one data
center. The buildings in Boston, Orem and
San Francisco are also not high rise
buildings.
“Benchmarking helps to note why
something is occurring, and
provides a starting point to
determine why.”
George Denise, Global Account Manager
Rev B 2012-06-19 14
Figure 11: Monthly energy usage for several Adobe Systems facilities
The monthly reports are shared directly
with 95 members of the facilities team,
including the chief engineer, energy
manager, Adobe regional managers and
account manager. Having one report helps
to reduce the amount of time needed to
gather the data and provide a uniform
format for everyone to understand the
data from a single point of view. It is
estimated that a significant amount of
employee time is saved when only a single
report is generated because multiple
managers are not compiling similar
reports.
The monthly reports are valuable to both
the team members who create the reports
and those who use the reports for decision
making. When developing a monthly
report, it is necessary to collect the data
and determine what the data indicates for
the given point in time. The conclusions
drawn from the report must be
defendable: clear reasons as to what the
data demonstrates must be known.
One of the main uses of the monthly
reports is to set and track goals. For
example, initially a goal was set to divert
90 percent of waste generated within the
buildings. Now that this goal has been
met, a new goal, diverting 98 percent of
generated waste, has been set. Setting
goals helps to make strategic decisions
about what operations and maintenance
practices are being performed well and
where improvements are needed. Once a
goal is met, it is often easier to meet a
higher goal because momentum and
behavioral changes are already in place to
support the practice. A second example of
the use of the monthly reports to set and
track goals is achieving ENERGY STAR
scores. Since all three facilities have
earned the ENERGY STAR, the current
goal is to have all three facilities have
scores of 100, the highest possible score.
If a KPI is lower or higher than previous
months, reasons for the low or high value
are investigated. The comparison of lower
or higher scores depends on the KPI. For
example, an ENERGY STAR score would be
investigated if it was lower than previous
months. However, the total monthly
operating expense would be investigated
if it were higher. The process starts with
discussions between the account
manager, site manager and chief
engineer. The purpose of the discussions
is to determine the reason(s) for the
variation. One investigation to lower than
anticipated ENERGY STAR scores
determined that the boiler efficiency was
dropping. Since the local air quality
requirements for natural gas boilers were
becoming more stringent, the existing
burners were replaced with more efficient
boiler efficiency, cleaner boiler combustion
and an increase in the ENERGY STAR
score. A second investigation, at a later
date, revealed that the boilers were
operating during the summer months.
However, it is company policy that boilers
are to be turned off in summer. Although
manufacturers may suggest that boilers
not be turned off for long periods of time,
it was found at Adobe that the energy
savings resulting from the boilers being
off in summer was greater than any
operational problems resulting from the
boilers being turned off for several
months.
Similar to IBIS, the monthly reports are
graphical and are written to allow users to
find the information they need quickly and
support coordinated communication, both
of which attribute to increasing
organizational efficiency.

Rev B 2012-06-19 15
Skills and Knowledge for Energy
Analytics
Based on the site visits and interviews
conducted, building technicians and other
members of the facilities team at Adobe
Systems’ headquarters utilize the
following knowledge, skills, and abilities as
part of standardized processes and
reporting:
Ability to use spreadsheets to
perform data tabulation, analysis
and charting.
Visualization of macro and micro
perspectives when making
strategic decisions.
Ability to draw defendable
conclusions.
Understanding of key performance
indicators, or KPIs, and how to
derive them to support reporting
requirements.
Ability to communicate the
rationale behind KPIs and reported
information, and reasons for
achieving or falling short of
performance goals.
Best Practice #4: Implementation
of a Sustainability Program
Sustainability is an important part of the
mission of Adobe Systems and Cushman
and Wakefield. The three towers in San
Jose have received the highest USGBC
certification, LEED EB: O&M Platinum, and
have ENERGY STAR scores of 100, 98 and
92. The highest ENERGY STAR score is
100, on a scale from zero to 100.
Buildings with a score of 75 or higher are
eligible to receive the ENERGY STAR label.
Plaques of these accomplishments are
prominently displayed in the main lobby of
each building (Figure 14).
Figure 13: LEED and ENERGY STAR plaques
Figure 12: Metrics from the monthly global report for Adobe Systems at the building level. [Note: Data is fictitious and for illustration only.]
Rev B 2012-06-19 16
To maintain the LEED EB: O&M status and
the ENERGY STAR labels annually,
Cushman and Wakefield gather
documentation monthly that must be
submitted for re-certification to the
USGBC quarterly and to the U.S. EPA
annually. Gathering the data at monthly
intervals helps to keep accurate, up to
date records. Some of the data needed is
collected from IBIS.
Practices instituted at Adobe Systems in
support of LEED EB: O&M include:
Plans for managing cooling tower
water treatment, bleed-off and
biological control (LEED EB: O&M
WEc4.1: Cooling Tower Water
Management, Chemical
Management)
A preventive maintenance program
to ensure all BAS components are
tested and repaired or replaced at
the manufacturer’s recommended
interval; and
BAS is used to drive decisions
about building operations and
energy savings (LEED EB: O&M
EAc3.1: Performance Measurement
– Building Automation).
ENERGY STAR scores are tracked monthly
as a way to benchmark and maintain
energy efficiency. Monthly tracking
provides a practical way to determine if
energy consumption is slowly increasing
or remaining steady, reducing the need
for energy audits.
Figure 14: ENERGY STAR scores
Between 2001 and 2011, Cushman and
Wakefield completed 77 sustainability
projects at the Adobe Systems’
headquarters. Spending $2.8 million
dollars resulted in a $2 million annual
savings, equivalent to a 1.1 year simple
payback or 95 percent return on
investment with $708,000 in rebates.
Some of the benefits include:
27 percent electricity usage
avoided
16 percent natural gas usage
avoided
LEED EB: O&M
Leadership in Energy and
Environmental Design for Existing
Buildings Operations and
Maintenance 2009 is a voluntary
rating system developed by the
U.S. Green Building Council that
ranks how green a building is,
considering seven categories:
• Sustainable sites
• Water efficiency
• Energy and atmosphere
• Materials and resources
• Indoor environmental quality
• Innovation in operations
• Regional priority
ENERGY STAR
ENERGY STAR is a voluntary
program developed by the U.S.
Environmental Protection Agency
and the U.S. Department of
Energy to help reduce energy
consumption through energy
efficient products and practices.
ENERGY STAR Portfolio Manager
is a free, interactive energy
management tool that can be
used to track energy and water
consumption of buildings.
Portfolio Manager is used to
determine the ENERGY STAR score for a building.
Rev B 2012-06-19 17
53 percent reduction in domestic
water use
93 percent reduction in irrigation
water use
98 percent solid waste diversion
rate
43 percent reduction in carbon
dioxide emissions
Projects completed spanned a range of
building system upgrades such as
installing thermal window film, optimizing
the chiller plant control sequences and the
implementation of an energy and
sustainability checklist. Installing window
film resulted in an annual savings of
$51,504 with 24 percent return on
investment. Optimizing the chiller plant
control sequences using an all-variable
speed strategy resulted in an annual
savings of $297,553, a 49 percent return
on investment.
One of the simplest energy conservation
projects with a high return on investment
was reducing the run-time of the garage
exhaust fans. Before the energy
conservation project was implemented,
the exhaust fans operated 24 hours a day,
seven days a week. However, through an
analysis of the concentrations of exhaust
and other particulates in the air, it was
found it was only necessary for the fans to
cycle on 15 minutes each hour, except
during high traffic times: three hours in
the morning and three hours in the
evening as employees were coming and
leaving the office. The change in the
control strategy cost approximately $100
of a building engineer’s time, but resulted
in electricity savings of $98,000 annually,
yielding a 980 percent return on
investment or nearly an immediate
payback.
Real-time digital electric meters were
installed in the main electric panels for a
cost of $39,472. After using the meters
for one year to look for energy
consumption abnormalities identified by
examining graphs of the data, a 42
percent return on investment was
realized. It was also found that the graphs
made it easier to identify variances in
energy consumption.
Although the buildings had motion sensors
in individual offices for overhead lighting
as part of the initial construction, the
facilities team determined additional
locations where motion and occupancy
sensors could be used to further reduce
lighting power consumption. Power strips
with motion sensors were installed to turn
off plug loads, except uninterruptable
power supplies (UPSs), when occupants
are not in their offices. Motion sensors
were installed in break rooms, hallways,
restrooms and meeting rooms. Motion
sensors, connected to relays, were
connected to the variable air volume
(VAV) boxes in the conference rooms so
that the rooms were only being heated or
cooled during use. Since code
requirements do not allow lights in
stairwells to be turned off using motion
sensors, the lamps and ballasts initially
installed were replaced with dimmable
lamps and ballasts to allow motion
sensors to dim stairwell lighting to the
minimum level to meet code requirements
for safety when the stairwells are not
occupied. A similar strategy was also used
with the parking garage lighting. Initially,
the parking garage lighting was on 24
hours a day, seven days per week.
However, to optimize energy efficiency
while maintaining safe conditions, lighting
levels were adjusted.
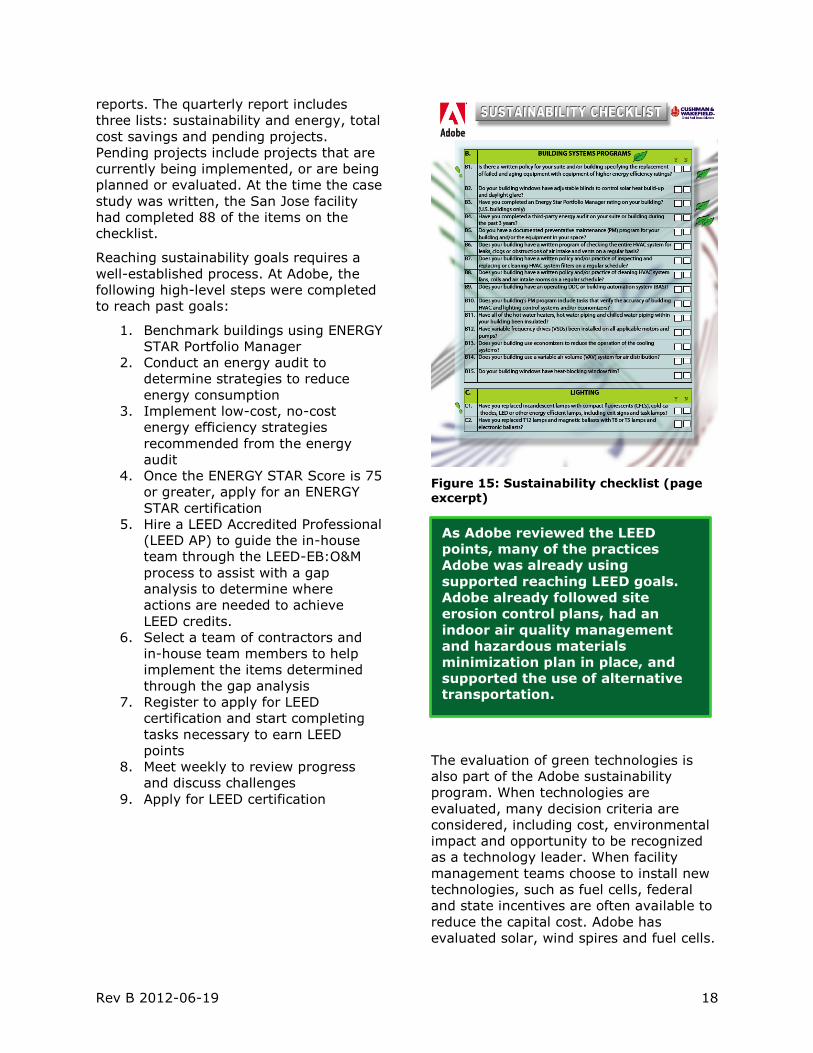
The sustainability checklist (Figure 15) is a
92 item list of possible items to improve
sustainable operations. The list was
generated through in-house ideas and
research about what other facilities are
doing. The checklist also allows Adobe to
compare the number of sustainable
operations practices implemented at each
Adobe facility worldwide through quarterly
ENERGY STAR ratings of 75 or
higher have been achieved since
2003 for the three Adobe towers.
Rev B 2012-06-19 18
reports. The quarterly report includes
three lists: sustainability and energy, total
cost savings and pending projects.
Pending projects include projects that are
currently being implemented, or are being
planned or evaluated. At the time the case
study was written, the San Jose facility
had completed 88 of the items on the
checklist.
Reaching sustainability goals requires a
well-established process. At Adobe, the
following high-level steps were completed
to reach past goals:
1. Benchmark buildings using ENERGY
STAR Portfolio Manager
2. Conduct an energy audit to
determine strategies to reduce
energy consumption
3. Implement low-cost, no-cost
energy efficiency strategies
recommended from the energy
audit
4. Once the ENERGY STAR Score is 75
or greater, apply for an ENERGY
STAR certification
5. Hire a LEED Accredited Professional
(LEED AP) to guide the in-house
team through the LEED-EB:O&M
process to assist with a gap
analysis to determine where
actions are needed to achieve
LEED credits.
6. Select a team of contractors and
in-house team members to help
implement the items determined
through the gap analysis
7. Register to apply for LEED
certification and start completing
tasks necessary to earn LEED
points
8. Meet weekly to review progress
and discuss challenges
9. Apply for LEED certification
Figure 15: Sustainability checklist (page
excerpt)
The evaluation of green technologies is
also part of the Adobe sustainability
program. When technologies are
evaluated, many decision criteria are
considered, including cost, environmental
impact and opportunity to be recognized
as a technology leader. When facility
management teams choose to install new
technologies, such as fuel cells, federal
and state incentives are often available to
reduce the capital cost. Adobe has
evaluated solar, wind spires and fuel cells.
As Adobe reviewed the LEED
points, many of the practices
Adobe was already using
supported reaching LEED goals.
Adobe already followed site
erosion control plans, had an
indoor air quality management
and hazardous materials
minimization plan in place, and
supported the use of alternative transportation.
Rev B 2012-06-19 19
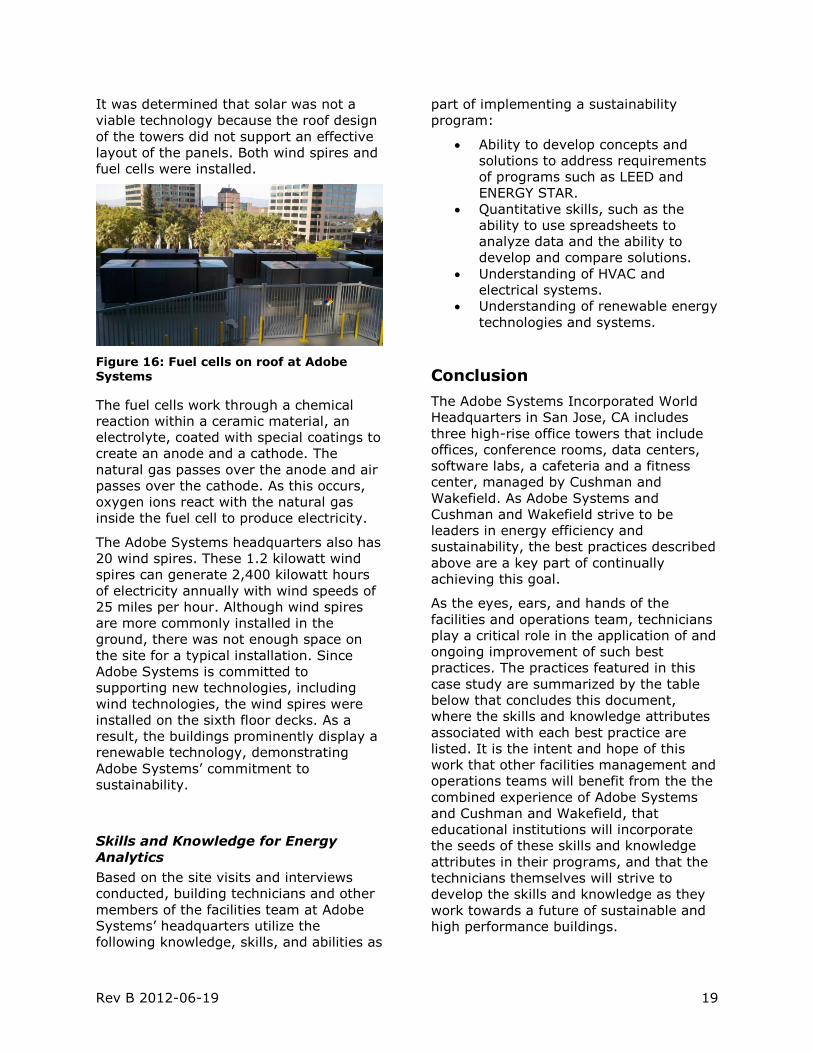
It was determined that solar was not a
viable technology because the roof design
of the towers did not support an effective
layout of the panels. Both wind spires and
fuel cells were installed.
Figure 16: Fuel cells on roof at Adobe Systems
The fuel cells work through a chemical
reaction within a ceramic material, an
electrolyte, coated with special coatings to
create an anode and a cathode. The
natural gas passes over the anode and air
passes over the cathode. As this occurs,
oxygen ions react with the natural gas
inside the fuel cell to produce electricity.
The Adobe Systems headquarters also has
20 wind spires. These 1.2 kilowatt wind
spires can generate 2,400 kilowatt hours
of electricity annually with wind speeds of
25 miles per hour. Although wind spires
are more commonly installed in the
ground, there was not enough space on
the site for a typical installation. Since
Adobe Systems is committed to
supporting new technologies, including
wind technologies, the wind spires were
installed on the sixth floor decks. As a
result, the buildings prominently display a
renewable technology, demonstrating
Adobe Systems’ commitment to
sustainability.
Skills and Knowledge for Energy
Analytics
Based on the site visits and interviews
conducted, building technicians and other
members of the facilities team at Adobe
Systems’ headquarters utilize the
following knowledge, skills, and abilities as
part of implementing a sustainability
program:
Ability to develop concepts and
solutions to address requirements
of programs such as LEED and
ENERGY STAR.
Quantitative skills, such as the
ability to use spreadsheets to
analyze data and the ability to
develop and compare solutions.
Understanding of HVAC and
electrical systems.
Understanding of renewable energy
technologies and systems.
Conclusion
The Adobe Systems Incorporated World
Headquarters in San Jose, CA includes
three high-rise office towers that include
offices, conference rooms, data centers,
software labs, a cafeteria and a fitness
center, managed by Cushman and
Wakefield. As Adobe Systems and
Cushman and Wakefield strive to be
leaders in energy efficiency and
sustainability, the best practices described
above are a key part of continually
achieving this goal.
As the eyes, ears, and hands of the
facilities and operations team, technicians
play a critical role in the application of and
ongoing improvement of such best
practices. The practices featured in this
case study are summarized by the table
below that concludes this document,
where the skills and knowledge attributes
associated with each best practice are
listed. It is the intent and hope of this
work that other facilities management and
operations teams will benefit from the the
combined experience of Adobe Systems
and Cushman and Wakefield, that
educational institutions will incorporate
the seeds of these skills and knowledge
attributes in their programs, and that the
technicians themselves will strive to
develop the skills and knowledge as they
work towards a future of sustainable and
high performance buildings.
Rev B 2012-06-19 20
Acknowledgements
Thanks to the Cushman & Wakefield team
at the Adobe Systems Incorporated
facility, including George Denise Sr. CFM,
CPM, FMA, RPA, LEED AP, Global Account
Manager; Karl Okulove CFM, LEED AP,
Global Energy Manager; Charles Stathis,
LEED AP; Director of Engineering;
Lakshimi (Meera) Ramanathan, LEED AP,
Global Sustainability Manager; Bert
Lankins, Utility Engineer; and Carl
Gerlach, Chief Engineer.
Resources
USGBC LEED EB
http://www.usgbc.org/DisplayPage.aspx?CMSPageID=221
ENERGY STAR
http://www.energystar.gov/index.cfm?c=
business.bus_index
Rev B 2012-06-19 21
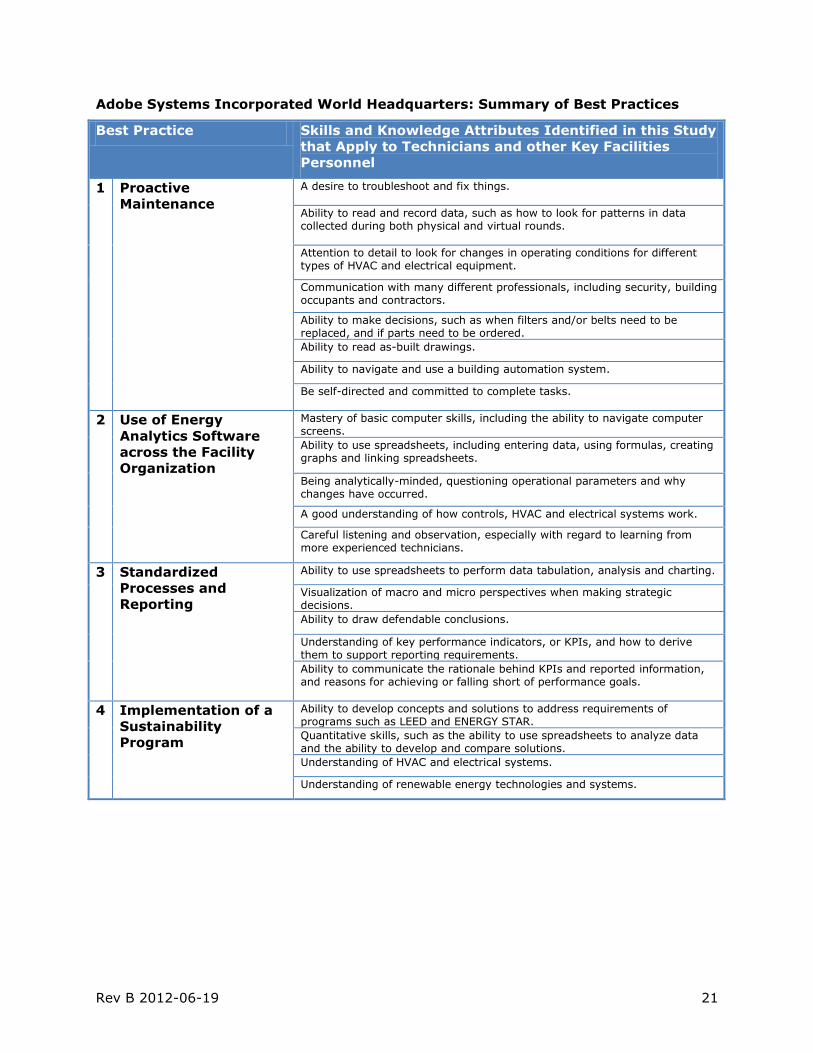
Adobe Systems Incorporated World Headquarters: Summary of Best Practices
Best Practice Skills and Knowledge Attributes Identified in this Study
that Apply to Technicians and other Key Facilities
Personnel
1 Proactive
Maintenance
A desire to troubleshoot and fix things.
Ability to read and record data, such as how to look for patterns in data collected during both physical and virtual rounds.
Attention to detail to look for changes in operating conditions for different types of HVAC and electrical equipment.
Communication with many different professionals, including security, building occupants and contractors.
Ability to make decisions, such as when filters and/or belts need to be replaced, and if parts need to be ordered.
Ability to read as-built drawings.
Ability to navigate and use a building automation system.
Be self-directed and committed to complete tasks.
2 Use of Energy
Analytics Software
across the Facility
Organization
Mastery of basic computer skills, including the ability to navigate computer screens.
Ability to use spreadsheets, including entering data, using formulas, creating graphs and linking spreadsheets.
Being analytically-minded, questioning operational parameters and why changes have occurred.
A good understanding of how controls, HVAC and electrical systems work.
Careful listening and observation, especially with regard to learning from more experienced technicians.
3 Standardized
Processes and
Reporting
Ability to use spreadsheets to perform data tabulation, analysis and charting.
Visualization of macro and micro perspectives when making strategic decisions.
Ability to draw defendable conclusions.
Understanding of key performance indicators, or KPIs, and how to derive them to support reporting requirements.
Ability to communicate the rationale behind KPIs and reported information, and reasons for achieving or falling short of performance goals.
4 Implementation of a
Sustainability
Program
Ability to develop concepts and solutions to address requirements of programs such as LEED and ENERGY STAR.
Quantitative skills, such as the ability to use spreadsheets to analyze data and the ability to develop and compare solutions.
Understanding of HVAC and electrical systems.
Understanding of renewable energy technologies and systems.