

Administrative Services report for FY 2017-2018 · Administrative Services for the Health Care ......
36
ADMINISTRATIVE SERVICES FISCAL YEAR 2017 - 2018
Transcript of Administrative Services report for FY 2017-2018 · Administrative Services for the Health Care ......

INTRODUCTION
I am pleased to share this report, which provides an overview of Administrative Services for the Health Care Agency. This report provides a description of our mission, vision and values, as well as information about each Administrative Services division, list of balanced scorecard measures and Administrative Services goals.
The primary function of Administrative Services is to provide support to Health Care Agency programs and staff. We provide a diversity of administrative services through Accounting Services, Contract Services, Financial Services, Human Resource Services, Information Technology, Management Services and Purchasing Services. These divisions are necessary for the Health Care Agency to operate efficiently and effectively, and allow the programs to provide the best possible services to our community. Our desire is to help you meet the mission and vision of the Agency.
I am proud of the Administrative Services staff and the exceptional service they provide to you our internal customer. We value being accountable, dedicated, ethical, innovative and respectful. If you have any questions or want to learn more, please contact myself or any of the Administrative Managers.
Anna PetersDirector of Administrative [email protected] (714) 834-5150
Fiscal Year 2017 - 2018

ADMINISTRATIVE SERVICES
Our Mission
In collaboration with our partners, deliver excellent customer service through effective communication,
leadership, fi scal responsibility and integrity
Our Vision
Provide Quality Administrative Support
Our Values
Accountable Dedicated Ethical
Innovative Respectful
Administrative Services

TABLE OF CONTENT
5 ACCOUNTING SERVICES
CONTRACT SERVICES
FINANCIAL SERVICES
HUMAN RESOURCE SERVICES
INFORMATION TECHNOLOGY
MANAGEMENT SERVICES
PURCHASING SERVICES
ADMINISTRATIVE SERVICES BUDGET
ADMINISTRATIVE SERVICES BALANCED SCORECARD SUMMARY
ADMINISTRATIVE SERVICES GOALS FOR FY 2017-18
Fiscal Year 2017 - 2018
7
11
1417
21
26
27
28
32

4 Administrative Services
Richard Sanchez
Director
County Health Officer Eric G. Handler, MD, MPH, FAAP
Office of Compliance Chi Rajalingam, PhD
Chief Compliance Officer
Behavioral Health ServicesMary Hale, M.S. CHCDeputy Agency Director
Correctional Health ServicesKim Pearson, RN
Deputy Agency Director
Public Health ServicesDavid M. Souleles, MPHDeputy Agency Director
Regulatory/Medical Health ServicesSteve Thronson
Deputy Agency Director
Office of the DirectorSusanna Ganey
Executive Secretary
Office of DirectorRachel Selleck
Assistant to the Director
VacantAssistant Director
Health Policy, Research and CommunicationDonna Grubaugh
Chief
Administrative ServicesAnna Peters
Director
Accounting Services Salvador LopezDivision Manager
Contract ServicesSusie Kim
Division Manager
Financial Services DeeDee FranksDivision Manager
Human Resource Services Jennifer Canzoneri
Team Manager
Information Technology Adil Siddiqui
Chief Information Officer
Management Services John Lewis
Division Manager
Purchasing Services Maritza FajardoDivision Manager
ADMINISTRATIVE SERVICESOrganization Chart

5Fiscal Year 2017 - 2018
ACCOUNTING SERVICESAccounting Services are provided by the Auditor-Controller Department and include pro-fessional accounting support and Medi-Cal billing services for Health Care Agency (HCA) programs. The Accounting Services division is organized into five distinct units: (1) Claims and Financial Reporting, (2) Disbursements, (3) Environmental Health, (4) Medical Billing Unit and (5) Public Guardian.
Claims & Financial ReportingServices provided include preparing claims for reimbursement and various monthly, quar-terly and annual financial reports in addition to processing year-end entries. The unit is also responsible for conducting internal monitoring to ensure all transactions are in ac-cordance with Generally Accepted Accounting Principles (GAAP), and act as the primary resource regarding the claiming and proper recording of revenue transactions. This unit is the primary contact for financial audits conducted by the State, Internal Audit, and ex-ternal auditors and is responsible for compiling HCAs Schedule of Expenditures of Federal Awards (SEFA).
DisbursementsConducts all required activities necessary for processing timely vendor payments and payroll for all of HCA in addition to internal monitoring and auditing of these operations. The unit is also responsible for conducting cash handling audits and providing guidance as needed.
Environmental HealthPerforms annual, quarterly and prorated billing and collection operations for the hazard-ous waste and health service fees on behalf of HCA Environmental Health. Annually, this unit coordinates the State mandated Certified Unified Program Agency (CUPA) billings and collects and distributes funds to all participating agencies and businesses, as applicable.
Medical Billing UnitAssists in implementing accurate billing, coding and HIPAA and compliance practices in HCA as well as processes any necessary refunds as directed by the payor or HCA.
Public GuardianPerforms accounting support for the Public Guardian’s operations as well as the fiduciary services to their clients. Conducts court accountings and provides guidance as needed.
Division DescriptionADMINISTRATIVE SERVICES

6 Administrative Services
Accomplishments
n The Medical Billing Unit (MBU) successfully collaborated with HCA’s clinic staff and converted to Electronic Health Records (EHR). Client billing began accepting credit card payments over the phone.
n Disbursements ensured all W2s for current and former HCA employees were distrib-uted in compliance with Internal Revenue Service guidelines. Additionally, the unit successfully implemented OC Expediter into the Accounts Payable functions.
n Claims & Financial Reporting met the ongoing demands of the State for the required submission of the Mental Health Cost Report, Alcohol & Drug Abuse Services Cost Report, Targeted Case Management Cost Reports and Medi-Cal Administrative Activ-ities Cost Reporting. The unit is currently collaborating with HCA’s Behavioral Health staff to prepare for the Drug Medi-Cal – Organized Delivery System (DMC-ODS) for implementation in FY 17/18.
n Environmental Health Accounting completed another successful CUPA billing cycle and disbursement to all applicable participating agencies.
n Public Guardian accounting collaborated with HCA Public Guardian and IT in the search for a new ePages system. The unit is currently collaborating in the develop-ment of the new system with an anticipated go-live date of April 2018.
Accounting Services Metrics
Type of Accounting Service
FY 2013-14 FY 2014-15 FY 2015-16 FY 2016-17
Number Amount Number Amount Number Amount Number Amount
Timecards audited, processed and up-loaded in one year
62,307 $165M 62,151 $168M 65,708 $174M 63,896 $188M
Invoices submitted for Environmental Health Services
39,879 $21M 39,188 $20M 40,954 $22M 38,963 $22M
Claims, reports, and cost applies reportedand claimed for HCA programs - estimates
1,011 $685M 937 $716M 975 $805M 1,211 $778M
Regulatory/Medical Health Services billed for services provided by HCA and providers
454,843 $75M 389,627 $74M 329,709 $70M 389,317 $93M
Invoices audited, processed and paid for goods or services received by HCA
13,045 $333M 12,068 $245M 13,499 $240M 14,204 $281M

7Fiscal Year 2017 - 2018
CONTRACT SERVICES The Contract Services Division is responsible for developing, soliciting, negotiating and administering human service contracts for HCA.
Contract Services currently administers more than 680 contracts and Memorandums of Understanding (MOUs), many of which contain multiple funding sources and distinctly different programs. These human service contracts include services for Agency programs in Behavioral Health Services, Correctional Health Services, Regulatory/Medical Health Services and Public Health Services. Contract providers include hospitals, clinics, physi-cians, educational institutions and community based organizations.
The Contract Services Division supports the fiscal and operational integrity of HCA by uti-lizing the competitive bidding process to obtain the most cost effective services; providing effective and efficient contract development and administration; and providing oversight of contracted human services to safeguard the County’s financial resources.
As part of the Administrative Services team, Contract Services partners with HCA pro-grams to ensure the availability of cost-efficient, effective contracted services for Orange County residents.
Contract Services Metrics
Type of Contract Service FY 2013-14 FY 2014-15 FY 2015-16 FY 2016-17
Human Services invoices processed 3,200 3,400 2,524 3,021
MOUs administered 58 61 74 87
Personal Services Contracts administered 208 135 111 79
Letters of Agreement administered 258 14 45 145
Solicitations for Human Services developed and administered
28 34 34 56
Human Service Contracts developed and administered 503 506 503 *555
* Variance from last year due to inclusion of additional non-financial agreements; does not include amendments.

8 Administrative Services
Solicitations Administered Metrics
Service Area
FY 2013-14 FY 2014-15 FY 2015-16 FY 2016-17Number of
Solicitations Status Number of Solicitations Status Number of
Solicitations Status Number of Solicitations Status
Administrative Services N/A N/A N/A N/A *3In Process (0) Completed (3)Cancelled (0)
4 Completed (4)
Behavioral Health Services 15In Process (1) Completed 12) Cancelled (2)
24In Process (2) Completed 22)Cancelled (0)
17In Process (0) Completed (16)Cancelled (1)
37In Process (10) Completed (25)Cancelled (2)
Correctional Health Services 3In Process (0) Completed (3) Cancelled (0)
2In Process (0)Completed (1) Cancelled (1)
3In Process (0) Completed (3)Cancelled (0)
3In Process (1) Completed (1)Cancelled (1)
Regulatory/Medical Health Services 2
In Process (1) Completed (0) Cancelled (1)
2In Process (0)Completed (1) Cancelled (1)
2In Process (0) Completed (2)Cancelled (0)
4 Completed (4)
Public Health Services 8In Process (0) Completed (7) Cancelled (1)
6In Process (2) Completed (4)Cancelled (0)
9In Process (0) Completed (9)Cancelled (0
8 Completed (7)Cancelled (1)
Total Number of Solicitations 28 34 34 56 Completed (4)
* New metric as of FY 2015-16
Contracts Administered Metrics
Service Area
FY 2013-14 FY 2014-15 FY 2015-16 Funding Sources
Number
% ofVolume
% of Total
Funding
Numberof Contracts
% ofVolume
% ofTotal
Funding
Numberof
Contracts
% ofVolume
% ofTotal
Fundidng
Administrative Services 73 14% 2% 73 14% 2% *12 2% 2% NCC
Behavioral Health Services 155 31% 53% 158 31% 53% 167 33% 69%
MHSA, Medi-Cal (FFP, 2011 Realignment, 1991 Realignment, MOE), PATH, SAPT, SAMHSA, NCC, Drug Medi-Cal, FOTP, AB109, Ryan White, HOPWA, Discretionary/NCC Funds, TSR, Parolee Services Network, CalWORKs, BJA, and General Funds
Regulatory/Medical Health Services/ Correctional Health
189 38% 41% 189 38% 41% 229 46% 19% NCC, TSR, AB109, Federal, CI / LIHP, SB1773, Maddy, ICE, EMSF
Public Health Services 86 17% 4% 86 17% 4% 95 19% 10% Ryan White, HOPWA, SAPT, TSR, NCC, Federal, State, Kaiser Grant
Totals 503 100% 100% 506 100% 100% 503 100% 100% 25
* Large variance in number, compared to prior fiscal year, due to reclassification of off-campus student agreements from Admin to MOUs.

9Fiscal Year 2017 - 2018
Solicitations Administered Metrics
Service Area
FY 2013-14 FY 2014-15 FY 2015-16 FY 2016-17Number of
Solicitations Status Number of Solicitations Status Number of
Solicitations Status Number of Solicitations Status
Administrative Services N/A N/A N/A N/A *3In Process (0) Completed (3)Cancelled (0)
4 Completed (4)
Behavioral Health Services 15In Process (1) Completed 12) Cancelled (2)
24In Process (2) Completed 22)Cancelled (0)
17In Process (0) Completed (16)Cancelled (1)
37In Process (10) Completed (25)Cancelled (2)
Correctional Health Services 3In Process (0) Completed (3) Cancelled (0)
2In Process (0)Completed (1) Cancelled (1)
3In Process (0) Completed (3)Cancelled (0)
3In Process (1) Completed (1)Cancelled (1)
Regulatory/Medical Health Services 2
In Process (1) Completed (0) Cancelled (1)
2In Process (0)Completed (1) Cancelled (1)
2In Process (0) Completed (2)Cancelled (0)
4 Completed (4)
Public Health Services 8In Process (0) Completed (7) Cancelled (1)
6In Process (2) Completed (4)Cancelled (0)
9In Process (0) Completed (9)Cancelled (0
8 Completed (7)Cancelled (1)
Total Number of Solicitations 28 34 34 56 Completed (4)
* New metric as of FY 2015-16
Contracts Administered Metrics
Service Area
FY 2013-14 FY 2014-15 FY 2015-16 Funding Sources
Number
% ofVolume
% of Total
Funding
Numberof Contracts
% ofVolume
% ofTotal
Funding
Numberof
Contracts
% ofVolume
% ofTotal
Fundidng
Administrative Services 73 14% 2% 73 14% 2% *12 2% 2% NCC
Behavioral Health Services 155 31% 53% 158 31% 53% 167 33% 69%
MHSA, Medi-Cal (FFP, 2011 Realignment, 1991 Realignment, MOE), PATH, SAPT, SAMHSA, NCC, Drug Medi-Cal, FOTP, AB109, Ryan White, HOPWA, Discretionary/NCC Funds, TSR, Parolee Services Network, CalWORKs, BJA, and General Funds
Regulatory/Medical Health Services/ Correctional Health
189 38% 41% 189 38% 41% 229 46% 19% NCC, TSR, AB109, Federal, CI / LIHP, SB1773, Maddy, ICE, EMSF
Public Health Services 86 17% 4% 86 17% 4% 95 19% 10% Ryan White, HOPWA, SAPT, TSR, NCC, Federal, State, Kaiser Grant
Totals 503 100% 100% 506 100% 100% 503 100% 100% 25

10 Administrative Services
Contracts Administered Metrics
Service Area
FY 2016-17*
Funding SourcesNo. ofContracts
% ofVolume
% of TotalFunding
Administrative Services 44 8% 1% NCC
Behavioral Health Services 172 31% 75%
MHSA, Medi-Cal (FFP, 2011 Realignment, 1991 Realignment, MOE), PATH, SAPT, SAMHSA, NCC, Drug Medi-Cal, FOTP, AB109, Ryan White, HOPWA, Discretionary/NCC Funds, TSR, Parolee Services Network, CalWORKs, BJA, and General Funds
Correctional Health Services 7 1% 9% NCC, TSR, Federal, ICE
Public Health Services 124 22% 7% Ryan White, HOPWA, SAPT, TSR, NCC,
Federal, State, Kaiser Grant
Regulatory/Medical Health Services 208 37% 8% NCC, TSR, AB109, Federal, CI / LIHP,
SB1773, Maddy, ICE, EMSF
Totals 555 100% 100% 25* Variance in total number of contracts, and distribution between service areas, due to inclusion of additional non-financial agreements.

11Fiscal Year 2017 - 2018
FINANCIAL SERVICES Financial Services provides budget, administrative and programmatic support to HCA in accordance with Financial Services roles/responsibilities and requirements established by the CEO Budget Office and Auditor-Controller. This division is responsible for:
n Annual preparation of HCA’s Strategic Financial Plan
n Fiscal budget development, monitoring and forecasting for 40 general fund budget units within HCA:
n Fiscal budget development, monitoring and forecasting for seven non-general fund revenues – these funds are restricted for specific purposes and required to be kept and accounted for separately from the general fund
n Coordination of fee and rate schedules to ensure HCA recovers appropriate revenue for associated costs
n Management of financial projects for the Director’s Office
n Agency coordination of the annual fiscal year-end process
Financial Services Metrics FY 2014-15 FY 2015-16 FY 2016-17 FY 2017-18Gross adopted annual budgeted expenditures $625M $608M $652M $685M
Budgeted funding sources >170 >170 >170 >170
Budgeted positions 2,588 2,579 2,655 2,667
12 Administrative Services
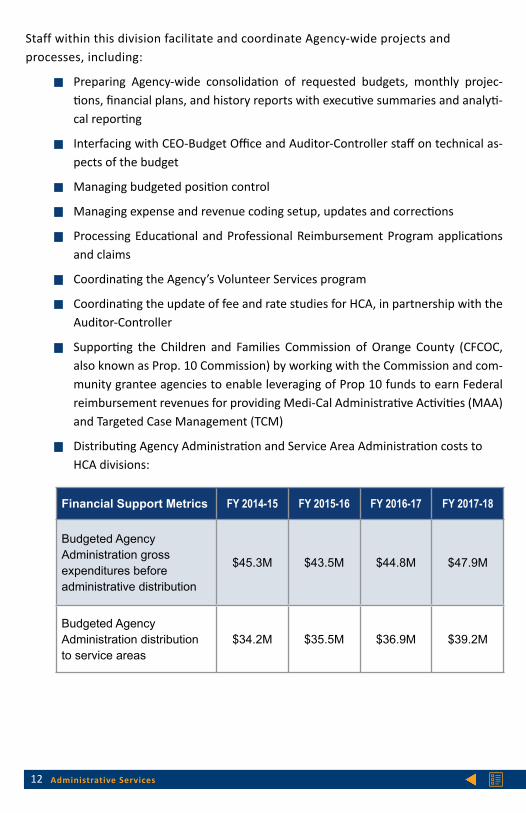
Financial Support Metrics FY 2014-15 FY 2015-16 FY 2016-17 FY 2017-18
Budgeted Agency Administration gross expenditures before administrative distribution
$45.3M $43.5M $44.8M $47.9M
Budgeted Agency Administration distribution to service areas
$34.2M $35.5M $36.9M $39.2M
Staff within this division facilitate and coordinate Agency-wide projects and processes, including:
n Preparing Agency-wide consolidation of requested budgets, monthly projec-tions, financial plans, and history reports with executive summaries and analyti-cal reporting
n Interfacing with CEO-Budget Office and Auditor-Controller staff on technical as-pects of the budget
n Managing budgeted position control
n Managing expense and revenue coding setup, updates and corrections
n Processing Educational and Professional Reimbursement Program applications and claims
n Coordinating the Agency’s Volunteer Services program
n Coordinating the update of fee and rate studies for HCA, in partnership with the Auditor-Controller
n Supporting the Children and Families Commission of Orange County (CFCOC, also known as Prop. 10 Commission) by working with the Commission and com-munity grantee agencies to enable leveraging of Prop 10 funds to earn Federal reimbursement revenues for providing Medi-Cal Administrative Activities (MAA) and Targeted Case Management (TCM)
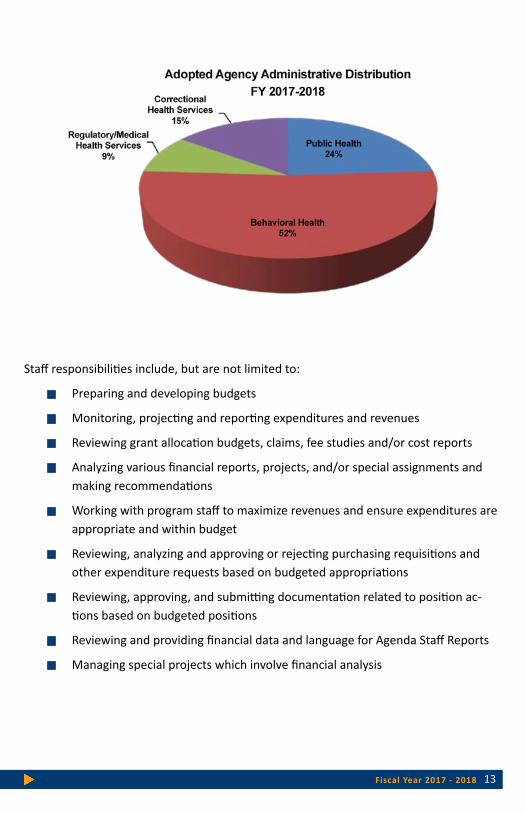
n Distributing Agency Administration and Service Area Administration costs to HCA divisions:
13Fiscal Year 2017 - 2018
Staff responsibilities include, but are not limited to:
n Preparing and developing budgets
n Monitoring, projecting and reporting expenditures and revenues
n Reviewing grant allocation budgets, claims, fee studies and/or cost reports
n Analyzing various financial reports, projects, and/or special assignments and making recommendations
n Working with program staff to maximize revenues and ensure expenditures are appropriate and within budget
n Reviewing, analyzing and approving or rejecting purchasing requisitions and other expenditure requests based on budgeted appropriations
n Reviewing, approving, and submitting documentation related to position ac-tions based on budgeted positions
n Reviewing and providing financial data and language for Agenda Staff Reports
n Managing special projects which involve financial analysis

14 Administrative Services
HUMAN RESOURCE SERVICES
The Human Resource Services (HRS) Department within the County of Orange provides services to each agency/department through a centralized model. The Health Care Agen-cy (HCA) is assigned a satellite HRS team to provide day-to-day Human Resource (HR) support in the areas of personnel transaction processing, performance management, re-turn to work, recruiting, classification, new employee training, personnel investigations and discipline, Leave of Absence (LOA) coordination, labor relations, licensure monitor-ing, policy and procedure review and training. These services are coordinated with the centralized HRS team who also provides countywide training and organizational develop-ment, labor contract negotiations, classification review, labor relations and Equal Employ-ment Opportunity (EEO) services throughout the County.
The HCA HR Team collaborates with HCA management and staff to provide effective and efficient services while adhering to established policies, procedures and applicable laws. This includes a strong focus on conducting efficient and effective recruiting processes and ensuring that classification issues are addressed in a timely manner. The results of these efforts are reported on a regular basis through the HCA Balanced Scorecard.
The following is a summary of each of the functions within the HCA HR team:
ClassificationThe HCA HR team coordinates with the central HRS Classification team to ensure that the duties being performed by HCA employees are properly classified within the County’s classification structure. This also includes reallocating vacant positions to another classi-fication where the duties are more aligned with the duties the unit needs the position to perform. Once HCA HR conducts its review of reallocation requests they are submitted to the central HR classification team for further review and analysis. The reallocation process is included as a Balanced Scorecard Measure with a goal of Average Time to Complete Reallocation Requests within 60 days.
Employee RelationsThe Employee Relations (ER) team consists of five ER Analysts who partner with all levels of the organization regarding performance management issues, policy review and revi-sion, personnel investigations, disciplinary actions and employee relations issues. They
Classification Metric FY 2013-14 FY 2014-15 FY 2015-16 FY 2016-17
Classification issues and requests which have been resolved by HCA HR >100 ~70 56 70

15Fiscal Year 2017 - 2018
also provide day-to-day support to all HCA staff requesting HR related information and work with the various labor organizations to resolve work related issues.
RecordsThe Records unit consists of four team members who are responsible for processing all personnel transactions in the Countywide Accounting and Personnel Systems (CAPS) per-sonnel system, coordinating new hire sign-up and training, performance evaluation and licensure monitoring, administering the Catastrophic Leave donation program, processing Leaves of Absence and processing job offer paperwork.
RecruitingThere are currently nine staff members assigned to the HCA HR Recruiting team. This team is responsible for partnering with HCA hiring managers to conduct recruitments for open positions within the County’s Merit and Selection Rules. The team also conducts outreach by visiting various schools and by attending job fairs to market HCA as an em-ployer of choice in order to obtain the best candidates for HCA’s open positions. Over the last year, this team opened approximately 116 recruitments where over 313 candidates were hired or promoted into HCA positions.
Given the critical nature of this function, the HCA HR team has included Average Time to Hire as a Balanced Scorecard Measure with a goal of 90 days or less. One effort to move closer to that goal includes the implementation of an online testing component for large recruitments which identifies more qualified candidates within a shorter period of time than traditional assessment methods.
Recruiting Metrics FY 2013-14 FY 2014-15 FY 2015-16 FY 2016-17
Recruitments 100 76 80 116
Candidates hired or promoted into HCA positions 425 410 442 313
Employee Relations Metrics FY 2013-14 FY 2014-15 FY 2015-16 FY 2016-17Personnel investigations 100 114 105 175
Performance related issues addressed 200 97 137 192Grievance matters handled 25 7 9 11
Records Metrics FY 2013-14 FY 2014-15 FY 2015-16 FY 2016-17Personnel transactions processed 8,500 4,300 5,629 8,480
Job offers 425 435 442 313
Catastrophic Leave donation requests 50 57 65 71

16 Administrative Services
Return to WorkThe HCA Return-to-Work Manager is the main point of contact for all HCA employees who have suffered a work related or non-work related injury and meets with the employee in an attempt to return them to work as early as possible. This position also tracks all Leaves of Absence (LOA) and coordinates disability retirement applications with Orange County Employees Retirement System (OCERS).
Training and Organizational DevelopmentThe HCA HR team is continuing to develop and facilitate short training topics to be de-livered to various HCA audiences at staff meetings or upon request. Topics include per-formance management, participating in recruitments, EAP program and classification to name a few. The team can also customize training related to any HR topic upon request. The HCA HR team is also leading the HCA Mentorship Program Committee which is devel-oping a mentoring program for HCA employees. The committee is providing training for each of the roles in the program and then identifying mentorship pairs that will meet on a regular basis over the course of six months.
The central HRS Learning and Organizational Development (LOD) team is currently provid-ing countywide leadership development training through the Professional Development Experience (PDX) program. This program offers three levels of training to supervisors and managers within a cohort setting. This training includes first level nuts and bolts training for new supervisors as well as more advanced training to higher level managers and exec-utive staff. As of July 1, 2017, a total of 35% of the eligible HCA employees have completed PDX training.
Return to Work Metrics FY 2013-14 FY 2014-15 FY 2015-16 FY 2015-16Leaves of Absence processed and monitored 200 265 317 365
Partnered with employees with medical restrictions in an attempt to return them to work
150 135 166 293
Worker’s compensation and disability retirement cases coordinated 76 105 129 125
17Fiscal Year 2017 - 2018
INFORMATION TECHNOLOGY
HCA Information Technology (IT) provides the vision, leadership, direction and strategic and tactical planning for all agency information technology initiatives.
The primary mission of the department is to enable and support all functional service and administrative areas within the agency to meet their respective goals and objectives. This is accomplished via collaboration and partnership with the program areas, by factoring in customer needs in all decisions with a customer-centric focus and ensuring that the individual technology-based objectives of the program areas are aligned with the overall technology roadmap and goals of the Agency.
The overall operational goal is to ensure high availability of the network, desktop and portable computing devices, servers, email, internet and intranet access, and to provide support for the development and support of all enterprise applications and databases, compliance with various laws and regulations, as well as set technology standards.
Primary services provided include:
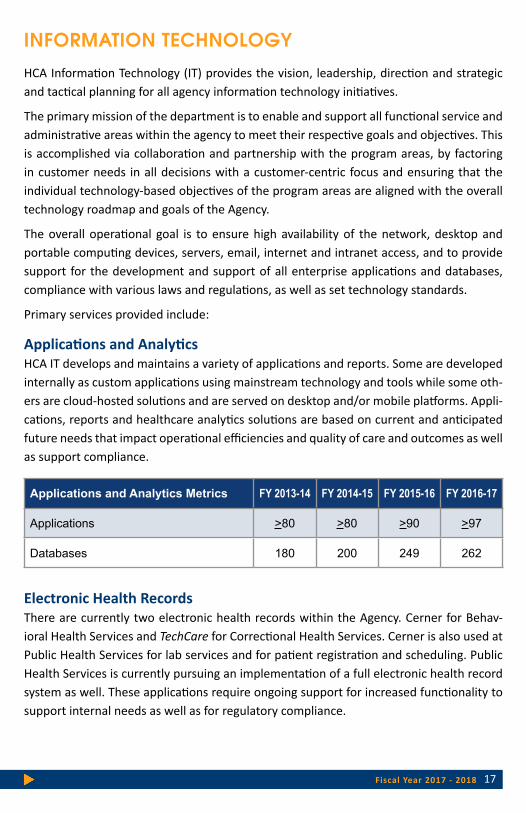
Applications and AnalyticsHCA IT develops and maintains a variety of applications and reports. Some are developed internally as custom applications using mainstream technology and tools while some oth-ers are cloud-hosted solutions and are served on desktop and/or mobile platforms. Appli-cations, reports and healthcare analytics solutions are based on current and anticipated future needs that impact operational efficiencies and quality of care and outcomes as well as support compliance.
Electronic Health RecordsThere are currently two electronic health records within the Agency. Cerner for Behav-ioral Health Services and TechCare for Correctional Health Services. Cerner is also used at Public Health Services for lab services and for patient registration and scheduling. Public Health Services is currently pursuing an implementation of a full electronic health record system as well. These applications require ongoing support for increased functionality to support internal needs as well as for regulatory compliance.
Applications and Analytics Metrics FY 2013-14 FY 2014-15 FY 2015-16 FY 2016-17
Applications >80 >80 >90 >97
Databases 180 200 249 262

18 Administrative Services
* Benefits of such systems include:n Conversion of clinical charts from paper-based to electronic system
n Better coordination of services amongst clinical staff
n Better treatment outcomes for clients/patients
n Increased client/patient engagement
n Compliance with federal mandates including HIPAA, Meaningful Use, Privacy and Security
n Internal efficiencies and error reduction
n Use of standardized models of service delivery across the programs
n More effective partnerships with other provider organizations
Field and Service DeskThe HCA Service Desk is the central point of contact for reporting, tracking and escalating all computer related incidents impacting HCA’s internal and external customers. This unit is available from 7 a.m. – 5 p.m., Monday – Friday. After hours support is also available from 5 p.m. – 7 a.m., including Saturdays and Sundays.
The Field Support group provides hardware and software support for all HCA employees and contractors, as well as maintenance and repair of printers, scanners, iPads, iPhones and other computer peripherals. On-site services are provided at all Agency and certain non-Agency locations.
Electronic Health Records Metrics FY 2013-14 FY 2014-15 FY 2015-16 FY 2016-17
Medi-Cal claims processed per year > $60M > $60M > $60M > $60M
Number of patients and clients within system served since implementation > 3M > 3M > 3M > 3M
Application availability uptime 98% 98% 99.6% 99.2%
Average number of system* users per day 600 600 700 800

19Fiscal Year 2017 - 2018
Network ManagementThe Network Services team coordinates the management of the internal HCA network and related components with Orange County Information Technology (OCIT) and an ex-ternal managed-services vendor. These services, over which oversight is provided, include network life cycle management, network problem management, network traffic moni-toring, internet access, application availability, remote access and management of the network backbone providing digital connectivity for voice, data and video transmission.
Network SecurityThe HCA IT Security Services team is committed to providing a secure environment to meet the needs of the Agency. The team develops, recommends, and enforces the securi-ty strategic direction, policy, procedures, standards and solutions to protect HCA informa-tion systems from damage resulting from failures of confidentiality, integrity or availabili-ty. It applies solutions and resources to deter, monitor, report, audit, and prevent failures resulting from known and unknown threats and vulnerabilities.
Network Security Metric FY 2013-14 FY 2014-15 FY 2015-16 FY 2016-17
Average number of electronic threats blocked per month 2,355 3,740 *4,490 *7,024
* Average number of electronic threats per month is increasing each fiscal year and trend is expected to continue in the future.
Field and Service Desk Metrics FY 2013-14 FY 2014-15 FY 2015-16 FY 2016-17Ratio of field technicians to County employees 419:1 442:1 437:1 471:1
Number of supported office locations 62 *74 68 64Number of personal computers supported 2,503 2,663 2,622 2,653
Number of mobile devices supported 874 902 988 1,037Number of printers supported 562 358 556 570Average number of customers supported per month 2,515 2,656 2,795 2,830
Average number of service desk call received per month 2,776 2,589 3,001 2,885
Average service desk calls resolved on the first call per month 70% 67% 68% 69%
* Correction to data included in FY 2014-15 Annual Report from 118 to 74.
Network Management Metric FY 2013-14 FY 2014-15 FY 2015-16 FY 2016-17
Network infrastructure uptime* average 98% 98% 98% 98%
* A measure of network service operational time

20 Administrative Services
Network and Server ManagementAn extensive number of servers are necessary to support the applications and databases. These are used to support systems in use as well as development and testing activities. There is a core set of individuals charged with building and managing servers. In addition, HCA IT also manages the mobile telecommunication devices and service plans.
Project Management OfficeThe HCA Project Management service provides customers with experienced IT project managers and business analysts to assist in and/or lead HCA IT projects. Creative and industry standard project management methodologies based on proven best practices are used, depending on the type of project and desired outcomes. The project managers tailor the methods used to fit the needs of each HCA IT project. The goal is to pragmat-ically meet the needs of each type of project without sacrificing HCA’s commitment to consistency and quality.
Significant projects and service functions that support the overall vision:n Collaborate closely with the business units and promote selection and adoption of appro-
priate technology solutions and innovations to achieve all necessary goals and objectivesn Electronic Health Records system implementation and support across all program areasn Assistance and leadership in the selection and implementation of all future
applications n Continuous monitoring of the network and applications for compliance with federal
mandates and risk managementn Provide daily proactive internet-based threat monitoring and Agency network pro-
tection servicesn Provide timely support for all hardware and software issues for Agency staffn Provide training support and technology consulting services
Project Management Metrics FY 2013-14 FY 2014-15 FY 2015-16 FY 2016-17Number of approved enterprise projects on average per year 6 9 10 10
Number of additional ad hoc projects that occur in an average year 10 10 5 9
Network Server Metrics FY 2013-14 FY 2014-15 FY 2015-16 FY 2016-17
Number of servers managed > 300 > 300 > 300 > 328
Total data storage space utilized (Terabytes) > 150 > 200 > 200 < 290
21Fiscal Year 2017 - 2018
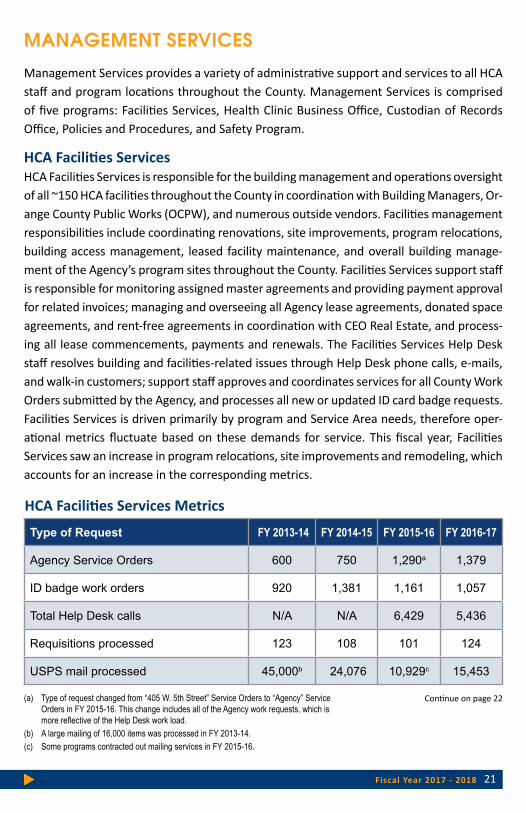
MANAGEMENT SERVICES
Management Services provides a variety of administrative support and services to all HCA staff and program locations throughout the County. Management Services is comprised of five programs: Facilities Services, Health Clinic Business Office, Custodian of Records Office, Policies and Procedures, and Safety Program.
HCA Facilities Services HCA Facilities Services is responsible for the building management and operations oversight of all ~150 HCA facilities throughout the County in coordination with Building Managers, Or-ange County Public Works (OCPW), and numerous outside vendors. Facilities management responsibilities include coordinating renovations, site improvements, program relocations, building access management, leased facility maintenance, and overall building manage-ment of the Agency’s program sites throughout the County. Facilities Services support staff is responsible for monitoring assigned master agreements and providing payment approval for related invoices; managing and overseeing all Agency lease agreements, donated space agreements, and rent-free agreements in coordination with CEO Real Estate, and process-ing all lease commencements, payments and renewals. The Facilities Services Help Desk staff resolves building and facilities-related issues through Help Desk phone calls, e-mails, and walk-in customers; support staff approves and coordinates services for all County Work Orders submitted by the Agency, and processes all new or updated ID card badge requests. Facilities Services is driven primarily by program and Service Area needs, therefore oper-ational metrics fluctuate based on these demands for service. This fiscal year, Facilities Services saw an increase in program relocations, site improvements and remodeling, which accounts for an increase in the corresponding metrics.
HCA Facilities Services Metrics
Type of Request FY 2013-14 FY 2014-15 FY 2015-16 FY 2016-17
Agency Service Orders 600 750 1,290a 1,379
ID badge work orders 920 1,381 1,161 1,057
Total Help Desk calls N/A N/A 6,429 5,436
Requisitions processed 123 108 101 124
USPS mail processed 45,000b 24,076 10,929c 15,453
Continue on page 22(a) Type of request changed from “405 W. 5th Street” Service Orders to “Agency” Service Orders in FY 2015-16. This change includes all of the Agency work requests, which is more reflective of the Help Desk work load.
(b) A large mailing of 16,000 items was processed in FY 2013-14.(c) Some programs contracted out mailing services in FY 2015-16.
22 Administrative Services
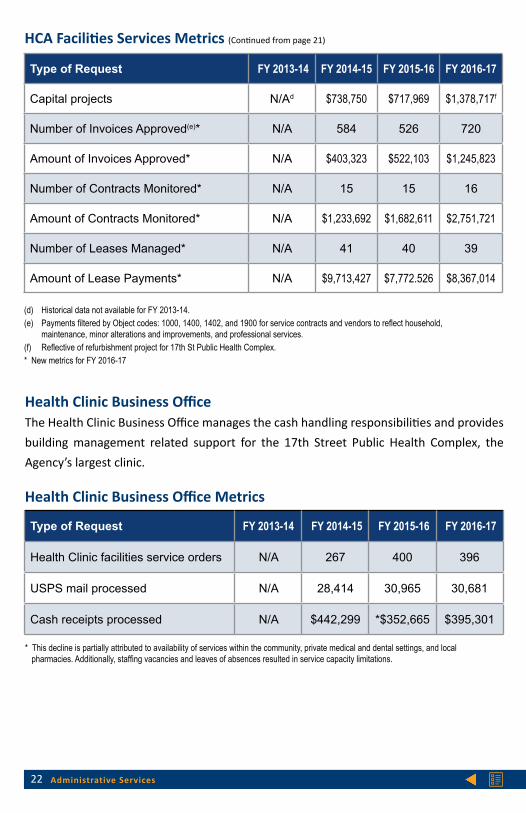
Health Clinic Business Office The Health Clinic Business Office manages the cash handling responsibilities and provides building management related support for the 17th Street Public Health Complex, the Agency’s largest clinic.
Health Clinic Business Office Metrics
Type of Request FY 2013-14 FY 2014-15 FY 2015-16 FY 2016-17
Health Clinic facilities service orders N/A 267 400 396
USPS mail processed N/A 28,414 30,965 30,681
Cash receipts processed N/A $442,299 *$352,665 $395,301
* This decline is partially attributed to availability of services within the community, private medical and dental settings, and local pharmacies. Additionally, staffing vacancies and leaves of absences resulted in service capacity limitations.
HCA Facilities Services Metrics (Continued from page 21)
Type of Request FY 2013-14 FY 2014-15 FY 2015-16 FY 2016-17
Capital projects N/Ad $738,750 $717,969 $1,378,717f
Number of Invoices Approved(e)* N/A 584 526 720
Amount of Invoices Approved* N/A $403,323 $522,103 $1,245,823
Number of Contracts Monitored* N/A 15 15 16
Amount of Contracts Monitored* N/A $1,233,692 $1,682,611 $2,751,721
Number of Leases Managed* N/A 41 40 39
Amount of Lease Payments* N/A $9,713,427 $7,772.526 $8,367,014
(d) Historical data not available for FY 2013-14. (e) Payments filtered by Object codes: 1000, 1400, 1402, and 1900 for service contracts and vendors to reflect household,
maintenance, minor alterations and improvements, and professional services.(f) Reflective of refurbishment project for 17th St Public Health Complex.* New metrics for FY 2016-17
23Fiscal Year 2017 - 2018
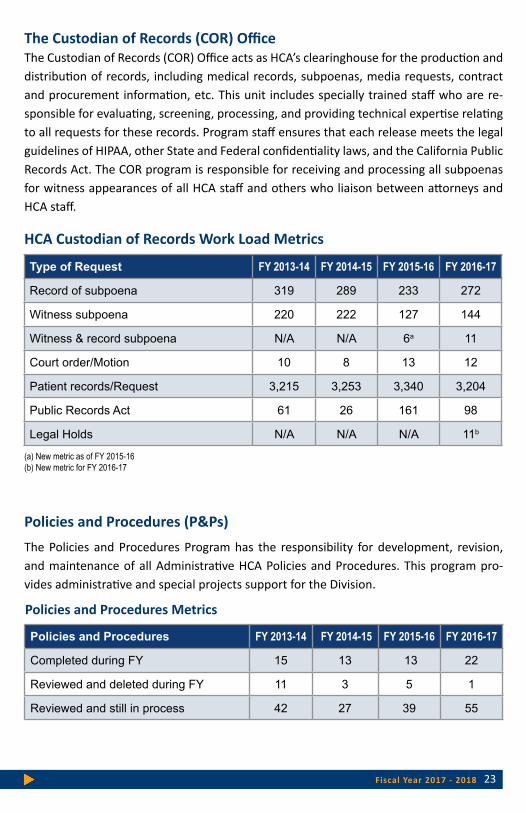
The Custodian of Records (COR) OfficeThe Custodian of Records (COR) Office acts as HCA’s clearinghouse for the production and distribution of records, including medical records, subpoenas, media requests, contract and procurement information, etc. This unit includes specially trained staff who are re-sponsible for evaluating, screening, processing, and providing technical expertise relating to all requests for these records. Program staff ensures that each release meets the legal guidelines of HIPAA, other State and Federal confidentiality laws, and the California Public Records Act. The COR program is responsible for receiving and processing all subpoenas for witness appearances of all HCA staff and others who liaison between attorneys and HCA staff.
Policies and Procedures (P&Ps)The Policies and Procedures Program has the responsibility for development, revision, and maintenance of all Administrative HCA Policies and Procedures. This program pro-vides administrative and special projects support for the Division.
HCA Custodian of Records Work Load Metrics
Type of Request FY 2013-14 FY 2014-15 FY 2015-16 FY 2016-17
Record of subpoena 319 289 233 272
Witness subpoena 220 222 127 144
Witness & record subpoena N/A N/A 6a 11
Court order/Motion 10 8 13 12
Patient records/Request 3,215 3,253 3,340 3,204
Public Records Act 61 26 161 98
Legal Holds N/A N/A N/A 11b
(a) New metric as of FY 2015-16(b) New metric for FY 2016-17
Policies and Procedures Metrics
Policies and Procedures FY 2013-14 FY 2014-15 FY 2015-16 FY 2016-17
Completed during FY 15 13 13 22
Reviewed and deleted during FY 11 3 5 1
Reviewed and still in process 42 27 39 55

24 Administrative Services
HCA Safety Program Evaluation & Inspection Metrics
Type of Request FY 2013-14 FY 2014-15 FY 2015-16 FY 2016-17
Facility safety inspections (annual and quarterly) *284 296 276 251
Special Incident Reports Processed 454 494 580 549
Hazard Assessments 143 162 147 124
Review of Cal/OSHA Logs 141 162 151 124
Review of Hazardous Chemical Logs 141 162 136 131
Ergonomic Evaluations and Consultations 60 58 63 200
Complaint Investigations 4 22 3 15
* Data in FY 2013-14 Annual Report corrected from 765 to 284 due to error in data collection.
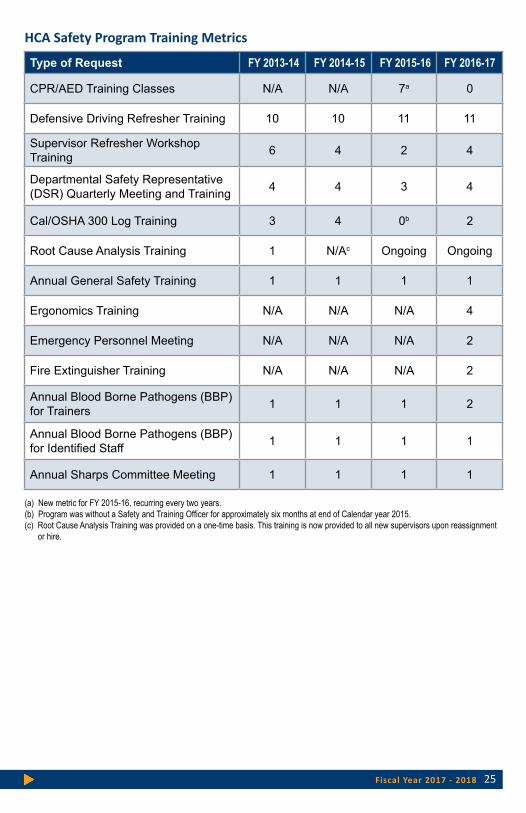
HCA Safety Program The HCA Safety Program administers the Agency’s Injury and Illness Prevention Program, led by a CEO-Risk Management Safety and Training Officer (STO), out stationed at HCA. The HCA Safety Program coordinates with over 100 Departmental Safety Representa-tives (DSRs) at nearly 200 HCA program sites. The program has the responsibility for the well-being and training of more than 2,600 employees and ensures the Agency remains compliant with all applicable Cal/OSHA rules and regulations. Data associated with site and program locations show decreases this Fiscal Year, related to the consolidation of some program locations and activities. The increase in ergonomic evaluations and con-sultations this FY is a result of a more proactive, educational approach and staff aware-ness of ergonomics and assessment availability.
25Fiscal Year 2017 - 2018
HCA Safety Program Training Metrics
Type of Request FY 2013-14 FY 2014-15 FY 2015-16 FY 2016-17
CPR/AED Training Classes N/A N/A 7a 0
Defensive Driving Refresher Training 10 10 11 11
Supervisor Refresher Workshop Training 6 4 2 4
Departmental Safety Representative (DSR) Quarterly Meeting and Training 4 4 3 4
Cal/OSHA 300 Log Training 3 4 0b 2
Root Cause Analysis Training 1 N/Ac Ongoing Ongoing
Annual General Safety Training 1 1 1 1
Ergonomics Training N/A N/A N/A 4
Emergency Personnel Meeting N/A N/A N/A 2
Fire Extinguisher Training N/A N/A N/A 2
Annual Blood Borne Pathogens (BBP) for Trainers 1 1 1 2
Annual Blood Borne Pathogens (BBP) for Identified Staff 1 1 1 1
Annual Sharps Committee Meeting 1 1 1 1
(a) New metric for FY 2015-16, recurring every two years.(b) Program was without a Safety and Training Officer for approximately six months at end of Calendar year 2015.(c) Root Cause Analysis Training was provided on a one-time basis. This training is now provided to all new supervisors upon reassignment
or hire.

26 Administrative Services
PURCHASING SERVICES
HCA Purchasing Services is a high volume procurement division that provides quality ad-ministrative support to approximately 2,600 agency employees. The division is responsible for managing all non-human service related purchasing and procurement requests, and is responsible for the oversight and monitoring of capital and controlled assets, surplus system, warehouse management, Cal-Card and Petty Cash system for the Department. The division purchases materials, supplies, furnishings, equipment and services needed for the agency to perform its business functions, and it oversees the multi-tiered master agreement monitoring system with 348 contracts, in addition to the external and single contract audit function, and self-audit functions specific to the activities of procurement and administration.
This 18-member unit of procurement professionals is one of the largest in the County. Last year, this unit processed 4,231 Requisitions (RQL’s/OC Expediter), 244 Purchase Orders and 348 Master Agreements, which totaled over $48 million dollars in expenses, and en-cumbered over $31 million dollars in Delivery Orders (DO’s).
HCA Purchasing of Procurement Services Metrics
Type of Request (Including Dos)
FY 2013-14 FY 2014-15 FY 2015-16 FY 2016-17
Total No.
Total Amount
Total No.
Total Amount
Total No.
Total Amount
Total No.
Total Amount
Master Agreements (MA’s) 243 $26,533,431 231 $27,225,41 314 $33,504,733 348 $40,930,187
Contracts (CT’s) 50 $554,460 51 $276,895 79 $818,102 66 $927,531
Purchase Orders (PO’s) 265 $2,628,291 240 $2,542,225 194 $2,248,730 224 $2,494,157
P Cal Card – transactions N/A N/A 1,901 $688,471 1,959 $764,123 1,415 $649,150
Travel Cal Card – transactions *1,525 $412,687.02 1,781 $392,212 1,545 $443,146 531 $396,496
Petty Cash – transactions 388 $105,482 347 $100,404 271 $77,935 225 $78,675
Requisitions (RQL’s/OC Expediter)
5,757 $39,739,316 6,112 $46,561,475 6,492 $52,583,919 **4,231 $48,237,853
Delivery Orders (DO’s) 558 $19,226,230 438 $17,795,226 596 $23,779,485 603 $31,204,939
* Includes travel and other purchases allowed under the program. ** Duplicate RQL/Expediter numbers excluded.

27Fiscal Year 2017 - 2018
Administrative costs are distributed to the budget unit level within HCA each month. This allows the Agency to more accurately identify the full/actual cost of administering programs, recover some administrative costs through specific grants or allocations, and recover some administrative costs through fee or rate calculations.
Administrative Services is continuing prudent fiscal management to maximize cost savings without compromising service delivery for HCA programs. Expenditures allo-cated out to HCA programs related to Agency Administration* for the past five completed fiscal years were:
*These expenditures include: n Compliance Officen Contract Servicesn Director’s Office (includes Auditor-Controller and Human Resource Services)n Financial Servicesn Health Policy n Information Technologyn Management Servicesn Purchasing Services
Administrative Services Budget
28 Administrative Services
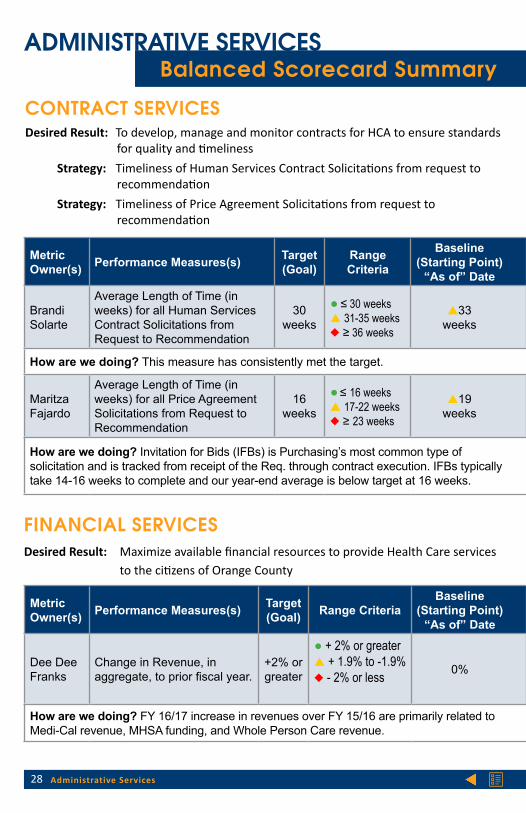
FINANCIAL SERVICESDesired Result: Maximize available financial resources to provide Health Care services
to the citizens of Orange County
Balanced Scorecard SummaryADMINISTRATIVE SERVICES
Metric Owner(s) Performance Measures(s) Target
(Goal)Range Criteria
Baseline (Starting Point)
“As of” Date
FY 2010-11Results
FY 2011-12 Results
FY 2012-13 Results
FY 2013-14Results
FY 2014-15Results
FY 2015-16Results
FY 2016-17Results
Brandi Solarte
Average Length of Time (in weeks) for all Human Services Contract Solicitations from Request to Recommendation
30 weeks
● ≤ 30 weekss 31-35 weeksu ≥ 36 weeks
s33 weeks
s32 weeks
s32 weeks
●30 weeks
●27 weeks
●20 weeks
●21 weeks
●22 weeks
How are we doing? This measure has consistently met the target.
Maritza Fajardo
Average Length of Time (in weeks) for all Price Agreement Solicitations from Request to Recommendation
16 weeks
● ≤ 16 weekss 17-22 weeksu ≥ 23 weeks
s19 weeks
s18 weeks
●15 weeks
●16 weeks
●15 weeks
●15 weeks
●13 weeks
●13 weeks
How are we doing? Invitation for Bids (IFBs) is Purchasing’s most common type of solicitation and is tracked from receipt of the Req. through contract execution. IFBs typically take 14-16 weeks to complete and our year-end average is below target at 16 weeks.
Metric Owner(s) Performance Measures(s) Target
(Goal) Range CriteriaBaseline
(Starting Point) “As of” Date
FY 2010-11Results
FY 2011-12 Results
FY 2012-13 Results
FY 2013-14Results
FY 2014-15Results
FY 2015-16Results
FY 2016-17Results
Dee Dee Franks
Change in Revenue, in aggregate, to prior fiscal year.
+2% or greater
● + 2% or greaters + 1.9% to -1.9%u - 2% or less 0%
●5%(For FY 2010-11
variance from $457,753,312)
●2%(For FY 2011-12,
variance from $481,204,781)
●13%(For FY
2012-13, variance from $491,268,101)
s-1%(For FY
2013-14, variance from $556,197,949)
u14%(For FY
2014-15, variance from $548,482,46)
s1%(For FY 2015-16 year-end, variance from $473,768,862)
●12%(For FY 2015-16 year-end, variance from $478,011,268)
How are we doing? FY 16/17 increase in revenues over FY 15/16 are primarily related to Medi-Cal revenue, MHSA funding, and Whole Person Care revenue.
CONTRACT SERVICES Desired Result: To develop, manage and monitor contracts for HCA to ensure standards
for quality and timeliness Strategy: Timeliness of Human Services Contract Solicitations from request to
recommendation Strategy: Timeliness of Price Agreement Solicitations from request to
recommendation

29Fiscal Year 2017 - 2018
Balanced Scorecard Summary
Implementing Balanced Scorecard performance measures allows Administrative Services to monitor our activities, increase transparency, accountability and evaluate our service delivery. We will continue to evaluate new business practices and strategies with the aim to exceed all our performance objectives and provide high-quality services.
Balanced Scorecard Categories:● = meets or exceeds target s = near target u = below target
Metric Owner(s) Performance Measures(s) Target
(Goal)Range Criteria
Baseline (Starting Point)
“As of” Date
FY 2010-11Results
FY 2011-12 Results
FY 2012-13 Results
FY 2013-14Results
FY 2014-15Results
FY 2015-16Results
FY 2016-17Results
Brandi Solarte
Average Length of Time (in weeks) for all Human Services Contract Solicitations from Request to Recommendation
30 weeks
● ≤ 30 weekss 31-35 weeksu ≥ 36 weeks
s33 weeks
s32 weeks
s32 weeks
●30 weeks
●27 weeks
●20 weeks
●21 weeks
●22 weeks
How are we doing? This measure has consistently met the target.
Maritza Fajardo
Average Length of Time (in weeks) for all Price Agreement Solicitations from Request to Recommendation
16 weeks
● ≤ 16 weekss 17-22 weeksu ≥ 23 weeks
s19 weeks
s18 weeks
●15 weeks
●16 weeks
●15 weeks
●15 weeks
●13 weeks
●13 weeks
How are we doing? Invitation for Bids (IFBs) is Purchasing’s most common type of solicitation and is tracked from receipt of the Req. through contract execution. IFBs typically take 14-16 weeks to complete and our year-end average is below target at 16 weeks.
Metric Owner(s) Performance Measures(s) Target
(Goal) Range CriteriaBaseline
(Starting Point) “As of” Date
FY 2010-11Results
FY 2011-12 Results
FY 2012-13 Results
FY 2013-14Results
FY 2014-15Results
FY 2015-16Results
FY 2016-17Results
Dee Dee Franks
Change in Revenue, in aggregate, to prior fiscal year.
+2% or greater
● + 2% or greaters + 1.9% to -1.9%u - 2% or less 0%
●5%(For FY 2010-11
variance from $457,753,312)
●2%(For FY 2011-12,
variance from $481,204,781)
●13%(For FY
2012-13, variance from $491,268,101)
s-1%(For FY
2013-14, variance from $556,197,949)
u14%(For FY
2014-15, variance from $548,482,46)
s1%(For FY 2015-16 year-end, variance from $473,768,862)
●12%(For FY 2015-16 year-end, variance from $478,011,268)
How are we doing? FY 16/17 increase in revenues over FY 15/16 are primarily related to Medi-Cal revenue, MHSA funding, and Whole Person Care revenue.
Strategy: Change in revenue, in aggregate, to prior fiscal year

30 Administrative Services
HUMAN RESOURCE SERVICESDesired Result: To recruit, hire and retain a high-performing workforce for HCA that is properly classified
Metric Owner(s) Performance Measures(s) Target
(Goal)Range Criteria
Baseline (Starting Point)
“As of” Date
FY 2010-11Results
FY 2011-12 Results
FY 2012-13 Results
FY 2013-14Results
FY 2014-15Results
FY 2015-16Results
FY 2016-17Results
Jennifer Canzoneri
Average Time to Hire(Based on timeframe from the date of requisition to date of hire. For positions requiring a Sheriff’s Dept. background screening, the screening process timeframe will be deducted from the Time to Hire timeframe)
91 days
● ≤ 90 dayss 91-120 daysu ≥ 120 days
s 33 weeks
New Measure Added
FY 2013
New Measure Added
FY 2013
New Measure Added
FY 2013
s102 Days
u189 Days
u140 Days
u144 Days
Average Time to Complete Reallocation Requests(Based on timeframe from the date the reallocation request is received in HCA HRS to the date a final decision has been rendered.)
60 Days
● ≤ 60 dayss 61-90 daysu ≥ 90 days
New Measure Added
FY 2013
New Measure Added
FY 2013
New Measure Added
FY 2013
New Measure Added
FY 2013
●54 Days
s65 Days
●56 Days
●44 Days
How are we doing? HRS implemented several strategies in June 2017 to reduce the time to hire.
First, we reduced the overall recruitment timeline for a standard recruitment to 8 weeks. Secondly, since the majority of the vacancies can be filled from existing eligible lists we are increasing recruitment staffing support to focus solely on processing referrals and job offers. This will allow recruiters additional time to conduct recruitments. We are reviewing and streamlining additional procedures that slow down the process such as assessments, background, sanction screening and selection interviews.
INFORMATION TECHNOLOGYDesired Result: To design, implement, manage and support Information Technologies
that maximize service efficiencies and ensure service continuity.
Metric Owner(s) Performance Measures(s) Target
(Goal)Range Criteria
Baseline (Starting Point)
“As of” Date
FY 2010-11Results
FY 2011-12 Results
FY 2012-13 Results
FY 2013-14Results
FY 2014-15Results
FY 2015-16Results
FY 2016-17Results
Adil Siddiqui
Total Percent of Services Requests Resolved:
1) On the first call (i.e., First Call Resolution) 70%
● 70-100%s 50-69%u <50%
s 63% s 63% s 67% s 67% ● 71% s 67% s 68% s 69%
2) One Business Day 70%● 70-100%s 50-69%u <50%
s 60% ● 80% ● 85% ● 84% ● 82% ● 80% ● 78% ● 76%
3) Two Business Days 78%● 78-100%s 58-77%u <58%
s 68% ● 87% ● 92% ● 91% ● 89% ● 87% ● 85% ● 82%
4) One Business Week 97%● 97-100%s 91-96%u <91%
s 94% s 95% ● 97% ● 97% s 95% s 94% s 93% s 91%
How are we doing? Two of the four IT outcomes measures have continued to meet target. Total percentage of service request resolved on the first call and one business week is close to meeting target.

31Fiscal Year 2017 - 2018
Strategy: Average Time to HireStrategy: Average Time to Complete Reallocation Requests
Metric Owner(s) Performance Measures(s) Target
(Goal)Range Criteria
Baseline (Starting Point)
“As of” Date
FY 2010-11Results
FY 2011-12 Results
FY 2012-13 Results
FY 2013-14Results
FY 2014-15Results
FY 2015-16Results
FY 2016-17Results
Jennifer Canzoneri
Average Time to Hire(Based on timeframe from the date of requisition to date of hire. For positions requiring a Sheriff’s Dept. background screening, the screening process timeframe will be deducted from the Time to Hire timeframe)
91 days
● ≤ 90 dayss 91-120 daysu ≥ 120 days
s 33 weeks
New Measure Added
FY 2013
New Measure Added
FY 2013
New Measure Added
FY 2013
s102 Days
u189 Days
u140 Days
u144 Days
Average Time to Complete Reallocation Requests(Based on timeframe from the date the reallocation request is received in HCA HRS to the date a final decision has been rendered.)
60 Days
● ≤ 60 dayss 61-90 daysu ≥ 90 days
New Measure Added
FY 2013
New Measure Added
FY 2013
New Measure Added
FY 2013
New Measure Added
FY 2013
●54 Days
s65 Days
●56 Days
●44 Days
How are we doing? HRS implemented several strategies in June 2017 to reduce the time to hire.
First, we reduced the overall recruitment timeline for a standard recruitment to 8 weeks. Secondly, since the majority of the vacancies can be filled from existing eligible lists we are increasing recruitment staffing support to focus solely on processing referrals and job offers. This will allow recruiters additional time to conduct recruitments. We are reviewing and streamlining additional procedures that slow down the process such as assessments, background, sanction screening and selection interviews.
Strategy: Percent of the time HCA network is online
Metric Owner(s) Performance Measures(s) Target
(Goal)Range Criteria
Baseline (Starting Point)
“As of” Date
FY 2010-11Results
FY 2011-12 Results
FY 2012-13 Results
FY 2013-14Results
FY 2014-15Results
FY 2015-16Results
FY 2016-17Results
Adil Siddiqui
Total Percent of Services Requests Resolved:
1) On the first call (i.e., First Call Resolution) 70%
● 70-100%s 50-69%u <50%
s 63% s 63% s 67% s 67% ● 71% s 67% s 68% s 69%
2) One Business Day 70%● 70-100%s 50-69%u <50%
s 60% ● 80% ● 85% ● 84% ● 82% ● 80% ● 78% ● 76%
3) Two Business Days 78%● 78-100%s 58-77%u <58%
s 68% ● 87% ● 92% ● 91% ● 89% ● 87% ● 85% ● 82%
4) One Business Week 97%● 97-100%s 91-96%u <91%
s 94% s 95% ● 97% ● 97% s 95% s 94% s 93% s 91%
How are we doing? Two of the four IT outcomes measures have continued to meet target. Total percentage of service request resolved on the first call and one business week is close to meeting target.

32 Administrative Services
Goals for FY 2017-18Implement the HCA/LMC employee engagement initiative recommendations
n Update all Contract Services Division and Purchasing Services Division policies and procedures
n Complete and design the implementation of the new Cerner server architecture
n Develop agency-wide training on purchasing basics including the 2017 Contract Policy Manual updates
n Develop and implement employee training on the Travel Request Process
n Evaluate implementation of an electronic risk management program
FY 2016-17 Goals and Completion Status:
Goal Status
Teambuilding for Administrative Services Ongoing
Succession planning for Administrative Services management positions Ongoing
Creation of a Business Continuity Plan and Governance Structure, in partnership with Regulatory/Medical Health Services
Governance structure was established and the plan will be tested and implemented by end of 2017
Expansion of the use of Electronic Health Records to Public Health Services Completed
Network compromise assessment to identify and remove any risks and vulnerabilities within our network
Completed
Identification of training opportunities to implement outreach and training that will help improve Custodian of Records requests
Completed
Automate special incident report Final testing being completed.
Goals for FY 2017-18ADMINISTRATIVE SERVICES

Goals for FY 2017-18

Orange County Health Care AgencyAdministrative Services
405 W. 5th StreetSanta Ana, CA 92701
Direct: (714) 834-5150 Fax: (714) 834-5506 Web: ochealthinfo.com