Administering SAP R3 FICO Modules
608
Administering SAP R/3: The Fi-Financial Accounting & Co-Controlling Modules ASAP World Consultancy (Author), Bernard Dodd (Author),Jonathan Blain (Author)
-
Upload
pramila-nagaraj -
Category
Documents
-
view
271 -
download
7
description
Administering SAP R3 FICO Modules
Transcript of Administering SAP R3 FICO Modules
Administering SAP R/3: The Fi-Financial
Accounting & Co-Controlling Modules ASAP World Consultancy (Author), Bernard Dodd (Author),Jonathan Blain (Author)
Administering SAP R/3: The FI-Financial Accounting and CO-Controlling Modules
PART I—Preparing the Public Accounts
Chapter 1—Reviewing the Processes of Accounting in SAP R/3
Outlining This Book
Appreciating Developments in Financial Accounting
Rendering the External Accounts
Using Subsidiary Accounts
Using Client*
Using Company Codes
Using Business Areas
Using Profit Centers
Using Cost Accounting Areas
Using Distributed Accounting Systems
Using Costing and Revenue Element Accounting
Using Cost Centers
Using Orders
Using Projects
Using the Reconciliation Ledger
Using Special Purpose Ledger Accounting
Using Parallel Costing Systems
Comparing Cost Accounting Methods
Accounting for Forward Commitments and Prospects of Revenue
Understanding Treasury and Financing
Using Cash Management
Using Treasury Planning and Active Treasury Management
Using Funds Management
Using Investment Management
Understanding Controlling
Planning and Controlling the Enterprise Business
Chapter 2—Understanding the General Ledger
Understanding SAP Accounting
Understanding the Principles of SAP R/3 General Ledger Accounting
Using the Extended General Ledger Concept
Using the Chart of Accounts
Using Account Classes
Using Internal Controlling Account Classes
Understanding General Ledger Account Master Data Areas
Using the Chart of Accounts Area
Using Company Code Area
Creating Charts of Accounts
Maintaining General Ledger Master Data
Checking the Data
Implementing GL Financial Accounting
Using the FI-GL General Ledger Module
Integrating Accounting Through the General Ledger
Identifying the Two Primary Functions of the General Ledger
Using Special General Ledger Transactions
Performing Year-End Closing
Understanding Complex Organizations and the Chart of Accounts
Understanding International Taxation
Using Standard Taxation Functions
Using Country-Specific Taxation Requirements
Using Intercompany Accounting
Using Intercompany Expense and Revenue Postings
Paying for Intercompany Purchases
Using Cash Receipt for Two or More Company Codes
Using Head Office and Branch Accounts
Making Vendor Payments to an Alternative Recipient
Making Intercompany Payments
Eliminating Intercompany Payables and Receivables
Dealing with Language Differences
Defining Currency
Using Currencies in Transactions
Dealing with Currency Exchange Differences
Specifying Rules for Administering General Ledger Accounts
Using Daily Journals and Interim Statements
Performing Year-End Closing Tasks
Planning in the General Ledger
Using the FI-SL Special Purpose Ledger
Using the FI-GLX Standalone Special Purpose Ledger
Planning in the FI-SL Special Purpose Ledger
Enabling Functionalities with the Special Purpose Ledger
Specifying Inflow of Data to the Special Purpose Ledger
Making an Assessment in the Special Purpose Ledger
Using Distribution in the Special Purpose Ledger
Using the Set Concept
Using Planned Amounts in the Special Purpose Ledger
Planning Perspectives
Posting Technique in the General Ledger
Understanding Origins of General Ledger Postings
Understanding the Relationship of Subledgers to the General Ledger
Understanding Data Entry Techniques
Closing the General Ledger During the Fiscal Year
Reporting at Closing
Using Standard Reports Available at Closing
Using Report Writer and Report Painter for Custom Reporting
Understanding Report Output Media
Understanding Financial Statement Report Formats
Reporting Operational Control Data at Closing
Understanding Balance Sheet Reporting Principles
Using the Financial Document Interface
Using the Financial Information System
Analyzing a Balance Sheet
Using Balance Sheet Key Figure Reports
Understanding Reporting Options
Taking Advantage of the FI-SL Functions
Using Direct Data Entry to Special Purpose Ledgers
Using Standalone Special Purpose Ledger Systems
Using Allocation in Special Purpose Ledgers
Distributing Costs
Using the Set Concept in Ledger Processing
Planning in the Special Purpose Ledgers
Using General Planning Parameters in FI-SL
Using Distribution Keys
Understanding the Scope of Special Purpose Ledger Planning
Reporting from the Special Purpose Ledgers
Using Workflow with the Financial Calendar
Chapter 3—Using Subledger Accounts
Understanding Ledgers and Accounting
Understanding Accounts Receivable
Using the Customer Master Record
Making Sales to an Affiliated Company
Processing Master Data Records
Using One-Time Accounts
Using Customer Head Office and Branch Accounts
Receiving Payments from an Alternate Payer
Understanding Customer Transactions in Accounts Receivable
Handling Recurring Entries
Using Invoice and Credit Memo Entry Tools
Using Entry Currencies
Dealing with Currency Exchange Differences
Processing Incoming Payments
Understanding the Basic Procedure for Receiving Payments
Searching for Invoices to Be Cleared
Searching for Open Items
Dealing with Open Items
Using Automatic Clearing in Accounts Receivable
Using Payment Procedures for Particular Countries
Receiving Partial Payments
Understanding the Payment Advice Note Procedure
Understanding the Debit Memo Procedure
Using Fast Incoming Payment Entry Techniques
Using Automatic Electronic Banking
Using Electronic Account Statements
Using Special Transactions in Accounts Receivable
Using Down Payments
Using Bills of Exchange Receivables
Using the Bills of Exchange Discount Ledger
Using Security Deposits and Guarantees
Understanding Document and Account Processing
Understanding Item Display in Accounts Receivable
Changing Documents Already Posted
Dunning Accounts Receivable
Using Automatic Correspondence from Accounts Receivable
Sending Automatic Payment Notices to Business Partners
Using Account Statements and Open Item Lists
Using Standard and Individual Letters
Using Other Types of Automatic Correspondence
Reporting Customer Accounts
Managing Customer Credit
Using Credit Limit Displays
Creating a Credit Master Sheet
Using the Accounts Payable Module
Understanding the Business Functions of Accounts Payable
Complying with GAAP
Working with Vendor Master Records
Creating and Maintaining Vendor Master Records
Using One-Time Transaction Accounts
Using Vendor Head Office and Branch Accounts
Sending Vendor Payments to an Affiliate
Understanding Transactions in Accounts Payable
Using Vendor Invoices
Using Electronic Data Interchange
Scanning Invoices
Supporting Manual Invoice Entry
Handling Recurring Entries
Using Account Assignment Models
Using Control Totals and Checks for Duplication
Working with Incomplete and Preliminary Documents
Using Centralized Open Items
Understanding the Net Posting Procedure
Using Credit and Debit Memos
Dealing with Down Payment Requests
Using Automatic Payment Functions
Editing a Payment Proposal
Maximizing Cash Discounts
Controlling the Payment Program
Receiving Intercompany Payments
Clearing Sales Contra Purchases by Offsets
Using Reverse Documents
Managing Data Media
Managing Checks
Chapter 4—Accounting for Assets
Defining Assets
Structuring Asset Records in Financial Accounting
Understanding the Hierarchical Classification of Assets
Identifying Assets
Developing Asset Classes
Using Asset Classes to Manage Different Types of Assets
Understanding Asset Class Master Records and the Asset Class Catalog
Using Asset Master Records
Using Group Assets and Super-numbers
Using Asset Line Items
Using Asset History Reporting
Maintaining Asset Master Data
Using Asset Master Record Elements
Controlling Asset Class Screens
Understanding Asset Master Maintenance Levels
Using Validation Conditions and Substitution Conditions
Creating and Viewing Asset Master Records
Identifying Time-Dependent Data
Using a Workflow to Effect Mass Changes to Asset Masters
Archiving Asset Portfolios
Using Valuation Techniques
Using Depreciation and Value Types in Asset Accounting
Understanding Other Types of Depreciation
Transferring Reserves
Using Depreciation Areas
Using the Book Depreciation Area
Using the Tax Depreciation Area
Using the Cost Accounting Depreciation Area
Using the Reporting Valuation Depreciation Area
Using the Net Asset Depreciation Area
Creating a Chart of Depreciation
Maintaining the Depreciation Area Data
Developing Derived Depreciation Areas
Applying Special Valuation to Fixed Assets
Using Investment Support Measures
Using Indexed Replacement Value Depreciation
Using Backlog Calculation of Depreciation
Using One-Time Revaluation
Using Imputed Interest in Cost Accounting Depreciation
Using Valuation for Insurance Purposes
Using Valuation of Net Assets
Simulating the Effects of Depreciation
Using Tax-Based Depreciation as Special Valuation Reserves
Using Group Valuation for Consolidation
Using Individual Special Depreciation Areas
Calculating Depreciation
Defining User-Specific Depreciation Keys
Understanding Standard Depreciation Methods in SAP R/3 FI-AA
Ending the Depreciation Calculation
Allowing for Cutoff Values and Scrap Values
Relating Depreciation to Usage
Defining Asset Accounting Periods
Handling Currencies in Depreciation Calculations
Using a Special Group Currency Depreciation Area
Applying Differentiated Capitalization Rules
Allowing for Currency and Valuation Differences
Using Parallel Currencies in the General Ledger
Simulating Depreciation for Planning Purposes
Previewing the External Rendering of Accounts
Previewing the Depreciation of Planned Investments
Simulating Asset Transactions
Representing and Displaying Depreciation Values
Displaying the Depreciation Calculation Procedure
Integrating Asset Transactions
Using Standard Business Transaction Types in FI-AA
Applying Account Allocation
Using Collective Assets
Acquiring Fixed Assets
Understanding Procedures for Acquiring Assets
Purchasing an Asset in Materials Management
Acquiring Assets Through Capital Investment Projects
Acquiring Assets Through Plant Maintenance
Using FI-AA in Isolation
Using Periodic Depreciation Posting
Using Manual Depreciation Posting
Using Write-ups to Cancel Depreciation
Retiring a Fixed Asset
Retiring an Asset to a Customer
Posting Mass Retirements
Posting Gross Value Transfers
Recording Transfers to Affiliates
Managing Assets Under Construction
Understanding Capitalization of an Asset Under Construction
Using Open Item Management
Making Down Payments for Assets Under Construction
Using R/3 FI-AA for Capital Investment Projects and Orders
Using FI-AA with CO-OPA Order and Project Accounting
Operating to Planned Cost Schedules
Using Fixed Asset Special Transactions
Using Investment Support Measures
Posting Subsequent Acquisitions
Performing Post-Capitalization Corrections
Transferring Hidden Reserves
Capitalizing Leased Assets
Reporting Assets Through the FIS
Performing Year-End Closing of Fixed Asset Accounts
Manipulating the Asset History Sheet
Maintaining a Report Selection Tree
Activating History Management
Manipulating Asset Reports
Generating Alternative Reports Interactively
Customizing Ad Hoc Reports
Developing an International Asset Management Capability
Chapter 5—Consolidating Company Accounts
Combining Financial Statements
Using the FI-LC Consolidation Module
Interfacing by Design
Reviewing the Benefits of Enterprise Consolidation Software
Using the Trading Partner Concept
Preparing for Consolidation
Standardizing Entries
Eliminating Intercompany Payables and Receivables
Preparing for Consolidation of Investments
Using What-if Versions and Forecast Simulations of Consolidation
Meeting Annual Reporting Requirements of Complex Companies
Using Special Report Designs
Reporting Interactively
Using Ratio Analysis
Using Interim Periodic Financial Statements
Understanding Options for Consolidation
Performing Positive Auditing with the SAP R/3 Auditor Workstation
Customizing the Consolidation Software
Applying Step Consolidation
Applying Management Consolidation
Consolidating with FI-SL Special Ledgers
Consolidating with the Executive Information System
Exploring Consolidation Master Data
Using the Business Area Concept
Defining the Items in a Financial Statement
Using Statistical Line Items
Understanding Methods of Consolidation
Defining Types of Companies
Performing the First Consolidation
Performing Subsequent Consolidations
Using Consolidation Reporting Subgroups
Preparing Data at the Subsidiary Level
Eliminating Intercompany Posting Transactions
Using Valuation Areas for Consolidating Fixed Assets
Transferring Data
Using Consolidation Groups
Using a PC to Enter Consolidation Data
Developing a Validation Rule Language
Changing the Balance Sheet from Local to Consolidated
Using Centralized Adjustment Postings
Using Currency Conversion for Consolidation
Eliminating Intercompany Profit and Loss
Reclassifying Capitalized Assets
Reclassifying Intercompany Profits to Inventory
Accounting for Intercompany Fixed Asset Transfers
Consolidating Investments
Using Automatic Investment Consolidation
Using Fair Value Adjustment Postings
Defining Goodwill
Using the Consolidation Report Tree
Designing Custom Consolidation Reports
Using Active Excel
Using Drill-down and Accessing Other Reports
Analyzing with Key Figures
Using Simplified Schemes in Periodic Consolidation
Using Consolidation Simulation
PART II—Planning and Controlling
Chapter 6—Controlling by Cost Management
Recognizing the Aims of Controlling
Defining Management Accounting
Reviewing the Techniques of Overhead Cost Management
Assigning the Procedures of Cost Accounting
Completing the Assessment Procedure
Performing Overhead Surcharge Calculations
Using Static Standard Costing
Using Flexible Standard Costing Based on Marginal Costs
Using Profitability Analysis
Defining Cost Objects and Cost Centers
Using Cost Objects
Defining Cost Objects
Developing Overhead Cost Management
Placing Cost Centers in a Structure
Adapting the R/3 Organizational Structure
Planning and Controlling a Business with R/3
Controlling with Job Orders
Using Projects as Control Structures
Accounting with Cost Elements
Operating Cost Element Accounting
Defining the Cost and Revenue Element
Using Cost Element Parameters
Classifying Cost Elements
Reporting on Cost Element Group Structures
Checking Posting Data in Cost Accounting
Posting to an Auxiliary or Statistical Cost Accounting Assignment
Using Imputed Costs Accruals
Imputing Costs as a Percentage Surcharge
Imputing Costs by the Planned = Actual Procedure
Imputing Costs by the Target = Actual Procedure
The Role of Imputed Cost Calculation Objects
Allowing for Price Variances
Using the Reconciliation Ledger
Implementing Cost and Profit Controlling
Applying the Controlling Area Concept
Defining Profitability Segments
Understanding the Flow of Control Data
Connecting Financial Accounting with Controlling
Understanding the Value-Adding Process and the Role of Cost Objects
Using Integrated Planning and Decision Support
Reporting in CO-Controlling
Integrating CO with R/3 Applications
Establishing Cost Center Accounting
Using CO-CCA Cost Center Accounting
Understanding Actual Costing
Understanding Cost Distribution Within CO-CCA
Understanding Assessment
Understanding Surcharge Calculations
Understanding Cost Center Planning Procedures
Posting Key Figures to Cost Centers
Transferring Data
Performing Period-End Tasks
Performing Period-End Clearing from Cost Centers
Using Cost Centers in Planning
Integrating Cost Center Plans with Other Plans
Planning Techniques with Cost Center Accounting
Developing Planner Profiles
Planning Authorization
Revaluing Plans
Transferring Planning Data from Other Systems
Integrating Internal Orders into a Plan
Planning with Cost Centers
Planning Secondary Costs
Planning Functional Dependencies
Budgeting a Cost Center
Chapter 7—Costing on the Basis of Activities
Determining the Profitability of Product Lines
Introducing Cost Object Controlling
Identifying Costing Requirements of Different Types of Companies
Understanding Make-to-Order, Make-to-Stock, and Continuous Flow Costing
Understanding Product Costing Techniques
Understanding Unit Costing
Understanding Order Costing
Assigning Costs to Cost Objects
Using Results from Costing a Cost Object
Understanding Valuation Methods
Understanding the Role of Flexible Analysis and Reporting in Product Cost
Accounting
Planning and Simulation from Unit Costing
Organizing Product Cost Controlling
Understanding Cost Object Controlling
Using Cost Objects in Different Industries
Planning Product Cost
Understanding Costing Transfer Options
Understanding Product Costing Variants
Using Target Costing
Using Current Costing by Key Dates
Viewing Product Costing Results
Using Cost Itemization
Using Manual Input for Unit Costing
Controlling by Cost Objects
Using Preliminary Costing
Using Simultaneous Costing
Using Period-End Closing for Order-Related Production
Using Period-End Closing for Sales-Order-Related Production
Calculating Overhead Surcharges
Accounting for Work in Process
Interpreting Production Variance
Understanding Standard Variance Categories
Calculating Variance Category Results
Developing Target Costs
Using Settlement
Using Cost Objects in a Hierarchy
Using Responsibility-Related Controlling
Using Product-Related Controlling
Using Activity-Based Cost Accounting
Using Activity Types and Allocation Bases
Applying Internal Activity Allocation Methods
Understanding Activity Planning and the Flow of Activities
Understanding Simulation and the Reconciliation of Activities
Using Activity-Based Cost Planning
Using Political Prices
Understanding Indirect Allocation of Costs to Non-Measurable Activities
Understanding Cost Center Variances
Charging Variances
Using Alternative Activity Rates in Parallel
Using Activities and Services Costing
Planning and Simulating the Subprocesses
Using Process Cost Rates
Using Internal Order Accounting
Integrating Order and Project Accounting with Asset Accounting
Using Planned Cost Schedules
Understanding Order Data Formats
Managing the Status of Orders
Classifying Orders by Content
Planning Orders
Using Open Items
Using Actual Cost Accounting Transactions
Settling Orders
Knowing Settlement Rules
Using Order Summary Evaluations
Using Cost of Sales Accounting
Chapter 8—Controlling by the PS-Project System
Defining Projects
Setting the Project Trajectory
Performing General Planning
Performing Detailed Planning
Coordinating Resources
Supervising Projects
Closing Projects
Using Different Project Views
Using Sales View
Using Manufacturing View
Using Materials Management View
Using Finance View
Using Controlling View
Using Capital Investment View
Using Profitability View
Using Enterprise Controlling View
Placing the PS in the Organizational Structure
Understanding How the PS Module Is Presented
Associating Structures in a Project
Establishing the Project Definition
Using Basic Data
Using Standard Work Breakdown Structures
Using Standard Networks
Identifying Production Resources
Checking Resource Availability
Planning in the PS
Using the Project Planning Board
Using Calendars
Developing Project Schedules
Using Floats and Reduction
Using Network Scheduling
Understanding Project Cost Planning
Planning Capacity Requirements
Using Capacity Leveling
Using Personnel Planning
Using Materials Planning
Using Availability Checking
Understanding Project Budgeting
Using Project Budget Management Support
Managing Budget Funds
Executing a Project
Using Activity Confirmations
Creating Orders for a Project
Performing Periodic Processing
Costing Overheads as Surcharges
Using Earned Value Analysis
Using Results Analysis
Using Balance Sheet Comparison of Costs and Revenues
Using Settlements
Billing
Using Resource-Related Billing
Using the Project Information System
Using PS Information System Reporting
Viewing the Structure and Dates of a Project
Exploring Portfolio Graphics for Project Status Analysis
Chapter 9—Analyzing Profitability
Introducing the SAP R/3 Profitability Analysis Module
Calculating and Analyzing Profitability
Using Standard Costs with Cost-of-Sales Accounting (Interim Reports)
Using Fixed Cost Absorption Accounting
Distinguishing the Sources of Profit
Defining a Cost Accounting Controlling Area
Using the Processes of Profitability Analysis
Using Methods in Parallel
Using Variants of Profitability Accounting
Using Account-based Profitability Analysis
Using CO-PA and EC-PCA for Period Accounting
Identifying Profitability Segments
Understanding Integrated Data Flow
Understanding Analytic Sales and Profit Planning
Reporting from EC-PCA and CO-PA
Decentralizing Profitability Analysis
Choosing PA Classification Characteristics
Making Use of Key Figures
Planning Sales Quantities and Profits
Using Revenue Element Accounting
Estimating Revenue Elements
Developing Multiple Planning Versions
Planning the Cost of Sales
Budgeting Sales Promotions
Operating CO-PA
Calculating Gross Operating Profits
Using Valuation by Proportional Rate
Using Simple Margins Analysis
Determining the Net Operating Profit
Forecasting from Incoming Orders
Analyzing Profitability Data
Handling Large Data Volumes
Using Profit Center Accounting
Using Ledger-based Period Accounting at the Profit Center Level
Understanding the Structure of a Ledger-based Period Accounting Profitability
Report
PART III—Funding, Investment, and Development
Chapter 10—Managing the Treasury
Using the Treasury Module
Applying Cash Management
Using Cash Management Functions
Monitoring Cash Management Procedures
Managing Cash Accounts and Clearing Accounts
Linking Cash Management and Financial Accounting
Processing Payment Transactions
Banking with Electronic Facilities
Clearing Bank Accounts Automatically
Managing Liquidity
Analyzing Available Liquidity
Defining Credit Limit Control Areas
Viewing the Customer Payment History
Tracking Items
Controlling the Treasury
Using Treasury Reporting
Sharing Functions and Tools
Taking Advantage of the Data Feed Interface
Managing Market Risks
Managing and Forecasting Cash in the Medium Term
Using an Annual Cash Flow Plan
Controlling Finance
Managing Funds Through a Budget
Managing Decentralized Funds
Targeting Costs and Revenues
Checking Available Funds and Paying from Funds
Controlling Public Funds
Using the Funds Management Module
Introducing the SAP R/3 Industry Solution for the Public Sector
Using Integration with the SAP Industry Solution for Insurance
Using Integration with the SAP Industry Solution for Banks
Using Integration with SAP R/3 Investment Management
Chapter 11—Managing Investments
Controlling Investments
Managing Investments in a Corporate Group
Relating the SAP R/3 Investment Modules
Using the Investment Management Functions
Separating the Treasury Functions
Organizing Investment Data
Defining an Investment Program
Understanding Capital Investment Types
Understanding Capital Investment Program Positions
Understanding Capital Investment Measures
Analyzing Investment Proposals
Using Cost-Planning Capital Investment Programs
Using Early Depreciation Forecast and Cost Planning
Budgeting in the Capital Investment Program
Displaying the Budget Approval History
Using the Research Reporting Tool
Linking with the Executive Information System
Capitalizing Assets Directly
Using the Flat-Rate Investment Procedure
Referencing a Capitalization Structure
Linking Budgets and Fixed-Asset Masters
Updating Open Items
Using the Capital Investment Information System with Flat-Rate Budgets
Creating Assets Internally by Capital Investment Measures
Selecting the Type of Capital Investment Measure
Cost Planning and Budgeting for Capital Investment Programs
Documenting Internal Value Flows
Allocating Activity Costs Indirectly
Allocating Overhead as Surcharges on a Capital Investment Measure
Capitalizing Internal Activities
Posting Down Payments
Using Interest During the Construction Phase
Using Investment Support During the Construction Phase
Using Settlement Functions for Capital Investment Measures
Customizing Final Settlement to Fixed Assets
Reporting Internal Accounting for Capital Investment Measures
Reporting External Accounting for Capital Investment Measures
Chapter 12—Developments in Financial Management Preparing for Open FI
Developing Business on the Internet
Recognizing the Possibilities of Electronic Commerce with R/3
Developing Electronic Delivery Channels
Combining Components of Open FI
Focusing on Positive Auditing with the SAP R/3 Workstation
Networking Workflow
Using Workflow Templates
Demonstrating SAP R/3 Processes
Reducing New Product Time-to-Market
Altering a System Without Disruption
Improving a Business Continuously
Selecting Components for Electronic Commerce
Using the SAP R/3 Java User Interface
Using Business Application Programming Interfaces
Using Internet Application Components
Providing Facilities Online
Protecting Electronic Commerce
Accessing Business Partner Information
Ensuring SAP R/3 Accounting Software Certification
Accounting Worldwide
Confirming SAP R/3 Year 2000 Compliance
Developing the Open Information Warehouse
Selecting Data Sources
Creating Master Data Objects
Using the Document Management System
Mining for Significant Data
Discerning Patterns of Events
Operating with SAP R/3 Business Objects
Updating Business Objects
Drawing Upon the SAP R/3 Business Object Repository
Anticipating Internet II
Raising Standards of Business Programming
Using Electronic Commerce Partner Applications
Connecting to SAP office
Accelerating Implementation with the Business Engineer
Chapter 13—FICO Education and Training
Introducing FICO Education and Training
Identifying Learning Zones
Facing the Challenges
Points of Principle
Determining Impact on Business
Structuring a Program
Using SAP Courses
Designing In-House Courses
Managing Expectations
Developing Detailed Education and Training Plans
Appreciating the Environment
Developing Education and Training Strategy
Launching Program
Assessing Role Definition and Level of Expertise
Identifying Trainers
Defining Competencies
Developing Training Schedules
Going Live
Providing Support After Implementation
Defining Scope of Education and Training
Using Overview Courses
Using Functional Courses
Using Policy, Role, and Responsibilities
Using Walk-Throughs and Demonstrations
Implementing
Providing Post-Implementation Support
Appendix A
Appendix B
Index
Preparing the Public Accounts
2 Understanding the General Ledger
3 Using Subledger Accounts
4 Accounting for Assets
5 Consolidating Company Accounts
Chapter 1
Reviewing the Processes of Accounting in SAP R/3
In this chapter Outlining This Book
Appreciating Developments in Financial Accounting
Rendering the External Accounts
Using Costing and Revenue Element Accounting
Using Special Purpose Ledger Accounting
Using Parallel Costing Systems
Understanding Treasury and Financing
Understanding Controlling
Planning and Controlling the Enterprise Business
Outlining This Book
Traditional accounting methods have evolved into sophisticated means of keeping
track of the ways in which value is altered by the processes of work and
commerce. These methods not only have been built into the finance and control
modules of the SAP R/3, but they also have been integrated so as to yield a global
enterprise-management system capable of both discerning important events and
trends and taking timely action to deal with problems and reap the rewards of
opportunities. This volume demonstrates that the process of installing a
sophisticated enterprise-control system need not fall beyond the reach of medium-
sized companies if the constituents are drawn from the SAP R/3 business object
repository that holds only items that can be seamlessly integrated into a total
enterprise-management support system.
In this book you will learn how to use the SAP R/3 FI-Financial Accounting and
the Co-Controlling applications, which are integrated with the SAP R/3 Basis
system at the code level. These applications can be configured according to the
requirements of your company.
This introduction reviews the processes of accounting so as to clarify the way in
which the SAP R/3 system uses the concepts and terminology of accounting and
financial controlling. Some differences exist in naming processes, and sometimes
variations arise in how responsibility is assigned to specific departments.
Part I, “Preparing the Public Accounts,” focuses on the balance sheet and the profit
and loss statement. These financial documents are legal requirements for
companies that might incur tax liabilities when using borrowed money. The
financial documents also provide a window on the recent performance and
financial viability of a company so that shareholders and potential investors can
assess the potential profitability of the enterprise.
Part II, “Planning and Controlling,” looks forward from the public accounts to the
processes of planning for a company’s future by studying the data collected in the
past and applying it, where appropriate, to a model of the enterprise’s future
physical and financial activities. The purpose of this modeling exercise is to
prepare for the next set of financial documents by making sure that the planned
activities are profitable.
Part III, “Funding, Investment, and Development,” recognizes the importance of
having funds available for planned activities and also maintaining contingency
resources, which can be applied to anticipated developments in market
opportunities based on trends already discernible.
Appreciating Developments in Financial Accounting
Accounting offers a source of support for working people. At its best, accounting
sheds light on the value of what people do and uncovers the value of the materials
and other resources that are used and thrown away. Accounting should help people
waste less and add more value by using information and skill. Those who have
invested in the company also want to see how things are going and will look at the
annual accounts for a start. At its worst, accounting is the painful process of
collecting a confusing blanket of numbers to throw over an enterprise that could be
a waste of time and resources. The law requires the publication of financial
documents, but it may take an expert to discern just which elements of the business
contribute to the value of the material and information passing through the
company.
The possibility of managing the accounts on a computer opens an opportunity to
make one of two mistakes at the software design and implementation stage.
The first mistake involves overlooking the many ways in which the computer can
add value to the information and material work items passing through the
company. For example, the computer can make sure that the customer is provided
with exactly what he needs and is properly billed so that he pays for it. Manual
systems can be used to serve this purpose if the person in charge of them is diligent
and energetic. In contrast, the computer can be diligent and energetic in a business
in which everything is going according to plan, or the computer can detect slow
responses in billing and customer service. Then the computer can call attention to
this imperfection, not simply by ringing an alarm bell but by gathering together the
pertinent information and presenting it to a human decision-maker.
The second mistake in conceiving a computer-assisted accounting system is to
assume that such a system is simply a matter of mechanized books.
The computer can be made to work well at what it does only if it is endowed with
impeccable behavior. As much as possible, the computer must be incorruptible. Of
course, entry errors may occur that are not detected at the time. When the problem
is uncovered, it must be possible to trace the origin of the error, make corrections
to the accounting, and perhaps take steps to make this type of error less likely in
the future—or at least detectable at the time it occurs. The SAP system takes this
moral stand very seriously. Each time a transaction takes place between SAP and
the outside world, an SAP document is created and stamped with the date and time.
The terminal device signs the document, and the user also is obliged to record his
or her identification. From this moment of formal entry launching the transaction,
no further opportunity exists to annotate or adjust anything illegally. The time-
stamped SAP document recording the entry event remains locked. Therefore, it is
best if the document is checked before it is launched. The user also should append
any annotations or explanatory remarks at this stage.
NOTE: When dealing with an SAP document, you usually will have a choice of standard annotations to cope
with most eventualities. You also might be able to enter a free-text explanation.
If the transaction is legal but in error, a correcting transaction must be enacted.
This, too, leaves its mark on the audit trail by generating an SAP document.
Accruals are an essential part of modern online accounting. Costs and charges (and
possibly profits as well) are linked to the time period and the cost or profit center
to which they belong, rather than to any general fund. The aim is to reveal the true
value to the company of whatever activity uses its resources.
There is no doubt that the cycle time of the financial management process is
decreasing. (A financial year may take too long!) If your company manufactures
only to a specific customer order, you necessarily work within a different time
frame than if you manufacture identical items in bulk and sell them by shipping
mass quantities. However, given the immediacy of electronic communication (of
product information and orders, for instance), you may find that customers
increasingly drive your production. If your assembly or manufacturing teams are
quick and responsive, you might be able to persuade the customer to wait for
delivery if he or she will obtain the exact configuration or product variant desired.
In another potential situation, your product mix may be transformed because of
customer demand before you have time to compile the annual accounts. You might
have to keep running cost accounts and rolling plans developed on the basis of
current information. You need a financial system designed for this change of pace,
and even a small enterprise needs a proper financial system. The future directions
for accounting are touched on in Chapter 12, “Developments in Financial
Management.”
Rendering the External Accounts
A company is accountable to its owners, investors, host country, host taxation
authority, and employees. Groups of companies can combine to form a group
enterprise. Most legal systems insist on being able to scrutinize a set of financial
documents for the group as a whole and for each of the constituent companies.
When the accounts have been certified, they must be made public so that anyone
may read the balance sheet and the profit and loss statement for each corporate
entity.
Under the discipline of an SAP R/3 financial system, every financial transaction is
recorded as an electronic document that identifies the following information:
• Date and time of the transaction
• Commercial content
• Company code of the corporate entity that will account for this
transaction in its balance sheet and profit and loss statement
Using Subsidiary Accounts
The General Ledger stores the values needed to compile the balance sheet and the
profit and loss statement for one company code.
A subsidiary ledger, or a subledger, is a company code ledger designated for
storing values of accounting transactions of a particular category. The Debtors and
Creditors categories are two such subledgers. Both are sometimes referred to as the
personal ledgers or the Accounts Receivable and Accounts Payable ledgers.
Another subledger account is often named “Assets” because it is used to compile
the entries of this category in the company code balance sheet.
Using Client*
Client (or Client*) is a data object in the SAP Enterprise Data Model that generally
encompasses all other data objects in the system. This Client* entity can be
specialized based on whether it is used for a single enterprise or to summarize
accounts across several Client*s. For example, the Client* could span several
corporate groups.
The Client* entity represents a self-contained business system that has the purpose
of acquiring, producing, arranging, or distributing goods or services.
The data fields in the client records can be differentiated according to legal or
administrative viewpoints, and they usually map readily to business concepts. For
example, the Plant field is used to record details of physical assets holding
materials such as manufacturing plants and warehouses.
NOTE: Each item of Plant must belong to just one client because the public accounts do not allow the value of
this plant to be assigned to more than one owner.
Using Company Codes
A client can be used to consolidate the accounts of several associated companies in
a group. Each of these companies is legally allowed to publish its own set of
financial documents. If some of these member companies operate in overseas
taxation regimes or in other countries from the Client*, then these separate sets of
accounts are obligatory. However, the enterprise corporate headquarters will want
to publish a set of financial documents that represents the group as a whole. In
SAP terminology, the Client* comprises one or more company codes.
A company code is a data object that appears on every transaction document to
signal how that transaction is to be used in the preparation of the public accounts.
The term “company code” is used to denote a self-contained unit, such as an
autonomous division or a decentralized business department that can differentiate
its own account transactions.
NOTE: Company codes usually represent separate legal companies.
Using Business Areas
Some enterprises span many types of businesses and are composed of many
constituent companies. The Client* has many company codes because each
constituent company needs to keep its accounts separate. The company codes also
can be classified as operating in a specific business area. There is no legal
obligation to use business areas as part of your system of labeling transaction
documents. However, you may find it useful to assign some of your customers, for
example, to the business area Retail and others to the business area Wholesale. If
your business is differentiated by geographical region or by type of product or by
type of final user, you can set up business areas that make sense in your particular
circumstances by using any combination of such factors.
If you want to use a particular set of business areas in your financial accounting,
the SAP R/3 system can maintain a separate set of accounts for each business area
and can automatically print individual documents for each division if a transaction
involves more than one. The result is the final breakdown of a company’s balance
sheet and profit and loss statement into a statement for each business area, to be
used for internal information purposes.
Using Profit Centers
A profit center is a real or conceptual structure, internal to your company, that you
designate to bear the responsibility for financial accounting, insofar as it concerns
specific operating capabilities of part of your company. You need not nominate
any profit centers—in such a case, the company code is treated as the natural focus
for profitability computations and acts as a profit center.
You may nominate any cost objects to be the responsibility of a particular profit
center. However, each cost object may be assigned to only one profit center.
Using Cost Accounting Areas
If you need collate transaction data across profit centers or across company codes,
you can declare one or more cost accounting areas within a Client*. This enables
you to inspect the flows of values and services within each area of cost accounting
responsibility, to and from the cost objects contained within the cost accounting
area.
NOTE: If your enterprise is multinational, you may have to apply different accounting conventions to some
cost accounting areas.
Using Distributed Accounting Systems
A business scenario can be distributed in the sense that the separate accounting
mechanisms can reside in different locations and hardware complexes. For
example, one or more integrated logistics systems could be partnered with a
centralized financial accounting system. The ALE (Application Link Enabling)
technology allows any of the partnered systems to make controlled linked calls to
any other partner. These links are used to initiate business transaction elements that
must be executed by one partner to complete the transaction begun by the other.
The ALE links can be processed in batch mode and supported by intelligent
reconciliation of aggregated data to initiate “ledger rollup.” This process minimizes
wasted data storage by holding the same data in more than one location.
Often the distributed system is composed of several company codes, not all of
which may be using SAP systems. The ALE protocols accommodate the
aggregation of data from many different types of accounting systems and the
consolidation modules. These protocols then are used to present the data in the
most useful form for corporate group ledger reporting, as well as for national or
regional analysis and summary.
Using Costing and Revenue Element Accounting
One method of costing involves adding all the payments and dividing by the
number of items to arrive at the average cost of an item. The cost element in this
method is the item. This information is not very meaningful, however, if you have
purchased several different kinds of items, such as raw materials and services.
How can you average across unlike entities?
If you have truly been able to record all your costs over a settlement period, then
you are well on the way toward setting up a database from which you can build
cost elements.
Recording costs is not a problem if you run an SAP R/3 system because every
transaction (including purchasing goods and services) leaves a time and dated
document that can be accessed to compile costs as necessary. This same document
notes the account assignment object used for the transaction (for example, a cost
center). Therefore, consumption of a quantity of a certain material for production
or sales leaves a record in the General Ledger profit and loss account cost element.
The system also records a corresponding entry on the account assignment object in
the controlling application. This system ensures that updating an account in the
General Ledger also causes a corresponding update in the controlling application
records.
A cost element is an item in the chart of accounts that is used to accumulate value
changes arising as primary costs or sales revenue. These chart of accounts items
classify a cost according to a scheme that can include categories such as the
following:
• Consumption of bought-out raw materials, or raw material costs
• Basic personnel costs in fixed wages or salary in production
• Basic variable personnel costs in production
• Personnel costs for administration
• Commissions to employees
• Cost of sales
• Imputed rent
• Settled job order costs
• Christmas bonuses
NOTE: The chart of accounts item for cost and revenues records sales revenue as the main category of
revenue.
A chart of accounts item can be a profit/loss value category in Financial
Accounting and, at the same time, a primary cost type in Cost Accounting. The
Cost Accounting module provides a wide range of standard cost objects to which
you may add your own category if none of the standard objects is suitable. The
purpose is to enable you to see how costs flowed through your organization. Where
did the costs arise? How were they passed on along the value-added chain? These
issues are discussed in Chapter 6, “Controlling by Cost Management.”
Using Cost Centers
The place in which costs are incurred, however you define it, is represented by a
data object of the type Cost Center. This is a unit within your company
distinguished in some way by area of responsibility, location, or accounting
method, and perhaps all three.
You might find it useful to assign certain types of cost objects to a cost center. A
cost center is an extension of the system of dividing costs into, say, raw materials,
labor, and overheads. No limit exists as to the number of cost centers or the way in
which they are construed and defined.
Using Orders
An order is an instrument for monitoring the costs of an internal job. An order
describes the job and accepts transactions that are concerned with planning the job
and monitoring its progress. The order also accepts transactions that specify how
the costs of this job are to be allocated to cost elements in the chart of accounts.
Therefore, an order is also a cost object.
Orders can be assigned an internal order type, of which the following are
examples:
• Repair orders
• Investment orders
• Public relations and trade fair orders
See Chapter 7, “Costing on the Basis of Activities,” for additional information on
this topic.
Using Projects
A project is a series of jobs that are directed to the achievement of a set of
objectives according to a detailed plan. The type of objectives amenable to project
management include the following:
• Engineer-to-order manufacturing
• Plant maintenance
• Installation of the plant
• Installation of information technology systems and hardware with
associated training
• Research and development
• General investment programs
Usually, a time constraint and some form of constraint on the use of resources
affect project management. The SAP R/3 PS-Project System is a fully integrated
part of the R/3 system that supports efficient project management in every type of
industry. The work to be done is specified as a WBS (work breakdown structure)
and the dependencies between WBS elements can be portrayed as a network of
activities. Either a WBS or a network can be used independently of the other.
The WBS can be used on its own to track the costs of a project that is treated as a
cost object. This use is discussed in Chapter 8, “Controlling by the PS-Project
System.”
Using the Reconciliation Ledger
When an actual posting occurs for a controlling object such as a cost object, a reconciliation
ledger is updated at the same time. The reconciliation ledger holds summary information
about all transactions in the cost accounting system, which then can be used in reporting
functions. This ledger also is used to identify cost accounting allocations that must be shown
in the General Ledger, and it automatically generates these entries for financial reporting.
In distributed systems, a reconciliation ledger is maintained locally. From time to time, the
data in each of these reconciliation ledgers is transmitted to the central company code system,
or to the controlling area system if this is not the company code. The central system then can
aggregate the distributed system data and can perform a complete analysis of all controlling
objects of a company code or controlling area.
Using Special Purpose Ledger Accounting
If the analysis you require cannot be conducted using the General Ledger accounts of debit
and credit transactions for each month, you may be able to find what you want in the CO-
Controlling system database. For example, the CO system could keep accounts that reflect
value flows between internal responsibility centers. If you cannot get the analytical result you
require using the General Ledger or the CO systems, you can set up special purpose ledgers
to be maintained in addition to the standard traditional accounts based on the general ledger.
You can define the data for a special purpose ledger on the basis of any combination of the
data elements held in the SAP R/3 system or its applications. In addition, your
implementation can be configured to receive data from non-SAP third-party systems.
The special purpose ledger facility is supported by a very flexible reporting system that is
built specifically to report on the changes of these values. For example, you may want to have
extra reporting on the quantity and value of certain materials, together with an analysis of
which customers contribute the most business involving these materials.
User-defined special purpose ledgers can be specified so as to selectively record transaction
data from a set of nominated accounts or by filtering on the basis of account groups.
Individual cost elements or cost element groups can be targeted. Similarly, revenue elements
or revenue element groups can contribute to a special purpose ledger.
Value components could be the focus of a special purpose ledger system. Your company
could set up a specific ledger in which you perform planning, allocation, and currency
conversions. Any business transaction relevant to the value components in this ledger would
update it so that you would always be able to scrutinize those aspects of your business that
you had assigned to the special ledger.
NOTE: Although the company code is the usual unit for profit center accounting, the SAP R/3 system accepts
profit centers defined in any way that suits the reporting needs of your company.
You can, of course, compute the profitability of your activities as a whole using the accounts
already compiled for the general ledger. The concept of statistical profitability analysis is
used to draw attention to the fact that the computations generally are based on aggregated
data from many transactions. The result should be interpreted as an average or an estimate of
profitability across this sample of transactions rather than a definite calculation of the
profitability of any one instance.
Using Parallel Costing Systems
The SAP R/3 arrangement has a Financial Accounting system supported by a CO system that
maintains a separate database. One of the benefits of this arrangement is the availability of
planning data and actual data at all times. The planning data, for instance, can include
historical information from which estimates of future values can be developed. As a result, it
is possible to run a suite of parallel costing systems and draw reports from them to inform
management decisions.
Comparing Cost Accounting Methods
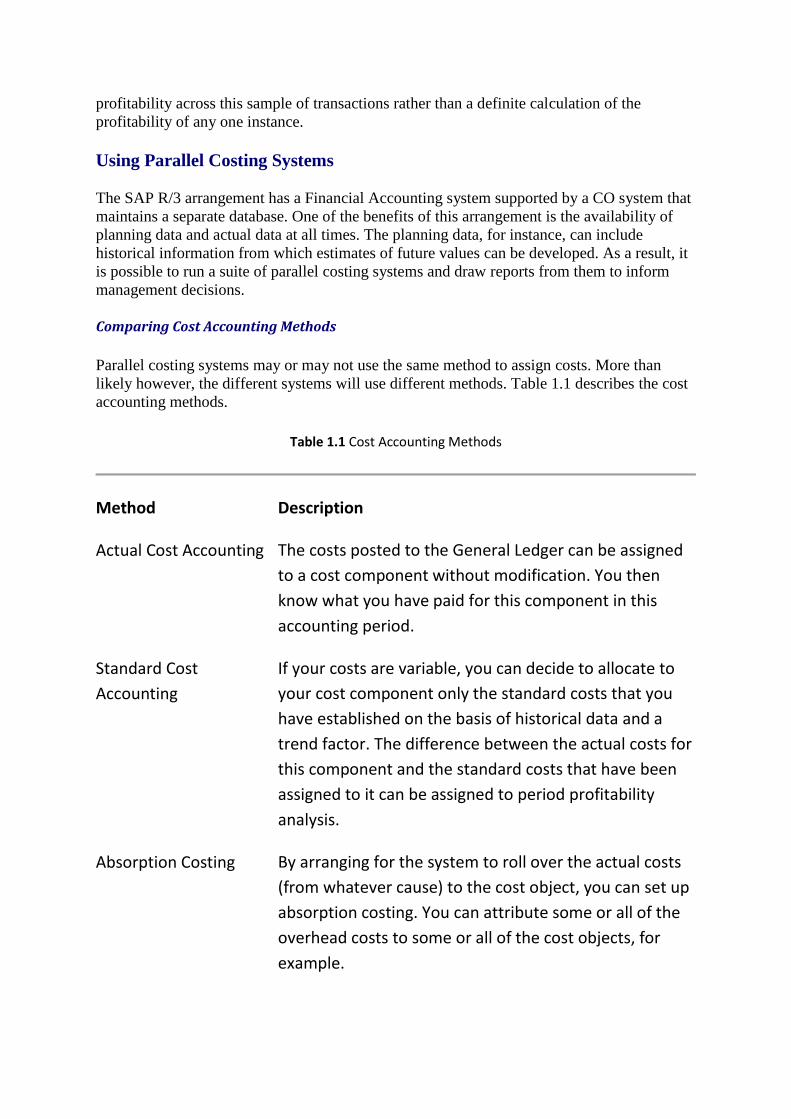
Parallel costing systems may or may not use the same method to assign costs. More than
likely however, the different systems will use different methods. Table 1.1 describes the cost
accounting methods.
Table 1.1 Cost Accounting Methods
Method Description
Actual Cost Accounting The costs posted to the General Ledger can be assigned
to a cost component without modification. You then
know what you have paid for this component in this
accounting period.
Standard Cost
Accounting
If your costs are variable, you can decide to allocate to
your cost component only the standard costs that you
have established on the basis of historical data and a
trend factor. The difference between the actual costs for
this component and the standard costs that have been
assigned to it can be assigned to period profitability
analysis.
Absorption Costing By arranging for the system to roll over the actual costs
(from whatever cause) to the cost object, you can set up
absorption costing. You can attribute some or all of the
overhead costs to some or all of the cost objects, for
example.
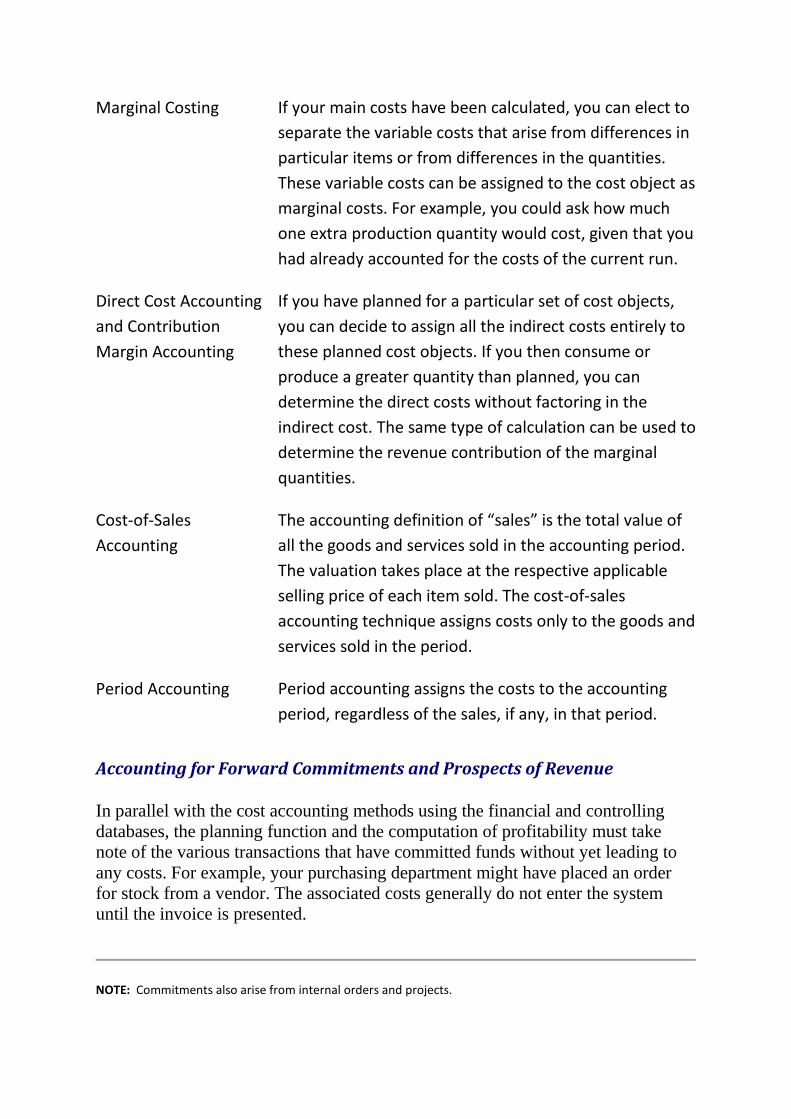
Marginal Costing If your main costs have been calculated, you can elect to
separate the variable costs that arise from differences in
particular items or from differences in the quantities.
These variable costs can be assigned to the cost object as
marginal costs. For example, you could ask how much
one extra production quantity would cost, given that you
had already accounted for the costs of the current run.
Direct Cost Accounting
and Contribution
Margin Accounting
If you have planned for a particular set of cost objects,
you can decide to assign all the indirect costs entirely to
these planned cost objects. If you then consume or
produce a greater quantity than planned, you can
determine the direct costs without factoring in the
indirect cost. The same type of calculation can be used to
determine the revenue contribution of the marginal
quantities.
Cost-of-Sales
Accounting
The accounting definition of “sales” is the total value of
all the goods and services sold in the accounting period.
The valuation takes place at the respective applicable
selling price of each item sold. The cost-of-sales
accounting technique assigns costs only to the goods and
services sold in the period.
Period Accounting Period accounting assigns the costs to the accounting
period, regardless of the sales, if any, in that period.
Accounting for Forward Commitments and Prospects of Revenue
In parallel with the cost accounting methods using the financial and controlling
databases, the planning function and the computation of profitability must take
note of the various transactions that have committed funds without yet leading to
any costs. For example, your purchasing department might have placed an order
for stock from a vendor. The associated costs generally do not enter the system
until the invoice is presented.
NOTE: Commitments also arise from internal orders and projects.
On the revenue side, your sales department might have information about
incoming orders that should be brought into the picture if you are using the
integrated Financial Accounting and Controlling system to assess the medium-term
prospects for your business.
Understanding Treasury and Financing
The treasury is recognized in English-speaking countries as the function that
ensures that an enterprise has funds for its activities and commitments. The
treasury department also makes sure that surplus funds are invested wisely. In
European businesses, these functions are carried on as part of financial accounting.
In the English-speaking structure, the following statements are true:
• “Finance” manages controlling and public accounts.
• “Treasury” manages financing.
The European structure uses different terms for these functions:
• “Controlling” manages controlling.
• “Financial Accounting” manages financing.
The SAP R/3 system comprises a software system, integrated at the code level, that
can be configured to carry out financial, controlling, and treasury functions
according to the requirements of the client user. The various functions are grouped
as application modules for ease of use. The treasury application therefore can be
configured to support either the English-speaking or the European structure.
Using Cash Management
The needs of your company for efficient check entry and clearing and for cash
forecasting are met by the TR-CM Treasury-Cash Management component. Short-
term cash management is improved by automatic or manually created memos to
supplement the planning data regarding anticipated payments.
The following functions are covered by the TR-CM component:
• Electronic banking
• Check deposit and clearing
• Short-term cash management
• Cash concentration
• Cash budget management
• Long-term financial budgeting
Using Treasury Planning and Active Treasury Management
The TR-TM Treasury-Treasury Management component is the planning module
for the treasury functions. This module supports the following activities:
• Liquidity management
• Currency position management
• Market risk management
• Financial planning and portfolio management
See Chapter 10, “Managing the Treasury,” for details of this module.
Using Funds Management
Budgeting on a local basis for all company codes is supported by the TR-FM
Treasury-Funds Management component. A separate fund can be set up for each
specific purpose, with budgets distributed over fiscal years. This component
enables you to see how the funds are being utilized.
The IS-PS is an Industry Solution developed from TR-FM, with the intended users
working in the public sector, essentially on budgets.
Using Investment Management
The domain of the IM Investment Management-application is the enterprise with
capital-intensive investment programs. This application provides support from
initial planning to settlement. A depreciation forecast is realized by internal orders
and projects that control activities during the construction phase. Capitalization
values can be accrued automatically to fixed assets. Chapter 11, “Managing
Investments,” discusses this module.
Understanding Controlling
In the context of business data processing and business management, controlling is
the process of planning the value flows in an organization and then recording the
actual values for comparison with the plan. The controlling tasks are essentially
planning, monitoring, reporting, advising, and informing. These tasks address any
activities that affect or could affect the profitability of the enterprise. Therefore, the
controlling functionality must include such duties as the following:
• Cost control
• Profitability analysis
• Financial control
• Investment control
The basic controlling tasks depend on thorough and complete documentation of the
consumption of materials and other resources in terms of the quantities used and
their value. Equally thorough must be the documentation of the quantity and
market value of all the goods produced and the services generated.
To assist in maximizing the profitability of the enterprise, the control function must
monitor the efficiency of all operations and make sure that they are contributing
the maximum to the value added chain. For the same reason, the controlling
department will want to provide good support for decision-making of all kinds.
The SAP R/3 controlling functions are explained in the following chapters:
• Chapter 6, “Controlling by Cost Management”
• Chapter 7, “Costing on the Basis of Activities”
• Chapter 8, “Controlling by the PS-Project System”
• Chapter 9, “Analyzing Profitability”
Planning and Controlling the Enterprise Business
The basic profit center is the company code, and an enterprise can comprise one or
more such component business units. For the enterprise as a whole to remain
viable, it must consider the viability of all the constituent parts. The financial
documents of the company codes must be consolidated. Chapter 5, “Consolidating
Company Accounts,” discusses this topic in more detail.
Management consolidation is the process of aggregating accounts to form a legal
consolidation that represents the financial position of the group as a whole. The
phrase also denotes the process of making sure that the management decisions of
the enterprise controllers are faithfully transmitted to the company code
managements. An integrated enterprise-wide business data processing system can
be a powerful vehicle for this communication.
The EIS (Executive Information System) is a comprehensive reporting and
analysis module that can draw data from any component of SAP R/3 and its
applications. With appropriate links, the EIS can also utilize data from associated
third-party systems.
Chapter 2
Understanding the General Ledger
In this chapter
Understanding SAP Accountings
Understanding the Principles of SAP R/3 General Ledger Accounting
Understanding General Ledger Account Master Data Areas
Implementing GL Financial Accounting
Understanding Complex Organizations and the Chart of Accounts
Specifying Rules for Administering General Ledger Accounts
Planning in the General Ledger
Posting Technique in the General Ledger
Closing the General Ledger During the Fiscal Year
Reporting at Closing
Understanding Financial Statement Report Formats
Reporting Operational Control Data at Closing
Using the Financial Information System
Taking Advantage of the FI-SL Functions
Using Allocation in Special Purpose Ledgers
Planning in the Special Purpose Ledgers
Reporting from the Special Purpose Ledgers
Using Workflow with the Financial Calendar
Understanding SAP Accounting
The SAP R/3 system is an integrated financial and controlling software complex in
which the components comprise standard business processes programmed to
accept the details of a specific client company. The components cannot be altered
by the user in their essential integrated functions. The specific components or
modules configured in your particular implementation can be determined by your
business requirements and by the pricing agreement you have with the supplier.
This chapter focuses on the essential of any accounting system: a book of accounts
known as the General Ledger.
The SAP R/3 accounting functionality can support the following three essential
component systems:
• Accounting (FI)
• Controlling (CO)
• Treasury (TR)
The following supplementary accounting applications are also configurable:
• Investment Management (IM)
• Business Planning and Control (EC), formerly named Enterprise
Controlling
• Executive Information System (EIS)
Understanding the Principles of SAP R/3 General Ledger Accounting
The General Ledger is a series of account balances. Modern online accounting
maintains the General Ledger balances continuously. Data that has been entered is
posted immediately to the General Ledger (and also to the CO-Controlling system
if it has been installed and configured). The balance sheet and the profit and loss
account are based on the General Ledger.
CAUTION: If your system handles very large volumes of small-value transactions with many corrections and
adjustments, you might have to weigh the value of remaining up-to-date against the costs of processing and
data storage. On the other hand, processing and data storage costs likely will continue to fall, whereas the
penalties of outdated accounting will not lessen.
Each business transaction creates a record in the format of an SAP document. The
transaction may be part of a batch input, or it may be the result of a dialogue
transaction at a terminal. The transaction is checked and validated as far as
possible and then returned for corrections, if necessary.
When the transaction is acceptable, it is posted and stored on the record log as an
SAP document. The system updates the daily journal file and posts the transaction
to the appropriate reconciliation account of the General Ledger. From that moment,
up-to-date account balances, trial balances, the balance sheet, and the profit and
loss statement reports are accessible on the screen.
Special document types and posting keys provide access to compilations of
particular types of transactions, such as the following:
• Customer or vendor invoices
• Cash receipts and disbursements
• Inventory transactions
• Allocations or distributions for cost accounting
• Transactions involving two or more profit centers
• Transactions involving two or more company codes
• Statistical postings (noted items, guarantees, and so on)
• Special business transactions (down payments, bills of exchange, and so
on)
Entering and posting a transaction document immediately updates both financial
accounting and cost accounting. The General Ledger and its subledgers use the
information, as do the cost analyses elaborated from the data.
The transaction log is available to feed the General Ledger and the subsystems
managing asset accounting, inventory accounting, cost accounting, order and
project accounting, product costing, profitability analysis, and the subledgers of
Accounts Receivable and Payable. The same transaction log can be available for
updating any special ledger accounts that you decide to maintain. From any or all
of this, the finance and controlling information system can extract and present
whatever primary or derived information is required.
NOTE: Integrated real-time bookkeeping ensures that verified data is available for processing in all areas at
once by automatically clearing cost accounting transactions in the General Ledger and its subledgers.
In keeping with the principle that any number that appears on the public external
accounting documents should be amenable to analysis into its constituents, the cost
accounting system must be supplied with all the expense and revenue entries.
Costing data allocated to period or product line is also posted to the General
Ledger via a common chart of accounts shared by both the financial (external)
accounting system and the cost control (internal) accounting system.
The accounts named in the General Ledger are called General Ledger accounts.
One or more General Ledger account balances can be derived from a
corresponding subledger specified in the chart of accounts.
Using the Extended General Ledger Concept
An extended General Ledger uses accounts based on a range of subledgers that
enable analyses from different points of view. For example, accounts can focus on
cost centers, product costs, or activities. These options are provided by using the
CO-Controlling system as an internal accounting system. Entered data posted to
the General Ledger is posted to the CO system and its components as part of the
extended General Ledger.
The financial and cost accounting systems are constantly reconciled at the level of
the individual General Ledger accounts. These accounts are named in the common
chart of accounts.
Using the Chart of Accounts
The chart of accounts is a legal requirement that is enacted in the SAP R/3
environment as a master data record according to the specification of entity type
2001. This specification declares a valid chart of accounts to be a detailed and
ordered list of value categories in which the economic situation of your company
can be recorded. The chart of accounts is used to configure any account in the
General Ledger so that it serves two purposes:
• To permit entry of transaction details required by the business
• To provide for any balance sheet or profit and loss statement required by
law
Generally, the business wants to plan and operate some logistical processes and
exercise internal financial control. In addition, the law demands proper external
accounting practice so that shareholders can value their holdings and see that taxes
are paid.
The processes of a business often can be classified broadly according to the focus
of the activities of the various departments and their managers. The chart of
accounts master record in the SAP R/3 system can differentiate many chart of
accounts items, including the following:
• Undeveloped real estate
• Long-term portfolio investments
• Equity capital for each shareholder
• Receivables from sales and services, domestic debtors
• Receivables from sales and services, receipt uncertain
• Payables for goods and services, domestic creditors
• Interest revenues from loans to business partners
• Semifinished products
• Raw materials, group 1
• Auxiliary materials
• Consumption of bought-out raw materials (raw materials costs)
• Basic personnel costs (wage and salary) in production, fixed
• Basic personnel costs (wage and salary) in production, variable
• Personnel costs, administration
• Commissions to employees
• Sales costs
• Imputed rent
• Settled job order costs
• Christmas bonus
• Cafeteria generation
• Sales revenue for company-produced products and services
The significance of having a large number of chart of accounts items is that any
transaction is identified with a chart item and, therefore, with a specific purpose
and accounting procedure. The system can deal with any sequence of transactions
because each transaction addresses specific chart of accounts items. It is not
necessary to additionally classify transactions according to their accounting
function.
NOTE: The chart of accounts items are maintained in only one language. This language may be used for some
or all charts of accounts in an enterprise. However, any user may read the item descriptions in any of the
languages supported in the particular implementation.
The first group of General Ledger accounts monitors the following activities,
which are concerned with building the productive resources of the company:
• Procurement of investment items, such as fixed assets, current assets,
and financial assets
• Extraordinary expense or revenue
The next group of accounts deals with how the day-to-day production and
processing activities affect the value of the company:
• Procurement of materials
• Consumption of company resources
• Valuation of finished or semifinished products
The third group is made up of activities with their own accounts in the General
Ledger to show how sales of products are set against costs to yield the financial
statements:
• Sales revenue or sales deductions
• Closing to the balance sheet and profit and loss statement
The sales and revenue items represent the value flows in the company, as do the
cost items.
Using Account Classes
External accounting balances are classified into account classes using the chart of
accounts. The following are examples:
• Fixed assets and long-term capital
• Finances, current assets, and short-term capital
• Non-operating expense and revenue
• Materials or stock
• Primary cost elements
• Secondary cost elements
• Job order cost elements
• Stock of finished and semifinished products
• Yield or changes to stock or capitalized internal activity
• Closing balances
The accounts needed to satisfy the GAAP principles (the Generally Accepted
Accounting Principles that set the standard for a reliable accounting system) may
be arranged and supplemented to suit the management requirements of your
company. You may want to have reports generated to select data for a business
area defined in terms of geographical operating regions, according to product
grouping, or as product groups per region. You could also define profit centers to
report separate financial data as a second accounting process supplementary to that
required by law to render the external accounts.
Using Internal Controlling Account Classes
Controlling balances achieved by internal accounting fall into one of the following
four categories:
• Project cost settlement
• Job order costing
• Cost center accounting
• Profitability analysis
Project cost settlement and job order costing recognize that purchases and
allocations of resources may be needed to carry out projects and complete specific
job orders that may not yield any financial return during the current accounting
period. These costs are therefore treated as investment.
Cost center accounting is used to gather specified types of cost under the heading
most useful for business purposes. These cost centers may correspond to
departments, or they may be used to associate costs with, for example, a specific
plant or item of equipment considered crucial for understanding and managing the
enterprise.
Job order and product costing are the traditional techniques of associating costs
with specific orders from customers or for internal production work. The
manufacture of goods for inventory provides a common example of this type of
costing.
Profitability analysis is the process of relating the financial yield of part of the
enterprise to the costs of owning and running it. No restrictions on how the parts to
be analyzed are defined. The profitability of a work unit may be of interest, or the
value of carrying out procedure change may be the target. The wisdom of all
business decisions may have to be assessed in relation to the short- and long-term
profitability of the consequences.
NOTE: To illustrate integration of accounting, consider the fact that the common chart of accounts can record
all the costs and revenues and can also provide all the factors needed for financial control via internal
accounting.
The chart of accounts installed in a specific implementation must comply with
statutory requirements under company law, as it is practiced in the host country.
The chart must also embody the essential GAAP elements.
Understanding General Ledger Account Master Data Areas
The master data held for General Ledger purposes is arranged in two areas, which
are both accessed as needed in any transaction. The chart of accounts area contains
the master formats needed by all companies in the group. The company code area
contains the masters that are not necessarily common to all the affiliated
companies.
Using the Chart of Accounts Area
General data, such as the following, is maintained for each account in this master
area:
• Account number
• Account name
• Type of General Ledger account, as determined by the chart of accounts
item specified for it (such as income statement account or balance sheet
account)
• Control information to specify how master records are created in the
corresponding company code area
• Account group assignment
• Screen layout for master record creation
Using Company Code Area
The General Ledger masters hold separate data for each company code that defines
the standard accounting environment. These include the following:
• Currency in which values are recorded
• Whether managed on an open item basis or not
• Sort basis, when line items are displayed
• Tax category
• Reconciliation account
• Screen layout for data entry DS
By arranging the General Ledger account master records in these two areas, you
can control the use of the chart of accounts. For instance, you could specify how
new accounts are to be assigned to the chart of accounts system and then open this
policy to modification by only a small number of authorized users. Different sets
of users can access the areas of the master data that deal with specific company
codes without interfering with the main chart of accounts policy.
NOTE: If several accounts groups share attributes such as bank accounts or reconciliation accounts, you can
specify a numerical range within which new accounts must be assigned.
The user screen, which appears when you open a new account, can be controlled
by the General Ledger master record by specifying mandatory and optional
attributes for display. By this means, the user does not have to view unnecessary
entry fields.
Creating Charts of Accounts
You can copy and edit any charts of accounts in your system to create one that
suits the way your company prefers to set out its accounts. Additionally, you can
prepare the names of the accounts that you want to use and then assign them to the
accounts provided in the master reference system. The accounts you need are
created automatically with new account numbers and the names you assign.
If you have an existing General Ledger chart of accounts, you can transfer all the
account master data to your R/3 system by means of a standard SAP interface that
invites you to confirm that the intended transfer will correctly interpret the data in
your existing system.
If you have several company codes in your enterprise, you may find it convenient
to define the values for the attributes of your General Ledger accounts and then
instruct the system to use sample accounts to generate appropriate new accounts
for each company code.
Maintaining General Ledger Master Data
You can enter General Ledger master data through the FI system for each account,
either separately or by groups of accounts. Your installation may have a configured
SAP data interface to enable direct input of master data under controlled
conditions.
Accounts can be added to the General Ledger, and certain parameters can be
modified. You can block and delete accounts during the fiscal year. As in all SAP
R/3 directories, match codes set up by the individual user can be used to find
specific accounts by entering an easily remembered name or title.
NOTE: As with all transactions, your activities with General Ledger accounts are logged so that all
modifications can be traced.
Checking the Data
Checks at every stage automatically assess whether the incoming information is
reasonable. The following types of questions are asked:
• Do the figures balance?
• Is this transaction legal?
• Has this decision-maker been authorized to deal with value changes this
large?
SAP standard business software is built to provide continuous measurement of the
profitability of all actions. Each business function records how often it is used and
how long it takes to do its work. This kind of performance information is available
to illuminate resource use.
This sophistication in accounting performance measurement, provided as standard
in the SAP systems, is additional to GAAP elements.
The ideal accounting system can recreate an unbroken audit trail from each and
every transaction that involves the company’s balance sheet and profit and loss
account. The auditor should be able to point to any number on the financial
documents of the company and ask to see how it was computed, right back to the
original paper documents.
NOTE: SAP FI-Financial Accounting can always deliver an unbroken audit trail because every external and
internal transaction creates a record in the form of an SAP document. This document can be called to
substantiate the audit and prove the credentials of the company’s accounts.
Upon this foundation, it is possible to demonstrate just how the system complies
with the GAAP tenets applied to computerized accounting systems. The GAAP
requirements arise from a set of statutory regulations, decrees, and ordinances that
embody the experience of accounting professionals and serve as the basis upon
which each nation may develop additional accounting traditions and requirements.
Implementing GL Financial Accounting
The SAP R/3 system with the FI-Financial Accounting application installed is
configured for particular countries, with the features specific to the accounting
laws and customs configured to operate correctly. The system also is configured to
comply with GAAP tenets, modified, if necessary, for region-specific regulations.
A national chart of accounts usually exists. If you have a multinational installation,
you can install the necessary additional charts of accounts. If you install another
SAP application, the system generates the additional FI-General Ledger accounts
required automatically.
Using the FI-GL General Ledger Module
The internal accounting system of a company is designed to control costs.
Investors want to know how the capital of the company is assigned in the external
accounting system that comprises the General Ledger.
For convenience, the General Ledger is supported by a set of subledgers, including
Accounts Receivable, Accounts Payable, Fixed Assets, Human Resources, and
Materials.
NOTE: An external accounting system should show what a company is worth.
Integrating Accounting Through the General Ledger
The General Ledger is the source of the data used to build the external accounting
documents, the balance sheet, and the profit and loss statement. Because this
information is audited, it must be supported by audit trails that show how each
summary total has been computed.
Anticipating the Year-End Results
If a complete audit trail exists, the possibility also exists of using the information
therein to make some decisions before the end-of-year results are derived. Making
interim decisions on the basis of accounting information is the province of business
controlling, for which the SAP CO-Controlling module was developed.
Controlling depends on detailed record-keeping, in which the individual
transactions retain their identity, their date, their sources, and the identification of
the users who worked on them. Only if the accounting information is retained in
this fine detail can the controlling functions assemble it and then use it to discern
what is happening in the business. If the decision-makers cannot establish what is
happening, they will be prone to take no action when they should, to take action
when they should not, or to take the wrong action.
The work units of a business controller probably are the line items of the business
transactions, as well as the journal statements, the accounts, the trial balance, and
the final statements. These provide fundamental monitoring of business direction
in terms of movement and progress, strategic goals, and operating tactics. These
are the primary results achieved as a result of investing human and financial capital
in the company.
Calling Up the Standard Transaction Data
The copious and comprehensive data gathered from the SAP standard procedure of
capturing all transaction information in the form of SAP documents can
subsequently be analyzed. For example, there can be valuable additions to primary
results in the form of data interpretations that examine the company from various
points of view. For example, you might consider taking a look at profit and loss for
each activity over each operating period.
These additional analyses of the accounting data can serve to prompt and direct an
interim change of direction or emphasis. However, they may also form the
essential inputs to business planning. Profit centers may focus the analysis;
geographical business areas may be of interest; and product groups may be worth
assessing in terms of profit contributions.
Viewing Profitability from the Center
Clearly, data should be held centrally if you seek widespread analyses.
Furthermore, if you want up-to-date information, records of every transaction must
be available to contribute to the analysis if required. The General Ledger and its
subledgers in the SAP online accounting system provide this central source. From
this source in the General Ledger, you can extract comprehensive analyses of
important ratios such as cash flow proportions and workload per person.
Be sure to watch liquidity. With General Ledger accounting, you can forecast
liquidity by examining projected short- and medium-term cash disbursements and
receipts. If you have created a business plan in the SAP system and have efficient
tools available to assist, then you can compare the actual results to planned ones in
whatever dimensions and ratios are of interest. Planning that is integrated across an
entire company must include plans for the balance sheet and for the profit and loss
statements. Cash plans that include project receipts and payments are also required.
Controlling from the Accounts
Controls over the ongoing activities of the company begin by comparing the
balance sheet and the profit and loss statements, year on year. Short-term cash
management using projected cash payments, receipts, and a daily financial
statement may well be essential. Control of ongoing business can also make good
use of financial analyses, comparisons, and ratios based on the organization’s
structure of business areas or units.
Subledgers can be the means of exercising control over the entities they represent.
Receivables and Payables can be managed by inspecting analyses of due dates,
amounts, selected customers, regions, and so on. Assets may attract the attention of
controllers because of automatic reports of their ratios, depreciation, capitalized
cost, and net book value. Inventory transactions, invoices, and personnel expenses
are other examples of business aspects that can be made available to controllers—
the SAP system captures all transactions from all system components in the form
of SAP documents that can be collated and analyzed into whatever informative
structure is feasible.
Of course, data not entered into the SAP system at some stage cannot take part in
subsequent analysis. You may have interfaces installed to link with third-party
systems that hold important business information, but it will not affect your
reporting system unless these links successfully transmit the accurate and timely
information you require.
However, if the necessary primary data is in the system, then automatic profit and
loss information can be computed. Overheads can be monitored and attributed to
such headings as Cost Center and Order Settlement. Product cost accounting can
shed light on the costs of ongoing jobs. Technical and commercial projects can be
monitored, controlled, and brought into the plans. Profitability analysis can be
conducted on the basis of cost of sales and period accounting.
TIP: At any time, it is possible to clear individual line items in business transactions to reconcile separate
controlling units with the General Ledger.
Identifying the Two Primary Functions of the General Ledger
The FI-GL General Ledger component recognizes two main reasons for asking for
reports from a General Ledger:
• To discern the financial viability of the company
• To seek opportunities to improve profitability by controlling some or all
activities of the company
Shareholders may be very interested in the financial statements required by law—
the balance sheet and the profit and loss statement. These two financial documents
serve as the basis of external accounting because they reveal a company’s financial
health.
The profit and loss computations depend on closing the accounts in the General
Ledger at the end of the financial year. One of the primary functions of the General
Ledger is to accommodate this year-end closing in an orderly manner.
The other primary function of the General Ledger is financial accounting for the
current fiscal year. The function of collecting and recording data from transactions
is one part of financial accounting. Posting data and effecting reconciliation on a
continuous basis make up the other part. Reconciliation takes place at the
transaction level before an entry is posted, but a closing of the reconciliation
accounts at the end of the month and then at the end of the year also must occur. A
facility exists in R/3 to call up daily or monthly reports at any time.
Using Special General Ledger Transactions
The accounts in the special General Ledger are reconciliation accounts for special
subledger transactions that do not directly involve sales or purchases and that may
not be balanced with the Receivables and Payables. The special General Ledger
indicator is a single character code to distinguish these transactions from sales to
customers or purchases from vendors. The following transaction types are
examples of special General Ledger transactions:
• Acquisitions
• Dispositions
• Depreciation
• Transfers
• Down payments
• Bills of exchange
• Period closing entries
Performing Year-End Closing
The law for closing a fiscal year requires entries to closing accounts for the balance
sheet and profit and loss statement. The SAP FI System ensures that year-end
closing entries are transferred from subledgers such as the following:
• Accounts Receivable
• Accounts Payable
• Fixed assets
Provision is also made for closing entries manually and individually. You can close
a fiscal year at any time. The flexible online reporting system offers separate
formats of the financial documents for tax authorities, stockholders, legal
consolidation of associated companies, and so on.
Understanding Complex Organizations and the Chart of Accounts
The chart of accounts must include all General Ledger accounts in an accounting
system. You can specify what transaction data goes where so that each account
contains all the required details for closing. Internal accounting usually requires
that certain types of data be sent to each of the accounts used in the controlling
functions.
Two possibilities exist for using a common chart of accounts in a complex
organization:
• You may have a centralized organization in which the maximum number
of accounts at group level is displayed in a uniform chart of accounts that
applies to all company codes in the group.
• You may have a decentralized organization in which each company code
has its own chart of accounts.
In either case, it is possible to use sample accounts taken from the reference system
paired with transfer rules for individual company codes. This grants each company
some flexibility while operating on a common chart of accounts.
Understanding International Taxation
The SAP system is international. Common taxation functions have been
programmed as standard business functions, with tables of parameters available for
customization of specific operational features.
When you use the SAP system, you signify both the country in which your
company is located and the country in which your vendor or customer is located.
The system adopts the taxation regimes appropriate to each of these countries.
The system calculates tax or adjusts it automatically. When you enter the
transaction, the system creates the SAP document that contains all the details and
then immediately posts the taxes as it updates the accounts. The required tax
reports are generated automatically.
Using Standard Taxation Functions
The FI-Financial Accounting module includes the following standard international
taxation functions:
• Taxes on sales and purchases
• Bills of exchange tax
• Tax base for tax calculation
• Definitions of all required tax rates
• Methods for the determination of due dates for tax payment
• Tax calculation procedures
• Tax base for cash discount
• Dependent taxes as surcharges or deductions
• European Community acquisition tax
• Division into deductible and nondeductible taxes
Withholding tax can be programmed to suit your requirements. The process makes
use of the following functions:
• Tax base
• Definition of all required tax rates
• Flagging of all vendors affected
• Determination of due dates for tax payments
The system verifies withholding tax when you enter a vendor invoice and payment.
You do not have to check the tax entries later. The necessary reports are prepared
automatically.
Although the system adopts the appropriate standard tax regime as soon as you
indicate the country, you can adjust parameters to meet your specific tax
requirements. For instance, you may have to make adjustments to the standard
procedure because of a change in the national taxation regulations, or because you
are working in a country that does not exactly follow any of the standard tax
regimes programmed into the system.
NOTE: Country-specific tax requirements are notified in the SAP INT International component and can be used
to customize your particular implementation.
Using Country-Specific Taxation Requirements
Specific taxation rules for charging, disclosing, and paying tax are accommodated
by customizing each company code operating in that country. Specific forms of
payment and common payment media are prepared for each country.
The following examples illustrate the range of differences that can be handled by
the system:
• German-speaking countries in Europe require a tax adjustment if the
payment for an invoice is net of cash discount. Other countries calculate
tax liability on the invoiced amount.
• Different countries have their own arrangements for tax exemptions and
delay of liability.
• Withholding tax is subject to wide differences in scope and method.
Using Intercompany Accounting
A group of two or more individual companies has an organizational structure
designed to facilitate day-to-day operations. For example, each company may buy
material and manage a warehouse. Each may run a Sales and Distribution division.
To increase the complexity of the organization somewhat, suppose there is also a
head office that functions as a separate company.
As a company, the head office may oversee the two other companies. Each of these
business units incurs expenses and probably enjoys revenue. For the sake of
business convenience, two or even three of these units might combine to make a
purchase, perhaps at a discount because of the size of the order. In this case, one
payment to the vendor is made against one invoice.
Again for good business reasons, the units may join forces to provide a service to a
customer. For example, Purchasing may provide the material goods, and
Distribution may look after their delivery. Again, one payment from the customer
is made against one invoice.
If each of these business units is managed as an individual company, all
intercompany transactions within the group and with customers and vendors must
obey the rules of intercompany accounting. In particular, transactions must leave
records that enable intercompany business to be legally audited to give a true
picture of the group as a whole, as well as of the individual companies, when it
comes to drawing up the financial documents.
The principles of intercompany accounting are applied when your company is part
of a group; they also apply when your customer or your vendor is part of another
group. The SAP accounting system uses methods that support intercompany
transactions and comply with GAAP codes.
NOTE: With modern online computerized accounting systems, the balance sheets and the profit and loss
statements of the group and each individual company are readily available at any time.
Using Intercompany Expense and Revenue Postings
Two divisions of a group, each with a separate company code, may jointly make a
purchase or issue goods. The same principles apply if more than two company
codes are involved. You must enter and post the expense item in both company
codes, but you post only one vendor account in one of the company codes (it does
not matter which one).
The system automatically calculates and posts the Receivables and Payables
between company codes, just as if you entered a regular transaction in one
company code. The system creates line items for Receivables and Payables
between company codes. It also generates an SAP document in each company
code. As it does so, the system assigns a unique intercompany transaction number,
which appears on all documents and vouchers.
NOTE: The debits do not have to equal the credits in each company code; they must balance only within the
entire intercompany transaction. Transaction documents in each company are balanced by the automatic
entries made by SAP R/3.
Paying for Intercompany Purchases
Several companies in a group may purchase from the same vendor. You can pay
for the purchase by making a single payment, with the vendor account number
being the same in the vendor master record in each company in the group. One
company must keep a central bank account to be used to pay on behalf of the other
companies.
Using Cash Receipt for Two or More Company Codes
Some companies in a group may have customers in common. If one of these
customers offers payment for two or more company codes in the group, you can
use this procedure:
1. Match open items to the amount of the payment.
2. Process the selected items, sharing the payments flexibly if necessary.
3. Apply cash discount calculations in each company.
4. Clear documents for each of the companies.
The system automatically posts the required clearing account in each company.
Using Head Office and Branch Accounts
Your supplier may be a branch with its own account, but its head office may want
to receive your payment. In this case, you can enter its head office account number
in the master record for the branch vendor. When you enter a transaction to the
branch account, the system posts the transaction to the head office account, leaving
a cleared entry on the branch account to show who supplied the goods or service.
The master includes data about the branch and a reference to another master to
give details to the head office. By this means, dunning letters can be sent to the
head office, the branch, or both for overdue refunds.
Making Vendor Payments to an Alternative Recipient
Your supplier may not have to deal with its payments due. For example, it may
have a head office that receives payment. You can record in its master data the
account number of this alternative recipient. The system then processes return
transfers and other vendor payment business through the banks to the alternative
recipient.
If you do post vendor invoices to an affiliate, you must record in the master data of
the branch vendor a group-wide company account number to be used during
consolidation to eliminate the invoices that would otherwise appear twice in the
company accounts. The system can look at the transaction documents bearing this
group-wide company account number and identify any entries that are replicated
because the payment was made to an affiliate that was not the original vendor.
Making Intercompany Payments
One vendor may have supplied several company codes in the same group. The
payment system can make one payment and then settle the intercompany accounts
by calculating and posting Receivables and Payables between company codes.
You must define one of the company codes and enter it as a normal paying
company. The system assigns the document a unique intercompany identification
number, used to ensure that the other members of the company code group pay
their shares.
Eliminating Intercompany Payables and Receivables
FI-Financial Accounting eliminates intercompany balances by open item only if
each trading partner has been marked in the vendor master record. You must also
ensure that the reporting procedures inform the consolidating department of the
numbers of these trading partners, at least on the items relating to intercompany
Payables and Receivables, revenues and expenses.
The law requires that all intercompany balances be eliminated before presenting
the balance sheet and the profit and loss statement. All possible pairs of individual
companies must be investigated to prove that they have been trading with each
other.
In practice, significant differences in the way individual companies keep their
records may make complete elimination impractical. The most frequent causes of
discrepancies in elimination are as follows:
• Currency translation differences
• Differences in the timing of entries for goods in transit between
individual companies
• Specific reserves set aside for doubtful accounts
• Liabilities that are not acknowledged in the records
The cause that is most difficult to handle is currency translation; the others can
usually be resolved by applying corporate policies in a thorough manner.
If the individual companies have installed and configured SAP accounting
applications, automatic dual currency accounting occurs. In this type of
accounting, every transaction is documented at the time it occurs, in both the local
currency and the currency designated for all transactions in the group.
If the FI-LC Consolidation component is installed and configured in your
company, you can trace any currency translation differences between the local
currency, at the prevailing rate of exchange, and the transaction currency. An
exchange rate difference correction then is posted automatically in the balance
sheet account designated for this purpose, therefore updating the consolidated
financial statement.
Dealing with Language Differences
R/3 is an international system. The names of all General Ledger accounts can be
translated if the language key is entered together with the name of the account in
the target language. This process can be repeated for all languages in the group. By
this means you might add or modify General Ledger account names in the
language of the holding company and later log in and call for the account balances
in the language of your login profile.
NOTE: In a listing of the charts of accounts, each chart is annotated to show the main language and all the
alternatives available.
Defining Currency
The following operational currencies have been defined, and their codes are
assigned to each function by default (you can alter the default settings):
• Local currency is also the reporting currency for the company code.
• Document currency is the currency specified for entry on SAP
documents.
• Group currency is an alternative to document currency for group
reporting.
• Updating currency is defined for posting debits and credits to the
General Ledger in parallel with the local currency.
• Credit limit currency is the currency chosen to maintain the credit limit.
• Ledger currency is an alternative to the updating currency for that
ledger.
Additional currency assignments are available in the SAP Foreign Exchange
Management component. R/3 also offers the possibility of recording hard currency,
index currency, and global currency in the standard FI-GL General Ledger.
Using Currencies in Transactions
Each company code has a local currency for reporting. The system records
amounts in this local currency, as well as in the document currency, which will be
used on all documents in addition to the local currency.
NOTE: You can enter documents in any currency.
You have two options for converting currencies:
• You can enter an exchange rate when you enter the transaction
document.
• The system can translate between document and local currencies by
referring to a table of daily exchange rates, which is either updated
manually or maintained automatically by a link to a separate database.
The system can be customized in various ways, including the following:
• A specific user must enter amounts in a particular currency, which can be
the local currency or the document currency.
• A specific user can be permitted to enter amounts in either local or
document currency.
Regardless of the customizing arrangements, the system displays amounts in both
local and document currencies. Minor differences are rounded, using rules
established for this purpose. These differences can occur when several line items
are converted and then added in both currencies.
Customer monthly debits and credits are kept by the system only in local currency.
The reconciliation account for the Accounts Receivable subledger is kept in local
currency and in all the other currencies posted.
Dealing with Currency Exchange Differences
A line item can be expressed in a currency other than the local or document
currency. You can enter payments to clear such foreign currency line items using
either local or document currency.
The payment expressed in the document currency is converted from the local
currency at an exchange rate adopted by the system (according to rules for
assigning the daily exchange rate). If this rate has changed from the rate prevailing
when the invoice was written, the payment amount may not match the open item
amount. In such cases, the system automatically calculates and posts an exchange
difference entry to a separate account established for this purpose.
Specifying Rules for Administering General Ledger Accounts
An open item is one that can be partially settled; it remains open until the item has
been fully cleared. If an item is not to be managed on an open item basis, the
settlement has to be in full or not at all. Rules can be established, for example, in
the partial payment of accounts outstanding, to determine that the largest items
should be settled first, or perhaps those that have been open longest.
Such manipulations may not be permitted in some General Ledger accounts
because that would destroy their informative nature. By and large, if you have
authority to manipulate the General Ledger accounts, you will not have any
restrictions-only obligations.
NOTE: Some accounts display to anyone the line items upon which they are based. Payroll is not usually one
of them.
Another example of attaching instructions to a data object representing a General
Ledger account involves how the line items are to be displayed. This includes their
sort order and any masks applied to conceal certain values.
Using Daily Journals and Interim Statements
Certain SAP programs can help you prepare your system for year-end closing. For
daily and monthly closings, however, you face no special requirements and no
extra entries because the account balances are maintained all the time.
At the end of each day, you can review a report of the exact closing balances for
the day, based on the line items and the total debits and credits entered. For periods
of a day or more, you can ask for data reports posted over the period, sorted by
date or by any of the fields that appear in the relevant SAP documents created for
the transactions.
These journals can help you decide how to close posting periods and account for
accruals. You may wish to define two accounting periods open for this purpose.
TIP: The practice of calling daily or short-period journals can be helpful. You can validate data entry soon after
it occurs, so you can control it.
Performing Year-End Closing Tasks
Monthly and interim closing entails no technical requirements. Year-end closing,
however, must be anticipated by running a series of SAP programs that include the
foreign currency conversions. These year-end programs serve two main purposes:
• They reorganize SAP documents into more convenient groupings.
• They reconcile summary records with the individual documents upon
which they are based.
The year-end closing sequence must include the following tasks, which do not
necessarily have to be completed in this order:
1. Close posting periods.
2. Re-value all line items and General Ledger account balances to adjust for
foreign currencies.
3. Sort open and closed Receivables by their due dates.
4. Sort open and closed Payables by their due dates.
5. Identify and adjust vendor accounts with debit.
6. Identify and adjust customer accounts with credit balances.
7. Post re-evaluations.
8. Post adjustments.
9. Post accruals.
10. Print the balance sheet with the profit and loss statement.
Automatic closing programs compile a series of reports that support you by
preparing what you need to close the year. These supporting reports include the
following:
• Reconciliation of documents with monthly debits and credits
• Posting totals
• Accumulated balance trail
• Balances carried forward from the balance sheet of the previous year
Planning in the General Ledger
Throughout the SAP R/3 system, a distinction is maintained between two values:
numerical and monetary values that are the result of operational transactions, and
values that have been generated for planning purposes. As far as the user is
concerned, the planning entries are maintained in a database separate from the
operational data of the live production system. These two types of value are
brought together in the comparison of planned and actual values. This can take
place at any time for the purpose of exercising closer control over business
processes. It is also customary to amplify the presentation of the balance sheet and
the profit and loss statement by showing how well the company performed in
relation to the target planning values.
The natural structure for building a plan of anticipated or targeted business activity
is the one used for the profit and loss statement. The R/3 system includes examples
that you may copy and edit to formulate a first draft plan. These profit and loss
statement examples can be displayed as a tree structure that you can modify to suit
your company’s requirements.
You can establish planned values for the whole profit and loss structure, or you can
decide to enter planned values for only part of the structure. Any value is open to
copying, overwriting, editing, and selecting as a member of a group of values
subjected to a logical or arithmetical operation, such as an increase of 5% for next
year’s target.
If you enter a planned value, you may subject it to any of the following operations:
• Copy the planned value to other locations
• Append a reference text to a particular value or group of values
• Carry forward a value to successive time periods of the plan
• Assign a value to certain time periods of the plan
• Have the system distribute the entered value across a group of selected
periods according to a particular distribution scheme, such as “evenly to all
periods” or “linear increase from zero to the value entered”
Each plan you make is identified by the date and time you post it and by any other
text that you use to title it. In particular, the document management system ensures
that if you change a plan in any way, the new version is identified as such and is
kept separate from the previous version. By this means, you can formulate several
plans and see how the values change if you switch from one to another on your
display.
Using the FI-SL Special Purpose Ledger
From SAP R/3 Release 3.0, the FI-SL module has been assigned the functions
previously identified as the FI-GLX Extended General Ledger. The FI-GL General
Ledger module includes access to the full reporting facilities of the SAP R/3 Basis
system with which it is fully integrated at the code level. However, you can elect to
exclude some of the components of R/3 from your implementation by specifying
this at configuration. For example, if you do not require the full CO-Controlling
application to be installed and configured, you may nevertheless opt to have some
planning functionality available with your General Ledger. This option may be
presented as the FI-SL Special Purpose Ledger module. An implementation that
opts for the full CO-Controlling application does not need the FI-SL component
because all these functions are provided by CO-Controlling.
For historical and legal reasons, the General Ledger has been the primary means by
which an auditor or an investor might see how well or badly a company has been
managed. The results of this management are extracted to form the balance sheet,
showing the end-of-year value of the company’s assets, and the trading report or
profit and loss statement, revealing how the assets either have generated profit or
have diminished through losses. The General Ledger is therefore the basis for
external accounting, but it does not show all the useful information that has been
collected in the course of the trading year, such as who bought what.
The manager must submit to the procedures of internal accounting to see more
closely how resources might be used for a better outcome. Perhaps it would be
informative if the financial summaries contained breakdowns of activities by
geographical business areas, by type of business, by product, and so on. These
other ways of collating business information for the benefit of exercising better
control of a company have been provided with standard business functions in the
CO-Controlling module.
The FI-Financial Accounting module primarily serves the requirements of external
accounting. The CO-Controlling module accommodates internal accounting. Both
serve the same company by sharing a common chart of accounts that includes
accounts that are not necessary to meet the legal requirements of the financial
statement—those requirements that are met by the General Ledger, from which the
balance sheet and the profit and loss statement are derived.
These extra accounts are there to improve the usefulness of the financial system in
controlling the company. The FI-GL General Ledger accounts and these extra
accounts and account subtotals comprise the FI-SL Special Purpose Ledger. The
General Ledger is extended through integration with the common chart of accounts
to take advantage of the facilities offered by the CO-Controlling module.
Although the Controlling System is specialized for internal accounting procedures,
it maximizes the favorable values and minimizes the unfavorable values
summarized in the formal legal documents of external accounting (namely, the
balance sheet and the profit and loss statement). After all, the purpose of the
company is to realize profit from its activities and its use of invested capital
invested. The CO-Controlling module represents a comprehensive application of
the SAP system to all the elements of a company’s business.
Using the FI-GLX Standalone Special Purpose Ledger
The Special Purpose Ledger is an SAP product that can stand alone and accept data
from external systems using software from other suppliers. This product can also
be installed to integrate with the SAP R/3 system and interact with components of
the FI-Financial Accounting module and the CO-Controlling module. Either
directly or via the CO-Controlling module, the Special Purpose Ledger module can
link up with any of the SAP R/3 components.
The bridge between other applications and the Special Purpose Ledger comprises
one or more ledgers. Not all transaction data from other applications can find a
corresponding account in the Special Purpose Ledger. The system ensures that
updates from another application correspond with at least one ledger, however. A
standard program is supplied with the Special Purpose Ledger to check that this
reconciliation does in fact take place.
NOTE: You can reconcile the Special Purpose Ledger with the transaction data at any time.
Planning in the FI-SL Special Purpose Ledger
A plan comprises three operations and a reporting stage, which can occur at any
time and be repeated as often as required. The following sections explain these
processes.
Specifying Planning Objects
Controlling in business usually means that the controlling person has a plan or
objective that is used to influence decisions in situations where common sense is
not sufficient. A production target is an example. You could set up a plan to
produce as much as possible, or an amount for which you had positive orders. You
could set a sales target in units or total value. But if your resources are not
unlimited, or if your markets are restricted, then you may be advised to choose and
plan for a target that takes these factors into consideration.
The first step is to set out the planning cost objects or the levels at which planning
is to take place. These could include the following:
• Business area
• Cost centers
• General Ledger accounts
• Months or other posting periods
Many businesses can predict season variations by choosing posting periods to
which target values can be assigned to match the expected variations.
Assigning Values
Entering target values and budgets to be assigned to the planning cost objects can
be done manually or with assistance from automatic distribution functions. For
example, you could divide your annual planned sales evenly across the months, or
you could use a standard function to distribute your target according to a
predefined set of parameters in proportion to your expected variations. You might
use last year’s monthly figures plus 5% for these parameters. The more market
intelligence you can apply, the better your plan.
Collating Data
SAP R/3 automatically saves transaction data. But collecting this transaction data
and collating the individual items to match planning levels and objects is the most
intensive operation in terms of information flow. This function can be assigned to
batch processing and off-peak scheduling.
Reporting
The standard SAP R/3 flexible reporting functions can show you, for any
combinations of planning cost objects that you require, how actual values stack up
against plans and targets. Any or all of these procedures can be automated by
setting parameters under the control of the Special Purpose Ledger component.
Enabling Functionalities with the Special Purpose Ledger
The following actions can be carried out through the Special Purpose Ledger
program:
• Specifying General Ledger account subtotals to collect data on chosen
periods or another focus of interest
• Naming the account subtotals
• Specifying the criteria for posting entries to each subtotal
• Recording and updating account subtotals from the transaction
information entered in SAP documents
• Accepting data from other SAP applications
• Accepting data from systems that do not use SAP software
• Entering financial plans in the form of planned values for each relevant
account and account subtotal of the Extended General Ledger
• Reporting on the planned and actual account totals and subtotals for the
period or other focus of interest
• Designing reports based on flexible fiscal years
• Providing parallel reports in up to three currencies
You could regard these extra reporting functions as a waste of time and resources
because they are concerned with events that have already happened. However, the
more carefully you plan your business year, the more accurately the automatic SAP
R/3 functions can report on how the performance of your company corresponds to
your anticipation.
Specifying Inflow of Data to the Special Purpose Ledger
Data reaching the Special Purpose Ledger system arises mainly from transactions
in other systems, other SAP applications, or systems provided by other suppliers.
SAP provides a comprehensive suite of standard interfaces.
The flow can take place immediately after a transaction is posted, at regular
intervals, or via batch transfers. Validation can take place to ensure that the
incoming data complies with the conditions imposed by the Special Purpose
Ledger. Substitution of transaction data can take place so that what is retained is
amenable to further processing by the client systems using the facilities provided
by the Special Purpose Ledger module.
Checking for consistency also must occur. For example, master data in the Special
Purpose Ledger must have elements to name and specify all the necessary data
objects used to store data generated by the associated applications. Account
identification, cost center, product identification, and any other attribute of interest
must find a place in the Special Purpose Ledger. Of course, such information can
be retrieved and identified even though, in the case of non-SAP systems, it may no
longer be easily traced in the system that first created it.
One solution is to have the Special Purpose Ledger acquire master data from the
transferring system. This imposes the requirement that transactions in the
transferring system include all the information of interest as either optional or
required entries. Obviously, information that has not been collected by the
transferring system cannot subsequently be accessed from the Special Purpose
Ledger.
A set of master data shared by all applications ensures consistency of data across
all systems using the Special Purpose Ledger.
From other SAP R/3 applications, the preliminaries of data transfer include
establishing the following specifications:
• Determining which transactions update the Special Purpose Ledger.
Sources might include Financial Accounting, Material Management, or Job
Order Accounting.
• Determining which particular ledger is to be updated and how.
• Determining whether each ledger is to be updated immediately or at
regular intervals.
SAP R/3 guides and prompts you to set up the validation rules in each case, based
on rules and combinations of fields that you can define. The system then validates
transaction data, subtotals, or totals in the ledgers specified.
It is customary to have other SAP applications automatically transfer the data for
the Special Purpose Ledger. A direct data entry function is also provided to enable
the entry of notes or consolidation entries, for instance. As is normal practice, these
entries create SAP documents. These SAP documents can be flagged to show that
they are records of direct entries to the Special Purpose Ledger. If necessary, these
documents can be displayed separately.
Making an Assessment in the Special Purpose Ledger
In this context, assessment refers to the process of gathering cost information from
a number of sources. Consider freight charges across all warehouses for all
products in a particular group or on a particular list of products. Assessment is the
process of seeking out the details and calculating the total of these charges.
This task lies in the province of the Special Purpose Ledger. Needless to say, you
cannot complete such a task successfully if the master data of the Extended
General Ledger makes no mention of freight charges or any data field that could be
used to make a proper substitution (such as delivery charges.)
Using Distribution in the Special Purpose Ledger
Distribution is sharing. For example, the total of freight charges across the group
can be distributed by sharing it as some kind of overhead charge imposed by the
accounting system. Who should share this burden may be hotly debated, but in the
end the Special Purpose Ledger must be told to divide this cost between various
accounts.
Two types of distribution exist:
• Single-dimension
• More than one dimension or level of detail
Single-dimension distribution takes place when a value is credited to the sender
and debited to a single receiving account. For example, a cost center can be created
so that certain costs can be reported under the name of that center. Administration
Costs might be the name of such a cost center.
Distribution can also be directed at more than one receiving entity. The set of
recipients might include all production departments. The costs can be distributed
across specific products in a product group, for example.
Whether the distribution involves a single receiver (such as a cost center) or a set
of receivers, three methods exist for computing how much is attributed to each:
• Fixed amount method. You decide how much to charge each individual
recipient. A fixed amount is debited to each, and the sender is credited
with the total.
• Fixed share method. You decide what percentage share of the amount to
be distributed shall be charged to each recipient. Each recipient is debited
with the fixed share, and the sender is credited with the total of these
shares, which need not equal 100% of the assessed charge. The sender may
retain a share.
• Dynamic method. The amount to be distributed is automatically
calculated by the system on the basis of the subtotals already recorded in
the Special Purpose Ledger.
Using the Set Concept
The logical concept of a set is used in the Special Purpose Ledger for reporting,
planning, and ledger processing. A set refers to a data structure and its
relationships with other data structures. A set of numbers may be defined, where
the numbers are the identification codes of bank accounts, for example. A list of
cost centers also can constitute a set.
The actual members of a set may not be known until the set definition is called into
use. A set definition of this kind is, “The top three operating divisions for gaining
new customers in the current month.” The definition of a set may include
relationships between specific firms or companies in a group, not necessarily at the
same level. A set may comprise any collection of data objects that meet the logical
criteria forming the definition for membership of that set.
Specific business functions can call on a set definition that has been stored for later
use. Assessment and distribution often take place under the control of sets.
Using Planned Amounts in the Special Purpose Ledger
The basic concept is to set target values for account totals or subtotals for one or
more periods. Actual values totaled from the transaction data are then compared
with these planned targets. The method is to enter a planned total and then have it
allocated to periods by various standard functions. Special functions and tools in
the Special Purpose Ledger provide flexible planning and controlling facilities.
In practice, planning usually requires several iterations in which suggested budgets
and target values are distributed in various ways until an agreed distribution is
effected. The starting point for a plan is a set of plan parameters, such as the
following:
• Basic data and targets to be entered
• Planned currency for transactions, and the local and group currencies
• Planned types of main and additional quantities
• Standard period allocation keys
• Input units (hundreds, thousands, millions)
• Planned number of decimal places
• Plan version identification
• Data objects to be used
The plan parameters are dependent on the authorization profiles of the users. Not
all users are allowed to alter certain parameters.
NOTE: You can specify for display at any time sets of plan parameters to be used as the basis for planning and
for suggesting more appropriate amounts to be set as targets.
Planning Perspectives
Centralized planning entails planning cost elements, such as for all cost centers.
Decentralized planning plans for each cost center individually. The Special
Purpose Ledger accommodates both perspectives, and you can switch between
perspectives online.
The technique of setting up plan parameters enables you to begin the planning
process with a complete plan that can be used without altering anything. On the
other hand, any of the parameter values can be changed if the user is so authorized.
The distribution functions can be changed, as can the sets of account totals and
subtotals upon which they act. Individual amounts can be overwritten.
NOTE: Each version of a plan can be stored for later comparison.
Many standard ways exist for distributing planned amounts. Annual or quarterly
input values are usually distributed to planning periods by using one or more
distribution keys.
A distribution key is a tag or code that can be used simply as a label, or it may
refer to a complex data object that serves as a distribution formula. A standard
distribution key distributes an amount equally to every working day in the current
month, for example. SAP R/3 offers a wide variety of standard distribution keys,
and the user can define unique keys available for use with other planning periods
or other versions of the plan.
Other distribution keys can be used with various planning objects, such as sales,
personnel expenses, and so on. There are standard keys for product groups and for
product types such as semifinished products. Such keys can be used to plan for
production cost centers so that, in this example, the value of semifinished products
appears in the Special Purpose Ledger reports under that heading. In this case, such
a value also attracts a designated share of the cost of warehousing or other
assessments.
This system of distribution keys can be used with the suite of distribution functions
and the logical concept of sets to arrange for a flexible and focused planning
system that can be adjusted to suit changing business conditions.
Posting Technique in the General Ledger
The General Ledger is a primary recording mechanism that must be maintained at
the highest standards of propriety. The SAP R/3 system complies with the U.S.
GAAP principles and with the legal requirements of more than 40 industrialized
nations. This standard can be reached only if there is complete recording of all the
necessary data at the point of origin. It will not suffice to assign posting data to
origins and accounts at some later time.
To be reliable, precise, and comprehensive, every element of data must be
associated and recorded together at the time the transaction is posted. This record,
an SAP transaction document, is then locked against further editing to that it can be
recalled in an audit trail with the assurance that the information it contains is truly
the original data.
The posting data must include sufficient information to achieve the following
standards:
• The organization and person who originated the transaction must be
identifiable
• The date and time of the transaction must be recorded
• The organizational unit or department responsible for the accounting
aspects must be designated
• The details of the transaction items must be unequivocally specified
Understanding Origins of General Ledger Postings
A posting to a General Ledger account can occur as a result of any of several types
of events, such as the following:
• An operational transaction occurring in an active and integrated
application module
• A posting transaction in a subsidiary ledger
• A transaction assigned to a General Ledger account
For example, if the MM-Materials Management system is active and integrated
with the General Ledger, an issue of goods automatically posts a transaction that
prompts an inventory reduction posting to document the corresponding reduction
in value.
If you install and configure the FI-AA Asset Accounting module, when you
acquire a new asset (such as a plant item or a warehouse), automatic posting of the
change of value can be arranged in the Asset Acquisition account of the fixed
assets subledger. If you have the authorization and the FI-GL General Ledger
module is active, you might be able to post directly to a General Ledger account.
Understanding the Relationship of Subledgers to the General Ledger
The existence of subsidiary ledgers is a matter of convenience for the users rather
than a legal requirement. Subledgers are completely and comprehensively
integrated as part of the General Ledger. This means that there are several ways in
which the subsidiary and General Ledger can be treated as a single system:
• Master data is common to general and subsidiary ledgers.
• Master data parameters can be shared across general and subsidiary
ledgers.
• Transaction data is shared.
• Data can be mutually verified for correctness and validity.
• Reporting automatically uses both general and subsidiary ledgers, as
necessary.
• The chart of accounts is shared.
• All the account assignment elements of the subsidiary ledgers are
integrated with the General Ledger, including cost accounting elements.
Transaction data is held in a database that makes no distinction between general
and subsidiary ledgers. A line item of subledger accounting is in complete
correspondence with the original data and the account assignment, as recorded in
any central document.
The effect of using a shared uniform database for all ledger data is to provide the
following advantages:
• Data is created and maintained without redundancy.
• The database is accessible in the same way by all the installed and
configured applications.
• All transaction documentation can be verified and reviewed.
• Any customized reporting and information systems can access all the
data.
The integration of data is facilitated by the SAP system of standard account
assignment terms. These are provided by the system and can be edited during
customization. Thereafter, however, the terms are used as fixed codes that are
assigned to all transaction documents. If a document flows through a business
transaction sequence, it is processed with the standard assignment code.
One of the advantages of this mechanism is that each posting is identified by its
assignment code when records are selected for any evaluation or reporting purpose.
By this means, all the relevant data sources are collated when the uniform database
is accessed.
To the user, the common integrated database is apparent only by implication, so it
appears that data is reliably communicated to all the necessary places. From the
accounting point of view, the shared database ensures that the General Ledger and
the subsidiary ledgers are always reconciled.
Financial information compiled from the shared database automatically includes
the very latest postings to assets and profit and loss accounts. Conversely, you can
see immediately how any particular transaction posting affects the assets or profit
and loss positions.
NOTE: For the compilation of reports, the possibility always exists of using the balance sheet and profit and
loss statement data from the subsidiary ledgers. You also have the option of allowing the user to drill down the
data to the single document level, if necessary.
Understanding Data Entry Techniques
The entry of data is subject to authorization. As an added benefit, a user can set up
posting facilities that will be reconstructed every time the user profile is evoked.
Each user and each piece of information can be scrutinized so that data entry is
permitted or blocked according to a wide variety of filtering principles, such as the
following:
• Users can be confined to or restricted from a particular account.
• A user can be allowed to post only to accounts belonging to a specific
company code.
• A user can be confined to a business area but not to specific company
codes.
• A user can be confined to a cost center or a cost object.
NOTE: Before a document posting is accepted, data is checked for validity against related data in the
document.
Closing the General Ledger During the Fiscal Year
The SAP R/3 system includes programs to automate year-end closing so that it can
be generated quickly and reliably. The following tasks must be performed to close
the General Ledger and the subsidiary ledgers:
• Close the posting period to prevent further postings to the accounts.
• Evaluate open items.
• Evaluate balances in foreign currencies.
• List by due dates all incoming payments, including open items.
• List by due dates all outgoing payments, including open items.
• Determine vendors with a debit balance.
• Determine customers with a credit balance.
• Post re-valuations.
• Post adjustments.
• Post accruals and deferrals.
• Print the balance sheet and the profit and loss statement.
Reporting at Closing
The reporting system of the General Ledger is particularly flexible. You can use it
to report by any field that is already defined for accumulating subtotals.
Installations of SAP R/3 differ according to the needs of the customer, but there
may be account subtotals for planned data and actual data, for product groups and
business areas, and for individual products and cost centers. Many permutations
could make business sense for a particular user. Even the choice of time period
may be an important matter for individual purposes. SAP R/3 can work with up to
365 time periods a year.
Using Standard Reports Available at Closing
Standard reports are available for the main tasks:
• Reconciling and controlling account subtotals
• Providing an audit trail for internal and external auditors
Many reports are available to be compiled in real time to provide information on
the elements of the closing process. These elements include the following:
• Posting totals reports
• Open item account balance audit trails
• Transfer balance sheet account balances with multiple carry-forwards
TIP: When posting to the previous year, it is useful to call for a report on the permanent standardizing of
balance carry-forwards.
All the closing reports can be executed at any time for monitoring and analysis.
They may be examined interactively to provide a current business accounting
service. The main reports in the General Ledger are available online, with a range
of sorting and presentation options to help in year-end closing and final reporting:
• Chart of accounts
• Account statements
• Balance sheet with profit and loss statement
• General Ledger
• Advance return for tax on sales and purchases
• Document journal
• Posting totals
• Balance sheet adjustments
• Reconciliation of documents with monthly debits and credits
• Customer open items
• Customer open items by General Ledger indicator code
• Overdue Receivables
• Open checks
• Open item account balance audit trails
• Line item journal
• Accumulated balance audit trial
• Vendor open items
• Accounts Payable in local currency
• Bill of Exchange Register
Using Report Writer and Report Painter for Custom Reporting
Many of the standard reports are available to call without additional parameter
entries. However, if you require reporting from user-defined ledgers, or if your
presentation needs are not best served by a standard report, then you have available
a flexible system of designing custom reports.
Short reports can be generated interactively. Large volume reports are scheduled
for offline output. The normal output media are screen, printer, sequential file, PC
file, and the SAP Business Graphics component.
The advantage of interactive reporting is that you can change the report structure
and explore the data immediately. The SAP system of using a table of parameters
to specify report design enables you to make the following revisions online:
• Change the level of detailing
• Change the subtotaling
• Change the content of the columns
• Output all or parts of the report to file or to a printer
Display controls enable you to change what you see, such as with these functions:
• Switch to another report with another perspective
• Select a row in the report and see the whole of the SAP document upon
which it is based
The Report Writer is a component that enables you to select from a menu any
reported total and evaluate it along any of the dimensions that were used to
compile it. To exercise the full functionality of this tool, it is best to use the
extensive and powerful control elements called by keyboard entries and special
function keys.
The Report Painter provides a graphical interface to most of the functions of
Report Writer. Both systems require you to select or enter the parameters for the
report you are designing. The column and line layout of a report are designed
independently of the individual report and can be maintained separately even
though they are shared by several reports.
In designing a custom report, you must make decisions on the following options:
• Which standard or user text elements should appear in the report
• Which column width layout to adopt from a set of predefined system
standards
• Which dimensions appear in the lines
• Which summation levels to include
• Which values should appear in the columns (such as actual, planned,
monthly, quarterly, or total year values)
• Which data to use
• How the key figures should be derived, and what formulas to use
The reporting system of the General Ledger gives you the ability to extract
pertinent data and process that data so you can present it in the ways that best serve
effective decision making.
The following possibilities illustrate the range of functions:
• Print part of the onscreen report
• Generate graphics from part of the onscreen report
• Select an area of the report (a group of row items and some of the
columns) and call on SAP Business Graphics to present the data in one of a
range of graphical styles that you can subsequently adjust and annotate
before storing or consigning them to one or more of the output routes
• Drill down on report lines to inspect the individual documents
• Change the parameters to alter the content of the columns
• Change the level of detail and the summation levels
• Evaluate the same data using another report structure and take a different
point of view
NOTE: Any onscreen report can be saved to a file for inspection by other users.
Understanding Report Output Media
Reports can be produced online or in batches. They can be stored for later analysis
or printing, possibly by other users or through specialized output devices. The
range of output routes available for reporting includes the following:
• Online screen listing with user control of format and content
• Printing in accord with ad hoc designs to replicate screen reports
• Printing to standard report formats
• Printing to customized report formats and selected destination printers
• Printing to sequential files in the system for subsequent processing or
printing
• Printing to local PC files available to selected network users
• Sending graphic reports to screen or printers with SAP Business Graphics
Understanding Financial Statement Report Formats
Taken together, the main reports in the General Ledger satisfy the legal
requirement that a company publish an annual financial statement. The essential
components of the company financial statement are as follows:
• Fixed assets
• Current assets
• Equity
• Debt
• Profit and loss statement
These essential requirements relate to the basic elements of the chart of accounts,
from which the financial statement is constructed. A complex company is required
by law to present a financial statement for each of its components separately and a
consolidated statement for the group or company as a whole.
There may be a different chart of accounts for each company in a group. SAP FI-
GL General Ledger accommodates all these variations of organizational structures
when preparing the financial statement.
The process of designing or customizing the format of the balance sheet and the
profit and loss statement entails specifying the following details for each account:
• Levels of account detail
• Headings and subheadings
• Text
• Subtotaling and totaling
Separate formats can be designed according to the target readership of the financial
documents, such as the following:
• Stockholders and tax authorities
• Group requirements
• Profit centers
Facilities have been provided as extensions to the balance sheet functions. They
enable you to draft financial statements in a wide range of formats to suit all types
of company organization. These facilities have been integrated and placed under
the control of a sophisticated user interface.
NOTE: Balances on all accounts are always current. Therefore, a profit and loss statement or a balance sheet
can be prepared at any time.
Reporting Operational Control Data at Closing
In some companies, the reporting structure used for the legal financial documents,
the balance sheet, and the profit and loss statement is the same as the structure
through which the company is organized and managed. However, mergers and
restructuring may cause the operational structure of the enterprise to differ from
the legal reporting hierarchy. In other words, the balance sheet elements may not
correspond to the controlling elements.
For example, there may be separate groups of investors in the corporate enterprise
as a whole and in some of the constituent companies. For balance sheet purposes,
each of these investor groups requires a separate set of financial documents.
However, efficient management of the enterprise on a day-to-day basis may be
better served by a structure of formally defined business areas, profit centers, and
cost centers. This operational structure is the one used for transaction accounting
and controlling. The various accounts are then reconciled and consolidated to
provide the balance sheet and profit and loss statements directed at the company
structure and its investor groups.
In the SAP R/3 system, both types of structures can be supported at all times. You
can nominate a business area and call for reports to show the cash flows across all
company codes. You can nominate a company code and see how it has operated
across all business areas.
Any of these reports can be predefined or copied from sample master designs for
the standard reports, and the periods can be defined to suit your requirements. All
the reports can be generated offline or online because they evaluate and analyze the
posted account data directly.
Understanding Balance Sheet Reporting Principles
The main elements of the General Ledger are the balance sheet and the profit and
loss statement. These elements must be defined specifically for each of the
company’s operations so that they correctly portray in the closing report the assets,
liabilities, expenses, and revenues of the company over the reporting period.
The SAP R/3 General Ledger facilities enable you to specify the following
parameters:
• Level of detail to be reported
• Account classification structure
• How the items and subitems are to be assigned to each of the accounts
• What standard text elements are to be printed, and how they are to be
arranged and formatted
• Which totals and subtotals are to be computed, and how they are to be
captioned
A complex multinational enterprise must be able to generate financial documents
in several versions to suit the target readership and the legal requirements of the
nation that is host to the company code being reported. The following versions of
the balance sheet and the profit and loss statement can be generated in parallel:
• Commercial law edition
• Tax law edition
• Corporate group financial document set
• Operational group balance sheet and profit and loss statement
NOTE: If your corporate enterprise operates with more than one chart of accounts, you can instruct the
financial system to generate reports that select accounts from any of the charts.
Using the Financial Document Interface
The balance sheet and the profit and loss statement are generated from the posting
data. Therefore, you can call for them at any time. You can also recall data from
previous periods so that your display shows the differences. If you call for planned
data for any past or future period, you can again view the comparison and have the
display reformatted to highlight the significant aspects.
You always have a choice between tabular and graphic representation of any data
assembled for a report. You can also send this data to a specialized evaluation and
analysis system, for instance, to apply statistical techniques to it.
If you become interested in the movements of values through time or through the
accumulation of transactions, you can command the system to step through the
data using increments of your choice. What’s more, you could also display the
movements of value in graphical form. Your viewing focus can be the accounts
themselves or the stream of transaction documents that have contributed to them.
If a subledger is of interest, you can inspect summaries of the data across periods
or product divisions, or across profit centers or cost elements. You can drill down
through the data until you reach the line items themselves.
An existing item may include text. A summary may have had text added by a
previous user. You may wish to append text to comment on or explain some aspect
of the data that you think important. You can use standard texts for the common
business names and phrases to conserve data storage and processing resource. You
may also generate and append free text.
The financial documents can be generated in different versions that can use up to
10 hierarchy levels to differentiate the details of any particular account. By this
means, you can accommodate the readers who need detail as well as those who are
content to see only summary values at one or more of the hierarchy levels.
The period results of accounting calculations can be drafted according to different
conventions, such as the following:
• Alternative versions for different currencies
• Comparisons of actual and planned values
• Comparisons of current and previous reporting period
• Comparisons shown as absolute differences, percentages, or index
figures
• Transaction accounting using a flexible start and finish date to define the
reporting period
• Opening balance sheet with progress shown as a balance carried forward
• Cumulative balance carry-forward to the reporting period
Any of these accounting conventions can be combined, and the design can be
saved as a report specification version.
Using the Financial Information System
The Financial Information System (FIS) is a subset of the functions available in the
Enterprise Information System (EIS) developed to integrate all the reporting
functions of the SAP R/3 applications. The FIS creates separate reporting
databases, which summarize the main FI-GL, FI-AP, and FI-AR databases.
Analyzing a Balance Sheet
The profit and loss system of Financial Accounting can be seen as a hierarchy in
which the summaries of profit or loss are based on many layers of subsidiary data
sources, down to the level of the individual transaction document. It is a legal
requirement that these pathways back to the sources be traceable, if necessary,
using audit trail methods. The SAP R/3 system is prepared for this because the
component data elements of any balance sheet total can be identified by selecting
from the database all transaction documents bearing the code of the chart of
accounts item on which that balance sheet total is accumulated.
A parallel set of data is maintained for planning purposes in the General Ledger
application, and this set is also used by the CO-Controlling application. From the
EIS or the General Ledger application, you can call for multiple variance analyses
to compare actual and planned values on the following bases:
• Annual planned versus actual
• Semi-annual planned versus actual
• Quarterly planned versus actual
• Monthly planned versus actual
Using Balance Sheet Key Figure Reports
If you are accustomed to reading balance sheet reports that include presentations of
key figures computed in a manner particular to your company, you can set up such
reports in the General Ledger system. You may find it convenient to use as your
starting point one or more of the many standard balance sheet key figure reports
that are available as models you can copy and edit.
Understanding Reporting Options
Evaluations of key figures, subtotals, ratios, and similar arithmetical formulas can
be performed on demand or to schedule for all organizational units, such as
Client*, company code, and business area. The period of these reports can be based
on a fiscal year, a settlement period, or any time period you have established as
significant for your enterprise. The currency of a report is under your control. You
can generate reports with currencies in parallel from the following list of currency
types:
• Group or Client* reporting currency
• Hard currency on a specific currency market
• Indexed currency
• Company currency for each company code
• Global currency for cross-system reporting and interface
Any SAP R/3 report can be generated anew from the most recent postings relevant
to it. You may also have a database system installed to collate the necessary
documents in preparation for reporting. This arrangement enables you to conserve
the system resources in favor of more urgent processing that cannot be delayed.
Although the data for reports can be collated from the original document sources,
two techniques are popular because they save work and minimize errors. The first
is to define reports as standard entities that effectively specify the data storage
pathways that must be traversed to find the sources of information needed. The
second technique is to have the database system locate only those records that have
changed since their previous use in a report. This technique is sometimes referred
to as Delta database management because the Greek symbol is often used to
represent a very small change in a quantity.
All the functions described in connection with the FI-SL Special Purpose Ledger
component are available from the FIS. The information systems provide additional
control over the reporting procedures of the extended General Ledger.
In summary, the FIS enables you to operate flexibly on any subcomponent of the
constituent reporting functions. You can therefore access any data element in your
system, assuming you have the authorization to do so. If you have a distributed
database system that includes third-party systems, there may be some restrictions
concerning the level of detail to which you can return in the event of an auditing
query on the original transaction documentation.
The FIS offers the following manipulative options on financial report objects:
• All standard reporting functions can be deployed.
• Customized procedures can be called upon to define, select, evaluate,
and analyze financial and planning data.
• Data on the screen can be highlighted by the user and is subject to drill-
down, which is a sequence of recursively more detailed reporting of the
data set identified by the cursor.
• Any defined data set can be integrated with evaluations that have been
set up for specific company operations and that take part in customized
analysis and reporting. This may entail using particular reporting interfaces
to associated systems.
• Any reporting procedure can be integrated with operational processes by
using text, code, and standard messages to and from the operational
facilities.
Taking Advantage of the FI-SL Functions
The facilities of the Special Purpose Ledger enable you to simultaneously run
ledgers that can instantly portray the business situation from any or all of the
following points of view:
• Profit and loss
• Effective drivers of the balance sheet movements
• Departments responsible for the best and worst profitability evaluations
• Comparative performance of the company codes
• How individual business areas are being served by different company
codes
• Locations of the units that add the most value and consume the most
resources
• How costs are incurred by the products and services provided
• How costs are incurred by particular projects
The currency of a Special Purpose Ledger is that used for the original entry of the
business transactions. Two additional currencies can be designated by the user to
be maintained in parallel. You can choose from company code, index, group,
global, and ledger currencies.
Conversion between currencies always uses the exchange rate prevailing when the
transaction document was first entered. You can also arrange for other conversions
to be applied to the data.
The quantity units of SAP R/3 can be supplemented by units you have specified for
your own purposes. Any of these units can be designated for use in a Special
Purpose Ledger. For example, you could generate totals of some materials
expressed in the units used when purchasing. You may also require totals to be
drafted in terms of the delivery units.
The posting period of a Special Purpose Ledger can be any length. The General
Ledger maintains weekly and daily sales analyses. But you can set up a Special
Purpose Ledger to have the same transaction data assigned to monthly periods, and
another that separates the data according to time periods you have defined. A
Special Purpose Ledger can use more than 365 posting periods per fiscal year if
this suits your reporting requirements.
Your financial control and reporting arrangements probably include the following
services:
• Management reporting
• Individual account closing
• Consolidated financial statements
• Statistical reporting
For these services, your General Ledger and your Special Purpose Ledger store the
information that can be identified and reported to illuminate the following aspects
of your business:
• Expenditures
• Commitments
• Statistical summaries of relationships that represent value flows of
importance to your particular situation
• Salaries
• Depreciation
• Interest
• Vendor invoices
• Sales invoices
• Closing data on particular accounts
• Orders
• Cash receipts
• Disbursements
• Receivables
• Asset acquisitions
• Asset transfers
A standard program is available for comparing and reconciling General Ledger
accounts and the accounts in user-defined ledgers. This function can be called at
any time. If some of the data required by your Special Purpose Ledger is entered in
an external third-party system, it can be transferred through a standard interface.
You can apply validation and authorization checks to data flows for the Special
Purpose Ledger. For example, you could restrict posting to a cost center so that
only a certain group of users could update that particular ledger.
When data is transferred, the Special Purpose Ledger function expands the account
assignment allocation key so that all necessary postings can be affected. The
function accesses the master data of the transferring system so that all the fields
available can be copied.
Additional controls over the updating and reconciliation of Special Purpose
Ledgers include the following options:
• Update at each posting from financial accounting
• Update at every transaction in MM-Materials Management
• Update at every order settlement
• Update according to specified logical conditions
A logical condition is stored as a master record and can be applied for many
purposes. For the control of Special Purpose Ledgers, you can define logical
conditions that are automatically consulted so that transactions of particular types
are assigned to update specific ledgers. The parameters of the logical condition can
be data from any available data field in the system, and no restrictions exist for the
complexity of the numerical or logical operations to be applied. As a result, the
Special Purpose Ledgers are updated according to the rules you define.
Using Direct Data Entry to Special Purpose Ledgers
Although updating Special Purpose Ledgers is largely automatic in an integrated
system of R/3 and its applications, you can enter data directly in the form of a
special document recognized as a record of direct data entry. You may want to use
this facility if you are inputting statistical data, perhaps in connection with
planning or when simulating a what-if situation. You may also need to input data
directly to one or more Special Purpose Ledgers when consolidating company code
accounts. Two other common examples of direct update include planning and
currency translation posted directly to the ledger.
Using Standalone Special Purpose Ledger Systems
The FI-SL Special Purpose Ledger system includes a standard interface for
processing external data transferred from non-SAP systems. This means that the
module can be used independently of any SAP R/3 implementation. This
configuration can be seen in the banking and insurance industries.
Using Allocation in Special Purpose Ledgers
FI-SL includes an allocation function that can automatically allocate or distribute
currency amounts and quantity values from sender objects to receiver objects. Two
types of allocation and distribution are supported:
• Allocation by distribution within a dimension or level of detail
• Allocation by assessment
For example, one cost center could be credited and the amount distributed to other
cost centers, which would be debited on perhaps an equal-share basis. The
administration cost center may have paid for customer hospitality, and this cost
could be shared across other departments by the Special Purpose Ledger module.
Distributing Costs
Three main methods of distribution exist:
• Fixed amount distribution
• Fixed percentage distribution
• Dynamic distribution
In fixed amount distribution, you define the amount to be debited to each receiver
object. The total of these values is credited to the sender object.
In fixed percentage distribution, each receiver is debited with a percentage of the
total that you specify. It is not necessary to distribute the entire amount.
When using dynamic distribution, you specify certain values that have been totaled
in the database of the FI-SL system. These values are then used automatically to
determine how much to allocate to the receivers. For instance, you may distribute
certain overhead costs in proportion to the sales revenues of designated cost
centers.
Using the Set Concept in Ledger Processing
Many of the ledger processing functions accept as valid attributes any combination
of single values, intervals, and sets.
In logical terms, a single value is a set with only one member. An interval is a set
of values taken from an ordered sequence by specifying the lowest and highest
values.
Another way of specifying a set is to name or nominate the members individually.
SAP R/3 stores many set definitions as master records so that they can be referred
to by any of the integrated functions. The FI-SL module accepts set definitions as a
way of identifying senders and receivers.
Special Purpose Ledger processing takes advantage of the set concept to allocate
and distribute among the following types of data structure:
• Single accounting objects, such as individual bank accounts
• Hierarchies of cost centers
• Multilevel relations between individual business entities
By using the set concept, it is possible to echo in the Financial Accounting system
any configuration of companies and business partners so that planning and
reporting can be carried out precisely over the same structure. If the elements of
this structure do not correspond exactly with the accounts of the General Ledger,
the Special Purpose Ledger functionality can be installed and configured to build a
faithful accounting model for your enterprise.
Planning in the Special Purpose Ledgers
The essentials of a business planning system are the accumulated actual values and
a method of setting planned or target values that map to the categories used to
accumulate the actual values. For example, you can take your most recent sales
total and declare a planned sales total that equals the actual total.
The FI-Financial Accounting system is based on transaction data. Every precaution
is taken to ensure that no user can enter values that could be mistaken for actual
transaction data, unless they do indeed result from a valid business transaction—
such data will be present in the chart of accounts and therefore in the company
balance sheet and the profit and loss statement.
Planning data is always identified as such. It is entered as a total value for one or
several accounting periods, among which it can be distributed by a variety of
standard functions. These distribution functions are the same as those used by the
Special Purpose Ledger module, which is capable of serving as an extensive
planning tool.
Using General Planning Parameters in FI-SL
A master record is established for each version of a plan so that it can store general
data and requirements for the planning process. These values, referred to as the
planning parameters, both describe how your plan is to be constructed and suggest
values to be used in it. The planning parameters cannot be altered by a user who
lacks the requisite authorization profile. Each user can have access to only a
limited set of planning parameters.
A planning parameter is a data object that stores the following types of
information:
• How the planning total is to be entered or derived by calculation,
perhaps using cost center areas that do not correspond exactly to the
accounts to which the actual data is assigned
• The transaction currency, as well as the second and third currencies
• Primary and additional quantities suggested for this plan
• Standard or user-defined distribution keys used to specify the method of
allocating the total across the receiver objects
• The units assumed for the total when it is entered, such as hundreds,
thousands, or millions
• The number of decimal digits in the planned values
• The plan version number to which this parameter belongs
• The receiver objects to which this parameter applies, such as work days
per month
You can change any of these parameter values temporarily during a planning
session if you want to conduct a flexible what-if experiment. You can save your
experimental plan, but it will not recognize a new or revised parameter unless you
have an authorization profile that enables you to release planning parameters for
use by others.
Using Distribution Keys
A distribution key is a record of a defined procedure used to allocate values from a
sender to one or more receivers. Each key can have a name that suggests where it
is used, although you can use any distribution key in any planning activity. You
can take a standard distribution procedure, or one you elaborated earlier, and
assign a name to it that then appears in any planning parameter you design.
If an appropriate distribution key is not available, you can enter the individual
planning values directly for each period.
Understanding the Scope of Special Purpose Ledger Planning
The planning perspective is defined as the combination of the planning periods and
the method of selecting or nominating planning objects. The FI-SL module is
completely flexible in this respect.
For example, you can set up central planning in which you establish a set of
planning cost types that apply to all cost centers in your corporate enterprise. You
can also use the same FI-SL module to conduct decentralized planning, in which
you designate a set of planning cost types separately for each cost center.
Reporting from the Special Purpose Ledgers
You can regard the Special Purpose Ledger system as a dedicated support facility
for management reporting. Suppose you settle on the following set of reporting
requirements:
• Product results for each product
• Weekly and daily reports on demand
• Monthly, quarterly, and annual reports
• Comparisons of monthly, quarterly, and annual totals
• Key figures and ratios
• Short- and long-term projections
• Elimination of intercompany sales on selected reports
If such a list corresponds, even approximately, to your reporting diet, the Special
Purpose Ledger module would seem to be an essential element of your business
data processing arrangements.
Two data structures must be collated to feed such an extensive reporting
requirement:
• Each cost center must identify the transaction data by account
assignment, by accounting period, and by product for all the business
within its responsibility.
• The data in all the cost centers must be consolidated and arranged by
product group and business area.
Each entry of actual values in such a system of data structures must be matched
with a planned value.
Using Workflow with the Financial Calendar
The Financial Calendar is a planning and monitoring tool specialized for the
preparation of closings and the efficient conduct of the recurring tasks associated
with financial management. The Financial Calendar can be used in conjunction
with SAP Workflow to plan the following kinds of accounting tasks:
• Periodic dunning runs
• Periodic payment runs
• Periodic evaluations of specific accounts or groups of accounts
• Automatic messages and instructions for key period closing functions.
If you install and configure the Human Resources module and note in it the skills
and capabilities of your employees, the workflow can be arranged to assign a
suitable and available person to each task as it becomes due. The workflow
schedule is available at all times to authorized users so that the workloads and task
assignments are apparent beforehand.
The Financial Calendar component is responsible for the following functions
associated with future tasks:
• Displaying all planned tasks in preview format
• Displaying all planned tasks in overview format
The Financial Calendar component is responsible for the following functions
associated with previous tasks:
• Displaying all planned tasks to determine how and by whom they have
been accomplished
• Reviewing all planned tasks that have been executed automatically
• Tracking specific sequences of completed tasks
If you plan tasks to be carried out as manual activities, the Financial Calendar can
provide the following support facilities:
• Displaying the status of any task
• Assigning tasks to a specific user
• Assigning tasks to a group of users defined by their authorization and
experience or qualification
• Defining recurring standard tasks
• Distributing assigned tasks among available users
The Financial Calendar can operate in either of two modes:
• Given a date or period, the Financial Calendar can list the scheduled
activities.
• Given a preconfigured activity or set of activities, the Financial Calendar
can report the time of the scheduled tasks and the name or the qualifying
attributes of the person assigned to each.
The Financial Calendar component can be installed and configured to integrate
with the Financial Accounting system, with or without the Human Resources link.
The SAP Workflow module is a standard application that can be used with the
financial activities alone, or as a cross-application scheduling tool that can be
controlled over an intranet or through the Internet. These configuration possibilities
provide a flexible means of adjusting your company’s activities to the nature of the
work and the workloads in relation to your available resources.
Chapter 3
Using Subledger Accounts
In this chapter Understanding Ledgers and Accounting
Understanding Accounts Receivable
Using the Customer Master Record
Understanding Customer Transactions in Accounts Receivable
Processing Incoming Payments
Using Special Transactions in Accounts Receivable
Understanding Document and Account Processing
Using Automatic Correspondence from Accounts Receivable
Reporting Customer Accounts
Managing Customer Credit
Using the Accounts Payable Module
Working with Vendor Master Records
Understanding Transactions in Accounts Payable
Using Automatic Payment Functions
Understanding Ledgers and Accounting
Various traditions of accounting have developed concepts and assigned titles to the
departments responsible for carrying out the work activities. Thus Accounts
Receivable or Receivables are recognized as departments that keep track of value
owed to your company. These may also be the titles of ledger accounts in your
Financial Accounting system.
This chapter sets out the pivotal functions of the FI-AR Accounts Receivable and
FI-AP Accounts Payable modules of SAP R/3 that manage these subledgers of the
General Ledger. These functions address the following questions:
• How does money come?
• How does money go?
• How can my company organize these processes?
You will find that most accounting activities can be automated without losing
control because the FI-AR and FI-AP modules reliably report any difficulties and
suggest how you can remove them.
The SAP R/3 system uses the following structure of accounting function entities.
• General Ledger is the master record maintained using the defined entity
type 2107 in the enterprise data model, upon which the R/3 operates.
• Each account in the General Ledger is recorded in a record of the type
General Ledger Account–Transaction Figure.
• If there are many creditors, a Subsidiary Ledger–Creditor is defined as an
entity of type 2108, which is reserved for the company code credits account
records.
• A subsidiary ledger, or subledger, is an integral part of the General Ledger
and is regarded as a legal extension of it for balance sheet purposes.
• A special ledger or special purpose ledger is a grouping of accounts that
are held separately from the General Ledger and are used for alternative
reporting purposes specified according to the requirements of your
company. This type of ledger is not subject to legal restrictions.
Understanding Accounts Receivable
FI-AR Accounts Receivable is a module of the SAP R/3 Basis system. It is
specialized to maintain the Accounts Receivable subledger of the FI-GL General
Ledger and completely integrated with it at the following levels:
• Master Data
• Transaction Data
• Reporting System
The General Ledger and its subledgers share the common chart of accounts with all
applications and also share all the details of master records. Reporting can draw
from the General Ledger and the Accounts Receivable subledger.
The purpose of the Accounts Receivable subledger is to keep track of customers
and the transactions that involve them. Its job is to collect money, to process cash
receipts, and to dun customers who are late in paying. This subledger shares the
same accounting needs as the SD-Sales and Distribution module, which is also a
core module of the SAP R/3 Basis, and IT is fully integrated with it at the software
code level.
Transaction data is stored centrally in the document database, and the
corresponding line items and details are stored in the appropriate subledgers. The
system automatically updates a subtotal of a balance sheet account for every
business transaction and reconciles the account subtotals and the line items to
ensure that the financial information is always correct and current.
Every transaction creates an SAP document, and the data is immediately posted to
the General Ledger. Every business transaction recorded in this way automatically
updates the balance sheet or the profit and loss statement. This is the defining
characteristic of an up-to-date accounting and controlling system.
NOTE: The SAP system maintains account balances by debits and credits for up to 16 periods.
Using the Customer Master Record
The Accounts Receivable functions are shared with the SD-Sales and Distribution
application. The customer master record is maintained as a common reference for
all the information about a customer that could be of use within the company.
Access to this data can be controlled through the Authorization Profile System,
which can also regulate the updating of customer information.
NOTE: The central database of customer information is the source for decisions on automatic dunning and
automatic payment.
The sales organization need not have the same organizational structure as the legal
structure of the company. One sales department can handle products from two or
more associated companies. The system of customer master records makes
provision for this.
Master data is organized into the following three parts:
• General data
• Data applicable only for specific company codes
• Sales data
General data about each customer is available to every company code and every
sales department. It includes such items as the following:
• Name, address, telephone, fax, and modem number
• Customer registration number
• Line of business and business group
• Bank account data
For each individual company using a shared sales organization, there may be
different entries for each company code to reflect their different business methods
and any existing agreements. These can include the following:
• Standard payment terms
• Data for dunning overdue accounts
• Data for direct debit or automatic payment
• Data for correspondence, such as the account number and name
If more than one sales department in your group sells to the same customer, you
must specify a General Ledger reconciliation account for that customer. This is
identified in the customer master record.
Sales data in the customer master records may be helpful in initiating a relationship
between a sales representative and a customer. For example, a sales representative
may want to retrieve from the database the name and title of the customer company
buyer responsible for purchasing a specific range of products or services. This kind
of information can also be held as part of a sales support function.
The sales information section of a customer master record also includes the order
processing, shipping, and invoicing data required by the SD-Sales and Distribution
application.
Strategic sales data can be held in the customer master record. For instance, you
can specify whether a new customer master is to be made available to all your
departments or only within specific areas. One alternative is to make the general
customer data central and maintain individual database records for the
departments, such as accounting and sales.
Making Sales to an Affiliated Company
Among your customers you may have one or more affiliated company code
departments of your own corporate group. If you wish to use the SAP
Consolidation module in reporting, any intercompany sales achieved through
business transactions with such customers must be eliminated from the company
accounts before closing. Therefore, the ID code of other members of your group
must be entered on the customer master record so that it is automatically
transferred to the document when posting.
Processing Master Data Records
Access to customer master data records must be controlled by limiting the staff
authorized to modify certain data fields. This method involves using the system of
authorizations to restrict certain functions that can affect the critical fields of the
customer master records.
TIP: Separate functions can be authorized individually to create, change, or simply display customer master
records. These restrictions can then be applied to general data, accounting data, and sales data.
When a new or prospective customer is identified, a new master record is created
and assigned to an account group. The account group determines whether you may
assign account numbers within specified ranges or whether the system does this
automatically. Your implementation can include a supporting system that generates
account numbers that are then adopted by your SAP R/3 accounting application.
Your system is not allowed to assign the same account number more than once, but
both customers and vendors can exist within the same range of numbers. The
numbers can also be assigned on the basis of a hierarchy or classification of
customer accounts.
The account group also controls the fields that are active in this master record. You
can pick the fields offered by the account group and assign them to one of three
categories:
• Fields into which the user must make a valid entry
• Fields the user can either leave blank or make an entry into (optional
fields)
• Suppressed fields that do not appear on the screen
NOTE: A whole screen of fields can be suppressed if it is not needed for a particular transaction. You can use
field groups to control certain fields of sensitive information within a customer master record to specify
authorized users.
The FI-AR Accounts Receivable system makes it easy to create master records by
offering various options.
• By using a search function, you can inspect the master records of
customers similar to the one you are entering.
• You can copy the master record of an existing customer and edit the
unwanted details to make it into a new master record.
• You can copy a master record from a reference record that has been
established for the purpose. You must make at least one alteration to it
before you post it as a new master record.
• You can create the new customer master record by entering all the
necessary details.
After you enter and store a customer master record, you can call it back again and
change almost any of the fields. You have a choice of whether to go through all the
fields or work on a single subset of fields, such as the payment details. Master
records can be selectively displayed so that you see only those fields of interest to
you.
NOTE: Any changes you make to any record in the customer master database automatically leaves a change
record that can be accessed to form an updated history.
Using One-Time Accounts
If you think a customer probably will not become a regular purchaser, you can set
up a one-time account by selecting a special function. This creates a master record
that contains only the essential control data, such as the number of the
reconciliation account to which this sale will be posted. The system can provide
the customer name, address, telephone number, and bank account data when an
invoice is entered. This information then arrives in the one-time account master
record, where the dunning and payment programs can find it.
Using Customer Head Office and Branch Accounts
Your customer contact may be a branch with its own account, but the head office
may foot the bill. In this case, you can enter the head office account number in the
master record for the branch customer. When you enter a transaction to the branch
account, the system posts the transaction to the head office account, leaving a
cleared entry on the branch account to show who received the goods or services.
The master record includes data about the branch and a reference to another record
to give details of the head office. By this means, dunning letters can be sent to the
head office, the branch, or both.
Receiving Payments from an Alternate Payer
Your customer may not have to deal with his own payments. You can record in his
master data the account number of the alternate payer, and the system then
processes direct debits, return transfers, and other customer payment business
through the banks of the other payer.
If you post customer invoices to an affiliate, you must record in the master data of
the branch customer a group-wide company account number to be used during
consolidation to eliminate the invoices that would otherwise appear twice in the
company accounts. The system is capable of looking at the transaction documents
bearing this group-wide company account number and then identifying any entries
that are replicated because the payment was made by an affiliate that was not the
original customer.
NOTE: A customer may have an arrangement whereby any overdue payments must be dunned to an
alternative address. This is recorded in the customer master record and is used if dunning is necessary.
Understanding Customer Transactions in Accounts Receivable
As soon as the master data is stored for a customer, a customer transaction can
occur. If the master record is for a one-time account, the data will be sparse.
If you installed and configured SAP SD-Sales and Distribution with the SAP FI-
Financial Accounting system, invoices entered in the SD system are automatically
posted to General Ledger accounts in FI. Otherwise, the route to the FI-GL General
Ledger accounts runs through an SAP open interface, which transfers and posts
invoice data to General Ledger accounts automatically. If you must manually enter
an invoice that has not been posted automatically, SAP R/3 provides all possible
help. You can enter and post a check received and match the payment to specific
open items in the customer account, all in one operation.
The successful posting of a transaction does not occur until the necessary data is
recorded as an SAP document and is complete and error-free. You can set aside a
transaction document before it is ready for posting, in which case the system
validates any information you have already entered and reports to you any
discrepancies.
The SAP document must end up with a document header showing posting date,
document date, document reference number, and currency key. The body of the
document contains one or more line items that show the amount and identify the
product and terms of payment. The system generates certain line items, such as tax
entries, cash discounts, and exchange rate differences, as applicable.
You can set up helping routines and use standard data entry functions such as the
following:
• Offering default values that you can edit at the time of entry
• Recalling for copying and editing a previous screen
• Retaining data for individual users for several transactions
• Adapting a copy of a data entry screen so that it is better suited to a set
of expected transactions
• Searching for an account number by using matchcodes to narrow the
search
An SAP document that records a previous transaction can be copied to act as a
sample or a model to be edited. This sample can be a regular document that has
been set aside, perhaps as an incomplete transaction document. The posting date
and new values may have to be changed before posting.
Handling Recurring Entries
If you expect to make a series of entries in which the amounts are always the same,
you can set up a recurring entry. For example, one of your customers may be
paying in monthly installments. The entries will be posted to accounts only when
they occur, not when the recurring entry original document was first created.
A recurring entry is a set of data that will not be used until the due dates. Until
then, the entries will not update account balances. You must specify the first and
last dates and the frequency or time interval, and you must supply a deadline date.
The system automatically posts the required transaction on each of the due dates.
Using Invoice and Credit Memo Entry Tools
An invoice, a credit memo, or a transfer cannot be successfully posted unless it is
complete and free of errors. However, an incomplete Receivables document can be
saved, and you can resume work on it when the required information becomes
available. If the document is then posted, it is checked immediately, and
adjustments are suggested for your rejection or confirmation. The criteria for
accepting a transaction include the following:
• The debit and credit balance is zero.
• The assignment account data is complete.
• The mandatory entry fields are complete.
The assignment account data includes at least the following entries:
• Document date
• Posting date
• Document type
• Posting key
• Account number
• Amounts to be posted
Using Entry Currencies
Any currency can be used for document entry to Accounts Receivable. A local
currency will have been assigned to each company code, which is automatically
computed. Two other currencies can be indicated, if required, and are handled in
parallel. The records store the entered amounts in both local and document
currencies. An exchange rate table is consulted to convert between them.
You can also indicate a specific exchange rate when posting. The entry document
master will have been coded to control whether the local currency is open to
posting in addition to the document currency, which is always open for input
during document entry.
A document must have a zero balance in both the local and the document currency
before it can be successfully posted. Small rounding differences are automatically
taken into account. Transaction amounts are kept only in the local currency of the
customer area. The reconciliation account for Receivables From Goods and
Services is kept in local currency and in all the foreign currencies used in posting.
The system can be customized in various ways, which include the following:
• A specific user is obliged to enter amounts in a particular currency, which
can be the local currency or the system document currency.
• A specific user can be permitted to enter amounts in either the local or
the document currency.
Whatever the customizing arrangements, the system displays amounts in both local
and document currencies. It rounds off minor differences, using rules established
for this purpose. These differences can occur when several line items are converted
and then added in both currencies.
The system keeps customer monthly debits and credits only in local currency. The
reconciliation account for the Accounts Receivable subledger is kept in local
currency and in all the other currencies that have been posted.
Dealing with Currency Exchange Differences
A line item can be expressed in a currency other than the local or document
currency. You can enter payments to clear such foreign currency line items using
either the local or the document currency.
The payment expressed in the document currency will have been converted from
the local currency at an exchange rate adopted by the system according to the
approved rules for assigning the daily exchange rate. If this rate has changed from
the rate prevailing when the invoice was written, the payment amount may not
match the open item amount. In such cases, the system automatically calculates
and posts an exchange difference entry to a separate account established for this
purpose.
Processing Incoming Payments
The usual paper form of a payment is a check, a transfer, or a bill of exchange.
Regardless of the form, the processing of an incoming payment must include two
processes.
• Posting the payment to the assigned account
• Matching open invoice lines for this customer with payment line items
and then clearing them if they correspond
Understanding the Basic Procedure for Receiving Payments
A payment for clearing is indicated as a transfer slip or a payment advice note.
Credit memos are indicated in a similar fashion.
Your payment receipt actions are best carried out in a logical order. You must
perform the following steps:
1. Enter the bank general ledger account number.
2. Enter the amount of the payment.
3. Enter any bank charges.
4. Enter the document numbers of the unpaid items to be cleared by this
payment.
5. Apply the rules for cash discount, and deduct it from the total of the
indicated invoices.
6. Confirm that the total of the indicated invoice, minus cash discount if
appropriate, agrees with the input payment amount.
If the totals agree, the payment receipt is then posted. The cleared items should be
annotated to show the clearing date and which incoming payment was responsible.
Searching for Invoices to Be Cleared
If necessary, you can search for all the outstanding unpaid invoices for the
customer using any document-specific search term, such as the following:
• Amount of the invoice
• Reference number of the invoice
• Posting date
You can assemble a list of open items by specifying single values or intervals for
your search criteria. You can combine the results of several searches, and you can
remove items from the list if you do not want to consider them for clearing against
the incoming payment.
TIP: It may be helpful to have the list sorted, in either direction, on any of the values that appear in the listing.
NOTE: If you are focusing on a single line item, you can call for all the data in summary form, or you can
retrieve the entire document.
Minor differences might exist between the payments and the invoices to be cleared
against them. In such instances, you can arrange to adjust values less than a certain
amount through the cash discount, or you can post them to a separate differences
account. You may wish to grant some users permission to exercise more discretion
in this respect than others. You can control this through their authorization profiles.
Searching for Open Items
If the customer has not told you which invoices are being paid (by writing their
numbers on the check or by including an advice note or an allocation notice), you
must use the system to determine this information.
For example, you can call for a search for open items for this customer, but there
may be too many to decide which are being settled by this payment. In such a case,
you can narrow the search by giving exact values or ranges of values for almost
any of the header fields and line item fields that appear on a transaction document.
It is recommended that you use no more than a handful of search fields. The most
useful fields for narrowing a search for open items for a customer include the
following:
• Document Reference Number
• Posting Date
• Invoice Amount
• Posting Key
For any of your searching criteria, you can accept a range of values, such as the
following:
• Any document number between two given numbers
• Any posting date over a specified interval
• Any invoice amount greater than or less than a given amount
• Any posting key out of a short list that you specify
The system’s first response to a search command is to display a summary screen
showing the items found. The summary totals the amounts. If this equals your
customer’s payment, your search is over. If not, you must refine the search.
You might select a few items from the summary screen and examine their details
to find some better entries for a more focused search. The summary screen layout
may be more useful to you if you change its display format by moving or replacing
some of the columns until you are looking at only the details that interest you.
TIP: At any time, you can switch the display between showing the details of a line item and showing the entire
document. This includes the entry offsetting this customer line item, if there is one.
If your search for open items is successful, you arrive at a list of invoices that add
up to the same amount offered as payment by the customer. The system calculates
allowances for cash discounts, and you can check this from the display.
Differences also might arise because of the conversions between currencies.
When your system is being customized, you can specify the limits within which
the system posts minor payment differences automatically. You can also establish
special rules for each user so that any differences larger than a certain amount must
be referred to a user with authorization to deal with them.
NOTE: When the selected open items balance the payment, you can post the document.
Dealing with Open Items
The following are several different types of open items:
• Vendor open items
• Open items for different customers
• Open items with different company codes
Because the FI-GL General Ledger accounts are fully integrated, vendor open
items can be cleared at the same time as customer payments.
The integrated FI-AR Accounts Receivable component accepts each item as an
independent task because each item has access to the complete set of data objects
needed to process it. Therefore, open items can be found for several customers and
cleared by the appropriate payments in the same session.
Open items bearing different company codes can be cleared at the same time. The
system records a clearing document in each company code.
Using Automatic Clearing in Accounts Receivable
If your customer allows you to collect by direct debit, you can use the FI-AR
payment program component, which collects all invoices when due. Reimbursing
customers with checks or by bank transfers follows the FI-AP Accounts Payable
procedures for automatic payment.
If you installed and configured the FI-CM Cash Management component, you can
clear payments automatically. A file transfer can provide your bank statement, and
the system automatically posts the entries to the FI-GL General Ledger as it clears
the matching open items in the customer accounts. Only if the data from the
transfer is incomplete must you intervene.
Automatic incoming payment processing can be supported by the following
specific techniques:
• Electronic account statement
• Lockbox (in the United States)
• POR procedures (in Switzerland)
• Check scans and deposit transactions initiated automatically if the checks
are valid
The requirements for an acceptable electronic business transaction system are
defined in part by the national standards that depend on the legal monetary
instruments in that region. The payer must assign value to a check or other
instrument that can be taken as a contract. The validation of this assignment must
be conducted at the same time as the receiver is notified of the transaction details.
The loop is completed when the receiver acknowledges a valid transfer of value.
The SAP organization is developing improved methods of electronic banking to
further develop this aspect of business data processing.
Using Payment Procedures for Particular Countries
Variations in the legal payment procedures exist for different countries. These have
been encapsulated in the standard business procedures of the FI-AR Accounts
Receivable component. For example, there are differences between national
accounting conventions concerning whether a transaction should be dated for tax
and accounting purposes according to the invoice or to correspond to the
confirmation of payment received.
NOTE: National payment procedures can be specified for your implementation during the customizing
process.
Receiving Partial Payments
If the open items do not balance the payment after cash discounts, you have three
options.
• You can post a payment on account.
• You can clear an open item and post a residual item.
• You can enter a partial payment with a reference to the open item that
remains open.
If you cannot find any amounts to match with the payment, your only option is to
post the payment on account. If you cannot closely match the payment to the open
items, the best option remains posting the payment on account.
If you know the open item concerned and the payment is only partial, you can clear
the full amount of the open item but open a residual item to cover the difference
still unpaid. Alternatively, you can enter the payment with a note that marks the
open item as only partially settled.
If many possible open items exist, you can direct the system to pick open items
without defining any search criteria. The system will try various combinations of
open items to try to match the amount paid. It will suggest a set of items that
together add up to an amount as close as possible to the amount paid.
NOTE: If a bank charge is associated with a cash receipt, you can enter it at the same time. The system
automatically generates and displays a line item for the bank fee.
Understanding the Payment Advice Note Procedure
If the system finds a relevant payment advice note during clearing, it uses that to
settle the incoming payments on the appropriate accounts. A payment advice note
can be entered manually by copying the details from an existing advice note. EDI
(electronic data interchange) can also submit payment advice notes.
If you carry out the manual procedure for receiving payments, you can create a
payment advice note to record the current processing status of any items that are
exceptions, such as those that cannot be cleared directly. You can configure
automatic generation of payment advice notes to take place during the processing
of account statements, check deposit transactions, or Lockbox data, if any of the
items cannot be directly cleared.
The system requires only the payment advice note number to begin to use it for
clearing. If differences exist between the payment advice note and the open items,
the system automatically creates residual items and payments on account. You can
subsequently cancel these if you assign the differences manually or post them as a
total.
Understanding the Debit Memo Procedure
If a customer agrees to operate the debit memo procedure, your system can
automatically collect all invoices according to their due date. The payment
program generates debit memos in accordance with the agreement. Refunds to
customers can similarly be made by automatically generated checks or transfers
initiated by the same program. These functions are described in the section on
Accounts Payable.
Using Fast Incoming Payment Entry Techniques
Two features are designed to accelerate the processing of incoming payments.
• Manual check deposit
• Manual account statement
Neither feature requires user intervention, but the automatic procedure replicates
the manual clerical activities used in the absence of computer processing.
The incoming payment is registered as a check identification code, a check
number, and a payment amount. The payment is automatically posted to the bank
and to the customer account. The payment is settled automatically.
Using Automatic Electronic Banking
The fast entry methods that seek open items in a customer’s account and clear
them against incoming payments can work automatically until the system detects a
difference that exceeds the acceptable limits. At this point, a review by an
authorized user is necessary.
Data can be provided by a bank or the post office in any agreed on format. For
example, the Swiss POR procedure uses a protocol that can be accepted by the
SAP R/3 financial system and posted directly. The United States operates on a
Lockbox system from which SAP R/3 can receive payments and post directly to
clear open items.
A check scanner can be used to acquire payment data for direct and automatic
posting to clear open items.
Using Electronic Account Statements
The purpose of the electronic account statement is to obtain information for
clearing from a Note to Payee field. This indicates the document number so that
the incoming payment associated with an open item for that customer can be
cleared if it balances and is correct in other respects. For example, you can set up a
validation procedure that uses a code particular to your industry. This method is
used in the insurance industry, where the policy identification code is the key
reference.
No limit exists as to the complexity of the security measures in your system. For
example, if you have a particular device or software system that carries out your
identification and security validation, you can arrange to use an SAP User Exit.
This is a software gateway to an external system that can be used as a step in a
workflow sequence without disturbing any of the SAP R/3 system’s standard
business software.
The account statement facility enables you to post payment transaction information
in any of the supported languages and to transmit this information to any country
for clearing against the appropriate items. Transaction information can be
transmitted and received in any of the following international formats:
• BACS (Great Britain)
• ETEBAC (France)
• SWIFT MT 940 (United States)
• MultiCash (United States)
• CODA (Belgium)
• CSB43 (Spain)
• FIDES (Switzerland)
• ZENGINKYO (Japan)
• Various formats (Czech Republic)
• Various formats (Sweden)
NOTE: The SAP R/3 architecture allows additional transaction information formats to be defined and used in
an integrated manner without difficulty.
Using Special Transactions in Accounts Receivable
Transactions that are posted to a customer’s account automatically update the FI-
AR General Ledger Accounts Receivable (a reconciliation account) if they are
invoices, credit memos, or payments. Some transactions posted to the customer
account can update FI-GL General Ledger accounts other than FI-AR Accounts
Receivable.
A special operation or special transaction is so named because the item is posted to
the customer but does not cause an update in the General Ledger’s Receivables
From Goods and Services line-item account. The value is not actualized in the
reconciliation account from the customer master record but in a general ledger
account set up specifically for this purpose.
These accounts are a type of Special General Ledger Account. They are
reconciliation accounts recording business that is neither a sale to a customer nor a
purchase from a vendor. Special General Ledger Transactions include the
following:
• Down payments
• Bills of exchange
• Security deposits
• Guarantees
Using Down Payments
A down payment is a payment for a product or service not yet supplied or
performed. Down payments must be reported in the balance sheet separately from
other Receivables or Payables. Down payments made are reported as assets; down
payments received are reported as liabilities.
A request for a payment that is the first of a series of partial payments can be
identified as a down payment and is recorded as such. The item remains open, and
the amount is posted to an account established for the purpose of accumulating
such payments until full payment is received. Only then is the item cleared and the
holding account cleared by the same amount.
The receipt of a down payment from a customer is entered into the system as a
down payment request, which is a statistical posting. A down payment request is
recorded as a note that is displayed with other open items for each customer. As a
note, this request does not update account balances. However, as with any other
open item, you can dun the request for a down payment with the dunning program
and collect the down payment by direct debit.
The payment program automatically generates a down payment posting for each
bank collection. When a down payment request is posted, the system assigns the
line items to a special General Ledger account. You can call for a list of all
expected down payments.
A customer down payment account can display net of tax or gross:
• Net display shows the down payment minus the tax.
• Gross display shows the tax included in the line item, but an additional
line item is generated in the tax clearing account as a clearing entry.
When a final payment is posted, an automatic note appears detailing the existing
down payments. The down payment total can be transferred in full or in part, but
the invoice is not cleared unless the full payment is received.
NOTE: The down payment facility can also be used to assign values to accounts set up for internal orders, cost
centers, and projects.
Using Bills of Exchange Receivables
A bill of exchange is a document with a written promise to pay a certain amount on
a certain date in exchange for a specific business transaction that has taken place.
A Bill of Exchange Receivable is a promise that payment can be collected from a
customer on the expiration date record on the bill. This is a form of IOU (“I owe
you”) with a date set for payment. When a customer submits a bill of exchange,
you can use the search facilities to find open items to match it if you have any
doubt regarding the invoice to which it belongs.
A Bill of Exchange Receivable is an open item until the bill itself is deposited at
the bank and discounted there against your account. Alternatively, your customer
could pay cash to the amount of a bill of exchange. Either method of concluding
the payment permits you to close the open invoice item.
Because the Bill of Exchange Receivable is a promise and not a payment, it is
posted to a special General Ledger account set up for this purpose, the Bills of
Exchange Receivables account. If the customer offers you a cash or check payment
before the Bill of Exchange Receivable has expired, you can reverse the deposit in
the Bills of Exchange Receivable account and post the cash against the open item
in the normal way.
Using the Bills of Exchange Discount Ledger
Discounting is the process of depositing bills of exchange that are not yet due. The
system can prepare a deposit slip for bills of exchange. Discounting also refers to
the process of depositing a post-dated check and deducting interest on the amount
(the discount) until the due date.
NOTE: Commission or collection fees can be charged on both bills of exchange and checks.
The system can prepare the discount ledger, a journal in which all bills of exchange
are entered. The following data fields are mandatory:
• Due date
• Amount
• Name and address of the drawer
• Name and address of the previous holder
• Place of payment
• Name and address of the drawee
• Discount
You can specify default values for each company code for the following:
• Discount percentage
• Collection fees or charges
• Bill of exchange tax indicator
The charges must be posted to separate accounts in the General Ledger. The
system can prepare a bill for the customer that details these charges.
Bills of exchange deposits can be recorded and annotated as follows:
• Discounted before the due date
• Collected on the due date
• Factored—an exporter gets cash immediately from a bank or other
financial institution that takes responsibility for collecting the receivable
amounts or the amounts due on the bills of exchange
Using Security Deposits and Guarantees
A security deposit is a payment made in advance against the possibility of poor
performance by one of the parties to a transaction. Some examples are the payment
by the buyer or the performance of the seller.
Security deposits are reported as noted items in the financial statements.
A guarantee is a contract entered into by a third party to pay up to a specified limit
if one of the parties to a transaction either fails to deliver the contracted materials
or service or fails to pay the amount due.
Guarantees are reported as noted items in the financial statements.
Understanding Document and Account Processing
An SAP R/3 business transaction is posted to an assigned account in which the
account balance is immediately updated. At the same time, the system records the
items on the transaction document that contributed to the update. If you later query
the balance of this account, you can inspect the document items that formed it,
right back to the beginning of the accounting period. Furthermore, you can display
an overview of the transaction figures, separated into debits and credits, for each
period.
You can also inspect sales totals per period, as well as the General Ledger accounts
for special transactions such as down payments and bills of exchange. In each case,
you can drill down to see the individual line items.
A line item display provides a summary of open and cleared items. The format of
the summary display of line items can be customized by the user at the time.
Understanding Item Display in Accounts Receivable
Within each line item, it is possible to select the constituent document items and
display a variety of totals, such as separate summations for each type of document.
Documents can be selected according to their account in a company code, or as
related to a group of accounts in a group of company codes. Totals can be
displayed to this structure.
You can switch between a display of all line items and a view of the constituent
documents of any chosen item. If necessary, you can search for a specific
document according to posting date or document type.
If you want to view transactions that cross company codes, the system offers you a
list of relevant documents. You can alternate between displaying all line items
belonging to a particular transaction and all line items on individual documents.
Standard summary displays are available for the most frequently used analyses and
reviewing tasks. These include the following:
• Displaying the credit limit for one account or a group of accounts
• Tabulating a set of items by the number of days in arrears
• Displaying an overview of the net and cash discount situation
• Displaying a customer’s payment history to assess liquidity
• Simulating a payment history by entering trial values and assessing the
consequences
The most helpful screen display can be saved so that you can use it again. You can
save the exact display with the data, or you can save the pathway or analytical
route used to arrive at it. If you save the pathway as a report design, you can use
the same analysis on other data next time because the totals will be generated from
the data you specify.
TIP: The quickest way to access account documents is to begin at the individual account display and then drill
down in whatever direction is most fruitful.
Changing Documents Already Posted
The procedures for controlling the display on your screen can also be used in
preparation for changing a document. There are four main methods of accessing
documents for the purpose of making changes.
• Display an individual document by selecting it according to one or more
data fields in it.
• Display a document that involves more than one company code by
choosing from the list offered by the system when you identify a cross-
company code transaction.
• Select a document from a list of all the documents for a specific vendor.
• Select all the documents for a specific vendor and perform a mass
change for certain fields, such as a release of payment.
You cannot make any changes to a data field on a document if that field has
already been used to update the transaction database. For example, the following
fields are not open to alteration after the document in which they appear has been
posted.
• Account number
• Posting key
• Amount
• Tax information
Some fields in a document are locked against updating only if your system has
installed and configured a certain SAP R/3 component. For instance, a cost center
field cannot be changed if your system has already used it to update a cost center
account in the cost accounting component.
The status of a document can also affect the fields that are amenable to alteration
after posting. For example, you cannot alter the terms of payment after an item has
been cleared.
In addition to the logical rules that prevent you from changing a document to
invalidate SAP R/3 compliance with the Generally Accepted Accounting
Principles (GAAP) standards, you can institute other rules that make sense for your
particular business.
If you have set up additional account assignments for a special purpose ledger or
for a particular controlling reason that requires an accumulation of values, you can
declare a rule that prevents anyone from changing an additional account
assignment unless the document is still open for posting. After the month or other
accounting period is closed for accounting purposes, the posting data may be
relayed to other systems for evaluation. In these circumstances, you probably
won’t want anyone to alter the originals and destroy the validity of the audit trail or
any other operation that referenced the posting documents. Such rules that should
be obeyed across your system can be established through adjustments of the
system settings, which are permitted only to suitably qualified users.
Dunning Accounts Receivable
Each customer’s master data includes a field to indicate what is to be done about
overdue invoices. This dunning code identifies an established dunning procedure.
This procedure has the task of preparing a dunning proposal, which it does in the
following related stages, not necessarily in this order:
• Identifies the accounts and the items to be dunned
• Establishes the dunning level of the account
• Selects the text of the dunning letter or dunning notice according to the
dunning level of the account
• Computes the interest on arrears and any charges due
• Edits the text to include interest and charges
• Adds the details of the items overdue
• Adds the totals in the document currency and the local currency, as
required
• Addresses the dunning proposal to the customer’s head office or to
another addressee the customer approves
• Submits the dunning proposal for approval
• Prints or otherwise dispatches the dunning notice
• Stores the dunning particulars in the records of the items and the
dunned accounts
• Compiles lists and reports of the dunning activities
A standard dunning procedure can be independent of company codes. This
procedure records the grace period, the dunning level principle, and the number of
dunning levels.
Understanding Dunning Levels
The dunning level principle is the formula or logical conditions used to determine a
set of dunning levels. A debt is allowed a number of days of grace before it is
dunned. If the debt is not cleared after the grace period, the dunning begins at the
first level. Subsequent levels of dunning are assigned to the debt according to the
dunning level principle so that the text of the dunning notice reflects the
seriousness of the overdue payment. You can establish the dunning levels on the
basis of number of days in arrears, and you can add other conditions based on such
factors as the following:
• The absolute amount of the overdue item
• The percentage of overall sales to this customer represented by the open
item overdue
• The absolute amount of the total of all overdue items on this account
• The total of all overdue items on this account as a percentage of the
sales on this account
Each item in arrears on a particular account can be assigned to a separate dunning
area and, for this reason, can be subject to the dunning notice and procedure for
that area. A dunning area is confined to a single company code. Several dunning
areas in a company code can correspond to the profit centers or sales organization
of that company.
Preparing and Using Dunning Letters
The SAPscript word processing program is available to design and change the
format of dunning letters. During customization, the system provides you with
some model letters at each dunning level. You can change and edit the text of the
letter and also the company logo, position of the address window, and footers. You
can give open items referred to in the letter a special format and content for this
purpose.
A dunning proposal is a set of suggestions assembled by the system, which you can
accept as is or alter in various ways. The system initially creates a dunning
proposal by using due dates and some method of selecting the accounts to be
dunned. You may have defined these methods previously and specified dunning
levels and dunning areas.
You can then edit the dunning proposal list online. You can target the dunning
letters at particular individuals in your customer’s organization. You may decide to
change the dunning level of an item. The dunning level of the whole account is
changed automatically to the highest dunning level of any open item. You can
release specific open items and accounts to be referenced in the dunning letters.
The system records all changes to open items to be dunned.
The dunning data in an individual item is not changed, nor is the customer account
updated when you generate a dunning proposal. You can generate a proposal
several times and reject it without affecting the accounts. However, if you accept a
proposal, the dunning data is updated in the item and in the account as soon as you
release the printing proposal and therefore dispatch the letter to the customer.
You can use the same letter forms throughout the group, or you can customize
different forms for each company code. If your customer is recorded as a business
partner, you can instruct the system to automatically consult a master to determine
details of the dunning procedure. In particular, your system can be configured to
issue dunning notices in the language specified in the business partner master.
Certain text may appear only for particular company codes. You can decide for
each company code whether an individual dunning letter is to be prepared for each
dunning level. If this is to be the case, only the items with that dunning level
appear on the dunning letter.
Individual accounts can have their own dunning letters. Customer items can be
assigned to different dunning areas, each of which receives a separate dunning
letter.
NOTE: If the SD-Sales and Distribution System has been installed and configured, the dunning areas can be
made to correspond to the areas of the sales organization, the distribution channel, or the division.
Refunds overdue from a vendor can be dunned, and you can instruct the dunning
program to subtract vendor items from customer items when they concern the same
company, if the master records specify that this is permitted.
The dunning program can direct dunning letters to the EDI system on the basis of
individual customer or vendor accounts, or in accordance with a group or dunning
area policy. You can also use the office system to send the letters by telex,
messenger, or postal delivery.
The system always prepares a standard processing log. It can also offer the
following reports pertaining to dunning:
• Lists of blocked items
• Lists of blocked accounts
• Lists of items with special dunning keys
• Dunning statistics
• Reports of dunning runs
Using Automatic Dunning

Automatic dunning can be initiated if you have determined the key date for a
maturity check and identified the accounts to be scrutinized. The automatic
dunning program checks the due dates of open items in these accounts.
If you have installed and configured the Financial Calendar, you can schedule
dunning runs and assign the proposal lists they generate to the appropriate person
for editing and release. This person is notified automatically when a dunning
proposal list is about to be generated.
Using Automatic Correspondence from Accounts Receivable
Dunning notices are a type of automatic correspondence that must be first
submitted as a dunning proposal to a person authorized to edit and release the
dunning notices. This causes the dunning data to be updated in the records of the
dunned items and accounts.
You can call for a proposal for automatic correspondence at virtually any time
while you are processing accounts and documents. You can set up a cycle of
automatic correspondence, and you can initiate individual items manually.
NOTE: Any type of correspondence can be generated in the language of the business partner.
Sending Automatic Payment Notices to Business Partners
The business partner who has submitted a payment is automatically notified by a
notice that details the items cleared by this payment. If the system detects a
discrepancy, the business partner can be automatically asked to clarify the
discrepancy or pay the differences. Should it prove impossible to identify an item
that could be cleared by the payment received, the customer again can be
automatically asked to clarify.
You can use an automatic reply slip to permit payments on account to be assigned
to specific open items. This procedure can also be used to deal with any credit
memos that cannot be automatically assigned to items and posted in the clearing
procedure.
The automatic payment notice also lists any customer items still open after the
payment has been assigned. The payment program can be used to identify the open
items to be paid and can append additional remarks that are standard phrases or
text entered by the supervisor.
Using Account Statements and Open Item Lists
The customer account statement is a standard report generated by the system and
addressed to a business partner. The account statement shows the following
entities:
• The balance carried forward
• All items, both open and cleared, for the selected time period
• The account closing balance
An open item list is a form of account statement that includes only the open items
up to the specified date. This can be sent as a reminder, for reconciliation, or
simply for information.
Both account statements and open item lists specify the following information:
• Document number
• Document date
• Document type
• Currency
• Amount for each item
• Balance of open items on the key date
• Clearing document number, if applicable
• Addresses of the customer’s head office and branch offices, as
appropriate
NOTE: The number of days in arrears per item can be included in the account statement or the open item list.
Using Standard and Individual Letters
A standard letter can be added to an account statement or open item list
automatically. You may wish to notify customers of a relevant change in your
organization that could affect their payment and reconciliation activities. This
could be the occasion to use a standard letter.
You can use the accounting events of the SAP R/3 system to trigger the insertion
of standard texts in a standard letter. You can also assign specific texts to particular
segments of your business; some of your customers could be sent particular forms
of your standard letters. Furthermore, an individual letter can be added and edited
to suit each customer.
Using Other Types of Automatic Correspondence
A balance confirmation is a standard report mailed to a customer. You can operate
conditions that automatically arrange for the customers with the highest balances to
be notified first. In addition, you can arrange for a random selection of the
remaining customers to be notified of their balances.
A document extract is a standard report in which you inform customers of specific
line items that you have extracted from a transaction document. For example, you
might inform a customer of a credit memo and append a listing of the line items
involved.
A customer can clear invoices by submitting a bill of exchange. This incurs
charges that you can notify and explain in the form of an automatic letter. This is
generated from a master form in the language of the business partner.
Interest can be charged on items that have not been paid and are overdue, or on
items that were not paid before the due date for net payment. Interest also can be
charged on the account balance and notified by an automatic letter. This could
arise, for example, in cases when employees have loan accounts on which interest
is charged.
TIP: The SAP R/3 system contains a form letter for interest notification. You can modify this letter and store it
as the standard.
With appropriate authorization, an in-house or internal document that contains any
data fields in your system can be generated. You might want to create an internal
document using customer or product data, for example, because no suitable
original document was entered. All the standard text phrases and word-processed
free text stand at your disposal. An internal document can be saved and used as a
standard.
Reporting Customer Accounts
SAP R/3 reporting is executed by identifying the source records and subsequently
processing them. This two-stage process means that any standard reports can be
run virtually in parallel to a file that identifies the set of sources. Memory
considerations do not usually allow online storage of all information, so a separate
file is assembled containing only information from customer line items.
This line-item file is typically sorted so that all the cleared items appear at the
beginning of each account. Clearing transactions are sorted by clearing date and
clearing document number so that the context can be ascertained. Items still open
on the key date appear at the end of each account. Reconciliation totals are output
for each customer account and for each reconciliation account. This means that the
Accounts Receivable position can be integrated with other R/3 modules.
The online reporting facilities of the Accounts Receivable module can be
supplemented by printed outputs in single or batch modes. These reports can be
sent to file or to a printer. Three main classes of reports exist.
• Standard master record lists
• Customer account statements and open item lists
• Audit trails of individual accounts
Customers can be selected by various criteria, singly or in the form of logical
expressions that isolate customers on the basis of one or more attributes of their
master records, combined with attributes computed from their accounts up to a key
date.
The content of a report falls under your control. You can mix master data and
account data, subject to authorization. If the items remain in the system, you can
call for reports of customer open items that sort the items by ranges of due dates or
by values according to the report specification that you build or copy from a
previous design.
A legally valid financial accounting system must have a method of demonstrating
all the transactions that contributed to each of the balances on the balance sheet.
The system must show the balance at the beginning of the accounting period and
all the debits and credits applied to the account to reach the balance at the close of
the period.
Every computer system has limits to the amount of storage space that it can make
available for any particular purpose. The SAP approach to the management of
storage space is to archive all the line items needed for a balance audit trail
separately from the document data that recorded the transactions. When a balance
audit trail is required, usually at the end of the accounting period, the line-item
archive can be scanned without also having to read all the document data.
The balance audit trail report contains a list of customer line items and a control
total for each customer account. Reconciliation account totals are also shown so
that the accounts can be matched with accounts in other parts of your accounting
system.
TIP: The customer line items for accounts that are not managed on an open-item basis can be sorted in
chronological order to assist in tracking.
When open-item accounting is in practice, the balance audit trail procedure sorts
the cleared line items to the beginning of each account, arranged in clearing date
order and then by clearing document number. This helps the auditor trace how and
when an item was cleared. The uncleared open items fall at the end of each account
listing.
Managing Customer Credit
A credit limit is assigned to a customer based on an assessment of his or her
creditworthiness. If an order leaves the customer balance within the credit limit,
the order is accepted.
NOTE: Customers can have a credit limit of zero.
The Sales module checks the credit limit when the order is posted, as does the
Financial Accounting module. If the limit is exceeded, the system either issues a
warning or an error message, depending on the key held in the customer master.
The document can still be posted, but precautionary measures must be taken by
examining the customer position, and possibly by blocking the account at the
master record.
You can set up a credit control area that covers one or more company codes, and
you can specify a standard credit limit for each credit control area. Under these
circumstances, a new customer master record is assigned the credit limit according
to the credit control area of the company code in which the account is opened.
You can assign a credit limit to a single customer or to several customers
according to specific criteria. For example, you can assess customers and potential
customers according to your estimate of the business risk of associating with them.
You can assign your business partners to risk classes and check their position in a
certain way before accepting an order.
A customer can also be assigned to a group of companies that define an industry or
industrial sector. A customer can also be classified according to the country in
which it operates or according to the area of the world that shares its business
conventions.
The procedure for monitoring customer credit limits in a credit control area
automatically assembles and summarizes the following information for each
customer account:
• The Receivables from sales not in dispute
• The Receivables from special General Ledger transactions that affect the
credit limit calculation, such as down payments
• The total order value comprising open orders, open deliveries, and open
invoices
These totals are added to yield the total liabilities for each customer. When a
customer invoice is posted, the total liabilities display increases automatically by
the amount of the invoice. When a payment is received, the total liabilities display
decreases. If the posting of a customer invoice will cause an increase that exceeds
the credit limit, a warning is issued and the system records the date on which the
credit limit was exceeded.
Each credit control area has a credit limit currency in which all credit calculations
are conducted. This currency is independent of the local currency of the company
code. The system updates the credit limit data using an amount calculated by
converting the invoice amount to the credit limit currency. This control currency
update does not affect the transaction figures or the posting to the General Ledger.
Using Credit Limit Displays
The detailed monitoring of credit generally is focused on one customer account at a
time. For example, you might find it helpful at times to use one or more of the
following standard reports:
• Changes in the master record reflecting some aspects of the customer
account history
• Oldest due items to see whether there is a reasonable explanation or a
pattern to the items still owed
• Customer order value distributed among open orders, open deliveries,
and open invoices
• The date and details of the most recent payment
• The line items of some or all unpaid orders
• The dunning history and the payments in response to dunning
One of the best ways to discover unusual patterns in your customers’ payment
behavior is to have alert people use the display facilities and think about possible
interpretations of what they see. You can use an internal memo that references a
stored display or a display specification, along with a more detailed examination of
customer data. This could come from other sources, such as sales support, perhaps
with a block imposed on further orders from this customer until the payment
situation is resolved.
One of the benefits of an integrated accounting system is that you can move
effortlessly from credit control to financial information. You can display the sales
and payment histories. You can perform due date analysis and ask for a calculation
of day sales outstanding (DSO), a figure that combines the time overdue with the
magnitude of the amount outstanding. DSO represents the seriousness of the debt
from the cash flow perspective of your company.
Any combination of variables and display features can be deployed to help you
facilitate business intelligence. Business intelligence is defined as the capability of
discerning relationships in the data and the capability of working out what they
mean and what should be done. If you find a particular display or computation
useful, you can identify it and save it for future use.
Creating a Credit Master Sheet
As you move through the process of interpreting a customer credit situation, you
can build a credit master sheet to inform others or to document your decision
processes. The system enables you to assemble the line-item display, the account
analysis, and the credit management data on a document that also is automatically
annotated with the following information:
• The address and data for communication with the customer
• The credit limit and the date when the customer was last notified
• Selected fields from the credit management master record
• The totals of open deliveries, invoices, and orders
• The balance, the days in arrears of each item, and the texts sent to the
customer for each item
• The customer’s payment history
Your credit management module generally is integrated with the SD-Sales and
Distribution module, so it is possible to access any sales information and use it to
amplify the credit master sheet. The integration with SD enables you to perform
what may be complex credit checks in at least the two most critical moments:
• Before an order is accepted
• Just before the goods are delivered
If the customer has been assigned to a risk class or a credit control area, the
following checks can be mandated:
• A statistical check on the credit limit
• A dynamic check on the credit limit that takes into account the delivery
deadlines and the due date for all open items on the customer account
• The absolute value of the order
• Changes in critical fields, such as terms of payment during the customer’s
payment history
• The structure of overdue items in terms of amounts and time patterns
The credit limit management functions of FI-AR Accounts Receivable require a
policy to be elaborated and recorded as a set of master records for one or more
credit limit control areas. Standard dunning notices and credit limit documents are
available for editing. In total, a comprehensive and flexible system ensures that no
customers can deplete the value flows in your company by failing to settle.
Using the Accounts Payable Module
The role of the SAP R/3 FI-AP Accounts Payable module is to maintain and
manage accounting data for all vendors of goods, materials, and services and to
pay for them in support of an integrated purchasing system. Information about
orders, deliveries, and invoices is stored according to vendor.
Accounts Payable is a subledger of the General Ledger and is completely
integrated with it at the following levels:
• Master data
• Transaction data
• Reporting system
Master data entered or modified in one application is available to all the others.
Transaction data is accessible to all. Reporting can draw from the General Ledger
and the Accounts Payable subledger.
Transaction data is stored centrally in the document database, and the
corresponding line items and details are stored in the subledgers, as appropriate.
The system automatically updates a subtotal of a balance sheet account for every
business transaction and reconciles the account subtotals and the line items to
ensure that the financial information is always correct and current.
Every transaction creates an SAP document, and the data is immediately posted to
the General Ledger. As such, every business transaction recorded in this way
automatically updates the balance sheet or the profit and loss statement. This is the
defining characteristic of an up-to-date networked accounting and controlling
system.
Understanding the Business Functions of Accounts Payable
Accounts Payable includes a program that records orders, deliveries, and invoices
for each vendor. Operating transactions automatically update accounts in the FI-
GL General Ledger system. When you post a vendor transaction, the system
immediately updates the Accounts Payable account.
Accounts Payable is directly integrated with Cash Management, which supports
cash planning and dunning. An automatic payment program can be called from
Accounts Payable. SAP Purchasing is a group of components used by the MM-
Materials Management module that can be installed and configured to integrate
with Accounts Payable.
Reporting on matters concerned with FI-AP Accounts Payable follows the SAP
standard business functions to yield the following reports, for example:
• List of due dates for Accounts Payable
• Currency lists
• Hit list
Correspondence concerning Accounts Payable can be set to provide automatic
letters and messages for the following purposes:
• Balance confirmation
• Information
• Interest calculation
You can also customize correspondence to suit individual vendors.
The Accounts Payable module is designed to maximize available cash discounts.
You can set up an invoice receipt with information that is incomplete or that has
not been assigned to an account. The necessary details can then be added when
they become available.
FI-AP is also integrated with the business workflow functions so that invoices can
be routed automatically to those who are authorized and qualified to complete or
release them. The payment process sequence can be partly or completely
computerized. The module supports all customary payment modes for the countries
for which your implementation is configured.
Complying with GAAP
The methods used by SAP FI-AP Accounts Payable to adhere to GAAP standards
are the methods used throughout the SAP system. These methods also comply with
the account conventions of most industrial nations.
Vendor information is stored in vendor master data records, which are the only
source of this information and which are kept up-to-date by all users and
applications with reason to interact with them. The master data is entered once and
stays in only one place. Everyone knows where to find the data and can discover
when it was last updated.
Transactions concerning vendors automatically create SAP documents that can be
used to keep track of the transactions and any resulting actions. These SAP
documents can be used to compile a legal audit trail for each balance amount in the
balance sheet. The documents can also be used to record other information used by
controlling systems with interests in vendor transactions.
SAP documents must comply with GAAP in the matter of capturing information
essential to the proper and legal analysis and control of business. These documents,
which are automatically created during vendor transactions under the Accounts
Payable system, can be displayed and altered in a controlled manner using the SAP
standard business functions for manipulating SAP documents.
The vendor accounts and other accounts such as Payables and down payments
integrated with the Accounts Payable system are updated in accordance with
GAAP recommendations, and the proper record must be created whenever any
changes are made to the account balances by the SAP documents that record such
activities. In particular, a company must be capable of disclosing its debts when
closing an accounting period.
The R/3 Accounts Payable accounting system uses balance confirmations, journals,
balance audit trails, and custom valuation reports to document and manage
transactions with vendors. The main activities of deadline analysis are as follows:
• Revaluation of foreign currency items
• Identification of vendors with debit balances
• Lists of the calculated balance amounts on the vendor accounts, sorted
according to the terms of payment still obtainable
A thorough Accounts Payable accounting system not only meets legal obligations,
but it can also serve as a database for optimizing purchases. If they are directly
linked to Cash Management and Cash Forecasting, the Accounts Payable functions
can provide valuable support for efficient liquidity planning.
Working with Vendor Master Records
In accordance with the SAP principle of redundancy-free data storage, standard
practice involves using master records for the control of basic data that seldom
changes. The system designers have ensured that a vendor master data object has a
data field for every item of information needed to record and post business
transactions with vendors.
NOTE: If the information you require for any business process can be supplied by the system, you should not
have to enter it by hand every time you attempt to carry out a transaction. SAP should obtain it from the
master data object and supply it for you to confirm or edit.
Information in a master record is not necessarily available to anyone interested in
it. Certain data objects can be closed to a user who does not have access
authorization. The vendor’s bank balance is an example of data that is not available
for scrutiny by just anyone.
The Purchasing components of MM-Materials Management must be installed and
configured to make use of information directed at a Purchasing department. In
these circumstances, both the Purchasing department and the Accounting
department use the vendor master record at times. Data fields must be present to
suit them both, including the following data.
• General vendor data that any company code in your enterprise might
need, such as vendor address, telephone number, and telex and network
addresses
• Company code data about the vendor, such as terms of payment and
other arrangements that have been agreed upon only between that
company code and the vendor
• Purchasing organization data about the vendor that might vary from one
purchasing department of your company to another, such as the products
of interest and the relevant section of the vendor accounting structure
The vendor master record stores the data needed to control payment transactions,
and this record can provide the basic information needed to generate a preliminary
invoice posting without waiting for final details. Vendor master data for each of
your company codes includes the following:
• Payment terms agreed upon with the vendor
• The vendor account number under that company code
• The reconciliation account number in Payables
• The payment methods agreed upon
• The dunning procedure
• Correspondence information and prepared texts
• How the vendor line items are to be sorted on displays under that
company code
Creating and Maintaining Vendor Master Records
If your enterprise has more than one purchasing organization, each one could
maintain information that is of no particular interest to the other. For example, both
organizations could be responsible for the purchasing of different types of
materials and services. They might have a different set of purchasing contacts and
might operate through different sales departments of the vendor organization. Each
purchasing organization may need to maintain separately such items as inquiry
information, order information, and data required to verify invoices.
If your Financial Accounting and Materials Management applications are
integrated, the following possibilities are available for maintaining vendor master
records:
• Maintaining company code data on vendor masters separately at each
company code
• Maintaining purchasing organization data on vendor masters separately
in each purchasing area
• Maintaining all data on vendor masters from a central location
When a new or prospective vendor is identified, a new master record is created.
This record must be assigned to an account group.
The account group determines whether you can assign account numbers within
specified ranges or whether this is done automatically by the system. You cannot
assign the same account number more than once, but you can have both customers
and vendors within the same range of numbers.
The account group also controls which fields are active in this master record. You
can pick the fields offered by the account group and assign them to one of three
categories:
• Fields into which the user must make a valid entry.
• Fields the user can either leave blank or make an entry into (optional
fields).
• Fields suppressed so they do not appear on the screen. An entire screen
of fields can be suppressed if they are not needed for a particular master
record.
Field groups enable you to subdivide the control over groups of fields such as
address and bank information. Accounts Payable also can add fields that contain
specific information about the supplier.
The FI-AP Accounts Payable system makes it easy to create vendor master records
by offering various options.
• You can copy and edit a master record from a reference record
established for the purpose.
• You can copy the master record of an existing vendor and edit the
unwanted details to make it into a new master record.
• You can create the new vendor master record by entering all the
necessary details.
After you have entered and stored a vendor master record, you can recall it and
change almost any field. Master vendor records can be selectively displayed so that
you can see only those fields of interest. You have the choice of whether to go
through all the fields or to work on only one set of fields, such as the product or
service details.
NOTE: The system automatically maintains a log of all changes made to vendor master records.
Using One-Time Transaction Accounts
If you think a vendor probably will not become a regular supplier, you can set up a
one-time account by selecting a special function. This creates a master record that
contains only the essential control data, such as the number of the reconciliation
account to which this purchase is posted.
You can supply the address and the bank account data when you enter an invoice
received. This information then arrives in the one-time account master record,
where the dunning and payment programs can find it.
Using Vendor Head Office and Branch Accounts
Your supplier could be a branch with its own account, but the head office may
want to receive your payment. In this case, you can enter the head office account
number in the master record for the branch vendor. When you enter a transaction to
the branch account, the system posts the transaction to the head office account,
leaving a cleared entry on the branch account to show who supplied the goods or
service.
The master record includes data about the branch and a reference to another master
record to give details of the head office. By this means, dunning letters can be sent
to the head office, the branch, or both for overdue refunds, for example.
Sending Vendor Payments to an Affiliate
Your supplier may not have to deal with his payments due. You can record in his
master data the account number of the alternative recipient. The system then
processes return transfers and other vendor payment business through the banks to
the alternate recipient.
If you have a credit balance in one or more affiliates of a vendor and you post
vendor invoices to an affiliate account, your accounting system also must record
the single head office vendor company account number to be used during
consolidation to eliminate the invoices that would otherwise appear twice in the
accounts. The system can look at the transaction documents bearing this group-
wide company account number and identify any entries that are replicated because
the payment was made to an affiliate that was not the original vendor.
Understanding Transactions in Accounts Payable
When you post a transaction to a vendor account, the reconciliation account for
Accounts Payable is updated immediately in the General Ledger. The system
updates a separate account for each type of vendor transaction, such as the
following:
• Purchases
• Down payments
• Bills of exchange payable
• Guarantees
Orders to and invoices from vendors also update financial planning and cash
management data.
Using Vendor Invoices
The SAP FI-Financial Accounting system can be integrated with the MM-
Materials Management system. An invoice with an order and delivery data can be
entered and validated in Materials Management. Validated invoices are posted
automatically to the General Ledger accounts in the FI-Financial Accounting
system, if the two systems are suitably configured.
If your financial system is not integrated with a Materials Management system,
you can carry out the invoice receipt function in the Financial Accounting module
using the following steps:
1. Enter the invoice document header.
2. Enter one or more line items.
3. Verify the line items entered automatically by the system, such as input
tax postings.
4. Correct any details on the invoice receipt document.
5. Post the invoice receipt.
Using Electronic Data Interchange
Vendor invoices can be received by EDI. Data entry starts automatically, and the
system creates an SAP document that receives the incoming data and is posted
when complete. If any errors are detected, the invoice receipt document is
forwarded to a suitable person for verification.
One of the advantages of this kind of system is that the invoices can be processed
at off-peak times, and the problem items can be presented in batches when a
suitable person is available.
Scanning Invoices
The ArchiveLink standard interface can be used to scan incoming invoices. The
interface will have been customized to recognize the type of document and the
vendor company. The scanning will also be primed to identify standard materials
and services, with the corresponding quantities. If the recognition cannot be
completed automatically, the system forwards each image to an appropriate person
for verification.
Supporting Manual Invoice Entry
If you must manually enter or edit an invoice that has not been posted
automatically, SAP R/3 provides all possible help. The successful posting of a
transaction does not occur until the necessary data is recorded as an SAP document
and is complete and error-free. You can set aside a transaction document before it
is ready for posting, in which case the system validates any information you have
already entered and reports any discrepancies in the form of a detailed list of the
error sources. If you have the authority, you can access the source document to
seek clarification.
The SAP document must end up with a document header showing posting date,
document date, document reference number, and currency key. The body of the
document contains one or more line items showing the amount and identifying the
product and terms of payment. The system generates certain line items such as tax
entries, cash discounts, and exchange rate differences, as applicable.
You can set up helping routines and use standard data entry functions such as the
following:
• Setting default values that you can edit at the time of entry
• Recalling for copying and editing a previous screen
• Retaining data for individual users for several transactions
• Adapting a copy of a data-entry screen so that it is better suited to a set
of expected transactions
• Searching for an account number by using matchcodes to narrow the
search
An SAP document that records a previous transaction can be copied to act as a
sample or model to be edited. This sample can be a regular document that has been
set aside, perhaps as an incomplete transaction document. The posting date and
new values may have to be changed before posting.
Handling Recurring Entries
If you expect to make a series of entries in which the amounts are always the same,
you can set up a recurring entry. Monthly service charges under contract would be
one example.
A recurring entry is a set of data that is not used until the due dates. Until then, the
entries do not update account balances. You must specify the first and last dates
and the frequency or time interval. The system automatically posts the required
transaction on each of the due dates.
Using Account Assignment Models
An account assignment model is a document entry template that can take a variety
of forms. Unlike a sample document, a document entry template need not be a
complete and valid document. You may have to add or edit details before posting
it.
The advantage of using an account assignment model is that you can enter invoices
and credit memos quickly and safely. For example, you may have to repeatedly
divide amounts between several company codes, between accounts, or between
cost centers. If you have a suitable document entry template, you can arrange for
the General Ledger account items to be in place so that when you enter the total
amount, the system can apportion it automatically between the various receiver
accounts. Your account assignment models can include fixed distribution ratios to
control the assignments between General Ledger items.
You do not have to accept the suggestions of an account assignment model. You
can amend any details before you release it by entering the total and posting the
template as a complete document.
Using Control Totals and Checks for Duplication
If you post any document that is in error, the system immediately reports it and
suggests a correction. Control totals are maintained at suitable levels that are
entered, automatically where possible, on the basis of the expected values. A built-
in function ensures that you do not generate duplicate invoices. Should you
mistakenly post a transaction to the wrong vendor, you can reverse this transaction
and the associated SAP document. The system automatically generates a reversing
entry for each item wrongly posted.
Working with Incomplete and Preliminary Documents
If you are interrupted before completing a transaction document, or if you want to
set the document aside for the moment, you can save it as an incomplete document
and recall it when you are ready to resume work on it. If you have an invoice that
needs to be reviewed or assigned to an account, you can enter it as a preliminary
document. Creating a preliminary document does not update transaction figures,
even if the document is complete. However, the posting of a preliminary document
is treated as a statistical transaction and is displayed along with other accounts.
The data in a preliminary document, or in a set of preliminary documents, can be
analyzed and used in various ways, as long as you do not try to update the
transaction database with them. For example, you could create a preliminary
invoice to calculate and print an advance sales tax return, perhaps in response to a
question from a business partner. Another use of preliminary invoices might
involve payment requests to assure that your customer or your accounting
department pays on time and qualifies for a cash discount.
A preliminary or incomplete invoice receipt document can be generated by one
person and then forwarded to a cost center for payment release by someone with
the required author-ization. The document could then be returned to the originating
person for completion and posting.
Another main use for a preliminary document is to register an invoice when there
is insufficient information to have the amount correctly assigned in cost
accounting, for example. The invoice can still be recorded and reported for tax
purposes, ensuring there is no loss in cash flow resulting from taxes levied on
supplier invoices.
The task of processing incoming invoices can be summarized in the language of
the SAP workflow system, as follows:
1. A trigger event arises on receipt of an EDI invoice, a scanned invoice, or
a manual invoice entry.
2. Accounting entry is affected by posting a preliminary document with the
payment-blocking indicator set.
3. The responsible organizational unit releases the preliminary document
for payment.
4. The responsible employee workplace processes the document through
to completion.
The authority for actions at each stage of the workflow is defined in terms of
authorization paths that represent the stages of approval for payments of different
kinds and amounts.
The flexibility of the workflow concept, as it is elaborated in the SAP R/3 system,
is demonstrated by the infinite variety of workflow paths that can be established to
ensure that your work activities are performed in the correct order and with the
utmost dispatch.
Using Centralized Open Items
You can support centralized open items by allowing more than one company code
to post to them. For example, you might wish to hold a central stock of a material
and permit each company code to draw on it as planned or as required. Under these
circumstances, an invoice can refer to goods and services destined for different
company codes. The invoice must be entered in the Accounts Payable of only one
company code. The General Ledger account items must therefore be distributed
among the various company codes that make withdrawals of the central item.
When a multicompany open item of this kind is posted, the system automatically
creates line items for Payables and Receivables arising between the individual
company codes. The system also generates a separate document for each so that
their individual accounts can be correctly updated to record their particular
withdrawal from the central open item. Each document carries its unique document
number, but they all refer to a joint transaction number that links them. This joint
transaction number can be used to acquire a summary of the joint transaction data.
Understanding the Net Posting Procedure
A net vendor invoice records the liability to the vendor after the cash discount.
When you process a net vendor invoice, you must enter the gross amount. The
system calculates the net amount on a line-by-line basis.
When this type of invoice is posted, the General Ledger entries in the Accounts
Payable subledger include the offsetting amounts net of the cash discount. The
amount of the cash discount is automatically posted to a discount clearing account.
This figure remains there until you pay the invoice, at which time it is released.
When a vendor invoice is entered using net posting, the cash discount is taken into
account at the time the vendor invoice is entered. A net posting anticipates that the
payment will be made before the due date and will attract the cash discount. The
cost of the goods or services bought on a net posting transaction is recorded in the
materials or expense account, with an additional line item to allow for the discount.
If you use the payment program to pay invoices, the system applies the cash
discount rate when the payment is made and posts the net amount. This discount
therefore might differ from the discount anticipated and posted when the invoice
was received. If this difference arises, it is posted to a separate expense account.
The gross posting procedure and the net posting procedure are used side by side in
the SAP R/3 system. In both cases, even after posting, you can make changes to
the cash discount terms in the invoice document or in the payment proposal. In
both types of posting, you enter gross values and the system automatically corrects
the line items and posts any differences to the clearing account.
The purchase of a fixed asset can be recorded as a net vendor invoice. By this
means, the amount representing the value of the fixed asset is net of the cash
discount and can be depreciated in the normal way. The discount clearing account
carries the amount of the cash discount, but it does not have to be cleared later
because it was released when payment was made for the fixed asset.
Using Credit and Debit Memos
A transaction that reduces Amounts Receivable from a customer is a credit memo.
For example, the customer could return damaged goods. A debit memo is a
transaction that reduces Amounts Payable to a vendor because, for example, you
send damaged goods back to your vendor.
When you post credit memos, the payment program processes them automatically.
If the credit memo is specifically related to a particular open invoice item, the
payment program automatically attempts to offset the credit memo against the
open item. If it is not possible to completely offset the credit memo against an
invoice, you can post a debit memo to the vendor, who is to reimburse the amount.
Then you can apply a multilevel dunning program.
Dealing with Down Payment Requests
The standard general-purpose data-entry function can be called from the Accounts
Payable module to General Ledger entries such as credit memos and adjustments.
However, down payments, bills of exchange, and security deposits are examples of
special General Ledger transactions. Separate account balances are maintained for
them.
A down payment to a vendor can be made by the payment program if you have
entered to the system a down payment request document that includes all the
necessary payment data and the due date before which the down payment must be
made. The system stores the request without updating any account balances. At
any time, you can call for a report to display an individual request, all requests for
a given vendor, or all requests for down payment entered.
You have the option to display down payments in the vendor or General Ledger as
either gross (including sales tax) or net (excluding sales tax). The net amount is
reported in the balance sheet, and the tax appears in the tax account.
When the payment program carries out all the down payments requested and you
receive the final invoice from the vendor, you can enter it. The system displays all
the down payments made on this invoice, and you can apply them to offset the
invoice in whole or in part. The payment program then pays any amount
outstanding to the vendor.
Using Automatic Payment Functions
Manual entering of payments is necessary, for example, if a vendor is to collect
from you by direct debits. The most effective time-saver in Accounts Payable,
however, is the automatic payment program. The payment program proceeds in
three stages:
1. Generating a payment proposal list
2. Presenting a payment proposal for editing
3. Executing the approved payment proposal by posting payment
documents to clear the Payables and link them to the payment, creating
payment forms and other payment media as required
You can also have a payment triggered automatically without considering a
payment proposal.
Editing a Payment Proposal
The purpose of a payment proposal is to maximize cash discounts within the
constraints set by the control strategy specified in the vendor master records and
also by the way the payment program has been set up. The following options are
available for editing a payment proposal:
• Replace the proposed payment procedure with another
• Substitute a different bank to receive the payment
• Change the cash discount terms for the items to be paid
• Block certain payment items
• Add open items to the payment proposal
Displaying vendor open items shows you who is yet unpaid; you must decide who
to choose for payment. You can choose who to pay on the basis of due dates,
according to the outstanding amounts of magnitude, according to your preferred
vendor policy, and so on.
The system checks the due dates of vendor open items and proposes a method of
payment for each, depending on the vendor master data and the requirement to
maximize cash discount. The system also chooses one of your banks to provide the
funds for each payment, as well as a bank to receive it on behalf of the vendor.
The system can generate a form for a check or automatic payment medium, such as
disk or an online electronic transfer. You must assign a medium of this kind for
each payment, either individually, based on the default values suggested by the
system, or based on the data in the vendor master records. You can directly specify
the choice of medium prior to a batch of payment proposals.
Execution of a valid payment proposal is largely automatic. The payment program
generates SAP payment documents and posts payments to the appropriate General
Ledger accounts. The vendor items in the payment proposal are marked as cleared
and are given a reference number that links them to the SAP payment document.
For each country and payment method combination, a specific program prints the
checks or payment forms in the language and accounting style for that country and,
if a disk or other electronic payment notification channel is used, in the format for
that medium. The system compiles a log of each payment run and all payment
methods applied so that you can see the effects and exercise control.
Maximizing Cash Discounts
The default payment principle operated by the system is to pay open items as late
as possible without losing any available cash discounts. Each vendor open item
carries a base amount, which is the payment due before applying cash discounts.
Each vendor master record contains information about the payment terms that that
vendor has agreed upon with the purchasing company. Under the control of the
purchasing group, different payment terms can be negotiated between a vendor and
each business entity defined by the company codes.
The payment terms for each company code purchasing from a vendor each include
at least one cash discount term, expressed as a percentage discount, and a cash
discount date related to the date of the invoice. For example, the following are cash
discount payment terms:
• 3% if paid within 14 days of the date of the invoice
• 2.5% if paid on or before the 15th of the month following the date of the
invoice
For each open item, you can enter one or two payment terms and a date for net
payment. The system can calculate the due discount date by referring to the
payment terms and the invoice date. You might wish to enter a date for net
payment within a discount period on a date that suits your requirements.
You may find national differences in the practice of settling accounts. In France,
for instance, it is customary to pay an invoice with a bill of exchange immediately
so that the due dates of the bill of exchange and the invoice are the same.
Controlling the Payment Program
The SAP payment program can be set to pay, by bill of exchange, all invoices due
within a specific time period. Many other different payment methods could be
available in the system. The payment program can also be used to make payments
by check, by bank transfer, by postal check, and by other methods such as notes
payable that are specific to particular countries or trading areas.
Multinational accounting is supported by the SAP INT-International Development
module that manages accounting according to the areas of legal force listed in
Table 3.1.
Table 3.1 SAP Accounting Areas of Legal Force
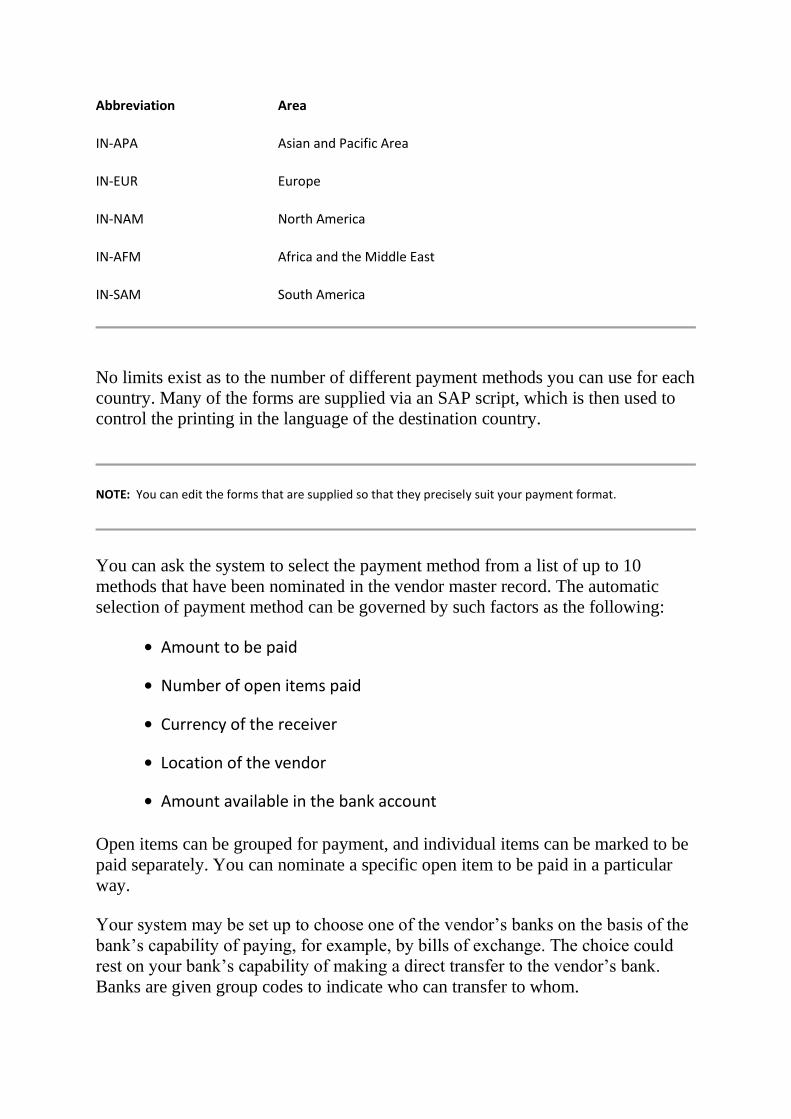
Abbreviation Area
IN-APA Asian and Pacific Area
IN-EUR Europe
IN-NAM North America
IN-AFM Africa and the Middle East
IN-SAM South America
No limits exist as to the number of different payment methods you can use for each
country. Many of the forms are supplied via an SAP script, which is then used to
control the printing in the language of the destination country.
NOTE: You can edit the forms that are supplied so that they precisely suit your payment format.
You can ask the system to select the payment method from a list of up to 10
methods that have been nominated in the vendor master record. The automatic
selection of payment method can be governed by such factors as the following:
• Amount to be paid
• Number of open items paid
• Currency of the receiver
• Location of the vendor
• Amount available in the bank account
Open items can be grouped for payment, and individual items can be marked to be
paid separately. You can nominate a specific open item to be paid in a particular
way.
Your system may be set up to choose one of the vendor’s banks on the basis of the
bank’s capability of paying, for example, by bills of exchange. The choice could
rest on your bank’s capability of making a direct transfer to the vendor’s bank.
Banks are given group codes to indicate who can transfer to whom.
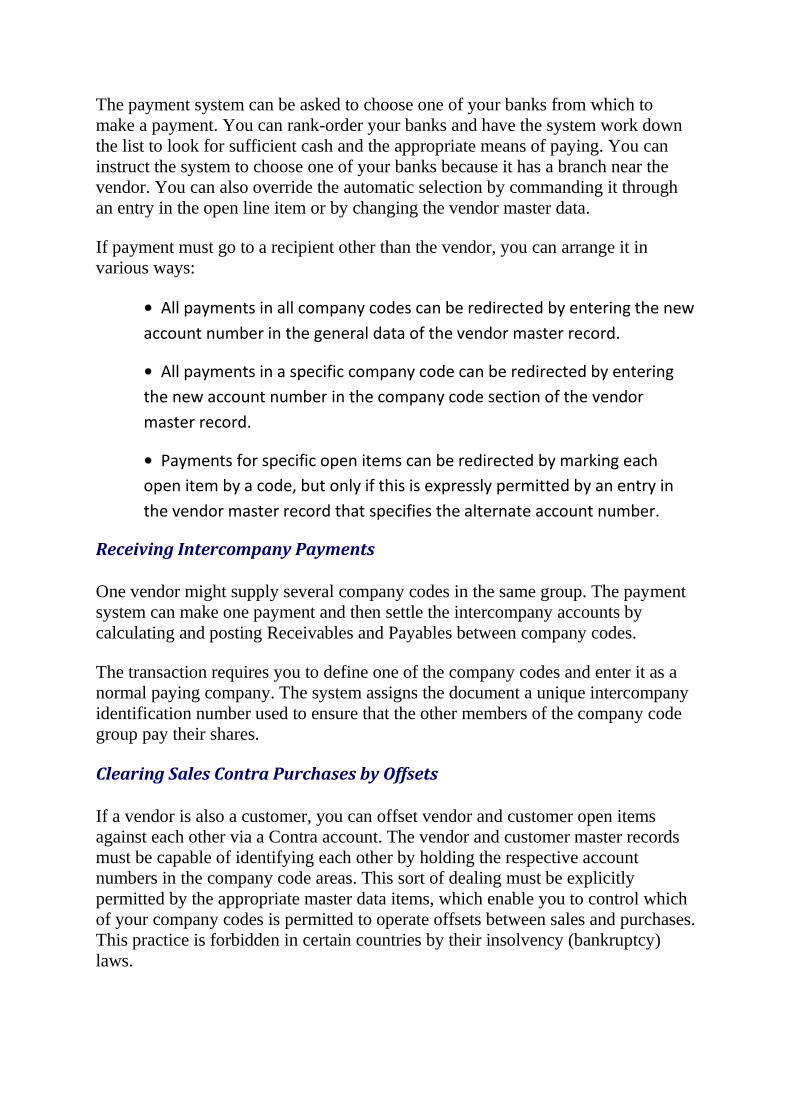
The payment system can be asked to choose one of your banks from which to
make a payment. You can rank-order your banks and have the system work down
the list to look for sufficient cash and the appropriate means of paying. You can
instruct the system to choose one of your banks because it has a branch near the
vendor. You can also override the automatic selection by commanding it through
an entry in the open line item or by changing the vendor master data.
If payment must go to a recipient other than the vendor, you can arrange it in
various ways:
• All payments in all company codes can be redirected by entering the new
account number in the general data of the vendor master record.
• All payments in a specific company code can be redirected by entering
the new account number in the company code section of the vendor
master record.
• Payments for specific open items can be redirected by marking each
open item by a code, but only if this is expressly permitted by an entry in
the vendor master record that specifies the alternate account number.
Receiving Intercompany Payments
One vendor might supply several company codes in the same group. The payment
system can make one payment and then settle the intercompany accounts by
calculating and posting Receivables and Payables between company codes.
The transaction requires you to define one of the company codes and enter it as a
normal paying company. The system assigns the document a unique intercompany
identification number used to ensure that the other members of the company code
group pay their shares.
Clearing Sales Contra Purchases by Offsets
If a vendor is also a customer, you can offset vendor and customer open items
against each other via a Contra account. The vendor and customer master records
must be capable of identifying each other by holding the respective account
numbers in the company code areas. This sort of dealing must be explicitly
permitted by the appropriate master data items, which enable you to control which
of your company codes is permitted to operate offsets between sales and purchases.
This practice is forbidden in certain countries by their insolvency (bankruptcy)
laws.
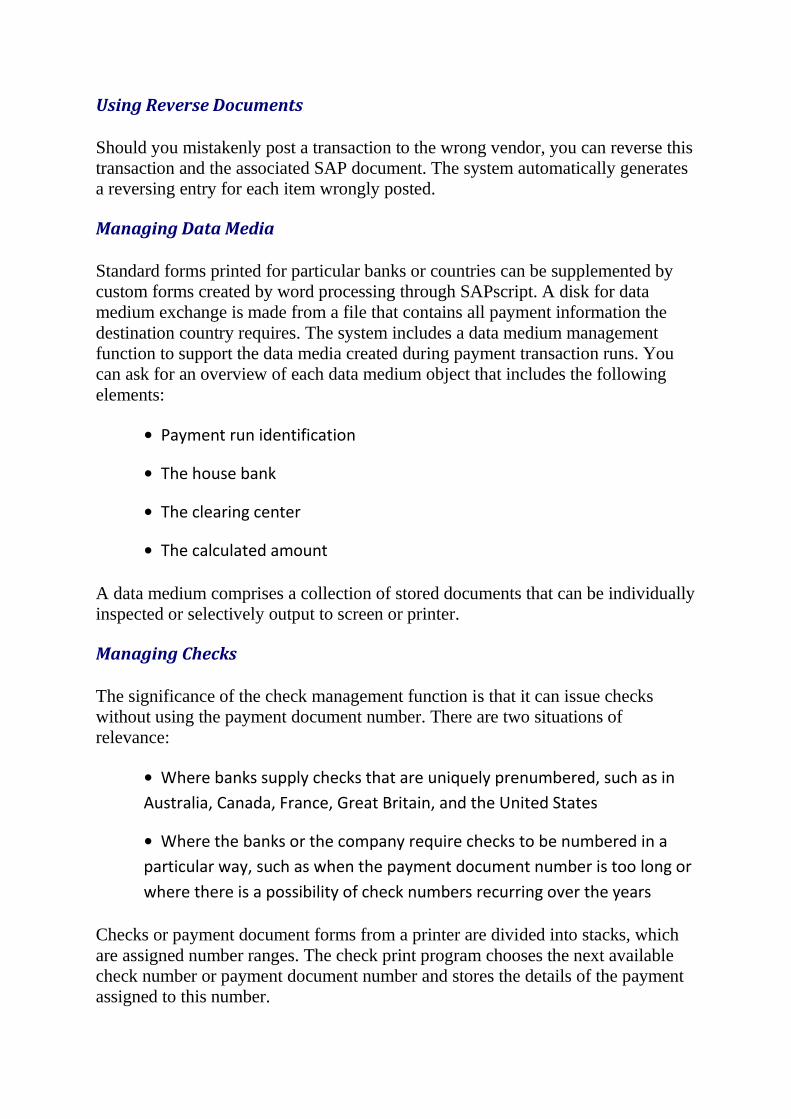
Using Reverse Documents
Should you mistakenly post a transaction to the wrong vendor, you can reverse this
transaction and the associated SAP document. The system automatically generates
a reversing entry for each item wrongly posted.
Managing Data Media
Standard forms printed for particular banks or countries can be supplemented by
custom forms created by word processing through SAPscript. A disk for data
medium exchange is made from a file that contains all payment information the
destination country requires. The system includes a data medium management
function to support the data media created during payment transaction runs. You
can ask for an overview of each data medium object that includes the following
elements:
• Payment run identification
• The house bank
• The clearing center
• The calculated amount
A data medium comprises a collection of stored documents that can be individually
inspected or selectively output to screen or printer.
Managing Checks
The significance of the check management function is that it can issue checks
without using the payment document number. There are two situations of
relevance:
• Where banks supply checks that are uniquely prenumbered, such as in
Australia, Canada, France, Great Britain, and the United States
• Where the banks or the company require checks to be numbered in a
particular way, such as when the payment document number is too long or
where there is a possibility of check numbers recurring over the years
Checks or payment document forms from a printer are divided into stacks, which
are assigned number ranges. The check print program chooses the next available
check number or payment document number and stores the details of the payment
assigned to this number.
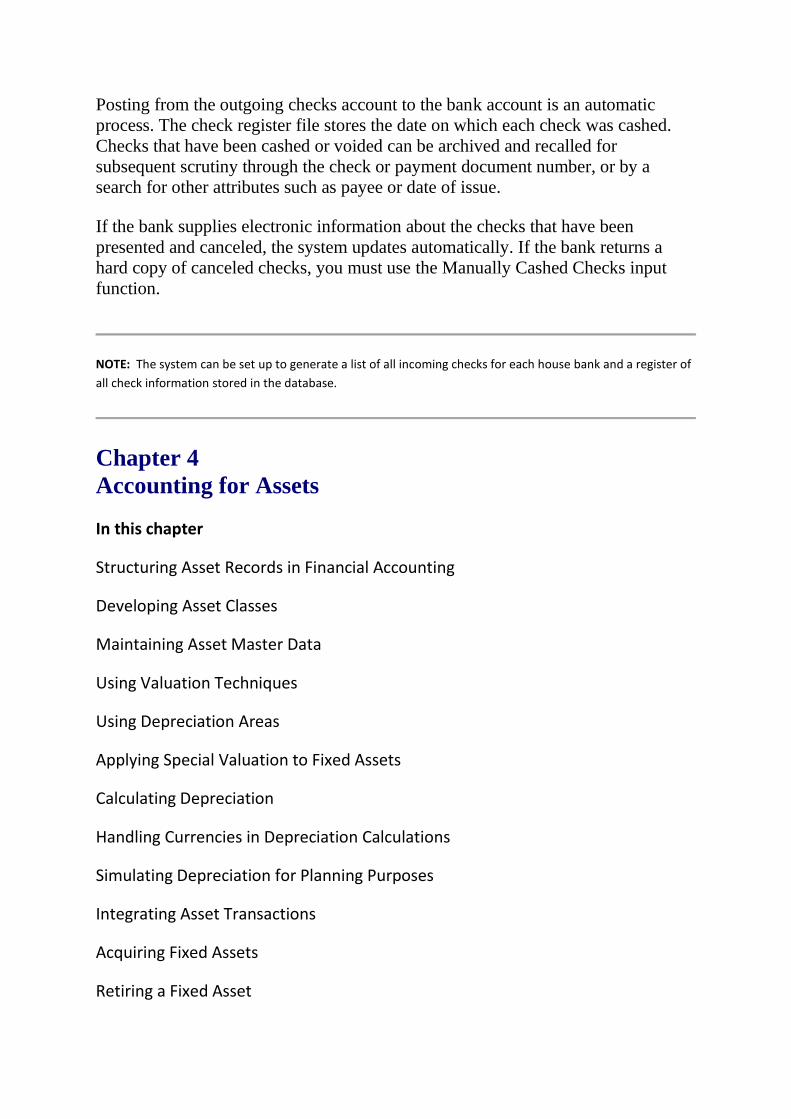
Posting from the outgoing checks account to the bank account is an automatic
process. The check register file stores the date on which each check was cashed.
Checks that have been cashed or voided can be archived and recalled for
subsequent scrutiny through the check or payment document number, or by a
search for other attributes such as payee or date of issue.
If the bank supplies electronic information about the checks that have been
presented and canceled, the system updates automatically. If the bank returns a
hard copy of canceled checks, you must use the Manually Cashed Checks input
function.
NOTE: The system can be set up to generate a list of all incoming checks for each house bank and a register of
all check information stored in the database.
Chapter 4
Accounting for Assets
In this chapter
Structuring Asset Records in Financial Accounting
Developing Asset Classes
Maintaining Asset Master Data
Using Valuation Techniques
Using Depreciation Areas
Applying Special Valuation to Fixed Assets
Calculating Depreciation
Handling Currencies in Depreciation Calculations
Simulating Depreciation for Planning Purposes
Integrating Asset Transactions
Acquiring Fixed Assets
Retiring a Fixed Asset
Managing Assets Under Construction
Using Fixed Asset Special Transactions
Reporting Assets Through the FIS
Developing an International Asset Management Capability
Defining Assets
Assets are legally defined as an organization’s property plus its accrued income.
Assets are shown on the left side of the balance sheet. A balance sheet account is
used to record acquisitions and retirements of assets through the fiscal year. The
balance is carried forward to the same account for the following year.
Assets are identified as a separate accounting area and are assigned an account type
in a scheme that usually includes such account types as the following:
• General Ledger accounts
• Fixed assets
• Customer accounts
• Vendor accounts
Accounts assigned to different accounting types can have the same account
numbers because they are differentiated by their type code.
NOTE: In practice, it is sometimes useful to discriminate between fixed assets and financial assets.
This chapter concentrates on the processes of balance sheet accounting for all types
of assets, although the main concepts were developed in connection with fixed
asset accounting. Chapter 11, “Managing Investments,” develops the ideas of
investing in financial assets and details the strategies for managing their acquisition
and disposal.
Structuring Asset Records in Financial Accounting
The R/3 system is designed to support any legal accounting convention and to
comply with the Generally Agreed Accounting Practice (GAAP) and similar
national standards. Among their many functions, asset records support the
compilation of balance sheets for specific closing dates and for inclusion in the
annual financial documents. Different balance sheets can be drafted to display lists
of balances and to report funds flow analysis.
Asset transactions are subject to the receipt principle, in which the system notices
and remembers all business events because they generate SAP documents that
record the time, date, and all relevant aspects of the event. The structure of the
asset records is flexible within a formal scheme that ensures that all system
modules are compatible and fully integrated.
Like all SAP R/3 data processing, asset accounting is based on data elements that
are defined in master records. If you engage in manual entry, for example, you can
proceed almost entirely by a sequence of multiple selections presented by a list of
options. Even if you enter the required field as a key sequence, the system
probably validates your entry by referring to a set of masters that define acceptable
entries for this field. For complex entities, you need complex master records. For
businesses that change over time, you need the ability to recombine your
established master entities to represent the concepts that make business sense.
The defining reference source for SAP R/3 data elements is the enterprise data
model. In this model, entity types are specified as patterns to which all instances
must conform if they are to be successfully processed by the system. This
effectively imposes an immutable logical structure on data and ensures the
integrity of data processing.
Understanding the Hierarchical Classification of Assets
A tree structure, or better, the structure of the roots of a tree, can be interpreted as a
hierarchy. At each level, every item is connected to one of the items in the level
above, although it may not be connected to any item in the level below. The
balance sheet items in SAP R/3 are classified in a hierarchical fashion, starting at
the items that typically appear in a balance sheet:
• Intangible assets
• Fixed assets
• Financial assets
Of these three elements of a balance sheet, the fixed asset category is assigned the
most complex record structure. Fixed assets are classified, depending on the
requirements of your company, into such categories as the following:
• Real estate
• Machinery
• Fixtures and fittings
• Assets under construction
To ensure that these categories of fixed assets are served with the appropriate
transaction data, a system of General Ledger accounts is established with such
headings as the following:
• Land
• Commercial buildings
• Residential buildings
• Production machinery
• Packing and packaging machinery
• Transportation machinery
• Vehicles
• Data processing equipment
• Office fittings
• Buildings under construction
• Production facilities under construction
• Miscellaneous assets under construction
Assigning these categories to fixed asset classes at the level above may be different
for your company. For instance, do you regard data processing equipment as
fixtures and fittings, machinery, or even as assets under construction?
Identifying Assets
The word “asset” is used in two senses:
• “Assets” is a legally defined heading in the balance sheet that records an
organization’s property plus its accrued income.
• Assets are the individual economic units that a company uses in
permanent business operations that can be identified on the closing key
date for accounting purposes.
The concept of a fixed asset is useful in manufacturing industries to differentiate
these individual economic units from assets such as currency holdings. The
distinction is not so clear, however, if the business of your company is largely
concerned with holding currencies.
Developing Asset Classes
An asset class is defined by entity type 3008, which specifies that an asset class is a
grouping or classification of complex fixed assets, according to statutory or
enterprise-specific requirements.
Although the asset class structure is designed to support balance sheet accounting,
it can also include categories established purely for the convenience of the
enterprise or one of its company codes. Control parameters and default values for
calculating depreciation must be defined for each asset individually within an asset
class. An asset master record is assigned to only one asset class.
NOTE: Each asset class can be assigned a different set of custom or standard reporting formats.
Using Asset Classes to Manage Different Types of Assets
The reason for having a complex classification of assets is to facilitate their subtle
and simple management. You can account for your assets in legal procedures that
also suit your company.
The main idea is to manage different types of assets by using the characteristics of
the asset classes to which they have been assigned. You are free to design asset
classes on any basis, provided that every asset class can be related to one of the
main types of assets as defined on your balance sheet (such as intangible, tangible,
and financial).
The asset class is the main classification criterion for dividing the fixed assets. This
class also uses its relationship to the fixed assets balance sheet account to serve as
a bridge between the reconciliation accounts of financial accounting and the
records of the fixed assets. No restrictions exist as to the number of reconciliation
accounts you set up to receive account allocations that arise as the result of
purchasing and other transactions in the system. However, if you arrange these
allocations based on account class membership, you ensure that the allocations
remain the same throughout the class.
Several asset classes can use the same account allocation so that you can classify a
fixed asset by the asset classes that contribute to it. This enables you to select fixed
assets for special reports and evaluations to suit your company’s requirements.
Furthermore, you can use the account class relationship as a control factor that
determines how master records screens and field displays are formatted. New asset
master records can be created by assigning as defaults the values held in the asset
class master. Assigning main asset numbers can be controlled at the asset class
level, either automatically or as proposals that await confirmation from an
authorized user.
Individual tangible assets can have different uses. For this reason, you might prefer
to allocate them to different balance sheet items. It may be sensible to apply
different depreciation procedures to them, and these can be designated by their
asset class.
If you have an asset under construction, you can arrange that no further
acquisitions be assigned to it after it has been completed and settled on another
asset. The IM-Investment Management module is specialized in the control and
management of large asset investments.
You can lease one or more of your assets. The capital lease method can be applied
to determine and capitalize future payment debits for the leased assets. The lessor’s
Accounts Payable account is posted with leasing liabilities with the correct due
dates.
Many of your assets may have low value. You can manage them individually or
collectively, and you can set a limit to the check amount. By assigning a special
depreciation key, either individually or as part of the asset class definition, you can
write off the acquisition value as soon as the item is acquired.
If you install and configure the PM-Plant Maintenance application, you can closely
couple the asset accounting to manage the necessary technical asset maintenance
for the assets and asset classes that need it. Financial asset management and real
estate management can be arranged by functions from the TR-Treasury
application, which is discussed in Chapter 10, “Managing the Treasury.”
Understanding Asset Class Master Records and the Asset Class Catalog
A catalog of defined asset classes is created and maintained at the client level and
is available to all associated company codes. An asset class master can store
primary valuation parameters and default values that can be used to create master
records for assets in that class. More than one set of valuation parameters can be
specified for each asset class. This enables you to define country-specific valuation
parameters in the asset class master.
If you need to classify asset class masters that are specific to particular
organizations, you can use multipurpose fields in the master record that are
available for customizing as any of the following key types:
• Evaluation groups for reporting purposes
• Access criteria for match codes
• Validation criteria for master record maintenance
Using Asset Master Records
You can create a fixed asset master record by entering selected information that is
specific to the asset. One asset could be represented in the system by several asset
master records that refer to parts of the assets and are assigned asset subnumbers.
In such circumstances, the asset is referred to as a complex fixed asset and is
recorded as an entity of type 3002. You can specify during customizing whether
you permit values to be changed individually for asset subnumbers or whether you
prefer to change the values uniformly throughout a complex fixed asset. The
following examples of complex fixed assets illustrate the possibilities for
exercising this option:
• All low-value fixed assets in the company could be treated as a single
complex fixed asset and depreciated uniformly.
• All company vehicles could be classified as subnumbers of a complex
fixed asset, but individual vehicles could be assigned specific depreciation
rates.
A complex fixed asset can contain only a single fixed asset. However, the
subnumber system is useful for a variety of purposes, as demonstrated by the
following examples:
• Subsequent acquisitions to a complex fixed asset can be tracked
separately or in groups for changes in value.
• Individual fixed assets that are constituents of a complex fixed asset can
be allocated to different cost centers.
• The components of a complex fixed asset can change their relative
values in ways that are not reflected by applying a uniform depreciation
formula.
• Constituent individual or groups of fixed assets can be differentiated for
technical reasons, such as the qualifications of a person able to diagnose
malfunctions.
CAUTION:
A fixed asset cannot be considered a constituent of more than one complex fixed asset.
Using Group Assets and Super-numbers
A complex fixed asset is assigned a main number and is stored as an entity of type
3002. This asset type can be used to represent one or more fixed assets, each stored
in entity type 3001 format. These have asset subnumbers as the asset components
of the complex asset, which has the main number.
If you need to represent the fixed assets of an economic unit or group that does not
coincide with the scope of an account already established in the General Ledger or
any supporting ledgers, you can assign asset super-numbers to any asset master
records to form a representation of the desired economic unit or group. A group
asset, defined by assigning assets an asset super-number, is used in reporting to add
up any desired number of asset master records.
For most controlling and planning purposes, depreciation calculated and posted at
the level of asset components is sufficiently precise. The FI-AA Asset Accounting
module therefore calculates depreciation by main asset number or by asset
subnumber. To perform such calculations at a higher group level, you must assign
super-numbers and create a virtual asset super-class. This may be necessary if legal
requirements mandate summaries at a level higher than the economic unit
represented by the main asset number.
Using Asset Line Items
Each transaction concerning an asset creates a line item for every depreciation area
to be posted. The following data elements can be included in an asset line item:
• Transaction type, such as acquisition or retirement
• Asset value date
• Posted amount
• Depreciation and interest pertaining to the transaction for each relevant
depreciation area
• Proportionate value adjustments, if appropriate
No limits are imposed on the number of transaction line items posted to an asset
master record, so you can continue to use the same record throughout the lifecycle
of an asset. By selecting line items for particular depreciation areas, such as book
valuation or tax valuation, you can report on the transaction history of an asset
from different points of view.
Using Asset History Reporting
An asset history sheet is a standard report delivered at year-end closing. This sheet
must be included in the Notes to the Balance Sheet in the financial documents. The
asset history sheet gives an overview of expansion costs and points out the changes
in value of the individual balance sheet items comprising the fixed assets.
An asset history report or asset chart is a special customized report that collates
master data and changes in value of particularly important assets. Each asset class
can be assigned SAPscript forms that can be adjusted by word processing to give
the list layout and associated information required by the target readership.
Maintaining Asset Master Data
An economic unit is represented as a complex fixed asset made up of one or more
subassets. The master record system must store the following types of information:
• The fundamentals of memory-based orderly accounting, as needed for
the legal financial documents
• Long-term documentation of the fixed assets of your company
• Information needed for internal decision making, such as the legal
acquisition costs and depreciation, together with information used in
controlling and profitability assessment
• Information needed to process transactions relevant to the life cycle of
each asset
Using Asset Master Record Elements
Each asset master can be viewed as a series of screens that you can reformat
according to asset class and the data to be displayed. One screen contains
information that is likely to change frequently during the lifecycle of an asset, such
as information relevant to cost accounting that can be maintained as a function of
time. Other screens show information that is relevant to particular management
functions. The selection of this information can be controlled by the asset class of
the asset master displayed.
The following types of master record displays are standard screens or screen
components:
• Time-dependent data
• Real estate data
• Leased asset data
• Origin or supplier of the asset
• Insurance data
• Inventory and warehouse management data
• Customized organization-specific asset sorting criteria
The requirements of an asset master data system include the following:
• Detailed and comprehensive information must be available on each
asset.
• Data can be changed only under strict authorization code and is subject
to document change management procedures that can trace all changes
and recover them if necessary.
• Different asset types should be accessible without displaying irrelevant
fields.
• Users should be able to view only the screens that are needed for their
task and are compatible with their authorization profiles.
Controlling Asset Class Screens
The screens available and their structure are determined by the asset class to which
the asset belongs. Under this regime, the following classification of master data
elements can be affected:
• Data fields that do not appear on the screen
• Data fields that are mandatory
• Data fields that are optional
This scheme enables you to specify some fields to be optional in the master and
optional in the screen as displayed. An asset class master that includes mandatory
fields ensures that these fields appear in any copy of this master.
Understanding Asset Master Maintenance Levels
An economic unit always belongs to an asset class and therefore does not need a
separate maintenance level. Instead, an economic unit can be maintained by
updating the main and subnumber assets that comprise it.
The function of a maintenance level is to control how each data field in an asset
master can be altered. Some can be changed at the asset class level, some at the
main asset number level, some at the asset subnumber level. Within an economic
unit, data can be changed uniformly across asset components at the subnumber
level.
Using Validation Conditions and Substitution Conditions
A validation condition is a rule (additional to the standard checks) that governs
how an asset master can be created. For example, you could specify that masters
for certain asset classes are to be limited in the permissible depreciation keys.
A substitution condition is an if-then rule that automatically inserts particular
default values if certain fields contain specified entries. For example, you could set
up a condition that automatically enters the correct business area according to the
content of the Plant field by referring to a table of correspondences.
Creating and Viewing Asset Master Records
In the absence of any other command, a new asset master inherits the default
values of the principal control parameters of the asset class to which you assign it.
If you reference an existing asset master record, whatever its asset class, the
parameters are copied to your new master.
You have two choices in asset master numbering:
• Internal assignment allows the system to assign asset master numbers.
• External assignment requires you to assign an asset master number.
The records of an asset master can be selected according to the purpose (and
therefore according to the task) being carried out by the user. For example, you can
associate the Real Estate view with those who need it and the Insurance view with
specialists in that subject. The details of asset views generally are determined
during customizing.
Identifying Time-Dependent Data
Some of the data stored in an asset master record may become inappropriate
outside a particular time period. Such data is defined as time-dependent data, and
the system automatically compiles the history of the changes to these particular
allocations.
You can decide which fields in the asset master should be regarded as time
dependent. Cost accounting allocations to cost centers, orders, or projects must be
entered according to the month or other accounting period to which they apply.
Another type of data that must be treated as time-dependent is that associated with
shift operations and plant shutdowns. These events directly affect the values to be
assigned for depreciation in the period.
Perhaps the most useful way of judging whether a data item is time dependent is to
consider whether anyone would interpret the meaning of any value held there in a
different way if they knew when the data was collected.
Using a Workflow to Effect Mass Changes to Asset Masters
You likely will use the mass change procedure when you must make extensive
changes. For example, your company may decide to set up a new system of cost
centers to monitor costs in a different way. All your asset transaction data for the
year may need to be re-allocated by adding the identification codes to each of the
transaction documents that will reassign the values to the new cost center system.
You also must update the relevant asset masters to ensure that future transactions
concerning them are correctly assigned to the new cost center plan.
The system will help you develop a work plan. You select the assets to be
reassigned from an asset report and then generate a work list. When you post this
work list, the system opens a workflow that defines which employees are to carry
out the necessary tasks. The authorized users then manually check the automatic
work list and supplement it if necessary. When the task list is fully approved, you
can post it. Such a program automatically generates a work list for each employee
and sends it to them by SAPmail.
The validation and substitution technique can be used in this connection to enable
you to set up rules to control when and how the master records are to be altered,
down to the level of specifying which fields are to receive what new data.
In mass changes of this kind, many asset master records might have to be altered,
and any asset master could have a profound effect on the valuation of your
company if an error exists in it. The procedure for effecting a mass change with
workflow control ensures that the alterations can be planned and checked in detail
on a stage-by-stage basis. Document change management ensures that all these
updates are documented and therefore amenable to subsequent analysis and
rectification, if necessary.
Archiving Asset Portfolios
As your company acquires and releases assets over the years, your portfolio of
assets could become extensive and entail very large volumes of data. If you archive
any data from the SAP R/3 system, the format is consistent, and you can retrieve
and operate on the archive material without having to undergo a hiatus.
Asset accounting keeps records of archiving activities, so any request for asset
evaluation data can be addressed to the online database or the archives, according
to the report date of the asset evaluation required. With the assurance that you can
always access archived data, you can maintain your asset portfolio by archiving the
asset evaluations at year-end closing. If you eliminate an asset from your portfolio
by selling or disposing of it, you have the choice of clearing the information from
your online database or retaining it for a specified period as a deactivated asset
record. You can use such information, for example, to assist in establishing the
records of a similar or replacement asset.
Access to asset masters can be controlled by additional authorization to limit an
employee’s scope for updating master records to specific assets or classes of assets.
You can also restrict the display of particular data fields and prevent the update of
others on an individual user basis. Classification of authorization can be arranged
to cover any combination of the following asset master data structures:
• Company code
• Business area
• Plant
• Asset class
Although you can design and store a workflow with extensive logical conditions to
manage a complex mass change to asset masters, you cannot execute this change
unless you have access to the special authorization object. This check prevents
unwanted mass changes to the asset master data set.
TIP: By using the authorization facilities, you ensure that the only people who make changes to the data about
your assets are those who are responsible and qualified to do so properly.
Using Valuation Techniques
You might like to think of depreciation as an amount of money that will be taken
out of your company each accounting period on behalf of each of your assets. If
you have a valuable asset, you can perhaps sell it. The price you could realize
might be more than you paid for it, in which case your company would enjoy
negative depreciation. Often, your operational assets wear out from productive use,
and their values decline. Eventually, these will be scrap and will perhaps cost a
great deal to eliminate.
The following sections discuss some computations that can be applied to compute
values for depreciation.
Using Depreciation and Value Types in Asset Accounting
A scheduled calculation is applied to determine the amounts that are recorded as
depreciation to estimate the decline in value of the operating funds. Negative
values of depreciation represent increases in value. A depreciation key is
established as a master record that can be evoked to control the valuation
calculations.
The valuation of an asset can be carried out in various ways. Some of these
techniques are acceptable for legal purposes, but others may be confined to internal
uses, perhaps in some regions of legal force but not others. The FI-AA module
makes available the following valuation types by providing access to the data and
the methods of using that data:
• Acquisition and production costs
• Investment support measures
• Transfer of reserves in accordance with tax guidelines
• Revaluation using indexed replacement values
• Revaluation using manual entries
• Ordinary depreciation
• Scheduled depreciation
• Unplanned depreciation based on current value depreciation
• Special tax depreciation
• Interest by asset
• Interest by depreciation area
These value adjustments can be classified by depreciation type, as follows:
• Ordinary depreciation that records the decline in value of an asset by
normal wear and tear over its useful life
• Special tax depreciation
• Non-scheduled depreciation
• Transfer of reserves
• Interest
Understanding Other Types of Depreciation
For tax purposes, depreciation can be calculated as a percentage over a tax
concession period without reference to the actual wear and tear of the asset. This
can differ from the depreciation calculation approved by the commercial law in
force. The difference must be recorded as a special item on the liabilities side of
the balance sheet. You are allowed to form open tax-free reserves from untaxed
profits based on tax law provisions if you show them as a special item. Tax will
become due on special items during later periods.
Two familiar reasons for unplanned (non-scheduled) depreciation are fire and
natural disasters. Falling out of date as a result of technological progress can also
be a non-scheduled depreciation. You may have to base your depreciation
calculation on the current value of the asset rather than on a value computed as a
percentage of the cost distributed over the predicted useful life.
Transferring Reserves
When an asset is sold, the amount realized is regarded as a hidden asset. This
amount can be transferred during the year of disclosure to newly acquired assets
that are replacements for the asset sold.
This transfer of hidden reserves diminishes the acquisition and production costs
recorded for the newly acquired assets. If no transfer takes place (perhaps because
no new asset is acquired), the amount that arises from the sale must be assigned as
a reserve to be set against profit for the year. If assets are acquired in subsequent
years, this reserve must be transferred to them in the period in which they are
acquired.
Using Depreciation Areas
When you post an asset transaction, you may take the opportunity to update some
accounts set up for purposes not strictly required for legal financial accounting. It
may be convenient to define depreciation areas that accumulate asset transaction
data to enable you to analyze and compare different areas. You could define
separate depreciation areas that represent the valuation of assets for different
purposes, such as the following:
• Valuation of assets within a corporate group
• Valuation for a commercial balance sheet
• Valuation for a tax balance sheet
• Valuation for costing purposes
• Valuation of net assets
• Valuation of assets defined on the basis of any geographical attribute
• Valuation of assets defined on the basis of any commercial attribute
• Areas defined on the basis of any logical combination of other areas or
the values already calculated for them
The combination of asset valuation methods can be used for internal controlling,
for example, to compile valuation data for a special group within an enterprise
using a particular currency conversion.
A depreciation area is specified as an entity of type 3007, Asset Valuation
Category. A depreciation area need not correspond to any business area that your
company may have delineated for internal purposes. You can establish
depreciation areas to evaluate your assets from several points of view. Each area
must be defined by specifying the following information:
• The depreciation types required
• The valuation rates to be used, such as the costs of acquisition or
production, the replacement costs, and investment support measures
• Other special rules to be applied, such as depreciation below zero and
currency handling rules
The system calculates the necessary values for all your depreciation areas and
maintains them in parallel so that you can readily switch from one to another when
reviewing the reported data.
A depreciation area can be co-extensive with a business area, but it is sometimes
convenient to make it independent of the business area system. Entity type 2009,
Business Area, is a non-independent unit in Financial Accounting for which a
balance sheet and a profit and loss statement can be prepared purely for the
purpose of internal reporting. This type forms no part of legal balance sheet
obligations. However, a set of business areas under a client code together include
all the General Ledger accounts required for the financial documents.
Using the Book Depreciation Area
The concept of applying a book depreciation to an asset is used when it is
convenient to ignore any variations of individual assets and to compute a value
based on some form of aggregated or summarized information. Insurance, for
example, can be based on a book depreciation area calculation of value. The
following standard computation functions can be applied to yield data for a book
depreciation area:
• Ordinary depreciation, allowing for wear and tear
• Unplanned depreciation
• Special depreciation, disregarding actual wear and tear
• Investment support
• Indexing based on inflation rates or rates computed on the basis of
collated statistics that indicate the change in value of similar assets
The following special rules can be applied in the book depreciation area:
• Cutoff values below which the asset is treated differently for
depreciation purposes
• A multiple shift under which the computation to be applied for
depreciation purposes can differ according to the value of a parameter
(such as the number of shifts worked in a plant in the period) that is
accepted as a valid index used to influence the depreciation formula
Using the Tax Depreciation Area
The following standard functions can be applied to yield data for a tax depreciation
area:
• Ordinary depreciation
• Unplanned depreciation
• Special depreciation
• Investment support
• Indexing
The following special rules can be applied in a tax depreciation area:
• Cutoff values
• Multiple shift
Using the Cost Accounting Depreciation Area
The following standard functions can be applied to yield data for a cost accounting
depreciation area:
• Ordinary depreciation
• Unplanned depreciation
• Investment support
• Interest
• Indexing
• Below-zero depreciation
The following special rules can be applied in the cost accounting depreciation area:
• Fixed or variable depreciation
• Multiple shift
• Suspension of depreciation for one or more accounting periods
Using the Reporting Valuation Depreciation Area
The following standard arithmetic functions can be applied to yield data for a
reporting valuation depreciation area:
• Ordinary depreciation
• Unplanned depreciation
• Special depreciation
• Investment support
• Indexing
• Foreign currency
Using the Net Asset Depreciation Area
The following standard functions can be applied to yield data for a net asset
depreciation area:
• Ordinary depreciation
• Unplanned depreciation
• Indexing
The following special rules can be applied in a net asset depreciation area:
• Cutoff values
• Multiple shift
Creating a Chart of Depreciation
If you declare depreciation areas, you can assemble a set of them to be displayed in
a chart of depreciation. You can also assign them a common set of parameters. A
company code can be assigned to only one chart of depreciation, but several
company codes can use the same chart. For example, you may want all companies
in a country or economic area to use the same chart of depreciation.
NOTE: The depreciation parameters defined in the chart of depreciation are applied to all asset depreciation
areas in the chart.
Maintaining the Depreciation Area Data
A business transaction in asset accounting is a one-time posting. The FI-AA
module carries out automatic updates of asset values using the defined valuation
rules for each depreciation area. In this way, the valuation data under the different
sets of rules is maintained in parallel.
You can post values and depreciation parameters to all depreciation areas or to
selections of areas. The reference technique enables you to nominate a depreciation
area and use its values as the basis for the values of another area. You can also
specify valuation and depreciation parameters for particular depreciation areas and
for individual economic units within them.
Developing Derived Depreciation Areas
You can generate a derived depreciation area by adding or subtracting the values of
one area from those of another. For instance, you could keep a derived area to
record the difference between book value and net value of a set of assets. You can
add area values or take the average of two or more. For example, the standard U.S.
chart of depreciation maintains a derived area to compute the valuation differences
due to different tax regulations, such as Primary Federal Tax Book and Alternative
Minimum Tax. In Germany, a derived depreciation area is used to determine the
difference between the total tax depreciation and the book depreciation. This
difference is indicated as a reserve for special depreciation.
As a function of its interface with FI-Financial Accounting, the Asset Accounting
module can post the values of one or several depreciation areas to suitable accounts
in the General Ledger. These accounts can then be used to prepare in parallel such
additional balance sheet versions as the following:
• Commercial balance sheet
• Tax balance sheet
• Group commercial balance sheet
Applying Special Valuation to Fixed Assets
The special valuation features of FI-AA are available as enhancements of the basic
functions for handling the three main depreciation types:
• Ordinary depreciation
• Special depreciation related to country-specific tax laws
• Unplanned depreciation
The main group of special valuation functions are designed to provide the
information needed by specific company accounting areas set up for internal
purposes such as cost accounting. However, several special valuation techniques
can be managed in connection with the depreciation area system.
Using Investment Support Measures
Some government authorities award subsidies or grants to a company for
investments in certain industries or regions. The FI-AA system can show these
amounts either as reductions in acquisition values on the assets side or as value
adjustments on the liabilities side of the balance sheet.
You can treat an investment support measure as a reduction in the depreciation
base in a depreciation area. If several investment assistance grants are to be
managed for the same asset, it may be best to create a depreciation area for each
investment support measure. The amount drawn on each subsidy or grant can then
be shown separately.
Using Indexed Replacement Value Depreciation
The base for ordinary depreciation is often the historical acquisition costs, or the
costs of producing the asset in-house. In addition to this baseline, you can calculate
depreciation on the basis of the replacement value of the asset, indexed to reflect
changes in value.
Two reasons exist for indexing the replacement value of an asset:
• The replacement value changes because of inflation.
• Technological progress will probably affect the price that would have to
be paid for an adequate replacement.
Either or both of these indexing factors may be positive or negative. The system
enables you to define two index series for each asset class that used to adjust the
replacement value for assets in the class. These two series can be used as numerical
models for inflation and obsolescence. After defining an index series, you can
assign a point number to any accounting period so that the calculation for that
period adopts the correct value in the index series and then adjusts the depreciation
to allow for the anticipated changes in replacement value.
Using Backlog Calculation of Depreciation
You may find it helpful to recalculate the depreciation values you have been using
to figure depreciation for balance sheet or internal purposes. This process of
backlog depreciation calculation helps you to ensure that the indexing is applied to
both the historical acquisition or production costs and the current net book value.
The system enables you to combine backlog calculation with any depreciation
method, but your legal environment may not.
Using One-Time Revaluation
Every few years, you might want to offset inflation and carry out a so-called one-
time revaluation of your fixed assets. Exactly how a company does this is a matter
for management decision, but the system has an interface that accepts individual
revaluation rules to prepare for applying them to the asset database.
Using Imputed Interest in Cost Accounting Depreciation
If you have a fixed asset, you could sell it and raise capital. Therefore, the asset
represents capital in use. This amount of money could depreciate or attract interest
if it were suitably invested.
It has become an acceptable accounting practice to post an amount to the
appropriate cost accounting object that represents the imputed interest or the
(imputed) depreciation of the capital in use in each fixed asset. Therefore, an order
or a cost center is appraised of the change in value of the associated fixed assets
that could have accrued as the result of depreciation and interest charges or
earnings.
Using Valuation for Insurance Purposes
The FI-AA module can store insurance data for each asset on insurance masters
that record two values:
• Current market value
• Value as if new
You can set up a depreciation area to calculate values for current market value for
insurance. This uses the same techniques as the depreciation and revaluation areas.
The current value for insurance purposes based on the value as new do not need to
be calculated as a specific depreciation area—you can record in the asset master an
index series to represent the changes over accounting periods of the value as if
new. These index series values are referenced automatically to calculate the current
insurable value as if new.
Using Valuation of Net Assets
If your company operates in a country that requires a separate statement of net
assets, you can define a depreciation area in the FI-AA module for this purpose. A
net asset depreciation area typically operates valuation rules to achieve the
following conditions:
• Values take inflation into account.
• Depreciation is carried out only down to a specified cutoff value.
• Depreciation values are also calculated as an average of several
depreciation methods.
Simulating the Effects of Depreciation
Applying a set of calculations based upon depreciation area formulations can be
carried out in simulation mode in which the results are available for display. No
changes are posted to the balance sheet ledgers.
A simulation depreciation area can be defined and used to try the effects of
different parameters.
Using Tax-Based Depreciation as Special Valuation Reserves
Depreciation for tax purposes can be calculated as a percentage over a tax
concession period without referring to the actual wear and tear of the asset. In
some countries, the legal provisions enable you to copy the tax valuation rates for
depreciation and then use them to form the commercial balance sheet.
This could differ from the depreciation calculation approved by the commercial
law in force. For most users of a commercial balance sheet, it is important to be
able to see how each asset is valued in commercial terms, whatever the tax
valuation rates may be.
The FI-AA module enables you to show the book depreciation of a fixed asset on
the asset side of the balance sheet. If this depreciation is not the same as the value
allowed under the tax regime in force, the difference must be recorded as a special
item on the liabilities side of the balance sheet. The item is then classed as a
reserve for special depreciation and acts as a value adjustment on the liabilities side
of the balance sheet. These calculations are carried out as a derived depreciation
area, which ensures that these valuation reserve postings are transferred to
Financial Accounting and the General Ledger.
You are allowed to form open tax-free reserves from untaxed profits, based on tax
law provisions of this kind, if you show them as a special item. Tax may become
due on special items during later periods, depending on their depreciation over this
time.
Using Group Valuation for Consolidation
The fixed assets in some of the company code balance sheets of a corporate
enterprise might not be treated for depreciation purposes in the same way as the
fixed assets of the parent company responsible for consolidating the accounts. To
accommodate these differences, you can set up a depreciation area in each
company code that computes the asset depreciation in exactly the same manner as
the consolidating parent. These depreciation areas use the same methods and
currency so that the consolidated results are compatible.
SAP R/3 FI-LC Consolidation is a module specialized for the creation of group
balance sheets. In particular, this module represents correctly the value movement
of any asset transactions between affiliated organizations.
Using Individual Special Depreciation Areas
The standard SAP depreciation areas provide a flexible method of valuation for
fixed assets, as well as for reporting their value changes from different points of
view and in a variety of aggregating structures. However, you can also create any
number of special depreciation areas and assign them individual parameters.
If you have already run FI-AA to assemble cumulative depreciation reports, the
module retroactively determines the depreciation using any new special
depreciation areas you create.
Calculating Depreciation
The calculation procedures for fixed asset depreciation accounting are governed by
their purposes:
• Legal requirements that are country specific
• Accounting techniques that include public (external) accounting and the
internal accounting for company-specific purposes
A comprehensive set of country-specific depreciation keys is provided in SAP R/3.
These keys serve to trigger the calculation procedures for all depreciation types,
such as ordinary depreciation, special depreciation, and so on.
Defining User-Specific Depreciation Keys
If you cannot initiate the precise depreciation computation you require by using
one of the standard depreciation keys, you can define a procedure of your own. If
your legal environment initiates a new procedure, you may need to create a fresh
depreciation and assign it the necessary data processing functions. The basic
calculation elements are available in the system, but you must specify the
following parameters or accept the defaults offered:
• Depreciation method, such as straight line depreciation
• Reference value, such as the acquisition value
• First-year convention, such as the half-year rule
• Method of determining the depreciation percentage, such as a useful life
distribution
• Periods for calculation, such as calendar months
Understanding Standard Depreciation Methods in SAP R/3 FI-AA
Any or all of the available standard depreciation methods can be used in parallel
for each fixed asset. The basic method involves applying a straight-line
depreciation calculation to the reference value that distributes the loss of value
evenly over the useful life of the asset. If the asset is acquired at some point after
the beginning of this useful life, the depreciation must be based on the remaining
useful life. The depreciation calculations in use worldwide are essentially variants
of the straight-line useful life model. They include the following methods:
• Declining balance method of depreciation
• Declining multiphase depreciation
• Sum-of-the-years digits method
• Depreciation based on the number of items and the number of times
they are used
• Depreciation of equipment based on the number of Units of Production
(UOP), as used by mining and extraction companies
• The average of two or more depreciation methods
• Special depreciation calculation mandated by an accounting authority
• Special depreciation type, such as the percentage during the tax
concession period
Ending the Depreciation Calculation
If you are using a depreciation area designed to serve cost accounting, it may be
useful to continue to depreciate an asset beyond the point at which its book value
has become zero. You can continue to calculate depreciation at a reduced
percentage after an asset has reached the end of its useful life. The following
possibilities are supported by FI-AA:
• Depreciation continues until the end of the asset’s useful life.
• Depreciation stops when an asset’s book value becomes zero.
• An asset can be depreciated below zero value.
Allowing for Cutoff Values and Scrap Values
Some countries apply an asset accounting rule that stipulates that an asset cannot
be depreciated below a certain value for balance sheet purposes. This rule assumes
that an asset always has at least a scrap value. The FI-AA module enables you to
specify this cutoff as a percentage of the asset value or as an absolute value.
If you know the cutoff percentage or the cutoff absolute value, you can subtract
this amount from the depreciation base amount before the depreciation calculation
begins. In this case, the figure would be entered as scrap value. Alternatively, you
could operate the scrap value as a cutoff value in the depreciation calculation.
Relating Depreciation to Usage
If your plant depreciates regardless of whether you use it, you might be content to
use a fixed rate of depreciation. However, a plant receives much more wear and
tear if it works than if it remains idle.
You can model a depreciation rate that is proportional to some index of usage, such
as the number of shifts worked in the period. Perhaps some assets retain their value
if they are shut down. In practice, variations of value arise for many different
reasons, and the best calculation model may be a combination of a fixed rate plus a
variable depreciation rate related to usage.
Defining Asset Accounting Periods
Financial accounting and asset accounting can define without restriction the fiscal
year and the accounting periods within it. You can have more than 12 months in a
fiscal year, and your accounting year need not last 365 days.
NOTE: If you decide to run a computation using a shortened fiscal year, the FI-AA module automatically
adjusts the corresponding depreciation values.
Each national accounting authority can decide to implement a particular set of
rules for applying depreciation. The SAP R/3 system contains functions that
support all the known regulations.
When a company acquires, retires, or transfers a fixed asset, there must be a
method of calculating how much of the value should be assigned as depreciation to
each of the periods in the fiscal year in which the change of asset took place. For
example, the mid-quarter convention assumes that an asset will have been
acquired, retired, or transferred completely on the mid-quarter date.
Another possible country-specific or company-specific rule might set a particular
value as a maximum that can be taken as the reference value for the purpose of
calculating depreciation. This maximum may have no relation to the acquisition
value of the asset, to its replacement value, or to any characteristic of the asset
apart from the fact that it has attracted the stipulated maximum.
Handling Currencies in Depreciation Calculations
Many companies operate in international markets in which it is optional or
mandatory to establish independent economic units. In SAP R/3, such affiliates are
assigned a company code under a consolidating parent at the client code level.
Any or all affiliated companies can function in a different local currency, yet the
corporate balance sheet must be readable in a single currency. Group consolidation
in these circumstances requires currency conversion.
Using a Special Group Currency Depreciation Area
The FI-AA is provided with a special depreciation area designed to report
depreciation in the group currency. This area, however, is separated into the
individual company code organizations and is computed by using the value of each
posting at the time the business transaction was first posted. The AA module
directly converts all acquisitions into group currency at the time of the transaction
by using the exchange rate then prevalent.
Using this calculation results in an acquisition cost of the asset that accounts for
the prevailing currency exchange rate between the currency of the business
transaction and the group reporting currency. The subsequent depreciation can be
calculated based on this one-time assessment of historical acquisition cost. The
system automatically determines retirements of assets and transfers on the basis of
a percentage of book depreciation values.
By using a historical acquisition cost value that takes account of the exchange rate
at the time, the AA system prevents currency fluctuations from influencing the
cumulative computation of depreciation. If depreciation were to be calculated in a
step-wise manner, a temporary high or low currency valuation in one period could
have a disproportionate effect on the value to be assigned to the asset in the future.
Applying Differentiated Capitalization Rules
Some regions of legal force use particular rules for treating some assets as capital.
For example, differences exist as to whether freight can be valued in the same way
as other assets. There may be different rules about who owns a delivery in transit.
This could affect balance sheet calculations if the group rules differ from the rules
of the affiliated company.
In such cases, you can enter values for the acquisition or production of a fixed
asset that are differentiated with respect to depreciation areas and that take into
account the time of the posting transaction.
Allowing for Currency and Valuation Differences
Fixed assets are depreciated in a procedure defined as a foreign currency
depreciation area for the group. Another depreciation area for the group uses the
local currency of each individual organization.
By comparing valuations from both depreciation areas, the system can distinguish
the differences that arise from currency conversion. The system can also identify
the differences caused by divergent valuation rules.
Using Parallel Currencies in the General Ledger
SAP R/3 FI supports the maintenance of all General Ledger values pertaining to a
company code in up to three currencies in parallel. Three local currencies can be
defined at the customizing stage.
Each currency has a corresponding depreciation area. This enables you to post the
value of a fixed asset to the General Ledger in three currencies in parallel.
Therefore, you can transfer asset values in local currency to the FI-LC
Consolidation system, where they are converted at an exchange rate that can be
specified when the consolidation is reported.
If you have no special consolidation requirements and report only in foreign
currencies, you do not need to set up special foreign currency depreciation areas.
As an alternative, you can designate specific currency conversions to be used for
all standard reports through the SAP R/3 Financial Information System.
Simulating Depreciation for Planning Purposes
The main reason that you would simulate depreciation is to help you prepare a plan
of acquisitions and retirements. For example, you may be running CO-CCA Cost
Center Accounting, to which you would want to assign planned values for
depreciation based on a simulation. The following factors can make this a difficult
task unless some form of simulation is available:
• Different depreciation methods can make appreciable differences to the
year-end closing situation.
• The depreciation method used can influence the management case for
planned acquisitions and retirements.
• The anticipated or forecast changes in the values of fixed assets over
future fiscal years could indicate opportunities for strategic planning that
should begin soon.
• There may be opportunities to take advantage of special tax-related
depreciation that can be optimized by precise and selective amount
distribution across accounting periods.
The concept of asset transaction simulation can be portrayed as a what-if exercise
in which the asset accounting system is used in a testing mode that has no effect on
the actual asset transaction database. However, the full function set is available to
demonstrate the effect on the balance sheet of any planned patterns of acquisitions
and retirements. You can use data from your existing or historical assets, and you
can acquire data on assets that are likely to be available. You can also generate
hypothetical assets that help focus your long-term asset strategy by applying the
FI-AA module to asset data that is realistic and that can be manipulated to refine
the simulation. The structure of a simulation of asset depreciation follows the
standard SAP convention of always identifying a plan as a specific version. This
ensures that you encounter no confusion between the results of one planning or
simulation run and another that was carried out with one or more parameters
changed.
The simulation specification typically designates the following data objects and
invites you to specify values or accept the suggested defaults:
• The simulation version that you intend to edit to become a new version,
or a new simulation specification for which you will enter or select the
details
• The asset class for which the simulation will be run
• The depreciation key to be used to control the depreciation calculations
• The useful life, or formula to be used to compute it
• The indexing arrangements to be applied, if any
• The validity period for the simulation, defined as starting and finishing
dates or accounting periods
As part of the simulation, you may also want to test the effects of some asset
acquisitions, retirements, and transfers.
After you initiate a simulation, you can call on any of the standard reporting and
display functions to process the simulated data in the same way as if they resulted
from actual asset transactions. The following options illustrate the useful analyses
that can come out of a simulation of asset depreciation:
• Displays of the effects on the profit and loss operating results, with and
without special depreciation
• Superimposed graphs of the changes in the value of an asset class, given
various assumed values for the length of the useful life
• Graphs of the depreciation of individual assets that have been
depreciated over the simulation period, using different depreciation
calculation procedures
In any of these simulated activities, you can use your existing parameters, such as
depreciation keys. You can also generate new depreciation procedures to which
you assign temporary keys so that they can take part in the simulation. Each
different simulation specification is stored as a version so that you can use it again
on different data or edit it to generate new versions.
Changes to rules used for depreciation are not made very often. Accounting
standards dictate that for comparison purposes, asset depreciation methods should
generally remain constant. Any changes must be highlighted in the notes to the
accounts, together with the reason for change. It is typically also required that you
show what the depreciation impact would have been under the previous provision.
Previewing the External Rendering of Accounts
When you must prepare the balance sheet and the profit and loss statement for an
economic unit in your corporate enterprise, there may be scope for presenting these
accounts in different ways within the legal framework. For example, you may be at
liberty to use special depreciation over some or all your assets.
TIP: A simulation using each of the various legal options can help you identify the best combination.
The process of depreciation through wear and tear and gradual market fluctuations
is usually assumed to be a continuous one and is said to be subject to the principle
of continuity. The calculations do not allow any sudden changes in the value of
individual assets. However, you may want to explore the effects of modifying the
depreciation parameters for your current assets in certain asset classes. In
particular, you will want to know how these changes are likely to affect the
operating result shown in the profit and loss account.
If you are allowed a range of depreciation methods, you may want to see how each
one affects the net book values. The FI-AA module provides functions for the
following simulation analyses:
• Depreciation for selected individual assets
• Depreciation for selected asset classes
• Depreciation for any time periods
• Depreciation for any combination of existing or temporary parameter
values
NOTE: Different simulation dimensions can be combined.
Previewing the Depreciation of Planned Investments
The depreciation preview facilities of the FI-AA module are fully integrated with
SAP R/3 IM- Investment Management, which is also referred to as TR-IM-
Treasury, Investment Management. The effect of this integration is to enable you
to include in your simulation any of the investment structures, such as the
following:
• Capital investment orders
• Capital investment projects
• Investment programs
The IM- Investment Management module is discussed in Chapter 11.
Simulating Asset Transactions
The SAP R/3 system of master records for assets enables an asset to acquire or
retire other assets during the course of a fiscal year. In fact, you may have defined
an asset as a stock of material that functions as a buffer from which quantities are
drawn and to which deliveries are made throughout the year. Similarly, a building
can acquire additional assets as plant items are installed.
The simulation functions of FI-AA enable you to test out the changes in value of
an asset as it becomes subject to different patterns of purchase or sales decisions.
You can plot the depreciation profile under the various simulation versions you
have defined.
Representing and Displaying Depreciation Values
The life of an asset can be characterized by an extensive sequence of business
transactions and many different calculations of its value from various points of
view. The records of this life comprise many individual values. You will need help
to filter this database and to present the information in a manner that can be easily
understood.
The following online displays of depreciation data are available for single assets or
classes of assets:
• Listing of line items for transactions and depreciation for a particular
depreciation area
• Notification of the changes in a particular depreciation area, such as
book depreciation, over the course of one year
• Display of the changes in a particular depreciation area over several
years
• Comparison over one year of the values computed by up to three
different depreciation areas
• Comparison over several years of the values computed by up to three
different depreciation areas
• Retracing a derived area to the real area on which it is based, such as a
reserve for special depreciation
The display of changes in values usually includes the opening balance and the
changes in the current year. You can alternate between posted depreciation values
and planned depreciation values. The acquisition values and the value adjustments
are shown together with the resulting book values.
If you need to see the background data, you can access the following sources:
• Asset transaction posting records
• Depreciation parameters
• General master data
Displays for comparing values usually offer up to three value areas on different
lines from such options as the following:
• Acquisition costs
• Production costs
• Depreciation
• Net book value
You can display all the records posted to the asset over the current year.
Displaying the Depreciation Calculation Procedure
The SAP technique of drill-down is applied to the depreciation displays to provide
the user with pathways through the calculation that can be traversed in various
ways to arrive at a display made up from any combination of the following data
sets:
• Each depreciation area
• Each depreciation type
• Each asset transaction
You can look at the results of a single asset transaction in terms of any depreciation
area and any depreciation type.
Integrating Asset Transactions
The business transactions associated with assets can be differentiated by one
important characteristic: whether they affect profit. Some transactions affect only
the balance sheet.
In the first class come the transactions that record the acquisition and production
costs of a fixed asset. The other transactions are depreciation value adjustments
that appear only in the balance sheet.
To supplement the asset transactions for acquisition, production, and depreciation,
the FI-AA module recognizes several different transaction types and treats each
transaction differently with respect to any or all of the following data:
• Accounts to be included in the scope of an account assignment
• Depreciation areas to be active
• Value fields to be updated
Using Standard Business Transaction Types in FI-AA
The transaction type groups available for asset accounting are as follows:
• Acquisitions
• Retirements to sales, those to scrap, and those unplanned
• Transfers
• Manual depreciation
• Write-ups
• Transfers of reserves
• Down payments
• Revaluations
Although you can create customized transaction types, the advantage of using one
of the standard types is that the associated transactions are simply processed in a
uniform manner across all applications. For each transaction type group, you can
define validation conditions in addition to the standard checks.
If you post an asset transaction, a posting document is created. The transaction can
be reversed in the FI-AA module or in SAP R/3 FI.
Applying Account Allocation
The General Ledger accounts that are updated when you post an asset transaction
are de-termined by the account allocation you have prescribed for transactions of
this class. The accounts to be used for each depreciation area can be freely
assigned for all types of transaction by means of the account allocation for each
asset class.
If you have an integrated system with FI-Financial Accounting and CO-
Controlling linked to your FI-AA Asset Accounting module, you can extend the
range of account types available for inclusion in the account allocation defined for
an asset class. In particular, you can assign a transaction to the following additional
accounts:
• Internal order or project for in-house production
• Cost center
• Profit center
• Quantities and text
All these additional accounts keep records for purely internal purposes and form no
part of the external accounting system directed toward the balance sheet and the
profit and loss statement.
Using Collective Assets
Assets can be managed using quantities and quantity units. For example, goods of
small value are usually carried and depreciated as collective assets. During
transaction processing, the quantities are updated with the appropriate sign
according to the debits/credits indicator of the asset transaction.
Acquiring Fixed Assets
The Integrated Asset Accounting module supports all types of process sequence
through which assets can be acquired and retired. If the systems are integrated, it is
not necessary to post asset acquisition individually in asset accounting. For
example, the following source modules can automatically provide the
capitalization values of the assets concerned:
• Accounts Payable
• Purchasing
• Inventory and Warehouse Management
• Job Order Settlement
• Plant Maintenance
• Project Settlement
When an asset is retired, Accounts Receivable is posted with the amount realized
as sales revenue and automatically determines the profit or loss generated by the
sale. Accounts Receivable then posts this amount to the profit and loss statement,
with appropriate identification, and also to cost accounting if you have installed
and configured this component.
Understanding Procedures for Acquiring Assets
An incoming supplier invoice for a fixed asset can be sent to a suitable accounts
person, who opens an asset master record with the appropriate account allocation
and valuation parameters. The Accounts Payable department then records the
acquisition and verifies the posting document, created with the input taxes and
discounts entered automatically.
When the acquisition document is posted, the values are recorded in the master
records of the following applications:
• FI-GL
• FI-AP, where an open item is created
• FI-AA, where depreciation is computed and various totals are updated
Purchasing an Asset in Materials Management
The R/3 Purchasing component of the MM-Materials Management application can
be used to purchase an asset. In this case, the asset can be assigned to an asset
master record when the order or purchase requisition is first posted. The details are
then automatically entered into subsequent documents, such as a goods receipt or
an invoice receipt. The actual value of the asset can be posted when the invoice is
received or when the goods are received.
The usual source of materials for in-house production is to use parts from stock.
The asset transactions must be posted in MM by specifying each material number
and the asset number to which it is assigned. The asset history sheet can represent
this as a transfer posting from current assets to fixed assets.
Acquiring Assets Through Capital Investment Projects
The costs of a large capital investment project as an asset produced in-house are
accumulated on an order or a project maintained by R/3 IM-Investment
Management. Some or all of these costs can be capitalized and settled internally on
a corresponding asset under construction, which is a data object maintained in FI-
AA. Therefore, a company can build for itself a fixed asset and thereby increase its
capital.
When the construction of the asset is complete, a final settlement occurs and the
asset is transferred to the Assets in Service account. At the same time, the relevant
cost accounts and the balance sheet accounts in Financial Accounting are updated
to record the capitalization. The new fixed asset is acquired through project
settlement in the IM-Investment Management module.
Acquiring Assets Through Plant Maintenance
A major overhaul and refit of a manufacturing plant can be managed through the
PM-Plant Maintenance application. The expenditure gives the company a much-
improved plant, and the plant, as a fixed asset, acquires additional assets. These
new assets can be capitalized directly from the maintenance order to the
corresponding asset.
Using FI-AA in Isolation
The Asset Accounting functionality can be installed as a separated system that
operates through clearing accounts. The asset acquisition and retirement
transactions can be entered exclusively in FI-AA as a standalone module. The
period closing results then must be posted to the clearing accounts before their
effects can be seen in the General Ledger.
Using Periodic Depreciation Posting
Depreciation must be calculated and posted to the relevant income statement
accounts of finance accounting. This can be accomplished manually or
automatically by means of the system of depreciation keys that affect the periodic
calculations.
An asset transaction in the FI-AA module causes a change in the total forecast
depreciation. This module does not immediately correct the value adjustment
accounts and the depreciation accounts in Financial Accounting. These are not
updated until a transfer is effected by the posting of the scheduled depreciation to
the corresponding accounts in financial accounting. FI-AA and FI-GL are only in
agreement after the FI posting run has been performed. When your system is set
up, you must designate which depreciation areas are to be used to calculate the
depreciation amounts that will be accumulated in the General Ledger. Then for
each of these areas, you must detail the following parameters:
• The additional accounts to which the depreciation must be posted, such
as company code, cost center, or order
• The period rate at which each depreciation area amount must be posted
Using Manual Depreciation Posting
If you must manually enter the asset base amount and instruct the system to
calculate the depreciation automatically, the corresponding General Ledger
accounts will not be posted immediately. The FI-AA module transfers the base
amount and the depreciation to Financial Accounting during periodic depreciation
posting.
Using Write-ups to Cancel Depreciation
If the calculated depreciation in a period exceeds the amount allowable, you may
have to use a write-up of the difference to correct the value of the fixed asset. You
may also need to write up the value of an asset that has been subject to unplanned
depreciation if the reason for this unexpected loss of value no longer exists. For
example, an idle and unwanted plant may have been heavily depreciated and then
be reinstated because of an unexpected demand for its products. It might be
appropriate to write up its value to cancel some of the former depreciation.
You can manually post write-ups in the FI-AA module. This increases the book
value of the corresponding asset and corrects the depreciation values according to
the method of calculation used for them.
Retiring a Fixed Asset
The following standard transaction types can be used to record the retirement of a
fixed asset:
• Retirement by way of sale with proceeds
• Retirement by way of sale without proceeds
• Retirement to scrap
• Retirement to an affiliated organization
• Retirement due to unforeseen events
When an asset is retired, the system operates according to the gross principle and
closes out acquisition and production costs separately from the value adjustments.
Retirement lists of various kinds are used to analyze the asset retirements for a
given period so that a decision can be taken whether to allocate any book profits
arising from the retirements to reserves for the procurement of replacements.
An asset can be retired in part or completely. To post a complete retirement, you
enter the asset number, the retirement date, and the transaction type. The system
calculates automatically all the amounts to be closed out. Partial retirements must
be entered with the following parameters:
• The value of the asset at retirement, in terms of acquisition and
production costs
• The quantity or the percentage of the asset being retired
NOTE: If you specify a quantity of the asset being partially retired, the system calculates the percentage value
from the acquisition and production costs for that quantity.
Retiring an Asset to a Customer
If you sell a fixed asset to a customer, the transaction document can be used to post
the receivable from the customer, the proceeds from the sale, and the notification
of the asset retirement. If you are operating a fully integrated system, the R/3 FI
application ensures the continuity of information across all these postings.
The system also automatically compares the proceeds from the sale with the book
value and so calculates the book profit or the book loss. This entails an income
statement posting. You can have the income debited to a clearing cost center. If the
asset master record was assigned to a cost center, you can have the income debited
directly to this cost center.
Posting Mass Retirements
If your company sells a large and complex fixed asset such as a manufacturing
plant or a building, there may be many subassets to be retired. The FI-AA module
can manage a mass retirement posting.
The assets to be retired must be selected and assigned through a work list
procedure that is processed as a workflow similar to a mass change of master data.
Suitable people are tasked with processing the details of the mass retirements.
The total proceeds from the economic units sold in a mass posting can be divided
and coded so that the amounts can be distributed under your control. Three ways
exist for coding the proceeds from the sale of a fixed asset:
• Proportionally to the book value
• Proportionally to the acquisition and production costs
• To a distribution scheme created when you use a program block in the
ABAP/4 language
Posting Gross Value Transfers
You can use the FI-AA module to transfer values from one asset to another in the
following circumstances:
• Transfers from assets under construction to assets in service
• Transfers between items of the active fixed assets
• Transfers between affiliated organizations
The module always applies the gross method for asset retirements and transfers so
that the acquisition and production costs are processed separately from any value
adjustments such as depreciation and write-ups.
Recording Transfers to Affiliates
When two organizational units in a corporate group effect a transfer of a fixed
asset, the event must be recorded in Asset Accounting as a retirement from one and
an acquisition for the other. From the group’s point of view, however, the
transaction must be represented in Financial Accounting by a balance of zero
because there is no change to the value of the fixed assets held by the group. This
requirement is organized by FI-AA by using separate transaction types that can
represent the event correctly in both the asset history sheet of the individual asset
and the asset history sheet of the corporate group.
When your system is customized, you can set up the following conditions to define
separate affiliate transfer transaction types for each depreciation area you intend to
use:
• The proceeds of the seller will be transferred within the group as a gross
transfer addition valued at historical acquisition costs.
• The transfer will be valued at historical acquisition costs with value
adjustments applied.
The second transaction type takes account of changes in value and is appropriate
for transfers between those departments in your company that are not independent
because their transactions are posted to the same company code.
Managing Assets Under Construction
Many countries stipulate similar functions for both assets in service and assets
under construction (AuC), usually with the following reservations:
• Scheduled depreciation is seldom permitted for assets under
construction.
• Assets under construction must be shown separately in the balance
sheet.
NOTE: Assets under construction can attract special tax depreciation and investment supports.
Because of their similarities, both assets under construction and assets in service
are managed by R/3 FI-AA in the same way, using asset master records and
assigned balance sheet accounts. This ensures that transactions concerning an asset
under construction are automatically posted to the assets under construction
account, even before this asset becomes operational. The same masters collect the
transaction data after startup.
Understanding Capitalization of an Asset Under Construction
The Asset Accounting system provides a special transaction type to control transfer
postings for assets under construction. A summary transfer posting of the value of
the asset under construction is made to one or more master records of the assets
already in service. This type of summary transfer posting continues each year until
the year in which the asset is completed. In the year of completion, the new asset is
balanced by reversals that correspond to the summary transfer postings made to the
other assets already in service.
The asset history sheet of the newly completed asset then shows the value
acquisitions of previous fiscal years as transfers and the acquisitions of the current
year as reversals. The assets already in service have their summary transfer
postings balanced as acquisitions in the year the new asset came into service.
This procedure may not be necessary if an existing asset does not have to take
account of any related assets under construction. Open item management may be
more convenient.
Using Open Item Management
The principal data to be assembled while an asset is under construction can be
extracted from the following sources:
• External activities by contractors
• Internal activities by the company
• Withdrawals from stock
It is customary to account for the materials used to construct an asset as
withdrawals from stock rather than to initiate special purchases of them.
The FI-AA module can manage all aspects of a capital investment measure as open
items in a single asset under construction master. Each line item, such as a down
payment made and acquisitions of subassets, must be cleared. This ensures that the
details are recorded as posting documents where they are available for subsequent
analysis, even after the asset goes into service.
It may be convenient to run a collective management of several economic units
under development by posting the transactions as open items to a single asset under
construction master. When the work is completed, the values of the individual line
items can be allocated to various recipients and then further distributed if it is
necessary to refine the valuation of subassets.
Making Down Payments for Assets Under Construction
A down payment must be initiated by a down payment request that is assigned to
the corresponding asset. The building or assembly of the asset need not be finished.
When the actual down payment is posted, R/3 FI automatically generates the
corresponding line items and posts them to the master of the asset under
construction.
This procedure ensures that the balance sheet items of the fixed assets include
proof of any down payments made. The corresponding final settlement is posted to
the asset under construction as if it were a standard acquisition. The final
settlement amount eventually is offset by the down payments.
A down payment on an asset under construction represents an investment and can
therefore be the recipient of an investment support measure. The down payment
can also be subjected to depreciation calculations, even though it is not usually
permissible to apply scheduled depreciation to a down payment on an asset under
construction.
When an asset under construction is finally capitalized, the financial documents
can show the payment amounts in the current year as acquisitions to the asset.
Down payments from closed fiscal years are represented as transfers because they
will have been capitalized in the year they were made.
Using R/3 FI-AA for Capital Investment Projects and Orders
Large fixed asset investments can be managed as internal orders or as projects. The
R/3 IM application (also known as Treasury-Investment Management) is designed
to support the cost accounting and the project planning and control essential for
large investment programs that run over several years.
However, the functions used by IM are also available to the FI-AA module,
although the continuity does not extend beyond year-end closing unless the IM
application is installed and configured. This application supports the following
business processes:
• Capital spending requests
• Capital investment measures
• Capital investment programs
• Simulation and depreciation forecasting
Chapter 11 develops the topics of investing in financial assets and covers the
strategies for managing their acquisition and disposal.
Using FI-AA with CO-OPA Order and Project Accounting
If you manage fixed assets such as buildings and machines, the settlement of
capital spending orders is of crucial importance. The SAP R/3 system offers
detailed settlement rules and a close integration between the FI-AA Asset
Accounting component and the Controlling application through the OPA-Order
and Project Accounting module. The following arrangements can be utilized:
• Settlement of costs to the appropriate balance sheet accounts under the
heading of Assets Under Construction while the capital spending order is
ongoing
• Order-based display of special depreciations for Assets Under
Construction
• Recognition of subsidies, grants, and down payments
• Settlement of partial orders over a hierarchy of orders
Because all costs are based on unified posting and settlement rules in the SAP R/3
system, you can allocate costs from orders and projects to the various target objects
using either the same rules or rules you have specified separately. You can keep
track of complex overhead costs using maintenance and capital spending orders.
Operating to Planned Cost Schedules
When dealing with costs and deadlines on orders and projects that take a long time
to complete, you have to recognize the financial facts of life. Money is not always
available when you need it. When performing financial and liquidity planning, you
need to know what costs are expected on the orders and projects. It helps to have
some idea of how the costs are likely to be incurred in detail over the first few
accounting periods, and in broader terms up to the date of completion.
A cost schedule is a plan extending the length of an order or project, showing the
values expected to be allocated to costs. The schedule has a key date. Until this
date is known and entered into the plan, the forecast of costs must be moved ahead
to the best estimated date.
The SAP R/3 system provides support in the following ways:
• The system automatically determines the tasks from the planned start
and finish dates for the order.
• Cost distribution across the schedule can be suited to the specific order.
• Graphical representations of the data model are readily available online
and in print.
The following manipulations of the cost schedules and the task plans are
automatically available:
• Shifting the start date, retaining the duration
• Compressing the duration, retaining the finish date
• Expanding the duration
NOTE: If you have carried out cost element planning or created a unit costing for the order, the system can
use this information to develop a cost schedule.
Using Fixed Asset Special Transactions
An asset is subject to the normal business transactions, such as acquisitions,
retirements, and transfers. However, a few events of importance do not lend
themselves to management by these functions. In most cases, a special transaction
has been designed to handle each situation.
Using Investment Support Measures
One of the special transactions applicable to a fixed asset is the investment support
measure. For example, a regional subsidy can be available to pay for a percentage
of the acquisition cost of certain types of assets if the transaction is settled within a
specified period.
The FI-AA module accepts a definition of an investment support measure and
stores it on a master record if the following information is entered:
• Time period over which the investment support will be available
• Percentage of the acquisition and production costs that can be claimed
• Maximum amount available
• Required period of retention of the supported assets before a penalty is
incurred
An asset support measure can also be confined by the awarding authority or by the
receiving company to particular company codes, plants, cost centers, and asset
classes. This information is also stored on the investment support measure master
held by the FI-AA module.
Posting Subsequent Acquisitions
You have the choice of posting a subsequent acquisition to the fixed asset master
itself or of creating a subnumber master record to receive the new acquisition
without losing the connection to the main asset. You can also generate super-
number masters to become virtual parents of a set of main assets.
The subnumber technique is useful because it includes a method that preserves the
details of the acquisition and production costs of a subasset. The year of
acquisition is recorded so that the proportionate value adjustments of the main
asset can be subsequently analyzed throughout its lifecycle.
NOTE: If you have a main asset and a set of subassets, you can effect mass changes by addressing only the
parent. Doing so results in uniform depreciation.
Performing Post-Capitalization Corrections
A special fixed asset transaction is sometimes needed to make up in later years for
acquisitions that were omitted when the accounts were closed. The FI-AA module
applies the gross principle and posts the acquisition and production costs of an
asset omitted from previous fiscal years. This provides for the calculation of any
value adjustments theoretically accrued to the asset in the interim.
Transferring Hidden Reserves
When an asset is sold, it may turn out to be worth more than the value of it
computed by the depreciation procedures. This difference in value can be treated as
a hidden reserve that can now be assigned elsewhere. No asset is acquired, only a
value that must be correctly placed in the financial accounts.
A set of special transaction types is available to transfer the hidden reserves to one
or more of the current year acquisitions. According to the depreciation valuation
method used, one of two procedures is applied:
• The hidden reserves amount is used to reduce the value of the
depreciation base in the book depreciation area.
• The hidden reserves amount is posted to the liabilities side as a reserve
for special depreciation.
Capitalizing Leased Assets
Two methods exist for accounting for leased fixed assets:
• Capitalize the leased asset according to its present value.
• Apply the capital lease method so as to treat the leased asset as a
costing-based acquisition.
A leased fixed asset is subject to a lease agreement from which the system can
calculate the net present value of the payment debits scheduled for the future.
As soon as a leased asset is acquired, the system posts all the anticipated payment
installments, with their due dates, to the account of the vendor from whom the
asset is leased. These payments can be reduced to a net present value, and their
total can be compared to the present value of the leased asset based on acquisition
or production costs. The difference between the present value and the amount that
will actually be paid is shown separately as interest, and this amount is cleared
periodically when depreciation is posted.
Reporting Assets Through the FIS
The Financial Information System (FIS) can display reports selectively on fixed
assets using the asset history sheet format together with standard and customized
reports.
Performing Year-End Closing of Fixed Asset Accounts
At the center of the Asset Accounting system is the asset history sheet report.
Year-end closing includes the task of checking all asset history sheets. It may be
necessary to consider alternative closing valuations that can arise as the result of
using different depreciation methods. You may find that a simulation that
compares these methods is the most useful way of arriving at the best valuation.
At year-end closing, you may have to make some adjustment postings to account
for inventory differences that arise when the planned quantities do not correspond
with the actual quantities of materials as determined by the physical inventory.
When all the necessary manual adjustments have been made in connection with the
fixed assets, any depreciation values that have not already been posted must be
transferred to Financial Accounting so that they can contribute to the balance sheet
and the profit and loss statement.
Finally, a special year-end program is called to carry out all the necessary checks
that answer such questions as the following:
• Does the General Ledger contain all the asset values and the
depreciation?
• Have the procedures for dealing with residual values been carried out?
Until these checks have been carried out and the fixed asset accounts have been
corrected (if necessary), the year-end closing cannot proceed to the last activity,
which is to block the asset account areas of the General Ledger against any further
postings or changes for the current fiscal year.
Two year-end programs exist for FI-AA:
• The fiscal year change program allows postings into a new fiscal year
while the old year remains available for processing.
• The fiscal year change program closes the old fiscal year against changes
to assets.
Manipulating the Asset History Sheet
Each of the companies in your corporate group can operate under a different
accounting regime that obliges them to maintain a particular format for asset year-
end closing reports. The FI-AA module enables you to set up alternative asset
history sheet formats that can be used in parallel to meet the requirements of your
affiliated organizations.
The first step in creating a custom variant of the asset history sheet is to determine
the titles of the cells that eventually receive the data. The next step is to choose
which transaction types contribute to the data in each cell.
Maintaining a Report Selection Tree
A report system can contain many different standard and custom reports. You
would not want to design a report if there was one already available to do what you
require. On the other hand, each user may have a different set of priorities for
accessing data. The database system also has preferences. Some assemblies of data
can take a long time if diverse records must be accessed. A structured reporting
system tries to ensure that subsequent report calls do not cause the system to carry
out the same task needlessly.
A report tree for an individual user is built from a list of evaluations and reports
provided by the INFOSYSTEM of Asset Accounting. This list includes such items
as the following on the first level:
• General reports
• Depreciation lists
• Transaction lists
• Master data directory
• Change lists
• Special reports
• Application log
The second level of the list provided optionally expands the items nominated at the
first level.
The depreciation lists include the following variants as options:
• Depreciation
• Depreciation/interest
• Depreciation comparison
• Depreciation simulation
• Manual depreciation
• Depreciation posted
The reports of the master data directory include the following:
• Asset history
• Property list
• Insurance list
You have the choice of creating a user report tree from a reference file that you
specify or creating a tree on the basis of a standard application report tree, such as
the Asset Accounting tree.
Activating History Management
If you have signified in the fixed asset master record that a particular asset is
currently active, the system generates an asset chart. The content and structure of
this chart can be defined for each asset class.
The function of the asset chart is to report all the information relevant to the history
of an asset over any number of fiscal years.
Manipulating Asset Reports
Your varied assets may well demand varied treatments to give you the information
you require. The FI-AA module enables you to define a report solely in terms of
the records used to compile it. When you display the data, you have control over
how the source data elements are sorted and how the summations are carried out.
You do not have to make any changes to the definition program for the report in
order to carry out the following procedures online:
• You can break out any set of asset records represented as a summation
line on a report by double-clicking on that line.
• You can have the depreciation of an asset computed by any depreciation
area formula analyzed to show how the value of the fixed asset changes
according to the procedure defined for that area.
• You can nominate depreciation areas to generate comparisons of value
changes according to the depreciation area calculation applied.
• You can call for versions of the sorting procedures to be carried out
before the evaluation is computed, and you can instruct the system to
display the summations at each stage of the sort as a hierarchy.
• You can build hierarchies of evaluation for any desired time period.
• You can specify sorts according to depreciation amounts and then
selectively summarize the highest group by defining them by number or by
a percentage.
Generating Alternative Reports Interactively
If you start with a list display of a report and select one line, the system assumes
that you are interested in the detailed records used to compile the values in that
particular line. By clicking on a line of a listing report, you automatically select a
particular set of records. You can then call for a specific type of report and the
system will go ahead and produce it using the assumed set of data.
This is a perfectly standard SAP facility, so you can call for similar interactive
analysis of data in associated applications. For example, if you are running a cost
accounting application in your SAP R/3 system, you can select a cost center and
choose the value assigned to it at year-end closing. This automatically assumes that
your next request for a report will be targeted at the elements used to compile that
cost center valuation. These elements are likely to include the fixed assets and their
depreciation as it has been computed from a cost accounting point of view.
There are many ways of looking at a portfolio of assets. The system is very
flexible, in that you can nominate any field or any combination of the fields in an
asset master record as the basis for a search specification in preparation for a
session of interactive reporting.
Customizing Ad Hoc Reports
The ABAP/4 programming language can integrate any custom report you require
with the rest of your R/3 system. However, the first step should be to check that a
standard SAP R/3 has not already been designed that could have its display edited
to yield what you require. The next option is to use the standard report facilities to
see whether you can design the report you need by using the available facilities.
When you have the report you require, you can save the logical pathway used to
compile it so that a similar report can be generated on other compilations of data.
If what you require is a one-off evaluation of a set of fixed assets, and if you do not
expect the situation to arise again, then you can use a standard R/3 system query
that is often referred to as an ad hoc query. Ad hoc queries are structured to suit the
unique circumstances and are not needed again in precisely that form. Your SAP
R/3 implementation was most likely supplied with some examples of ad hoc
queries that are suitable for your industry and that need very little editing. Asset
evaluations and inventory list reports are often supplied as model examples.
If you must design what you need, the procedure begins by nominating the tables
that define the databases you will access. The system enables you to arrange all the
fields available from these databases as columns for a list-format report. You can
rearrange or omit columns and specify the titles, line length, display column width,
and the output length of the fields.
Developing an International Asset Management Capability
The SAP R/3 system is designed as a potentially worldwide support for a global
organization that carries out business in several industrial sectors and across many
national boundaries. This kind of international business data processing cannot be
achieved by any single software mechanism. At least the following factors must be
accommodated:
• Automatic multilingual operation must be possible.
• Language-independent graphic symbols must accompany translations
into each language.
• The structure of an organization must be represented in such a way that
the accounts can be attributed to the unit responsible by a reliable
structure at various levels (such as group, company, company code, and
business area).
• Currencies must be handled in a flexible manner that can reflect the
differences in the acceptable business practices of the various host nations.
• Data must be available and verifiable to meet the legal accounting
requirements of different nations and their tax laws.
• Consolidation of accounts at all levels of a global enterprise must be a
standard facility.
The FI-AA module is supplied in a form that is neutral with respect to country,
legal requirements, and currency. Default settings are evoked to customize the
module to suit the location of the implementation. Depreciation is customized by
nominating from standard computation procedures and creating new depreciation
logic if circumstances change. Standard charts of depreciation are provided with
the appropriate depreciation keys for the following countries:
• Austria
• France
• Germany
• Great Britain
• Italy
• Japan
• The Netherlands
• Spain
• Switzerland
• The United States
Currency functions are standard throughout the SAP R/3 system and are applied
consistently throughout the separate organizations of a corporate group. In
particular, the Asset Accounting operations adopt the following conventions as
standard:
• Any procedures defined as depreciation areas in the chart of
depreciation can be applied in any currency.
• Asset accounts are maintained in parallel currencies in the General
Ledger and in the depreciation area accounts that support it.
• All standard reports can be compiled in any currency using definable
currency conversion procedures.
Each host nation may be operating under a different business climate. This would
necessitate special functions to meet the local legal requirements and still permit
meaningful legal consolidation at any level within the corporate structure. The
following examples of special functions illustrate the diversity of the facilities
available:
• Named depreciation types for tax purposes, such as ARCS, MACRS, and
ADR in the United States
• Capital lease methods for leased assets, such as those allowed in the
United States and Spain
• Depreciation exact to the day, as in France
• Revaluation for countries with high inflation
• Controls at special periods, such as the mid-quarter convention used in
the United States
• Transfer of reserves, as in Germany
• Special depreciation procedures defined as they come into force
• IFB investment incentives, as in Austria
• Investment support measures, as in Germany
• Investment support grants
Chapter 5
Consolidating Company Accounts
In this chapter Combining Financial Statements
Using the FI-LC Consolidation Module
Interfacing by Design
Preparing for Consolidation
Meeting Annual Reporting Requirements of Complex Companies
Customizing the Consolidation Software
Exploring Consolidation Master Data
Understanding Methods of Consolidation
Preparing Data at the Subsidiary Level
Transferring Data
Changing the Balance Sheet from Local to Consolidated
Consolidating Investments
Using the Consolidation Report Tree
Combining Financial Statements
Legal consolidation is the process of combining the financial statements of two or
more individual companies to produce a consolidated financial statement that
complies with legal requirements. The process can include the following
operations.
• Reclassification
• Reappraisal
• Consolidation
Any or all of these processes can be carried out on any or all of the following data
objects.
• Equity
• Receivables
• Obligations
• Profits
• Sales revenues
The numerical values stored in these data objects encapsulate the monetary values
assigned to the assets and contracts associated with the company at the moment
when the period accounts were closed. What a company is worth is a matter of
opinion, but the legal convention of the host country defines how the business
community computes values to represent this worth. Consolidation must reconcile
potentially different points of view on the value of a company if the balance sheet
of the corporate group is to be created.
There is a tendency to regard the consolidation process as a difficult and time-
consuming process that must be accomplished quickly as soon as the year is closed
and that is best kept in the accounting department. Fully integrated enterprise
systems must have a powerful consolidation system to compete with this
viewpoint.
Consolidation involves more than summing the individual company balance
sheets. This process can express the balance sheet policy of the corporate group in
relation to the balance sheet policies of the individual organizational units.
This chapter sets out the various functions that can be called from the SAP R/3 FI-
LC module, entitled Legal Consolidation (or more often referred to simply as
Consolidation) because it can be used to conduct parallel consolidation operations
that suit the corporate group without necessarily complying with the legal
requirements of any particular nation. For example, this chapter helps answer the
following questions.
• How does SAP R/3 cope with the changing requirements suggested by the
European Union guidelines?
• How can assets be reported when different nations place different values
on them?
• How can a corporate group summarize the business activities of many
affiliates when they each operate under different tax laws?
Using the FI-LC Consolidation Module
The principles behind consolidation are based on the theory that the legal entity of
a corporate group should be portrayed as if it were a single company. This entails
reporting on the assets and the financial and revenue position. It may be necessary
to carry out any or all of the following operations as preparation for rendering the
external accounts of a corporation.
• Elimination of investments
• Elimination of intercompany payables and receivables
• Elimination of intercompany profits and losses
• Elimination of intercompany expenses and revenues
• Elimination of investment income
• Reclassification
This SAP component is also referred to as FI-LC Legal Consolidation. A legal
consolidated financial statement can also be supplemented and used for internal
information purposes.
NOTE: An internal consolidation report does not have to comply with legal requirements.
Consolidated financial statements are often required promptly, yet they usually
must be assembled from incompatible data communication protocols in a software
environment that is, to say the least, heterogeneous. Extra details may be required,
and there will be a need to validate the data.
The purpose of the SAP FI-LC Consolidation module is to optimize and automate
the consolidation process. The module offers the following additional
functionality.
• Integration with the accounting software used by individual companies
• Automatic and reliable transfer of data from the individual financial
statements
• Integration of internal and external group reporting
• Multinational accounting functions
• Standards for processing representations of organizational structures
The method of FI-LC Consolidation is first to prepare the financial data in each
individual company and then to affect computer integration.
Interfacing by Design
The consolidation software has always been designed with the expectation that the
data from the constituent companies will be stored in different accounting systems
that are possibly legacy and third-party implementations. As such, a system of
interfaces has always been necessary. If the affiliated organizations already use
SAP R/3 software or mainframe R/2 software, the consolidation process can be
fully integrated.
In addition to the design of efficient interface systems, the need for speedy
consolidation at year-end closing has resulted in many detailed improvements to
the design of the data objects themselves. For example, the entity type 2001, Chart
of Accounts, is designed to be uniform across all companies so that diverse charts
of accounts can be processed by the same consolidation software.
Changes in the international business environment are increasing the importance of
group accounting and are enlarging its scope. The following factors are salient in
this respect:
• Many companies have been restructured without regard to national
boundaries.
• The rule of instituting a separate company code for each national
business unit in a corporation is no longer applied universally.
• Communities of nations, such as the European Union, may change legal
consolidation norms.
• International companies might have to prepare worldwide financial
statements that include all their affiliated subsidiaries.
• The cost of processing data for consolidation increases if entries must be
standardized across companies, and if the values must be converted to a
common reporting currency.
• The consolidation process may have to eliminate intercompany profit
and loss before rendering external public accounts.
• Asset accounting may have to include an extra depreciation area to
arrive at a standard valuation that can be referenced at the corporate level.
The FI-AA Asset Accounting module, for example, makes provision for the
following computations in preparation for group consolidation.
• Maintaining, parallel to local ledger depreciation, a special depreciation
area according to the rules for the corporate depreciation area
• Maintaining information, such as exchange rate variations, for a central
historical currency conversion, or maintaining a local depreciation area
database in historic group currency
It may also be necessary to maintain information that properly represents the
changing values of fixed assets transferred to other group companies in the fiscal
year and in following years. It is important to know which company owns each
part of an asset during the transition period so that individual accounts can be
closed properly and can contribute to the consolidated financial statements.
The functions of group-wide planning and controlling must meet the traditional
legal and regional requirements. In addition, the system must be capable of
reporting on the basis of products or services. The system must also support a very
wide range of reporting and display demands. The following questions illustrate
the type of questions that can be asked over and above the legal financial
requirements.
• How do the values of particular assets or asset classes change in the
different organizations within the group?
• How does the group distribute the total investment, and how is it
budgeted?
• How are the various asset areas within the group ranked with respect to
the relative cost of maintaining them?
Reviewing the Benefits of Enterprise Consolidation Software
One of the sensitive measures of the quality of consolidation software is the time
saved in closing the books. The SAP R/3 FI-LC module saves time in the
following ways.
• Faster collection of financial data from subsidiary companies
• Minimization of manual entries
• Automatic reconciliation of intercompany transactions (except for
queries)
• Minimal manual entry to consolidate investment transactions
These time-saving advantages are greatly increased by having a database of
financial transactions in the General Ledger that can be copied to the consolidation
database online. You can then view your group data at any time during the period
without waiting for closing.
Using the Trading Partner Concept
A trading partner is defined from the point of view of a consolidated company. In
this sense, a trading partner is a company engaged in a business relationship.
When a posting of an intercompany transaction occurs, the system applies a special
posting procedure that uses a trading partner value taken from the document to
initiate an intercompany reconciliation at the document level. As a result, there is
no need to effect this reconciliation as of the reconciliation closing date.
Preparing for Consolidation
Although a fully integrated financial accounting system can benefit from automatic
functions of various kinds, the principles of consolidation are essentially those
based on manual accounting. Before consolidation, preparation must take place.
You or your system must carry out the following operations.
• Match the individual company chart of accounts to the group chart of
accounts
• Eliminate intercompany Payables and Receivables, and revenue and
expenses that arise because individual companies in a group enjoy a variety
of sender-recipient relationships
• Record the acquisition years of assets for historical currency conversion
• Consolidate investments
Computer integration is relatively straightforward if every individual company has
installed and configured only SAP applications. In this case the companies share a
common environment of standard documents and data objects controlled by SAP
standard business process software.
If one or more individual company has been in the habit of using only paper forms
and ledgers for accounting, there obviously must be a stage of data input to at least
a personal computer with a means to convert the data to a medium suitable for
transfer to the SAP FI-LC Consolidation system. The alternative of last resort is
probably a conventional mailing of the data to the host company’s head office
where a SAP R/3 workstation can be used to re-enter the data.
NOTE: If one or more individual companies uses a software system that can communicate with one of the
interfaces supported by SAP, you can use specific programs to facilitate the transfer of financial data.
Standardizing Entries
If the accounting practices of an individual company do not agree completely with
the format chosen for presenting the consolidated financial statements, it is
possible to account for the differences in amounts by posting a standardizing entry
to a head office account designated for this purpose. These entries are stored in a
separate file.
Eliminating Intercompany Payables and Receivables
FI-Financial Accounting eliminates intercompany balances by open item only if
each trading partner has been marked in the vendor master record. You must also
ensure that the reporting procedures inform the consolidating department of the
numbers of these trading partners, at least on the items that relate to intercompany
Payables and Receivables, revenues and expenses.
The law requires that all intercompany balances be eliminated before presenting
the balance sheet and the profit and loss statement. All possible pairs of individual
companies must be investigated for evidence that they have been trading with each
other.
In practice, significant differences between the way individual companies keep
their records can make complete elimination impractical. The most frequent causes
of discrepancies in elimination are as follows:
• Currency translation differences
• Differences in the timing of entries for goods in transit between
individual companies
• Specific reserves set aside for doubtful accounts
• Liabilities that are not acknowledged in the records
The cause that is most difficult to handle is currency translation; the others can
usually be resolved by thoroughly applying corporate policies.
If the individual companies have installed and configured SAP accounting
applications, automatic dual currency accounting will occur, in which every
transaction is documented in both the local currency and the currency designated
for all transactions in the group. The FI-LC component enables you to trace any
currency translation differences between the local currency at the prevailing rate of
exchange and the transaction currency. A corrected exchange rate can then be
posted in the balance sheet account designated for this purpose and later brought
into the consolidated financial statement.
Problems in currency can also arise when not all companies involved in the
consolidation are part of a SAP system. This is especially true if currency
translation takes place in two company code organizations, where one uses the
reciprocal exchange rate of the other. Intercompany loans, in particular (which can
run into hundreds of millions of units), can result in exchange rate differences in
the hundreds of thousands of units.
Preparing for Consolidation of Investments
When you use FI-LC Consolidation, you can specify which consolidation methods
are to be used for subgroups of individual companies. For example, step
consolidation first consolidates each accounting unit within every subgroup
separately. Subgroups at the same level of the organization are then consolidated
with each other, and so on until the final consolidation yields the financial
information for the group as a whole—the top level.
You can specify what should happen if different methods yield differing results.
Likewise, you can use these methods and options in parallel. The system can carry
out simultaneous consolidation using each of the methods chosen to calculate
equity shares that represent the values of the individual holdings. This is known as
the matrix method.
NOTE: Simultaneous consolidation treats all accounting units as equals under the head office and performs
the whole consolidation in one step.
FI-LC takes account of any minority interests in investments and any hidden
reserves as it performs any of the following procedures. In most instances, these
procedures are performed automatically.
• First consolidation
• Subsequent consolidation
• Step acquisition and indirect changes in ownership
• Increase and decrease in capital
• Write-down of investment
• Complete divestiture or partial disposal
• Transfer of investment to a new owner
The balance sheet and the profit and loss accounts are corrected in parallel by the
system. Goodwill and hidden reserves are amortized. Auxiliary records are
updated. Every elimination entry is explained clearly, concisely, or in detail, at
your command.
NOTE: The system meets the legal requirements for an asset history sheet and the special situation of equity
consolidations.
Using What-if Versions and Forecast Simulations of Consolidation
The system enables you to copy the consolidation data to a new version of the
consolidated financial statement. You can then edit certain control tables for the
new version so that a different method of consolidation is used. For example, you
might want to see what would happen if valuation were done differently, or if
exchange rate differences were handled in another way.
You can also create a simulation of the consolidation process by using forecast
data in place of actual financial statements data. All the same manipulations can be
carried out on plan data just as on actual data.
Meeting Annual Reporting Requirements of Complex Companies
The SAP FI-LC Consolidation component is the application of choice for
analyzing and reporting for large and complex groups. The following types of
reports are usually required, at least annually, but they can be performed on an ad
hoc basis at any time.
• Asset history sheet, reserves, and special items
• Summaries of Payables and Receivables
• Detailed information on selected items
• Group or parent company comparisons
• Sales by region or by product line
SAP standard product FI-LC Consolidation includes predefined report
specifications that serve most of these reporting needs.
Using Special Report Designs
Small-volume reports can be generated to view online, to print, or to store using
the standard display control and item selection functions of the R/3 Basis
component. This flexible type of interactive reporting is a specific SAP technique.
Extensive consolidation reports and audit trails can be sent to a printer or a transfer
medium. For example, preconsolidated financial statement data for a subgroup can
be sent by electronic means or can be transferred to a tape or a disk so it can be
passed to the next level in the group.
TIP: Consolidated financial statement information can be directed to word processing and spreadsheet
facilities, where it can be attached to letters and prepared for presentation.
Reporting Interactively
The process of interactive reporting starts with a display of data that appears on
that screen as part of a warning or an advisory message from some other part of the
system. Such a warning also could appear because you specifically asked for it by
calling for a search based on a range of parameters to narrow the possibilities. You
might ask for items over a certain amount, for instance.
When you see an interesting data object on the screen, you can find out more about
it if you place the cursor on it and use one of the function keys to locate what you
want to know. You might want to perform a what-if analysis using a value or other
parameter in place of the actual value used to compute the item.
The following types of query can be readily initiated.
• Details of specific items, moving to ever-finer detail as you repeat your
query action
• Comparisons
• Investments in companies
• Transaction types
• Standardized and consolidated entries
• Graphical presentations of selected data
If your system is integrated with other SAP application modules, you can gain
access to the data they record. For example, you can inspect account balances and
documents in the SAP FI-Financial Accounting system if your FI-LC
Consolidation component is integrated with it. If your installation uses the SAP FI-
AA Asset Accounting module, you can see and use in reports the information in
the acquisition and retirement records.
Your finished report can be readily drafted to show whatever combination of detail
and summary information best serves your purpose.
Using Ratio Analysis
One of the important benefits of having an up-to-date accounting system with a
flexible reporting facility on a powerful computer is the speed with which complex
business calculations can be provided with the information necessary to ensure that
they are valid. A frequently studied outcome of business calculation is the ratio,
which is a comparison between two numerical values obtained by dividing one by
the other.
A ratio that compares one production period with another can be a useful indicator
to guide internal management. The financial position of the company can be
compared with that of a rival by means of one or more ratios. Ratios between
individual company performance and consolidated financial statement amounts can
be used to explain or amplify the annual report.
The FI-LC facilities enable you to define the same mathematical procedure for all
these ratio calculations, but the actual variables and data depend on the purpose
and the version number of the ratio calculation you specify when you call for the
result.
Suppose you define your ratio calculation in two stages:
• You specify where the information is to come from.
• You specify how the information is to take part in the calculation.
Suppose, for example, that you are interested in calculating the equity ratio, which
you have agreed to define as the ratio of equity to total assets. The information
could be gathered from three sources, but only one will give you exactly what you
want.
• Equity(1) = Paid-in Capital + Reserves + Retained Earnings
• Equity(2) = Paid-in Capital + Required Adjustments + Pension Reserves
• Equity(3) = Total Assets - Total Liabilities
Equity(1) is defined in the language of a business report, and Equity(2) appears by
law on the balance sheet. Equity(3) is expressed in the terms used in cost
accounting. Your definition of the ratio you want corresponds to Equity(3). This is
what the system will use to calculate the ratio for whatever time periods or
organizational units you specify.
If you select an element on your display, the system shows you how it computed
this element; the system displays the individual values that took part in the
calculation on a split screen. You can also call for a 3D display of the information
you have isolated for your calculations.
Using Interim Periodic Financial Statements
Unlike the annual consolidated financial statement, interim periodic financial
statements can be selective in the information they report. You can flag each
individual company to indicate its reporting category, and you can adopt the
suggestions of the system based on the following ratio thresholds.
• Individual company information required will be provided.
• Data will be derived from prior periods (as plan data).
• This company will be omitted from the periodic report.
Consolidation intervals, such as the following, must be defined for each subgroup
of companies.
• Yearly
• Half-yearly
• Quarterly
• Monthly
Different companies tend to post entries to accounts at different times of the
accounting period. The system eliminates intercompany Payables and Receivables,
which balances the unavoidable timing differences.
TIP: Intercompany profits and losses can be eliminated by using information from the previous year’s financial
statements.
NOTE: The system automatically posts depreciation accrued during the periods of the periodic consolidated
financial statement.
Understanding Options for Consolidation
In the format for any account balance (external or internal), some fields can be
used to eliminate intercompany balances. You can extend this format and use it to
eliminate transactions between companies and business areas with sender-recipient
relationships. This feature can also be used for detailed internal group reporting.
Because the SAP system uses central data administration, simple validation
ensures that external and internal reports use the same data.
Performing Positive Auditing with the SAP R/3 Auditor Workstation
The SAP R/3 Auditor Workstation is a module that can operate with individual
companies and on a global enterprise basis. This feature can operate as a stand-
alone module and can interface with the data sources through standard SAP
interfaces. The module operates online with the SAP R/3 system. The auditors
work in the operational system and must be authorized to read the current data set.
This workstation focuses on more positive auditing activities and consulting,
although the standard processes of compiling evaluation documents and reports are
fully supported. The Generally Accepted Accounting Principles (GAAP) remain
the guiding standards, but the workstation is optimized for the benefit of internal
and external auditors, system auditors, and cost accounting personnel. The module
was first developed for the German auditing environment and is being enhanced
with the capability of recognizing other auditing conventions.
The R/3 Audit Information System is also available to the auditor workstation.
This information system can construct an audit report tree from which the user can
call individual reports and evaluation programs that can work with pre-closing
interim lists, such as Assets, Receivables, Balance Confirmation, Balance List,
Domestic Customers, and so on.
Customizing the Consolidation Software
Two standard methods exist for changing the way SAP software operates. Most
variations can be accomplished by altering the parameters of the standard
functions. However, if you have the necessary authorization, you can alter the
sensitive settings of the consolidation software—if you choose to do so, however,
you risk moving your system away from one of the preconfigured legal
consolidation procedures.
The following facilities are offered to assist you in customization.
• You have the option to define new currency translation methods.
• You have the option to define additional methods for the consolidation
of investments.
• You have the option to alter the Financial Statement items catalog in the
FS Items file.
If you exercise any of these options, your activities are recorded in the table
modification audit reports.
The SAP R/3 FI-LC module is provided with preconfigured consolidation plans
and FS Items suggestions that require very little customizing. For example, the
following industries are offered a range of different plans for the FS Items catalog.
• Commercial businesses
• Banks and insurance companies
The module also comes with the following facilities.
• Entry forms in numerous languages
• Currency translation definitions and formulas
• Consolidation method definitions
Any of these items can be edited to suit your company.
The SAP R/3 FI-LC module is an integral part of the FI-Financial Accounting
system, so no separate system need be installed. However, you may want to run
consolidation from a computer separate from your main system for either or both
of the following reasons.
• Year-end closing can be conducted without disrupting the production
system.
• Data is directly posted to consolidation at the transaction document level
rather than being transferred periodically from the operative systems.
The SAP ALE Application Link Enabling system is used to connect the operative
computers and the consolidation computer.
Applying Step Consolidation
If you have a corporate system that comprises two or more independent computers
running your financial accounting, and if your corporate structure is such that each
subgroup of affiliates holds its financial data in a separate computer, several
computers will be used to perform consolidation. In this case, you can apply step
consolidation to each subgroup computer in isolation and later consolidate the
results.
If all your affiliates share the same computer system or network, step consolidation
is performed internally. First, you define subgroups that are subjected to
consolidation from the bottom of the hierarchy upwards. If you then initiate the
consolidation function, the system compresses the completely consolidated
subgroups from the bottom to the top of your consolidation structure. The results
of step consolidation may well differ from those achieved by simultaneous
consolidation because the details of any subgroup can be obscured when the
subgroup is combined with the next layer.
Applying Management Consolidation
The SAP R/3 systems from 1996 have the capability of supporting additional types
of consolidation. For example, the user can define management-consolidation
procedures that assemble data on the basis of any structure using the standard SAP
organization of client and company code, together with any logical combination
using such user-defined transaction data collectors as the following:
• Business area
• Profit center
• Product group
• Any consolidation unit that can be defined from the data stored in the
transaction documents
This extension of the standard consolidation functions that support management
consolidation is provided with an automatic reconciliation function that ensures
that the control accounts of the management consolidation function are always
maintained up to the latest transaction posting. The concept of special ledger
accounting has been extended by providing a set of additional ledgers in a special
format that cannot be modified.
These facilities are installed as the EC-MC Enterprise Controlling - Management
Consolidation package. The management consolidation system uses the same
techniques as the Executive Information System (EIS), to which it can transmit
compressed summary data.
Consolidating with FI-SL Special Ledgers
The Special Ledgers component of the FI system provides a method of defining
data structures according to the special purposes and business needs of the user. A
system of Special Ledger accounts can be defined to accumulate totals and line
items that can be updated from any source. All SAP system business transactions
can contribute, or there could be a selection condition for posting to any Special
Ledger account.
Using Special Ledgers to Extend FI-LC
The FI-LC module has three 10-digit user fields that can be used to receive the
results of consolidation performed by the FI-SL module using additional account
assignment terms stored in the Special Ledger.
Using Special Ledgers Without FI-LC
Your company may not need to consolidate using automated processes. The FI-SL
module is used when the following operations can be performed manually, as
necessary, and the results posted manually.
• Elimination of intercompany Receivables and Payables
• Elimination of intercompany profits and losses
• Investment consolidation
In the FI-SL module, you can perform simple elimination by ignoring totals
records in the reporting module that were added by related companies. No
automatic adjustment postings, no difference postings, and no computations of
proportions take place.
Consolidating with the Executive Information System
Although the Executive Information System (EIS) is essentially a decision support
information provider, it can handle external data input, currency translation, and
financial reporting. The EIS also can manage user-defined data structures. At the
reporting stage, you can manually eliminate intercompany sales by permitting a
user to update transaction data records by editing the displayed values.
Exploring Consolidation Master Data
A financial statement produced by the consolidation procedure refers to reporting
entities using a six-digit alphanumeric key, which is referred to as the company ID.
Each company ID is recorded in a company master record. A reporting company
can be one of the following entities.
• A subsidiary company that is fully consolidated
• A joint venture to be partially consolidated
• An associated company to be treated as an equity holding
• An external company that should not be consolidated
• A business area within a separate legal entity
Master records can be maintained in the system for companies that are not included
in the external consolidated financial statements. You may want to add to such
records the reason why the company is not included in the external consolidation.
This function is used for internal accounting and auditing.
Using the Business Area Concept
A business area is an organizational unit used in financial accounting, although it
does not necessarily form part of the legal financial statements. A business area
represents an internal accounting or reporting object that is legally non-
independent, even though it has a balance sheet and a profit and loss statement as if
it were an independent organizational unit. A business area is a subdivision of a
client, but it may not extend across more than one client.
One advantage of compiling transaction data for a business area is that this data
can be used to depict areas of activity that are not reported through the company
code system. Some national systems may require that data be collected on specific
business areas that are then consolidated across regions or industry structures.
In the SAP scheme, business areas are set out by assigning predefined categories.
The following categories of entities can be receivers for subsequent postings of
transaction data.
• Plant
• Division
• Cost center
• Order
• Sales area
• Event defined by a manual entry
These business areas can each generate a reconciled balance sheet. They can also
be used in conjunction with the company code to define a business area in addition
to a company code consolidation unit.
If you want to compile financial statements for similar business areas in different
company codes, you can define a subgroup so that it includes precisely the
organizational units you require. For reporting purposes, a subgroup is a set of
companies defined on any convenient basis. The consolidation system processes
the data as if the subgroup defines a legal company.
Defining the Items in a Financial Statement
If you have different charts of accounts in use within your corporate group, you
must assign all the accounts to a single catalog, called The Consolidation Financial
Statement Items catalog, or the FS Items catalog.
Each item in the individual financial statements must be assigned to only one item
in the unified FS Items catalog. The assignment of individual accounts to FS Items
is made in the General Ledger account master records in the FI-Financial
Accounting module. When consolidation takes place, the items are condensed to
the values of the line items when the balances are transferred.
Information about a line item is conveyed by a system of additional account
assignments that can be displayed in the line. Four categories of additional
assignments have been defined, and you can add three more to your own
specification. The predefined additional account assignment categories used for
information are as follows:
• Transaction types
• Partner companies
• Currencies
• Acquisition years
The predefined transaction types are as follows:
• Fixed assets
• Special items with reserve
• Provisions
• Appropriations, Equity
The predefined partner company FS Items are as follows:
• Loans to members of the consolidation group
• Payables/Receivables to/from members of the consolidation group
• Investments or shares in members of the consolidation group
• Expenses or income with members of the consolidation group
The predefined currency FS Items are as follows:
• Payables/Receivables to/from members of the consolidation group
• Loans to members of the consolidation group
The predefined acquisition years category includes fixed asset items with historical
currency conversions.
Each account assignment combination that receives a line item value is stored as a
single record. Data can be added directly at this level as further values that have
been assigned to the combination are posted. Data can also be added at a global
level and can be broken down into more detail later by signifying the appropriate
assignment combinations.
Using Statistical Line Items
The items in a unified FS Items catalog are numbered, and this number is used as
an ID code for all reported or derived numerical information. This data is regarded
as statistical, in that it does not directly represent original transaction values.
Statistical lines are used in the following circumstances.
• Balance sheet and profit and loss statement items
• Quantitative statistical information, such as sales quantities
• Nominal statistical information, such as the number of employees
• Definitions of how ratios are to be computed
Extensive reporting facilities are available so that you can selectively access all
types of consolidation line items.
Understanding Methods of Consolidation
The purpose of consolidating the financial statements of the members of a
corporate entity is to render a set of external accounts as if the group was a single
company. Because groups can differ widely in their internal structures, several
methods exist for organizing the consolidation process and the data preparation
that it entails.
Defining Types of Companies
A company can be defined in any way you choose for internal accounting or
management purposes. But for the legal rendering of the external accounts, strict
definitions govern what may be defined in the consolidated financial statements as
autonomous entities.
A subsidiary company must be fully consolidated because the direct parent
company can exert a controlling influence. This is because the parent company
shares the same management or because it has an equity holding of more than
50%.
A joint venture company must be consolidated proportionally to the share of the
investment. The investment shares of the independent direct parent companies in a
joint venture are usually the same, such as 50% or 33.3%, and so on, according to
the number of investing parent companies.
An associated company is a company in which you have an equity holding.
An affiliated company is a consolidated company in which you have an equity
holding of between 20% and 50% so that you can be said to exert considerable
influence.
Performing the First Consolidation
When a subsidiary, a joint venture, or an associated company is represented in the
consolidated financial statements of a corporate group for the first time, the process
is the same for all consolidation methods. The investment book values of the direct
parent companies of the new acquisitions are compared with the equity of each
investee. If any differences exist, they are allocated to goodwill or to fair value
adjustments. The minority interest values are also calculated at this first
consolidation.
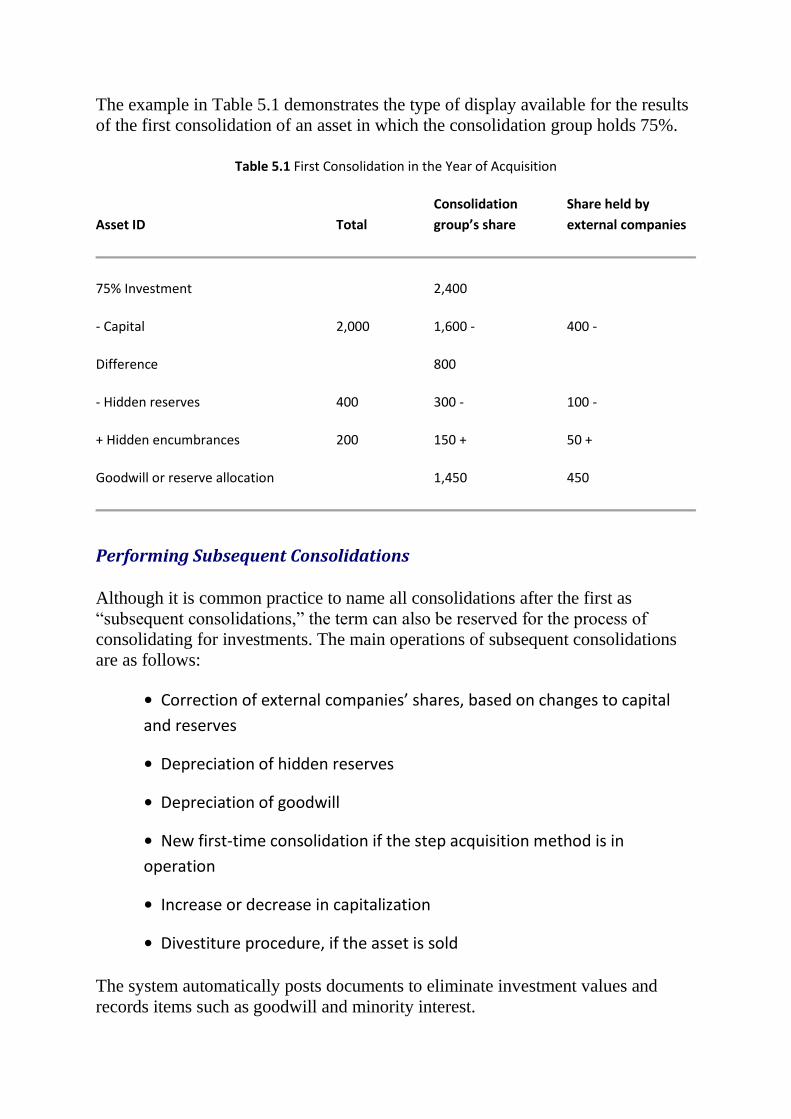
The example in Table 5.1 demonstrates the type of display available for the results
of the first consolidation of an asset in which the consolidation group holds 75%.
Table 5.1 First Consolidation in the Year of Acquisition
Asset ID Total
Consolidation
group’s share
Share held by
external companies
75% Investment 2,400
- Capital 2,000 1,600 - 400 -
Difference 800
- Hidden reserves 400 300 - 100 -
+ Hidden encumbrances 200 150 + 50 +
Goodwill or reserve allocation 1,450 450
Performing Subsequent Consolidations
Although it is common practice to name all consolidations after the first as
“subsequent consolidations,” the term can also be reserved for the process of
consolidating for investments. The main operations of subsequent consolidations
are as follows:
• Correction of external companies’ shares, based on changes to capital
and reserves
• Depreciation of hidden reserves
• Depreciation of goodwill
• New first-time consolidation if the step acquisition method is in
operation
• Increase or decrease in capitalization
• Divestiture procedure, if the asset is sold
The system automatically posts documents to eliminate investment values and
records items such as goodwill and minority interest.
Using Step Consolidation
Step consolidation is applicable to a hierarchy of companies in a multitiered
corporate group. The lowest-level companies are consolidated first, then these
accounts are consolidated at the next level, and so on.
Extra preparation for consolidation may be required if any lower level company is
not fully integrated with your SAP R/3 system. This may be the situation with a
company that has recently been incorporated into the group.
Using Simultaneous Consolidation
Simultaneous consolidation is a procedure that takes into account in a single step
all the existing investments of an investee within a subgroup and the resulting
minority interests. One characteristic feature of simultaneous consolidation is the
opportunity it affords for calculating the difference that arises from the
consolidation of investments between the following entities.
• The corporate group investments for the direct parent company
• The investee’s equity weighted by the group share
The simultaneous consolidation procedure is useful when the investment structure
is not in the form of a hierarchy because it can report an exact analysis of the share
attributable to each individual company.
Using Proportional Consolidation
Proportional consolidation is a method used for consolidating investments in joint
venture companies. The financial statement data from the individual joint venture
companies is incorporated in your consolidated financial statements only in
proportion to your share of investment in the joint venture.
Using the Equity Method of Consolidation
If an associated company (or a subsidiary or joint venture company) is not fully
consolidated, or if it is only proportionally consolidated, the equity method of
consolidation is applied. The individual financial statement data for a company
included “at equity” does not have to be entered into the SAP R/3 FI-LC system
because only changes in equity are reported for consolidation. The method adjusts
the shareholding reported in the consolidated balance sheet.
Using the Purchase Method of Consolidation
When the parent company within a subgroup exercises a controlling influence over
a consolidated subsidiary company, the purchase method of consolidation is used.
It is assumed that a controlling degree of influence can be exerted over a subsidiary
if the management is identical, or if the investment by the parent in the subsidiary
is more than 50%.
Using the Revaluation Method of Consolidation
The revaluation method has features of both the purchase method of consolidation
and the proportional method. This method is used when minority interests have a
share of silent reserves as well as the corporate group. Both types of shares are all
dissolved during the first consolidation. This effectively revalues for first
consolidation purposes all the assets and liabilities of the investee company.
NOTE: The book value method of consolidation is an alternative to the revaluation method of consolidation.
Using Consolidation Reporting Subgroups
Any two or more companies, selected in any way you choose, can be associated as
a subgroup for reporting purposes, although you cannot change the structure of
subgroups after the first consolidation takes place. A company can be assigned to
more than one subgroup.
A subgroup usually is not defined in a hierarchical corporate group, unless for
internal reporting requirements.
Preparing Data at the Subsidiary Level
Preparing data for consolidation at the subsidiary level entails applying the same
logic as corporate consolidation. Inventory valuation must take place for the
balance sheet and consolidation closing dates. The perspective of this valuation can
be local, commercial, tax law, or corporate group. The methods can vary for each
viewpoint.
Furthermore, the valuations most useful for the periodic financial statements need
not be the same as those required for external accounting. The software programs
can be passed using different parameters.
The results of valuations are based on individual subledger values and are posted
as totals figures in a separate account. You can therefore maintain these accounts
in parallel in local currency and the corporate reporting currency.
A financial statement can be prepared in various versions generated according to
how you assign the various balance sheet and profit and loss accounts. The
consolidation display identifies the separate versions and shows the total of the
differences between local and corporate group valuations as a corporate valuation
adjustment posting.
Eliminating Intercompany Posting Transactions
If individual financial statements are to be successfully used to produce a
consolidated group balance sheet and a profit and loss statement, then the
intercompany posting transactions must be clearly identified. The sender-receiver
relationship must be clear. You could achieve this clarity by maintaining separate
accounts for all possible intercompany transactions. But even for small companies,
this would waste system resources.
The SAP method involves logging the relationship in the transaction document,
where it can be used as a retrieval key to prepare the data for consolidation.
Intercompany postings incorporate the trading partner company ID in all document
lines by copying it from the customer or vendor master record, or by requesting
that the user enter it manually.
With this code in place, you can arrange for automated reconciliation activities at
the level of the individual financial statement. This prepares the data for
eliminating intercompany Payables and Receivables and for revenue against
expense elimination.
Using Valuation Areas for Consolidating Fixed Assets
Various systems of statutory consolidation rules preclude any procedure designed
to apply central or global rules to fixed assets. It is mandated that fixed assets
should be valued according to the single valuation principle, under which each
asset is to be assigned only one value.
The SAP solution maintains parallel valuation areas that each record the results of
a different calculation. Therefore, you can set up a valuation area purely for
internal accounting purposes. That valuation area can be used in consolidation
across any structure of organizational units without corrupting the valuation data
that must be maintained in the local books. This is done using the currency and
legal valuation methods of the region of legal force in which the fixed asset is
located.
Chapter 4, “Accounting for Assets,” includes a discussion of the methods of
maintaining asset histories using the appropriate currencies and exchange rates.
The FI-AA module can provide the following facilities.
• Maintaining separate valuation areas
• Preparing for centralized historical currency translations based on the
year of acquisition
• Maintaining decentralized valuations of corporate group value areas in
the corporate group currency
• Tracing the value changes from the corporate and individual company
viewpoints on a year-by-year basis as assets are transferred to other
members of the corporate group
• Calculating and eliminating intercompany profits and losses as part of
the process of preparing for consolidation
Transferring Data
To be able to produce consolidated financial statements every year, it is necessary
to transfer reported data quickly and without errors. In addition, if your group
operates under active corporate management, there is a requirement that
management consolidation usually must follow a reporting cycle much shorter than
the fiscal year. Demands for different viewpoints and data selections often also are
present, to enable management to focus on opportunities for improvement.
It is not good enough for subsidiary companies to mail their operating results to the
head office once a year. The ideal requirement is perhaps a networked
consolidation using an intermediate storage medium, if necessary, and direct links
from workstations in the smaller affiliates. This can be seen as an internal
consolidation system that does not replace the statutory global consolidation
process but rather provides a more active management-consolidation function. This
function can be run on a satellite system to conserve central resources, with
application link enabling (ALE) posting transaction data automatically (where
justified) because it affords a more timely summary of the true trading position
across the group.
NOTE: The ultimate in integrated global system management is to automatically post the data of each
transaction to the consolidation database.
Using Consolidation Groups
A convenient way to set up the interface between financial accounting and the
consolidation system is to define one or more consolidation groups. When an
affiliated organizational unit sets up the procedures for data integration, various
parameters can be assigned in the “sender” system. For example, the fiscal year
may be the accounting period, but a variant of the fiscal year can be designated for
the purpose of internal accounting. You can decide on a four-week period for
internal consolidation.
The choice of consolidation types usually ranges as follows:
• Company consolidation
• Consolidation of business areas
• Profit center consolidation
The source of data to be used can be direct posting from the transaction, or you can
apply a scheme of data roll-up to assemble batches of data for the consolidation
database. Another possibility is to arrange for the data to be extracted from the FI
Financial Accounting database.
Using a PC to Enter Consolidation Data
A consolidation system running SAP R/3 FI-LC could receive data from a personal
computer. Two SAP applications are available to run in the PC environment—one
is based on DBASE, and the other uses Microsoft Access. In each case, the rules
for data entry and validation checking are defined in the consolidation module and
are downloaded to the PC, where they support the standard functions of entry,
print, check, export, and import. The DBASE and Microsoft Access applications
can be used to define entry formats and reports.
The import functions enable the PC to accept data from subsidiary applications that
may be third-party systems. Export to the consolidation coordinator can take place
only if the data passes the validation checks. The transfer can take place via disks
or directly through remote function call (RFC) operations.
Standard forms are available in all the languages supported by SAP. These forms
have the normal SAP design, in which the presentation of the form and the active
fields are determined by parameters held in tables that the user can edit without
disturbing the underlying software. The user can also add new language sets to be
assigned to the fields when they are displayed for entry or reporting. How a
particular form is used in your company and the language are matters that are
assigned in the company master record.
The following examples of online operations illustrate the versatility of the
consolidation module.
• Calling up the balance sheet and the profit and loss accounts to display
one value per item
• Calling up selected asset items
• Printing out comparable figures from the previous year as a guide for the
person entering the data
Asset items can be selected on the basis of any logical combination of the
following attributes.
• Transaction type
• Trading partner
• Currency
• Year of acquisition
Developing a Validation Rule Language
Any value that is entered into a key field is automatically checked for validity so
that company ID, line item number, and transaction type are not allowed unless
they fall within the permitted ranges. The consolidation module also enables the
user to define the validation procedures to be applied by recognizing a code that
identifies a specific validation version. For example, the critical values that define
the boundaries of an acceptable entry to a data field can be changed from one
accounting period to the next. At the level of consolidation, the data objects of
interest are concerned with the operating results of the individual companies being
consolidated.
A step-wise status management system is available to control the application of the
checks specified in the validation version rule set. If any particular company fails
to satisfy the assigned validation rules, then the status management system holds
up the consolidation until the error is resolved. The following types of logical
checks can be applied under control of the validation rule language and its status
management system.
• Are corresponding line items, such as profits according to the balance
sheet and the profit and loss statement, compatible with the depreciation
values recorded in the asset history sheet and the profit and loss
statement?
• Do the line item totals, such as assets and liabilities, balance?
• What period values have changed more than a certain percentage from
the values of prior periods with which they can reasonably be compared?
• How do line item values compare with specified baseline or target
figures?
If any checking process detects a suspect condition, a warning message can be
issued. If an error is detected, a suitable report is generated. The status
management system is set up so that each level of proving validity produces a
status update only when all errors are removed and all warnings are acknowledged.
Changing the Balance Sheet from Local to Consolidated
Each independent organizational unit at the company code level produces its own
financial documents, the balance sheet, and the profit and loss statement. These
must be approved by local auditors, who ensure that the statutory requirements are
met for the region of legal force in which the company is located.
Exactly how these external accounts are rendered can be subject to group
guidelines, provided they are compatible with the local regulations. For example,
certain assets can be reclassified and assigned value adjustments that place them in
accord with the valuations used in other affiliated companies. In these instances,
some of the preparation for consolidation has been decentralized.
However, cases do arise in which the consolidated corporate accounts must report
additional company-specific corrections to the data reported from the local
accounts. The local accounting function may not be aware of this corporate
requirement, so the adjustment might not have been made under the group
guidelines arrangement.
The following items can appear in consolidated accounts as a result of this type of
adjustment.
• Changes in local valuation of assets
• Adjustment postings to corporate valuation
• Postings to corporate group values as a result of elimination of
intercompany profit and loss accounts
• Postings to corporate group values as a result of subgroup-related
consolidation postings if a multistep preparation for consolidation is being
operated
This type of centrally posted adjustment to the accounts of a specific company are
known as adjustment postings and are identified as such so that they can be
analyzed separately from the reported data.
The sequence of preparation for consolidation can take the following form.
1. GL1, the first General Ledger financial statement produced by an
individual company, is audited locally.
2. Local adjustments, reclassifications, and individual asset revaluations
are posted in accordance with the valuation guidelines of the group.
3. GL2, the second General Ledger financial statement produced by an
individual company, is audited locally.
4. The parent company receives all the individual GL2 financial statements
and collates them.
5. The parent company applies central adjustment postings to effect global
corrections, if necessary.
6. The parent company applies cross-company consolidation postings to
GL3 (the summarized financial statements) to produce the consolidated
financial statements, which are then inspected by auditors.
Using Centralized Adjustment Postings
Adjustment transactions are stored in a separate line item database in the SAP R/3
FI-LC module. A single type of posting is used to enter both company-specific
adjustment postings and multicompany consolidation postings.
A system of document type codes is interpreted to control the assignment of
document numbers automatically and to ensure that various validation checks are
carried out. Balance sheet profit and loss corrections can be posted, and allowances
can be entered for deferred taxes.
You can deduce how the account is to be assigned from the FS Item, as defined in
the catalog of financial statement item types. The trading partner and the type of
transaction can also influence the account assignment.
Standard data entry assistance is provided by the system’s capability of referring to
earlier posted documents. A certain facility can automatically reverse a posting
document, and you can sort transaction documents and display the posting data
from various points of view.
Using Currency Conversion for Consolidation
A variety of technical methods exist for carrying out currency conversion in
preparation for consolidation. The following methods are the most widely used.
• Closing date method
• Modified closing date method
• Temporal method
• FASB 52: U.S. Dollar Perspective
• FASB 52: Foreign Currency Perspective
Groups of FS items in the balance sheet and the profit and loss statement are
converted at one of three exchange rates.
• Current rate at the closing date
• Average rate
• Historical rate
FI-LC Consolidation can translate any line items at any rate and can use any
method for any of the individual companies. This program provides solutions for
several problems.
• Exchange differences can exist between the date of the transaction and
the date of the currency conversion.
• Rounding differences can exist.
• The assets history sheet uses rates current on the reporting date.
• If a transaction difference is posted, the previous translation differences
must be reversed.
• Translation differences can be treated so that they either have no impact
or have a positive impact on profits. This might have to depend on the
currency and the trading partner.
If line items from the balance sheet and the profit and loss statement are not
translated at the same exchange rate, differences can arise between two accounting
periods that will affect the totals when the individual items are summarized.
You can initiate a sensitivity analysis to discern the impact of currency translation
on the overall results. In cases in which a translation difference is detected, you can
display the line item groups that contributed to this difference. You may also want
to discriminate the relative magnitude of such factors as the following:
• Proportion of foreign currency volume compared with total corporate
volume
• Variation of translation differences with changes in key financial
statement amounts, such as balance sheet totals and net income
• Differences arising due to historical, key date, and average exchange rate
calculation methods
• Effects of exchange rate fluctuations during the fiscal year
The SAP R/3 FI-LC module provides a versatile array of functions for carrying out
consolidation over all types of corporate structures and for analyzing the results
and detecting any anomalies present.
Eliminating Intercompany Profit and Loss
The SAP method of reconciling accounts across a corporate group depends on the
use of trading partner ID codes. When these are recognized, they cause automatic
reconciliation at the line item level. When the data is presented for consolidation,
the trading partner ID is used to identify candidate items for the process of
eliminating intercompany Payables and Receivables and for eliminating
intercompany revenue and expense items.
When the system searches for possible intercompany items that could be
eliminated, it takes all constituent companies on a two-by-two basis and seeks
items that fall into the following types of elimination sets.
• Intercompany sales
• Intercompany interest gain or loss
• Intercompany Payables and Receivables
• Intercompany loans
The search for balancing items is not always successful. The following are
common reasons for differences.
• Currency translation differences
• Differences in the timing of postings, such as when goods are in transit
• Incorrect intercompany account assignments
It is customary to define the handling of goods in transit and the intercompany
account assignments in the corporate guidelines. If all members of a corporate
group use the standard SAP practice of reporting their balances in the transaction
currency in addition to the local currency, then the system can display the
differences due to currency translation.
NOTE: One of the most important benefits of using the SAP R/3 FI-LC module is that it can analyze the sources
of elimination differences that arise between any pair of affiliated companies.
The reconciliation and elimination of intercompany Payables and Receivables
between trading partners can often be executed with precision at the balance sheet
item level. However, the profit and loss statement can embrace many revenue and
expense items, which consequently makes it more difficult to reconcile.
The system accepts user-defined sets of accounts that can be allowed to engage in
mutual offsetting. For example, you could perhaps offset the sales revenue and
materials expense accounts with one another. Interest expense and interest revenue
represent another compatible pair.
If you specify that the revenue item for a partner relationship is to be reported by
group, the system attempts to match it by amount with an expense for the partner.
The other option involves instructing the system to report all revenue and expense
items in the partner relationship.
Reclassifying Capitalized Assets
If you use consolidated profit and loss statements in period accounting, sales
revenue must be reclassified as other capitalized internal activities or as changes to
inventory.
The transaction type code on the balance sheet documents identifies the
reclassification, and the system automatically reposts the amounts if the receiving
trading partner has capitalized assets supplied within the company.
Reclassifying Intercompany Profits to Inventory
Intercompany profit and loss elimination can be carried out on the basis of
documents selected as follows:
• Inventory management records classified by product group and
corporate group vendor
• Vendor records classified by product group and corporate group
customer
It is necessary to obtain the book value and possibly the quantity of the inventory
items used to eliminate intercompany profit and loss during consolidation.
Allowance must be made for incidental costs and value adjustments. The vendor
partner can provide detailed information about sales revenues and production costs
or summarize this as an intercompany profit and loss percentage rate.
The retroactive calculation method first eliminates the book values of incidental
costs and value adjustments for the inventory items. Then the system computes the
difference this makes to the production costs for the same items. Alternatively, you
can instruct the system to calculate a global percentage share. The final step is to
deduce the change in intercompany profits from the prior accounting period and
then post this amount to the profit and loss statement.
Accounting for Intercompany Fixed Asset Transfers
The company in the group issuing a fixed asset has records of the associated data,
which includes the following:
• Acquisition costs
• Cumulative depreciation
• Depreciation method used
• Sales revenues
• Asset history sheet showing opening balance, acquisitions, divestitures,
revaluations, and closing balance
The elimination process yields records that detail the following types of
information, as appropriate for each asset transferred.
• Profit eliminated in the transfer year, calculated as acquisition value
minus residual book value
• Details of the elimination of the acquisitions and divestitures from the
asset history sheet
• Depreciation correction for the years before the transfer year
• Details of divestiture to external companies
• Details of resale within the company
The receiving company in the group maintains records containing the following
types of information about each fixed asset transferred.
• Acquisition amount
• Depreciation method to be applied
• Asset history sheet, showing opening balance, acquisitions, divestitures,
revaluations, and closing balance
The transfer of a fixed asset may have to be represented in the consolidated
financial statements by the following actions.
• Eliminating the acquisition and divestiture from the asset history sheet in
the year of transfer
• Making an appropriate adjustment to the profit and loss statement
revenues
• Posting corrections to depreciation and intercompany profits for
consolidations in years before the year of transfer
• Continuing making corrections each year until the asset is fully
depreciated, or until it is sold to a company outside the corporate
consolidation group
The full benefits of the SAP system in relation to the consolidation of fixed assets
are best appreciated by installing and configuring both FI-AA and FI-LC.
Consolidating Investments
The practice of consolidating investments is aimed at offsetting the investments of
a direct parent company against the appropriate assets of the subsidiary. This
ensures that there is no double reporting of the same asset in the consolidated
financial statements. The basic method is to distribute the investment among the
subsidiary, joint venture, and associated companies according to their proportional
equity. The main procedures are step consolidation and simultaneous
consolidation.
The methods for consolidation investments are assigned to individual companies
without regard to any subgroup to which they may have been assigned. A methods
table is compiled to record your decisions on which consolidation methods and
variants are to be applied. Different methods can be used simultaneously.
Using Automatic Investment Consolidation
The FI-LC module processes the following types of investment transactions
automatically.
• First consolidation
• Subsequent consolidation
• Successive acquisition and indirect changes in ownership
• Capital increases and decreases
• Complete divestiture
• Reporting
Using Fair Value Adjustment Postings
A fair value adjustment is a difference between the value of a balance sheet item
on the consolidation date and the value in the investee’s balance sheet. A lower
value appears on the asset side, and a higher value appears on the liability side.
The FI-LC module automatically takes into account any fair value adjustments
made. If an asset is partially owned by a company outside the consolidation group,
this factor is also taken into account. The balance sheet and income statement are
corrected at the same time that any of these factors are taken into consideration.
NOTE: Goodwill and fair value adjustments are amortized by automatic postings and can be analyzed by a
separate calculation.
Defining Goodwill
Goodwill is the difference derived from consolidating investments. It is capitalized
as an intangible asset and is written off over the useful life of this asset, which has
been prescribed by the legal authorities or by the company guidelines.
At the first consolidation, the goodwill value of an investment is computed by
calculating the difference between the following entities.
• The corporate group’s proportional share of the book value of the
investment for the direct parent companies
• The proportional equity of the company to be consolidated
Silent reserves of equity holdings that exert no controlling influence are taken into
account in calculating these proportions.
As an example, goodwill could be calculated as the difference between the value as
a going concern and the breakup value of a purchased company. If additional
benefits accrue, such as knowledge transfers and customer contacts, these would be
valued as goodwill. Another example of goodwill could be the value of a
purchased company that arises by eliminating this particular company as a
competitor.
Badwill arises from the consolidation of investments as an accrued liability. It
appears on the liability side of the balance sheet as a separate item. The badwill
value arises when the acquisition costs for the investment in a company are less
than the proportional present value or book value of the company’s net assets.
Using the Consolidation Report Tree
The reporting tree is a standard SAP facility that displays the reports available as
standards together with any reports you have defined for use in your company.
Any particular types of report needed for the region of legal force in which you
operate can also appear on the reporting tree. You can edit the display of the
reporting tree.
In accordance with normal SAP practice, the consolidation reports are designed to
collate the necessary records and then offer you the opportunity to direct your
inquiry. You can do so by selecting and sorting subsets of the collated records and
by adjusting the manner in which the totals are computed and displayed. By
selecting an item in a report tree, you call up either the report itself or a screen in
which you can select further details to refine the scope of the report. Standard drill-
down facilities are provided so that you can access the records used to compile any
data element that you select from your screen. A drill-down sequence is usually set
up as a standard or customized feature when your system is first installed.
The top level of the consolidation reporting tree offers the following options.
• Master data
• Financial reporting data
• Control parameters
• Journal entries
• Totals report
• Report writer
• EIS drill-down reports
The report writer option points to a user-defined selection of standard and custom
reports. The following list illustrates a typical user’s report tree from the report
writer branch.
• U.S. balance sheet and income statement
• U.S. income statement, level development
• U.S. industry segment information (with sublevel report choices)
• U.S. geographic region information (with sublevel report choices)
• U.S. cash flow statement
• Standard SAP reports (with sublevel report choices)
• Comparison reports
• Changes in value
• Changes in value by document types
• Group asset history sheet
• Receivables and Payables aging report
• Group quarterly income statement
• Income statements by quarters and by divisions
Many of the reports enable you to work interactively by using such options as the
following:
• Branching to other reports
• Displaying break-down values by company or trading partner
• Displaying break-down values by subgroup or business area
• Displaying in the same report the comparable data for several years
• Calling upon predefined variants of the same report and displaying the
results in a single report for comparison
• Calculating the variances between nominated columns of a displayed
report
Two tools are available for designing reports or customizing standard reports.
• The consolidation database report function
• The Report Writer/Report Painter standard SAP tool for designing any
report, and the display screens for presenting the results
Designing Custom Consolidation Reports
All reports must be designed on the basis of the values presented and the format to
be displayed in print or on the screen. The format is defined by specifying three
elements in the form of tables that can be edited by a user with suitable
authorization.
• Page header
• Row construction
• Column layout
The header definition includes the text to be presented as titles and the names used
to label the variables. Row construction specifies which FS item numbers are to be
used. Each row construction specification is annotated to signify whether it is to be
a text row, a value row, or a totals row.
The column layout table is responsible for defining the information that is to
appear in the report. The following parameters are specified in the column layout
table.
• Report version ID
• Range of periods to be considered
• Year
• Level of data
The level of the data is defined according to the particular report and the structure
of the consolidation group, which interact with the methods of consolidation
available. The level of data definition can include such levels as the following:
• Local values
• Corporate values
• Consolidated values
After you designate the data to be subject to valuation and the format of the report,
you can direct the valuation program according to a further series of parameters.
• Whether the report will await a unique call from the user
• Whether the report will be bundled in a sequence of reports called by a
single bundle identifier
• Whether the report will appear in various language versions
• Whether the displayed data will be scaled
Most reports can be directed at any of a variety of output media, such as the
following:
• A menu-based display with programmed function keys
• A Windows display with standard scrolling functions
• A departmental or system printer
• A special purpose display to present a predesigned extract of the report
results
• Output to a word-processor file that can be displayed under control of
the user
• Output to a spreadsheet package
Using Active Excel
The totals held in the consolidation system database can be accessed directly from
Microsoft Excel. If you have installed and configured additional software
components, you can also access master data and transaction data to contribute to
an Excel report. These add-ins also enable you to create a spreadsheet column by
copying the profit and loss statement structure with the correct FS item numbers.
If you opt for the active function, Microsoft Excel can access your R/3 system
using RFC methodology and can retrieve the current values to go into your Excel
report. When consolidation data is changed in R/3, the Excel spreadsheet is
updated automatically.
The Excel spreadsheet report procedure offers additional facilities for calculating,
formatting, and printing group reports. Once the format is specified, fresh data and
subsequent period data can be displayed without additional report design.
The standard snapshot function enables you to capture the data at a particular
instant. Extra flexibility is available by using pivot tables to effectively define
pathways to the data of interest.
One of the advantages of accessing R/3 from Active Excel is that you can work in
spreadsheet format, not only to see the results but also to adjust the tables of the
parameters that control how R/3 retrieves information for the cells of the report.
Using Drill-down and Accessing Other Reports
The standard drill-down function makes use of re-keying rules that refocus a
display, for instance, from the account level to the line item, or from the company
code level to the parent company. These facilities are available in most reports.
An extension of the drill-down procedure is developing what can be called a
report-to-report interface in which it should be possible to call virtually any report
from any application integrated in your system, even if it is across a network. For
example, you could obtain the line item value for a company for all its associated
account balances and their constituent documents by calling upon the relevant
report from FI-Financial Accounting after select the company from a display in
your FI-LC module.
As an illustration, the following sequence could be initiated from the EIS.
1. Consolidated profit and loss statement
2. Individual company profit and loss statement
3. Reconciliation ledger
4. Project list from the R/3 PS Project System
5. Single project
6. Cost elements
7. Line item
This illustrative pathway to the line item of an individual project cost element is
but one of many such pathways available from a report-to-report interface set up in
an R/3 system of integrated applications.
Analyzing with Key Figures
A key figure is as a formula applied to specified variables or base factors. A key
figure can be used in analysis for any of the following purposes.
• To clarify individual company and consolidated financial statements
• To support comparison with competing companies
• To support internal company control
Defined key figures can be displayed in any of three types of presentations.
• Chronological order
• External hierarchical comparison
• Internal hierarchical comparison
If one or more key figures yield markedly different results over time or over one of
the structural divisions, then an explanation could be warranted because there may
be an error, a change of business, or a change of market. Any of these events
detected in time can trigger a useful improvement of profitability.
TIP: When you are looking at a key figure display, you can arrange a split screen to reveal how the base factors
relate to the results.
The following are useful key figures that are available as standard formulas and
that could be presented over a range of fiscal years.
• Sales, and sales per employee
• Equity capital amount, also specified as a percentage of the balance
sheet total
• Balance sheet total
• Employees at year end
• Investment in tangible assets
• Depreciation
• Cashflow amount, also specified as a percentage of sales
• Research and development costs
Trends in key figure results can be displayed in tabular format or as graphical
presentations.
Using Simplified Schemes in Periodic Consolidation
Interim financial statements need not be particularly precise when compared to the
year-end closing. Some consolidation simplifications can help reduce the costs of
processing interim reports.
For example, a more global item line number can be selected for an interim report.
In addition, there may be ways of allowing for unavoidable timing differences
when eliminating intercompany Payables and Receivables. When investments must
be consolidated on an interim basis, the system can post the profit and loss results
from depreciation posting as accruals.
Using Consolidation Simulation
Each specification of a consolidation scheme is treated as a version. If you edit a
version, the system automatically creates a new version number and stores the
version you started with in its original form. With this mechanism, you can set up a
simulation comprising any number of consolidation versions computed in parallel
and from which your displays can select the factors in which you are interested.
For example, you could begin with the actual financial statement of an individual
company and make a copy that would be automatically differentiated as a version

of the actual. In the simulation copy, you can modify any of the consolidation
methods because these are defined in the control tables and do not affect the base
data or the standard software. For a comparative report, you could display the
actual financial statement alongside the version you modified for the purposes of
simulating the effect of a change in one or more parameters.
PART II
Planning and Controlling
6 Controlling by Cost Management
7 Costing on the Basis of Activities
8 Controlling by the PS-Project System
9 Analyzing Profitability
Chapter 6
Controlling by Cost Management
In this chapter
Recognizing the Aims of Controlling
Assigning the Procedures of Cost Accounting
Defining Cost Objects and Cost Centers
Planning and Controlling a Business with R/3
Accounting with Cost Elements
Using Imputed Costs Accruals
Implementing Cost and Profit Controlling
Understanding the Flow of Control Data
Establishing Cost Center Accounting
Using Cost Centers in Planning
Recognizing the Aims of Controlling
The prime aim of controlling is to hit the target. In business, the objective is a
profit target related to the capital and other resources deployed—controlling relates
to how these resources might realize more profit if they were otherwise engaged.
From a business data processing standpoint, the act of controlling is defined as a
set of management accounting tasks performed within a company. These
management accounting operations are supplementary to legal requirements to
produce the balance sheet and the profit and loss statement.
Defining Management Accounting
Management accounting, or controlling, can be defined as a set of phases or
subobjectives with such titles as the following:
• Planning the value movements over a series of accounting periods
• Monitoring the relations between the planned value movements and the
actual values achieved in the respective accounting periods
• Reporting the planned and the actual value movements
• Advising financial management and production management of reported
discrepancies and anomalies in the reported data
• Advising financial management and production management of forecast
discrepancies and anomalies in the anticipated value movements that
might warrant preventive, precautionary, or palliative actions
• Informing all kinds of management of the relationships between planned
and actual data in such a way as to make this information immediately
intelligible and preferably indicative of the options for future activities
The method of controlling involves conceptualizing the company as a set of
functional areas in which cost centers can be present. By definition, a cost center is
an area in which costs are incurred. A cost center can be a unit within a company
distinguished by area of responsibility, location, or accounting method.
Departments such as Procurement, Production, Sales, and Marketing can be treated
as cost centers, or particular items of productive resource can be nominated as the
focal points to which costs are attributed in the cost center procedure.
If you have decided how to structure your company for the purpose of controlling
and have produced a scheme or plan showing the cost centers, your next
conceptual task is to arrive at a method of tracking the expenses and revenues so
that these value changes can be assigned to the cost centers in your plan. A simple
scheme is to send each invoice to one of the departments that holds the necessary
funds. You can then see from the financial accounting records where your costs are
incurred. However, several weaknesses arise in this plan. For instance, not all
departments may have a budget. Furthermore, some departments may carry out a
very wide range of diverse activities, which should really be differentiated by
assigning at least some of them to specific cost centers so that management can
consider the wisdom or profitability of that part of the enterprise.
A different approach involves noting every item of expense and every element of
revenue. If you do this, you can later sort your notes in various ways to build up
costs and revenues according to any particular scheme. As another option, you
could use the SAP R/3 CO-Controlling module to make copies of all your
transaction document details and hold them in a separate database. From this
database, you could call for the values to be totaled in various ways to show how
your costs and revenues have changed in successive periods.
If you wish to be prudent in the matter of spending, you must look to your cash
flows. You can plan expenditures for some time ahead by assigning values to
future accounting periods.
The scope of the controlling activities can and should cover all the various ways in
which a company can increase or decrease its value. In particular, the controlling
disciplines should be applied to the following business areas:
• Funds to manage the procurement, use, and creation of funds in all
functional areas
• Financial and liquidity management, by planning and monitoring
scheduled payments for projects and orders
• Capital investment controlling, to transfer activities to be capitalized so
that depreciation and operating profits can be computed
• Cost and profitability accounting, to monitor the costs of all company
activities
If your company is to be profitable, you must exercise planning and control over
all its activities. In particular, you will want to use the established techniques in the
following functional areas:
• Human resources
• Procurement controlling
• Logistics controlling
• Inventory controlling
• Sales controlling
• Asset controlling
Reviewing the Techniques of Overhead Cost Management
The function of overhead cost management is to plan, allocate, control, and
monitor secondary costs. Several overlapping sets of techniques are available in
the technical literature and are fully supported by SAP R/3 in the form of the
modules comprising the CO-Controlling application. This section introduces the
main techniques and points out some of their similarities and differences.
Using Cost and Revenue Element Accounting
This branch of cost accounting begins by identifying costs and revenues. It delimits
the costing-based outlay costs and the opportunity costs by assigning them to cost
elements (both primary and secondary) recognized by the financial accounting
system as items in the chart of accounts.
Using Cost Center Accounting
A cost center is an area or a virtual section of the enterprise in which costs are
incurred and revenues are earned. The costs are allocated to the departments
responsible for controlling them. Cost origins are identified in the cost centers.
Using Internal Activity Accounting
Secondary costs can be allocated in proportion to the activities produced by the
cost centers. These costs can be distributed on the basis of the activities in which
several cost centers may be involved. See Chapter 7, “Costing on the Basis of
Activities,” for more details.
Using Overhead Cost Orders and Projects
An operational order is created in a cost center for a concrete task or function. This
order must be planned, controlled, and settled in detail. Complex orders are
controlled by the PS-Project system, which is described in Chapter 8, “Controlling
by the PS-Project System.”
Assigning the Procedures of Cost Accounting
The SAP Business Navigator is a component of R/3 that is used to access the R/3
Reference model where all the available software is documented. If you select the
overhead cost accounting area, you can access a matrix display of the standard
processes and techniques available. On this matrix, you can signify which
processes you intend to use to build a customized overhead cost accounting
procedure for each of your cost accounting control areas. This section summarizes
the principle costing tasks represented in the SAP R/3 system.
Completing the Assessment Procedure
The assessment method entails allocating all costs to a cost recipient or product.
The primary costs and overhead costs must be associated with the product or
service that has incurred them. Although the assessment procedure accumulates
separate information on primary and secondary costs, they are combined to
compute full costs. This procedure does not identify fixed and proportional
components. The cost receivers are products or other units, and the secondary costs
are allocated to them under the control of key codes. Planned and actual data can
be compared.
Performing Overhead Surcharge Calculations
The overhead surcharge is similar to the assessment procedure, in that full costing
is applied to the planned and actual values. No splitting of costs into fixed and
proportional components occurs. However, cost center planning will have
determined an hourly rate for each activity in the activity structure, and this rate is
used to calculate the labor costs assigned to particular cost recipients or products.
The remaining secondary costs are distributed as overheads.
Using Static Standard Costing
The cost center structure that is to use static standard costing is first divided into
allocation bases, and activity types are defined so that quantities of activity can be
allocated to them. These allocations of activities form the basis for costing. No
splitting of costs into fixed and proportional components occurs. From the work
plan, the calculated full activity prices are transferred to the activity quantity
structure to compute the cost values.
Product costing on this basis can be used to compute the costs of goods
manufactured and so provide values for the products sold. The value of the
products sold, which is based on full costing, can then be used in cost-of-sales
accounting. From the cost of sales, the profitability analysis for these products or
services can then proceed.
Using Flexible Standard Costing Based on Marginal Costs
Costs are first split into fixed and proportional components based on dividing the
cost center structure into activity types. Activity price calculation using planned
activity prices then occurs to value the activity quantity structure.
The results enable you to improve decision making on marginal costs and help you
determine short-term price floors because you can exercise analytical cost planning
to calculate proportional costs. Cost object controlling yields the cost of goods
manufactured using the full costs basis.
Using Profitability Analysis
Product costing based on the costs of goods manufactured can be used in cost of
sales accounting to value sold products on the basis of full or marginal costing.
Contribution margins can be calculated on the basis of marginal costs in
profitability analysis because you have determined both the fixed and proportional
costs.
Defining Cost Objects and Cost Centers
A cost center is an organizational unit that embraces a unique set of cost origins.
Activity types or primary and secondary cost elements are regarded as cost origins.
A cost center can coincide with an operational department, or it can be defined in
terms of its functional area. Geographical characteristics can be used to specify a
cost center. Yet another way of dividing up your company for the purposes of
controlling is to recognize ownership or the location of responsibility. You can
define some cost centers in terms of how the transactions are to be settled.
The main criterion for judging the quality of a scheme of cost centers is how well
you can use it for the following related tasks:
• To allocate secondary costs to sales activities in a meaningful manner
that calculates the costs of sales
• To control in detail how costs are incurred within the enterprise
Using Cost Objects
The basis of computer support for business controlling is the cost object, which is
an account assignment term that points to a database record structure in which
actual data can be stored. A cost object can hold the details of costs, budgets, sales
revenues, and other data objects that represent value.
The cost object section of the database is identified with a cost object that is
recognized by the employees of your company, such as an individual product or a
product group. The defining feature of a cost object is that you must be able to
identify a quantity of at least one activity that is associated with the object, such as
a manufacturing process or the warehousing of a quantity of material. A cost object
can be inactive in an accounting period because no work is being done there, but it
will still incur costs in terms of maintenance and investment.
You can also associate a cost object with a physical place or a section of a physical
place that is differentiated by its use. In a production plant, you can classify groups
of resources using industry-specific criteria. For instance, you could define some
cost objects in terms of recognized shop floor areas in which certain types of work
is performed. After assigning a shop floor area number, you could then post the
costs incurred there to a cost object data structure associated with this number.
Defining Cost Objects
A cost object is an activity unit represented by a Controlling Object–Costs data
object. The function of a cost object is to collect costs or sales revenues and the
data that identifies their origins. A cost object can be specialized according to the
type of object for which it collects costs or sales revenues, such as a production
order.
A cost object represents a concept that is particularly important when using the
CO-Controlling application. A cost object is the main data object of preliminary
costing, simultaneous costing, and final costing. Other entities from the integrated
logistics modules can also be used as specializations of the Controlling Object–
Costs object. The following entities can function as specialized cost objects:
• Procurement or requisition order
• Material as a finished product
• Production order
• Assembly order
• Run schedule header
• Process order
• Network
• Sales order
• Work breakdown structure element
A cost object can be one of several objects that contribute costs and revenues to a
business area. In addition, a cost object can be one of several objects that post costs
and revenues to a company code.
NOTE: A cost object is always assigned to exactly one cost accounting area in which there is a common
method of cost accounting using the same business year division.
Developing Overhead Cost Management
The function of overhead cost management is to plan, allocate, control, and
monitor secondary costs. The secondary costs are expenses for which one single
receiving data object cannot be directly and fully identified according to the cost-
by-cause principle. Consider these examples:
• Secondary expenses, such as building insurance
• Secondary labor costs, such as supervisor wages
• Secondary materials costs, such as coolant cleaning materials
Secondary costs that cannot be allocated directly and completely to operational
activity units, such as products and services, must be assigned to subareas within a
cost accounting area. A cost center for each subarea must receive the costs or
revenues and then distribute them to the operational activity units, such as
products.
The SAP R/3 approach to controlling is elaborated in the CO application and
therefore is integrated with both the FI-Financial Accounting application and also
with any other application that has been installed and configured. The following
components comprise the SAP CO-Controlling module and constitute an integrated
system for overhead cost controlling:
• CO-CCA Cost Center Accounting
• CO-ABC Activity-Based Cost Accounting
• CO-OPA Order and Project Accounting
• CO-PA Profitability Analysis
• CO-PCA Profit Center Accounting
The FI-SL Special Purpose Ledger module uses accounts that are based on a range
of subledgers that enable overhead cost analyses from different points of view. For
example, accounts can focus on cost centers, product costs, or activities. These
facilities are provided so that the SAP R/3 CO-Controlling application can be used
as an internal accounting system that is fully integrated with financial accounting.
The implementation of a controlling function in an organization is carried out in an
SAP R/3 system in the following phases:
• Defining the structure of the organization in terms of units to be
controlled
• Setting up information flows that can monitor the performance of the
controllable units
• Running the controlling system through cycles of the controlling tasks,
which are repeated at a frequency suited to the type of business process
The R/3 system integrates all these phases by offering standard business programs
that are fully integrated with each other. If you install the system in your company,
the SAP Customizing procedures prompt you to select the functions that match
your requirements. You are also invited to provide such details as the specific
terms and names of work units so that the system is an accurate representation of
your company.
Placing Cost Centers in a Structure
The structure of a business organization can be seen from different points of view.
One company might see itself as a group of complete and self-sufficient units
reporting to a head office; another might think of the main functional areas, such as
Procurement, Production, Sales, and Marketing.
To make use of a fully integrated system and exploit the value-adding functions
available in a modern, computer-based installation, it is necessary to define an
organization in terms of a detailed structure of cost centers with specified
relationships between them.
The SAP R/3 system with the CO-Controlling component gives you the
functionality you need to capture the structure of your company in the form of a
comprehensive cost center plan that clearly defines the responsibility structure of
your company. When you have such a structure, the system uses it to run all the
controlling functions.
This structure must be rich enough in features to capture any type of organization
and express it in a form that can be used by the computer system to carry out
automatically as many of the necessary operations as possible. When automatic
operation is not possible or required, the system should be capable of providing as
much support and guidance as possible, and should make the work as efficient and
effective as circumstances allow.
Adapting the R/3 Organizational Structure
The structure of an organization from an accounting point of view must be
formally defined if it is to be used by a computing system. SAP R/3 defines a
multilevel structure in terms of nested classifications, known collectively as the
Enterprise Data Model (EDM). The EDM model is outlined as follows:
• Client is a name attached to a data set that cannot overlap any other
client data set. For example, TEST and TRAINING could be clients with
separate data sets. Standard SAP R/3 works with only one client at a time.
• Company code is the identification number of an independent
accounting unit that can generate its own financial statements. It is a legal
requirement that a group operating in several countries must establish a
separate company code unit for each country. The system must record all
the transaction data necessary to compile the balance sheet and the profit
and loss statement for a company code. A company can comprise one or
more company codes.
• Business area is a subdivision of a client that further classifies the value
movements posted to the General Ledger of a parent company code. The
business area is not an independent business unit, although it manages the
transaction information and the financial results shown in the company
code balance sheet and the profit and loss statement, insofar as they
concern that particular business area.
• Controlling area takes into cost accounting both the accounting units,
such as company codes and business areas, and the logistics units, such as
plant and sales organization. A controlling area can embrace several
company codes, provided that they all share a common chart of accounts.
All internal allocation transactions must refer only to objects within the
same controlling area.
• Cost element is an item in a chart of accounts used in a controlling area
to record the value assigned to the consumption of production factors. This
is a classification of costs for internal and external reporting purposes.
• Revenue element is an item in a chart of accounts used in a controlling
area to record the value assigned to the volume of operational activities.
• Activity type is a classification of the activities that can be produced in a
cost center. An activity type can have a level. Values are assigned to activity
prices from a business point of view to be used in allocations.
• Investment centers are represented as profit centers carrying an
indicator that controls which different items of fixed assets or current
assets can be allocated to the investment center.
• Operating concern is a unit used in CO-PA Profitability Analysis to focus
on the market and sales of a business to set off costs against revenue. An
operating concern can embrace several controlling areas, provided that
they all use the same chart of accounts. The operating concern can also be
selective in its zone of interest by defining specific segments of the market,
for example, in terms of a product range for a certain customer group in a
sales area.
• Functional area is used in cost-of-sales accounting to classify operating
costs according to functions such as management, sales, marketing,
production, research, and development.
• Profit center is an internal control subsection of the business that is
assigned responsibility for its own profit or loss. A profit center must be
assigned to only one controlling area. Revenues calculated according to
cost-of-sales accounting or period accounting are assigned to the
responsible profit center.
The software of the SAP R/3 system is designed so that you can use the standard
functions on the data objects as defined in the system. This initial structure is
defined as the R/3 Reference Model. Any of the structures in this model can be
replicated and linked to completely match the structure of your company. None of
these copying and linking activities disturb the underlying software, so the
enterprise data model that you construct works perfectly when you use it in
production. This model also works perfectly if you populate the enterprise data
model with planned data as part of your controlling endeavors.
Planning and Controlling a Business with R/3
In accordance with the basic divide-and-measure approach to business control, it is
useful to differentiate the operational controlling systems from the functional
controlling systems. The operational controlling systems are provided with SAP
R/3 components to support the following four operational tasks:
• Capital investment controlling, which transfers activities to be capitalized
and used to calculate depreciation and operating profits
• Financial controlling, which monitors and plans scheduled payments
from projects and orders
• Funds controlling, which oversees the procurement, use, and creation of
funds in all areas
• Cost and profit controlling, which monitors the costs of all company
activities
Controlling with Job Orders
Each SAP R/3 application can process various types of orders that represent simple
jobs within a controlling area. An order can be used for planning, monitoring, and
allocating costs. The following types of orders are distinguished by their business
significance in the SAP R/3 application indicated:
• Imputed cost (CO-Controlling)
• Overhead cost order (CO-Controlling)
• Capital investment order (CO-Controlling)
• Orders with revenue (CO-Controlling)
• Maintenance order (PM-Plant Maintenance)
• Production order (PP-Production Planning)
• Assembly order (PP-Production Planning)
• Run schedule header (PP-Production Planning)
• Process order (PP-Production Planning)
Job orders tend to focus particularly on the activities needed to achieve a business
result.
Using Projects as Control Structures
A project is a data structure used to represent a complex structured job taking place
within a controlling area. The project is used to plan, control, and monitor the
schedule, resources, capacities, costs, revenues, and availability of funds. A project
cannot be assigned to a General Ledger account or to a special purpose ledger
account.
A work breakdown structure (WBS) element is a concrete task or subtask that can
be further subdivided. A WBS element can be costed and assigned to an account.
For more information about projects, see Chapter 8, “Controlling by the PS-Project
System.”
Accounting with Cost Elements
The SAP R/3 standard business functions provide all the functionality needed to
support most modern cost accounting systems.
The main differences between costing concepts arise in connection with the scope
of the costs they include and the structure of these costs with respect to the
organization structure. Variations in the use of standard versus actual costs exist,
and other variations affect the allocation of costs directly to the products or
services, in contrast to allocating them to overhead. Methods can also differ in the
relationships between cost center activities, such as in the use of primary costs,
cost components, and secondary cost breakdown.
Operating Cost Element Accounting
Cost element accounting demands organized recording so that the costs incurred
during a particular settlement period are accurately recorded and sorted. When you
operate the SAP R/3 integrated system, each business event relevant to cost
accounting generates a document that bears information about the cost element and
the account assignment of its posting.
Cost element accounting is a standard approach that is integral to the R/3 system.
Functions are predefined to create and maintain cost element master data and to
calculate imputed cost elements. The R/3 system can mediate the importing and
incorporation of posting data from external systems. Full reporting occurs on cost
elements. Individual business transactions are structured, recorded, assigned, and
reported using the FI-GL General Ledger profit and loss account structure.
Defining the Cost and Revenue Element
There is a legal requirement to distinguish between costs that arise in a company
code, as follows:
• Primary cost and revenue elements for goods and services procured
externally
• Secondary cost elements attributable to internal activities
A cost element is a classification code. This is a mandatory data field on
transactions that involve costs arising in a company code. A cost element is used to
label and differentiate the types of cost, which affects how each is posted.
Primary cost elements are maintained in the General Ledger master records.
Secondary cost elements have no counterpart in the financial accounts and are
maintained exclusively in cost accounting.
It has always been the case that the proportion of secondary to total costs is high in
a service industry compared to manufacturing. However, this proportion is
increasing rapidly as, for example, automation takes a larger share of secondary
costs in relation to the production costs that can be allocated directly to materials
and procured services.
Cost elements are formally classified according to their use or origin, such as
material cost elements, settlement cost elements for orders, and cost elements for
internal cost allocations. A primary cost element is an item in the chart of accounts
in which the values are recorded to represent the consumption of production
factors such as raw materials and energy.
A cost element is also used to maintain a collection of information, in particular,
the transaction documents that bear the code of the cost element and that have been
selected, for example, for a specific accounting period. The cost element concept
ensures that each business transaction posted under a particular cost element in the
CO-Controlling system is properly assigned to the relevant cost centers, orders,
projects, cost objects, and so on.
Each material issue in MM-Materials Management, each invoice recorded in SD-
Sales and Distribution, and each external invoice in MM-IV Invoice Verification
flows via the FI-GL General Ledger account to the appropriate cost or profit
object. The expense accounts of the FI-GL General Ledger chart of accounts are
automatically adopted by the CO-Controlling system as primary cost elements.
Additional primary cost elements must be added to the financial chart of accounts
to accommodate accruals and imputed costs. The aim is to ensure that all the costs
incurred in a particular accounting period and documented in the CO-Controlling
system are properly reconciled with the General Ledger. It is also possible to
establish a default coding block (cost center) for a particular cost element.
Secondary cost elements are created and managed only in CO-Controlling. They
represent value flows such as the following:
• Internal cost allocation
• Surcharge allocation
• Settlement transactions
Using Cost Element Parameters
The CO-Controlling system carries an extensive set of standard cost elements that
you can adopt and edit for your own installation. A matchcode search facility helps
locate the one you want on the basis of a specific name or label that you have
assigned. The matchcode search can also include values such as order number
ranges and dates to narrow the field of your search. You can strike out those you
are unlikely to need.
The standard cost elements begin with certain established parameters, such as the
following:
• Default coding block assignment
• Whether quantities are recorded in addition to values
• How costs are displayed in reports
NOTE: The system logs any changes you make to the cost element masters.
Classifying Cost Elements
The following cost element types are recognized by the SAP R/3 system because
their documents bear a key code:
• Primary cost elements
• Imputed cost elements
• Revenue elements
• Sales deductions
• Cost elements for external order settlement
• Cost elements for internal order settlement
• Assessment cost elements
• Cost elements for internal activity allocation
Reporting on Cost Element Group Structures
A cost element group is a technical term for a set of cost elements, such as salaries
and bonuses. The cost element group can be used to define lines and columns in
reports that use the appropriate records. The cost element groups can be used for
planning purposes. No constraints govern how you combine and structure cost
elements in a cost element group. You can display a cost element group in the form
of a tree diagram. The hierarchies and subhierarchies of a cost element group can
be deployed without constraint. You can use cost element groups to arrange the
structure, or you can use cost objects (such as personnel costs) or function-oriented
criteria (such as purchasing and sales).
One task of planning for secondary costs is to define standards that help control
these costs and assign reasonable values to the internal activity costs. Secondary
costs are charged to the cost centers where they were incurred, or to the jobs that
led to their occurrence. Secondary costs therefore can be charged according to their
origin defined by the location where the work takes place or the activities are
involved.
Planning occurs using target costs that can adjust the plan account for operating
rate changes. At the end of the accounting period, the target and the actual costs
can be compared, and the results can be used to modify appropriate controls.
Checking Posting Data in Cost Accounting
Each posting from cost accounting to an account assignment object is controlled by
a reference check that first confirms that the cost object exists and then locks the
entry. Validation is the process of applying individual checks in addition to the
reference check. The user can define logical rules and conditions that can refer to
any data held by R/3 at the time. You can specify whether a query should lead to a
warning or an error message.
When the posting occurs, the system checks to see whether the account assigned
for the relevant cost center is also allocated to a profit center. In such a case, an
automatic extra posting occurs. This is a so-called statistical posting that does not
cause a false value movement by posting the same amount twice. Substitution is
the name given to the process of changing posting data characteristics. As with
validation, this automatic process depends on the outcome of a logical conditional
checking procedure that can be set up by the user.

Posting to an Auxiliary or Statistical Cost Accounting Assignment
The CO module receives the primary data as a General Ledger posting from
financial accounting. However, the account assignment term in this posting
document can be expanded by adding assignments to various auxiliary or statistical
cost accounting objects. For example, you might have a statistical order to
accumulate cost data about a specific job.
The system always makes sure that only one cost accounting object acts as the cost
object and is posted with costs. All the others are treated to a statistical posting that
is identified as such so that it is used only for statistical purposes, never for totaling
costs.
Using Imputed Costs Accruals
Some data posted to cost accounting is necessarily the same as in financial
accounting. However, some costs are incurred without a corresponding expense
posting in financial accounting. Furthermore, some business expenses are posted
differently in financial accounting and cost accounting because a different quantity
unit or different valuation rates are used. The accounting period most useful when
controlling a business is seldom the same period used for financial accounting.
These kinds of discrepancies must be reposted in financial accounting as imputed
costs so that the true value of the resources consumed in production in the period
can be totaled. To effect this reconciliation, it is necessary to use accruals that
assign imputed costs to the financial accounting periods under an account heading
that indicates their cause.
Two sources of data exist for calculating imputed costs:
• Imputed costs are computed in financial accounting, are posted as a
recurring entry in financial accounting, and are passed to cost accounting.
• Imputed costs are computed in cost accounting by using the costs
already posted there.
Three methods of calculating imputed costs exist in cost accounting:
• Cost element percentage surcharge
• Planned = actual allocation
• Target = actual allocation
Imputing Costs as a Percentage Surcharge
If you know the cost elements, you can build up a database from which to calculate
the imputed costs for each financial period by allocating a percentage surcharge to
each period. You can do this for both planned data and actual costs, by period and
by cause. For example, you might accrue a Christmas bonus as if it were a monthly
cost throughout the year by posting it to a cost element in the General Ledger titled
Imputed Christmas Bonus.
TIP: Any number of cost elements can be linked by a tracing factor, from which a value is calculated by
applying an overhead percentage rate.
Imputing Costs by the Planned = Actual Procedure
If no relevant historical values or quantities are available to enter into your base
cost elements, you can make a plan or estimate of them across the relevant time
periods and by cause. Then you can instruct the system to post the planned values
as imputed costs and later, if necessary, post an adjustment when the actual cost
data becomes available. You might accrue insurance charges by assuming that the
actual costs will equal the planned and distributed-as-planned across the periods.
Imputing Costs by the Target = Actual Procedure
If you expect your costs to be directly related to the operating output, you can use
the techniques of activity-based cost accounting to arrive at target values. The
more activity that takes place, the greater the imputed cost.
The system posts the target activity costs as imputed costs to the relevant financial
accounting periods and causes as represented by the cost objects. Again, you must
instruct the system to make an adjustment posting when the actual values can be
obtained.
The Role of Imputed Cost Calculation Objects
An imputed cost calculation object is one of a number of results analysis objects
used to reconcile balances between financial accounting and other applications.
Financial accounting must remain reconciled with cost accounting. This means that
no balance should emerge as a cost that is not identified in financial accounting.
To achieve this, an imputed cost calculation object is created that is credited every
time a cost center is debited for an imputed cost calculation. When the expense is
actually posted, the appropriate imputed cost calculation object is debited by a
corresponding amount. At the end of the year, the user must transfer any remaining
balance to profitability analysis or reallocate it by distributing it to cost centers or
by reposting it to some other account.
Allowing for Price Variances
The CO-Controlling system can calculate the influence of price fluctuations for
each posting transaction. The difference is displayed as a variance in the SAP
document that records the transaction.
The SAP MM-Materials Management application can provide the difference
between the standard price of a material and the moving average price. These price
variances can affect the difference between target and actual values, for example.
Differences can be computed between the actual cost to the cost center and the
value posted to it from FI-Financial Accounting. The difference as a percentage
share of the actual value can be distributed across a number of cost centers.
Using the Reconciliation Ledger
The reconciliation ledger is maintained by a group of functions with the aim of
integrating the internal and external accounting systems. The reconciliation ledger
must provide facilities to overview and reconcile any value flows arising within
cost accounting that affect the balance sheet and the profit and loss statement of the
enterprise.
The data in the reconciliation ledger is summarized, compressed, and evaluated.
Allocations in cost accounting can cross company code boundaries, or functional
areas or business areas. If any of these cross allocations occur, they are registered
in the reconciliation ledger, from where they can be automatically or manually
assigned to appropriate accounts.
The reconciliation ledger consolidates the data from company code and business
area controlling cost objects according to a user-selected set of controlling object
types. These are related to the cost elements of the General Ledger to which they
are posted.
Transactions between company codes and across business or functional areas must
be reconciled by clearing accounts in the reconciliation ledger. This way, the value
flows finally reported in the consolidated balance sheet and the profit and loss
statement are accurate reflections of the net value flows in the corporate group.
An additional service performed by the reconciliation ledger is to offer a
navigation aid through the controlling accounts, starting with the profit and loss
accounts of the General Ledger. It is always possible to drill down through the
reconciliation ledger structure to the cost controlling objects of the constituent
company codes.
The flexible SAP R/3 reporting system enables you to analyze cost elements from
any point of view:
• By individual cost elements, cost element groups, or subgroups
• By other cost objects, such as cost centers, orders, and projects
Implementing Cost and Profit Controlling
The modular structure of SAP R/3 applications is designed to enable you to
implement progressively according to the developments and requirements of your
company. The application modules are discussed in a sequence that is in
accordance with this concept of progressive implementation.
CO-CCA Cost Center Accounting is specialized to help you plan, monitor, control,
and settle all business activities and responsibilities. This module has functions to
create and maintain cost center master data and to accept or modify definitions of
statistical key figures. Cost center postings and transfers have their specialized
functions, as have distribution, assessment, and allocation between cost centers.
Primary cost elements can be used in the planning functions for cost centers. The
user can define the screen and printed report layout formats from the cost center
reporting system. Planning functional dependencies and the detailed planning of
cost centers are supported by the CO-CCA Cost Center Accounting component.
Activity-based cost accounting is used to cost the internal flow of activities with
functions to plan, evaluate, and allocate. CO-OPA Order and Project Accounting is
specialized in the tasks of planning, monitoring, and settling the activities, services,
and processes that take place as the result of internal orders and projects. These
two modules are covered in Chapter 7, “Costing on the Basics of Activities.”
CO-PA Profitability Analysis is required to report on the business viability of
complex sales organizations and complex product hierarchies. See Chapter 9,
“Analyzing Profitability,” for more information.
Applying the Controlling Area Concept
Navigating through the details of a controlling system involves using the Business
Navigator component. This improves the presentation of a structure made up of
units and links that can also be accessed directly. This structure is stored in the
SAP R/3 system and can be inspected in various ways, including by a graphical
representation. The structure can be the same topological network as the
management structure, with each level of managers reporting to more senior
managers on the level above.
Traditional business organizations tend to have a pyramid structure, rising to the
owner on the pinnacle. Government and military organizations are notorious for
having very tall pyramids. Modern, small companies in the high-tech domain are
notorious for having very flat structures, very few layers of management, and a
boss who is ready to speak to anyone at almost any time. The logical justification
for any type of structure is based on the demands placed on it by external
circumstances and by the owner’s need to exert some control over it.
The controlling area of the owner is perhaps limited to the managing director or the
chief executive officer. This person has a controlling area of the whole company.
The department heads have controlling areas defined by the territory of their
departments—or perhaps their controlling areas are better specified by the
activities for which they are responsible.
The SAP R/3 CO-Controlling module holds master data on the controlling areas
that you establish for your company. These can correspond exactly with the
departments that exist already, but if you are looking for a method of adding value
to information and material as they pass through your company, it would be
prudent to at least consider other ways of setting up controlling areas.
What you should look for are profit centers that can be controlled on the basis of
the measured profit they contribute to the company. One or more of these profit
centers constitute an area of responsibility that is a proper subject for the
application of controlling area discipline.
The conceptual tools of area controlling include the following types of cost
objects:
• The cost center is defined as a place in which costs are incurred. The cost
center may be a unit within a company distinguished by area of
responsibility, location, or accounting method.
• The order is an instrument for planning and controlling costs of what can
be considered a relatively simple job. In a business environment, the order
is represented by a document. In the SAP environment, the order is an SAP
document, which has a standard set of constituent parts and is subject to
strict internal control by the computer system. This ensures that the
system can follow the legal requirements of an audit trail.
• The project is an instrument for planning and controlling costs during a
complex job. The defining characteristic of a project is that it must achieve
a certain result in a specified time without exceeding its budget. Many
types of projects exist, including capital-spending, research and
development, engineer-to-order manufacturing, investment program, and
data processing and customer project.
The individual cost object is also an instrument for planning and controlling costs.
Whatever work is undertaken (whether planning, controlling, informing, and so
on), certain features can be used to focus the computation of costs. The cost object
need not be a real object, and it doesn’t really have to engage in any activity that
consumes resources or generates revenue. The cost object can be just a convenient
conceptual destination that can appear in the accounts with accrued costs or
revenues. On the other hand, the accounts might be easier to interpret if most cost
objects represent tangible units of products or resources that are recognized as such
by the people who work with them.
Defining Profitability Segments
The control of a business could be improved if information is collected separately
about part of it. For example, a calculation of profitability entails comparing costs
and revenues. It might make sense to compute profitability over some aggregate of
your business activities. You can define this sector or segment of your business by
using any combination of data terms that already exist in your system.
You could create a master record for a market or a business segment structure
based on the sales of certain products, in a specified market area, over a range of
accounting periods. Another example of a segment would be the value of the raw
materials in each possible location in which there exists spare capacity for
additional production. This defines a segment in a dynamic fashion because
different locations could be chosen each time on the basis of spare production
capacity.
In logical terms, a controlling area is defined as a set of accounting units within an
organization that all use the same cost accounting configuration. Usually, the
controlling area is coextensive with the company code, which usually stands for an
individual company in a corporate structure. For cross-company cost accounting,
one controlling area can be assigned to cover the areas of responsibility of more
than one company code.
These conceptual tools have been efficiently programmed into the SAP standard
business processes in the most useful of forms, the generic form. You can
customize the generic form to fit your particular circumstance. For example, you
can record in the master data how you want to define the business segments and
how you want to select which cost objects to monitor. You also can determine how
orders and projects are assigned to cost centers.
The CO-Controlling module accepts your requirements and delivers a flexible
controlling system that fits your company.
Understanding the Flow of Control Data
CO-Controlling uses transaction data from the FI-GL General Ledger accounts to
maintain its own set of records. Overhead costs are posted to a cost center
according to their source of origin. The CO-Controlling system uses additional
postings to assign the primary costs to other cost objects, such as orders, processes,
other cost objects, and business segments.
CO-Controlling shares both primary costs and overhead costs among the
assignment objects according to their use. The CO module also allocates the values
to other cost objects for the purposes of control and analysis.
Revenue and sales deductions are posted directly to the relevant business segment
or profit center. The cost objects either remain in inventory or are posted to
profitability analysis. As a result, you can conduct period accounting at the profit
center level, taking into account changes in inventory. You also can call for cost of
sales accounting in each business segment.
CO-Controlling operates a system that is parallel to the FI-Financial Accounting
system but separate from it. You can display a business-oriented profit and loss
analysis because all the data objects that have a bearing on the computation of
value added are represented in the analysis and can therefore be scrutinized down
to the details of the individual transactions from which the data is drawn. The cost
data is allocated according to rules under your control. You should encounter no
obscurity in interpreting the analysis reports.
Customer quotations and sales orders produce the information that CO-PA
Profitability Analysis needs:
• Billing documents
• Sales quantities
• Revenues
• Sales deductions
Goods that are issued, received, or manufactured produce the information
necessary for the calculation of the following:
• Manufacturing costs
• Standard costs
• Moving average price
• Transfer prices
External activities carried out by contractors, for example, are either posted
directly to CO-PA Profitability Analysis from FI-Financial Accounting, or they are
settled from the orders and projects, which also input to CO-PA Profitability
Analysis.
Analysis for separate business segments can be conducted because cost and
revenue data can be posted directly to a business segment, just as they can be
posted to any cost center. Any of the following systems can carry out direct
postings automatically:
• FI-Financial Accounting
• CO-Controlling
• MM-Materials Management
• SD-Sales and Distribution
In contrast, a profit center is not a separate account assignment object. The values
held by it are derived from the master data assignments of the cost objects in the
CO-Controlling system. The postings are treated as statistical values because they
do not contribute to the balance sheet and the profit and loss statement—their
values have already been recorded in the General Ledger. Posting these values to a
profit center occurs automatically under the supervision of the CO-PCA Profit
Center Accounting standard business functions.
Connecting Financial Accounting with Controlling
At the heart of every accounting system must be the General Ledger, and the SAP
system is no exception. The FI-Financial Accounting module serves the FI-GL
General Ledger.
The chart of accounts contains all the accounts available to a company. Every
company, and therefore every unit identified by a company code, must be assigned
to the same chart of accounts if cost accounting is to be applied to the whole
organization.
The concept of the controlling area is integral to the internal controlling functions.
In simple company structures, only one controlling area can exist, and it will
therefore be co-extensive with the company code. Complex corporate structures
can distribute the constituent company codes among several controlling areas.
Each controlling area is assigned a chart of accounts. This ensures that every
transaction in each area is posted to an account in the chart of accounts. Therefore,
every transaction is reconciled and participates in the financial accounting that
provides the balance sheet and the profit and loss accounts required by law.
Different controlling areas can operate with different charts of accounts, either
because this is more convenient or because the local legal authority requires it.
The CO-Controlling system uses the FI-GL General Ledger accounts directly. In
particular, this system uses the FI-GL General Ledger profit and loss accounts as
primary cost and revenue elements.
With certain exceptions, the CO-Controlling system needs no separate
reconciliation with the FI-GL General Ledger and its subledger accounting
systems. The exceptions arise if you use the special feature of CO-Controlling that
manages imputed costs or accruals. CO-Controlling enables you to create imputed
costs at a level of detail other than that used in financial accounting—you can
record costs that have no equivalent, or that have an equivalent with a different
value, in the accounts of financial accounting. These intentional differences can be
reconciled and cleared by using the CO-Controlling functions provided for this
purpose.
Secondary cost elements are maintained by CO-Controlling in addition to the
primary accounts of the FI-GL General Ledger. This constitutes a two-level system
of accounts—each level can record accounting data using a different degree of
detail.
However, the extra details maintained by CO-Controlling in the secondary cost
elements are integrated with the FI-GL General Ledger accounts by means of the
controlling areas, which are represented in the common chart of accounts. In
accordance with Generally Accepted Accounting Principles (GAAP) standards, it
is possible to trace any transaction posted on the General Ledger down through the
controlling area to the cost center, which holds all the details of the cost elements
used to compute it.
The value flow in the subledgers of the FI-GL General Ledger is always reconciled
via special reconciliation accounts. You can always analyze data into summaries
using these accounts, which provide you with such reports as monthly debits and
credits, account balances, and so on. You can inspect individual business
transactions as well. With this kind of functionality, you can substantiate any value
shown in your trial balance.
If you have installed and configured an SAP application such as CO-Controlling,
you have an additional and parallel way of looking at the value flows in your
organization. But because the system is fully integrated, you know that the values
and value flows revealed by the external accounting documents, the balance sheet,
and the profit and loss statement are fully reconciled with the value flows
uncovered by your parallel internal accounting system (implemented using the
standard business functions of the SAP CO-Controlling module). You have a fresh
way of looking at how the values change by doing business.
Understanding the Value-Adding Process and the Role of Cost Objects
In simple terms, a cost object is something that incurs costs. Two cost objects cost
twice as much, and 10 of them cost 10 times as much. A cost object can represent a
product.
You can declare that a particular cost object exists in a market segment by entering
it in the master record of that segment. This cost object could also be identified in
the processes of inventory accounting.
A cost center is charged overhead because that is where the costs originated.
Overhead posted to that cost center then is transferred to the cost objects that are
the responsibilities of that cost center. The proportion of the overhead allocated can
be determined according to the quantities of cost objects. In this way, the cost
object bears a share of the overhead.
Revenues and sales deductions are reported in the relevant market segments and
profit centers. You can use period accounting at the profit center level,
incorporating changes to the inventory in the period. You can also use cost-of-sales
accounting at the market segment level.
NOTE: The cost object method enables you to use an accurate system of accounting to help you control the
value-adding business processes of your company.
Using Integrated Planning and Decision Support
One important decision to be made involves the product mix. You want to make
sure that you optimize the contribution of each product line to the profit margin.
Your methods include tentative variations in the planned production costs, which
the system develops through the work flows of your organization to arrive at the
planned values in each area of interest. You can display any combination of
planned values for any cost object or set of objects, right up to the planned figures
for the entire company.
This is integrated planning, and it depends on the following functions programmed
in the CO-Controlling system:
• Planned assessment, distribution, and accruals of imputed costs
• Planned allocation of internal activities
• Planned assessment of costs on orders and projects
These functions cannot succeed unless you provide the data or tell the system how
to find them. The system supports you in this preparation by guiding you through
these essential tasks and performing the necessary calculations automatically
wherever possible:
• Planning of cost centers
• Planning of internal orders and projects
• Determining standard costs of products for stock production and for unit
costing of customer orders
• Planning contribution margins and profits in sales management
Again, the system needs information to help you in the development of your plans.
CO-Controlling provides the program support for the following preliminaries:
• Creating the activity plan, using the activities for each work center and
cost center
• Integrating detailed planned sales quantities for the individual reference
objects, including assigned costs and revenue, with the production plan
• Developing automatic standard cost estimates based on bills of materials
and routings
Reporting in CO-Controlling
The SAP Executive Information System (EIS) and the reporting facilities of CO-
Controlling are fully integrated. Within the SAP R/3 computer system, the
reporting facilities are highly flexible. Reports are easy to define forad
hoc purposes and are also easy to maintain as needs change. The content and
format are virtually unlimited and can be differentiated by user groups.
Reports can be stored, recalled, and processed by the SAP graphics presentation
component. Online navigation facilities make it easy for you to switch between
report formats without losing the focus of your inquiry. For example, you can
select an item on a list and use the function keys to call up a more detailed report
on the item selected.
Standard predefined reports are available for the following purposes:
• To compare actual values with the planned entries
• To compare the performance of different cost objects, such as cost
centers, orders, and projects
• To assemble balance lists and balances of activities
• To inspect individual line items
You can select a cost center and call up all the settlement objects linked to it. You
can also trace the costs on each object, back to the individual business transactions
that caused them.
NOTE: Reports designed in the CO-Controlling module are applicable to all CO components.
Integrating CO with R/3 Applications
All the information in all the R/3 applications installed and configured is available
directly. The CO-Controlling system can call upon any of the information outputs
of the system—from the annual sales and production plan to the individual
planning steps, and down to the planning and processing details of individual
orders.
For example, standard business functions are available for the following tasks:
• Using bills of material and routings to prepare cost estimates for
products and orders
• Updating a costing as production progresses by transferring times and
material valuations automatically as they become available
• Evaluating quantities used of supplies and raw materials
• Evaluating semifinished and finished products in stock
• Using cost-of-sales accounting to provide an ongoing analysis of
profitability based on invoiced sales quantities
The success of a controlling function depends on the integration of planned and
actual data at all stages and levels of the production process.
Establishing Cost Center Accounting
A cost center is a place in which costs are incurred because at least one activity
originates there. A cost center need not correspond to a real place in the
geographical sense—it can be a functional unit that makes business sense. If one
person does two different types of work, you might find it helpful to place one type
in one cost center and the second in another. The cost center is a unit within a
company distinguished by area of responsibility, location, or special accounting
method, and by activity-related aspects.
All cost centers must belong to a controlling area. If more than one FI-Financial
Accounting company exists in the area, then you also must specify which cost
center belongs to which company by assigning a company code to the master
record for each cost center.
Using CO-CCA Cost Center Accounting
The CO-CCA Cost Center Accounting module maintains master records that
represent your cost centers and organizes the storage of related data. Each cost
center has a defined validity period, and all changes to the master record are related
to this validity period. You decide when cost center changes take effect.
Progressive implementation of cost accounting can occur because a cost center can
be created with its basic characteristics and can receive postings of auxiliary
account assignments. These are simply checked on receipt. They can be reposted if
full cost accounting is subsequently installed.
The cost center master record indicates by parameters which functions can be
active. The following questions address these parameters:
• Will the cost center master record accept planning data?
• Is posting allowed to this cost center?
• Will the cost center maintain open items or commitments?
• Can quantities be entered on the cost center master record?
• How are commitments handled for this cost center?
• Are statistical revenue postings accepted?
• What blocking logic applies?
• What is the type of this cost center?
• What is the cost center currency? (This defaults to the area currency but
can be changed.)
The cost center concept ensures that transaction data can be validated against cost
center masters as soon as they are established, even if CO-CCA Cost Center
Accounting is still being implemented. This module also prepares data for other
cost accounting areas, such as cost object controlling.
Cost centers can be grouped in alternative configurations that can be changed at
any time. The transaction data itself is always assigned to the relevant cost center.
Alternative cost center groups can correspond to organizational or functional
distinctions related to decision-making, departmental, or controlling requirements.
For example, your cost center hierarchy could be headed by the corporate
headquarters responsible for the first level, comprising management, logistics, and
affiliated cost centers. The logistics cost center group could control costs from
different organizational areas, such as warehouse, energy, buildings, and fleet.
Each of these, in turn, could perhaps include a set of cost centers.
NOTE: A cost center master record is usually created and maintained for each fiscal year, although it can be
recreated for subsequent years.
The warehouse cost center group can be used to group together the following
component cost centers for reporting:
• Goods receipt checking
• Goods receipt warehouse
• Goods issue warehouse
The energy cost center group can be used to group together the following
component cost centers for reporting:
• Power
• Water
• Gas
The buildings cost center group can be used to group together the following
component cost centers for reporting:
• Corporate headquarters
• Warehouse buildings
• Production facilities
The fleet cost center group can be used to group together the following component
cost centers for reporting:
• Executive cars
• Road transport vehicles
• Internal materials-handling vehicles
• Dedicated rail wagons
Cost centers themselves can be allocated to a business area and a profit center and
therefore contribute data to them as required. The data stored in a cost center
section of the database includes the following:
• Control information for planning
• Control information for settlement
• Control information used by the Controlling Information System (CIS)
and the Executive Information System (EIS)
NOTE: The parent company code of a cost center can be changed from one financial year to the next.
Understanding Actual Costing
When primary costs are entered, you specify a cost center as the destination in the
cost accounting system. SAP R/3 automatically creates an SAP document to record
the transaction and posts it to the appropriate subledger of the FI-GL General
Ledger. At the same time, CO-Controlling makes a second copy for itself. As a
result, CO-Controlling can be self-contained, yet the audit trail remains intact.
The following SAP applications are fully integrated with CO-CCA Cost Center
Accounting and can act as feeder systems sending actual cost data to specific cost
centers:
• FI-Financial Accounting sends costs from external invoices and imputed
cost calculations.
• FI-AM Asset Management sends imputed depreciation and interest for
book values and replacement costs of fixed assets assigned to the cost
center.
• MM-Materials Management sends details of the consumption of
overhead materials.
• PP-Production Planning sends notification from production orders.
• HR-Human Resources Management sends payroll costs and employee
benefit costs as postings to expense accounts.
• SD-Sales and Distribution sends sales data and distribution costs.
The data from these feeder systems can be used in calculating statistical key
figures for the purpose of internal cost allocation and ratio analysis. The data can
be formed into groups and used in the same way as cost elements and cost centers.
External data from non-SAP systems can be automatically transferred through SAP
standard interfaces. A flexible and supportive interface also exists for the manual
input of data. Every transaction is recorded in the standard form of a CO
document, which is supplementary to the standard SAP document created by every
transaction.
The actual costs transferred to a cost center can be recorded in separate accounts to
identify their origins. A further distinction is maintained in the records between
activity-related allocations made during the business period and those made at the
end of the month or other business period. These kinds of postings can arise from
direct internal cost allocations or as repostings.
A reposting in cost accounting usually occurs from one cost account assignment
object (such as a cost center or job) to another when the external accounting
system makes a mistake in assigning the item.
Understanding Cost Distribution Within CO-CCA
Costs can be transferred between cost centers, but the original cost element data
remains unchanged. CO-CCA Cost Center Accounting sponsors two types of
distribution of costs:
• A periodic transfer of primary costs in CO-Controlling, known as
distribution
• Distribution of primary and secondary costs within CO-Controlling,
known as assessment
The distribution method of CO-CCA Cost Center Accounting is totally flexible and
remains under your control.
The sender is a cost center with access to the rules for distributing the cost
elements to the receivers, which are possibly also cost centers. You have control
over the allocation structures to ensure that distribution suits the needs of your
company. The identity of the sender is preserved in all distribution postings, and
the system keeps a log of all the relevant data.
You can simulate distributions to test the effects of the rules before you post the
values. The variety of available distribution rules is illustrated by the following
examples:
• Fixed specific amounts, or values calculated at the time and based on
shared portions or percentages
• Actual data or planned data
• Allocation across a group of cost centers, which is defined in the
distribution rule
Distributions in cost accounting can occur only within a controlling area, so sender
and receiver cost centers always exist in the same controlling areas. For example,
you could allocate 70 percent of a cost arising from sales evenly to the cost centers
for individual sales representatives. You could then split 20 percent between the
central sales organizations in proportion to the number of sales representatives
working for them. This example illustrates that you do not have to distribute all the
costs—the sender cost center still has 10 percent.
You can witness the effects of a distribution immediately by calling for a standard
online report, available through the special functions keys. You can repeat the
distribution procedures at any time.
Understanding Assessment
The function of assessment is to allocate primary and secondary cost elements. The
processing logic is similar to that for the distribution method. The cost center
sending cost data is credited with the total of the accounts assigned to it.
The receiver cost center is debited using a special secondary cost element
signifying that the transaction is part of an assessment procedure. By looking at the
appropriate secondary cost elements, you can analyze the results of the assessment.
Understanding Surcharge Calculations
One cost allocation method available in CO-Controlling that is supplementary to
assessment is to use the surcharge calculation function. This calculates a
supplement (usually as percentage), which is used to apply overhead in absorption
costing on an individual transaction basis. For example, this occurs when a service
receiver is charged for overhead incurred by the service provider.
You can call on CO-CCA Cost Center Accounting to calculate a surcharge at a
percentage rate based on one or more cost elements. The system simultaneously
credits and debits the relevant cost centers with the calculated surcharge, which is
posted under a predefined surcharge cost element.
Understanding Cost Center Planning Procedures
The purpose of cost center planning is to anticipate the volume of costs for a
particular period at each cost center you identify in your company. You can plan
for one fiscal year ahead or for several. You can divide the year into parts (up to
365), or you can use a rolling system of planning.
Within your overall period of choice (say, the fiscal year), the system reallocates
any planned values according to your selection from the predefined distribution
keys. You can add your own distribution keys to this set.
You also must decide on a planning level, which defines the cost center where you
set out your plan. If the plan is to be applied across the entire enterprise, the
planning level is the SAP client that subsumes all subordinate companies. If the
plan centers on a single subsidiary, the level is the company code. This code
appears on all records associated with this plan.
The plan specifies details such as the following:
• Quantity-based activities
• Value-based primary and secondary cost elements
• Statistical key figures
When you settle on the planning level, the system provides detailed planning
support in the form of standard texts that document the plan and formulas for
calculating all the standard statistical key figures. The SAP product costing system
can supply information to your plan in the form of quantity and value details of
particular cost elements.
Although you can change and correct the cost center plan at any time by repeating
individual sections of the overall planning sequence, you can also block your plan,
version by version, to prevent any changes. Furthermore, you can use the standard
R/3 authorization functions to control changes to your plan.
Your cost center plan may contain a planned value for a particular cost element
that should really be subjected to more detailed attention. The system enables you
to define individual items to separate what you regard as the important factors that
should be subjected to detailed planning. The following influencing factors
illustrate the concept:
• A material may be subject to wide fluctuations in cost due to an unstable
market. Your plan could specify the code number of this material, and the
SAP MM-Materials Management application would keep your plan up-to-
date by posting the current price of this material to your plan.
• Some cost centers in your plan may be sensitive to employee-related
wages and salaries. You could evaluate this influencing factor using price
tables and cost rates, by employee group or by individual employee, if
necessary.
• Some cost centers may be sensitive to the costs associated with
individual activities and external services. You might highlight these as
influencing factors to be actively and automatically taken into your plan.
• You may have some risks or overheads that should attract surcharges at
some cost centers. These can be factored into your plan.
NOTE: SAP standard business functions are available to support the concept of linking cost centers with a cost
center budget.
Posting Key Figures to Cost Centers
A statistical key figure is a number or a ratio used in planning. Key figures can be
transferred from the Logistics Information System (LIS) to cost accounting and can
be used for internal allocations to cost centers. The role of a key figure is to
represent the comparative quantity of a value, such as the proportion of annual
output forecast for each month in the year. Key figures can be used as the basis for
internal purposes as part of representative value analysis and various simulations
when the actual figures are not available or not appropriate.
Transferring Data
Data for cost centers can be automatically transferred from third-party systems
through standard SAP interfaces. Manual data is supported by an extensive range
of preset values and key figures, together with facilities for copying values from
other periods and from other cost centers. Manual and automatic data transfers
generate CO documents to which origin verification can be applied by referencing
other document numbers and texts.
Performing Period-End Tasks
The scope of period closing and its timing may well depend on the completeness of
data arriving from other systems, such as financial accounting. If all primary cost
elements are to be processed, you must determine the sequence of the period
allocations for the period-end closing. Distributions and overhead calculation must
come before cost center assessment. If follow-up costs appear, the processing run
can be repeated in the period involved.
The actual costs incurred in the cost centers, apart from costs allocated in
inventory, can be periodically transferred into profitability analysis to be verified.
Multilevel fixed cost absorption is carried out by allocating costs to any market
segment or revenue object, from which they can be assigned to any level of the
contribution margin hierarchies. This accommodates both variances from the
production cost centers and costs from the sales and distribution and administration
cost centers to be transferred to profitability analysis.
Performing Period-End Clearing from Cost Centers
At the end of the period, all cost centers can be cleared of all costs with the
following procedures:
• Activity allocation and production orders are used to settle part of the
costs to inventory.
• Any production variances remaining on the production orders can be
periodically transferred to profitability analysis.
• Any cost center costs remaining are distributed directly from the cost
centers to revenue objects.
Using Cost Centers in Planning
A plan is a way of setting goals for a cost center. A variance is a difference
between some aspect of the plan and the actual results. A variance detected and
reported can lead to a beneficial change in the process flows.
If you want to use standard costing, you must set out a cost plan that includes the
values and quantities for the relevant time periods, without reference to the actual
values and quantities of preceding periods. You can use transfer prices based on
planned costs and activity quantities to assign values to internal activities during
the current period before the actual costs become available.
A cost center plan usually applies to a period of one year and is part of the
enterprise plan. The components of the plan are quantities of activities and
consumption. From these quantities, the value flows are computed for the cost
center. If the cost center managers cooperate, these values can then be used as
goals or targets if they take into account both the internal conditions of the cost
center and the external market conditions. The preset goals can be adjusted as
market conditions, and other factors can change during the period.
When the accounting period closes, the differences between planned and actual (or
between target and actual) values and quantities can be used to trigger changes in
processes intended to improve efficiency. The results of the cost center activity in
relation to the plan can be used to assign values to these business activities that are
not unduly influenced by unusual events that may have occurred during the period.
Integrating Cost Center Plans with Other Plans
The usual beginning of a short-term plan is the sales plan. The sales plan sets
targets for the quantities that should be sold in the planning period. The planned
sales volumes form the input to the production plan.
The production plan must determine the quantities of raw materials and operating
supplies needed to produce the volumes called for in the sales plan. In addition, the
production plan must specify the capacities needed, in terms of the people and
production facilities, and the time schedule in which they must be engaged if the
production targets are to be met.
The capacities identified in the production plan are passed to the available cost
centers, which must make available the activity units to supply the target
capacities. At the same time, the cost center managers must plan how the costs and
activities needed will be transferred from the relevant cost centers.
From the planned costs and the planned sales volumes, it is possible to calculate
the revenues. This information is then used to calculate a value for planned profit.
Of course, the scope of production planning and cost center planning can be
curtailed by financial planning, which is affected by profit planning.
Other plans in the enterprise encroach upon production and financial planning.
Subplans from any or all of the following sources must be taken into account:
• Investment plan
• Procurement plan
• Inventory plan
• Personnel plan
The cost center planning module can receive planning data directly from the
following integrated modules:
• Human Resources
• Asset Management
• Plant Maintenance
• Production Planning
• Logistics Information System
NOTE: The cost center accounting module can transmit planning data to the PCA Profit Center Accounting
module and to the FI-SL (Special Purpose Ledger) component.
Planning Techniques with Cost Center Accounting
A planning view is a summary of the planning technique and scope. Planning
periods are usually a year or a regular division of a year. Two main types of
planning views exist:
• Decentralized planning, where plans are developed for individual cost
centers
• Centralized planning, where the head office manager distributes the plan
values
The recipients of the head office directives are special cost elements or cost
element groups in the cost centers. For example, all cost centers may be given
payroll plans from the head office.
Plans are automatically tagged as versions and are stored as separate versions if
parameters change. For example, the previous year’s actual figures may constitute
the first version of the next year plan. Adjustments in the form of proportional
revaluations and changes to the planning quantity numbers are recorded as
versions, perhaps as several versions as different managers contribute their views.
It may be helpful to record a best-case and a worst-case version, or a least versions
portraying various degrees of optimism and pessimism. Versions of a plan can be
run in simulation mode and can be compared with each other in a report. Standard
SAP layouts are provided for cost center planning reports, and certain facilities
enable you to set up template planning screens (layouts) into which the planned
data is inserted.
Developing Planner Profiles
A planner profile specifies which planning layout or screen is to be used for each
planning area. The planning areas recognized by cost accounting for this purpose
are as follows:
• Cost elements and activity inputs
• Activities and activity prices
• Statistical key figures
Within the planning area, you can decide which planning layout is to be used.
Planning Authorization
A planning profile can be associated with an authorization group so that access to a
plan is controlled. In decentralized planning, for example, it is important that
alterations to a plan are made by people in the appropriate cost center and area of
responsibility. Default values can be specified for plans as a form of guidance for
the local planners.
Planning locks can be set according to the following levels:
• Version
• Cost object, such as cost center or job
• Period
• Procedure, such as distribution or activity allocation
Plan copying can be used as follows:
• Entire version
• Cost centers or cost center groups
• Procedures
• Time segments within a fiscal year
Revaluing Plans
An existing version of a plan can be revalued to change planned amounts for
primary cost elements proportionally. For example, payroll costs can be planned on
the basis of an estimated rate of inflation and can be later revalued when a better
estimate is available or when a rate increase is negotiated.
The use of plan versions with different parameters can be regarded as a form of
simulation that you can use to explore what the values might be if, for example,
your primary costs changed.
Transferring Planning Data from Other Systems
If one or more of your integrated systems have developed plans, the data can be
transferred to cost accounting. For example, the following applications can
contribute plan data:
• Planned personnel costs can be acquired from the HR-Human Resources
application.
• AM-Asset Management has period depreciation and interest calculations
for each asset that can be transferred to primary cost planning objects.
• PP-Production Planning has developed schedules of the services
required, and these service quantities for each period can be transferred to
cost center planning.
• Statistical key figures developed in the logistics information system can
be copied to cost accounting.
These contributions to cost planning can be corrected at any time to ensure that the
resulting plan truly represents what you want your business to achieve.
Integrating Internal Orders into a Plan
If an activity in a cost center has been planned to occur at a certain level, you may
discover that the resulting capacity will not suffice. You can update a planned
activity by an internal order. The sender cost center is credited in the plan, and the
plan activity is updated by the same values.
A rate is assigned for converting a quantity of an activity to a value, for planning
purposes and perhaps for pricing. If this rate changes, the rates applied to any
planning objects that include the same activity should also change. This
revaluation occurs automatically with planning integration as it is implemented in
SAP R/3 and later versions.
Profit center accounting must be provided with all the costs that have been
determined in the planning processes. Again, this is an automatic function of SAP
R/3 if so configured.
NOTE: If you run the integrated planning object regime, the planning objects are settled to the appropriate
cost centers, and the settlement process automatically generates planned costs in the cost centers.
Planning with Cost Centers
There may be as many different ways of planning across cost centers as there are
different companies. Each needs a custom planning scheme. However, there is a
basic sequence that is almost always the most prudent way to establish the targets
by cost center and by period. The following entity clusters should be assigned
planning values in order:
• Statistical key figures
• Service performance
• Consumption and costs
The next step is to transfer all the activities as scheduled in production planning.
You will probably have to reconcile the activity network to make sure that no cost
center is assigned more activity than it can provide from its available capacities.
Next comes the allocation of activities and values to the individual cost objects,
followed by careful calculation of the activity prices once you know the production
resources in which these activities will take place.
If you have not done so already, you should bring your plan into accordance with
any other subplans approved by the board of management or their planning
advisors. You will not want to publish a plan that requires more qualified
employees than will be available over the periods of your plan, nor will you be
popular if you plan to use high value materials over periods when they are
expected to fetch premium prices.
Iteration is a mathematical technique in which a process is repeated until the result
settles down to a decent compromise. Planning works like this, and the SAP R/3
functions make sure the process takes place in an orderly and traceable fashion.
Statistical key figures may be nothing more elaborate than a target number of units
to be sold in each of the product divisions. On the other hand, they may comprise
logically complex ratios, such as the return on capital invested in high-risk
ventures in business areas of high inflation. The useful key figures enable you to
build a plan with reasonable estimates of the capacities needed for each of the
critical activities in each planning period. Will you have the plant idle, or should
you invest in extra productive capacity?
If you can manage to accumulate the quantities of the activity types required in
each period in each cost center, then you can apply primary and secondary cost
allocations to these activities and their sponsoring cost centers.
Primary costs are defined as those incurred by the consumption of goods and
services that come from outside the company. The following are classified as
primary costs:
• Payroll costs
• External services
• Material costs
• Operating supplies
• Imputed costs
If some of your requirements can be met by calling on other cost centers, you have
two ways of accounting for them in your planning. You can plan them as activity
inputs and credit the sending cost centers, or you can plan them as secondary costs.
Some of your primary costs may have to be planned without reference to activities.
Your shop floor manager must be paid salary regardless of how much work takes
place on the shop floor.
Another scenario in which you might assign primary costs without reference to the
quantity or type of activity planned arises if you do not operate activity accounting
and therefore cannot relate primary costs to activities in any strict computation. See
Chapter 7 for a more detailed discussion on the methods of relating primary costs
to the activities in your company.
Planning Secondary Costs
An input of secondary costs must be posted when a cost center calls upon another
cost center to provide goods or services. If the amount of this hired activity
depends upon the amount of some activity in the hiring cost center, then the
planning process must take this into account. On the other hand, if the service
provided by the sending cost center is not related to the activity in the receiving
cost center, then the plan must assign a value to this service that is not related to
activities.
Planning Functional Dependencies
When activities are used to plan activity prices, a calculation of a planned sum
could be distributed across all the cost elements. It is recognized that the cost of a
cost element, such as a unit of the product, is functionally dependent on the costs
incurred by the cost center, in relation to the number of units produced in the
period. This is referred to as detail planning of a primary cost element.
This technique can be applied recursively; that is, the costs can be planned on the
basis of the costing of the goods and services that make each unit of product. You
can apply the same technique to these goods and services themselves.
Budgeting a Cost Center
A budget is an amount assigned to a time period. You can set a budget and
compare the actual postings to a cost center with the budget. If the postings do not
balance, you have the option of changing the budget or changing the activities.
The cost accounting information system is provided with reporting tools to enable
you to compare actual costs, commitments, and the budget for any or all cost
centers.

A budget profile can be specified so that the amounts are spread over a range of
accounting periods according to any distribution function you care to impose.
Chapter 7
Costing on the Basis of Activities
In this chapter
Determining the Profitability of Product Lines
Introducing Cost Object Controlling
Identifying Costing Requirements of Different Types of Companies
Organizing Product Cost Controlling
Planning Product Cost
Viewing Product Costing Results
Controlling by Cost Objects
Interpreting Production Variance
Using Cost Objects in a Hierarchy
Using Activity-Based Cost Accounting
Using Internal Order Accounting
Using Cost of Sales Accounting
Determining the Profitability of Product Lines
The traditional method of controlling a business has often been a matter of keeping
careful records of what has been spent and what has been sold. At the end of the
financial year, the balance sheet and the profit and loss statement should reveal
whether the business has been profitable and whether it owns any assets of value or
is responsible for outstanding obligations.
Cost-of-sales accounting and period accounting are formal methods of tracking
revenues and expenses on a monthly basis to detect poor operating results in time
to do something about the business processes.
If your business has more than one product or service, you probably want to know
how each of your product lines is performing so that you can make at least an
informal judgment of how profitable they are in case you decide to alter the effort
and resources you devote to them. The formal method of product costing is
designed to set out all the ways in which each product consumes value and how
each product can earn revenue. The formal method of activity-based costing is
designed to refine product costing by assigning a value to every activity in your
company so that any changes you make in resource allocation can be represented
as a plan. Such a plan produces a series of period value targets built by adding the
values of all the activities intended for each period. Of course, you can compare
target values with actual values as soon as the period operating figures are
available.
Introducing Cost Object Controlling
The purpose of product cost accounting is to determine the unit cost of whatever
product units your company handles. These units are referred to as cost objects,
with one cost object for each product, or one distribution package for each product.
The context is a technical production system customized to a particular company;
the outcome is a company-specific costing system that integrates the flow of cost
information from its origins.
There is a core technical discipline based on the principle that costs should be
accurately allocated to the processes that incur them. Several costing systems
embody this principle.
Product cost accounting addresses two types of costing:
• Production order costing
• Inventory costing
Four types of cost object controlling are differentiated because they offer particular
clusters of benefits according to their type of business:
• Make-to-stock production
• Process manufacturing
• Make-to-order production
• Plant construction
All these types of product cost accounting are supported by the CO-Controlling
module by the flexible use of cost objects.
Identifying Costing Requirements of Different Types of Companies
Modern controlling methods have been developed to support technical
manufacturing processes and service industries. The methods must match the needs
of the individual company. The SAP approach is to establish a core of standard
business functions that can be controlled by the implementor through the medium
of parameters to yield a customized system finely tuned to the requirements of the
different user classes in the specific company.
Manufacturers require a costing system that shows where and by how much their
manufacturing processes add value to their raw materials. They differ in their style
of manufacturing according to whether they make to a production order or make to
replace stock on their inventory. Their processes differ over a range, from discrete
one-off production to repetitive production to continuous flow production.
Trading companies need a method of costing to enable them to apply overhead and
surcharges to the cost prices of their goods, which they often must keep to set final
selling prices.
Service companies tend to adopt the principles of process costing, which revolves
around the concept of cost drivers—in this case, service activities. The companies
must have the means to define, measure, plan, and pass on costs incurred by their
cost drivers, service calls, and other activities.
Understanding Make-to-Order, Make-to-Stock, and Continuous Flow
Costing
The manufacturing industry has a polished costing method based on routings of
work units and bills of materials. Manufacturers need to know what processes the
product must undergo, the costs of materials and resources, and the quantities
required. This is referred to as the quantity structure for this product. If you have
this information, you can begin to cost the product by assembling the costing
components.
In the make-to-order company, the customer order sets off costing. Because each
order is unique, there may be a shortage of routings and bills of materials that can
be applied without editing. Yet it is of the utmost importance to be able to arrive
quickly at a cost prediction for this one-off product so that the company can issue a
quotation and take part in competitive tendering for the work. An effective costing
system for this sort of company would have to make this approach to one-off
tendering a high priority, for all future business may depend on its speed and
accuracy.
Those manufacturers who make to stock apply standard bills of materials and
routings about which they may well have copious actual data. Products and orders
for them can be costed from this database.
When the manufacturing process is continuous (such as in repetitive
manufacturing), it is probably not amenable to much in the way of variation. This
process probably works at its best only if the rate of flow falls within narrow
limits. Nevertheless, management and shareholders still hold an interest in the
contribution of the various cost components to the cost of the finished product. It is
important to understand how and why costs vary if the flow rate and quality are
allowed to move out of the normal operating ranges. This might happen because of
variations in the raw materials or in the environmental conditions at the
manufacturing plant.
Understanding Product Costing Techniques
A costing system uses a set of costing objects, which are the different products,
production orders, resources, and so on. The only qualification for a costing object
is that it can be allocated costs that mean something when they are totaled under
that costing object. The costing objects can be conceptual or tangible,
organizational or geographical.
The pivotal concept in costing centers on a structure of cost drivers customized to a
specific company. These cost drivers are cost objects onto which the actual costs
are settled according to how they were incurred. SAP R/3 CO-Controlling provides
a range of model structures on which you can base a structure specific to the needs
of your company.
Three types of costing values can be settled on a cost structure:
• Planned values
• Target values
• Actual costs
Two ways exist for applying cost data to arrive at a specific costing:
• Allocating the full costing to the cost objects
• Allocating only the variable costs to the cost objects, and applying
overhead or surcharge
These ideas are discussed in Chapter 6, “Controlling by Cost Management.”
An integrated costing system must have at least the following capabilities:
• Calculating alternative cost plans using different versions and timings
• Controlling the activities and the value added by each operation
• Settling actual costs, according to how they occurred, on a specific cost
structure
Understanding Unit Costing
If your company makes unique products only to customer orders, you need unit
costing. You have very little choice but to cost each individual order by deciding
which unitary components you must put together. You also must determine what
other costs will be incurred as you do so.
The relevant database is a set of reference unit cost estimates. CO-PC Product Cost
Accounting helps you locate which elements you need, and you can transfer them
in blocks to the relevant quotes and sales order items or to the cost accounting
objects (which are orders and projects). This builds the planned costs of the quote,
which can be compared to the actual costs as the order proceeds toward
completion. Materials that are consumed have their quantities or values assigned to
the accounts under the correct cost element headings as data is collected on the
activities that consume them. Overhead is applied, and charges for external
activities add to the cost.
The sales order is documented with a continuous comparison between planned and
actual costs for its lifetime. From this data, a simultaneous calculation of the
contribution margin can be computed, and the results are recorded on the sales
order document.
Understanding Order Costing
In make-to-stock production, it is useful to combine order and unit costing methods
because order lots and batches of products are usually produced in response to
production orders. Different cost estimates are prepared as alternative versions that
take part in simultaneous costing to ensure exact control of the actual costs
incurred by the relevant cost elements, sender cost centers and their activities,
materials used, and so on.
The system supports settlement of some or all the costs to stock an automatic
calculation to support inventory control over finished and semi-finished products.
The value of stocks of unfinished goods and works in progress can be calculated
automatically.
Process manufacturing includes production processes that have a step-by-step
structure and those that entail a cyclical input of materials. Continuous flow
production, such as in repetitive manufacturing, is characterized by long
processing runs of a single basic material. Many types of manufacturing plants
perform more efficiently if the raw materials and the process cycles are not subject
to undue perturbations.
The control document for continuous flow processing is the period production
order. Comparisons are made between target and actual costs, planned output for a
period, and actual output, including cost use from backflushing surplus material or
summarized confirmations of production. The costs are charged to individual cost
elements of the production structure in relation to the quantities produced.
Backflushing occurs in the chemical industry, for instance, when some of the
output can be returned to the process as a semi-finished product. There may be by-
products and co-products with alternative uses to the main product, and some
products may bypass some of the production stages in the process cycle. The
production order documents these variations.
Trading companies need a costing system that can provide accurate valuations of
the costs and the prices, taking into account the individual costing and pricing
structures that prevail in the type of business and under the market conditions at
the time. The basic method involves applying overhead to cost prices. Costing the
overhead enables you to apply the overhead according to cost elements, or in
relation to the overhead you have already calculated. The system enables you to
use different levels of sales prices, such as net sales price or gross sales price, to
compute additional overhead or surcharge, such as discounts or cash discounts.
These factors differ in wholesaling and retailing.
Service companies use the functions and elements of process costing. The service
operations must be defined in terms of individual activities that can be measured. If
these activities can each be measured, then they are subject to planning. When the
work is done, the actual amount of each activity component can be entered in
quantitative terms. In this type of situation, the measured activity is the cost driver.
The valuation process can cost each activity using predetermined rates and allocate
the costs to the service cost structure under the appropriate cost element headings.
From this point on, the flexible reporting system of SAP R/3 can be used to collate
the information and present it for the benefit of the decision makers in your
company. In particular, the actual data compiled after a plan has been developed on
the basis of activities can be used to refine the values assigned as rates for given
quantities of each costed activity. In this way, the estimates for the next plan that
involves these activities can become progressively more accurate. An accurate plan
can be of great value because it enables the materials supervisor to purchase the
right amount of raw materials and consumable stores. The plan also ensures that
the key resource, the personnel, is planned with precision.
Assigning Costs to Cost Objects
A cost object exists for SAP R/3 if there is a master record for it. The function of a
cost object is to control the allocation, analysis, and settlement of costs related to
the object it represents. A cost object can relate directly to a production unit; it can
be an organizational structure component that is useful in reporting value flows. In
essence, a cost object is an identification number and a set of master record data
fields that can be accessed in connection with that number.
NOTE: Unit costs of all cost objects serve as the basis for arriving at all costing values.
The cost object could be an entity that is quite independent of any particular SAP
application, a convenient peg on which to hang information relevant to the specific
costing procedures of your company. A cost object can collect the costs of two or
more other cost objects. This constitutes a cost object hierarchy, which can branch
down any number of layers and extend to any number of cost objects on each level.
Most cost structures exist in the form of cost object hierarchies of this inverted tree
shape if plotted, for instance, through the SAP R/3 online reporting system using
the graphical interface.
If you run projects or production lines, you might find it informative to have
certain cost information gathered by cost objects, in parallel to the normal product
costing. One way of achieving this is to define unique cost objects for each project
or production line of interest.
If your installation has other SAP modules installed and configured, you will find
it convenient to use the cost objects from these applications to define your own
unique cost objects by copying some or all of the data structures from these
predefined SAP cost objects. For example, the following application modules use
particular cost object types:
• PS-Project System (network and project item)
• CO-Controlling (internal order)
• SD-Sales and Distribution (sales order)
• MM-Materials Management (material number)
• PP-Production Planning (production order and routing)
• PM-Plant Maintenance (maintenance order)
If you have the unit costs for all your cost objects, you can display inventory
costings and call for profitability analyses using the full set of fixed and variable
costs. You can use any combination of the costing systems current in your
company.
The SAP R/3 system carries the definitions, in the form of master data, for all the
cost object controlling functions of the SAP integrated system. Any transaction
that bears data relevant to costing is processed according to these definitions.
Using Results from Costing a Cost Object
Costing results are stored by version so that different methods and different periods
can be compared. Each assembly is itemized in a costing created from a cost
object. The data used can be planned or actual and can be expressed as valuations
or as quantities to which standard rates can be applied by the system at the time.
The results of a costing comprise information on each of 40 cost components for
each cost object, itemized for each assembly, and the whole is replicated for each
version of the costing structure, if required.
Legal analysis demands that the origins of cost estimates be identifiable. This, in
turn, requires that details be kept for the cost origins of all the contributors to the
values recorded as the cost object components. A cost origin must be a document
that identifies a transaction by such means as follows:
• The vendor number for external procurement and the provision of
external activities
• The operation number, the identification of the sender cost center, and
the activity type for each internal activity
• The material number or material group code, if stock movements or the
consumption of goods occurred
• The cost center for charging overhead
The SAP R/3 system running CO-PC Product Cost Accounting can carry out the
following procedures using cost origins to associate posted movements with cost
elements:
• Conducting valuation using individual cost structures or cost rates
• Assigning costs to standard cost elements
• Establishing the costing basis for overhead
• Accepting planning and account assignment directives at any level of the
costing structures
• Preparing reports at any analysis level to display planned or actual
resource-usage variances
Understanding Valuation Methods
The following costing systems are available in the CO-Controlling module of the
SAP R/3 system and can be used in any combination:
• Unit costing
• Product costing
• Production order costing
• Cost object controlling for make-to-stock production
• Cost object controlling for process manufacturing
• Cost object controlling for make-to-order production
• Cost object controlling for plant construction
The valuation of input factors and the presentation of this data for costing analysis
are carried out by a uniform valuation method across all costing systems. The
source of the data differentiates the methods, insofar as different methods exist for
costing when technical quantities are involved (such as when using bills of
materials and routings). Variations also occur when existing cost estimates must be
copied or referenced. Manual entry of cost estimates is supported, and the R/3
system offers suggested default values whenever possible for editing.
The valuation process extends to the following calculations:
• Planned input quantities with planned allocation rates and planned
prices
• Actual input quantities with standard prices and standard activity prices
• Actual input quantities with actual prices and actual activity prices
• Partial or total output quantities
• Scrap quantities
• Order-specific cost settlement according to the quantities delivered
• Calculation of all types of variance
• Profitability analyses to different layout formats
Input quantities can be evaluated by any of a range of methods. The method chosen
is recorded as the valuation variant. These variants are listed below:
• Standard prices and current prices, both future or previous
• Moving average prices
• Tax-based and commercial or “political” prices
• Standard activity prices
• Actual activity prices
• Applying variances on standard or actual prices adjusted to match
changes in planning or historical amounts
In the service sector, it is possible to instruct the system to split the costs into fixed
and variable components. This enables you to carry out marginal and absorption
costing in parallel. You can take any point of view of output to evaluate services
rendered.
By having the required functionality available online, the system can offer a
modern control system covering products and the analysis of results. The following
outcomes are supported:
• The cost of goods manufactured and the cost of goods sold are displayed
on efficient and informative cost structures that are understandable from a
business point of view and are accurate from a product cost accounting
perspective.
• The company can see the effects of using different valuation techniques
on the financial accounts and year-end closing. This ensures that choices
can be made on the basis of correct information.
• Not all the divisions of a corporate group must use the same valuation
methods; each can use the ones most suitable for that division.
• Detailed costing records can be made available for each alternative or
parallel valuation of variances between planned and actual costs for each
business segment.
• The costing methods throughout the group do not necessarily depend on
the costing documentation requirements of the logistics operations.
Understanding the Role of Flexible Analysis and Reporting in Product Cost
Accounting
The structure of a report can be made to suit your requirements. The standard
system contains many predefined standard reports, which you can modify and
extend, often in the online mode. Both the format and the data are under your
control.
Orders can be grouped by order type, for instance, and line items can be selected
based on their connection to a specific cost object. Summaries and graphical
representations are available at all stages of analysis and reporting.
Cost objects can be compared, and the variances can be computed using any
dimensions for comparison, such as between orders, between periods, between
similar cost objects, and between cost objects of very different kinds.
Planning and Simulation from Unit Costing
You can apply unit costing regardless of the status of an order. This is because unit
costing is based on a quantity structure that you define manually. Some of the uses
of a comprehensive system of unit costing are as follows:
• Price determination.
• Costing to make quotes and tenders.
• Costing to support the processing of orders.
• Planning of costs and resources to prepare order and project cost
estimates.
• Making sample cost estimates for new or existing products using an
existing estimate as a reference model to be edited and updated.
• Defining sales prices for sales orders.
• Preparing, planning, controlling, and settling investments by means of
orders and projects.
• Preparing cost estimates for base planning objects, which can range from
a single-level assembly to a multilevel structure that includes other base
planning objects. A base planning object can also be an instrument for
integrating information from other non-SAP applications.
You can display the costing information before, during, and after production or
project activities, as well as before, during, and after sales activities.
In the activities of sales and distribution, you can use unit costing to good
advantage in the following ways:
• To transfer unit cost estimates at any time to reference objects such as
orders, projects, and sales orders
• To cost and check quickly the feasibility of extra sales orders (or
alternative or modified product components or characteristics) and any
changes in the activities involved
Organizing Product Cost Controlling
The role of product cost accounting is to control the costs that accrue as a result of
producing a product or performing a service. The accounting disciplines involved
in product cost controlling serve as supports to the following operational functions:
• Pricing policy elaboration
• Pricing calculation control
• Production cost management
• Inventory valuation
• Profitability analysis
The basic software functions for all these tasks are integrated in the SAP R/3 Basis
system. Additional functions are provided by the integrated FI-Financial
Accounting, CO-Controlling, PP-Production Planning, and MM-Materials
Management applications. Just how much functionality must be configured from
each of these applications depends on the structure of your company and the extent
to which you intend to operate product cost controlling.
The focus of product costing is the order-neutral costs of producing tangible or
intangible goods, such as services. Computing product costs independently of any
specific order ensures you can arrive at a standard cost estimate for each product.
This amount is often specified at the beginning of the fiscal year and then is
subjected to various adjustments that arise from profit planning to yield the
planned prices. The invoice price is the result of applying discounts or surcharges
according to the customer and the order.
The output results of product costing should include values for each product for
each of the following parameters:
• The order-neutral cost of goods manufactured
• The order-neutral cost of goods sold
• The product cost of manufacturing optimized by comparative costing
• The product price floor
Order-neutral product costing also assembles the data needed by the following
operations:
• Calculating the cost of manufacturing each product for the purpose of
inventory valuation
• Calculating the variances between target costs and actual costs for the
purposes of cost object controlling
• Analyzing profitability with contribution margin accounting
Understanding Cost Object Controlling
All the various costs incurred as the result of manufacturing are collected and
collated so that they can be associated with a suitable cost object. The nature of
this object depends on the product and the company. The choice of object must
provide for the following considerations:
• It must be possible to assemble sets of cost objects, or use a single cost
object, to determine the actual costs of each product or service.
• The cost objects must have a means to show and explain why variances
exist between the planned product costing and the actual manufacturing
cost.
• The set of cost objects must be capable of yielding meaningful and legal
values when the work is still in progress.
• It must be possible to associate the revenue arising from the sale of the
product with a relevant cost object or set of cost objects.
• It must be possible to compare the revenues that accrue to a cost object
with the actual and planned costs of manufacturing the product it
represents.
Using Cost Objects in Different Industries
All companies may at times use any of the standard or customized cost objects in
the SAP R/3 system. However, some types of enterprise tend to have preferred cost
objects.
For example, service industries tend to use general cost objects, such as orders and
contracts. Large-scale engineering companies accustomed to collating costs on cost
object hierarchies that are complex orders and that may well be managed by
projects and task networks. These are discussed in Chapter 8, “Controlling by the
PS-Project System.”
If your company specializes in products made to order, then the natural cost
objects are the sales order or the production order.
The SAP R/3 system can treat a single material as a cost object. This is not as
restrictive as it sounds because a material can be a finished product, a semi-
finished product, or even a defined unit of a service. The material as a cost object
can be found in the continuous process industry, in repetitive manufacturing, and
in order-related manufacturing, where there is perhaps a mixture of make-to-order
and make-to-stock production. The production order is a useful cost object in such
cases where an executive decision must be made on the amount to be manufactured
to cover firm orders, anticipated orders, and perhaps a reserve.
When the manufacturing process is complex and subject to many variant
specifications, the bill of materials and process routing can be represented as
master records that can then function as cost objects. The values to be assigned as
the costs of the material components of an order can be copied from the materials
master records, where they are represented as materials prices. Services are usually
valued according to the sum of the separate activities, each priced at a standard rate
that is specific to the particular cost center providing the necessary activity
capacity.
If you accept that a product costing system must be capable of assigning a value to
any product at any stage in its manufacturing process, then you must be prepared to
migrate values from one cost center to another as the work progresses. The system
integrates these value movements by means of simultaneous costing so that the
value of each cost center is accounted as the actual costs accrued in the cost objects
for which it is currently responsible.
Planning Product Cost
All product costing systems must begin by being assigned costing items. The SAP
R/3 automatically identifies any suitable items from the logistics modules. Material
consumption items are found in bills of material, for example. Activity
consumption is recorded in routings.
If they have been assigned quantities, the items are converted to corresponding
costing items. You can also define costing items from a batch input or as a result of
manual input, such as when you enter an estimate for a new order.
When you or the system identify the costing items, values must be assigned to
them. Material usage must be costed at current prices, and activity usage must be
valued according to cost center rates.
If your manufacturing takes place in several phases, the costing is carried out
separately for each stage. Unit costs at one stage are used as transfer prices to
become part of the input costs of the next step. This process is referred to as a
BOM explosion because the system treats each unit of a bill of materials as a
separate costing object that may itself contain a bill of materials to be expanded
through all the various stages of the associated routing.
Automatic costing runs are executed by the system for multistep processes. At
customizing, you determine when and how you wish to be informed of any
problems in the automatic costing process.
Understanding Costing Transfer Options
When the quantity structure of a hierarchical cost object is exploded, each cost
object might have to supply partly finished goods to the next step valued at transfer
prices. The sequence of steps can cross company boundaries. The following
possibilities are supported by the SAP R/3 system:
• A partial cost estimate can be devised, in which the semi-finished
constituents are transferred at standard prices.
• Cross-plant costing can be conducted using the existing costing of the
sending organizational unit.
• The quantity structure can be exploded and recosted across company
boundaries, as necessary.
• Cross-company transfers can be treated as purchases and handled as
external procurement.
Understanding Product Costing Variants
The various forms of costing have been developed for good commercial reasons.
They can be applied at the user’s discretion.
All products kept in stock are assigned a standard cost estimate that is valid for a
specified planning period, such as a fiscal year. This period yields a planned cost
of goods manufactured and a planned cost of goods sold. These unit values are the
same, regardless of how often they must be included in the production program or
how many are ordered by customers.
A costing lot size of the product is specified for a standard cost estimate. A
planned price for the material is associated with each costing lot size. An order
estimate computes the appropriate number of material lots needed, as well as the
planned material price. Surcharges are applied to provide for the material overhead
allocated for this amount of material.
The costs of production are calculated on the basis of the amount of activity
needed per costing lot size and the planned activity price for all operations needed
to set up and manufacture the costing lot. The production costs are often stored on
the routing document for the process.
Indirect costs can be included in activity prices, or they can be added as a
surcharge percentage of production costs. Costs of administration, transportation,
and insurance are calculated as planned charge rates using percentages, usually of
production costs.
NOTE: When the costs of manufactured goods are determined through the standard cost estimate procedure,
they are stored as standard prices in the material master records.
Using Target Costing
The bill of material and the routing for the complex production network for a
product can undergo changes as the product specification develops or as different
raw materials are used. The standard cost estimate can be updated by adopting the
previous costings and recomputing the altered elements, such as the variable costs.
This process is referred to as the target costing, and it can be compared to the
standard cost estimate to yield a variance report.
Using Current Costing by Key Dates
Goods forming part of a product can be costed using the quantity structure
associated with the product and its components. The price is obtained on a
specified key date so that the costing reflects the most up-to-date prices. Inventory
costing is an example of key date costing.
If you have been able to order the materials you need for a batch of products at
very favorable prices, you may not wish to pass on this advantage to your
customer. On the other hand, you may decide to operate with a competitive price
by specifying a key date that ensures that your key date costing calculation takes
into account your purchase of materials at favorable prices.
Some industries have established the practice of costing materials at a particular
date in the year that represents a compromise between periods when the seasonal
price of materials is higher or lower than the average for the year.
Viewing Product Costing Results
A product is often a structure made up of various levels that represent sub-
assemblies or sub-processes, all of which must be costed to obtain a true product
cost estimate. When you view the costing of a product, you might want to inspect
the data at various levels and from different viewpoints. For example, cost
components can be examined from the following points of view:
• Costs of goods sold
• Valuation of selected cost components for tax purposes
• Commercial inventory valuation
• Legal procedure for inventory valuation
Using Cost Itemization
If you want to look at the individual items in the quantity structure of a product, the
itemization function enables you to focus on cost elements and on cost origins,
such as the manufacturing operations that generated those costs. The database from
which you can draw includes for every manufacturing level all the costing items
identified in the quantity structure. This database also holds information on the
surcharge calculations and the values and parameters used by them.
If a particular manufacturing level includes a complex assembly, you can
interactively explore the costing of this structure. If you call for a cost element
itemization report, you receive a summary sorted and totaled by costing item.
If you ask for a cost component split, you can define how the summarization
should assemble the calculated costs. Up to 40 cost components can be defined.
The details of the cost origins that contribute to the cost components are
maintained so that you can inspect them for any manufacturing level.
Using Manual Input for Unit Costing
Unit costing takes place if you enter a quantity structure manually rather than
calling up a bill of material and routing. In unit costing, you develop an individual
costing spreadsheet detailing such items as the following:
• Materials
• Internal activities
• Variable items
• Surcharges
Any of the variants of product costing can be applied to a costing sheet. You can
edit the document table structure and use word-processing and spreadsheet
facilities to develop your own format for unit costing. You could use a unit costing
sheet to plan costs for orders for which there is no defined quantity structure
suitable for automatic costing.
Reference costing is a technique used in unit costing to nominate predefined base
unit costing objects. This technique enables you to carry out material explosions
when elaborating your unit costing sheet. For example, you may have a predefined
base object comprising some materials and activities, each with a quantity and a
resulting value. If you assemble a unit costing sheet and enter a line item that is a
reference for this base object, the system inserts its details in your unit costing. A
base object can itself refer to other base objects, and so on, to any level of
complexity.
If you use the Microsoft Excel interface, the results are stored in the R/3 system as
an Excel session. Through this interface, you can enter costing items and set up
calculations. If you are online with the R/3 system, you can retrieve material
masters and the standard cost estimates that they carry.
Controlling by Cost Objects
Cost objects are used for controlling purposes in three main activities:
• Preliminary costing
• Simultaneous costing
• Period-end closing, that includes final costing
Each of these activities is discussed in the following sections.
Using Preliminary Costing
If you have an order for a product for which your system carries a defined lot size
master record, you can conduct order-related preliminary costing to determine the
planned costs of the order. As soon as you identify the product, the system
provides a copy of the quantity structure of materials and activities needed to
produce it. Preliminary costing can use these quantities to assign a value to the
order.
You can also enter costing items manually or through batch processing, perhaps
through one of the dedicated costing interfaces such as the CPIC. In all cases, the
system automatically performs preliminary costing, from which you can select cost
elements or itemization for display and update.
Using Simultaneous Costing
The function of simultaneous costing is to assign values to all material and activity
use that has been confirmed as completed. This data comprises the actual costs on
the cost object and can be compared with the planned costs.
If you produce to stock and only partial deliveries have been made to stock, you
can apply the simultaneous costing procedure. This ensures that the standard cost
estimate or the planned costs of the order are applied to the amount delivered to
stock. In this way, you can calculate a value for the costs of the partial delivery.
These costs are referred to as target costs and can be compared to the actual costs
of the order when the full delivery to stock has been completed.
Using Period-End Closing for Order-Related Production
When a cost object is the focal point of controlling, the accounting period must be
closed according to a strict sequence. The sequence for order-related production,
and for repetitive and process manufacturing that is not directly related to a sales
order, is as follows:
1. Calculate the overhead on the cost object.
2. Calculate the work in process.
3. Calculate the variances.
4. Carry out settlement.
A variance is a difference between the number expected and the number obtained
from the data. For example, a variance can exist between the planned delivery date
and the actual delivery date. A production batch can include items that have
slightly different dimensions, although they all fall within the specification. A
more serious variance is the delivery of items outside the tolerances, or a delivery
of fewer items than the quantity desired. The variances must be calculated
separately for the following origins:
• Scrap
• Price
• Quantity
• Use of reserves
• Lot size variance
• Output price
Settlement is an accounting process that ensures that the value of the work done
and the work in process is credited to the proper account so that this value appears
in the financial documents. If you operate control accounts that are supplementary
to the legal requirements, the values are also posted to these accounts so that your
management can refer to them when looking for opportunities to improve the
profitability of your business. The settlement process entails simultaneous posting,
as follows:
• The work in process is posted to financial accounting.
• The work in process is posted to a profit center.
• Variance and scrap values are settled to profitability analysis.
• Variance and scrap values are settled to material or price difference
account.
Settlement can be in full or periodic. The full settlement method allows for the
total variances to be determined and settled for the corresponding cost object only
if the work associated with that cost object reaches a specified stage in its life
cycle. For example, if there is a short lead time in order-related production, it may
be sensible to delay the final determination of variances until after final delivery,
when the actual costs can be compared with the target costs of the movement into
stock. Before final delivery, the difference between actual costs and the credits that
arise from the partial deliveries is shown as work in process.
Periodic settlement entails calculating the work in process, scrap, and variances
and settling these for the corresponding cost object. This method is appropriate
when there are long-term orders in repetitive and process manufacturing. Each
period, the actual costs are adjusted by work in process and scrap costs. Then the
target costs for the movement into stock for that period can be compared with the
actual costs for the period.
Postings for work in process can be made automatically to financial accounting.
Scrap and variances are settled to inventory or price difference accounts. Standard
cost accounting ensures a statistical posting of the period costs to profitability
analysis, where the standard cost of goods manufactured and the production
efficiency are calculated on the basis of the standard cost estimate.
Using Period-End Closing for Sales-Order-Related Production
If you manufacture specifically for a particular sales order, the sequence of closing
accounts at period end follows a different logic from that applied when you
manufacture to stock in anticipation of future orders.
Results analysis for a sales order is carried out at period-end closing to show sales
revenues, costs of sales, reserves, and work in process. The sequence is as follows:
1. Post the direct costs.
2. Calculate the overhead on the cost object.
3. Calculate the work in process.
4. Calculate the costs of sales.
5. Calculate the provisions.
6. Carry out the settlement.
The settlement comprises the following postings:
• The work in process is booked in financial accounting.
• The provisions are booked in financial accounting.
• The sales costs are booked in financial accounting.
• The sales revenues are booked in invoice.
• The sales costs are booked in invoice.
• The work in process is booked in the profit center.
• The provisions are booked in the profit center.
• The sales costs are booked in the profit center.
NOTE: The revenues and costs of sales are periodically settled in profitability analysis.
Calculating Overhead Surcharges
The calculation of overhead charges begins with a reading of the direct costs of the
orders that have been previously posted. A calculation base must be defined. This
could be the production costs or the direct material costs of a specific origin group.
The calculation base can be split between fixed and variable costs.
The surcharge for overhead is calculated either as a percentage of the calculation
base or as a choice from values related to quantity. Different surcharges can be
allocated to different types of products. When the surcharge is allocated to the
product, the cost center specified on the line item of the costing sheet is
simultaneously credited, perhaps with separate values for fixed and variable costs.
Accounting for Work in Process
If the full settlement procedure is in use, work in process is assigned a value that
depends on the status reached by the order. If the order is released, the work in
process is shown as the difference between the actual costs and any credits
assigned because some of the work has been delivered. If the work extends over
several periods, the changes to stock are accounted periodically. When the order is
a final delivery, the work in process is written off.
Target costs can be involved that take account of the amount of work that has been
costed, up to the moment when the period accounting is closed. These targets are
based on the product’s standard cost estimate to which the pertaining overhead
charges have been added.
Interpreting Production Variance
Cost center accounting often reveals problems or variances of the following kinds:
• Planning over-estimated or under-estimated the actual values.
• The actual costs of a cost center do not agree with the target costs.
• The cost center is absorbing too much or too little of the overhead.
It is possible to view a cost center report showing these kinds of detail. However, it
may be very difficult to explain the variances. The following questions illustrate
the analytical gaps:
• Have wages increased, or have more wage hours been used?
• Was more spent on energy because more units were consumed or
because the price increased?
• How were the fixed costs allocated to activity receivers in the cost
center?
• In which activity types in the cost center were the largest variances
detected?
Almost all cost centers will show variances between planned or target and actual
costs. The problem is to identify the instances that should be regarded as
opportunities to make improvements.
One differentiation that you may have to recognize is the difference between cost
center input variances and cost center output variances. For example, variances can
arise from the difference between planned and actual values that appear on the
input side, such as costs and consumption quantities representing the resources
needed to produce activity. These include wages, salaries, energy, and plant
maintenance.
Understanding Standard Variance Categories
The system calculates and saves the values for the standard variance categories for
each cost element and each cost origin as part of the final costing of an order. The
following are the standard variance categories:
• Price variance
• Quantity variance
• Structure variance
• Input variance
• Lot-size variance
• Transfer price variance
A factor used in the costing process can change in price after the standard cost
estimate has been calculated. Price variance is shown as the difference in price
multiplied by the actual input quantity.
If the quantity of a factor used changes with respect to the standard cost estimate, a
quantity variance is calculated. This is the difference in quantity multiplied by the
price used for the standard cost estimate. The standard price is usually chosen for
the standard cost estimate. Quantity differences can arise because of inefficiency in
creating the activities in the cost centers so that the work is less than planned.
Activity additional to that planned can also arise if the cost center employs
processes that are less effective than planned.
When resource-usage variance occurs, such as the kind that occurs when the
activities are created by a different mix of human and plant resources from that
planned, or some other production factor is completely replaced by another, a
variance of the actual cost can arise. This is identified as a structure variance.
If overhead surcharges differ from those planned, or if there are any residual
differences that cannot be attributed to any other input variance category, the
differences are shown as general input variances.
On the output side of a cost center, quantity variances can arise if actual lot sizes
differ from the fixed lot sizes entered in the standard cost estimate. Differences
arising in this way are shown as lot-size variances.
Perhaps the cost center should be credited with a different amount because the
planned or manual allocation prices used in the standard cost estimate do not
reflect the value of the result achieved. The cost center therefore can deliver the
finished material at a transfer price different from the price established in the
standard cost estimate.
Calculating Variance Category Results
In a typical production plant, the variance calculation begins with the confirmation
of the scrap quantities and the work in process. The standard cost estimates are
applied to the scrap quantities to yield the scrap costs, which are related to the
operations in which the scrap materials were produced. Quantities are planned for
scrap for each operation, so the unplanned scrap costs can be calculated for each
cost element and for each cost origin.
Developing Target Costs
Target costs are calculated by multiplying the planned costs by the quotient or ratio
of planned to actual activity as it occurs in a cost center. Target costs therefore
equal planned costs only if the planned activities are the same as the actual
activities, in both quantity and type of activity. An alternative way of calculating
target costs is to multiply the planned costs by the quotient or ratio of the planned
quantity of goods to the actual quantity of goods manufactured in orders.
Both methods of calculating target costs use the planned costs and modulate this
figure by a factor that represents the magnitude of the changes that were not
anticipated by the planning process. One method bases the factor on activities in
cost centers; the other uses quantity of goods manufactured.
The purpose of calculating variance is to measure and explain the differences
between actual costs and target costs. Two methods exist for working out target
costs, and they can be set up as alternative target cost versions to be applied and
compared as required.
One method of calculating target costs is to apply the standard cost estimate to the
quantities of material delivered under the order. The other method is to apply the
price of the materials as used in the preliminary costing of the order and then adjust
for the quantities actually delivered.
The standard cost estimate simultaneously determines the standard price of a
material. If there is a difference between the standard cost estimate calculation for
an order and the actual costs of this order, this indicates that there is a difference
between the standard price and the actual costs. Perhaps the standard cost estimate
should be revised, or perhaps the difference is attributable to transient factors that
are expected to return to normal in the near future.
The other target costing version that uses the preliminary costing of the order can
also be used by noting the variance between preliminary costs and actual costs.
These variances represent the differences that arise during production because the
preliminary costing was carried out when the order was first opened, and the actual
costs are calculated when it has been settled. This target version is used to identify
variances and inefficiencies within the production process itself.
Yet another target costing version can be designed to use the standard cost estimate
for materials. This version adjusts the cost estimate to the costing lot size of the
order. Target costs calculated in this way can be compared with the planned costs
taken from the preliminary production order costing. Variances that arise from this
calculation represent the changes that have taken place between the estimates used
in planning and the estimates applicable when the order was released. This target
version is used to identify variances resulting from the scheduling of the order, not
those from production inefficiencies.
Using Settlement
The outcomes of settlement as a conclusion to final order costing and at period-end
closing are as follows:
• Inventory changes in the period are posted to financial accounting and
profit center accounting.
• Production order variances are settled.
Two ways exist for carrying materials in accounting to portray the value flows in
your organization:
• Materials are valued at transfer prices.
• Materials are valued at standard prices.
There are two corresponding ways of settling production variances. If the material
is carried at transfer price, any production variances are debited to material stock
unless there is insufficient stock. In such a case, the variance posting is made to a
price difference account. If the material is carried at the standard price, the
variance posting is made to a price difference account, regardless of the stock
position.
If you operate profitability analysis, production variances can be differentiated by
materials and variance categories and then shown as period costs. These values
reflect the efficiency of the cost center in handling the particular material in the
reporting period. The cost center profitability calculations are usually aggregated to
a division or business area level. See Chapter 9, “Analyzing Profitability,” for
more details.
Using Cost Objects in a Hierarchy
Cost object controlling is designed to focus on the costing of products. If you plan
the cost of your products going into stock, you can arrive at a system of target costs
for these materials. You can manufacture these products on receipt of an order. If
your production orders are per product, you can enter inward stock movements on
the same basis. You can set up activity completion confirmations and material
consumption confirmations to enable you to post the actual costs of these inward
stock movements on the basis of individual products. These products form natural
cost objects for your planning and costing systems.
Suppose that you manufacture products not in response to external orders from
customers, but in response to internal orders that maintain certain levels of stocks
in anticipation of future orders. This type of manufacturing is recognized as a
make-to-stock process.
A similar situation exists in continuous process industries, where the products are
managed as production lots, runs, or even campaigns. In this type of plant, there
might have to be a delay in posting the actual consumption of materials until after
the manufacturing has finished. Inventory differences might arise because the
actual output differs in quantity and specification from that planned. One
production line may be producing several products between which it is impossible
to allocate some of the costs. For instance, the costs of setting up and taking down
a production line of this type are very difficult to allocate if the products are to be
the receiving cost objects.
In these circumstances where the product is not really a convenient entity to treat
as a cost object, a different system must be used to associate certain actual
overhead costs with cost objects. A hierarchy of cost objects can provide a solution
to the problem of allocating actual costs meaningfully.
For example, you could have a plant that had two production lines. Suppose each
line could produce Product A. Suppose Line 1 could also produce Product B, but
Line 2 could not. You might therefore have three possibilities:
• Product A made on Line 1
• Product B made on Line 1
• Product A made on Line 2
Now Product A will not always be the same in its costing because it can come
from either of two different production lines. You must have two costing versions
for Product A. One version is to be applied to the Product A from Line 1, and the
other is for the same product made on Line 2.
A convenient cost object in this kind of situation is the run schedule header. The
production order sequence specifies the program of production order operations
needed to plan and control the production processes. It is to these activities that the
work in process and scrap data is related by the accounting procedure.
The cost object hierarchy for this illustration has the structure shown in Figure 7.1.
There are two production lines: Line 1 carries only Product 1, which is designated
as Version 1 because this product can also be manufactured by Line 2. If Product 1
is made by Line 2, it could have slightly different characteristics and may have to
be costed separately because it is manufactured in a different plant. For example,
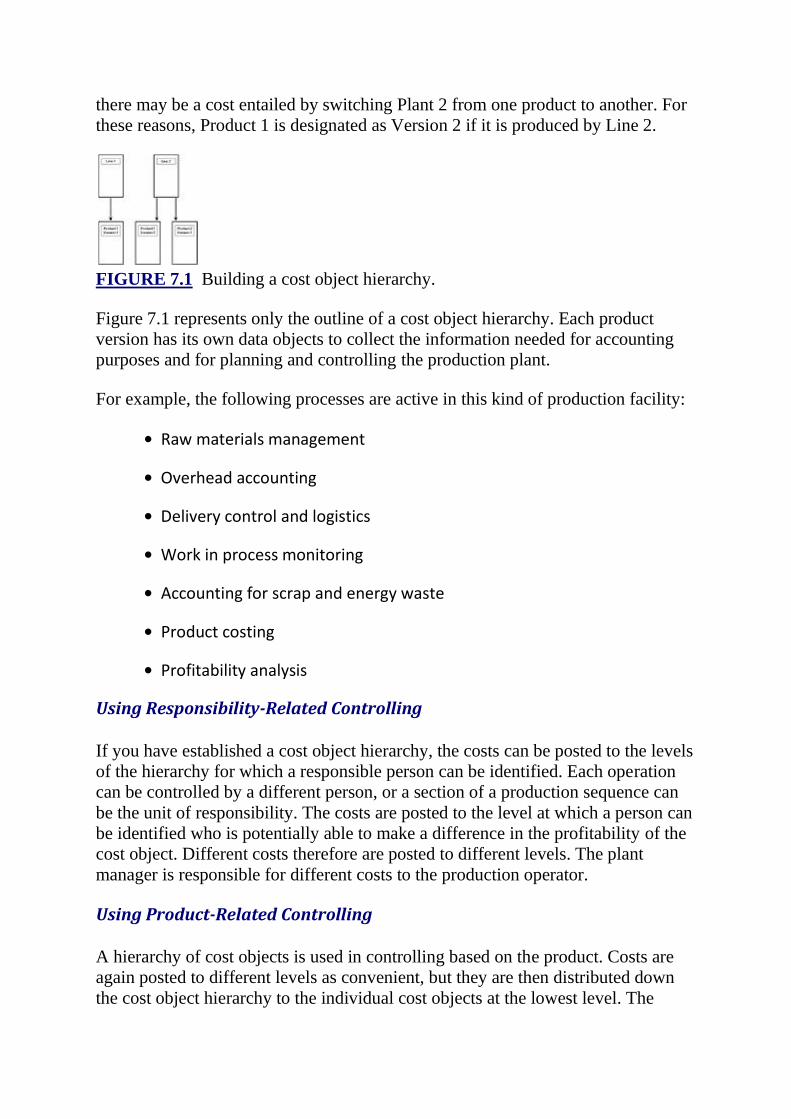
there may be a cost entailed by switching Plant 2 from one product to another. For
these reasons, Product 1 is designated as Version 2 if it is produced by Line 2.
FIGURE 7.1 Building a cost object hierarchy.
Figure 7.1 represents only the outline of a cost object hierarchy. Each product
version has its own data objects to collect the information needed for accounting
purposes and for planning and controlling the production plant.
For example, the following processes are active in this kind of production facility:
• Raw materials management
• Overhead accounting
• Delivery control and logistics
• Work in process monitoring
• Accounting for scrap and energy waste
• Product costing
• Profitability analysis
Using Responsibility-Related Controlling
If you have established a cost object hierarchy, the costs can be posted to the levels
of the hierarchy for which a responsible person can be identified. Each operation
can be controlled by a different person, or a section of a production sequence can
be the unit of responsibility. The costs are posted to the level at which a person can
be identified who is potentially able to make a difference in the profitability of the
cost object. Different costs therefore are posted to different levels. The plant
manager is responsible for different costs to the production operator.
Using Product-Related Controlling
A hierarchy of cost objects is used in controlling based on the product. Costs are
again posted to different levels as convenient, but they are then distributed down
the cost object hierarchy to the individual cost objects at the lowest level. The
allocation of costs is governed by the relative values of target costs summarized
across each level. The actual costs are distributed among the cost objects in
proportion to the target costs calculated for them.
Using Activity-Based Cost Accounting
In cost accounting terms, an activity is a process that can be counted and that
attracts costs. In business terms, a production process is achieved by a network of
activities. If you want to find out the cost of a process, you must know the
activities and the quantities of work done by each.
The purpose of the SAP R/3 CO-Controlling module is to help you plan, monitor,
and settle activity types in the accounts of cost centers.
NOTE: Activity types serve as allocation bases and are used as cost drivers to determine and send incurred
costs to receivers.
The system enables you to develop fully integrated activity costing in a controlled,
step-by-step fashion. There is an inevitable logical sequence, as follows:
1. Define the activity types of interest to your company because they add
value, attract costs, or both.
2. Specify how each activity type will be measured and what units should
be used.
3. Create a plan using your activity types and their quantities.
4. Extend the plan to include the costs that are dependent on activities and
the rates to be applied.
5. Allocate, or set up rules to allocate, activity costs for both planned and
actual data.
6. Predistribute the fixed costs, and attach a value to each activity type
that cannot be measured.
7. Determine the variances over the period, and allocate them to activities
or cost centers.
Using Activity Types and Allocation Bases
The measurement of productivity must start with a measurement, or at least a
quantitative assessment of activity. In a production cost center, there are
measurements of time required; number, weight or volume of each product; and
units finished and semi-finished. The service cost centers have records of jobs,
hours worked by each skilled trade, energy, and materials used.
Sales and administrative tasks are also becoming subject to measurement of a
nominal kind, where something that can be counted (such as the number of calls
made) is used as an index of activity. Each call entails an amount of work that can
be assessed and evaluated, at least in average terms. Depending on the type, data
on an activity typically includes information on the planned activity quantity, the
capacity, and the output quantity. Activities can be assigned to activity groups so
that you can carry out some operations on all the members of the group
simultaneously. This might be useful as you change your controlling task from
planning to allocation, to determination of cost rates, and so on. No limit in CO-
Controlling governs the number and scope of the activity groups you use.
The master record of an activity group contains parameters that you can use to
define how the group is handled. There are parameters to define the settlement cost
elements to be used in the direct allocation of planned and actual values. You can
flag particular activities as statistical, which ensures that the system adopts a
standard procedure for calculations according to the needs of the moment,
including assessment, distribution, and computing ratios for use in reporting.
Applying Internal Activity Allocation Methods
The system provides for allocating overhead costs to cost centers and business
processes. Two methods are available:
• Costs posted to cost centers are distributed to business processes.
• Costs posted to business processes are allocated to cost objects.
Using Value Accounting
The characteristic of value accounting is that costs are simply allocated from
sender to receiver without showing the underlying relationships between the
activities involved. The method is easy to implement, but it permits only limited
forms of analysis. The areas of application of this method are in cost center
distribution, cost center assessment, and process assessment.
The sending cost object does not reveal its operating rate or the extent to which its
capacity has been utilized when merely the full costs of production are posted.
Variance calculations are limited to straightforward comparisons of planned costs
and actual costs.
NOTE: One of the limitations of pure value accounting is that it is impossible to differentiate between fixed
and variable costs. Only the full and complete costs are allocated.
Using Quantity Accounting
The process of quantity accounting is more costly than value accounting because
there are more calculations to be performed and more records to be kept. Cost
centers and processes must be capable of reporting the quantities of their various
activities and the prices they are charging for them individually. This entails
detailed planning and measurement of the actual quantities. First, a quantity
structure is built to show how much of each activity is transferred between cost
centers. Then a standardized price list is applied to convert the quantity flows to
value flows.
Understanding Activity Planning and the Flow of Activities
For each cost center, you must arrive at a planned value for each activity. You
must reconcile this amount of activity with the amount of activity planned in the
logistics system. The system can assist you with this.
The CO-ABC Activity-Based Cost Accounting module differentiates three types of
planning:
• Planning statistical key figures
• Planning activity quantities
• Planning primary and secondary cost elements
A statistical key figure in planning can be simply a number for each posting period,
or it can be a cumulative number computed for each period on the basis of data. If
the cost center produces activities that are quantified, the planned or actual quantity
of output can be the basis for planning the primary and secondary cost elements.
This is because the output quantity of the cost center can be converted to values.
Given the input of primary and secondary costs to a cost center and the output in
terms of evaluated quantities of activities, you can instruct the system to compute
the efficiency of the cost center in each of its activities. The same method is used
to plan the activities to be produced and consumed in the flow of internal activities.
You then have the basis for planning secondary costs.
Understanding Simulation and the Reconciliation of Activities
The logistics plan and the controlling plan may be inconsistent, but bottlenecks and
idle production capacity can be foreseen.
Interactive activity analysis enables you to look at several activities at once to see
which have spare capacity and which are destined to be subjected to demands
beyond their capacity. You may be able to initiate a displacement of work or
resources or to replace one activity by another. The system immediately simulates
the cost effects of your tentative change of plan, which you can either confirm
when you are satisfied or store as a separate version of the plan.
Starting at any cost center, you can command a display of the activity types
received from or sent to an adjacent cost center level. This enables you to trace the
functional dependencies between individual activity types.
Using Activity-Based Cost Planning
Each activity type and each cost center can be given as many cost elements as
necessary. You can enter the planned cost elements as values or as values to be
computed at the time based on the quantities and the rates prevailing. The cost
element can be given a planned overall value or a planned quantity.
Both procedures can be carried out as full or marginal costs and can direct a split
into fixed and variable components. The system provides formulas, formal
specifications, texts, and report characteristics.
The CO-Controlling system distributes the planned values for the variable primary
cost elements for the year. You can see the effects on costs of any fluctuations in
planned activity levels. You can call for the fixed costs to be distributed using
standard rules or your own rules.
The internal exchange of activities also causes secondary costs to be incurred.
These are computed by valuing the amounts of the allocated activity quantities at
the appropriate standard rates defined in the sender cost centers. The receivers of
internal activity costs include the following:
• Cost centers
• Orders for cost centers that are overhead cost orders
• Production orders for semi-finished and finished products
• Capital spending orders for fixed assets
• Sales orders or sales cost objects
After planning values for internal orders, you might want to allocate the planned
costs to the receiver cost centers. The original producing cost centers retain the
information.
Using Political Prices
Standard prices and standard rates at which cost centers activities should be
charged are among the important results to come out of any planning exercise. The
total cost is divided by the total quantity in each case.
You may be in a business that prefers not to use the actual or historical standard
price computed as an average based on total cost and total quantity. You may have
to set rates that are determined by political factors rather than by computation.
You must enter political rates manually. You can then use them to evaluate
planned and actual quantities. The system retains an accurate representation of
internal activity cost flows and cost allocations, even if the rates are not the strictly
determined product of formal business planning.
Understanding Indirect Allocation of Costs to Non-Measurable Activities
The system has indirect cost allocation functions that you can use to allocate costs
accurately to the objects that caused them. You may be able to apply standard
methods if you can derive an index of activity to serve as a quantity to which you
can apply a rate. But the indirect allocation functions are available for times when
the most reasonable method is to assess costs and allocate them to their causes.
For example, you could set up a master record and name a cost center as Quality
Control. You could determine an hourly rate for inspection and then estimate how
many hours of inspecting could be made available from the quality control cost
center. From the logistics information system, you could obtain an estimate for the
number of items to be inspected in the reporting period, both for incoming and for
outgoing goods. The actual cost of inspection could be calculated from the hourly
rate for inspection based on using the full capacity of the quality control cost
center. You would have to modify this total by applying the ratio of the total
capacity of the center to the amount of inspecting actually needed in the period. If
you could not measure the number of items inspected, you would have to use an
estimate based on some reference quantities, such as the consumption in the period
of some measured resource thought to be proportional to the number of items
inspected.
Understanding Cost Center Variances
Variance analysis is a method of monitoring business activity. A variance is
defined as the computed difference between actual costs and planned costs, using
the following formula:
Actual cost = Planned cost plus or minus the variance
Variances can be calculated at any level:
• Cost center
• Cost element
• Activity type
Four variance factors explain why actual costs can differ from planned costs:
• Price variance, caused by differences between the actual and the
planned prices of the goods and services used.
• Usage variance, arising from uneconomical working practices in the
production process.
• Volume variance, which occurs when the planned volume is not reached
or is exceeded. This gives rise to fixed costs that are under- or over-
absorbed by the actual volume of product.
• Cost center over- or under-absorption of fixed costs, as a result of using
standard rates in the plan that differ from those applied in the posting of
actual activities, the so-called political rates. The same effects can occur if
the cost center plans have not been reconciled.
The total of these variances for all cost elements and activity types within a cost
center provides the overall variance for that cost center.
For each combination of cost element and activity type on each cost center, the
system maintains a value structure for controlling. Each of these values is split into
a fixed part and a variable part:
• Planned costs
• Target costs
• Variance types
• Actual costs
• Planned/actual usage
You can have the variances calculated and included as part of the cost components.
The formulas follow:
• Actual Cost = Planned Cost plus or minus Cost Variance
• Actual Price = Planned Price plus or minus Price Variance
• Target Costs = Actual Volume times Planned Rates
• Usage Variance = Actual Costs minus Target Costs minus Price Variance
• Volume Variance = Target Costs plus or minus Actual Activity times
Planned Price
• Over- or Under-absorption = Target Costs minus Allocated Costs minus
Volume Variance
Charging Variances
The CO-Controlling system evaluates each activity by applying the planned rate to
the activity quantity. If you have the historical variances, or if your system can get
them for you, you have the possibility of using them in a fresh version of your
plan. Similarly, if you have some way of anticipating future variances, or if you
want to conduct a what-if simulation exercise, you can create a fresh plan version.
You may want to use anticipated variances in the cost allocation process. To
represent accurately the value flow in your company, it is essential to allocate cost
center variances periodically. You can specify whether to use historical, standard,
or anticipated variances for the subsequent charging process. In this way, you can
transfer all variances directly to your profitability analysis system.
An alternative approach is to pass on usage variances to the receivers but keep as a
charge on the producing cost center the variances resulting from too little output.
These variances go to the profitability analysis system from there.
You can charge variances periodically to the following types of receivers:
• Individual cost centers
• Internal orders or projects
• Production orders, and so to the finished and semi-finished product
inventory
• Cost objects in profitability analysis
• Fixed assets
If you arrange for actual variances to be charged to cost objects in CO-PA
Profitability Analysis, you will be on the way toward creating the detailed cost
structures necessary for a system of contribution margin accounting.
Variances are posted under the system using the rules and procedures of direct cost
allocation. The system specifies the allocation cost element by its identification
code and by whether the value is fixed or variable on either the sender or receiver
object. The system also ensures that identical variance types are in use.
The effect of all these procedures is to accurately allocate all actual costs to the
precise area of the company where they were caused. This serves both the legal
requirement of external accounting and the need for comprehensive internal
reporting as a basis for controlling the company.
Using Alternative Activity Rates in Parallel
The method described in the previous section can be regarded as an imputed
allocation approach: Cost centers accrue costs because of the activities they
undertake and the overheads they enjoy. The CO-Controlling system also operates
a system of parallel activity rates that can provide a family of alternative
evaluations relevant to various accounting purposes.
At the cost element level, you can put together a portfolio of costs to be included in
an alternative activity rate for each cost element. If these rates are used when
calculating internal activity flows, you can produce cost estimates that conform to
all legal and tax regulations for which your portfolio is correct.
These calculations lead to the derivation of the balance sheet and profitability
analysis. You can compare costs of sales and total costs of production, both
estimated and as they appear in the external financial documents.
Using Activities and Services Costing
By looking more closely at the way they produce their goods and services,
companies have made extensive improvements. The need exists for a system of
structured overhead costing. The first thing to do is to identify and define the cost
drivers, which are the factors that can be used to influence how activity costs are
allocated to the cost centers that generate them.
The cost driver is a subprocess that can be measured for individual cost center
activities, such as the following:
• Number of purchase order items successfully processed
• Number of quotation items
• Delivery items in sales
• Dunning operations and payment differences handled
Subprocesses are grouped together into primary processes that can be addressed by
the product costing system to determine the costs of administrative and service
activities. You will discover what each subprocess costs and can initiate an
activity-based profitability analysis.
Planning and Simulating the Subprocesses
The basic disciplines of activity-based accounting must be applied to ensure that
the activities at a cost center are integrated with the accounting and controlling
systems. However, there is a further level of detail to be considered if activities are
to be analyzed into their constituent subprocesses.
A business process can be represented by a chain of activities and products or a
network of such chains. In the SAP R/3 system, this chain or network is managed
by a process sequence structure, which can be of any complexity. The process
sequence structure can be used to simulate the flow of material through a sequence
of activities that create perhaps a series of semi-finished products and that
terminate with the finished product. The SAP PP-Production Planning module
specializes in this work.
The system of costing based on a process sequence structure requires that all the
processes and subprocesses be quantified in terms of quantity and value flow. This
is so that analysis and reporting can occur at a level of detail that yields a balance
of activities. Such a process documents the ways in which the activity level of the
parent cost center exerts influence on the costs of the primary processes and their
subprocesses. How do support costs alter when business gets better or worse?
Using Process Cost Rates
The purpose of applying the methods of activity-based costing to the detailed
processes and subprocesses of a production company is to compute process cost
rates. How much does it cost to put one invoice item through the office? How
much to move one pallet from production to warehouse?
If you have process cost rates at this level of detail, you can take a standard costing
based on a bill of materials and routings, for example, and cost each of the
processes entailed. You can also have the SAP system do it for you.
If you have these process cost rates for all the subprocesses in each activity type,
you can transfer the process costs from CO-CCA Cost Center Accounting directly
to CO-PA Profitability Analysis.
Because you have the process costs associated with each activity embraced by CO-
CCA Cost Center Accounting, you can include these process costs in the value
flow patterns that are identified by both Product Costing and Period Costing.
Using Internal Order Accounting
The CO-OPA Order and Project Accounting module is specialized in the tasks of
planning, monitoring, and settling the activities, services, and processes that take
place as the result of internal orders and projects.
The distinguishing feature of CO-OPA is its capability of settling in detail the
actual costs according to rules particular to each item. The system also has the
following important capabilities:
• Planning is available for all resources and costs required, in quantity and
value.
• Charges can be computed from prices at the time, with imputed
allocations of overhead and actual costs.
• Open items (commitment items) for purchase requisitions, purchase
orders, and material reservations are closely monitored.
• All cash-related procedures, such as down payment requests and down
payments, are displayed.
• Order reports are evaluated and analyzed concurrently.
The purpose of internal orders is to monitor costs to assist in decision making and
to manage the allocation and settlement of activity costs to target objects, including
FI-GL General Ledger accounts. Projects can also be used for these purposes.
Complex projects are discussed in Chapter 8.
Internal orders are usually defined for a particular task, event, or internal change
measure that must be planned, monitored, and settled in great detail. These orders
are distinguished by their origin and by the time allocated for their completion.
They vary in their settlement arrangements and in how they appear in the reporting
functions.
SAP R/3 classifies internal orders as follows:
• Production-related orders used in Logistics
• Sales orders used in SD-Sales and Distribution
• Internal orders used in CO-Controlling
Although the internal orders of the Logistics modules and the SD-Sales and
Distribution component serve mainly to monitor resources used and sales achieved,
they also document estimated costs, actual costs, and revenues. In the PP-
Production Planning and Control modules, the order has the job of annexing
information on the latest estimate of costs until the actual costs replace them when
the order is complete.
Sales orders that document costs and revenues are accessed by the CO-PA
Profitability Analysis system. These sales orders also carry the information needed
by CO-Controlling and PP-Production Planning and Control, for example. The
orders for processing and settling internal costs usually support the integration of
different business systems with the ways the particular company likes to do
business and settle the costs.
Internal orders in CO-Controlling are differentiated by the following
characteristics:
• Whether logistical, controlling, or settlement is the main function
• The content of the order, such as product or project
• Whether the item is an individual order or a standing order
• The significance of the values on the order, such as plan costs, actual
costs, or variances
• The settlement receiver for the order, such as fixed asset account, cost
center, cost object, project, stock, business segment, sales order, or FI-GL
General Ledger account
An important feature of the CO-OPA Order and Project Accounting component is
that you can assign the relevant costs on each of the orders and projects to the
various receivers, split by period and allocated accurately by cause. The costs can
be used for both overhead cost controlling and production controlling.
If you wish to have an internal order that is a simple single-level project used only
in the CO-Controlling system, the system invites you to specify how you want to
monitor it and settle the costs incurred.
Integrating Order and Project Accounting with Asset Accounting
If you are managing fixed assets such as buildings and machines, the settlement of
capital spending orders is of crucial importance. The CO-OPA Order and Project
Accounting module offers detailed settlement rules and a close integration with the
FI-AA Asset Accounting system to yield the following advantages:
• Settlement of costs to the appropriate balance sheet accounts under the
heading of Assets Under Construction (AuC) while the capital spending
order is ongoing
• Order-based display of special depreciation for AuC
• Recognition of subsidies, grants, and down payments
• Partial orders settled over a hierarchy of orders
Because all costs are based on unified posting and settlement rules in the SAP R/3
system, you can allocate costs from orders and projects to the various target objects
using the same rules or rules that you specify separately. You can keep track of
complex overhead costs with maintenance and capital spending orders.
The distinguishing feature of the SAP module CO-OPA Order and Project
Accounting is its capability of settling in detail the actual costs according to the
individual rules for each item. The following must be specified:
• The target object(s) defined as one or more fixed assets in FI-AA Asset
Management
• The date of the settlement
• The scope of the costs to be settled
• The settlement cost element heading
• The supplementary information
The system also has the following important capabilities:
• Planning is available for all resources and costs required, in quantity and
value.
• Charges can be computed from prices at the time, with imputed
allocations of overhead and actual costs.
• Open items (commitment items) for purchase requisitions, purchase
orders, and material reservations are closely monitored.
• Display is possible for all cash-related procedures, such as down payment
requests and down payments.
• Concurrent evaluation and analysis of order reports can be performed.
Using Planned Cost Schedules
Costs and deadlines on orders and projects that take a long time to complete are
constrained by the financial facts of life. Money is not always available when you
need it. Financial and liquidity planning must know what costs are expected on the
orders and projects. It helps to have some idea of how the costs are likely to be
incurred over the first few accounting periods in detail—and in broader terms
thereafter up to the date of completion.
A cost schedule is a plan, extending the length of an order or project, that shows
the values expected to be allocated to costs. The schedule has a key date. Until this
date is known and entered on the plan, the forecast of costs must be moved ahead
to the best estimated date.
The SAP R/3 system provides support to the EC-Enterprise Controller in the
following ways:
• The system automatically determines the tasks from the planned start
and finish dates for the order.
• Cost distribution across the schedule can be suited to the specific order.
• Graphical representations of the data model are readily available online
and in print.
If you have carried out cost element planning or created a unit costing for the
order, the system can use this information to develop a cost schedule.
A costing system uses a set of costing objects, which are the different products,
production and other orders, resources, and so on. The only qualification for a
costing object is that it can be allocated costs that mean something when they are
totaled under the heading of that costing object. The costing objects can be
conceptual or tangible, organizational or geographical.
The pivotal concept in costing is the structure of cost drivers, or cost objects onto
which the actual costs are settled according to how they were incurred. SAP R/3
CO-Controlling pro-vides a range of model structures on which you can base a
structure specific to the needs of your company.
Understanding Order Data Formats
The master data record for an order comprises the order number and the parameters
for controlling the business and technical system functions that deal with it. You
are authorized to use a certain range of order numbers; otherwise, the system
assigns the number.
The order master bears control data to signify the transaction groups in which it
can take part. For example, an order type Planning allows the entry of information
such as primary costs and overhead costs for planning purposes only.
The order master also includes parameter fields to organize overhead components
and to control the settlement functions. Some orders have the function of
monitoring all open purchase orders, for example; others are intended for the
detailed settlement of individual cost items.
This system of order parameters set into the master records enables you to establish
a suite of order types. These order types can be used to nominate the manner in
which each order directs the value flow in your company along the lines already
defined by your organizational structure and the way in which your company
chooses to group its business functions.
Managing the Status of Orders
The status of an order is the stage it has reached in its life cycle. The SAP CO-
OPA Order and Project Accounting system is particularly flexible because it
enables you to decide what should happen at each stage and, indeed, through which
stages a particular type of order should proceed through its life cycle on its way to
completion. For example, you can choose where to have the system plan primary
or secondary costs for each order.
The typical status sequence for an order encounters the following stages:
• Order opened, basic data identified
• Planning primary and secondary costs
• Released for posting
• Execution
• Technical completion
• Accounting completion
Some of these business functions can operate across more than one status. You can
permit planning information to be added to an order while it is being executed, for
example.
Classifying Orders by Content
Because they are treated differently, orders are classified by their content and
controlling objectives into various types. Job orders collect and analyze the
planned and actual costs for a commodity or operational event that will not be
capitalized, such as minor repairs or staff training. These orders are settled on the
objects that caused them, by means of the periodic cost center accounting
procedures.
Capital spending orders on the fixed assets produced in-house and on maintenance
costs serve to manage the planning and allocation of costs over the lifetime of the
order, which can be an open order.
Production orders are used to gather primary costs from FI-Financial Accounting
and secondary costs from overhead assessment. Activity costs come from internal
allocation. Issues of raw materials and semi-finished materials are notified from
MM-Materials Management. Production orders in Logistics use bills of materials,
routings, and cost centers. They are fully integrated into the overall capacity
planning and monitoring functions.
Sales orders can have posted to them any type of cost and revenue items taken
directly from SD-Sales and Distribution. These can be transferred directly to the
appropriate business segments in CO-PA Profitability Analysis.
An individual order is typically unique and of long duration. The quantity
structures are seldom fully known at the start, so planning is carried out in stages.
Where an individual order entails multilevel production processing and a complex
web of activities, partial orders can be created. The SAP R/3 Project System is
specialized for this kind of work in make-to-order production.
Standing orders are used when cost centers must be split into smaller activity units,
such as small repairs, minor maintenance, or individual vehicles in a company
fleet.
Statistical orders are used to receive additional account assignments for the
purpose of summarizing, sorting, and displaying cost objects according to specific
criteria. The amount posted appears under the original cost element heading on the
appropriate account and again on the statistical order. Revenues can also be
collated by a statistical order.
Planning Orders
You can plan the overall value of an order. You can also plan according to the cost
elements and activity types, either on the specific order or by transferring the
values from a unit you have already costed. The following cost elements and
activity types are amenable to planning on orders:
• Primary costs by cost element or cost element group, in values or in
quantities to which the system applies cost rates at the time
• Cost center activities as the secondary costs, planned down to the level
of individual operations if necessary
• Overhead, planned using the overhead application functions
• Statistical key figures, to be used to form business ratios when reporting
Distribution keys provide a choice between planning orders on a yearly basis with
a standard distribution across months, and planning for each month separately.
Order groups can be assembled for overhead calculation, planning, and reporting.
The functionality and screens used in CO-CCA Cost Center Accounting can give
planning views of your flexible combinations of planning objects and planning
content. For example, you can call for planning views on all or any of the
following situations:
• Many cost elements on a single order
• Many cost element groups on a single order
• Many cost elements on an order group
• Many cost element groups on an order group
Whatever planning steps you take, you can store in the system a choice of standard
explanatory texts with additional information to document your decisions.
If a long time elapses before the order is executed after planning, the assumptions
on which the plan was built could become out-of-date. Each plan is noted as a new
version whenever you change something so that subsequent analysis presents an
accurate picture.
If a plan has already been released and changes must be made, you can instruct the
system to document the entry of the modified order plan and the changes made to
it, in the form of a copy of the plan line items that have been altered.
Using Open Items
If you want to place a reservation on a certain quantity of material, or if you still
have a commitment to pay for an external service on a specific order, then you
enter an open item. In the display, open items appear as values and quantities under
the appropriate cost element heading in the correct fiscal year and in the period that
includes the planned supply date.
Open items can arise through purchasing in the MM-Materials Management
system. If the invoice has been received, the open item can be evaluated from the
actual prices; if not, the anticipated price must be used. Delivery costs are
displayed separately so they can be evaluated in the appropriate currency for the
place where each cost element was incurred.
Material reservation in MM-IM Materials Management, Inventory Management
creates an open item that is evaluated at the carrying price. You can also generate
an open item manually in the form of a funds reservation.
As you reduce an open item, the system helps you manage it using the original
currency. Analysis and posting can take place under the system rules for foreign
currency and its exchange.
The aim is to replace each open item on an order with the corresponding actual
costs. If an open item concerns external services, the system reduces the purchase
order by value using the invoiced amount, whether full or partial. The system
identifies any price differences by account and by order.
If an open item is a goods purchase order, the system automatically reduces the
quantity and the value for the open purchase item as soon as the goods are
received. If the invoice is received before the goods, the system adjusts the open
purchase order by adopting the invoice value in place of the purchase order value.
If any amounts on the invoice or on the services received remain unsettled, the
order stays open until they are finally cleared completely.
The order number and the posting details are retained when an order progresses
from one business transaction to the next. As a result, the system can document the
purchase order history, which enables you to trace a partial delivery or a partial
invoice to the purchase order and then back to the original purchase requisition.
NOTE: Open item management illustrates the close integration of Logistics and Accounting in the SAP system.
Using Actual Cost Accounting Transactions
Every SAP transaction generates an SAP document. If the document contains a
posting to an order number, the CO-OPA Order and Project Accounting system
charges the amount to the order under the relevant cost element heading and with
that order number. You can trace the history of origin of each line item throughout
the lifetime of the order.
Activities must take place so that production orders, maintenance orders, and job
orders are fulfilled. These activities are the responsibility of one or more cost
centers. For each of these activities, the responsible cost center demands payment
in the form of an internal cost allocation.
The CO-Controlling system evaluates the activity quantity at the appropriate rate.
At the same time, line items are created to document the flow of value from the
producing sender objects to the receiving objects. These take the form of a credit to
the sending cost center and a debit to the receiving order. This is the process of
direct internal cost allocation.
If the activity is not amenable to quantification—if you cannot say exactly how
much of the item is needed for the order—you must use indirect cost allocation, in
which a periodic total is shared in some way between the receiving cost centers or
orders.
Overhead is a charge that should be allocated as accurately as possible to the items
that must share its burden. This distribution is discussed in the section on CO-CCA
Cost Center Accounting.
Settling Orders
Order settlement is the process of passing costs from the originating order to other
cost objects. Two groups of these target objects exist: internal postings within CO-
Controlling, and external postings to the accounts managed by FI-Financial
Accounting and other applications.
Internal postings settle orders automatically using CO-CEA Cost Element
Accounting. This component creates the necessary credit and debit line items for
any of the following objects:
• Cost centers
• Internal orders
• Projects
• Business segments
• Sales orders
Orders can be settled by postings to external objects using the following functions:
• FI-AA Asset Accounting, for assets under construction or capitalized
assets
• MM-Materials Management, which settles any product manufactured in-
house to inventory under the material number for a warehouse
• FI-Financial Accounting, which can settle orders to the appropriate FI-GL
General Ledger account
Knowing Settlement Rules
Each order master includes a data element that determines the settlement rule to be
applied to that order. The rule includes the following control parameters:
• Period of validity for the settlement rule.
• Target object or objects to which the costs are to be sent—for example,
if part of the costs of the order will be capitalized and the rest distributed
between certain cost centers.
• The cost element or elements under which the order value is to be
credited. Using cost element groups results in a debit to the receiver under
each element.
• Settlement of costs to a cost element within the CO-Controlling system.
The settlement rule can be a defined debit to the receiver. Several receivers can be
targeted in proportions calculated from equivalence numbers or percentages.
Absolute amounts can be settled, or costs can be based on quantity—the system
uses the rate current when the settlement is performed.
If the order includes information on a suitable target object for settlement, such as
a responsible cost center or a related project identification, the system operates a
default distribution rule generated on the basis of this information. Orders that
allocate costs to cost centers tend to be settled periodically; capital spending orders
are settled at period-end after the project has been completed.
Orders to be settled can be grouped according to the following criteria:
• Order type
• Date when the settlement is to be performed
• Receiver of the settlement
• Corporate or company code
• Settlement to internal or external accounting system
You can create a settlement simulation list in the CO-OPA Order and Project
Accounting system using the allocation groups to check that the orders are both
correct and complete. When the simulation is correct, you can use the list to
execute the settlement. You can reverse a settlement made previously and repeat it
at any time.
The system calculates the total settlement and the individual amounts debited to
each receiver in the controlling area currency, from which you can convert if
necessary. The settlement function differentiates between debiting the full costs of
an order and debiting only direct costs. You can have previously distributed fixed
costs in CO-CCA Cost Center Accounting, in which case this is provided for in the
value flow.
NOTE: The order reporting system shows you the settlement history, which comprises the dates and details of
the amounts already settled, any reversals performed, and the balance remaining on the order.
Using Order Summary Evaluations
If you want to compare two or more orders in detail, you may find it helpful to
have the system classify orders using a hierarchy. The CO-Controlling system
enables you to put any criterion at the top of your hierarchy and any other criteria
at each level below. You might ask these sorts of questions:
• How do the various companies in this group compare across these
functions: repairs, advertising special campaigns, and so on?
• How do the various companies in this group compare, for all
departments and all production orders?
These criteria together create a hierarchy over which the system can collate the
data, in this example, for all production orders. The SAP R/3 flexible reporting
functions enable you to view this data at any level of your hierarchy and to switch
readily from one viewpoint to another.
In fact, the system offers a complete system of order reporting, from line item up to
order, cost center, controlling area, and company. The online reporting techniques
enable you to take any summary and drill down to the details of the order items
that contribute to it.
Using Cost of Sales Accounting
The cost of sales accounting method using standard costs to produce interim
reports enables you to look at any market segment immediately, without waiting
for the actual data to arrive.
The market-driven needs of sales management dictate that the system be capable of
estimating profits in the short term by using interim reports based on standard
values and imputed costs. These interim values are derived from standard
manufacturing costs with cash discounts and rebates because the actual data is not
available at the time the billing document must be issued.
When the actual data arrives, the interim reports are usually reconciled with it on a
period basis to yield the cost of sales accounting using actual costs (reconciled
reports). Because of the lag in time, these reports are not so useful for managing
the sales activities; their function is more to document and summarize.
Chapter 8
Controlling by the PS-Project System
In this chapter
Defining Projects
Setting the Project Trajectory
Using Different Project Views
Placing the PS in the Organizational Structure
Planning in the PS
Understanding Project Budgeting
Executing a Project
Using the Project Information System
Defining Projects
In the context of business data processing, a project is a complicated plan to
accomplish something that cannot be managed as a single order. (Sometimes
single-level projects can exist, however.) Project management includes monitoring
the progress of the work and settling the costs when the procedure is finished. A
successful project is distinguished by carefully planned objectives, efficient
execution of the plan, and a prudent control of resources.
NOTE: When a project lasts across several accounting periods, the costs are settled in each accounting period
for those elements of the work that reached a certain milestone stage.
The purpose of the R/3 PS-Project System module is to manage efficiently all the
stages of a project, from planning to completion. The efficiency comes from
having the right information available when it is needed, as well as implementing
an automated data processing routine to deal with it.
Five types of projects contribute to the definition of what functionality is required
of a project system. Though each of the following project types are specialized,
they are not specific to any one industry or field of business:
• Research and development
• Engineer-to-order manufacturing
• Investment programs
• Maintenance projects
• Information technology projects
Each project proceeds along a trajectory, a path of activities that consume
resources, until the purpose of the project is achieved and reported. At each stage,
SAP R/3 standard business functions are organized in support by the R/3 PS-
Project System. The system is fully integrated with all other SAP R/3 applications.
Setting the Project Trajectory
A project plan can be developed in detail at any time after a master record is
created to identify the project. You can begin with a simple list of key events, or
you can copy a project structure from one already in your implementation.
Although some the stages of a project can be abbreviated (and some extended)
according to the nature and complexity of the endeavor, it is usually possible to
discern phases or groups of tasks, especially if the R/3 PS-Project System is at
work. The following sections indicate what is achieved at each phase. Later
sections discuss the individual functions.
Performing General Planning
Rough-cut general cost planning usually begins a project and aims to set times and
values against a work breakdown structure, or at least a listing of what must be
done. The first draft of a work breakdown structure (WBS) can be arranging the
list of what must be done so that the elements are arranged in sequence (if that is
how they must be performed). If some elements can be performed in any order as
long they are all completed before a particular task begins, then this can be shown
in logical or tree diagram form. The PS-Project System provides graphical help for
this purpose.
Each task in a work breakdown structure is represented in the SAP R/3 system as
one or more of the following types of WBS elements:
• A planning WBS element that contains the planned values for the actual
costs
• An account assignment WBS element to which actual costs are posted
• A billing WBS element to which revenues are posted
A WBS element can be associated with a specific organizational unit, such as a
plant or business area. If you do not explicitly make this assignment, the PS system
uses the organization data from the project definition.
If a WBS element is associated with a particular piece of equipment or a functional
location, such as a workplace, you can record this as an assignment to the element.
This could then be used for plant maintenance according to the scheduled time or
work quantity performed at the location.
As soon as a plant is identified, the person responsible is identified. But you can
also define the areas of responsibility and the responsible people for the elements
of a work breakdown structure. The system also provides user-defined fields in
each WBS element record that you can use for your own purposes.
Performing Detailed Planning
The details of a project are subject to fine planning, which may utilize cost element
planning or unit costing methods. You may use manual entries for critical dates,
although the system may be able to carry out automatic detailing of activities if
they have been used previously. The R/3 system will look after scheduling and
highlighting of time-critical activities as soon as the requisite data is available.
Coordinating Resources
System support for coordinating resources is provided by the following:
• Purchase requisitions and materials reservation plans produced
automatically under control of the MRP-Material Requirements Planning
module.
• Inventory management.
• Network planning of capacities, materials, operating resources, and
services. Particular people defined by their experience or qualifications can
be located through the HR-Human Resources application.
NOTE: R/3 Release 4.0 provides you with the facility to specify a dynamic agent. This agent is specified in a
master record as an organizational object that is authorized to execute a particular workflow task. Depending
on the task, the agent can be an organizational unit, a user, a job, a position, or a named employee.
Supervising Projects
System monitoring of materials, capacities, and funds takes place as the project is
approved and executed. Material availability is checked as soon as your customer
places an order. Capacity planning is supported by a capacity planning table that
displays any schedule delays, bottlenecks, or overloads. You can initiate corrective
measures interactively with this display.
A budget management component supports approved and released project budgets,
funds commitments, and assignments to projects. This component checks the
availability of funds and transmits an alarm to the project manager if any problem
is foreseen.
SAP Workflow is integrated with the Project System so that you can keep all
departments in touch with the progress of the project and any changes made to it.
The actual values from Accounting, Purchasing, Inventory, and Productions are
written directly to the project records. You can arrange for the values to be
assigned to the appropriate WBS element and to the network display records for
such transactions as the following:
• Postings
• Purchase orders
• Material movements
• Production orders
• Plant maintenance orders
Closing Projects
Project closing entails the following actions:
• Revenues from sales orders are automatically written to the project from
the SD-Sales and Distribution application when they occur. The interest is
calculated as part of the closing procedure.
• Results are analyzed up to a specified date.
• Settlement takes place by settling all or some of the incurred costs to
one or more receivers, such as cost centers, fixed assets, or objects in the
financial statement.
During the results analysis, the realized revenues are compared with the accrued
costs up to a specified date. The outcome of the results analysis can be written
automatically to the profitability analysis. At this time, the system posts values to
the appropriate balance sheet accounts for works in process, bad debt provisions,
and any other provisions you have specified.
The control panel for the project system is really the Project Planning Board
display, which the user can configure for each project. The control panel adopts the
standard planning board graphical symbols and is virtually unlimited in the number
of elements and the time periods represented.
The PS information system is provided with open interfaces to Microsoft Word for
Windows and Excel to enable you to perform word processing and spreadsheet
operations to analyze project results. You can also manage projects in conjunction
with Microsoft Project and with communication links that can confirm actual
project data.
Using Different Project Views
Within an organization, each functional department looks at a project from a
different point of view. Each specialty may need a different selection from the
project information. However, with an integrated system, when somebody enters
data, everyone else may utilize it. The project system can filter out data to suit each
type of user.
Using Sales View
The sales staff focuses on the customer order and the sales cycle, from inquiry to
quotation to sales order, billing, and delivery notes. Values, dates, and quantities
are obviously important. The customer is the object of attention. Technical
documents and specifications could be as important as costings, prices, revenues,
and cost elements in accounting. Commercial practice controls inquiry processing,
quotations, order processing, delivery documents, and invoicing. These events can
be seen in the sales view.
The work breakdown structure and the networks can easily portray the internal and
external structure of a sales order and can provide you with data objects to which
you can assign planned values as and when they become available. All the pieces
can fall into place automatically as soon as the customer places an order, even if
the details must be added later. You can check the availability of materials
immediately and make plans against which to monitor material requirements and
stock levels. The system enables you to conduct materials requirements planning
and inventory control for individual sales orders, if necessary.
Using Manufacturing View
Manufacturing operates with planned orders and production orders in conjunction
with bills of materials, plants, work center hierarchies, and production schedules.
These are the entities of the PP-Production Planning and Control application with
which the project system is fully integrated.
You can allocate planned orders and production orders to specific WBS elements
or to network-level activities, as appropriate. You then have two options. You can
analyze data from a project view using the project hierarchy and network activity
cost objects, or you can take a manufacturing approach to analyzing data.
The cost objects of the manufacturing view are taken from the logistics
applications. They include plants, work center hierarchies, and production
schedules. Costs and dates are important, but so is the availability of production
resources according to the scheduled requirements. External resources may have to
be employed.
The production manager can call for a different format for the project planning
board display. The analysis of results might also take a different layout from the
analysis used by the sales view because inputs capacity planning and costing arise.
Capacities represent the capability of a work center to perform a specific task.
They are differentiated into capacity categories and are arranged hierarchically.
The same capacity can be available from more than one work center.
When the project system is in operation, the work capacities needed by projects
must be scheduled in addition to the other work going on in the plant. This
integrated function is an important part of production capacity planning activities.
Using Materials Management View
The materials manager must manage vendors and manage inventory. The project
manager must meet target dates and stay within budget. The PS can support both
interests in the following ways:
• Materials with long lead times can be ordered by preliminary orders.
• Materials requirements can be processed with strict dates.
• Stock required in the project can be monitored at appropriate intervals
independently of the main inventory management.
• Costs can be subject to continuous updates to maintain accurate values
for the commitment of funds.
Linkage occurs through the materials elements of a project to the functions of the
MM-Material Management application. These include material requirements
planning, inventory management, and purchasing. In particular, the MM functions
can support the project system by carrying out the following tasks:
• Processing inquiries and requests for quotations
• Processing quotations by vendors
• Assigning prices to vendor quotations
• Selecting vendors on price and delivery performance
• Processing purchase orders
• Processing goods receipts
• Verifying vendor invoices
• Managing the project inventory or the general inventory
The standard Material Management functions enable you to inspect the values
assigned to the project elements, so you can selectively focus, for example, on the
MRP controller, the purchasing organization, or even on the specific storage
locations holding the project materials.
It may be the practice to manage your supply chain through electronic data
interchange to include suppliers of your materials outside your company. In such
cases, your project identifies the contracts and scheduling agreements and has them
built into the work breakdown structure and the networks so that proper control can
be exercised.
Using Finance View
The control of cash flow is important in project work because large gains or losses
accruing on interest payments can seriously affect the profitability of the project.
Incoming and outgoing payments can be planned manually because purchase
orders assigned to projects or down payments negotiated with the customer are
documented in the master records to indicate the payment dates.
The CO-Controlling application maintains a system of commitments that is the
equivalent of the General Ledger accounting in financial accounting. A
commitment represents a contract or schedule that is in the planning stage but is
not yet represented in financial accounting. The commitment provides a method of
recording activities that will lead to actual expenditures in the future. These
anticipated expenditures can be analyzed for their effects on cost and for their
implication on the future financial situation. For example, a purchase order that is
intended to replenish materials at a cost center can be managed as a commitment in
the CO system. If you have materials reserved for a specific order or project, they
too represent a commitment and can be managed as such.
Incoming payments can be fed automatically to the commitment items, but
outgoing payments must be planned manually. The project system derives such
expected payments automatically and writes them to the project on the expected
date. You can include interest calculations in the project plan. The PS posts the
values to the Cash Management and Forecast module of the financial accounting
system.
Actual payments and down payments from the customer are recorded in the project
records. You have the option of including the imputed interest value directly in the
project result calculation.
Using Controlling View
The CO-Controlling application maintains a database for controlling purposes that
is shared by all the applications integrated with it. The controlling database holds
planning and actual data that originates in the CO, FI, SD, PP, MM, and PS
applications. The controller can view the latest information on such key activities
as the following:
• Down payments
• Payments
• Material requirements
• Reservations of stock
• External processing
In accordance with standard SAP practice, the controlling view of a project can
activate filtering to focus on different areas of responsibility in the organization,
such as controlling departments, controlling areas, overhead allocation structures,
and cost center hierarchies. Of course, the controller can also focus on project
specifics by referring to the work breakdown structures.
Using Capital Investment View
A project can be seen as a scheme of work and as a controlled consumption of
resources. You may prefer to look upon it as an investment of capital on which you
are looking for a profit. Each phase of the project can be treated as a capital
investment in its own right.
The management of capital investments is discussed in Chapter 11, “Managing
Investments.” If you have established a capital investment program, you can use
the PS to total planned values for new projects and then direct them to suitable
places in the program.
The capital investment program assigns budgets to appropriate accounting periods.
These budgets can then be distributed top-down to projects awaiting approval. The
system automatically ensures that the budget framework as approved in the capital
investment program is not exceeded.
The annual plan values for projects that have been applied for and for projects
already running can be totaled to create an annual expenditure budget. If you are
operating with annual budgets from the capital investment program, the system
automatically allocates them to the individual projects.
TIP: One way to monitor current expenditures is to compare the programmed budgets with the project’s
actual costs in a standard report designed for this purpose.
Your project may attract investment subsidies. These can be entered as project
preliminaries. Support work for pre-investment management decision-making
generally makes use of the following system faculties:
• Document management
• Personnel management for the assignment of project staff from SAP R/3
Release 4.0
• Pre-investment analysis
• Project control by status key definition
• Workflow links with work centers and accounting
• Workflow links with project approval management
Before a project is approved, it may probably be helpful to consider how the assets
created will depreciate over their anticipated life cycle. The first simulation of
depreciation can start as soon as you have a project cost estimate and a planned
start-up date. The result may well influence the assessment of the economic
feasibility of the project.
If you are running the FI-AA Asset Accounting module, you can review approved
capital spending projects in the depreciation forecast list. These planned
depreciation values are automatically transferred to cost center accounting.
Assets under construction can be displayed in the balance sheet accounts through
the project system. The following facilities are available:
• Displaying the asset history sheet
• Calculating special depreciation for tax purposes
• Displaying the status of capital investment grants
• Computing valuation amounts, using different valuation rates as defined
in the valuation areas of AA-Asset Accounting
• Excluding from valuations those costs or cost portions that cannot be
capitalized
• Transferring assets while still under construction
• Retiring assets while still under construction
The project system enables you to analyze the origin of any cost element of a
completed asset back to the original project document. The capitalization of
completed assets can be partial or complete, and you can control this at the
summary level or on a line-item basis.
Using Profitability View
Current customer projects can be subjected to profitability analysis so that you can
inspect a concurrent profitability forecast. This is based on the expected time series
values for costs of sales or works in process. With this feature, you can determine
how the values are derived for the billing plan, for example, or you can reference a
plan of how the costs are expected to be incurred. You can also construct a forecast
to show the development of costs as the project progresses through various
percentage-completed stages.
NOTE: Alternative profitability analysis versions can use planned and actual values.
The concurrent profitability forecast using actual values usually occurs at period-
end closing and can use any of the following procedures:
• Completion based on actual costs
• Completion based on calculated percentage of completion
• Revenue-based results analysis
• Manual completion based on actual line items
The results of concurrent profitability analysis can be stored in any degree of
detail. You can maintain financial statement versions for a project so that you can
compare different accounting procedures. This could be useful if you need to
differentiate the effects of including or excluding internal fixed price agreements,
for example.
Using Enterprise Controlling View
The project system can support higher-level enterprise controlling by posting data
to accounts that monitor market segments, profit centers, or the business as a
whole. Incoming orders for a project can update the totals in profitability analysis,
and the system can keep track of any changes to these orders.
Profit planning for future periods is supported by data from the project system
forecasts. The profitability analysis system automatically records the values as
soon as transaction data is posted, such as costs of sales in the income statement or
as work in process in the balance sheets. Chapter 9, “Analyzing Profitability,”
discusses the control and forecasting of profitability.
Because it can adopt any or all of these viewpoints, the R/3 PS-Project System is
the embodiment of integrated business accounting. Not only can a specific project
take advantage of the functions of the separate applications, but the PS-Project
System itself can also serve as the main executive controller for the entire business.
The PS-IS Information System is an efficient project analysis tool that is
undergoing continuous program development to increase the depth of its analytical
penetration and the clarity and pertinence of its presentation methods. The
following additional functions are in development to enable you to better assess the
progress of a project:
• Milestone trend analysis will detect and compare schedule deviations
and trends.
• Earned value calculation will provide another internal progress check and
an activity confirmation for the customer by comparing various methods of
measuring earned value during the progress of an activity.
Placing the PS in the Organizational Structure
The R/3 Basis system has a comprehensive suite of data structures on which it is
possible to map in detail the structure of your company, no matter what business or
industry you operate in and no matter how individual your organizational structure
is.
To help you become aware of the data architecture of the R/3 system, an
information model shows the information objects of all the integrated application
software. This is referred to as the R/3 Reference Model, and it can be accessed
directly or through the Business Navigator presentation tool. This model not only
shows you what data objects are available in the R/3 system, but it also reveals
clearly how these data objects relate to each other.
You can see how your specific business can be accurately represented in the R/3
data objects. If you choose to make a decision on which functions will be required,
the R/3 Basis system annotates the reference model so that you can see what you
have selected. This annotated structure is then referred to as the Enterprise Data
Model (EDM) of your implementation and is the principal instrument for
controlling how your system is built. The standard R/3 Reference Model is
available for inspection without any annotations that are specific to your
implementation.
When you have identified the processes and business control instruments of your
company in the Reference Model, you can be certain that they will be fully
integrated when the time comes to run the finished system.
Understanding How the PS Module Is Presented
The PS-Project System is delivered ready to be configured and customized to fit
your particular situation. An implementation guide (IMG) introduces the business
functions, and a customizing menu provides access to the standard settings and
technical recommendations. You set up the R/3 PS-Project System in the IMG-
Implementation Guide itself.
The R/3 PS-Project System makes extensive use of the SAP Enterprise Data Model
to support you in the definition and management of your projects. For example, the
standard organizational structures in the FI-Financial Accounting module have a
strict logical form. Client in an SAP system refers to the highest level of the
organizational structure. The owner of the entire corporation is identified as the
Client and is assigned a client code between 002 and 999. Client codes 000 and
001 are reserved for use by SAP. Client 001 probably is a client created for testing
purposes. You can also reserve a client for training purposes. The transaction data
associated with one client cannot be transferred to the transaction records of
another. However, the particular design of your implementation as developed in
the customizing process is represented as customizing data, and this can be
transported from one client to another.
Although the R/3 Reference Model contains only one definitive example of each
data structure, a company can build any number of replications into its EDM to
represent all the working elements that exist.
The R/3 Reference Model is presented through the R/3 Business Navigator, which
is an information model that can show you the software elements of the R/3 system
and explain their purpose. The R/3 Business Navigator offers a component view
that details the static structure and functional capabilities of all the software
modules. The process flow views comprise a selection of different process flow
configurations that you can study and copy.
For example, if you are looking at the PS-Project System with the R/3 Business
Navigator, you can see how various types of projects can be graphically
represented and executed under control of the standard R/3 software. The displays
can be presented in any language for which your implementation has been
configured.
TIP: When you have drafted an operational project in the PS format and have stored it in your system, you can
use the R/3 Business Navigator to explore and document it.
Logistics organizational structures, for example, follow strict logical definitions.
The modules in the logistics group are as follows:
• SD-Sales and Distribution
• PP-Production Planning
• MM-Materials Management
• PM-Plant Maintenance
• QM-Quality Management
Because all applications are integrated with the FI-Financial Accounting module,
the logistics structures must map to the financial structures. The financial
statements must be prepared up to the client level. In the applications modules, the
data structures must extend to a great depth of detail to encompass the operational
entities that add value to the business through the activities in which they engage.
If managers care about an activity, then the system has a place for it.
A client can have any number of the following:
• Controlling areas
• Business areas
A controlling area can have any number of the following:
• Profit centers
• Cost centers
• Company codes (how subsidiary companies are identified)
A company code can have any number of the following:
• Purchasing organizations
• Plants
The plant is the main organizational element for Materials Management. A
purchasing organization can have any number of purchasing groups.
A plant can have any number of the following:
• Functional locations or pieces of equipment
• Storage locations
• Work centers
A storage location has a separate inventory maintained for it. This is defined as a
physical location or group of locations in which stock can be held.
A work center is defined as an organizational unit where a work step is carried out
to produce an output. The activities performed at or by a work center are valuated
by charge rates that can vary according to the cost center and activity type. Work
centers can be defined on any convenient basis and do not have to coincide with
physical locations. Work centers can be machines, people, production lines, or
groups of skilled people. They can be narrowly defined or can encompass an entire
geographical location.
Each work center master record has a cost center assigned to it. For planning and
reporting purposes, work centers can be arranged in work center hierarchies. The
output from any work center can be assigned to any number of work center
hierarchies for the purpose of planning and reporting.
A work center can have any number of the following:
• Activities
• Machines, plant, pieces of equipment, and production resources and
tools
• Persons
A person is defined as a natural person in whom an enterprise-internal interest
exists. A business partner is defined as legal or natural person, or a group of legal
or natural persons, in whom or in which a business interest exists. A work center
cannot include a business partner.
Associating Structures in a Project
A project can be concerned with any combination of entities in the company. The
project system itself illustrates how the data objects of the R/3 system are used to
monitor and control the costs and revenues of the work done in your company.
Each element points to the responsible organizational unit represented by a data
object. These data objects can attract not only the costs and revenues information
but also any technical information relevant to the operations of the accounting
system or the other functions of your company.
The master data records used by the PS-Project System are formally structured. A
“project” is represented by a master record with a predefined structure of data
fields. One of these fields contains the unique identification code of the project,
which is then associated with all the elements attached to this data structure, such
as WBS elements, profit centers, and so on.
A project has the following components:
• One project definition
• One or more WBS elements
• One or more networks or subnetworks
NOTE: In practice, networks and work breakdown structures can be used independently. It is common to used
the term “project” to refer only to a work breakdown structure.
A project definition has the following components:
• One project identification
• One controlling area
• One company code
• One cost center
A WBS element has the following components:
• One profit center
• One business area, if this facility is operative
• One company code
• One cost center
• One jurisdiction code (optional)
• One plant
• One or more activities
• One or more functional locations and pieces of equipment (optional)
The functional location is a place where plant maintenance activities occur. The
equipment refers to the objects upon which the maintenance is carried out.
A network has the following components:
• One profit center
• One business area
• One jurisdiction code
• One plant
• One or more activities
A network is recursively defined so that any element in a network can itself be a
network, and so on. Therefore, the term “project” may refer to an element of a
larger project, and so on. However, it has become the convention to define a
project by specifying a work breakdown structure. A network is used to specify
what must be done in terms of activities and their relationships, such as timing and
sequence.
An activity has the following components:
• One activity type
• One or more material components
An activity type is one of the following:
• An activity processed internally
• An activity processed externally, via a purchasing organization and a
purchasing group
• A general costs activity assigned to a plant
A material component has the following components:
• A purchasing organization
• A purchasing group
• A plant
• A storage location
Establishing the Project Definition
The project definition is a data object requiring certain fields to contain valid
entries, such as those that relate the project to the company organization. The
project definition also includes text to describe the project goals or mission. You
can add a reference to the settlement rule to cover all the objects in the project.
NOTE: It is not necessary to define any activities or networks to establish a project definition. These can be
added later.
Using Basic Data
The basic data repository of the PS includes templates for project management
entities. The following are the most important standard structures:
• Standard work breakdown structures
• Standard networks
• Standard milestones
• Standard texts
Using Standard Work Breakdown Structures
The work breakdown structure (WBS) defines a project in terms of the tasks and
subtasks that must be completed. A standard WBS is a template for creating a new
project. It creates a model project that is fully integrated with the rest of your
system as soon as you assign it an ID code and save it. You can define several
model projects and arrange for the system to use them as appropriate to generate
projects, for example, in response to any of the following events:
• Customer inquiry posted in the SD–Sales and Distribution module
• Quotation posted in the SD-Sales and Distribution module
• Sales order posted in the SD-Sales and Distribution module
Project organization and coordination are managed through the WBS, which is
defined as a master record structure that can store the work, time, and cost data
associated with a project.
A WBS can be used to track costs incurred in a network. It comprises a hierarchy
of tasks and subtasks to any number of levels and can be represented by a tree
diagram.
If you do not have a model project already defined as a standard WBS, the
individual tasks must be entered to generate valid WBS elements. The level of
detail can be increased at any stage of a project.
The WBS elements can also be used to plan dates, costs, and budget, before and
during a project. Each element is assigned an operative indicator, which determines
its properties for the duration of the project:
• Planning elements for actual costs
• Account assignment elements to which you want to post costs
• Billing elements to which you want to post revenues
Existing organizational units in your company’s enterprise data model, such as a
plant or a business area, can be associated with specific WBS elements. The
default assignment for a WBS element links to the organizational structure
specified in the project definition.
WBS elements already in existence can be referenced during data entry, as can
portions of the hierarchy from other projects. For plant maintenance purposes, for
instance, you can assign a piece of equipment or a functional location to an
element in a WBS.
Each WBS element can be assigned to an area of responsibility and to a
responsible person within that area who is accountable for the work of this element
of the project. The WBS element master record also contains data fields that can be
defined by the user to carry additional information.
Using Standard Networks
In general terms, a network is a connected structure of nodes and links that signify
relationships between the nodes, such as “Must be completed before_ .” The nodes
represent activities. The nodes in a network can also be networks. A subnetwork is
part of a network.
In the R/3 system, a network is defined formally as an activity-on-node structure
containing instructions on how to carry out activities in a specific way, in a specific
order, and in a specific time period. The project system provides graphical displays
of networks upon which all maintenance operations can be conducted by selecting
a displayed node icon and initiating an appropriate function.
Three types of activities can be represented by WBS elements:
• Activities internal to your company that may require a capacity of a
machine or a person
• Activities performed outside your company or by outsiders
• General costs activities
The third type of activity element is defined as a general costs activity because it is
used for planning costs when you do not want to refer to any other data object in
the system. You can also use a general costs activity to accumulate incurred costs,
such as insurance, that are not directly attributable to any one activity.
Activity elements can be used to represent the components of a complex activity.
Each activity in an activity hierarchy can be broken down into internal, external,
and general costs activity elements.
NOTE: You can assign to a WBS activity element the production resources and tools (PRTs) needed to perform
the work.
The system can create a purchase requisition for all activities classified for external
processing by running the MRP-Material Requirements Planning module. You can
refer to the associated purchasing information record to obtain prices and delivery
times for external activities.
Using Relationships Between Activities
A standard network is a template that creates a new network that you can save
under a unique ID code. You can connect several standard networks with logical
and temporal relationships to build an overall network for a project. Subnetworks
are treated the same as networks by the project system.
You can assign a network to a WBS element and instruct the system to roll up the
data from all the constituent networks and assign to the relevant WBS element the
costs, schedule data, and capacity data.
Within a network, the activities can be restricted by the time available or for
technical reasons. Some activities take a long time, some cannot begin until others
have finished, and so on. The PS module makes use of four types of relationship
between activities, as follows:
• Finish-Start, where the second activity cannot begin until the first has
completed
• Start-Start, where the second activity cannot start until the first has
started
• Finish-Finish, where the second activity cannot finish until the first has
completed
• Start-Finish, where the second activity cannot finish until the first has
started
Using Network Types
A complex project uses both a WBS and an activity network. The R/3 Network
Library can be augmented by user-specified neutral network structures for the
commonly used processes that can be copied into your project. The network type
distinguishes networks by their use. The network type controls are as follows:
• Costing variants for planned and actual costs
• Number ranges permitted
• Status profile
Using Standard Milestones
A milestone is an event that can occur during the life cycle of a project. In the SAP
R/3 system, an event is a particular set of data that is recognized for its
significance. When the predefined data situation is detected, the system registers an
event by creating a record and perhaps also triggering a sequence of functions.
In project management, a milestone is usually defined to mark the transition
between one phase to the next, or between one cost center and another. You can
assign a milestone to a network activity or to a WBS element.
A standard milestone is a template that generates a new milestone in an existing
network or WBS element. You can group standard milestones to report on them as
a set.
Using Predefined Milestone Functions in Networks
The PS module includes standard milestone functions that can be predefined to
perform the following tasks for specific business processes:
• Releasing activities
• Starting workflow tasks
One use of milestones in engineer-to-order manufacturing is to trigger customer
billing. A billing plan is created using the defined milestones. When the milestone
is reached, the system automatically copies the actual date when the milestone
event conditions were satisfied to the billing plan, which then releases the billing
block. The invoice is produced the next time that the billing due list is run.
Identifying Production Resources
A WBS can include elements that need documents to support the activities. These
documents can include drawings and technical specifications and other matter from
word-processing or multimedia sources. The documents can be treated as
production resources and can be managed along with the production resources and
tools (PRTs). Alternatively, documents can be allocated directly to WBS elements
from a document management system, even if this is not the one installed in R/3.
The R/3 PS-Project System recognizes and maintains three categories of PRTs:
• PRTs with a material master record that are stock items on inventory
• PRTs with a document information record that are part of the R/3
document management system
• PRTs with their own PRT master record that can be allocated in network
activities
Document management under R/3 for WBS elements maintains the following
information about each document:
• Storage location of the document, such as CAD system, PC file, or filing
cabinet. Generally, the advantages of document management are only
realized if the documents are in electronic form.
• Object status.
• Location of the original data.
• Person responsible for the data.
Checking Resource Availability
Availability checks by the R/3 PS-Project System cover capacities, materials,
production resources, and tools. When you customize your R/3 PS-Project System,
you tell the system whether and how checks are to be made on material
availability, and whether scheduled receipts or only the on-hand inventory should
be scanned.
NOTE: A complete workflow for missing parts is provided to manage the shortage through to goods receipt
and backorder updating.
The system determines whether each PRT is available according to its status and
refers to the PS information system to compare the available capacity with the
capacity load per work center. The system then calculates the capacity utilization.
Capacity leveling is available, and simulations can be performed to see how the
capacity available might be affected by such procedures and events as the
following:
• Orders
• Midpoint scheduling
• Rescheduling
• Out-sourcing
• Work center changes
Planning in the PS
A successful project plan is characterized by its major contribution to completing
the project on time and within budget. Project planning can be a process that spans
the life cycle of the project and extends down to the details required.
Using the Project Planning Board
One way of planning a project is to carry out all planning activities in the main
transaction documents of the project. A better way is to use the project planning
board. This gives a graphical presentation of the entire project at a level of detail
that is under your control.
By pointing and calling functions, you can carry out the following activities from
the project planning board:
• Create activity master records
• Create WBS elements and insert them in the project
• Define milestones
• Exercise the planning functions
• Exercise the resource scheduling functions
• Perform capacity leveling
• Calculate costs
The project planning board comprises two display areas. In the table area, you can
create and maintain activity masters, WBS elements, and milestones. In the Gantt
Chart area, you can point and drag to change the schedule of activities and WBS
elements, set milestones, and set up the relationship links between activities. The
display format of the Gantt Chart falls under the user’s control.
Using Calendars
The R/3 system recognizes the following calendar types, all of which can be used
in project planning:
• Gregorian calendars
• Factory calendars (any number)
• Work center-specific operating calendars, with shifts if appropriate
The following types of dates are accepted:
• Basic dates entered manually for the work breakdown structure valid at
the time of entry
• Forecast dates entered manually
• Actual dates to show the progress of the project
• System-calculated dates created during network scheduling
The dates you use for scheduling can be fixed dates or dates obtained from a
forecast and used as a basis for developing more accurate plans.
Developing Project Schedules
The system can automatically assign project dates if they’re connected to a
scheduled network. Alternatively, you can plan project dates manually in the work
breakdown structure. Planning dates can be entered on the lists and overviews, in
the hierarchy display, or in the Gantt Chart of the project planning board. Three
methods or planning forms are available:
• Top-down, beginning with the start and end dates for the highest WBS
element in the project hierarchy, within which all other dates must fall
• Bottom-up, starting with the subordinate WBS elements and applying
system functions to transfer dates up the hierarchy
• Open, in which you plan without reference to hierarchical dependencies
but check dates before using system functions to transfer them up the
hierarchy
It is characteristic of the R/3 PS-Project System that checking and automatic
updating are not carried out automatically. You must total, check, and reconcile
repeatedly until your project is correctly specified. In the individual WBS
elements, you can compare, reconcile, or extrapolate dates. You can schedule the
whole project or only part of the hierarchy, together with the associated activities.
If it is necessary to make parts of the schedule more detailed, you can create new
activities and assign them to existing WBS elements. Dates from these new
activities can be transferred to the WBS element, and you can link activities to
develop a network local to this element. You can offset a new activity to the start
or finish of an existing activity.
It is often necessary to apply constraints to a project schedule. These can be dates
recognized by your implementation, such as annual plant shutdown.
Using Floats and Reduction
A slack time between activities is a float, so called because it is possible to allow
either activity to extend into this time without disrupting the overall schedule. The
project system has various strategies available to reduce the activity durations in a
WBS if the constraints demand it.
Using Network Scheduling
You can link both networks with relationships and individual activities in different
networks in the same manner. By this means, you can generate an overall network
for your whole project and then apply network scheduling.
Four types of network scheduling are available. Each is discussed in the following
sections.
Using Forward Scheduling

In forward scheduling, you set the start date and instruct the system to use any
scheduled dates already assigned to the WBS elements. This procedure then
reports the end date to you.
Using Backward Scheduling
In backward scheduling, you set the finish dates and the PS tells you when the
project should start.
Scheduling to Current Date
In scheduling to current date, the system schedules forward from the current start
date for the network, and then you can check whether the project will finish on or
before the required date. You can use the floats along the critical path to estimate
the discrepancy. In SAP usage, there is a critical path within a project if the total
float is zero or negative. In general, you should be concerned if there is a sequence
of tasks in which each must await the completion of the previous, and where the
estimated duration of this sequence approaches the time available. Although these
tasks may not have zero floats, their position in the sequence can make them
vulnerable. One advantage of a formal system of network planning is that it obliges
the user to specify all the links and to assign time values to them. If any delay is
anticipated, the effect on the network as a whole can be simulated.
Using Today Scheduling
In today scheduling, the system schedules forward from today’s date. For example,
if the scheduled start of a network is between today’s date and the planned start
date, the system first reduces the lead time. If the finish date calculated by the
system is still not acceptable, you can ask for the earliest possible finish date if the
network were to begin today.
Understanding Project Cost Planning
The success of many projects depends on the costs incurred. There are a few
projects in which the quality of the outcome is arguably more important than the
costs incurred. Your company may want to be the first, and only on repeat orders
seek to reduce the costs. Some of these costs will be excessive if they are
improperly planned. Some costs will be excessive because the plan was not
updated with fresh information as it became available. The project system must
support continuous editing and updating of project plans.
At the conceptual and rough-cut planning stage, the planning of costs suggests the
costs you expect the project to incur. At the approval stage, planning indicates the
way ahead for budget allocation. During project execution, the role of the planned
dates and costs is to monitor variances between planned and actual values.
The system offers the following forms of cost planning:
• Structure planning that is independent of cost elements
• Detailed planning of direct costs by quantity and value
• Detailed planning of secondary costs, using planned activity quantity and
the standard CO-Controlling rate for the sender activity
• Unit costing, using data and methods from CO-CEA Cost Element
Accounting, and Purchasing in MM-Materials Management, if required
• Cost planning in the network, in which the network activities are used as
cost elements in the unit costing technique
Copying of work breakdown structures and parts of them can be used where
projects entail the same processes. Different versions of a project plan can be saved
and maintained in parallel, for example, in the best-case and the worst-case
scenarios.
Using Structure Planning
At an early stage in planning, you may have just an outline WBS structure in
which some or all of the elements have been designated as planning elements. You
could estimate the cost for each WBS element, or you could adjust the cost taken
from similar reference objects. The characteristic of structure planning is that it is
independent of cost elements. You nominate or create a WBS and allocate costs for
top-down distribution or to the lower levels for bottom-up totaling.
You can plan overall costs and then distribute them over the expected duration of
the project, or you can define plan values for costs for individual years. The PS
totals work breakdown structure values for each year.
As information becomes available the structure plan can be refined and elaborated
toward detailed cost element planning and unit costing, for example.
Using Detailed Planning to Cost Elements
A cost element is an account item in the chart of accounts that is used in the cost
controlling area. Cost elements of this kind are used in cost accounting to enter,
classify, and assign values to the consumption of production resources.
When costs are posted (if you’re using CO), they must be assigned to a specific
cost element, which is either a primary cost element for goods and services
procured externally, or a secondary cost element for goods and services created by
internal activities.
When costs are entered, they must be identified with a controlling area and a cost
element. They must also be assigned to an additional account assignment object
that is offset with the cost element posting to complete the settlement procedure.
This additional account assignment object must be one of the following:
• A cost center
• A network
• A WBS element
• A cost object
• A revenue object
Detailed cost element planning of this type requires planning primary costs and
secondary or indirect costs.
Planning primary costs can be carried out in terms of both quantity and value. If
you plan for quantities, you enter the planned consumption and then value it using
the planned prices per quantity unit. Planning by value does not require the entry of
planned use quantities. You enter the planned costs for each cost element.
Cost center activities can be planned as indirect costs on a quantity basis. The
activity required is planned by quantity and is multiplied by the rate charged by the
sender cost object. This yields a value that is stored in a secondary cost element as
an internal activity allocation.
Using Detailed Planning by Unit Costing
It may be the case that you can access all the information you need for costing
from the integrated applications of your SAP R/3 system. You need the
information on the sources of supply, the quantities, and the prices so that you can
apply unit costing for project cost planning purposes. Into your plan you enter the
quantities of the units for each origin, such as each material and each relevant
activity defined in the CO module. The system then computes the values using the
standard prices for these resources.
Using Cost Planning in Networks
If you have built a network that schedules the activities and carries planned values
of the intended resource use, you can have the project system calculate the costs of
your plan in terms of the objects in your network. Primary costs are derived from
your entries for external activities, materials, and general costs activities. Activity
input is defined by your internal activity planning values.
The user can allocate materials to activities. The system then generates stock
reservations for all the materials held as stock. The prices are available from the
materials masters. Non-stock material is allocated by purchase requisitions, for
which the plan values can be obtained from the purchasing system.
The general costs activity is an instrument for accumulating costs that cannot be
assigned directly to a cost center activity or to a material. These costs can be
assigned to any suitable cost element.
Planning Capacity Requirements
For internal activities in each work center, you define available capacities and
specify formulas for calculating them. You can operate capacity splits, which serve
to allocate capacity data to individual capacities such as specific machines or
individual people. As you enter the quantity of work to be performed, you indicate
the required capacity units. The system uses this information automatically when
scheduling capacity requirements.
You can plan external activities by referencing a purchasing information record for
a contractor, which shows the prices and delivery times. If your system is
integrated with the PP-Production Planning application, the project system can
initiate the creation of a purchase requisition by the MRP module from this
information. When the activity is released, the user must convert the purchase
requisition to a purchase order.
If you want to inspect the capacity utilization of the work centers, you can do this
from the time scheduling and structure planning functions at the project planning
board. The capacity evaluations display the accumulated capacity loads per period.
This is the kind of information that can foretell backlogs and bottlenecks.
Using Capacity Leveling
The display and control interface of choice for capacity leveling is the R/3 Graphic
Planning Table. The idea is to reconcile all your capacity demands to amounts of
activities that will be available at the time. You have a range of tactical procedures
at your disposal that you can compare through simulations of your plan. For
example, you can see what differences you could make to the capacity availability
position by any or all of the following:
• Order manipulation
• Midpoint scheduling
• Rescheduling
• Outsourcing
• Work center changes
You can perform most of the rearranging from the R/3 Graphics Planning Table.
Here are some options:
• Change the sequence of activities in a network
• Split activities across work centers
• Split activities across time periods
• Change the structure of work centers
• Change the available capacity of work centers
The consequences of any changes you propose can be explored at the planning
table. You have two areas on the table: One shows the work centers and available
capacities, and the other shows the activities with requirements that have not yet
been dispatched. You can select an activity on the graphic planning table and drag
it to an available time period in a suitable work center.
Using Personnel Planning
When you install and configure the PD-Personnel Planning and Development
system, you effectively extend planning in another dimension. The personnel
system depends on definitions available for all the work positions in your
company. These definitions use standard qualification descriptors that specify what
experience, qualifications, and authorization levels are needed for each work
position. Your personnel system also represents all your employees in the SAP R/3
database. These appear as master records using entity type 7005, which is reserved
for natural persons in whom your company has an enterprise-internal interest rather
than a business interest. Such persons can be current employees or retired
employees still on the pension payroll—or at least still in the database in case they
might be invited to rejoin your company.
You can use the integrated personnel system to find a person to whom a task could
be assigned. You can specify the time period as well as the qualifications required.
Therefore, you can conduct personnel planning over the same periods you use for
your other types of planning.
The system offers you a list in rank order of all the persons suitable for a task on
the basis of their availability in the appropriate work center, their available time,
and the attributes needed to perform the activity. You can arrange to view rankings
with different sort codes.
Using Materials Planning
The natural source of planning support for materials is the MM-Materials
Management module, which can provide integrated functions for the following
activities:
• Purchasing
• Inventory management
• Materials requirements planning, if your system is also integrated with
the PP-Production Planning application
If you allocate a material from stock from the project system, an automatic
reservation of the required quantity occurs so that it is no longer available to
promise to another project or order. If the material you allocate is not a stock item,
the MRP system can create a purchase requisition for the required quantity; this is
submitted for approval and release for purchasing action.
If that particular MM workflow is enabled when the material is received, the
receipt confirmation is associated with the relevant object in the project system so
that the project manager can be informed when the material arrives.
Some materials needed for a project can be obtained on time only if they are
ordered well in advance. If you know the lead time, you can place a preliminary
order in the materials purchasing system. Such a preliminary order can be assigned
for accounting purposes to a sales order as part of the project, or to the project
account itself. The assignment serves as a purchase requisition.
If you use the project system to assign a material to an activity, and if there will be
a long lead time before this material is delivered, the project system uses this
planned delivery time to automatically adjust the duration of the activity. The idea
is that the activity begins by ordering the material and then lasts at least as long as
the time necessary for delivery.
You may decide that the stock needed for your projects should be managed
separately from the inventory used for other work in your company. You can
designate the materials and quantities to be managed as project stock or sales order
stock so that these materials will not be available to promise to any other orders.
Using Availability Checking
If your project plan has reached the stage of assigning milestone dates or activity
durations, the project system automatically checks that all the materials, production
resources, tools, and activity capacities will be available at the planned start dates
for the relevant activities.
Before you release a network, you should conduct an availability check. The
project system enables you to specify when and how availability checks are to be
conducted. For instance, you can arrange that materials needed by your project are
not considered to be available unless they have been confirmed as on-hand
inventory. If you are confident in your suppliers, you can permit scheduled receipts
to be considered if their planned delivery times are compatible with your network.
The R/3 Workflow system can be set up to take action automatically if any
material is missing. This is referred to as missing parts management. This type of
management can respond to initial shortages, discrepancies in goods receipts, and
updates to back orders.
Checking PRTs must take account of the planned time schedule and the capacities
required. Any particular PRT is identified in the master records and is associated
with a status code. This reveals whether the resource is being used by another
activity, whether it is unsuitable for service until repaired, or whether it will be
withdrawn from service. You have a customized status structure according to the
type of PRTs used in your industry.
NOTE: You can check the availability of PRTs and activity capacities with the graphical planning table and the
project information system.
Understanding Project Budgeting
If your project has a budget, your management must have approved a plan that sets
out the expected development of costs over the intended duration of the project.
The better the planned cost development, the better chance you have of bringing in
your project within budget. On the other hand, your management may not approve
your plan in its entirety. You may not get a budget sufficient to cover your planned
costs.
A budget for a project is created formally when planning is completed and project
approval is granted. A cost plan is an estimate. A budget is a fixed amount that can
be allocated to the WBS elements. You may be permitted to keep some of your
budget in reserve for contingencies. You can allocate funds either by adopting the
values produced by detailed planning, or by distributing the budget manually as
values entered directly in the WBS elements.
Your finance director may not actually release all the funds for your approved
budget. The R/3 PS-Project System recognizes the following two types of budgets:
• A current budget is the original budget that may have been amended by
supplements, transfers, and returns
• A released budget is limited by the original budget total but is released in
stages, perhaps in relation to WBS elements or milestones.
Changes in a budget can be accommodated by the following instruments, all of
which are reversible:
• Supplements that you can process from the top-down in the WBS
• Returns of excess funds that you can process from the bottom-up in the
WBS
• Transfers of funds that you can move from one WBS element with a
budget to another, which also must have a budget, although it need not
belong to the same project
NOTE: The project system displays project budgets in hierarchical format, if necessary, and checks that no
release or assignment would exceed the original budget amount.
Using Project Budget Management Support
The following support functions are available in budget management support:
• Logging all budget updates in an approval history
• Selecting WBS elements and increasing their budget allocation by a
percentage or by an amount
• Reassigning individual WBS elements or project branches, along with
their budget values, to any existing budget
Managing Budget Funds
A funds overview is provided to display what funds have been assigned in a
project. If you operate passive availability control, the system reports fund
commitments in a project, even if they are in excess of the funds available at the
time.
However, you can specify active availability control. A tolerance level is defined
per WBS element or for the project as a whole. The business transactions that
trigger active availability checking must be defined in the configuration of your
implementation. If you post a business transaction to create a purchase order for a
WBS element, for instance, the project system checks whether the available project
budget or the released funds are enough to cover it within the tolerance level. You
can specify what action should occur if such an event is detected. For example, you
can specify a warning to the user, plus a message to the person responsible for the
project.
The following availability control parameters can be specified:
• Whether the target for comparison is the amount of released funds or
the current budget
• Whether the budget to be considered is the annual budget or the overall
budget for the project
• Which types of business transactions should be subject to availability
control (such as purchase orders or postings in CO-CEA Cost Element
Accounting)
• Whether the tolerance of an intended transaction is to be based on a
percentage use or an absolute value of the variance of the budget overrun
• What actions should be triggered by a transaction that will create a
budget overrun according to the parameters defined
In the event of an intended transaction triggering availability control conditions,
the project manager can respond to the warning by using a special function key.
This automatically displays the funds overview for the WBS element that is about
to run over budget. The display gives the amount of the excess, the details of its
origin, and the item in the transaction where the overrun conditions were triggered.
The tolerance limits can be configured to respond with different actions according
to the amount of the budget excess in the following sequence:
• Warning alone
• Warning plus electronic message to the project manager
• Error message and rejection of the intended posting
The budget availability control function can provide an automatic system for
giving early warning of those project commitments likely to exceed budget funds.
Executing a Project
If you manage your projects by the method of budgeting and releases, execution
begins with project release. Many activities needed in a project are initiated from
the project system. However, some activities are executed outside the project
unless you make provision for them to be under direct control of the project
system. For example, a purchase requisition is usually submitted to the purchasing
department. A sales order is created and processed by the sales department.
For a business process to be assigned to a project and processed there, you must
allocate an account assignment to a specific network activity or to a WBS element.
As the project proceeds, funds assignments are generated by it. They are
represented as funds commitments, open items, and actual values.
Variances arise between planned and actual values. Prices of purchased goods may
change. Vendor deliveries may fall outside their planned periods. Your plant may
not be capable of manufacturing or processing as much as you had planned.
Unplanned events such as these require planning updates from you to supply the
fresh information used in planning subsequent activities. As you update your
project with new planning information, you will become aware of the more
obvious trends in the data. You will probably notice when the project plan looks
like it will exceed budget or come in late.
Using Activity Confirmations
Each activity must be confirmed in the system. This could be done in many
different ways. You may have a data link installed, or you may have to manually
enter data from an activity confirmation slip, for example. These confirmations
update the capacity load of the work center and record the actual costs. The
remaining duration and work to finish the network are also updated by these
confirmations. A confirmation can be canceled as well.
You must enter the following information either manually or automatically into
your activity and network completion confirmations:
• Degree of processing (optional)
• Work center
• Dates
• Duration
• Forecast values (optional)
The network and the work breakdown structure work together; changes in one are
reflected in the other.
Confirmations to the network can be directed to the PS information system and can
be downloaded to there from external systems such as plant data collection
systems, Microsoft Project, or Microsoft Excel. Confirmed data can be copied to
the network.
The project system enables you to confirm many activities at the same time with
the Collective Confirmation Screen. Each member of the project staff can define a
unique user screen that displays only those confirmations that fall within their area
of responsibility. The user can define column widths and the sequence of fields and
can selectively filter out unnecessary information. The user can also individualize
the act of confirmation by setting default values, such as their personnel number, to
be written into every activity confirmation.
NOTE: Any confirmation of an activity can be subsequently canceled.
Using Actual Dates
Each WBS element in a project is associated with planned dates. Actual dates can
be either entered manually to each WBS element or copied automatically from
activity completion confirmation documents. Two basic schemes exist for
recording actual dates; you can also apply a combination of these two schemes:
• If your plan is developed top-down or bottom-up, the project system will
copy actual dates from the lower-level WBS elements to the higher-level
elements to which they belong.
• If your plan is developed by any other procedure than top-down or
bottom-up, the project system will update with the actual dates only those
WBS elements that have a network assigned to them.
As soon as an activity has been confirmed and you have actual dates for network
activities, the project system uses them in the schedule forward procedure to
calculate a new finish date. The system then automatically schedules backward
from the basic or fixed dates to determine the floats.
CAUTION: A negative float suggests that your project has fallen behind schedule.
Using Actual Costs and Commitments
Business transactions in the project and in the various feeder systems incur actual
costs and commit funds to meet future needs. These are automatically associated
with the WBS element responsible. The following transaction documents record
activities likely to create commitments of funds:
• Activity allocations and confirmations
• Material issues
• Deliveries
• External invoices
• Purchase orders
• Purchase requisitions
• Manual funds reservations
Using Actual Revenues
For revenue to appear as an actual value in the project system, one of the following
commercial transactions must be posted:
• Posting in FI-Financial Accounting
• Invoicing in SD-Sales and Distribution
Using Actual Payments
Payments can be processed from the project system in various ways, which include
the following documented transactions:
• Down-payment requests
• Down payments and down-payment clearing
• Incoming and outgoing payments
NOTE: Imputed interest can be computed in the project system to contribute to the project result calculation.
Creating Orders for a Project
If you have elaborated and planned a project in terms of WBS elements and
networks, you can extend the scope of the project by adding WBS elements and by
creating orders for the project. Creating an order may be the preferred option for
any or all of the following reasons:
• You may be able to use an existing bill of materials and routing as the
basis for a new production order to manufacture materials.
• You can create a maintenance order to plan and monitor maintenance
tasks for the project.
• You can create internal orders to allocate costs and activities for cost
accounting and performance analysis purposes.
One advantage shared by all types of orders is that they can be managed from the
project system and yet still be kept up-to-date by automatic postings in the
controlling system.
Costs that are planned in orders and later posted represent commitments against the
budget of the WBS element to which the order is assigned. The same is true of
planned or actual costs posted in networks. An order for a project can be assigned
for settlement to the responsible WBS element or to an account assignment object,
which probably is another order or a cost center.
When the system settles an order outside a project, internal business volume is
eliminated in accordance with standard accounting practice. The costs settled on a
receiver become the responsibility of this receiver and are displayed there. For
example, if you have settled an order for a project on a cost center, the costs settled
are displayed in the information system of the cost center, not in the project
information system. The project is no longer responsible.
Performing Periodic Processing
It is essential to carry out periodic valuation of long-term projects so that the
balance sheet accounts and the controlling accounts can be properly rendered. In
particular, the project system carries out the following tasks on behalf of any of its
projects:
• Overhead surcharge calculation
• Calculation of interest
• Results analysis
• Settlement
Earned value calculation can take place at any time because the date that
contributes to them is updated when the report is initiated.
Costing Overheads as Surcharges
If your project needs and takes advantage of resources already provided by your
company, it may be appropriate to impose surcharges to pay for a share of the costs
of their initial provision and upkeep. For example, the following resources can be
costed and assigned as surcharges:
• Personnel
• Buildings
• Machines
• Materials
These overhead surcharges can be directed at any level of your project. WBS
elements, networks, and network elements may all attract various types and
amounts of overhead surcharges.
You can use a standard overhead costing sheet, or you can edit one to make a
customized form to suit your particular circumstances or the type of WBS element
to which you are directing the surcharges. You might include any or all of the
following surcharge procedures in different versions of your overhead costing
sheet:
• Percentage overhead rates
• Absolute overhead amounts
• Quantity-based surcharge amounts
• Surcharge rates applied to mixed or variable portions of the base
amounts
• Single or multilevel surcharge calculations
• Assigning overheads to credit objects and cost elements
• Assigning overheads to allocation cost elements
A base cost element that is used as a multiplier in the calculation of overhead
surcharges can be treated in various ways. For example, the total, the fixed, and the
variable cost portions can each be multiplied by a different surcharging rate.
The system calculates surcharges in simulation mode without posting them to a
project so that you can review the amounts and correct them before charging.
Surcharge calculations and simulations can be conducted online or in background
processing. A surcharge log is maintained to record how the surcharges have been
applied as actual costs to the cost centers or orders.
From the stored payment, the down payment, and the internal activity transaction
documents, the project system maintains an up-to-date balance interest calculation
that is recorded as an accounting document. The interest calculation brings in the
values on dates in the past history of the project, interest rate changes, and the
effects of compound interest.
Using Earned Value Analysis
The earned value analysis functions of the project system are used to present the
progress of a project and its value at particular points in time, such as period end.
You can call on various techniques that can be combined under the user’s control
to portray the progress of a project or an individual work package within a project.
The following procedures are available to be applied to a base value, such as the
planned costs of a task:
• Start-finish rule to calculate value at the start and finish of each WBS
element
• Milestones reached
• Measurement of the degree of processing achieved in the project
• Percentage of completion (POC) based on the actual costs as a
proportion of the planned costs
• Estimation of the POC
• Time proportionality used to calculate earned value from the base
• Secondary proportionality
The start-finish rule is a measurement technique in which you can specify that a
percentage of the planned work on a task shall be deemed to have been completed
as soon as the activity has started.
Secondary proportionality is a method of measuring the progress of a project that
uses a variable, such as the quantity of a key resource or tracing factor. The
proportion of the actual to the planned quantity of the tracing factor is applied to
the planned costs to calculate the value of a project at the interim stage.
If you have calculated the percentage of completion of a project at an interim stage
before completion, you can use this proportion for the following purposes:
• To bill the customer
• To calculate balances and reserves of funds
• To analyze the earned value of the project
Using Results Analysis
The rules of financial accounting require that projects in process be evaluated at
period-end closing. To achieve periodic valuation of long-term orders, the results
analysis function compares the calculated costs and the actual costs of an order as
it progresses towards completion. This method calculates either inventory (if actual
costs are greater than calculated costs) or reserves (if actual costs are less than
calculated costs).
The data calculated during results analysis is stored in the following account items:
• Cost of sales, or a revenue figure for profitability analysis calculations
• Work in progress
• Capitalized costs
• Capitalized profit
• Reserves for unrealized costs
• Reserves for costs of complaints and commissions
• Reserves for imminent loss
When a project is settled, the data from results analysis can be passed to financial
accounting, profit center accounting, and profitability analysis.
The procedure to be followed in results analysis is controlled by the results
analysis key assigned to it. The key specifies such options as the following:
• Whether revenue-based, quantity-based, or manual
• Basis on which it is carried out (planned or actual results)
• How profits are to be realized
• Whether to split inventory, reserves, and cost of sales
• To which results analysis accounts should post the results
• How the life cycle of an object is to be broken down into open and closed
periods
You can set up different procedures by editing a results analysis master and
creating a results analysis version. You may want to do this under the following
types of circumstances:
• When your corporate group operates in more than one region of legal
force and therefore needs to render external accounts in accordance with
various legal accounting practices
• For financial accounting purposes that require assignments that differ
from project control
• For profitability analysis
You may also want to take into account the effect of operating fixed prices
between different subprojects within a project. This can be arranged through a
results analysis version to enable you to pass on profitability analysis data for a
subproject separately. This may be necessary, for example, when you assign
certain results to profit centers.
Using Balance Sheet Comparison of Costs and Revenues
If you use the project system to transfer calculated data to the balance sheet
accounts on a period basis, the corresponding balances are formed and
subsequently cleared. These retain evidence of their origins in a specific project so
you can maintain a concurrent costing and internal valuation procedure for each
project as it is executed.
The results analysis up to a key date enables you to compare costs incurred and the
matching revenues.
Using Settlements
A settlement can be performed as a simulation, or it can result in the appropriate
values being updated. Settlement of costs incurred in a project on one or more
receivers is automatically accompanied by corresponding credit postings to the
project itself. The costs settled are recorded in the relevant receiver. Debit postings
assigned to the project remain on display even after settlement.
The following types of assignment account objects could accept the settlement as
receivers:
• Cost center
• Project
• Asset
• General Ledger account
• Business segment
The project or the WBS element master must include a specification of the
settlement rule. This can comprise several distribution rules, each defining the
settlement receiver, the distribution of costs, and the settlement type.
The settlement structure determines how the process is controlled. This structure
specifies the settlement cost elements, or the value fields from an operating
concern, that are to be assigned to cost elements and cost element groups.
The following settlement functions are under development by SAP:
• Settlement by amount
• Settlement of line items
• Settlement in the plan
• Settlement by cost element
A separate structure for use by CO-PA Profitability Analysis is known as the PA
Settlement Structure. See Chapter 9 for more information on this structure.
Billing
A sales order or a sales order item can be assigned to a project or to a WBS
element. When the customer is billed, the amounts then are automatically recorded
as actual revenues in the project or relevant WBS element.
Fixed-price billing can be carried out per sales item as of a single billing date.
Partial billing also can take place, splitting the total amount to be billed between
the dates of the billing schedule. The following splitting options are available:
• Dates for split billing are entered manually in the billing schedule.
• Partial billing is based on network milestones assigned to the sales order
from the project or from a subhierarchy assigned to the sales order.
The customer is invoiced with a percentage of the total project costs or with a
predefined amount as each milestone is reached.
A billing schedule can include items for down payment as well as the actual billing
items. The system creates down-payment requests that are automatically posted to
financial accounting.
Using Resource-Related Billing
When a customer places a unique order, prices for services may not be stored as
fixed prices in the sales order master records. Instead, billing may be based on the
expenditure actually incurred. Resource-related billing uses the cost information
stored in the project to create items for a billing request. When the time for billing
arrives, the billing request initiates the production of billing documents. The
following operations are carried out prior to the release of billing documents:
• Pricing can be based on internal prices as an alternative to using cost
information stored in the project.
• Resource items against contracts and warranties is a checking process
that can be used to reduce individual resource items or eliminate them
from billing.
• Interactive dialog functions enable the user to manually change billing
requests at the resource item level to delete items or reduce the quantity
to be billed.
If you create or change a billing request, the system automatically records this fact
as a document history item that can be used to ensure that no item is billed twice.
The history can also be used to trace the origin of individual billing items.
NOTE: Billing documents provide cost information that can be used in results analysis during project
evaluation.
Using Fixed Prices in Subprojects
A subproject can be defined as a section of a project or work breakdown structure
that has responsibility for its own budget and is therefore obliged to manage its
accounting locally. Fixed prices can be used for the transfer of goods and services
between subprojects. At the planning stage, fixed prices are managed under fixed-
price agreements. At the execution stage, fixed-price allocations are used.
A fixed-price agreement is a document in which you enter the subprojects or WBS
elements taking part. The amount appears as a plan revenue in the supplying or
sending WBS element and as a commitment in the ordering WBS element.
At the execution stage, a fixed-price allocation based on a fixed-price agreement is
affected. The supplying WBS element shows the allocation as an actual revenue,
and the ordering WBS element shows the amount as an actual cost. The
commitment is reduced by the same amount.
Interpreting Subproject Views
The overall view does not recognize subprojects and therefore does not recognize
fixed-price agreements. However, fixed-price agreements can be evaluated in the
subproject view, which is accessed by entering the subproject ID code.
The subproject view for decentralized project management can be upheld in the
following processes and structures:
• Budgeting and availability control
• Profitability analysis
• Commercial project structures
• Cost element reports
Using the Project Information System
Many different business specialties are used in a complex project, and their
providers do not all want to use the same displays and reports. Project status in
relation to the various influencing factors will be of interest to many on the team.
This is closely related to project progress.
The reporting system enables you to select the degree of detail and the filtering of
data appropriate to your immediate purposes. The following project role displays
are available to provide starting points for interactive analysis:
• Budget
• Costs and resources
• Finances
• Project structure and schedule
• Resources
The natural way to measure project process is to compare different versions of the
same project. A version of a project is a snapshot of the project data at a particular
time or at a particular stage, as defined by the status of the project. A project
version is either time-dependent or status-dependent. Different versions are
displayed in contrasting colors, and you can compare as many versions as you
require on a line or column basis to evaluate trends in costs or schedules.
Using PS Information System Reporting
The data you want to inspect can be sorted to differentiate a particular point of
view. The following project views are standard structures upon which reports can
be deployed:
• The project structure
• A subhierarchy, such as a profit center hierarchy
• A cost center hierarchy
• A summarization hierarchy
• A sales structure, such as a sales order
A report tree function structures and displays the existing standard and custom
reports. All reports can be executed interactively or in background processing.
Selecting Standard Reports
The cost information system of PS includes standard reports to compare planned
and actual budgets as well as budgets and assigned funds. Any report can be edited
for content and layout and can be saved as a custom version.
Defining Custom Reports
The following information is available for use in custom reports:
• Actual values
• Commitment
• Plan values
• Budget
• Sales orders
• Results analysis
Using Structure Reports
Structure reports deploy the data in accordance with work breakdown structures
and can make the following comparisons:
• Planned versus actual data
• Budget versus committed funds
• One cost element and another
The scope of structure reports using these comparisons can extend across projects
or can be confined to work breakdown structures or WBS elements.
Using Cost Element Reports
You may want to report on particular cost elements taken from the common chart
of accounts. Cost element reports evaluate projects, WBS elements, and networks.
Using Line Item Reports
Standard line-item reports are available for the following values:
• Actual
• Planned
• Commitment
• Budget
You can apply flexible analyses and formatting to the data collected for line-item
reports to show individual postings. The standard reports have a variety of options
to control the document information selected for presentation in the report. You
can change the display format interactively.
To help you be selective, sort and summary functions can be applied to the data in
the document inventory. The individual documents can be accessed directly from
line-item report displays.
Using Summarization Reporting
Several projects or subprojects of the same type can be summarized by assigning
them to a generic term that can be located in a project summarization hierarchy.
The following information can be summarized in this way:
• Values from WBS elements
• Values from activities and activity elements
• Values related to project structure, budgets, and cost elements
The grouping of records for the purpose of summarization is controlled by
characteristics that you define for individual hierarchy levels. Reference
characteristics point to fields in the project master record. User-defined
characteristics are specified by selecting fields and values that will be available in
the system when the database is accessed to select records for a summary.
When you have a report on your screen, you can select a summarization object and
switch between cost element and project levels. This enables you to move from a
summarization report to the detailed information on which it was based.
TIP: Project summarization can embody or branch to standard reports and make use of the full function set of
the project and cost information systems.
Viewing the Structure and Dates of a Project
The information system offers you a family of Structure/Dates views of your
project. You can select from the following options:
• Show the current status or the hierarchical relationships between
selected objects that are part of the project, such as WBS elements,
networks, activities, material components, production orders, and
maintenance orders
• Control the data aggregation and display to emphasize totals,
summaries, comparisons, sorted lists, or graphics
• List all objects in a hierarchical structure
• Inspect overviews of particular types of object in a project, such as
activities
• Branch to a detail screen for the object identified on the display
Manipulating Presentation
Lists and overviews are accompanied by relevant statistics and interpretations, of
which the following are perhaps the most useful:
• Number of WBS elements
• Number of activities
• Critical activities
• Number of activities started ahead of planned schedule
• Number of activities begun behind schedule
• Number of objects released and partially confirmed
You can add fields to a list or overview display, and you can control presentation
and layout. You can be selective by referring to such field data as the ID of a
particular manager, a controlling area, or a priority level.
The following standard graphics can be applied automatically to the data on your
screen or to any part of it that you choose to select or otherwise define:
• Structure graphic
• Hierarchy
• Gantt Chart
• Network
• Period drill-down graphic
• Portfolio graphic
From the standard SAP R/3 presentation graphics, you can select as appropriate
from the following list:
• Histogram
• Totals curve
• Correlation
• ABC analysis
• Segmenting
• Classification
The presentation of values and the layout of the graphics can be customized and
edited interactively.
Accessing Related Information Systems
The following information systems are accessible from the Project Information
system:
• Costs, finances, and revenues
• Resources
The resources information system presents information about purchasing, materials
planning, and capacity planning from the following data sources:
• Capacities
• Missing parts
• Stock and requirements list
• Pegged requirements
• Order reports
• Reservations
• Purchase requisitions
• Purchase orders
• Outline agreements
The resource information system can evaluate the loads on your work centers
imposed by the capacity requirements of your project. You can evaluate per project
or per work center for all projects. The project system automatically notifies you of
problems such as backlogs or capacity overloads. You can use the evaluation
facilities to analyze how networks and production orders could affect the capacity
loads on your work centers.
If the existing work center hierarchies do not yield the precise information you
require, it is possible to create work center groups that combine capacity
evaluations across plants and even across companies. You can encapsulate
whatever you decide is the most useful way of looking at the capacity situation in
your company in a capacity evaluation profile. This is stored and can be called up
as necessary.
Some evaluation profiles have been identified as standard capacity overviews. For
example, you can select from the following views:
• The standard overview offers the capacity requirements, the available
capacity of selected work centers, and the committed capacities of these
work centers by period.
• The capacity detail list shows which activities are causing capacity
requirements in each period.
• The variable overview shows whatever subset of capacity requirements
you define, such as the requirements caused by created or released
networks.
Exploring Portfolio Graphics for Project Status Analysis
The customized displays of the portfolio graphics function are designed to use
summarized data to represent the costs and work activities of several projects on
the screen at the same time. The basic idea is to place each project in an area of the
screen that represents a characteristic of interest. A Venn diagram uses similar
logic to define sets of entities. The regions can be scaled to represent time variance
on the horizontal axis and cost variance vertically.
A small rectangle defines an area in which a project is depicted only if it is on time
and within budget according to the tolerances in these variances. Around this
central region the next rectangle indicates projects with larger variances in time
and cost. In this type of portfolio graphic display, the further out from the center a
project is located, the further it is from meeting planned cost and time targets.
TIP: To add more detail, each project can be labeled by an icon in the form of a pie chart depicting project
status, perhaps with a radius related to the planned costs.
Chapter 9
Analyzing Profitability
In this chapter
Introducing the SAP R/3 Profitability Analysis Module
Using the Processes of Profitability Analysis
Identifying Profitability Segments
Planning Sales Quantities and Profits
Using Revenue Element Accounting
Operating CO-PA
Using Profit Center Accounting
Introducing the SAP R/3 Profitability Analysis Module
In this chapter, you will discern the differences between the various accounting
procedures that can support the fight against unprofitability. You will be able to
deploy the most effective techniques in your own particular circumstances. You
will also be able, for example, to prepare answers to the following questions:
• What are the similarities and differences between account-based and
costing-based profitability analysis?
• What are the similarities and differences between computing
profitability by Cost-of-Sales or by Period Accounting?
• What are the similarities and differences between cost centers and profit
centers?
• What is the role of key figures?
• How is data collated for the purpose of analyzing which business
activities are profitable?
This section introduces the CO-Controlling modules relevant to profitability
analysis and points out the very precise definitions that are applied to the concepts
and the SAP R/3 data objects that represent them. The success of the PA module
depends on the clarity with which these technical terms are applied in a particular
company.
The CO-PA Profitability Analysis module is developed in conjunction with the
CO-PCA Profit Center Accounting module. They are both elaborations of the
Cost-of-Sales procedures. There is an important distinction to be made between the
following aspects of profitability analysis:
• Profitability Analysis is the periodic analysis of the profit and loss made
by the strategic units or by the entire company.
• Cost-of-Sales Accounting is also a form of profitability analysis that is
used in the management of market-oriented activities.
They both call on the same costing information but treat it in different ways. Sales
managers need to be able to estimate profits in the short term by using interim
reports. These are based on standard values and imputed costs derived from
standard manufacturing costs with cash discounts and rebates, because the actual
data is not available at the time the billing document has to be issued. Periodic
profitability analysis has to wait for the actual values to be collated.
Calculating and Analyzing Profitability
Profitability is calculated for a business segment. The SAP R/3 system is supplied
with a set of criteria from which the definition of a business segment can be
assembled. The most commonly used criteria are provided as lists of proposals that
can be adopted or ignored when you set up your own CO-PA Profitability Analysis
system. You can define fresh criteria to suit your own circumstances.
The SAP R/3 CO-PA Profitability Analysis component is designed to make
available the full range of analyses covering the following requirements:
• Current sales data valued with standard costs and prices at the level of
the individual product and for individual customers.
• Calculation of actual cost variances for summarized business segments
on a periodic basis.
• Proportional assignment of fixed costs in order to measure net profit at
the divisional level.
• Application of period profit center accounting in situations where there
are large fluctuations in stock levels.
Both the periodic profit and loss statement and the interim sales report have to be
able to provide the answers to similar questions, even though their answers may
take different forms:
• What is the relationship between gross sales and net sales revenue?
• How were the sales deductions calculated for each market segment?
• What was the profit on this specific order?
• Which products or market segments are showing the greatest increases
in sales revenue?
• Which products or market segments are making the highest contribution
margin?
• What are the shifts, if any, between the main business segments?
• What are the planned contribution margins for each product?
The Cost-of-Sales Accounting method uses standard costs to produce interim
reports, enabling you to look at any market segment immediately, without waiting
for the actual data to arrive. If you can wait to the end of the period, then
probability analysis will give you more accurate results.
Using Standard Costs with Cost-of-Sales Accounting (Interim Reports)
The market-driven needs of sales management dictate the requirement of
estimating profits in the short term by using interim reports based on standard
values and imputed costs. These interim values are derived from standard
manufacturing costs with cash discounts and rebates because the actual data is not
available at the time the billing document has to be issued.
When the actual data arrives, the interim reports are usually reconciled with them
on a period basis by applying the procedure referred to as the “Cost-of-Sales
Accounting Using Actual Costs (Reconciled Reports).” Because of the lag in time,
these reports are not so useful for managing the day-to-day sales activities; their
function is more to document and summarize.
Using Fixed Cost Absorption Accounting
Profitability accounting requires that profit and loss be calculated on the basis of
both full costs and marginal costs using contribution margin accounting. The actual
costs can be assigned to the business segments en bloc or in proportion to sales.
Therefore, the fixed costs can be absorbed across several levels of the organization
for each period.
When costs are assigned to user-defined business segments, they have usually been
gathered from one or more cost centers. Costs, however, may have been assigned
to orders as “direct costs” so that they can be collected from the customers. These
costs can also be taken into account, and direct costs can be assigned to any level
of a business segment.
In practice, an SAP R/3 Controlling application may support several methods of
profitability accounting in parallel so that the user may compare and contrast his
findings in the search for signs of high and low profitability.
Distinguishing the Sources of Profit
It is customary for a corporate group to establish independent operating units in
different countries or in different regions of legal force that are defined by the local
code of accounting practice. In the SAP R/3 system, these units are identified as
company code entities, and they render their own set of external accounts as well
as take part in the consolidation of accounts at the head office or client level.
In order to distinguish the sources of profit, the database must be able to associate
every business transaction with an accounting data object that serves to collate and
summarize the relevant information that will be used to compute the profitability
of each operating unit of interest. Your company may be interested in the
differences in profitability of company code units, and it may also want to trace the
sources of variability down to the departments. In fact, the CO-PA module is able
to refine the definition of profit source down to any degree of precision that you
require.
Using Charts of Accounts
The balance sheet and the profit and loss statements are rendered as the external
accounts by assembling business transaction data in cost elements. These are
specific accounts in the General Ledger and are listed as the items in the chart of
accounts, which serves as a classification plan. The chart of accounts is stored as
an entity of type 2001 and belongs to only one client, but a client can have several
charts of accounts.
Here are some examples of entity type 2002, “Chart of Accounts Items”:
• Undeveloped real estate
• Long-term portfolio investments
• Receivables from sales and services—domestic debtors
• Receivables from sales and services—receipt uncertain
• Payables for goods and services—domestic creditors
• Interest revenue from loans to business partners
• Semi-finished products
• Raw materials
• Auxiliary materials
• Sales costs
• Sales revenue for company-produced products and services
Each cost element defined by an account listed as an item in the chart of accounts
belongs to only one chart of accounts, although a similar item may appear in other
charts belonging to the same client. You may use whatever titles for these accounts
that suit your business, if they are acceptable to your accounting authority.
The purpose of the chart of accounts is to record values and value flows. Financial
Accounting uses the chart items for the external accounts. Management
Accounting uses chart items in conjunction with the controlling database to assess
progress and plan for the future.
Using Company Codes
The company code is an ID number assigned to the smallest organizational unit
that is allowed to compile an independent set of financial documents for external
reporting. Every transaction and supporting document has to be tagged with a
company code if it is to contribute to the balance sheet and the profit and loss
statement of that organizational unit.
Using Companies
A company comprises one or more company code organizational units. The
individual company code financial statements are consolidated to generate a
company balance sheet and a profit and loss statement. It is customary to structure
an international group as a series of affiliated companies. Each country usually has
a separate company and is represented by an SAP R/3 company code identifier.
When several countries share accounting conventions, they are coded as a single
entity. Each “Region of Legal Force” is defined on the basis of the legal and
accounting practices customary or, indeed, mandatory in the geographical territory.
The SAP database recognizes a set of these regions according to the directions you
have established by customizing. Any country or region of legal force may contain
more than one company affiliated to your group.
Using Business Area
If the division of a company into company code units does not exactly match the
management accounting requirements of a corporate group, business areas may be
defined by assigning separate areas of operations or responsibilities, for example,
for subsidiaries or specific product lines. A business area is not legally
independent, although it may compile a balance sheet and profit and loss statement
purely for internal purposes, such as profitability analysis. A business area is
formally defined as an entity of type 2009 and has to be assigned to just one client.
NOTE: The data stored in a business area master record can be drawn from any or all company codes
belonging to the same client.
Using Functional Areas
The classification of expenses in Cost-of-Sales Accounting is achieved by defining
functional areas such as the following:
• Administration
• Sales and Distribution
• Marketing
• Production
• Research and Development
When an expense is posted, the details are assigned to one of these functional
areas. The accumulated data is then available for reporting at any time and may be
used, for example, to compute the profit contribution of a product or group of
products.
There also has to be a method for deciding how any particular expense shall be
assigned. Your system could be customized to suggest that any invoice should be
assigned in the same way as the previous invoice from that supplier. This could
proceed automatically until a new supplier appears.
However, you might want to distribute some of your expenses between several
accounting headings. For this purpose, you can call upon or create a distribution
key to share out the expense.
Defining a Cost Accounting Controlling Area
To enable you to refine your analysis of where your balance sheet costs have
incurred, a system of account assignment objects is available for constructing a
cost assignment structure. Alternatively, you can access a standard structure
suitable for your industry and make a copy of it to be edited to suit your specific
circumstances. The main cost assignment objects are the cost center, the order, and
the project. You may also define a cost object based on a convenient product unit
or, indeed, on any data object that can collect costs in a way that is understood by
your company.
If the SAP R/3 system is to operate cost and revenue element accounting, it must
be conducted entirely within a closed unit referred to as a controlling area. More
than one company code can be assigned to a controlling area, but they must all
share a common chart of accounts. This configuration could arise, for instance, in a
group of companies at the company code level that operates a shared centralized
cost accounting facility.
CAUTION:
A cost and revenue element accounting system can only work if each posting in the controlling area includes
not only the cost or revenue element but also information on where the costs were incurred and the purpose
of this expenditure.
Using Controlling Areas
The controlling area is formally defined as a self-contained organizational unit
within a company or group that is able to perform Cost Accounting. It is created as
a master record of entity type 4017, “Cost Accounting Area.” A controlling area
can include more than one company code, and each of them can be operating in
different currencies. A master currency will be defined, however, and the
companies must all share the same chart of accounts. Internal allocation
transactions must be confined to objects within the same controlling area.
If a system of controlling areas is not defined, the corporate group is assumed to be
the effective controlling area. A cost accounting area ledger is maintained to
represent the value movements in the cost accounting area.
Using Cost Elements and Revenue Elements
The cost elements are the account items of the chart of accounts that are used for
entering, classifying, and recording the values of production resources consumed
in a controlling area.
Revenue elements are the account items of the controlling area chart of accounts
that are used to record the value of products sold.
Using Profit Centers
Any convenient scheme of subdividing a business organization can be used to
define profit centers because they are set up purely for internal management
control. They have to be defined within a Cost Accounting controlling area. Their
purpose is to record the value of operating profit calculated by either or both of the
two methods, namely, Cost-of-Sales Accounting and period profitability analysis.
Using Investment Centers
The investment center concept is developed from the profit center by allowing a
profit center to incorporate restricted asset values when calculating profit. An
investment center is created in a profit center master record. The transfer of
balance sheet items is performed by running the period end reports for transfer of
balance sheet items to a profit center.
Using Cost Centers
A cost center is a physical place where costs arise or a conceptual entity to which it
makes sense to assign costs. A system of cost centers can be established on the
basis of any scheme that is useful. The following methods are often used:
• Cost centers relate to functions or functional requirements.
• Cost centers relate to the cost allocation criteria.
• Cost centers correspond to the different activities that consume costs.
• Cost centers correspond to the various services provided.
• Each geographical area is treated as a cost center.
• Each trading area is treated as a cost center.
• Each plant or group of plant resources is controlled as a cost center.
• Each area of responsibility to which a named manager is assigned is
controlled as a cost center.
One of the useful roles of a system of cost centers is to enable you to apportion
overhead costs to sales activities as part of the cost calculation procedure. If you
wish to exercise a cost control function, the costs attracted to a specific cost center
may be the first object of your attention. Where your company handles many
orders of a similar nature, the continuous monitoring function of a cost center may
be very informative. If your business is characterized by large individual orders,
you may not wish to assign them to cost centers because each order can be usefully
monitored individually.
Using Activity Types
Although a cost center can be defined as a place where costs are incurred, it may
not be very informative about exactly how those costs were accumulated. If you
can divide all the work of your company into different activities that take place in
various quantities in your cost centers, you are in the position of being able to
calculate the cost of activities in terms of the value rate per quantity. You can then
predict how the costs of a cost center are likely to change if the quantities of
activities performed there were to change in the future, or if some of the activities
were to be abandoned altogether. You might also be able to form a view on how
much it might cost if some activity is moved from one cost center to another.
To make use of activity types, you need a price list and information on exactly
what factors were used when compiling this list of activity prices. If you have a
system of virtual, as opposed to location-based, cost centers, you can assign
activities to them without regard to the practicalities that would be taken into
consideration if you wished to transfer activities from one location to another. You
can do both by planning a work item in a conceptual cost center and later assigning
these activities to a physical cost center with the personnel and other resources that
are needed.
Using Order Types
An order is a convenient assignment object for controlling by Cost Accounting. It
can describe a simple task or work package in a controlling area and is a
convenient recording focus for planning, monitoring, and allocating costs in
situations where the driving factors are the activities and sequence of actions
needed to meet the order. An order can also represent a computation or
measurement process that is carried out for accounting or controlling reasons. If
you view orders in terms of their different business goals, you will recognize the
following different types:
• Production orders
• Assembly orders
• Run schedule orders
• Process orders
• Plant maintenance orders
• Orders with revenue
• Capital investment orders
• Overhead cost orders
• Results analysis orders
By and large, orders are the favored control instrument for discrete events or
limited series of associated events, whereas the cost center is preferred when your
business operates with a continuous flow of similar orders that is likely to carry on
year after year.
The list of business goals, which can be differentiated by the various types of
order, can be extended by including the more complex data structures that can be
used as cost assignment objects. Project and networks are in this class.
Using Projects
A project has to be assigned to only one cost controlling area because it is used to
control and monitor the various aspects of a business that are needed to complete
complex tasks on time and within budget. A project, for example, can serve as the
cost assignment object for all the costs incurred by the following activities:
• Planning, controlling, and monitoring the schedule of work
• Allocating and valuing resources
• Planning and monitoring activity capacities
• Controlling costs and revenues
• Monitoring funds availability
Using WBS Elements
The work entailed by a project can be represented by a work breakdown structure
(WBS), which is formally represented as a WBS element in the SAP R/3 PS-
Project System. A WBS element can be part of a task and may itself comprise a
complex work structure that is best represented by a WBS, and so on. A WBS
element can act as a cost assignment object. These ideas are discussed in Chapter
8, “Controlling by the PS-Project System.”
Using Cost Objects
A cost object is a unit that is used as a cost assignment object in Cost Accounting.
You can use some types of SAP R/3 data structures as cost objects. For example,
you can use instances of the following entities from the logistics modules as costs
objects:
• Procurement order
• Material
• Production order
• Assembly order
• Run schedule order
• Process order
• Network
If none of the available objects is convenient to use as a cost assignment object,
you can create one manually as a “cost object” entity.
Using Business Processes
You may have defined your cost centers so that all your business processes are
located neatly in the cost center structure. If this is not convenient, you can group
tasks performed in different cost centers and assign them to a business process
master record so that you can process them as if they were co-located. You may
have many cost centers, for example, that each require a system update or plant
maintenance function to be carried out by a specialist team. The work of this team
could be associated with a business process master so that its costs and profitability
could be measured.
If you name a business process and make it a cost assignment object, the reports
will tell you what resources have been used in this process. You will be able to
explain why these resources were used in the reporting period. On the other hand,
the cost center with a physical location in a specific plant has a named manager so
that the reports can tell you who managed the resources and where they were
applied in your organization.
Using Profitability Segments
The CO-PA Profitability Analysis module works with a specific assignment object
to which costs and sales revenues may be posted in order to compute the
profitability of the business entities associated with it. This assignment object is
defined as a profitability segment and it may be defined in terms of any
combination of cost or revenue objects available in your system.
For example, you can use customers, products, and sales organizations as the basis
for a profitability segment definition. You can also define a profitability segment
according to a classifiable attribute, such as the orders that are valued over a
specified amount.
Using Operating Concerns
If you have many profitability segments defined over one or more controlling
areas, you may nevertheless wish to recognize that the sales market for part of your
organization is structured in a uniform manner. You can combine the profitability
analyses of the profitability segments in this uniform sales market by assigning the
segments to an operating concern master record. The profitability analysis can then
be conducted and reported separately for each operating concern.
Using Object Classes
The CO-Controlling application supports many different types of cost assignment
objects so that you may perform control and management tasks on your specific
company, no matter how it is organized. These cost assignment objects are
conveniently classified according to the type of controlling activity in which they
take part, although some of the types of objects are to be found in many different
business activities. The main object classes are as follows:
• Cost centers are typically used in overhead cost management.
• Cost objects are typically used in production cost controlling.
• Capital investment orders are typically used in investment management.
• Profitability segments are typically used in profitability analysis.
Cost assignment objects can be assigned to an object class automatically under
control of the module in which the object is created. Alternatively, you can arrange
for the assignment of the cost object to be controlled by a key assigned in the
master record for each project or order.
Using the Processes of Profitability Analysis
The functions of SAP R/3 in the CO-PA Profitability Analysis module are
designed to provide extra information to enable you to take action when you have
calculated the contribution margin or the overall contribution to operating profits
arising from business activities in the different parts of your company. For
example, you can apply PA results in the following activities:
• Pricing
• Sales terms and sales policy elaboration
• Quantity control and allocation to productive resources
• Allocation and evaluation of distribution channels
• Marketing
The SAP R/3 functions needed for profit center accounting are located in the EC-
PCA module (Enterprise Controlling-Profit Center Accounting). They can be
integrated with the CO-PA functions.
The profit center concept is designed for decentralized organizations in which the
units are accounted as separate entities, and operating results have to be published
for these units. You can control how these profit centers are specified. For
example, you could map your profit cen-ters on products, on divisions, or on
product groups. You might want to treat your main functional activities as profit
centers, such as Production, Sales, and Service. On the other hand, the most useful
scheme of profit centers for your company might be based on geography in terms
of the location of regional distribution centers, plant locations, branch offices, and
so on.
Using Methods in Parallel
The CO-PA module enables you to compute profitability by several different
procedures in parallel. The following procedures are available:
• Interim sales analysis in which the sales revenues are calculated on the
basis of standard costs.
• Sales analysis based on full costs and marginal costs to yield contribution
margin results.
• Fixed costs assigned to profitability segments in proportion to sales.
• Fixed costs assigned to profitability segments using a cost pool allocation
sequence.
• Supplementing interim sales analysis with production and cost center
variances from planned values to produce a final sales analysis that can be
periodically reconciled with Financial Accounting data.
Using Variants of Profitability Accounting
The FI-Financial Accounting application is able to conduct various forms of
profitability accounting without recourse to the PA application. There may be a
strong case in your company, however, for installing and configuring the PA
module because it enables you to follow up in detail any promising leads that are
suggested by the basic PA computing conducted in the FI application. The
following sections explore some of the possibilities.
Using Relative Direct Cost and Contribution Margin Accounting
If you choose to leave out indirect costs from your profitability analysis, you can
assign costs and revenues to any level of your cost assignment structure. This
enables you to compute the costs and profit contribution relative to any aspect or
point of view of your company that is represented in your cost assignment object
structure.
For example, you could have defined a profitability segment so that it collated data
for a particular region and a single product. If you conduct a sales campaign in this
region for this particular product, the periodic costs could be assigned directly to
this segment and, thus, take part in the profitability analysis for this product. If
your system already maintains a separate account for this product in this region,
then there is no need to specify a profitability segment for it in the PA module. In
the same way, the revenues in this region from this product appear in the
calculation of its contribution margin.
Using Account-based Profitability Analysis
You can calculate profitability by comparing posted revenues and sales deductions
with the imputed costs and sales deductions. However, you can leave out the
imputed costs that are based on costing calculations carried out by the CO-PA
application. The effect is independent of any profitability segments because the
profitability results are based on the existing accounts. These results, of course, can
be reconciled with the General Ledger at any time. This method is equivalent to
defining your profitability segments exactly in accord with your existing accounts.
That way you can show the operating results in the accounts of the General Ledger
and thus ensure reconcilability with Financial Accounting at any time.
Using CO-PA and EC-PCA for Period Accounting
CO-PA uses the Cost-of-Sales approach to compute profitability. EC-PCA also
uses this approach, as well as the Period Accounting approach. You can have both
methods used in parallel.
Identifying Profitability Segments
CO-PA depends on your defining profitability segments as the assignment objects
for cost data, quantities, and revenues. In order to prevent you from having to take
up any standard point of view, the system enables you to specify any characteristic
or attribute to become one of the dimensions of a reporting structure, which is
stored as a profitability segment master record.
If you define one dimension to be the manufacturing plants in your company, for
example, and you have four, then this dimension of the profitability segment will
have four divisions. Suppose you had three product groups that were manufactured
in these four production plants; then you could have a two-dimensional
profitability segment of 12 cells representing the three product groups combined
with the four plant units.
In another example, if you were to call for the profitability to be analyzed
separately according to the distribution channel, and you had five, then the three-
dimensional profitability segment would have 60 cells. Each of these 60 cells could
be subjected to individual analysis of costs and revenues in order to determine its
profitability. For instance, you could have the results displayed in rank order so
that the first item in the list would be the most profitable cell. This cell would be
computed by selecting the costs and revenues for only one of the three product
groups, only if they were attributed to one specific plant, and only if they were
associated with one particular distribution channel.
This example used the plant, product group, and distribution channel as the
defining char-acteristics of the profitability segment. You could have set up other
dimensions provided your system is holding the data necessary to identify when a
posting should be assigned to the profitability segment in the Profitability Analysis
module. You can apply logical and mathematical conditions to set up profitability
segments, as in the following hypothetical definitions:
• Electronic sector product group in the company operating regions using
the customers in the top sector according to credit worthiness.
• Retail customers who have not bought for over one year.
Understanding Integrated Data Flow
You can trace the flow of data for Profitability Analysis along various routes. If
you post a billing document or an incoming sales order from the SD-Sales and
Distribution application, the Profitability Analysis module is automatically posted
with the sales quantities, the revenues, and the Cost-of-Sales deductions.
There may be direct costs that should be assigned to an intermediate level in your
cost assignment structure because they are not associated with the lowest level cost
objects in any straightforward manner. You can do this manually in the
Profitability Analysis module.
The costs of goods you have manufactured can be obtained in the form of product
cost estimates or as material prices in make-to-stock production. Alternatively, you
can settle costs from the customer orders or from projects.
The CO application enables you to specify in advance how Profitability Analysis
shall be assigned costs in the following situations:
• When supplier invoices for wholesale or retail are received
• When costs of services are posted in Financial Accounting
• When internal activities are allocated by direct postings
If you are operating with cost centers or internal orders, you can have the overhead
costs allocated to profitability segments. You can also have them subsequently
updated to actual costs by transferring, as period costs, any variances from
production orders and cost centers.
If you have installed and configured the SD-Sales and Distribution application, the
necessary information is automatically available to the FI system. If the integrated
SD application is not available, you must set up the complex interfaces into FI that
acquire the data relevant to sales by extracting it from the sales documents, such as
the sales inquiries, quotations, and sales orders.
Understanding Analytic Sales and Profit Planning
In order to generate a sales and profit plan, you have to call on the CO-PA facilities
that provide for periodic distribution of costs, projections, valuations, and all the
logical and arithmetic functions. The automatic planning functions include the
following facilities:
• Copy previous year plan
• Copy previous year actual figures
• Top-down distribution of planned values
• Revaluation of existing plans
• Saving of plan data at any level of the profitability segment structure
• Multi-year planning
Semi-automatic planning in profitability segments is possible in either of the
following modalities:
• You enter plan sales quantities and revenues, and the system calculates
sales deductions and costs automatically.
• You enter plan sales quantities, and the system uses price list catalogs to
calculate the revenues automatically.
• You enter contribution margins, and the system calculates the sales
quantities necessary to realize them.
The idea of sales and profit planning is to set the processes of planning, not only
for sales, production, and procurement, but also for investment, personnel, finance,
and profit.
Reporting from EC-PCA and CO-PA
EC-PCA provides profit center reports in the form of listings. CO-PA uses the
structure of your profitability segments to direct interactive drill-down reporting.
The combined integrated system enables you to define reports in terms of the
following reporting display structures:
• Layout definitions and forms
• Line or contribution margin structures
• Key figure formula definitions
• Predefined report headers
The full array of standard and custom reports is available as a standard reporting
tree display that can be customized by the user.
While you have a report displayed online, the following manipulations are
available:
• Drill down
• Information on the origin of the data in a line item
• Period breakdown
• Overview list
• Detail list
If you are able to specify the exception conditions or define the characteristics of
the records that interest you or their data, then you can store this search procedure
and use it again to focus your scrutiny of the reported Profitability Analysis results.
Decentralizing Profitability Analysis
The advantage of ALE (Application Link Enabling) is that several computers may
share integration of applications. In particular, Profitability Analysis can be carried
out in a central function having had all the decentralized profit-related transactions
passed to it. You can carry out cost and profit planning in CO-PA from the
decentralized installation and pass the data to central planning where the cost
center data can be integrated with it.
One of the key distinctions to be made is between the information that can be taken
directly from a sales document and the information that has to be derived from
other sources of data. For example, you can add up all the quantities and prices of
the products and services sold in a time period and by a particular sales team. What
you cannot extract from the sales documents is a value for the materials and other
resources that your company has expended in order to produce or procure these
products and services. You may have set your prices to factor in some of these
indirect costs, but a profitability analysis that will be of most use to you is one that
can go back to basics. You may wish to explore how the PA results change if you
alter the production facilities, for example.
Choosing PA Classification Characteristics
The system offers you a list of proposals based on the profitability segment
characteristics that users most often find convenient. You may also choose from
this list and create your own. Your scheme of profitability segments is time-
stamped so you can refer to it later and subject it to status control in order to ensure
that the correct version is applied on each occasion. For example, you may want to
rearrange your territories as markets develop, or you may need to change to a
different PA structure.
Your circumstances and intentions determine what kind of Profitability Analysis
structure is going to be most effective. You may elect to install several methods to
be run in parallel, but several factors have to be evaluated before data structures are
defined.
You may have a number of objectives in mind when designing a PA system, of
which the following are but illustrations:
• Sales management aims and methods.
• Depth of detail required in the analysis, and an estimate of how this level
of detail is interpreted.
• Reconciliation with Financial Accounting.
• Methods for ensuring a flow of imputed values into the Profitability
Analysis, or a reliance on actual costs.
• Whether all the costs or a portion or sample are used for Profitability
Analysis.
• The accounting and computation procedures to be used.
The procedures to be applied are taken from the following list, although several
may be operated in parallel:
• Up-to-the-minute Cost-of-Sales Accounting per product and per
customer using standard cost valuation.
• Summary level profitability segments updated by periodic calculation of
actual cost variances compared with planned costs.
• Net Profitability Analysis of operating units using staggered allocation of
fixed costs.
• Account-based PA using only profits that can be reconciled with balance
sheet accounts in Financial Accounting.
• Period Accounting PA.
The operating results of your company can be computed in various ways according
to the way you collate the data and structure the reports. Choices have to be made
in three main dimensions:
• Analyze by periods or analyze by transactions.
• Apply Period Accounting or Cost-of-Sales Accounting.
• Analyze according to General Ledger accounts or analyze according to
cost origins.
If you elect to analyze according to cost origins, you have the choice between the
following:
• Cost-of-Sales using interim reports and standard costs.
• Cost-of-Sales using final reports and actual costs.
In the matter of computing the Cost-of-Sales, there is a further choice between the
following:
• Net Profit Analysis based on full costing.
• Gross Profit Analysis based on partial costing results.
If you choose net Profit Analysis based on full costing, there are two options as
follows:
• Proportional fixed costs
• Fixed cost lump sum
The reason there are so many possibilities to choose from in Profitability Analysis
is that there are at least two target readerships for the results. Sales managers want
to formulate plans for active marketing, while company directors want to present to
shareholders a valid and favorable analysis of the entire company and be able to
explain the main sources of profitability.
Making Use of Key Figures
Cost-based Profitability Analysis makes use of key figures stored in the database.
The following data structures can store key figures:
• Associated quantity and value fields (duples)
• Calculated values, such as contribution margins and net profit
A duple is used to store quantity and value at the lowest or finest level of detail that
is required in the Profitability Analysis in order to handle quantities, revenues,
sales deductions, and costs for each profitability segment. Both actual and plan
data can be stored in this way.
This PA database holds data that cannot be stored in Financial Accounting because
it refers to objects that are more detailed than the account assignment objects
needed for the balance sheet and the profit and loss statement.
The standard system provides 120 value fields that can be used to differentiate the
source or purpose of the value stored. You can differentiate revenues from external
customers, for example, and revenues from affiliated companies. You can also
assign credit memos and discounts to separate value fields.
Costs derived in other FI and CO modules that are used in PA are also stored in
value fields. Possible sources of cost data are SAP R/3 modules that have to be
installed and configured in your system. Some of them are noted in the following
list:
• Cost of goods manufactured from CO-PC Product Costing.
• Cost of goods manufactured and cost of goods sold from sales orders
and from projects using the CO-PC and PS-Project System modules.
• Costs from overhead projects and orders using the PS or CO-OPA Order
and Project Accounting modules.
• Variances from production orders derived from the PP-Production
Planning application.
• Fixed costs, variances, and internal activities from the CO-CCA Cost
Center Accounting module.
• External data acquired from invoice receipts via the MM-Materials
Management module (MM).
• Direct postings from FI-Financial Accounting .
• Imputed costs from the CO-PA Profitability Analysis module.
Revenues, sales deductions, and costs are well represented in the key field
proposals offered to you by the system when you are setting up your Profitability
Analysis structure.
Planning Sales Quantities and Profits
The planning of sales quantities, revenue, and profit in the context of corporate
planning is the exclusive province of the SAP R/3 CO-PA Profitability Analysis
system. The business segment is the focus of this planning, and the fine details are
held in the key figure section of the PA database.
The possibilities of business segment planning include the following:
• Planning the sales quantity for a business segment.
• Using the planned sales quantity and the values available to the system
for revenue, discounts, rebates, and so on to compute the planned gross
revenue and planned net revenue.
• Transferring the planned costs, such as manufacturing cost and cost
center overheads, from the CO-Controlling system, and calculating the
planned profit for a business segment.
• Planning all fixed cost allocations at different levels of the segment.
The CO-PA Profitability Analysis system enables you to plan sales quantity data
for any number of business segments, defined as you wish. You can plan down to
the level of the individual key figure. There is no need to specify a permanent level
at which planned values and quantities are entered because each plan is treated as a
version with status control and a specified period of validity. Each business can
operate sales and profit planning in the most informative way and change it to meet
movements in the markets.
Planning in CO-PA carried out at the level of sales quantity and revenues can also
be transferred to SOP (Sales and Operations Planning) in production. Thus, a sales
plan created in CO-PA can be used as input to a production plan. The production
plan in turn derives the costs of production from product costing CO-PC. This
module in turn provides information back to CO-PA to enable it to compute the
planned costs of sales for the originally planned sales. This yields a value for the
planned cost contribution. This is a good example of how complex plan integration
is possible using standard SAP R/3 modules.
Using Revenue Element Accounting
The Generally Accepted Accounting Principles (GAAP) require that the values
recorded in the accounts of a company shall be in a permanent state of
reconciliation. In order to comply with this requirement, an online accounting
system has to maintain a journal, a set of account balances, and all the documents
to support them. The SAP R/3 system meets these conditions and, in some
respects, exceeds them.
In particular, revenue data transferred to CO-PA Profitability Analysis can be
reconciled with the posted revenue in FI-Financial Accounting.
In company codes in which the sources of revenue are not readily matched to the
revenue elements of the CO-PA Profitability Analysis system, it is usual to utilize
the facilities of the FI-SPL Special Purpose Ledger to associate the revenue
sources with the appropriate items chosen from the lists of origins recognized by
this component. The additional subdivisions of revenue accounts that are supported
by the FI-SPL Special Purpose Ledger remain reconciled with the FI-GL General
Ledger revenue accounts. The advantage of calling on the extra analysis
information available through the FI-SPL Special Purpose Ledger is that it enables
accurate reconciliation with the revenue elements of the CO-PA Profitability
Analysis component.
Estimating Revenue Elements
It may well happen that the billing data transferred to CO-PA Profitability Analysis
is not accurate and revenue elements may have to be estimated. A sales deduction,
for example, could be estimated as, say, 10 percent of domestic sales revenue, on
the grounds that a previous analysis supported this as a reasonable prediction. The
benefit is that the CO-PA Profitability Analysis system can provide a complete and
up-to-date estimate of gross and net revenues as soon as the billing takes place.
Such estimated sales deductions are usually posted and transferred to FI-Financial
Accounting, where they can be balanced with the actual sales deductions when
they become available. If necessary, the CO-PA Profitability Analysis system then
adjusts the calculation for future estimates.
There is a difference between account-based PA and costing-based PA:
• For account-based CO-PA, the cost of goods sold is transferred at goods
issue time to ensure reconciliation with FI-GL.
• For costing-based CO-PA, the cost of the sale is only transferred at billing.
The logic is that in costing-based analysis, you never record a cost of a sale
without posting the corresponding value of the sale revenue.
Developing Multiple Planning Versions
One of the applications of multiple versions of a plan for a particular time period is
to be able to hold different views of the future course of business. For instance, you
may have a preliminary version of a plan that is saved but also edited to become a
current version, and later made up as the final version. Another classification of
planning data can depend on the differing requirements of management, sales, and
production. You can also maintain different plan versions to show particular
content and levels of detail. You could perhaps conduct sales monitoring by
comparing plan, target, and actual quantities and values.
You may copy and extrapolate data from one plan or actual data block to other
time periods. If you have a suitable interface to another planning system, this data
can be imported to the CO-PA module. Your draft plan may be updated by
applying percentage additions or reductions. A re-evaluation function is also
available to revalue a complete profitability segment or each value field separately.
The standard techniques of top-down and bottom-up planning can be used. You
can enter or copy high-level planning values and have the system distribute them,
or you can enter or copy the low-level figures and have them rolled up to generate
planning values for higher levels of your planning structure.
Planning the Cost of Sales
You have the ability to transfer known costs from other applications and impute
unknown costs. You can use the following sources of cost data, for example, in
your plan:
• Special direct costs from sales orders.
• Pricing elements from Inventory Management.
• Costing results from Product Costing.
• Fixed costs planned in cost center accounting.
The plan can split costs into fixed and variable components for each profitability
segment and can also identify the cost of goods manufactured and the cost of
goods sold. If you have planned sales quantities across periods, you can use these
values as proportions to distribute the annual planned costs. You can also create
your own set of proportions to have the distribution reflect what you anticipate or
intend to be the pattern of business over the time scale for which you are planning.
The sequence of planning is usually similar to the following:
• Identify the managers for whom the planning is to take place.
• Arrange the source data into convenient blocks.
• Eliminate or aggregate very small amounts or special transactions.
• Review the time sequence for the plan data objects separately for each
manager.
• Adjust the plan data.
The R/3 method of transferring plan data to create alternative plan versions is
applied in corporate planning so that the various business area plans can be
combined to contribute to a corporate plan. In addition, the values planned at the
corporate level can be used as the basis for lower-level planning.
NOTE: The cycle of top-down and bottom-up planning can be repeated as often as necessary to build a refined
planned by iterations and adjustments.
Budgeting Sales Promotions
Sales and promotion budgets are managed in PA as budget versions in the same
way as other plan versions, and any profitability segment can be assigned a budget.
The budget amounts are distributed according to the plan structure you have
established. This structure may have an associated distribution function that
automatically allocates a budget top-down to profitability segments.
A budget is subject to status control and can be adjusted and updated in a plan
version before being released. After a budget has been released, there can be no
changes to the planned values unless the release is canceled by a person authorized
to do so.
Operating CO-PA
The Profitability Analysis module is fully engaged in the flow of data between the
R/3 Logistics, Financial Accounting, and Controlling applications. Either in real-
time or in periodic batch processing, the PA system acquires the following classes
of profit-related data:
• Sales quantities, revenues, and sales deductions from SD-Sales and
Distribution.
• Cost of sales for account-based PA from goods issued in SD.
• Cost of goods manufactured from CO-PC Product Costing or from the
material prices in the materials masters of MM-Materials Management.
• Costs and revenues posted directly from invoice receipt in MM.
• Costs and revenues posted directly from FI-Financial Accounting.
• Costs and revenues in make-to-order production from sales orders and
project settlement in SD and the PS-Project System.
• Cost center costs or cost center variances from CO-OM-CCA Order
Management, Cost Center Accounting.
• Internal activities posted directly from CO-OM-CCA.
• Indirect costs of internal orders from CO-OM-OPA Order Management,
Order and Project Accounting.
• Production variances arising from the settlement of production orders in
PP-Production Planning.
If your implementation does not include the integrated sources of profit-related
data, or if you are running the CO-PA module as a standalone application, you can
import the necessary information through an established open interface. However,
you must establish the details to customize the SAP interface in order to enable
your system to acquire the sales data. Using an integrated SD system is the
recommended alternative.
Calculating Gross Operating Profits
There are several accounting conventions for arriving at gross operating profits.
They may all be used by posting direct costs and revenues and then allocating
indirect costs to the appropriate level of the profitability segment structure. The
following methods are used to value gross operating profits:
• Make-to-stock production and wholesale-retail trading may arrive at a
gross operating profits valuation by applying a proportional rate.
• Production related to sales orders will compute gross profits from the
order results analysis and order settlement data.
• The service industry will value gross profits by comparing direct cost
postings and revenue postings.
Using Valuation by Proportional Rate
Make-to-stock production and the wholesale and retail trading industries typically
process standard products. When billing occurs in the SD application, revenues and
sales deductions are transferred to Profitability Analysis. If costing-based PA is
being applied, the system computes costs for these sales by adjusting standard cost
estimates and valuing imputed costs.
If account-based PA is being applied, the system determines the cost of sales at the
time goods are issued by referring to the valuation of the change-in-stock posting
that has been made to Financial Accounting. If any imputed sales deductions and
costs were also posted to Financial Accounting, they will be transferred to CO-PA.
Any costs or sales deductions that are not posted to a balance sheet account is not
recognized by PA when account-based PA is being applied.
The use of a profitability segment depends on recognizing when a transaction is
relevant to it, in the sense of having the characteristics that were used in defining
the segment. The system automatically uses the sales order for customer, product,
and distribution channel information. The customer master record and the material
masters provide other sources of data that are needed to assign a transaction to a
profitability segment. If you have specified characteristics to define a profitability
segment that cannot be obtained automatically, then you can enter them manually
on the order document by choosing from a list so that the transaction is attributed
to the correct profitability segment.
Using Simple Margins Analysis
From a sales perspective, it is very helpful to have a continuous picture of
operating results. Margins analysis uses formulas based on percentages, quotas,
and specified fixed amounts. The calculations can proceed in steps, of which the
following is an example sequence:
1. The posted revenue is subject to a percentage discount that is
dependent on the sales total to yield the net revenue.
2. The net revenue is reduced by a profit margin defined as a specified
fixed amount per unit sold and further reduced by a profit margin defined
as percentage of the net revenue to yield the profits at stage one.
3. The stage one profits are reduced by another profit margin, based on a
percentage of the stage one profits to yield the stage two profits.
This example uses three profit margins calculated in different ways to convert the
posted revenue value in the period to a profit value. These calculations do not
depend on a value for the cost of goods manufactured, but they do give an
indication of the gross profit contribution margins.
Determining the Net Operating Profit
Contribution Margin Accounting has to bring in the revenues and associated cost
of goods manufactured and also the other direct and indirect costs. It is usually
impossible to associate these other overhead costs with specific orders, products, or
customers, but they can be assigned to profitability segments. The CO-PA system
enables you to calculate profits using either full costs or marginal costs.
The costs arising in a cost center are allocated to just one profitability segment.
These include fixed costs from administration, sales, inventory management, and
general functions. Part of the fixed costs will have been assigned in proportion to
the imputed costs of goods manufactured for the product. The remainder of the
fixed costs are allocated to individual profitability segments on a periodic basis.
The following allocation methods are supported:
• Allocation to any combination of profitability segment characteristics
• Allocation to one or several profitability segments
• Allocation to profitability segments specified individually or by range
• Allocation in accord with predefined fixed and variable cost distribution
keys that control fixed percentages or rates dependent on revenues of the
destination segments
Forecasting from Incoming Orders
Data from orders coming in to the SD application can be transferred to Profitability
Analysis where the date of receipt of an order is treated as if it were the settlement
date. Therefore, it is valued at the rates then current. This order forecast data is
maintained as a separate database and aggregated periodically.
NOTE: The ad hoc forecast based on incoming orders is usefully compared with the sales and profit plan when
there is only a short delay between order and billing.
Analyzing Profitability Data
The reports available for Profitability Analysis are displayed in a report list or a
report tree. The ad hoc report is an inquiry of a simple kind that can be interactive
and use the drill-down facility, or be a predefined report focused on a form of
analysis frequently required.
More complex reports are needed where there are many options at several stages of
analysis. Exception reports are predefined to issue warnings when specific values
do not fall within the expected range, which you can define for individual rows or
columns of a report. You can also specify thresholds in terms of percentages.
The following report designs are often specified for Profitability Analysis:
• Ranking lists with threshold values to define partitions for ABC analysis in
order to identify the highest and lowest percentage of instances and the
“Top N” selection.
• User-defined classes for analyzing large data volumes graphically and
building cumulative frequency curves.
• Detailed operating results for all the individual profitability segments in a
specified controlling area.
• Detailed step-down report of the contribution margin for a profitability
segment compared with another segment or period.
• Comparison of multilevel contribution margins for selected operating
units.
The following display options are available for all reports:
• Actual quantities and values
• Planned quantities and values
• Comparisons of plan and actual for different periods
• Comparisons of plan and actual for any time period
• Comparisons of different plan versions
Many reporting possibilities exist. It is reasonable to assume that any format is
available, provided the data is available and the characteristics needed to make a
selection are accurately associated with the targeted data.
Handling Large Data Volumes
If you have a large number of profitability segments and many transactions, many
items and totals will be processed. CO-PA generates a profitability segment for
each combination of customer and product, for example, if you decide to make
these two dimensions part of your Profitability Analysis.
If you can usefully define summarization levels in which the data elements for
certain profit-ability segments are aggregated, then you can arrange for these
summarization levels to be consulted when a report is required and, thus, save
processing resources. In the meantime, they can be updated in offline batch mode
when relevant data is detected.
The summarization levels can also provide up-to-date reports if the delta technique
is used. This enables you to add small numbers of line items to the summarized
data just before the report is compiled. The system maintains information on how
efficient the existing sum-marization levels are in providing a data processing
service to those who need the profitability reports.
Using Profit Center Accounting
A profit center is not an independent account assignment object. It derives its
information from existing account assignment objects. The necessary standard
software is provided as CO-PCA Profit Center Accounting. The master record of
each account assignment object includes a field that identifies the responsible
profit center. The profit center is defined by an organizational master record in the
system and can, therefore, store descriptive information, in particular the criteria
that defines which account assignment objects it is responsible for.
Profit centers can be summarized and their results combined on any number of
hierarchical levels and across different hierarchies. The profit center is a way of
looking at a particular selection of transaction data assigned to various accounts to
see how the data affects the operating profit of that portion of business that the
profit center represents.
Using Ledger-based Period Accounting at the Profit Center Level
Profit centers enable you to collate all profit-related posting information under the
divisions of your organizational structure. Every posting is saved simultaneously as
a line item and totals are recorded in the FI-GLX Extended General Ledger. As a
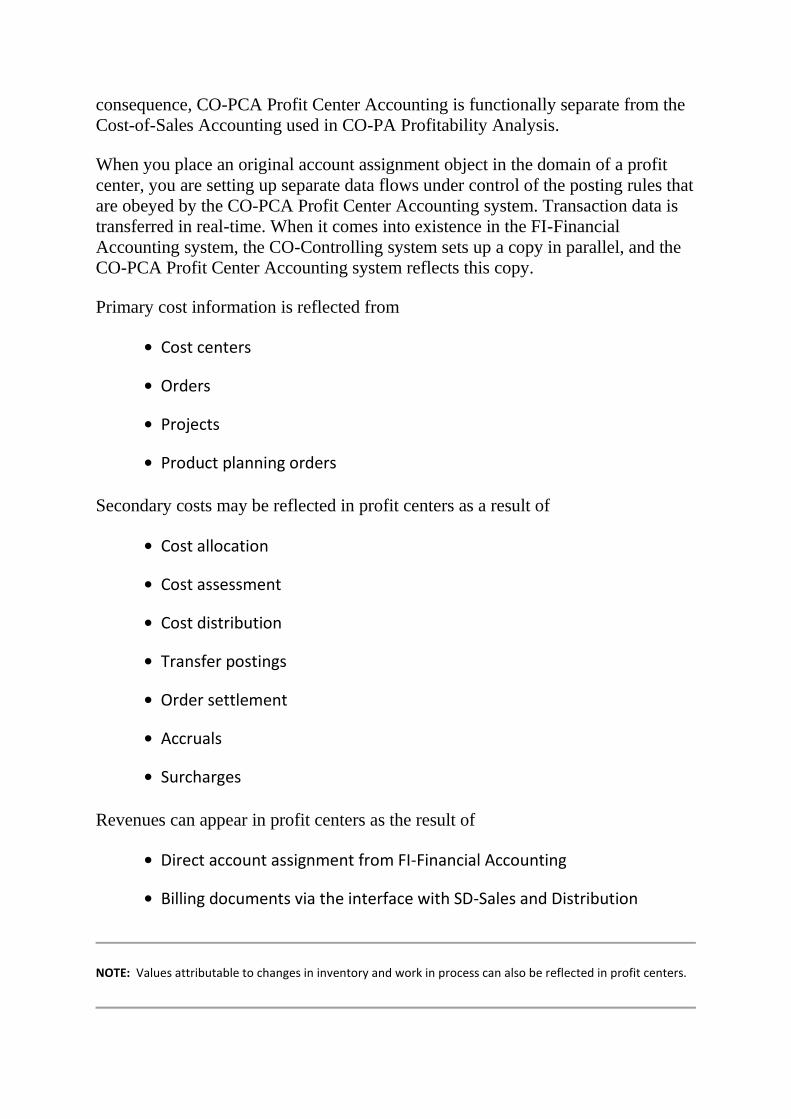
consequence, CO-PCA Profit Center Accounting is functionally separate from the
Cost-of-Sales Accounting used in CO-PA Profitability Analysis.
When you place an original account assignment object in the domain of a profit
center, you are setting up separate data flows under control of the posting rules that
are obeyed by the CO-PCA Profit Center Accounting system. Transaction data is
transferred in real-time. When it comes into existence in the FI-Financial
Accounting system, the CO-Controlling system sets up a copy in parallel, and the
CO-PCA Profit Center Accounting system reflects this copy.
Primary cost information is reflected from
• Cost centers
• Orders
• Projects
• Product planning orders
Secondary costs may be reflected in profit centers as a result of
• Cost allocation
• Cost assessment
• Cost distribution
• Transfer postings
• Order settlement
• Accruals
• Surcharges
Revenues can appear in profit centers as the result of
• Direct account assignment from FI-Financial Accounting
• Billing documents via the interface with SD-Sales and Distribution
NOTE: Values attributable to changes in inventory and work in process can also be reflected in profit centers.
Understanding the Structure of a Ledger-based Period Accounting
Profitability Report
The line item of a Period Accounting profitability report represents an FI-GL
General Ledger account number and its name. The line items can be selected and
organized by hierarchies of profit centers.
There is continuous reconciliation at the company code level between the FI-
Financial Accounting system and the CO-PCA Profit Center Accounting system.
Thus, the inputs to each profit center can be any combination of the following
sources of information:
• Customer orders and projects
• Cost objects
• Fixed assets
• Materials management
• Internal orders and projects
• Manufacturing orders
• Cost centers
Transaction data from any external system or SAP application may be integrated
with the R/3 system.
The benefits of this integrated system include the following insights:
• The flow of the value of goods from one profit center to another is
displayed, having eliminated internal transactions.
• The profitability report reveals the origins of all profit-relevant data.
PART III
Funding, Investment, and Development
10 Managing the Treasury
11 Managing Investments
12 Developments in Financial Management
13 FICO Education and Training
Chapter 10
Managing the Treasury
In this chapter
Using the Treasury Module
Managing Liquidity
Controlling the Treasury
Managing Market Risks
Managing Funds Through a Budget
Using the Treasury Module
The scope of Treasury module functions broadly covers the management of
finances so that funds can be made available to serve the business objectives of
your company. Areas of interest include liquidity forecasting, market risk
assessment, and portfolio planning and management. The relevant SAP R/3
functions can be accessed from the TR-Treasury module.
This chapter introduces you to the following topics:
• How liquidity is monitored
• How the treasury provides funds
• How market risks are managed
Active treasury management entails taking appropriate action as soon as the need
for it can be predicted. To this end, the SAP R/3 Treasury software is capable of
supporting a wide range of planning and evaluation procedures.
The purpose of the TR-Treasury module is to integrate cash management and cash
forecasting both with the logistics activities in your company and with financial
transactions. For example, TR enables you to apply cash-budgeting tools and
commitment-accounting methods that take into consideration the allocation of
responsibilities. These methods also take in the current budget positions and the
sources of the relevant funds to accommodate very subtle monitoring and control.
The TR-Treasury module comprises the following components:
• TR-CM Cash Management
• TR-FM Funds Management
• TR-TM Treasury Management
• TR-MRM Market Risk Management
Applying Cash Management
The purpose of the TR-CM Cash Management module is to plan, control, and
monitor the liquidity of the business and contribute to its profitability, if possible.
The key accounting distinction to be made lies between these two types of
accounts:
• Cash accounts that record actual available liquid assets
• Clearing accounts that represent payments in transit
The operational concept involves taking three steps:
1. Planning all transactions that have payment advices
2. Controlling cash
3. Investing cash
NOTE: A payment advice notice is a document that notifies a delivery, a payment, or the receipt of a
commercial letter of credit in a connection with a foreign trade transaction. A payment notice is a document
sent to a customer or an internal department to confirm a payment, to ask for clarification of any
discrepancies, or to ask how the payments are to be allocated.
The Cash Management method uses SAP’s fully automatic payment routines to
accomplish the following two aims:
• Optimize short-term interest revenue
• Optimize money market transactions
The computer context is a closely integrated system comprising the standard
functions used in SAP Cash Management, the payment program, and FI-AP
Accounts Payable.
Using Cash Management Functions
The TR-CM component enables you to analyze financial transactions for a given
period. Cash Management also identifies and records future developments for the
purposes of financial budgeting. Payment transactions are grouped into cash
holdings, cash inflows, and cash outflows. Cash Management provides information
on the sources and uses of funds to secure liquidity to meet payment obligations
when they become due.
Cash Management also monitors and controls incoming and outgoing payment
flows. The module makes a distinction between current cash position and short-
term cash management. The CM module provides the data required for managing
short-term money market investments and borrowing by ensuring that all
information relevant to liquidity is available to you for analysis purposes. For
example, in bank account management, electronic banking and control functions
provide support for managing and monitoring your bank accounts.
The liquidity forecast function additionally integrates anticipated payment flows
from financial accounting, purchasing, and sales to create a liquidity outlook for
medium- to long-term financial budgeting.
The cash position and liquidity forecast components generally are configured to
cover both foreign currency holdings and expected foreign currency items. The
functions also presented as the SAP Foreign Exchange Management component
are included in TR-Treasury to enable the analysis of foreign exchange risk online
with electronic banking features to enhance the integration with FI-GL General
Ledger and FI-AR Accounts Receivable components.
NOTE: As of Release 3.0, the SAP R/3 Treasury includes tools to analyze money markets, securities, and
derivatives.
Monitoring Cash Management Procedures
The main steps needed to manage cash efficiently are as follows:
1. Store information in the form of payment advices until you receive the
payments.
2. Prepare to clear open items using the information held as payment
advices.
3. Process partial payments, either by open items or by account.
4. Receive bank statements by file transfer, if available.
5. Clear open items by referring to bank statements or payment advice
notes.
6. Update expected cash receipts.
7. Use the payment advices to plan cash flow for a few days ahead.
Managing Cash Accounts and Clearing Accounts
Cash accounts record actual available liquidity; clearing accounts represent
payments in transit. For each cash or clearing account, you can specify individually
how it is to be managed. The SAP standard business functions ensure that all the
items in these accounts are consistent with the balance sheet at all times.
You have five options for managing an account:
• Account to be managed on an open-item basis
• Account to be kept by value dates
• Account to be kept with various currencies in parallel
• Account to be posted automatically by the payment program
• Account to be cleared automatically by using an electronic banking
function
The date in the financial year when the value of an asset is calculated can be
determined by the user and can be specified in the legal requirements of the host
country. For example, a specific account could be managed using the clearing date
as the value date. Another business partner may be allowed to use the posting date
as the value date. For some purposes, it may be convenient to use the end of the
month as the value date.
Linking Cash Management and Financial Accounting
The SAP R/3 system operates on either program objects designed to carry out a
business process or data objects that provide information when it is needed by the
programmed business processes.
Cash management and short-term cash position forecasting depend on having
transaction information made available to the various processes that will prepare
data objects (such as a daily cash report) or plans to control the allocation of cash.
The TR-CM Cash Management module must be assigned transaction information
from the following sources:
• FI-GL General Ledger
• FI-AR Accounts Receivable
• FI-AP Accounts Payable
If a schedule of funds is to be made available, TR-CM Cash Management must be
notified so it may use this information in the forecasting. The Cash Management
function should also know about recurring entries in any of the ledgers.
NOTE: In addition to the integrated functions of Cash Management, this module enables you to enter
expected cash outflows manually. For instance, if you do not have the payroll module of HR-Human Resources,
you could anticipate payroll amounts using a manual recurring entry.
Many relationships between the parts of the SAP R/3 system will already be in
place by virtue of the integrated design of the various modules. However, the
precise details may have to be configured and customized to make the best use of
them in an individual implementation. Naturally, this depends on which
components are installed and which interfaces to outside systems are active.
Processing Payment Transactions
The payment program makes available a wide range of options for payment of
individual accounts and groupings of sets of accounts. The following functions are
possible under this program:
• Enter bank statements quickly
• Optionally clear open items automatically, subject to specified controls,
such as the availability of cash
• Record payment advices and list them for display
• Delete payment advices
• Provide preliminary information about payment orders, checks received,
bank statements, and discounted bills of exchange
• Prepare check deposit slips using default posting instructions
• Manage checks outstanding
• Control checks deposited
• Manage bills of exchange receivable and payable
• Calculate interest automatically
Throughout all these transactions, the integrity of the FI-GL General Ledger is
maintained by the automatic functions of TR-CM Cash Management, FI-AR
Accounts Receivable, and FI-AP Accounts Payable.
Banking with Electronic Facilities
The purpose of electronic banking is to reduce the time needed for entering data
and to support the aim of timely cash management. The methods use data transfer
by portable storage media such as tape or by direct communication line transfer of
files. These files can contain general data or transaction data (in the form of bank
statements) or transaction documents (in the SAP document format or in formats
provided by other systems).
The effects of rapid file transfer include the following contributions to the goal of
quicker, more secure, and more efficient processing and clearing of payments:
• Bank statements can be posted automatically.
• Bank statements can be transferred and clearing accounts can be
processed automatically.
• Data can be transferred to FI-AR Accounts Receivable, and cash receipts
can be processed automatically.
• Bank charges can be posted automatically.
• Exchange rate differences can be posted automatically, and foreign
currency accounts can be managed more effectively.
Clearing Bank Accounts Automatically
The result of automatic bank account clearing is an improvement in your control of
cash—you can process payment advices and clear bank statements on a daily basis.
As a result, liquidity reserves and interest income are optimized.
You still retain the option of intervening in the automatic processes and making
manual corrections. The TR-CM Cash Management position display, for example,
can be arranged to separate specific accounts or groups of accounts. Furthermore,
this module can split the display to differentiate checks, bank transfers, payment
advices, and so on. Amounts and dates can be used to rank-order or divide into sets
the items to be displayed.
Intercompany transactions and the separation into multiple levels of accounts also
is facilitated. You have control over the processing of different payment methods
and the minimum balance to be maintained in each bank account. The system can
be primed to create all the necessary correspondence automatically.
The day-to-day management of short-term and long-term cash flows is integrated
with the CO-Controlling module and its planning capabilities to ensure that fund
reservations are not likely to compromise future liquidity.
Electronic banking functions are associated with payment advice note processing
to enable you to make provisions for automatic adjustment of standard or custom
interpretation algorithms for clearing payments.
TIP: You can carry out a post-processing transaction to gain access to line items that could not be posted
automatically.
Managing Liquidity
Reports from the system enable you to plan for liquidity because you can analyze
payment dates and methods for both commitments and invoices.
Reports online enable you to compare targets, expenses, and receipts in accordance
with the budget system. Down payments, invoice amounts, and final payments can
be gathered into supplementary reports. An individual line item can be scrutinized,
and the history of a commitment can be inspected in the form of the related
transaction documents.
Analyzing Available Liquidity
Cash is money that is available, usually in currency or as a credit balance in a
bank. Cash is available to make payments immediately, as compared to
investments and fixed assets, which are not available to pay debts until they are
converted to liquid assets.
Available liquidity represents the estimated ability of a customer or vendor to settle
outstanding debts promptly. Computing this figure entails initiating two analytical
tasks to gather credit and liquidity information about customers:
• Analyzing customer accounts, their credit limits, their dunning program,
and payment history up to their current account balance
• Analyzing open items, both Receivables and Payables
Defining Credit Limit Control Areas
A credit control area is a set of one or more company codes and a currency for
credit controlling that applies to all company codes in that area. This currency need
not be the same as the currency of any of the company codes in the credit control
area.
You can set a total amount as the credit limit for a group and a limit for each
company in a credit control area. Several credit control areas may fall under one
group.
Different customers can be assigned a shared credit limit account. Any order or
invoice posted to any of these joint holders of a credit limit account causes the
system to check whether the joint credit account limit has been exceeded. For
example, different branches that are treated as separate customers may share a
credit limit account held by the head office.
You can decide which types of transaction affect a credit limit account balance.
Bills of exchange receivable, for example, are often posted to the credit limit
account.
NOTE: If your installation includes the SAP SD-Sales and Distribution application, an automatic check on the
credit limit will take place when you enter an order.
Online customer credit control is essential if you record payments and offset paid
items promptly. You can review the credit situation and the liquidity (available) of
any customer at any time in terms of the following elements:
• Customer credit limit and current account balance
• Payments due
• Dunning program and dunning level in force
• Payment history
Viewing the Customer Payment History
Under your direction, the system can automatically record a payment history for
any or all customers for each month (for up to three months) using the following
factors:
• Number of payment transactions
• Payment amounts
• Average days in arrears for each of the three months
For the most recent period, the data is sorted by net payment and payment under
each specific cash discount arrangement.
NOTE: If your business would be enhanced by having access to an extended payment history of some or all of
your customers, you can set up a special-purpose ledger to have transactions posted to as many posting
periods as you require for each fiscal year. You can also arrange to access the payment histories of previous
years from archived records.
Merely as a simulation or what-if exercise, you can ask to see how the payment
history would change if this customer paid immediately all the items open on a
particular date that you specify. By this means, you can simulate the payment
history report, including the current open and overdue items.
The system also contributes to the payment history of a customer by recording
totals of authorized and unauthorized deductions. The average discount rate is
calculated, as is the interest amount based on the items paid after the due dates,
including items still unpaid on the date you choose for making the calculation. A
fictitious or nominal interest rate is used for these calculations, and you can set this
rate to obtain a fair picture of how much interest has been lost to your company
because of the late payments of this customer.
You can total the amounts outstanding on open items and also on items paid in
arrears. These are sorted by number of days in arrears of the due dates for net
payment or days in excess of the time limits for payments to attract a cash
discount.
Tracking Items
The financial control system relies on tracking uncleared items. You can identify
one or more customers or vendors and then sort their open items in whatever way
is most informative for you.
Similarly, you can determine the column configuration of the report and identify
the periods that interested you the most. You can instruct the system to choose
open items that fall due within any range of dates. When you have found an
individual account that needs your attention, you can display all the open items for
that account and use the flexible line item search facilities to focus on just those
lines that you require.
Controlling the Treasury
The treasurer can take action in the form of financial instruments put into effect
through TR-TM Treasury Management module. To do this with wisdom requires
that you first consider the results of your current liquidity, currency, and risk
positions. Next you must consider the conditions prevailing in the money and
capital markets. Then you can review what actions to take before implementing
concrete decisions in the form of financial instruments in Treasury Management.
This module includes functions for managing financial deals and positions. It
supports you in trading and transferring data to Financial Accounting. Treasury
Management also provides flexible reporting and evaluation structures for
analyzing financial deals, positions, and portfolios.
For short-term liquidity and risk management, you can use money market or
foreign exchange transactions to even out liquidity shortages and surpluses, as well
as to minimize your exposure to currency fluctuations.
In medium- and long-term financial management, your system supports you in
dealing with securities and loans. Specialized functions exist for trading and
settlement: There are control functions for foreign exchange and money market
products, securities, loans, and derivative instruments. Derivative financial
instruments facilitate active Treasury management of interest rates and currency
risks.
The trading area contains functions for recording financial deals, exercising rights,
performing evaluations, and calculating prices (for example, the option price
calculator). In back-office processing, you enter the additional data required for
processing deals (such as account assignment and payment details) and generate
automatic confirmations. Position management functions, such as securities
account transfers or corporate actions relating to securities, are also supported in
the back-office area. The general ledger is updated in the accounting area, which
also offers flexible payment processing functions in addition to valuation and
accrual/deferral methods.
NOTE: By using common organizational elements throughout, various organizational structures, such as a
central enterprise-wide treasury department or “in-house banks,” can be represented in the system. This also
ensures full integration of Treasury into other SAP R/3 components.
The Treasury Management component is designed to support business transactions
from the trading stage to the back-office processing and then to their eventual
posting in the Financial Accounting system.
The scope of TR-TM includes managing the following types of activity and
financial instruments:
• Short-term cash management
• Long-term cash management
• Long-term financial budgeting
• Money market dealings
• Foreign exchange dealings, including spot dealing, forward exchange,
and swap dealing
• Derivative financial instruments, including hedging transactions, swaps,
caps, floors, options, and futures
• Securities management, including buying and selling, maintaining
deposits and portfolios, acquiring and exercising conversion, and
determining subscription and option rights
• Loan management, including fixed-term and at-notice deposits and
loans, both loans granted and loans obtained
• Collateral security management, including encumbrances on real estate
and guarantees
Using Treasury Reporting
The displays and functions provided by the TR-TM component include the
following:
• Up-to-the-minute liquidity, currency, and risk-position data for your
company and its assets
• Portfolio updates and valuations
• Option prices
• Cross rates
• Transaction data monitoring
• What-if scenario simulations in association with IS-IS, the SAP Industry
Solution for insurance companies
Risk-management functions include monitoring of changes in market prices,
interest rates, and exchange rates.
Sharing Functions and Tools
The central functions and tools that can be accessed from all TR-TM components
include the following:
• Partner and address administration
• Investment mathematics
• Flexible instrument generator
• Status-controlled transaction processing
• Correspondence processing
• Limit monitoring
• Real-time reporting
Taking Advantage of the Data Feed Interface
The online Treasury Data Feed component of TR-TM is an Application
Programming Interface (API) optimized for specific information providers. An
API provides a service to your treasury for importing data on the following
essential information:
• Interest rates
• Exchange rates
• Securities prices
• Stock indices
The Data Feed interface takes advantage of SAP R/3 standard data structures
supported by functions that request data from the provider’s interface. The
formatted data is then returned to the SAP market data buffer to be used or stored
for historical analysis.
You define the information you require as a request that references a standard data
structure transmitted to the relevant provider for each individual instrument. You
specify the instrument names that are converted to the names used by the
instrument provider. Remote Function Call (RFC) initiates request through the
SAP Gateway Interface.
The information provider identifies the required market data, obtains permission to
quote it, and delivers it to the SAP R/3 TM module, after having priced this service
and billed the recipient company.
NOTE: A query log of data buffer accesses is maintained automatically by the TM component.
Managing Market Risks
One of the duties of your company’s treasurer is to manage market risks as part of
the task of ensuring the financial viability of your enterprise. The TR-MRM
Market Risk Management module is designed to increase your company’s
competitiveness. The process entails continuous cycling through the following
activities:
• Data collection
• Risk measurement
• Analysis of your company’s exposure to the various types of risk
• Decision on the possible next actions
• Simulation of the effects of taking each of the reasonable next actions
• Active planning of financial instruments that might be needed
• Implementation of the next actions
• Continued data collection
Clearly these processes involve the other treasury and corporate financial planning
functions.
The Market Risk Management module acts as an integrated central risk-control
station with monitoring and management functions. MRM provides access to
information on current and future cash flows, as well as on financial deals already
processed.
The TR-CM Cash Management module provides the underlying support for MRM
by collating all cash flows from your business sectors, such as Sales and
Distribution or Purchasing. In addition, all financial transactions managed in
Treasury Management can be evaluated together with the cash flows generated by
the various operating divisions.
The MRM component provides various measurements for analyzing and assessing
interest rate and currency risks. Market-to-market effective rate and effective yield
calculations are based on up-to-the-minute market data. Such data is uploaded via
SAP R/3 Data Feed, which is an open interface designed to link with standard
information providers. Financial transaction and market position information can
also be accessed by this route.
Managing and Forecasting Cash in the Medium Term
The purpose of a cash management and financial controlling system is to maintain
liquidity to fulfill payment obligations. Short-term management consists of looking
at the current liquidity position and forecasting what the situation might be in a few
days, typically one working week. Medium-term cash management and forecasting
has a horizon that extends to a year.
One product of medium-term financial planning is the annual cash plan. This plan
must show how liquidity is to be secured over the period by exercising financial
control. The annual plan can be set out at any level of detail and for any
arrangement of the organizational structure that the data supports.
TIP: If you set up a simulation of market data and a flow of simulated transactions, you can explore what
might happen in the worst-case scenarios. Then you can perhaps devise a strategy to hedge your market risks,
or at least be aware of their magnitude.
Using an Annual Cash Flow Plan
With modern accounting systems, the financial planning period can be of any
duration because the information to be reported will be assembled online when the
design of the report is used to generate the presentation of the information. SAP FI-
Financial Accounting supports planning in a comprehensive way:
• The fiscal year can be flexible and can comprise any number of periods.
• The multilevel dependencies between totals and subtotals, departments
and sub-departments, and so on, are automatically taken into account
when assessing and distributing planning data.
• Data transfers to and from other systems occur through clearly defined
data interfaces, which can serve the aims of financial planning in addition
to handling their other traffic.
The information sources of most interest to the financial planner are as follows:
• Accounts receivable and payable
• Planned cash expenditures and receipts
• Open orders from customers
• Purchase orders to vendors
The financial planning report must address the following issues for each period of
the plan and for each of the groups within the company that are to be part of the
plan:
• Overall liquidity
• Committed funds
• Types of risk
Controlling Finance
The control process comes into prominence when values set out in the financial
plan are compared with the actual values achieved by the business. A quick
reaction demands a short planning and accounting period so that actual and
planned or budgeted amounts can be compared in time to make a correction. The
SAP FI-Financial Controlling module can provide for cycles of monitoring and
control that range upwards from one day. The TR-TM module can make use of
these cycles.
Managing Funds Through a Budget
Two methods exist for managing funds for a project:
• Accept the results of project cost planning and allow extra costs to be
incurred as unforeseen contingencies arise
• View the results of project cost planning and then decide on a binding
budget for the project
See Chapter 8, “Controlling by the PS-Project System,” for details on using the
SAP R/3 project as a receiver for a budget.
Managing Decentralized Funds
Public accounting is a form of financial controlling that focuses on a budget made
available to cover expenses over the fiscal year or a shorter accounting period.
Recent changes to the methods of financial controlling have made the concept of
public accounting equivalent to funds accounting.
The SAP R/3 FI-Financial Accounting system provides comprehensive support for
two tasks:
• Preparing a budget
• Monitoring the budget by tracking the achievement of targets in each of
the budget’s divisions
These facilities are available to the Treasury modules and are used by TR-FM in
particular.
Preparing a budget entails estimating or assigning target values for the following
cash flows:
• Cash requirements for operations
• Cash requirements for capital investment projects
• Planned cash receipts
You can assign responsibility for providing, managing, and accounting for funds
for each of these items separately before combining them into a total budget.
Under this total, you can then prepare individual plans that set up a division
between administrative and capital budgets.
TIP: You can store a budget with a version number and repeat the process using some or all the parameters as
a model to create a new version.
NOTE: If the proposed applications of funds exceed the funds available, you can identify the funding required
to balance the budget.
Targeting Costs and Revenues
When a budget is translated into planned target amounts for each account subtotal
that makes up the structure of the budget, each target represents the best estimate
of the costs or revenues that will or should be realized.
As the period passes, fresh targets can well arise as a result of operating costs,
investments, and cash receipts that were not anticipated exactly in the plan. Targets
may have to be altered if the budget is not to be exceeded or underspent. The data
for these adjustments may arise from any of the following causes:
• Funds released and allocated to operating areas added to the original
budget
• Amendments to the budget, either in total or in allocation to
subdivisions
• Internal transfers
• Commitment authorizations that can be anticipated to exceed the
budget
• Unexpended balances
• Anticipated expenditures
Checking Available Funds and Paying from Funds
The funds committed are revealed by the purchase orders. The system checks that
these purchase orders do not exceed the funds available.
The cash available is checked, and the vendor invoices may have to be reviewed by
persons responsible for the budget.
When you post an invoice, the system updates the actual data. The system prints
cash payment orders to be signed and passed to the controller.
NOTE: The system can be set up to maintain a cash journal that records all cash transactions by date.
Controlling Public Funds
Public accounting and the controlling of funds in the public sector tend to
emphasize monitoring receipts and expenditures, that is, the sources of these funds
and their applications. The efficient monitoring of payments is an important duty
of public sector accounting.
The overriding principle involves ensuring that the actual expenses and payments
are no greater than the budget. In some circumstances, the aim could be to have the
expenses equal the budget because any underspend may not be allowed to be
carried over into the next accounting period.
In contrast, organizations that seek a return on investment in financial terms might
focus on budgeting for expenses. An underspend of the expense budget may be
welcome. In these commercial circumstances, the cash flow statement is prepared
to safeguard liquidity, to monitor financing, and to analyze investments.
The budget uses a plan to allocate funds to each function and organization unit
over a period or succession of periods. The source of funds is an organizational
unit, such as Area, Division, Department, or Individual. Each source can manage
the application of part of the budget to activities that are intended to add value to
the information or work items passing through the company. The funds can be
applied to the following areas:
• Investments, such as stocks of materials, energy, or partially completed
work
• Output-related expenses, such as raw materials, supplies, or
maintenance
• Serviceability costs, such as depreciation, repairs, or capital investments
that affect the value of the plant
The progress of the funds through the budget period is monitored by using the
ongoing business transactions. Separate records are made of the details of receipts
and expenditure, using the budget structure to allocate them to fund sources (fund-
holders) so that reports can show how the funds were used in relation to the
budgeted targets.
NOTE: Because the structure of the budget need not coincide with the commercial or production structure of
the company, the funds controlling system is capable of providing a sophisticated monitoring and control
mechanism that can be aligned to whatever decision-making activities best serve the company.
Using the Funds Management Module
SAP R/3 Funds Management (TR-FM) is a Treasury component that specializes in
the funds management processes. This module makes a working distinction
between cash position, short-term cash management, and medium- and long-term
financial budgeting. These differences represent the different time scales
appropriate for your particular company. You may need to know your cash
position on a continuous basis, for instance, whereas your short-term cash flow
expectations can perhaps take account of anticipated receipts.
The TR-FM module provides support functions throughout the funds management
cycle, from budgeting to payments. You have functions to monitor expenditures,
activities, resources, and revenues.
Budgeting in TR-FM begins with an original budget that is subject to status control
as it moves to approval and release. The module manages budget supplements,
returns, and transfers.
Budgets are entered for areas of funds management responsibility, which can cover
as many management levels as you require. You can define an area for local
budgeting on the basis of any characteristics that your implementation recognizes.
Funds centers and their hierarchical structure provide a base for top-down
budgeting and represent responsibility areas within budget control.
As each anticipated expenditure arises, you can consult the commitment
management system to determine how much of your budget has already been
utilized and what funds will become available. The information system can report
when and where the existing commitments of your funds were posted and tell the
purpose to which they were assigned.
TIP: You can identify any budget bottlenecks by calling for analyses by responsibility area and commitment
items.
The TR-FM Funds Management component maintains master records that
represent those budget objects that are commitment items. In this case, a budget is
released in a series of stages that constitute portions of the funds that become
available for commitment to expenses. Commitment items are used to split budgets
by functional aspect, such as administration, production, and transportation. You
can set up account assignment items to get the level of detail you need to record
commitments of funds for specific purposes and to ensure that they are allocated
accordingly.
The transfer of budget commitment items takes place between commitment funds
centers and receiver centers for the committed funds. Again, the TR-FM module
maintains master records to identify commitment funds centers that can take part in
this transfer of budgeted funds.
NOTE: Summary items are used in budgeting to emphasize the levels at which budget allocation and control
take place.
The structured budget data objects can be maintained and assigned to the budget
commitment funds centers to provide a flexible system that can display clearly the
way in which budgets are allocated to the hierarchy. The allocation of budgets can
be carried out from the bottom up so that subordinate items can be committed,
even if the higher-level budgets have not been allocated.
Different versions of budgets can be maintained separately, and different sources
of funds can be designated for each financial management area. The utilization of
these areas can be traced through the reporting system.
Budgeting in TR-FM
Before a budget is approved, it is classified as a preliminary budget or merely a
cost plan. At this stage the bottom-up summation of costs probably occurs. The
preliminary budget is then submitted for approval, and the allocation of the
approved budget can take place as top-down distribution to the budget cost objects.
You company may differentiate between funds that have been budgeted and funds
that have been released. You may not be able to commit all your current approved
budget in the early stages of a project or accounting period.
Using Availability Control
Two styles of availability control exist:
• Passive availability control merely gives an overview of the commitment
of funds, regardless of whether the budget for the period has been
exceeded.
• Active availability control checks to ensure that no excessive funds
commitment occurs.
The following variants of availability control fall under the specification of the
user:
• Checks against the current budget or released funds
• Checks against the overall budget or annual budget for the current year
• Types of business transactions to be monitored, such as purchase orders
or postings in cost accounting
• The decision of whether the availability control is conducted on the basis
of absolute variances between commitment and budget or on the basis of
percentage use
• The action to take place in the event that availability tolerance limits are
exceeded
The availability control function has the following possible actions:
• Warning
• Warning plus message to the project manager
• Error message and a rejection of the posting that would otherwise
exceed the availability control limit
Using Budget Updates
Even though availability control of the active variety might be in place, a situation
may arise that requires a change to the approved budget. Price increases and
additional requirements from the customer or project sponsor are common
contingencies, although other events may delay a work program and threaten the
budget. Rolling budget planning is standard practice in some industries.
A supplement is a quantity of extra funds that can be distributed in the top-down
mode to increase the current budget. Returns are excess funds that are not needed
and are processed from the bottom up in the budget hierarchy. A transfer is a
movement of funds within a responsibility area from one work breakdown
structure or budget cost object to another.
NOTE: A transfer can take place across projects, provided they all fall under the same responsibility area.
Budget updates can be made subject to status management and can be controlled
through the standard system of authorization objects to limit the persons authorized
to approve budget changes.
Using Funds for Specific Purposes
A cost can be classified on the basis of the purpose of the expenditure, and a
budget can be split to create a separate fund for each purpose. Availability control
can then be applied to constrain expenditure according to the proportions set up in
the approved budget structure.
A budget can also differentiate between the sources of the funds and can maintain
the origin of funds as an entry on the transaction documents.
Using Budget Planning and Monitoring
Freely definable planning horizons are a feature of the TR-FM module. The budget
accounting periods do not have to coincide with the financial accounting calendar.
You can even distribute budgets over several fiscal years. The monitoring of funds
commitments assigned to the distributed funds can be managed on an overall
global basis or by fiscal year.
Accounting transactions recorded in TR-FM keep track of down payments,
invoices, bank clearing transactions, and any transactions affecting the funds, right
through to final payment clearing and settlement.
Purchase orders and release orders in Materials Management automatically update
funds commitments if they are identified with a budget. The module maintains a
commitment management facility that can keep track of the various funds
commitments. The TR-FM can show how much budget you have assigned to each
CO cost assignment object, such as a cost center, an order, or a project. For
example, a measurement of how much of a budget has been used can be generated
by a standard budget/actual comparison report. You can also look at the differences
between one plan and another, and between the commitment of funds and the
actual expenditures.
You also can generate information on current assets because all purchase orders for
stock items (as well as the resulting invoices and goods receipts) are recorded in
TR-FM.
Using Funds Utilization History
The evidence of how, where, by whom your budget was committed is
automatically assembled as the funds utilization history. With this history, you can
display the analysis for each responsibility area and each commitment item. By
looking at the various summarization levels in your budget structure, you can see
where funds bottlenecks and shortages are likely to occur.
Introducing the SAP R/3 Industry Solution for the Public Sector
The IS-PS is a configuration of SAP R/3 in the Industry Solutions series that is
optimized for use in organizations that operate wholly or mainly in the public
sector. In this situation, the commercial priorities rank second behind the need to
manage public funds in a responsible and accountable manner not easily monitored
in terms of financial profit.
IS-PS includes an enhancement of the TR-FM module that uses the SAP R/3
business workflow system to control “budget parking.” This module allocates
funds across a formal system of authorization levels and authorization objects that
represent the work positions in public sector organizations responsible for
segments of the budget.
Using Integration with the SAP Industry Solution for Insurance
The treasury management application is integrated with the Industry Solution for
Insurance and Real Estate management, IS-IS. Through this system (IS-IS), the
Treasury can support the following functional areas:
• Extended management of loans
• Extended treasury management
• Real estate management
• Management of premium reserve funds and statutory reporting for
insurance companies
Using Integration with the SAP Industry Solution for Banks
The TR-TM application is also integrated with the Industry Solution for Banks, IS-
B, through which it can support the following functional areas:
• Back-office data pooling
• Single transaction costing
• Bank profitability analysis
• Risk management
• Statutory reporting
Using Integration with SAP R/3 Investment Management
The IM-Investment Management module includes the following components:
• IM-FA Tangible Fixed Assets
• IM-FI Financial Investments
The TR and IM modules overlap because the functions of IM-FI Financial
Investments are the same as those of TR-TM Treasury Management. The IM
functions are discussed in Chapter 11, “Managing Investments.”
Chapter 11
Managing Investments
In this chapter
Controlling Investments
Defining an Investment Program
Analyzing Investment Proposals
Budgeting in the Capital Investment Program
Capitalizing Assets Directly
Creating Assets Internally by Capital Investment Measures
Documenting Internal Value Flows
Using Settlement Functions for Capital Investment Measures
Controlling Investments
The standard activities of an investment department are based around the need to
purchase new assets and operating equipment. The daily decision matrix includes
perhaps hundreds of decisions of the following types:
• Repair this faulty asset, or replace it?
• Buy this improved equipment, or stay with the existing plant that works
well although it’s not the latest design?
• Snap up this resource now because it is available at bargain prices, or
wait until there is a clearly defined need for it?
• How long will this plant last at the present rate of usage?
• Invest in more repair facilities to alleviate the problems with the existing
equipment, or invest in new and possibly unknown equipment in the hope
that it will prove more effective?
Some common-sense measures can be used to reduce the uncertainty characteristic
of investment decision making. You must be prepared to search for information
from such sources as the following:
• Competitors who have faced similar decisions
• Scientific disciplines with research evidence that could illuminate at least
parts of your investment decisions
• In-company technical resources that may be aware of information
relevant to your proposed investment
• Lessons learned from errors and equipment failures in similar activities
• Commercial knowledge gained by analyzing business activities and
results in similar situations
Although the big decision might seem to be the one that initiates an investment, it
may be much more difficult to abandon a project or relinquish an investment that
turns out to be a failure. Worse still, it may be very difficult to cut off a project in
its prime, when all is going well, just because it looks like it might fail some time
in the future. But nothing in the investment manager’s job specification says the
work will be easy or enjoyable. Good data processing can help avoid the kind of
mistakes made because the right information is not extracted and highlighted at the
moment when it could be used to improve the decision-making process.
With complex and expensive investments, you have no chance to sit back and let
the investment earn profit. Investment control applies throughout the life of the
asset, both its useful life and its economical disposal.
The depreciation of an asset is a function of both usage and other factors that affect
its value. For example, an asset could become obsolete. Chapter 4, “Accounting for
Assets,” concentrates on the ways in which the value of an asset can change
through its lifecycle. One of the important lessons to be learned from managing
buildings, for example, is that the cost of repairs and maintenance may soon add up
to more than the cost of acquisition. Similarly, an inexpensive item of production
machinery could cost more to run than a more expensive one.
The moral from this kind of experience is to establish a plan for the expected life
of each investment and then modify this plan according to the costs of owning and
operating the object. Include both preventive maintenance and the likely cost of
repairs and replacements.
TIP: You could set up a key figure report element to let you see just how much was spent on maintenance for
each asset and what percentage of procurement costs this figure represents.
Managing Investments in a Corporate Group
A multinational company comprises several individual company codes,
independent organizational units that render their own financial documents in the
form of a balance sheet and a profit and loss statement. These company codes tend
to operate in different currencies for which the SAP R/3 system can maintain
parallel accounting data. Chapter 5, “Consolidating Company Accounts,” discusses
the procedures for legally consolidating these separate accounting structures.
Investments in a multinational corporation are represented by many records held
on local computer systems. The SAP R/3 system can integrate these distributed
systems by the Application Link Enabling (ALE) technology. This enables you to
post and report object data structures. In particular, the capital investment
programs of the affiliated companies can be reported to a central client database in
R/3, even if some sending companies use other systems. External software and
standard systems such as Microsoft Access can be used as sources by accessing
them through the Remote Function Call (RFC) technique.
The ALE technique is applied to filter the investment documents of the distributed
companies according to the requirements of the head office. For example, options
exist to have investment reports at the summary level and at the level of individual
investment measures and projects.
The following are the standard reporting levels applicable to capital investment
management:
• Company code
• Business area
• Profit center
• Plant
• Balance sheet item
• Capital-investment program per approval year
• Capital-investment program position
The reporting dimensions for Capital Investment programs and related Capital
Investment measures include the following options:
• Total and annual planned values
• Total and annual approved budget values
• Actual values
• Open item values
NOTE: The data collated at the remote systems is summarized by period as directed before it is consolidated
at the head office.
Relating the SAP R/3 Investment Modules
The Treasury is the part of your organization concerned with medium- and long-
term financial planning, together with the medium-term management and control
of revenues and expenditures. The focus remains on the company’s future financial
state.
These objectives can be met to some degree by using the FI-Financial Accounting
application. The modules of FI-Financial Accounting that are specifically
concerned with investments are as follows:
• FI-IM Investment Management
• FI-AM Assets Management
The functions used by FI-IM are also available to the FI-AA Asset Accounting
module although the continuity does not extend beyond year-end closing unless the
IM application is installed and configured. The IM application supports the
following investment management processes:
• Capital-spending requests
• Capital-investment measures
• Capital-investment programs
• Simulation and depreciation forecasting
Using the Investment Management Functions
The investment modules can be installed in SAP R/3 as a stand-alone system. This
is referenced as the IM-Investment Management application.
Using IM-FI Financial Investments
IM-FI Financial Investments carries out the functions of TR-TM Treasury
Management when the IM application is configured for investment management as
a specialization.
Using IM-FA Tangible Fixed Assets
The purpose of the IM-FA Tangible Fixed Assets component is to perform analysis
of capital investments and support their management. The principal functions of
the component are as follows:
• Pre-investment analysis
• Capital-investment master data, planning, budgeting, and allocation
• Measurement of Capital Investment performance and integration with
the CO-Controlling module CO-OPA Order and Project Accounting
component
• Valuation and settlement
• Depreciation simulation
• Asset control
• Information system and connection to the EIS-Executive Information
System
This component shares functionality with the FI-AM Asset Management
component. The TR-Treasury module provides some enhanced functions.
Separating the Treasury Functions
As of R/3 Release 3.0, the long-term financial management functions are available
in two separate but overlapping modules that can be installed independently of
each other:
• TR-Treasury
• IM-Investment Management
Individual components from these modules can be installed and configured to
integrate with the FI-Financial Accounting module. These components are also
available in the form of integrated R/3 enhancements designed for specific sectors
of business and industry and presented with an IS prefix to designate an Industry
Solution.
Organizing Investment Data
The essence of complex system management involves dividing business activities
into tasks and dividing data into units that can be readily retrieved and applied to
the tasks as necessary. Two target readership groups exist for financial documents:
• Shareholders and legal authorities that demand the external accounts in
the prescribed formats
• Internal management that must be able to freely select data to discern
opportunities for improving the company
Investment control must operate with a flexible data structure that can be called
upon to satisfy both types of scrutiny.
Defining an Investment Program
The highest level of investment information held in a master record is the Capital
Investment program structure. An investment program is defined in SAP R/3 by a
master record that specifies a hierarchical structure for all the planned and
budgeted investment costs of a company for a specific period.
How you define this hierarchy is up to you. You can use the existing organizational
units and also separate the reasons for the investments or the balance sheet items. If
you need to, you can define investment program types that specify the objects to
which investment funds can be assigned.
Understanding Capital Investment Types
An element of a Capital Investment program can be classified according to the
purpose it serves by assigning it to one of a set of types that you establish. The
types indicate reasons for making capital investments, of which the following are
typical examples:
• Asset expansion to include new products
• Modernization
• Asset-replacement measures
• Environmental protection
Understanding Capital Investment Program Positions
A Capital Investment program position is a data object that represents a reference
point within a Capital Investment program. This position refers to an
organizational unit that is responsible for a well-defined stage of the project. The
program position can have additional user-definable classifying characteristics,
such as investment type. The object carries planned and budget values for the
investment in one of the following reporting structures:
• Controlling area
• Company code
• Business area
• Profit center
• Plant
A Capital Investment program position can also be defined by additional
characteristics, such as the investment type or reason. For example, a capital
investment program position can be defined as an asset-replacement investment
type targeted at a specific plant that belongs to a particular company code. The
transaction data associated with this position is classified and posted accordingly.
A Capital Investment program is defined within a single controlling area, but there
may be more than one Capital Investment program position element at any level.
For example, a refurbishment project could involve several plant locations. In each
plant, you can designate a technical site or other type of investment position to
serve as the focal point for allocating budgets and recording costs and progress.
Each active Capital Investment program position element is represented as a
Capital Investment project or an element in a project. This requires a budget, a
responsible company code, and also perhaps a controlling area that can summarize
the programs across more than one company code.
Any particular capital-investment order is assigned to a specific plant, a profit
center, and perhaps a business area. The accounting of this capital-investment
order sees to it that the costs are assigned to specific cost centers if you have
installed and configured the PCA Profit Center Accounting module.
Understanding Capital Investment Measures
A Capital Investment measure is a project or an internal order that is used to carry
out an asset investment. This measure is classified as a capital investment because
it cannot be posted to fixed assets as direct capitalization. The usual reasons are
that the project budget is very large and that it includes a considerable internal
activity component.
Two types of data are stored in master records of a Capital Investment measure
such as a project or an internal order. One set of data comprises the controlling
information, the other is the actual data of an asset under construction. This data is
used to identify the following components:
• The investment components that must be capitalized on the balance
sheet
• Special depreciations that must be reported
• Capital-investment support measures needed during the construction
phase
NOTE: The Capital Investment measure can be accessed from both the financial accounting system and from
the controlling system.
Analyzing Investment Proposals
A requirement for a capital-intensive investment project may be submitted for your
consideration. How can you decide whether it will be wise to go ahead?
You need to know the profitability of the project at each accounting period
throughout its expected life and at its final disposal. You could apply static
business mathematics to compute the values invested minus the depreciation and
then arrive at a trajectory of costs and revenue that provides the data for a graph of
profitability over a life cycle.
Dynamic mathematics would provide a similar projection if you could define some
assumptions about the interest rates and market values over a project’s lifetime.
For example, you could allow for predicted fluctuations by defining an internal
interest rate. Alternatively, or in addition, you could compute the predicted
capitalized value of your investment at each period in its lifecycle.
If you have been able to carry out similar pre-investment analyses for each capital
investment program that you evaluate, then you might be able to come to a rational
decision about which to choose. Your system may be able to provide actual data
from previous investment projects that you can refer to as the basis for a numerical
model for your proposed project. Your assumptions about future interest rates and
market values can then be used to refine and update the model. As an additional
facility, you could develop several versions of a pre-investment plan and
associated analysis, with each variant utilizing different parameters to represent
optimistic and pessimistic views of your markets and the effectiveness of your
resources.
The pre-investment analysis process can be set up using data processing to enable
the decision maker to choose between fully elaborated and costed plans that
genuinely represent viable business alternatives. Any proposal that cannot be
shown to be profitable at the planning stage, even if the assumptions are favorable,
will not be considered as an option in the decision.
NOTE: In practice, determining viable projects may well turn out to be a matter of how investment resources
are to be distributed among the competing claimants. Everyone can compile a wish list, but not all wishes will
come true.
In accord with the common-sense procedure of subdividing complex projects into a
structure of components, the SAP R/3 investment functions work with three types
of values that are distributed across as many necessary units to map your
investment programs to your company cost centers. Planned values, budgeted
values, and distributed values are stored for the company or controlling area. Each
of these three values is computed by adding the corresponding values from each of
the business areas. These business areas are defined on any convenient basis and
represent the budget-holding authority at a particular level under the control of a
business area manager. Each business area can be further subdivided and allocated
a budget in a similar fashion.
If you already have organizational units that are convenient for capital-investment
budgets, you can direct the system to use them to form a suitable distribution
structure automatically. You can then edit this structure manually if it does not
correspond to the most convenient arrangement.
Using Cost-Planning Capital Investment Programs
The costing of an investment program, and hence the cost planning, takes place
from the bottom up. You can assign the actual Capital Investment measures
planned for each year to the company codes responsible for them.
The intended activities associated with a Capital Investment program must be
included in the process of budgeting across the company. The controlling
instruments that can be used automatically with capital investment programs are as
follows:

• A project managed by the SAP R/3 project system
• An SAP internal order
• An SAP maintenance order
For each pre-investment analysis you conduct, you can specify one of these
instruments. The system posts the planned and actual values that represent internal
activities, external activities, down payments, and overhead to that particular
instrument.
If you cannot clearly assign a certain Capital Investment measure to one company
code in the investment program, you can arrange a percentage distribution of a
Capital Investment measure among several program positions. If necessary, you
can enter and maintain the planned values directly in the investment program
structure, at any level of the hierarchy. The system checks that your manual
alterations to the plan do not cause an excess in the value of the next level in the
hierarchy.
Using Early Depreciation Forecast and Cost Planning
A depreciation forecast is a set of values distributed across a series of time periods.
These amounts represent the best estimates of how the value of the company’s
assets will move as a result of depreciation. You can define a depreciation area that
takes a different point of view than the actual depreciation calculated by one of the
standard methods. For example, you could define a depreciation area that
calculates the depreciation of fixed assets for a tax-based balance sheet. Another
area may be designed to support your cost-accounting analyses by expressing the
depreciation of the fixed assets in a slightly different manner.
You can include the cost plans of a Capital Investment program in your
depreciation forecast. Each program position value that has been planned but not
yet distributed to lower levels of the investment hierarchy can be treated as an
object to be processed by a specific depreciation procedure. By this means, you can
compare different depreciation calculations and capitalization programs to obtain a
long-term overview of the progression of your fixed assets and the possible effects
of taxes on your investments.
The R/3 line-item settlement facility enables you to use the balance sheet to trace
the costing differences that arise as a result of special investment postings.
Similarly, you can discern the variance between book depreciation and tax-based
depreciation. Each line of every asset in your balance sheet that pertains to a
Capital Investment measure bears a reference to the origin.
Your depreciation forecast can be regarded as a simulation of depreciation effects
over a series of reporting periods. The values calculated can be transferred to your
system of cost center planning.
Budgeting in the Capital Investment Program
A budget is distributed to the Capital Investment program positions. An individual
Capital Investment measure can derive the budget directly from one of these
positions. You can control just how strictly the system manages the availability of
the budget funds. For instance, you can prevent any individual capital-investment
budget for a measure associated with a Capital Investment program position from
being assigned a value that would cause the position to exceed its allocation. On
the other hand, if you do not wish to exercise strict availability control, you can
monitor the situation by using current period reports.
The annual expenditure budget represents the funds that must be made available
for particular investments in a given year. The IM can derive this pattern of
expenditure in either of two ways:
• Aggregate the values budgeted for all the Capital Investment measures
in a given year
• Use the values specified directly in the Capital Investment program
Each Capital Investment measure has an individual approved budget that is the
total budget for this measure, regardless of how many years the measure may take.
The recommended procedure is to maintain approved budgets for Capital
Investment programs to represent the upper limit of funds, and then to maintain in
addition a continuous monitoring of the pattern of commitments made for the
program’s future years. The IM module provides for displays of these values in
formats under control of the user.
Further subdivision of budgets is usually advised so you can distinguish budget
components that must be capitalized from those that you can account for in pure
cost items. You also might want to be able to display budgets divided in terms of
internal and external activities.
Displaying the Budget Approval History
Each Capital Investment program position can be displayed as the original
approved budget together with the following types of changes:
• Supplementary budget entries that enable extra funds to be applied in a
top-down procedure from higher-level program positions to lower-level
ones and to the individual Capital Investment measures, if needed
• Returns of surplus funds that are entered at the lowest level from where
they are passed to a higher-level program position
Using the Research Reporting Tool
To evaluate a Capital Investment program, the Capital Investment Program
Information System can be customized by using the standard reporting tool
Research. For example, the following selection of standard reports can be
customized:
• Capital-investment program structures, plan values, budget values, and
availability
• Investment projects
• Investment order master data, order lists, and order selection
• Investment order summarization
• Depreciation simulation
Linking with the Executive Information System
The Capital Investment Program Information System is integrated with the EIS
Executive Information System, from which reports can be compiled automatically
using the established key figures and sorted by the existing organizational units,
such as company codes, business areas, profit centers, plants, and so on. If your
EIS has access to information from other affiliated companies, you may find it
helpful to set up a report to make use of it.
Multinational corporations are served by the standard SAP R/3 system of
maintaining currencies in parallel. The values of a Capital Investment program can
be converted to the currency of the company code at the time of reporting, as well
as to a currency defined as the standard for corporate Capital Investment program
reporting.
NOTE: The EIS is capable of interfacing with non-SAP systems carrying Capital Investment program
information needed for corporate reporting.
Capitalizing Assets Directly
A large Capital Investment measure generally is budgeted. However, some assets
are capitalized directly by applying the flat-rate investment procedure. For
example, a general resource such as local computers and vehicle fleets is likely to
be capitalized directly and then subjected to standard depreciation procedures.
If you allocate a budget for assets that will be directly capitalized, you can plan and
monitor how these asset acquisitions contribute to your Capital Investment
program. If you do not allocate a budget for directly capitalized assets, you risk the
danger that your company will allocate resources that are not attributed to capital
investment and recognized as such.
Using the Flat-Rate Investment Procedure
The flat-rate investment procedure can be used as an alternative to the Capital
Investment program technique. This procedure can also be applied to individual
elements in a program.
To fund assets that are to be capitalized directly, you can use the standard cost
object Asset Under Construction, the SAP Internal Order, or an SAP Project.
However, these instruments are not entirely satisfactory for this type of purchase
because they require an intermediate step of debiting the order or project and
subsequently settling it. The alternative involves recording asset acquisitions by
using the SAP R/3 IM Flat-Rate Budget object as a special program item in a
Capital Investment program. All the orders or projects that represent budgets for
individual assets can be linked to a special program item that represents the flat-
rate budget object for purchased assets.
Referencing a Capitalization Structure
A capitalization structure enables you to specify those cost component percentages
of a Capital Investment measure that do not need to be capitalized for each cost
element or cost element group. You also can specify these percentages for each
activity type or group of activity types. If necessary, you can define different
versions in the capitalization structure for the various depreciation areas of fixed
assets. The capitalization structure is defined for each controlling area and is
identified using a capitalization key that can be maintained in the master data of
capitalization-investment measures.
Linking Budgets and Fixed-Asset Masters
In the FI-AA Asset Accounting module, master records represent the fixed assets
and store all the transactions associated with them. The fixed-asset master includes
a data object that records the investment account assignment to be used for any
associated order or project. If you have many assets to be assigned in this way to
investment accounts, you can define general replacement rules to enable your
system to automatically assign assets to the appropriate investment account. For
example, you could specify a logical condition to automatically assign to a
designated account any asset that satisfies all the following conditions:
• Assets of a particular class, such as Vehicles
• Assets acquired in a specific business area, such as Retail Distribution in
the Southwest Region
• Assets procured for an identified distribution center, such as Plant 53
Updating Open Items
An open item is a contractual or scheduled commitment that is not yet reflected in
financial accounting but will lead to actual expenditures in the future. A fixed asset
may be conveniently handled using open-item management. All business
transactions connected with procurement of the asset are directly linked to the asset
master. Purchase orders, for instance, are assigned directly to the asset number for
which they are intended. The goods receipt and invoice are similarly assigned to
the asset master.
When a purchase order for an asset is entered into the purchasing system, its value
is used to debit the project or order to which the asset is assigned with a liability of
the same amount. The liability is converted to an actual value when the goods are
received or the invoice posted. If you do not want the order or project to be posted
with the actual cost elements, you can specify it as a receiver for statistical values
only rather than actual amounts.
Individual assets can be acquired without going through the purchasing system.
They can be routed through the FI-AP accounts payable module to be posted
directly to an existing asset portfolio. The additional value is then posted
statistically to the order or project.
TIP: You can control the availability of additional assets by allowing them to be released to an order or project
only if the corresponding budget is still available and has not been depleted for any reason.
Using the Capital Investment Information System with Flat-Rate Budgets
When the capital investment is being conducted using flat-rate budgets, the asset
acquisitions are represented by investment program items and orders or projects.
You can display the actual values of your asset portfolio and call for breakdowns
by asset. You can readily switch between program items and their component
orders and individual asset items. You can have a combined display of the total
planned investment, the budgets for selected areas, and the investments that have
already been implemented and contain generated fixed assets.
Creating Assets Internally by Capital Investment Measures
A Capital Investment measure is an SAP internal order or an SAP project. This
measure is used to control an asset under construction within a company using the
same functions used when an asset under construction is procured primarily from
external sources. As a result, a Capital Investment measure is subject to external
accounting rules.
Two classes of Capital Investment measures exist, as follows:
• Capital-investment order
• Capital-investment project
A project comprises a PSP project structure plan and therefore includes PSP
elements, some of which can be orders.
Both classes of a Capital Investment measure have the task of managing the
operational implementation of the investment plan. This includes the following
activities:
• Recording primary and secondary costs
• Calculating overhead rates and interest
• Managing down payments
• Managing open purchase orders
By these means, the capital-investment order or project can provide a single data
object that has collected all the costs for a Capital Investment measure. This
includes both those already charged to fixed assets and those that are held in the
controlling system and therefore constitute the elements of the Capital Investment
program yet to be implemented.
Several reasons point to using a capital-investment order or project rather than a
series of standard orders or projects. The following are probably the most
significant advantages:
• Program items that have been so designated are automatically
capitalized to the balance sheet account item Assets Under Construction.
• Convenient arrangements can be made to settle the Capital Investment
measure at month-end closing and period closing.
• The cost of goods manufactured and the costs of acquired assets can be
valued in parallel by each of the depreciation procedures.
The depreciation procedures are identified in asset accounting as depreciation areas
because they are conducted for slightly different purposes. These include the
following variations of the depreciation technique:
• Commercial balance sheet depreciation
• Tax-based balance sheet depreciation
• Depreciation calculated for the consolidated balance sheet
Managing investments by using the technique of Capital Investment measures and
their associated master record structures can be advantageous for companies that
need to plan and control large individual investments, or for companies that use
their own resources to create the assets.
Selecting the Type of Capital Investment Measure
Four types of cost assignment objects can take part in a Capital Investment
program:
• Capital-investment project
• Capital-investment order
• Job shop order
• Asset under construction (AuC)
Understanding Capital Investment Project Structure Plans
A project structure plan (PSP) has the task of reporting a set of activities in a
hierarchy that arranges the PSP elements in levels. A Capital Investment PSP
element is represented by a master data record that includes information on the
following entities:
• Identification of the project leader
• The requesting cost center
• The cost center responsible for implementing the Capital Investment
measure
• User-defined data fields
A PSP element can be divided into lower-level elements, each of which can be
subdivided, and so on. The subdivision can take place at any stage, from planning
to project implementation.
The role of a PSP is to form the basis of the planning and control of a project. In
particular, the PSP is specialized for the following functions:
• Display the labor, time, and cost required for a project
• Control the integration of any subsequent project’s planning activities
• Plan the project costs
• Distribute the project budget
In all functions, the controlling activities extend to each level of the PSP
architecture under control of the user.
A project is intended to be a structured set of activities in which the costs and the
time management are planned, controlled, and monitored in as much detail as the
user requires. The following logistics functions are integral to project management:
• Scheduling
• Resource and capacity management
• Network planning and cost distribution to individual activities
• Analysis of the interdependencies between activities
• Planning of optimum procedures within the project
• Scheduling of external resources
• Management of contingencies, such as resource bottlenecks and
changes of requirement
Understanding Capital Investment Order Functions
Unlike a project structure, a capital-investment order is not divided into subtasks
because it is a single-level structure. Most of the logistics functions that
characterize project management are not needed for capital-investment orders.
Understanding Capital Investment 0rders in a PSP
An order can be assigned to a PSP element in the master data records. An internal
job shop order, for example, can be placed in the context of a large Capital
Investment measure. If this work must be viewed or analyzed as a separate subtask,
even though it is part of a large project structure plan, you can call for the order
itself from the order processing system to see the progress and settlement situation.
The individual order is identified in the PSP and therefore takes part in the
reporting and settlement procedures of the entire project.
Understanding Asset Under Construction (AuC)
The AuC data object is used to identify assets that must be reported as capitalized
assets in the balance sheet. When an order or a project structure plan is released for
planning and posting, the system automatically sets up an AuC item in the balance
sheet accounts. It is normal practice to set up a separate AuC balance sheet account
item for each order or project structure plan element. The alternative is to identify
cost elements and assign them to different AuC balance sheet account items
according to their type. The system automatically creates a separate AuC record for
each cost element according to its origin. Each project AuC item is then assigned
to an appropriate balance sheet account AuC item.
Every Capital Investment measure is associated with an AuC item in the balance
sheet that represents the balance sheet value of an order or project structure plan
element. This value change is reported in asset accounting, in the balance sheet
reports, and in the asset history sheet. However, the system does not permit you to
post any value directly to the AuC. The order or project is the primary cost object,
and its value is not posted to the AuC until it is settled.
Cost Planning and Budgeting for Capital Investment Programs
Several different approaches exist in planning for capital investments, whether by
orders or through projects. For example, you can draw up general plans in the form
of annual amounts that take no account of cost elements or cost-element planning.
You could have these annual totals broken down into individual reporting periods.
If you apply unit-costing techniques, you can plan the expected consumption of
materials, constituent base objects, and materials. It may be useful to maintain a set
of statistical key figures in this connection. These plans could be differentiated by
organizational unit.
Using Account-Determination Keys
The primary costs of a Capital Investment measure can be planned by a cost
element estimated by value or by quantity. If a cost element is to be reported
according to several account-determination keys, you can apply detailed planning
using these as the primary cost elements. The user can specify the account-
determination key to combine quantity and value measurements. The following
account-determination factors are recognized by the system:
• Material items recognized by their material numbers as defining
members of an overhead area, such as Supplies Overhead Area
• Cost components arising as personnel-related wage and salary amounts
valued by using costing tables and cost rates
• Activities required in support of planned external or internal activities
• Surcharges applied as percentage rates using various base quantities to
compute risk surcharges and price surcharges, for example
If you have systems of cost centers and overhead rates, you can use them to plan
internal activities for the Capital Investment measures in your program.
From the price of activities calculated by cost center accounting, you can work out
the quantities of internal activities of the various kinds that could be performed for
each Capital Investment measure. You must find some way of determining the
quantities you probably need and applying the activity costs to arrive at the value
that must be debited to the Capital Investment measure as secondary cost elements.
When values have been determined for primary and secondary costs, the overhead
costing techniques are applied to compute flat-rate overhead surcharges for each
cost element. The user has control over how much surcharge is applied and the cost
element to which it is assigned.
The result of these stages is a set of planned total costs for the Capital Investment
measure. This figure is then transferred directly to the Capital Investment program
cost planning. The mechanism to effect this transfer automatically associates an
order or project with a particular Capital Investment program position or measure.
You can view the associations between program positions and orders or projects
through the availability control reports, where you can inspect the planned, actual,
and assigned amounts for each Capital Investment program or individual Capital
Investment measure. The source and distribution of a budget for a Capital
Investment program is copied from the plan. You may wish to apply discounts to
the planned amounts before you allow them to become budget amounts.
If a new Capital Investment measure begins in the current year, you can approve its
total budget directly from the Capital Investment program. This total covers the
entire measure, however many years it lasts. Distribution across the expected years
of the program is carried out later and gives you the annual expenditure budgets,
the annual slices, for each Capital Investment measure in each year.
Controlling Availability
The approved total budget and the annual expenditure budgets may be subject to
passive or active availability control. The passive control mode simply reports the
availability of funds. Active control can be carried out directly for each activity. If
your project exceeds the budget for any one item, the person responsible can be
informed automatically by mail through SAP R/3 Business Workflow application.
The manager can also respond through the workflow, for example, by electing to
provide a budget supplement.
Goods and services required in conjunction with a Capital Investment measure can
be procured through the SAP R/3 Purchasing System and FI-FA Financial
Accounting. When an order for goods or services is posted, an open item is created
automatically to document the commitment of funds from a Capital Investment
measure or program. This document effectively plans the future costs of the
Capital Investment measure. When the goods or services are delivered, or when an
invoice is received, the open item is removed if the delivery is complete. If only a
partial delivery takes place, the open item is reduced by a proportionate amount.
The relevant Capital Investment measure is automatically debited with the
purchase order value as actual costs when the goods or services are received, or by
the invoice amount when the invoice is received.
NOTE: An invoice can be directly posted by financial accounting without reference to a purchase order. In
these circumstances, the Capital Investment measure is directly updated by an additional account assignment
annotated as Capital Investment Order or Capital Investment Project, as appropriate.
Documenting Internal Value Flows
Cost centers provide activities to Capital Investment measures. These activities are
each specified by quantity and by value. The flow of these internal activities is
recorded as direct internal activity allocation. The controlling system values the
activity quantity by referring to the price determined through cost center
accounting. An individual item comprising a certain quantity of a particular
activity is recorded as a credit memo at the sending cost center and as a
corresponding debit memo in the Capital Investment measure record, which is the
receiving object.
Allocating Activity Costs Indirectly
If an activity cannot be quantified for each transaction, an indirect allocation can
be performed. Allocating activity costs indirectly involves a periodic transfer
posting of a proportion of the costs of providing the activity. This enables the
transfer of costs between cost centers and orders.
Allocating Overhead as Surcharges on a Capital Investment Measure
In the procedures of planned cost accounting, the computation of overhead rates is
used to develop a method of distributing costs. In a similar way, overhead
surcharges may be applied to Capital Investment measures.
The overhead surcharges are not usually included in the cost rates for the various
activities provided by cost centers. Therefore, an amount representing a proportion
of the overhead surcharges must be debited to the Capital Investment measure in
accord with the Cost by Cause principle.
Capitalizing Internal Activities
A percentage of internal activities can be capitalized under fixed assets. You can
choose different valuation types as a basis for computing a percentage. For
example, you may be able to capitalize all internal activities to fixed assets when
using commercial valuation. However, for tax purposes, you may have to value
your company by capitalizing only 80% of internal activities. For corporate
reporting of the consolidated accounts, you may have to capitalize no more than
70%.
Posting Down Payments
It is usual for a long capital-investment project to be subject to the requirement for
installments or down payments as the work proceeds. After the external activity
has been completed, the invoice quotes the total invoice amount that must be
posted in full. However, if you have made down payments during the course of the
construction of the asset, your final payment is much less than the full invoice
amount. Furthermore, the law requires balancing the accounts of AuCs so that the
down payments already made are assigned as fixed assets.
The SAP R/3 solution to this complex posting requirement involves posting a
down payment as such by the FI-AP Accounts Payable module. At the same time,
an additional account assignment is made to the purchase order under which the
down payment is made. The amount of the down payment is automatically updated
in the records of the Capital Investment measure, where it is assigned to a specific
cost element created for the purpose of recording down payments. At the end of the
accounting period, the down payment on behalf of a Capital Investment measure is
automatically prepared for capitalization by being transferred to the fixed assets
account.
NOTE: If your system does not have a purchase order as reference for a down payment, you can post the
down payment directly to the Capital Investment measure without affecting the value flow documentation.
Using Interest During the Construction Phase
A long construction phase for an asset represents capital lockup because the value
in the partially completed asset cannot be applied elsewhere in the company. Your
region of legal force may permit account balancing in which the interest on capital-
investment projects can be capitalized under fixed assets. In any circumstance, you
may find it useful to compare the interest calculated on book depreciation versus
tax-based depreciation, for example.
The system enables you to consult an interest table and determine the cost elements
for which interest is to be computed. You can also specify which depreciation
areas apply an interest computation, and which rates of interest are employed.
Compound interest can be calculated using a time period defined by the user. The
system calculates the interest at the end of the defined periods and debits the
Capital Investment measure with these values.
NOTE: Within a capital-investment project, the interest on capital invested is treated as a normal cost element
that can be charged to fixed assets or to the normal receivers of cost accounting assignments (the cost
centers).
Using Investment Support During the Construction Phase
If your Capital Investment measure attracts investment support from your host
country during the construction phase, you have various ways of accounting for it.
For example, you can apply any of the following techniques:
• Deduct the value of the investment support from the balance sheet
values of the asset under construction. Doing so reduces the acquisition
value of it.
• Treat the investment support as revenue from the asset, which does not
affect its acquisition value.
• Apply the investment support as a reserve for special depreciation on
the liabilities side.
If you create a special depreciation reserve for investment support subsidies, you
may have to dissolve this reserve on the asset side over the useful life of the asset.
The system offers you proposal lists at each stage of planning the utilization and
subsequent postings of investment-support measures. These documents are
presented in formats suitable for submission to the supporting authorities.
When a capital-investment project is completed, the system must transfer Capital
Investment measures to fixed assets on the asset side, with due allowance for
depreciation. If the Capital Investment measure has received capital investment
subsidies, the system makes a transfer posting automatically for the total subsidy
amount.
Using Settlement Functions for Capital Investment Measures
Many ways exist for arranging settlement of Capital Investment measures, and
many tools assist in this process. The settlement rules to be applied are stored in
the master records of each capital-investment order or capital-investment project.
The display of a Capital Investment measure that includes a number of items can
be settled one line at a time if you want to assign a settlement rule to each line item
individually. You can assign settlement rules according to cost element so that the
settlement receivers are assigned according to their origin groups. For example,
external activities are usually charged to fixed assets. Internal activities are
distributed on a percentage basis between fixed assets and certain cost centers.
Most items created for a Capital Investment measure are settled to an AuC account
at the end of the period. However, this means that the items will be capitalized,
which may not be appropriate or legal for items that should be accounted, wholly
or partially, as costs. The costs should not be capitalized as fixed assets but rather
settled on cost objects, including cost centers, internal orders, project structure plan
elements, and profitability segments.
These cost assignments to the controlling module enable the following reports to
be generated each month:
• Settlement by period to the cost-accounting receivers
• Balance sheet display of AuCs
• Asset history sheet
Customizing Final Settlement to Fixed Assets
A Capital Investment measure is intended to be used when it is completed and,
perhaps to some extent, before. The following matters must be resolved before
final settlement can take place:
• Shall the Capital Investment measure be represented as a single fixed
asset or as several fixed assets?
• Which cost center or cost centers shall be assigned responsibility for the
new assets?
• How shall the new assets be depreciated?
After you have resolved these issues, you can create master data sets for the new
fixed assets and assign them to the correct asset classes. From a list of the new
assets you can select line items for individual assignment, or you can settle by
groups based on original cost element postings. You can also distribute a line item
among several fixed asset receivers.
You may decide to settle some of the new asset items to cost centers in the
controlling application. In this case, you must settle by line item to create a
detailed proof of origin on the settlement receivers for controlling purposes, as well
as to comply with the legal requirements for rendering the external accounts.
The final settlement process credits the AuC account with the corresponding
amount. Items from previous years are shown automatically as transfer postings,
and items from the current year appear as acquisitions in the final fixed assets
accounts.
Reporting Internal Accounting for Capital Investment Measures
The SAP R/3 system includes a standard reporting system for Capital Investment
measures. This system is used for both orders and projects. You can modify the
standard reporting system to create exactly the reports that you require for your
individual circumstances, and you can change them as necessary without losing the
efficient collation procedures integral to the standard report.
The following are the main presentation options:
• Ongoing profitability control by budget/actual comparison
• Cost-development displays extending over several reporting periods
• Interactive drill-down report control of analyses from controlling area
down to line-item level
Reporting External Accounting for Capital Investment Measures
Legal external accounting requires that Capital Investment measures show legally
valid proofs of origin for the values recorded in the fixed assets accounts. An AuC
automatically generates an asset history sheet and appears in the asset list as well
as in any standard asset report.
To inspect this data, the following capabilities are available:
• Asset history sheets that are flexibly defined and selective in their
displays of columns and lines
• Reports that are amenable to the widest range of sorting procedures
• Comparison reports that display the effects of using different
depreciation area formulas
Chapter 12
Developments in Financial Management
In this chapter
Preparing for Open FI
Focusing on Positive Auditing with the SAP R/3 Workstation
Networking Workflow
Selecting Components for Electronic Commerce
Developing the Open Information Warehouse
Operating with SAP R/3 Business Objects
Raising Standards of Business Programming
Accelerating Implementation with the Business Engineer
Preparing for Open FI
Open FI consists of a network of information sources and business processes. One
of the tasks of this network is to generate the data in real-time that is relevant to
each decision in the commercial and financial processes. With global business
being conducted between complex enterprises, it is not a simple matter to
determine what data is relevant and how it should be processed. For example, you
may need to assess the credit worthiness of a business partner. Your affiliated
companies might have some relevant information, and you might have to access
public information as well. You may have to enlist the support of the abundant
computing resources of SAP R/3.
Developing Business on the Internet
Corporations are rapidly developing network software because the mechanisms are
available and offer many advantages. The attractions, or at least the potential
attractions, are distributed among consumer-to-business, business-to-business, and
within-business applications. These applications offer the following qualities to
users:
• Easy-to-use systems that can operate globally at any time
• Selective and easy access to information that is relevant at a pace and
complexity the reader can control
• A low-cost marketing channel with wide market exposure and
considerable penetration
• A familiar interface that can access a variety of services in depth, if
required
• Immediate answers to inquiries
• The capability of asking intelligent questions because previously
collected information is taken into consideration either automatically or by
the operator
• The capability to control the movement of images with sound to
demonstrate a product and discover which aspects interest the prospective
purchaser
• Increased revenue that may arise from a low cost of sales
• Direct access, as the Internet may have become the preferred source of
information for some sectors of the market
• Simple cut and paste functions that can be used to compile email
purchase orders and to request other services
• Automation of standard tasks under the control of a suitable
authorization profile system
Recognizing the Possibilities of Electronic Commerce with R/3
The implementation of local networks based on mainframe computers and
dedicated communications has a relatively long history. Client/server
configurations accommodated distributed computing, whereby the user at a
workstation or simple terminal could be connected not only to databases but also to
additional computing power to process the data. In simple terms, the concept
entailed accessing a system through a terminal dedicated for this purpose. The
extent and complexity of the system is often not apparent to the individual user,
nor need it be in most applications.
However, very real limitations exist as to the number of terminals that can be
operating at the same time. SAP R/3 and R/2 can adjust the allocation of
computing resources to the workload on a dynamic basis. These systems also
understand the provision of procedures to cope with equipment and
communication channel malfunctions.
Apart from automated banking terminals, the direct conduct of commercial
business by individual users is not yet widespread. But the SAP R/3 range of
standard business software is anticipating a change.
Developing Electronic Delivery Channels
The customers of banking and financial services expect reduced prices and
improved services. The electronic delivery channel, in any of its various forms, can
be an efficient provider of the services required by the customer. But this channel
can also be the means by which the customer can access competing services,
sample offerings, and rapidly switch accounts to the most attractive provider.
One of the problems to be resolved centers on the inequality between low-cost self
service and high-cost personal contact with a banking or financial representative.
Another problem involves determining the rate to charge. Should some types of
customers pay more than others?
One possible solution is to arrange the networks to recognize the customer and
then deliver a service and presentation package that is finely tuned to match the
needs and preferences of that individual customer. Clearly, the technology of
personalized display formats and controls is available to the computer user and
could be made available to the customer at a public or private terminal.
NOTE: Customizing the display presented to customers using an electronic delivery channel provides an
opportunity for target marketing. As a customer, you could find that each time you provide a new piece of
information (perhaps by selecting from a menu), the display would become more relevant to your specific
needs.
Combining Components of Open FI
At each phase of a business process, certain support activities can be managed to
add value to the sequence by applying information to control the process. The
following sales sequence illustrates the way the SAP R/3 components can be
configured:
• Marketing services
• Performing quotations
• Controlling customer credit using real-time scoring of payment history
• Processing orders
• Monitoring export credit insurance
• Processing invoices
• Factoring
• Analyzing asset-backed securities
• Dunning
• Using export credit insurance premium notification and collection
• Recording payments
• Updating customer payment history
One of the ways to make the financial systems more efficient is to link the
processes into workflow sequences. A workflow sequence is initiated only by
specified conditions and then proceeds automatically. The user can specify that an
intermediate step shall not be taken until an authorized user inspects the relevant
display and signifies approval for the next operation to take place. For example,
SAP R/3 FI is used as the core application in an enhanced FI-AR, Accounts
Receivable module, that is specialized to manage Asset-Backed Securities (ABS).
Cash flows expected from orders and revenues are essential components of short-
and medium-term budgetary planning. You may have to take measures to protect
your financial position against possible cash-flow contingencies. For example, you
can create a currency exposure cover, in the form of a microhedging transaction,
by allocating forward currency-exchange dealings to the order or billing document
from which they originate. The effect is to automatically protect the cash flow
expected from the transaction.
Focusing on Positive Auditing with the SAP R/3 Workstation
The SAP R/3 Auditor workstation module can operate with individual companies
and on a global enterprise basis. The Auditor workstation can operate as a stand-
alone module and can interface with the data sources through standard SAP
interfaces. This module generally operates online, connected to the SAP R/3
system. The auditors work in the operational system and must be authorized to
read the current data-set.
This workstation focuses on more positive auditing activities and consulting,
although it fully supports the standard processes of compiling evaluation
documents and reports. The Generally Accepted Accounting Principles (GAAP)
remain the guiding standards, but the workstation is optimized for the benefit of
internal and external auditors, system auditors, and cost accounting personnel.
NOTE: Although this module was first developed for the German auditing environment, it is gaining the
capability to recognize other auditing conventions.
The R/3 Audit Information System is also available to the Auditor workstation.
This information system can construct an audit report tree, from which the user can
call individual reports and evaluation programs that work with pre-closing interim
lists such as Assets, Receivables, Balance Confirmation, Balance List, Domestic
Customers, and so on.
Networking Workflow
Standard Web browsers, Microsoft Exchange, Lotus Notes, and custom
applications can use R/3 Workflow Wizards to automate workflow design and
control the workflow via a network. Workflow status reports are made available in
HTML format. The Workflow Management Coalition (WfMC) is an integrated
implementation that includes the 52 published Workflow Application
Programming Interfaces and provides the following components:
• Session Manager
• Distribution Architect
• Reference Model
• Computer-Aided Testing Tool (CATT)
• Organization Architect
• IMG Implementation Management Guide
Using Workflow Templates
Workflow templates are maintained as master records that can be executed and can
serve as a guide for a company’s own development. The individual steps of
workflow templates are predefined as standard tasks. These contain a task
description, linkage to the application logic through business objects, and prepared
linkage to the company’s organization structure.
The business object repository delivered in R/3 includes predefined key fields,
attributes, and methods. The events associated with the business objects Workflow
Definitions made from standard tasks can easily be combined and changed at any
time by using the graphical editor.
Demonstrating SAP R/3 Processes
Workflow templates have been integrated into the IDES International
Demonstration and Education System. This can play through the operational
sequences of a sample company. The preconfigured workflow scenarios can be
executed and analyzed for learning and planning purposes.
Reducing New Product Time-to-Market
If your financial operations are dedicated to a production facility, you probably are
aware of the financial implications of engaging materials and the plant in
production that will not generate revenue until products are sold. Your company
may face additional financial pressure if it must continue to find innovate product
designs and product mixes.
SAP R/3 4.0 and subsequent releases include many ways to improve value-chain
management and time-to-market. The scope of these improvements to business
process design must go beyond the confines of the company’s production plant
because the quality and timely delivery of supplies and raw materials may well be
major factors that control customer satisfaction.
Altering a System Without Disruption
The Internet and intranet will change the way Receivables are dealt with. If a
business is to make best use of the possibilities of electronic commerce, it is
essential that the work passing through the standard business processes should be
amenable to adjustment. This puts the company in a position to benefit from any
change or anticipated change in market conditions.
An installed and configured SAP R/3 implementation must be capable of
improvement without disruption, as you may need to reconfigure you business
workflows at short notice.
Improving a Business Continuously
The Business Framework architecture includes two types of Business Application
Programming Interfaces (BAPI), software standards that can be used to design
ways of controlling how a business application responds to a transaction. The
earlier type is used to access SAP and third-party applications from the R/3 Basis
core. The most recent type of BAPI resides in the application, where it can process
instructions that, in effect, reconfigure the complexities of business processes. This
new BAPI is used to enable customer organizations to apply new process-control
logic and to change the corresponding presentation logic. (BAPIs are discussed
later in the section “Using Business Application Programming Interfaces.”)
Such a process is achieved without disrupting business but, of course, occurs under
the strict discipline of change management, wherein all adjustments are held in
abeyance until the release date. At that point, the adjustments are recorded in the
change management documentation. For example, a production company might
adjust its logic from an emphasis on process control to distribution logic if the
production plant became part of a different enterprise.
Selecting Components for Electronic Commerce
The work unit of SAP systems is the transaction, and the same principle applies to
electronic commerce. The components available for electronic commerce are
software units that can be carried in a range of operating systems and hardware
devices. The idea is to make these units available for use by any system that has
received the SAP certification.
Using the SAP R/3 Java User Interface
The Java Virtual Machine can be deployed into virtually any presentation device.
The SAP R/3 Java User Interface can then be transmitted to any of these devices,
which can be granted access to R/3. In particular, this process takes advantage of
low-cost devices, such as the Network Computer (NC) and Network PC (NetPC),
that need hold very little functionality locally because they are continuously in
touch with the parent system over an intranet or the Internet.
The essential feature of the SAP Java BAPIs is that they use standard business
objects. Therefore, the BAPIs provide a way of operating with standardized
business content and logic without reference to the specific terminal device used
for access.
Using Business Application Programming Interfaces
As stated previously, BAPIs are software standards that can be used to design ways
of controlling how a business application responds to a transaction. In essence, the
application receives a message through a BAPI, which sets up the procedures for
dealing with the data that also arrives at the BAPI.
For example, a BAPI to a Human Resources database server can be configured to
recognize a request for a person who has particular qualifications and is also
available to carry out a task, such as processing a sales order. The server finds such
a person, if possible, and returns the details to the system or person who initiated
the request.
Using Internet Application Components
An Internet Application Component (IAC) is a standard business interface that is
specifically designed to operate with the Internet or with an intranet. One
characteristic of SAP R/3 IACs is that they are isolated from the kernel of the R/3
system. The IACs can be seen as separate components that can be developed and
adapted without requiring any change in the main R/3 system.
In particular, the way an IAC reacts is determined when the Internet Web page is
designed. Full multimedia facilities can be made available, and the very style of the
interchange between user and system involves building on the idea that the whole
supply chain responds without delay to the user’s requests and requirements. Both
goods and information are handled in the style of a production process in which the
customer is the source of prime information.
Providing Facilities Online
The following titles indicate both the range of services that have been rapidly
elaborated using the SAP R/3 IACs and their supporting BAPIs:
• A product catalog with facilities to service Interactive Requests
• Employment opportunities, with reports to users on their application
status
• KANBAN stock-control logic, with reporting from the SAP available-to-
promise server
• Maintenance service notification
• Sales order creation, with reporting on sales order status
• Measurement and counter readings from the production plant and
laboratory systems
• Quality notification and quality certificates
• Consignment stocks status
• Project data confirmation
• Collective release of purchase requisitions and purchase orders
• Staff listing
• Integrated in-box
• Internal activity allocation and workflow status
• Internal activity price list, requirement request, and requirement request
status
• Asset management
Some of these are available as loosely coupled systems using the Application Link
Enabling (ALE) protocol.
Protecting Electronic Commerce
The variety of processes and the very large number of users who will have access
to a networked electric commerce system inevitably raise queries about the privacy
of personal data and the restriction of commercially sensitive information.
Malicious damage to databases and other forms of hacking are real threats.
Firewalls are interfaces that allow only the transmission of information if
commands have been authorized and their sources verified. Encryption is the
process of transforming a data stream according to a code, which can be used by
the recipient to restore the stream to its original structure. The complexity of
encryption procedures increases as code-breakers acquire the ability to decode
private data.
The SAP R/3 business interfaces and Internet components are designed to
implement the Secure Electronic Transaction (SET) standard, which is under
development by the Internet Engineering Task Force.
Accessing Business Partner Information
The multi-service firm Dun & Bradstreet can provide real-time financial
information about business partners using the D&B Access program.
Receivables management systems can be provided with online information on
corporate customers, including details of the business transactions carried out with
them and their affiliated companies. The collated data enables assessment of the
business partner with respect to sales, accounts receivable, credit and receivables
management, and the controlling areas.
The system performs customer risk management by constantly monitoring credit
line usage as it processes business transactions. If a customer exceeds the limits set
for outstanding debt or liquidity ratios, the system’s alarm function is triggered.
The network can include information sources such as credit reporting agencies and
credit sales insurance firms. For example, the D&B Access application, developed
by Dun & Bradstreet Solutions in cooperation with SAP, provides a direct link
between R/3 applications and the D&B database, which contains information on
more than 17 million European companies.
These integrated systems provide real-time credit-worthiness scoring data, monitor
insurance limits, or determine corporate group integration so that companies have
comprehensive information about their customers. The full potential of this
infrastructure will be reached once multilevel business processes are streamlined
and automated.
Ensuring SAP R/3 Accounting Software Certification
Certificates of compliance with the Generally Accepted Accounting Principles
have been awarded to the following modules:
• Financial Accounting
• Asset Accounting
• Real Estate
• Treasury Securities
• Treasure Money Market and Foreign Exchange
• Treasury Loans
• Treasury Borrower’s Note Loans
Ongoing certification has been implemented for FI and MM software under
development, with country-specific certification of individual functions where
necessary.
Accounting Worldwide
SAP International Development is a set of models—one for each geographical area
of the world. This set enables the SAP system to account for the rules and practices
of the major trading communities.
INT-International Development module includes the following components:
• IN-APA Asian and Pacific area
• IN-EUR Europe
• IN-NAM North America
• IN-AFM Africa and the Middle East
• IN-SAM South America
These modules are fully integrated into the R/3 system during implementation.
They are additional to the standard R/3 provision for translating screen text and
currency values to suit the local language, local currency, and reference languages
of the group head office system.
Confirming SAP R/3 Year 2000 Compliance
All releases of R/3 are compliant. No migration or upgrade is required for R/3
users. All date fields are four bytes, as are all related record layouts, screen layouts,
matchcodes (secondary indexes), and data dictionary definitions.
Testing for Millennium Compliance
Year 2000 certification tests have been conducted on fields, transactions, and
reports by using hundreds of consultants and developers who entered predefined
and arbitrary data to verify software quality. Using the SAP R/3 Computer-Aided
Testing Tool, many of these tests were repeated with various system dates in the
range of years from several years before to several years after 2000.
Checking Data Interface Compliance
Third-party data interfaces may present dates in two-digit format, but the SAP
system automatically converts a two-digit year into the proper four-digit number.
The input of data simulates data entry from a keyboard, so existing programs that
process keyboard data entry correctly will interpret and automatically convert two-
digit year dates to the proper four-digit number.
Developing the Open Information Warehouse
The purpose of an information warehouse is to provide technical, business, and
statistical data for any part of a corporation. The concept of an open database
includes the notion that all data is stored in tables ready to be instantly inspected
and used without the need for complex data-retrieval instructions in a specific
language peculiar to one vendor.
An open information warehouse suggests that all the information is readily
available in a form ready for use without special access operations. The implication
also exists that the inventory of the warehouse is comprehensive and up-to-date.
Selecting Data Sources
SAP information systems are available for all the main applications and are an
integral part of their operation. The information systems are an obvious source of
data concerning the specific areas of business activity. These systems already
cooperate with one another to share master data such as supplier details and
materials master data, and they are also integrated with the financial accounting
modules.
If the open information warehouse is to be developed in support of the EIS-
Executive Information System, a demand will arise for information from the TM-
Treasury Management module, which could include online information links to the
financial and materials market information systems provided by non-SAP vendors.
The following SAP sources contribute to the open information warehouse:
• Financial Information System (FIS)
• Controlling Information System (CIS)
• Purchasing Information System (PURCHIS)
• Materials Management Information System (MMIS)
• Production Information System (PPIS)
• Shop Floor Information System (SFIS)
• Plant Maintenance Information System (PMIS)
• Sales Information System (SIS)
• Human Resources Information System (HIS)
Creating Master Data Objects
One fundamental aspect of SAP standard business program design is that each data
object should reside in only one location, where it is known to be the master data
object. A data object may be copied but not altered without leaving a record of
who altered it and when. Once a master object is updated, all subsequent calls to
that object should encounter the new information.
The standard date functions in SAP have always been business objects that carry
information, such as the system date and time, and processes that can transform
this value to express the date and time in various time zones and in appropriate
languages and formats. If you try to enter a date that is not expressed in an
acceptable format, an SAP system does its best to convert it.
NOTE: SAP does not enable you to enter the time or date in a format of your own invention because this may
not be understood by other users and their business processes.
Using the Document Management System
You have the resources of the DMS-Document Management System at your
disposal to help you find what you require in the open information warehouse. The
R/3 Classification System comprises many functions designed to help you locate
information held in document form. You may search on the basis of subject matter,
or you may search for an item because you know it is linked with one of the
following data objects:
• Another document
• A material identified by its material number, by its name, or by part of its
name
• An item of equipment, given its name or only the identification of the
activity where it is used
• A project identified by its number, the person responsible for the project,
the project’s purpose, and so on
• A quotation
• A sales order
• A customer or a vendor identified by an attribute in the master records
Mining for Significant Data
The basic purpose of data mining is to look for patterns in data. The simplest
pattern is one that satisfies a search query, such as all customers who have placed
an order in the current financial year and who live within a specific marketing
region. This type of convergent search terminates when all examples that match the
pattern are found, if there are any in the database.
Data mining usually refers to more intelligent searching, which falls into the
categories of supervised and unsupervised machine learning. In each case, the
machine seeks to find which records in the database go together in some way
because some aspects of their data can be related.
Supervision entails setting off the search by declaring some relationships in the
data that must be considered, at least to start. For example, records may only be
examined further if they already reveal that the customer has spent more than a
certain amount in the period under consideration. Given this baseline, the
supervised search can be told to look for patterns, for example, only in the type of
goods purchased. You can then ask to find the purchasing patterns associated with
the purchase of a particular item.
These data mining operations can tell you only which data values are associated;
they can say nothing about the reasons. On the other hand, you may reasonably
infer that your chances of making a sale to a prospect who has already bought a
product associated with your product will be higher than if no discernible
relationship exists.
The area in which the intelligent data mining engine has discerned a strong
association may be the area in which to seek your objective, even if you cannot
work out why some of the data values should appear as part of the significant
pattern. For example, it was said that prospective air combat pilots who could list a
large number of items of sporting equipment were more likely to become
successful flyers than those who could name only a few. The explanations for this
could be diverse: Sportsmen have better hand-eye coordination, or team players are
used to doing what they are told and putting up with discomfort.
If you use a pattern discerned by data mining to guide your future activities, you
must expect some disappointments. Sometimes the prediction turns out to be false
for individual cases; some of the rejected candidates might have been successful.
This fallibility can be demonstrated by carrying out your pattern recognition and
then paying no attention to it until a large sample of data has been accumulated.
How good does your prediction look now? How many successes would you have
lost if you had followed the policy suggested by the pattern mined from the data?
Your accountant will be able to tell you how much money you might have saved
by applying the policy compared to what you actually spent by ignoring it.
For example, an unselective advertising campaign may reach some unexpected
customers. That unusual data can then be used to help discern yet more significant
patterns.
Some data-mining products are set up to develop a range of data models that are
then applied to fresh data in a competitive manner to see which variation serves as
the best predictor. By this means, it is possible to determine the relative worth of
each element in the model. This may be important if the cost of obtaining the data
object is high. Having to conduct an interview, for example, may entail a very high
cost, which may not be worthwhile—the consequences of making a false positive
prediction and the consequences of making a negative or rejected decision might
not be justified. More subtle computations of probabilities can be used to steer the
data-mining engine in the direction most likely to be fruitful.
Discerning Patterns of Events
One of the keys to designing useful business objects is the existence of recurring
patterns that could be recognized by a system and provide business significance.
The arrival of a purchase order is an event that can be detected in any of several
different ways and can be checked for validity. Your business expects other
purchase orders. Therefore, investment in business objects to cope with them may
be worthwhile. There is a pattern to such events; purchase orders can be
recognized.
If you look at a set of events that do not share any common features, you could be
said to be a problem solver. You may have to create a new and unique procedure to
deal with each event. But you may still find it convenient to make use of a database
that contains business objects. If you are repairing a system and decide that a
particular part needs replacing, it might be convenient to call up and run the
maintenance object for that system. You might want to access not only system
checks directly or keyed-in data, but you also might want to run the stock control
module to determine the best way of acquiring the part you need and obtaining its
cost and delivery information.
Operating with SAP R/3 Business Objects
An object in the language of object-oriented programming (OO) is an entity that
carries a data element that signifies the state it is in, such as OFF or ON, and shows
some method by which this state can be changed. More than one method of
changing an object’s state could be indicated, and an object may have more than
two states. What matters to the user is what else happens or could happen if an
object’s state changes. For example, an object that has the function of recognizing
when a purchase order arrives could also have the functions of checking the stock
availability and the customer’s credit status.
Imagine a more complicated business object that has the function of finding not
only the best supplier for goods required but also other potential customers for
these goods. Such a business object might behave very much like a free market
enterprise. It could be allowed to search widely for both customers and suppliers.
You might wish to endow such an object with rules for choosing the best buy in
the context of the pool of customers available. You may also direct the object to
use the profitability of each potential trading activity as one of the factors when
deciding on the best course of action. Of course, it might be prudent to set limits on
the scope of this free market business object and bring in a human assessor when
these limits are approached.
This example would not be too creative in many industrial contexts because
purchasing, marketing, and sales staff carry out elements of this complex function.
A standard business object, however, could add the routine widening of search
horizons because the information-gathering process will not entail extra human
time.
Now suppose the suppliers identified by our marketeer business object were
themselves aware that a requirement for their type of product was put out to
competitive tender. They might well have a similar type of business object that
could find the best way of meeting the requirement. The marketeer business object
could find itself being used over and over again, with each reincarnation using
different particular details but still following the standard business process
programmed to work as efficiently as possible.
Updating Business Objects
This chapter has illustrated the concept of business objects with examples of wide-
ranging online functionality. An intermediate procedure involves holding your data
as business objects that carry static information in between formal updates. A price
list or a book of telephone numbers could be said to be a business object. But if
you never make any updates when new information is available, your business
objects are not as useful as those that are updated according to the rules
programmed into them, regardless of whether you decide to update them manually.
Drawing Upon the SAP R/3 Business Object Repository
The Business Object Repository (BOR) is a database that holds reusable standard
business processes that can be called upon to build a specific implementation
quickly. This is but an extension of the SAP process of building standard business
software elements that can be customized to suit their circumstances. Keep in
mind, however, that these elements can be customized only within limits that do
not compromise the functional integrity of the program. In particular, an SAP R/3
Business Object cannot be altered so that it is no longer compatible with the rest of
any R/3 implementation. The object always remains a fully integrated component.
Anticipating Internet II
The next generation of Internet servers will run at many times the speed of the
current devices, but much more traffic will exist on the net. Several developments
are underway at the research stage, and if adopted as standards, these innovations
will facilitate the setup of systems that can accommodate literally millions of users
online at the same instant.
For example, the R/3 Internet Transaction Server is available to extend the three-
tier SAP R/3 architecture. This server enables many users to access an SAP R/3
installation through the Internet. The Secure Electronic Transactions (SET)
standard for business communications is supported, and multitasking is possible.
Raising Standards of Business Programming
The SAP R/3 Reference Model is held in the Business Repository from which each
function and data object can be drawn as needed. In order to raise the standards of
business programming, cooperative work is in progress to define a Unified
Modeling Language (UML) that uses high-level modeling to organize and refine
the components which can then take part in specific workflow sequences.
Business processes that have been defined to the UML standard can be transferred
to any UML-compliant repository. For example, the Microsoft Repository has been
populated from SAP R/3 and so the programmers and tool developers who use the
Visual Basic language can call upon the SAP standard business processes and use
them in their own environments.
Using Electronic Commerce Partner Applications
SAP has always made use of third-party development partners to accelerate the
introduction of products that meet the SAP certification standards. Some more
recent partner applications illustrate the widening range of business applications
that has become apparent as the reliable network standards open the potential
market. The cooperative products are referred to as complementary solutions.
SAP operates a certification program to ensure that complementary products
interface properly with SAP, though it does not evaluate other aspects of
complementary solution software.
Connecting to SAPoffice
Although the SAPoffice email system has been available from SAP R/3 Release
3.0, it illustrates the way in which a standard SAP system can be related to a
variety of third-party systems. R/3 applications use SAPoffice to automatically
generate electronic messages that inform users of critical business process events.
Electronic messages from SAPoffice can start application processes and can be
integrated with SAP Business Workflow to provide automatic messaging services
for workflow processes.
SAPoffice can send and receive email messages over the Internet by means of an
SMTP interface. An interface to X.500 directories is available, and you can send
external messages from SAPoffice using SMTP, FAX, or X.400 interfaces.
SAPoffice can receive, process, and archive incoming faxes. You can upload and
download files between SAPoffice and desktop applications such as Microsoft
Word, Excel, PowerPoint, Microsoft Project, AmiPro, or WordPerfect.
Accelerating Implementation with the Business Engineer
With the release of R/3 4.0, SAP significantly enhanced the R/3 Business Engineer
to release 4.0. This is the support tool for Accelerated SAP (ASAP™), which is a
standard worldwide methodology for rapid implementation.
The SAP R/3 Business Engineer provides an open infrastructure to help businesses
shorten implementation time and optimize return on investment. As an Internet-
enabled component with a release cycle separate from the R/3 releases, the R/3
Business Engineer enables you to incorporate the latest business templates and
continually adopt the latest R/3 functionality to streamline your business.
Chapter 13
FICO Education and Training
In this chapter
Introducing FICO Education and Training
Structuring a Program
Developing Detailed Education and Training Plans
Defining Scope of Education and Training
Introducing FICO Education and Training
This section looks at the place of Financial Accounting and Controlling education
and training within the life cycle of an SAP project.
In the initial stages, it helps if the reasons for opting for a system change generally,
and SAP in particular, are shared with the workforce. Many companies change
their core business over a period of time, change direction, or find that existing
systems simply will not cope. It ought to be clearly explained to the workforce how
cost benefits can be achieved in realistic timescales.
The SAP system now runs on Windows 95, is compatible with other “best-of-
breed” mainframes, and is built “ready-to-go.”
An expert could configure a basic system in a matter of days. It would be of little
use, however, because from the top to the bottom of the company, employees have
to change their routines and learn a new way of working. This takes time and costs
money. It has been suggested that the ratio of software costs to hardware costs to
consultancy work out at about 1:1:3. So the required commitment to this level of
investment should be understood from the outset.

In order to benefit from this level of spending and potentially reduce these costs, it
makes sense to focus on the transfer of skills. Financial Accounting and
Controlling exists at the heart of any organization. This is partly due to the
statutory nature of external financial reporting, and partly because an accurate
record of financial performance is essential for the short- and long-term health of
any organization.
Identifying Learning Zones
There are four learning zones, each requiring a unique and clear training approach.
The following sections discuss each of these zones.
Identifying Technical Skills
Candidates for this would be the employees who are going to be involved at the
database management end—programmers with background knowledge of
commercial applications. ABAP, UNIX, and BASIS skills and a sound knowledge
of the existing company computer networks, operation systems, and systems
administration would be a prerequisite.
These are the people who are going to configure and maintain the technical side of
SAP. Their education would start at the SAP Training Center, using computer-
based learning techniques, and would continue in the workplace under the initial
guidance of consultants or in-house trainers.
Identifying Application Skills
SAP is one piece of software that can be adapted to an infinite variety of
businesses. The company needs staff with the skills to structure the software so
that it fits the industry: oil, sugar, medical, financial, and so on. A company
implementing SAP will have legacy applications and staff with a sound knowledge
of the functions they perform; these staff members should be actively involved in
the implementation and attend SAP applications training as a first step.
“Key users,” with sound business acumen and a thorough understanding of
existing applications, will need to extend their skills so that they not only operate
after a satisfactory im-plementation, but also support and use it creatively,
continuously molding it to fit their own business.
Identifying Information Skills
Information skills are critical for success in today’s business environment. The
rapidly changing nature of markets and competition means an organization must be
able to identify and react to changing circumstances. Current thinking suggests that
an organization should have a 7:3 ratio of information processing to data capture. It
is important in an SAP implementation to keep in mind the information
requirements of an organization and consider this in the implementation design.
Identifying Management Skills
Skills at the managerial level need to be enhanced to confront the issues that will
arise as a result of system changes. Managers have to be apprised of the business
risks as well as the opportunities; they need to know what to retain, what to let go,
and how to formalize company policies. The SAP integration course provides good
information about the impact of features, functions, and policies in an integrated
business systems environment.
Change management skills are being increasingly sought. The human issues are
now becoming more and more important. As the technology becomes more
familiar, the need to derive a competitive edge from its use will rely on the human
element. The change manager needs to work with the board and develop
a transformation program that encompasses all aspects of change.
Companies who have developed a successful implementation, and the consultants
who have supported them, will be valued for the education and training that they
are able to pass on. This will further raise the profile of SAP training.
Facing the Challenges
Successful implementation of the FI and CO modules will ensure improvement of
the level of financial information and control. This, in turn, should allow the
company to be proactive in satisfying the needs of its markets. Commitment to
these goals is a critical factor. The risks lie not so much in the technology as in the
human issues; people won’t accept a new idea unless they’ve had some part in its
development or unless they feel they’ll benefit from it personally. Getting people
to accept new ideas is part of the educational challenge.
SAP is designed to help people do a better job, a job they can be proud of, a job
providing a real sense of accomplishment. Employees seek recognition, personal
benefits, and an assurance that their contribution adds value to the business.
Users who are familiar with an existing system are often able to arrive at answers
quickly without having to go through all the formal steps. They may have routines
memorized; they may know who must sign forms and where to distribute them.
They may know where to obtain the critical information within the current
systems. This knowledge makes for a comfortable way of life in which employees
perform job functions efficiently without having to refer to manuals or ask for
help. They have probably developed shortcuts, which they understand but which
provide only very limited benefit.
The introduction of a new system requires new forms, new procedures, new
disciplines, and new reporting methods. New systems may require changes in the
reporting structure, and changes in job roles and functions.
This change can be threatening because users may feel that their existing skills
have lost value. The commitment of management to learning within a company
needs to be stressed constantly.
Points of Principle
The key messages for FICO modules users to appreciate during education and
training are
• The FI module is all about getting the right information for the financial
statements in an integrated manner from the business or logistics systems
and direct entry.
• The CO module is all about providing useful indicators about the internal
and external success of the company and a means to control company
plans.
• The project team must not lose sight of the core purpose of the financial
function. Performance and targets still need to be monitored carefully as
staff members are released for training.
• Education and training form part of staff development on an ongoing
basis, not just for the new systems implementation.
• Education provides background and contextual input—why they do
things in the broader picture.
• Training is very specific—what SAP does, how it does it, and what the
user must do to support the operations of the business.
Determining Impact on Business
The impact of a training program on the business is many fold. Users who are
being trained are not able to simultaneously perform their current job functions.
The business must continue to function while training is being conducted.
Management must therefore have a full commitment to the training program. This
may mean reorganizing workloads to ensure that the impact on the business is
minimized. They must, above all, promote the benefit of the training for the
business and also for the individual in terms of performance and flexibility.
Getting Commitment of Management
The impact of changing integrated systems in a company is not unlike replacing
the nervous system of a body and will clearly raise anxieties at all levels.
Staff will look for sound leadership. There are obvious advantages to building a
project team using a representative cross section of managers from key user areas.
Departmental training needs can be monitored and shared.
The importance of a clear, comprehensive education and training program that is
timed to address the need for new competencies is vital, particularly since the
reporting requirement function remains vital to monitor the business. Frequently,
education, training, and the generation of related documentation involves far more
time and effort than the project team might expect early in the project.
Achieving consensus and commitment and setting the right momentum early in the
project will address these issues.
Changing Job Roles, Responsibilities, and Standards
Staff job content will change. Individuals’ roles may remain the same if the system
is being overlaid on the current organization, but how they achieve results will be
different.
Staff will need to be fully trained on the new data capture and reporting functions
and will need extensive documentation to support their activities. Analysis,
documentation, and training skills may need to be brought in from external
sources.
Companies need to be sure that they do not loose their compliance with the
companies’ and various tax acts, as well as compliance with the Generally
Accepted Accounting Principals (GAAP) adopted for financial reporting.
Structuring a Program
Structuring a program correctly is essential if the benefit of training is to be
maximized. In broad terms, you need to focus on audience, content, and timing.
You need to ensure that you identify the level of the audience for each training
session. The audience will determine the requirements of the content required.
Content can refer to both the breadth and the depth of knowledge instruction
required. Lastly, you need to consider the timing of the program. Training must be
provided at the correct time. Too early, and the impact of the training is reduced as
knowledge learned is forgotten. Too late, and you risk delaying the project or
creating frustration or errors for users of the system.
Using SAP Courses
SAP courses are ideal for project team members to obtain understanding of SAP
functionality. End users need to receive education and training appropriate to their
environment. There is a third specific type of user who provides a key component
in realizing the competitive advantage an SAP implementation provides: the
information user.
Timing of attendance is all-important. A candidate returning to his work
environment needs to be given the opportunity to make use of the newly acquired
skills. This can be done in several of the following ways:
• Contributing to project activities
• Delivering a presentation to colleagues
• Accessing the demonstration SAP database and working through
examples
• Creating discussion papers for policy development
• Analyzing current reporting requirements and future information needs
• Highlighting specific areas of concern for the project team
The point of giving structured follow-up work is to reinforce the content of the
course and to make the information accessible to colleagues.
There are further benefits of attending public courses. Staff members will meet
others from similar industries who are likely to be at different stages of the project
cycle, and they can exchange “war” stories. It is hoped that these experiences will
be of a positive nature and raise morale.
NOTE: A public course will generally cover a broader scope of the SAP product and provide the trigger for
thinking outside the bounds of common work practices.
Designing In-House Courses
No public courses exist to meet the needs of each individual company. The project
manager(s) will need to devise, plan, and deliver courses with the assistance of key
users. If project managers do not have the time or specific skills to do this, they
should be prepared to use the services of a training consultant who could carry out
a needs analysis, devise a plan, and create the material.
At this stage, the contentious issue of the cost of training arises. Quality training
can be seen to be an expensive overhead item, but it is not half as expensive as a
poorly trained work force and error-ridden data.
Whether imported or home-grown, it is useful to have some idea about what
characterizes quality training. The following sections provide a rough guide.
Specific industries can extend this by incorporating their own unique industry
requirements or features such as safety standards, confidentiality, hygiene, and so
on.
Setting Goals
To be successful, an education program must have clear goals. Ideally, the
following goals would be targeted:
• Communicate and educate at all stages, but particularly in the early
stages.
• Gain user acceptance early.
• Generate high motivation.
• Aim for a shared understanding of the language, terminology, and
functions of the system.
• Demonstrate a commitment to team learning in vertical groups, as well
as in departments.
• Allow users to identify their own success and that of the system.
• Identify the skills users need to make the system work and acquire them.
• Celebrate success and progress.
If the above list looks overly optimistic, consider the alternative scenarios.
• Confusion and perceived job insecurity arising from rumors
• User resistance
• Poor motivation
• Interdepartmental struggles and ambiguous communication
• Users not understanding the purpose of the system
• Users ignoring the system or using it badly, corrupting or losing data
Even if this is an exaggeration, it illustrates the point that although training isn’t
cheap, a lack of it can be very expensive.
Getting Quality Training
Having set some high-reaching goals for the trainers, it is worth considering what
goes into quality training. What will be needed to achieve these goals?
Quality training can be defined as the efficient acquisition of the knowledge, skills,
and attitudes necessary to achieve and sustain specific goals.
An effective training plan should do the following:
• State the learning objectives. These should be the long-term changes in
the knowledge, behavior, and skills you expect of users.
• Record and make known to the learner the success criteria used to
assess learning.
For example:
A learning objective could be
The user needs to understand that the system allows for the automatic
payment of supplier invoices.
The success criteria would be
The user is able to request a payment proposal, execute it, and print the
output for analysis and authorization.
The terms task and outcome may be preferred; the important thing is that it
must be clear to all parties concerned what is being taught and what is
being learned.
• Consider the methods that will result in learning. Such methods may
include computer-based learning, workshops, tutor-led sessions, consultant
presentations, reading and video assignments, or practice with the system.
If there are optional teaching methods, consider the candidates’ preferred
style of learning.
• Define the objectives before selecting a teaching method.
• Use documentation that is as good as you can possibly afford. Working
with well constructed training materials will help develop the skills of less
experienced members of the project team who are called upon to carry out
training.
If the learning objectives or groups of learning objectives are written into the
phased project planning, along with descriptors, roles, deliverables, and
accountability, it is possible to deliver the training on a just-in-time basis. The
training schedule must not be written isolated from the project plan because timing
is all-important. Deliver the course at a time when the project cycle will allow the
user to learn, rehearse, and then apply knowledge in a meaningful situation. It does
wonders for morale.
NOTE: Within the implementation plan there should be a separate training plan that is integrated but
managed separately. If it is viewed in this manner, there is less likelihood of the training dimension being
underestimated or, even worse, ignored.
Teaching the Adult Learner
There are other factors to take into account when dealing with adult learners in the
workplace. For example, some users may be set in their ways. To effectively teach
such individuals, a training program must incorporate the following attributes:
• Motivation—The learner must be inspired to change behavior, to
respond to instruction, and to accept what is being taught.
• Content—The learning objectives must be presented in the context of
what the learner already knows and understands.
• Structure—Learning must be sequenced to provide repetition, practice,
and feedback of exercise results. Such structure reinforces newly acquired
knowledge and skills and transfers them to real-world applications.
• Meaningful and relevant—The learner sees and accepts the purpose of
the education as personally relevant.
• Immediately useful—Learning should be applied immediately, before it is
forgotten.
• Exciting—The structure stimulates, usually through participation.
Physically doing things keeps a marginally attentive learner interested.
A key to successful change management is to overcome fears that will inhibit
learning at all levels. By eliminating fear or apathy, you can develop an
atmosphere that will create support for your financial system. You can then make
everyone want to succeed by using the system and by using it properly. This will
happen if time and effort is invested to ensure that all employees understand,
accept, and believe that the system will be personally beneficial, that their jobs will
be better, that each department and the entire company will function more
efficiently, and that resorting to informal methods to circumvent the system will be
self-defeating and must be prevented. In addition, employees should achieve some
degree of reward and prestige by showing that they have learned how to use the
system correctly.
TIP: View the implementation of SAP as a challenge and an opportunity, not a painful problem. Each person
should profit from the system, grow professionally, feel increased worth toward the company, and receive
increased respect from it in return.
Managing Expectations
The expected benefits from the FICO modules may include the following:
• Improved recognition of cash discount
• Streamlining of mundane financial tasks
• Better management information systems
• Reduced costs of reporting
• Reduced clerical cost and the elimination of duplication
• Reduced headcount
• Reduction of capital costs
• Reduced cost of running old systems and associated hardware and
software maintenance costs
• Increased visibility
Management needs to explain why these benefits are required and how these
benefits can be achieved. This is crucial, as it justifies the replacement of old,
familiar systems.
Fear of the system is usually caused because end users do not see what is in it for
them; if they can see the personal benefits, they will be more likely contribute to it.
NOTE: The possibilities of reduced head count will inevitably cause high anxiety and will demand some
sensitive handling when developing education and training messages.
Developing Detailed Education and Training Plans
So far, the ground rules for training and education have been covered. The details
of an education and training plan will vary considerably. So many factors influence
it; the nature of the business, the level of existing expertise, the size of the budget,
the need for speed. No two companies will be alike.
An education and training program needs to be integrated with implementation
plans for multiple-phased modules. SAP is usually implemented in many different
locations with different products. It is therefore important to have a structured
approach.
The following sections provide a sequenced checklist that may help members of a
project team, users, or managers address some of the key communication,
education, and training activities to be included in a program.
Appreciating the Environment
The training program must be influenced by changes to business, any historical and
current knowledge of attitudes regarding change, and skill levels. To ensure this,
the following tasks should be accomplished:
• Understand the overall implementation plans and timing.
• Assess the company’s communication policies.
• Review user requirements.
• Assess all areas of the business change (for example, re-engineering and
business renewal).
• Assess the executive and management commitment levels to change.
• Fully appreciate the past track record of implementations.
• Assess the competencies of staff at all levels.
Management commitment levels and communication are critical items in this list.
Without management commitment, employees will not show commitment. Poor
communication leads to fear and suspicion.
Developing Education and Training Strategy
Consider alternative approaches to training and which approach is suitable
depending on the knowledge transfer required, current skill levels, and attitudes.
The following should be achieved to develop the best strategy:
• Prepare alternative approaches and a variety of teaching styles—one-on-
one, workshops, modeling, self-paced, and computer-based learning.
• Recommend approaches, showing the advantages and disadvantages of
each alternative.
• Secure top-level executive commitment.
• Use the senior levels of management to launch the overall program.
Launching Program
Having devised a suitable training program, you need to ensure it is launched
effectively. This can be accomplished by doing the following:
• Announce overall plans in a project newsletter or similar communication
vehicle.
• Address staff concerns as they arise.
• Commence the overall education program—background understanding
of the project, understanding of integration issues, best practice
implementation.
The importance and commitment to the training program needs to be stressed
again. Any issues or concerns should be addressed prior to the start of the program.
Assessing Role Definition and Level of Expertise
In order to identify the suitability of courses for actual individuals, job roles, as
they will exist in the new business, and the associated skills required need to be
identified during implementation. These required skills need to be matched to
existing user skills, thus identifying the skills gap. Training courses are designed to
cover these skill gaps. Do the following to identify roles and the level of expertise:
• Work with the project team during FI and CO configuration and develop
lists of tasks and procedures (SAP and non-SAP) that will be performed by
the various units.
• The overall education and training program is developed to support
change management activities—courses and how much job-release time
various units require.
• When roles have been defined, these will be allocated to the new or
existing positions in the departments where the FI functionality is being
implemented.
• Level of expertise needs to be defined for new employees to ensure that
their training requirements do not delay implementation dates.
Working with key users on the project team who are part of the organization can
help foster positive attitudes for the ensuing changes.
Identifying Trainers
Identifying the correct trainers is important to the overall success of the training
program. Keep the following in mind while identifying trainers:
• Trainers are identified from key users.
• Training is prepared for key users who will have to sign off policies,
propose systems operation, and convert data for system implementation.
• Confirm adherence to accepted GAAP principles for the new procedures.
• Trainers are educated on how to train.
• Trainers develop the education and training material.
The skill of the trainer should not be underestimated in the effectiveness of the
overall program. A trainer must be accepted by the users as having relevant
business knowledge, as well as knowledge of the system. Identifying trainers from
within the key users is preferable to external trainers. The train-the-trainer skills
are essential, however, to ensure that the necessary transfer skills are taught.
Defining Competencies
In order to target the courses in the program effectively, it is necessary to identify
existing competencies. This can be used to identify user competencies in existing
job positions and the relevant competencies for new positions. The following are
general guidelines for defining competencies:
• A competency measurement program is developed to assess the
effectiveness of training and user competency.
• Existing staff members are assessed for existing competencies and
appropriate courses are developed to improve competencies (for example,
PC-use capabilities prior to starting the full FICO education and training).
• Individuals are identified for the various positions in the new/existing
organization.
Because the time spent by users on courses is usually limited, it is important that
existing competencies and relevant courses are identified. This maximizes the
quality of the training program in the given time.
Developing Training Schedules
Having identified the training program, the trainers, and the users and their
requirements, you can now consider developing individual training schedules for
each user. To develop a training schedule, do the following:
• Locate and verify training facilities and equipment.
• Develop detailed training schedules for individuals.
Training schedules should be developed for each individual. Avoid the temptation
to assign an entire department to a single course or series of courses. If a course is
perceived as being not particularly relevant for an individual, it colors his or her
perception of the entire training.
Going Live
After the training program has been finalized, a check is made to ensure that the
training is ready for roll out. The following tasks are completed before going live.
• Assess trainers prior to the system going live.
• Check the accuracy of training schedule dates and locations.
CAUTION:
Missing an introductory course due to incorrect schedule information can seriously affect all subsequent
training.
Providing Support After Implementation
The training program does not end with the training of the initial users of the new
system. It must support ongoing training, training of users for a change of role, and
training for new employees. The following are guidelines for providing support
after implementation.
• Post-implementation support programs are designed to ensure that,
following education and training sessions, additional ongoing support is
provided.
• Refresher education and training is provided after going live.
• Follow-up and ongoing training programs ensure that the staff uses the
system correctly.
• Induction procedures for training new starters are formalized.
• The company training department adopts education and training
programs.
An ongoing training program should continue to monitor the relevance of each
training course. Changes in the way an organization uses the software can lead to
changes in some course instruction.
Defining Scope of Education and Training
Having outlined the possible training opportunities within the project cycle, it is
useful to have an idea of the range of courses that may be applied to meet the
business training needs. It is possible to opt for off-the-shelf material or
professionally produced courses. However, the project team must be prepared to be
creative and design training courses if the need arises. The following sections
suggest a range of courses and workshops generally available from SAP.
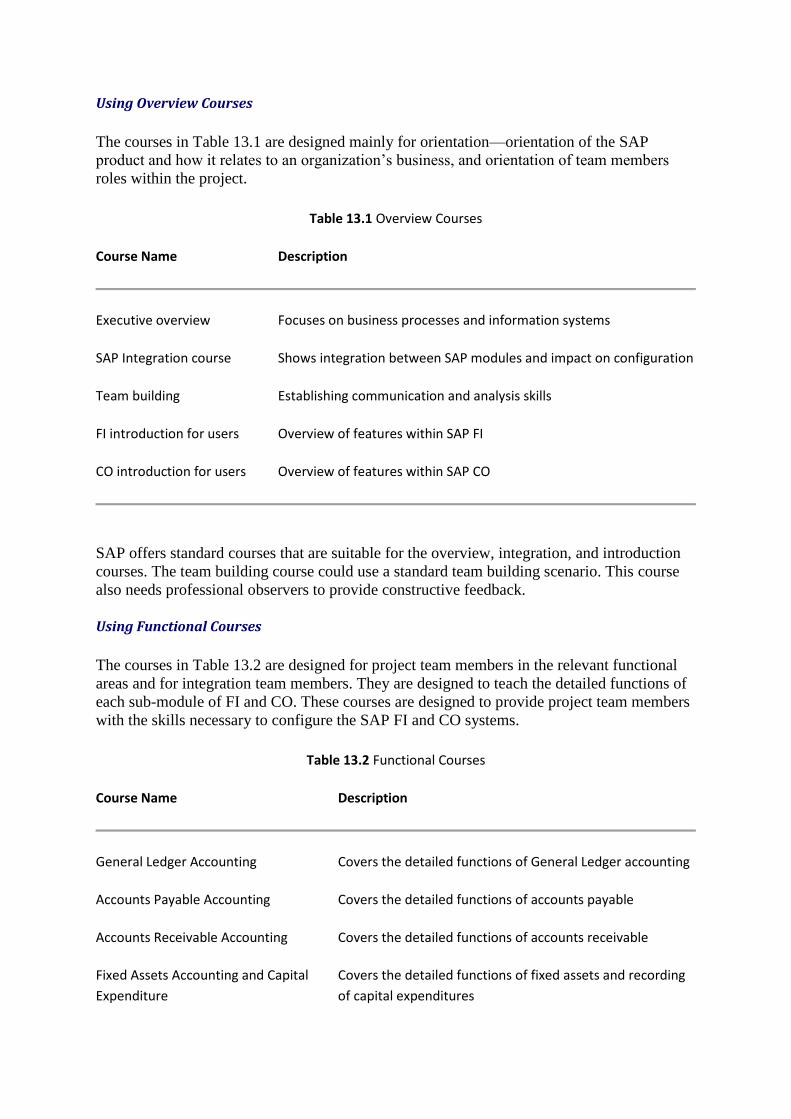
Using Overview Courses
The courses in Table 13.1 are designed mainly for orientation—orientation of the SAP
product and how it relates to an organization’s business, and orientation of team members
roles within the project.
Table 13.1 Overview Courses
Course Name Description
Executive overview Focuses on business processes and information systems
SAP Integration course Shows integration between SAP modules and impact on configuration
Team building Establishing communication and analysis skills
FI introduction for users Overview of features within SAP FI
CO introduction for users Overview of features within SAP CO
SAP offers standard courses that are suitable for the overview, integration, and introduction
courses. The team building course could use a standard team building scenario. This course
also needs professional observers to provide constructive feedback.
Using Functional Courses
The courses in Table 13.2 are designed for project team members in the relevant functional
areas and for integration team members. They are designed to teach the detailed functions of
each sub-module of FI and CO. These courses are designed to provide project team members
with the skills necessary to configure the SAP FI and CO systems.
Table 13.2 Functional Courses
Course Name Description
General Ledger Accounting Covers the detailed functions of General Ledger accounting
Accounts Payable Accounting Covers the detailed functions of accounts payable
Accounts Receivable Accounting Covers the detailed functions of accounts receivable
Fixed Assets Accounting and Capital
Expenditure
Covers the detailed functions of fixed assets and recording
of capital expenditures
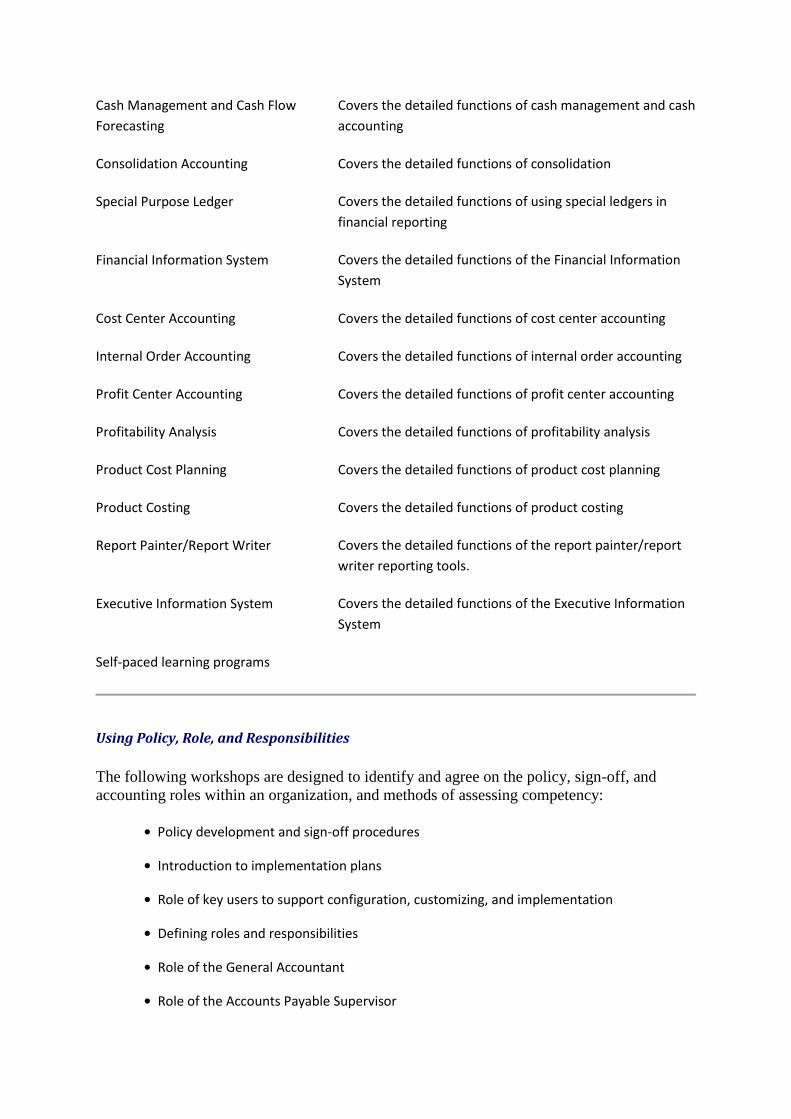
Cash Management and Cash Flow
Forecasting
Covers the detailed functions of cash management and cash
accounting
Consolidation Accounting Covers the detailed functions of consolidation
Special Purpose Ledger Covers the detailed functions of using special ledgers in
financial reporting
Financial Information System Covers the detailed functions of the Financial Information
System
Cost Center Accounting Covers the detailed functions of cost center accounting
Internal Order Accounting Covers the detailed functions of internal order accounting
Profit Center Accounting Covers the detailed functions of profit center accounting
Profitability Analysis Covers the detailed functions of profitability analysis
Product Cost Planning Covers the detailed functions of product cost planning
Product Costing Covers the detailed functions of product costing
Report Painter/Report Writer Covers the detailed functions of the report painter/report
writer reporting tools.
Executive Information System Covers the detailed functions of the Executive Information
System
Self-paced learning programs
Using Policy, Role, and Responsibilities
The following workshops are designed to identify and agree on the policy, sign-off, and
accounting roles within an organization, and methods of assessing competency:
• Policy development and sign-off procedures
• Introduction to implementation plans
• Role of key users to support configuration, customizing, and implementation
• Defining roles and responsibilities
• Role of the General Accountant
• Role of the Accounts Payable Supervisor
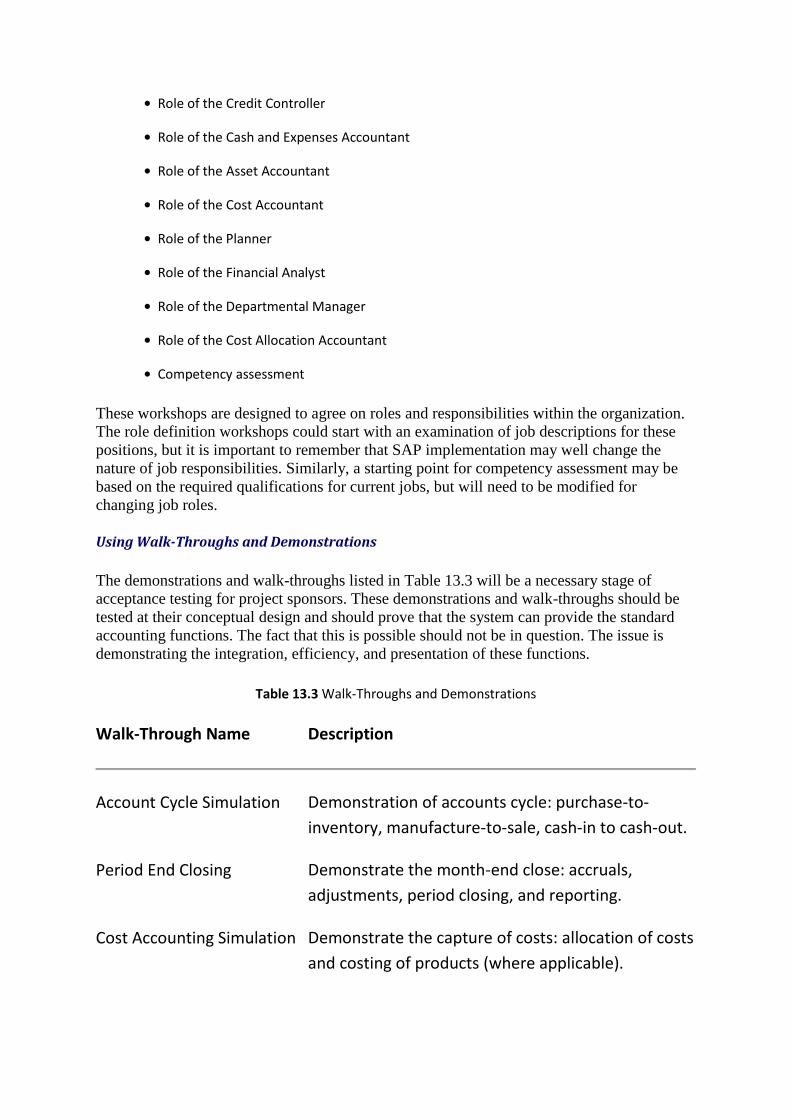
• Role of the Credit Controller
• Role of the Cash and Expenses Accountant
• Role of the Asset Accountant
• Role of the Cost Accountant
• Role of the Planner
• Role of the Financial Analyst
• Role of the Departmental Manager
• Role of the Cost Allocation Accountant
• Competency assessment
These workshops are designed to agree on roles and responsibilities within the organization.
The role definition workshops could start with an examination of job descriptions for these
positions, but it is important to remember that SAP implementation may well change the
nature of job responsibilities. Similarly, a starting point for competency assessment may be
based on the required qualifications for current jobs, but will need to be modified for
changing job roles.
Using Walk-Throughs and Demonstrations
The demonstrations and walk-throughs listed in Table 13.3 will be a necessary stage of
acceptance testing for project sponsors. These demonstrations and walk-throughs should be
tested at their conceptual design and should prove that the system can provide the standard
accounting functions. The fact that this is possible should not be in question. The issue is
demonstrating the integration, efficiency, and presentation of these functions.
Table 13.3 Walk-Throughs and Demonstrations
Walk-Through Name Description
Account Cycle Simulation Demonstration of accounts cycle: purchase-to-
inventory, manufacture-to-sale, cash-in to cash-out.
Period End Closing Demonstrate the month-end close: accruals,
adjustments, period closing, and reporting.
Cost Accounting Simulation Demonstrate the capture of costs: allocation of costs
and costing of products (where applicable).
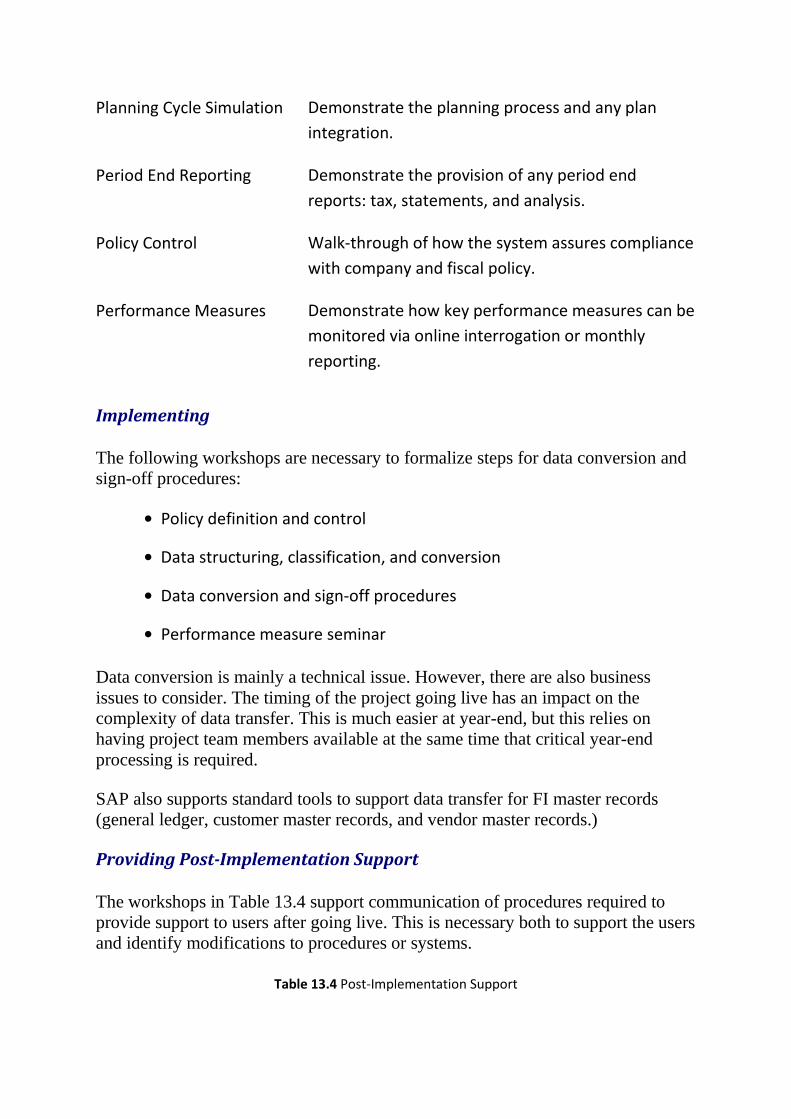
Planning Cycle Simulation Demonstrate the planning process and any plan
integration.
Period End Reporting Demonstrate the provision of any period end
reports: tax, statements, and analysis.
Policy Control Walk-through of how the system assures compliance
with company and fiscal policy.
Performance Measures Demonstrate how key performance measures can be
monitored via online interrogation or monthly
reporting.
Implementing
The following workshops are necessary to formalize steps for data conversion and
sign-off procedures:
• Policy definition and control
• Data structuring, classification, and conversion
• Data conversion and sign-off procedures
• Performance measure seminar
Data conversion is mainly a technical issue. However, there are also business
issues to consider. The timing of the project going live has an impact on the
complexity of data transfer. This is much easier at year-end, but this relies on
having project team members available at the same time that critical year-end
processing is required.
SAP also supports standard tools to support data transfer for FI master records
(general ledger, customer master records, and vendor master records.)
Providing Post-Implementation Support
The workshops in Table 13.4 support communication of procedures required to
provide support to users after going live. This is necessary both to support the users
and identify modifications to procedures or systems.
Table 13.4 Post-Implementation Support
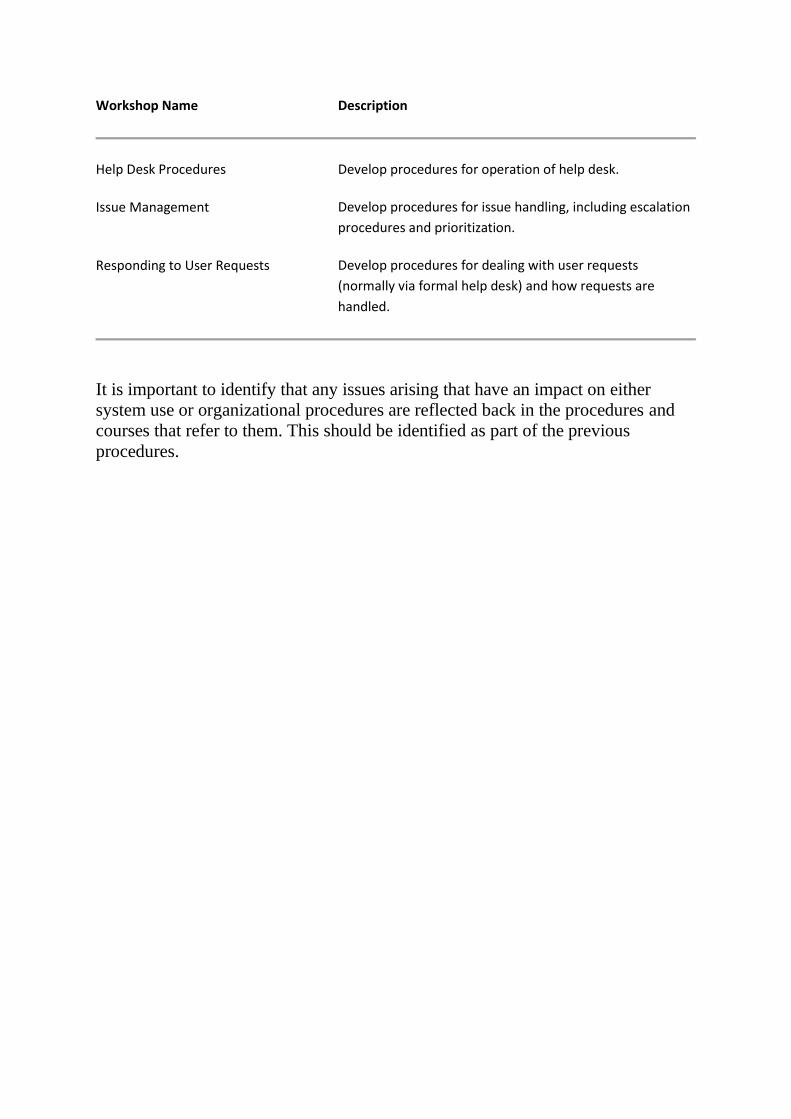
Workshop Name Description
Help Desk Procedures Develop procedures for operation of help desk.
Issue Management Develop procedures for issue handling, including escalation
procedures and prioritization.
Responding to User Requests Develop procedures for dealing with user requests
(normally via formal help desk) and how requests are
handled.
It is important to identify that any issues arising that have an impact on either
system use or organizational procedures are reflected back in the procedures and
courses that refer to them. This should be identified as part of the previous
procedures.
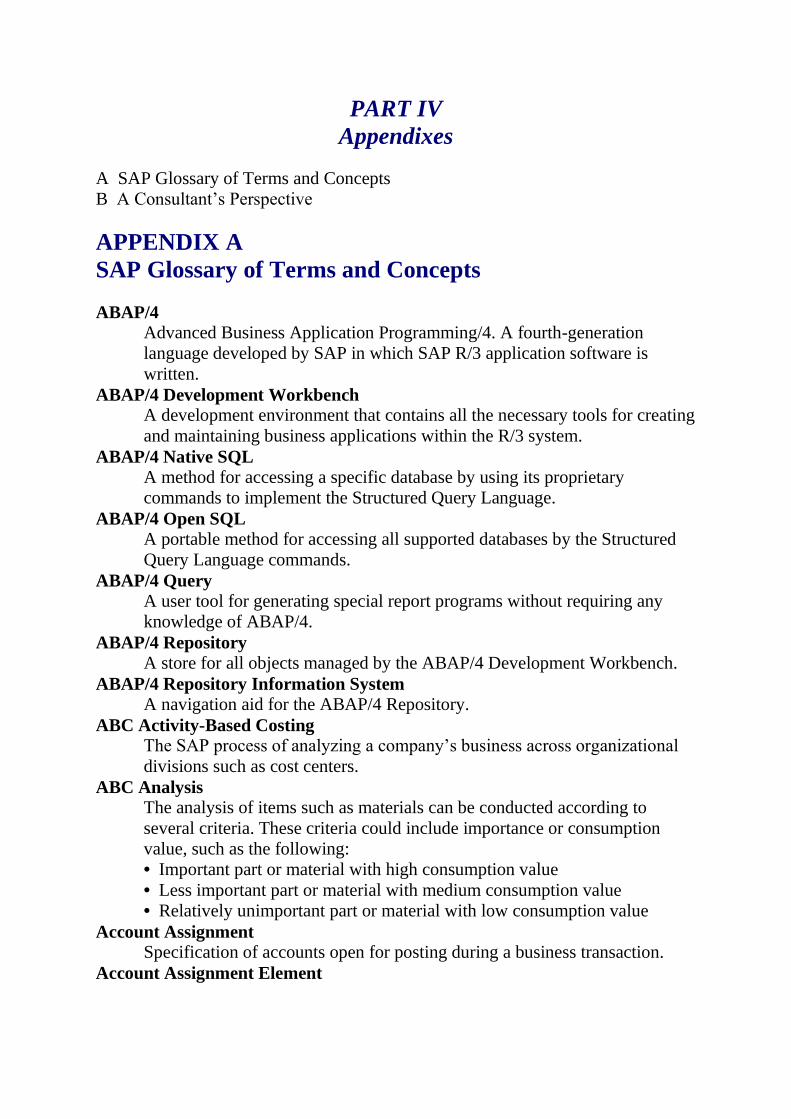
PART IV
Appendixes
A SAP Glossary of Terms and Concepts
B A Consultant’s Perspective
APPENDIX A
SAP Glossary of Terms and Concepts
ABAP/4 Advanced Business Application Programming/4. A fourth-generation
language developed by SAP in which SAP R/3 application software is
written.
ABAP/4 Development Workbench A development environment that contains all the necessary tools for creating
and maintaining business applications within the R/3 system.
ABAP/4 Native SQL A method for accessing a specific database by using its proprietary
commands to implement the Structured Query Language.
ABAP/4 Open SQL A portable method for accessing all supported databases by the Structured
Query Language commands.
ABAP/4 Query A user tool for generating special report programs without requiring any
knowledge of ABAP/4.
ABAP/4 Repository A store for all objects managed by the ABAP/4 Development Workbench.
ABAP/4 Repository Information System A navigation aid for the ABAP/4 Repository.
ABC Activity-Based Costing The SAP process of analyzing a company’s business across organizational
divisions such as cost centers.
ABC Analysis The analysis of items such as materials can be conducted according to
several criteria. These criteria could include importance or consumption
value, such as the following:
• Important part or material with high consumption value
• Less important part or material with medium consumption value
• Relatively unimportant part or material with low consumption value
Account Assignment Specification of accounts open for posting during a business transaction.
Account Assignment Element
A work breakdown structure element to which actual or commitment
postings can be made.
Active SAP R/3 Repository The directory currently in operational use that contains descriptions of all
the application data of an enterprise and their interrelationships, including
how they are used in programs and screen forms. During ABAP/4 program
development, a separate development repository directory is maintained for
versions of the program components undergoing development or
modification.
Activity (Controlling) Internal or external; a physical measure of the activity output of a cost center
according to activity type.
Activity (Project System) An instruction to perform a task within a network in a set period of time.
Work, general costs, or external processing can be associated with an
activity.
Activity Input A transaction to plan the secondary cost quantities of a receiver cost center
that uses activity from a sender cost center.
Activity Logs Records of all activities in the SAP R/3 system for each transaction and for
each user.
Activity Type Classification of an activity and the data structure, for example, as follows:
• Number or quantity of units produced
• Hours
• Machine times
• Production times
Actual Costs All the costs accruing to an object in a period.
ALE Application Link Enabling. SAP method for using documents to carry
messages that control distributed applications while maintaining integration
and consistency of business data and processes across many systems.
Allocation Group Group that defines which orders within one controlling area are to be settled
together, as follows:
• By settlement timing—monthly, weekly, and so on
• By order types—repair, capital spending, and so on
• By settlement receivers—cost center, GL account, and so on
Allocation Receiver Object to which the costs of a cost center or order are allocated.
APC
Acquisition or Production Costs. The value of an asset that is used in some
types of depreciation calculations.
API Application Programming Interface. Interface to support communication
between applications of different systems.
ASCII American Standard Code for Information Interchange.
Assessment (Controlling) A business transaction used to allocate primary or secondary costs. The
original cost elements are not retained by the receiver cost center. Instead, a
secondary cost element is used to show this allocation. Information on the
sender and the receiver is documented in the cost accounting document.
Asset Class A grouping of fixed assets depreciated in a specified manner.
Asset under Construction An asset still being produced when the balance sheet is prepared.
Asynchronous Database Updating A method of updating a database separately from the management of the
dialog part of the transaction.
Background Process Non-interactive execution of programs, sometimes using prepared file data
to replicate the user dialog to utilize the same standard functions.
Backward Scheduling Method for scheduling a network in which the latest start and finish dates
for the activities are calculated backward from the basic finish date.
Billing Element In a work breakdown structure, a data object to which you can post invoices
and revenues.
Budget Prescribed and binding approved version of the cost plan for a project or
other task over a given period.
Business Segment Intersection of criteria to suit the relevant operating concern enabling
analysis of profitability, for example, as follows:
• Country, U.S.
• Industry, farming
• Product range, animal feeds
• Customer group, wholesale
Business Segment Criterion Chosen from SAP proposal list or existing tables, or created manually.
Comprises a field name and a field value.
Business Segment Value Field Holds a number, a code, or a string.
Business Transaction
A recorded data-processing step representing a movement of value in a
business system, such as cost planning, invoice posting, and movement of
goods.
Calculated Costs An order’s progress toward completion represented in value terms. Two
methods exist for determining the calculated costs: calculation on a revenue
base and calculation using quantity produced as a base. If planned revenue is
more than planned costs for an order, there are two corresponding methods
for calculating the (interim) profit realization.
Calculated Revenue The revenue that corresponds to the actual costs incurred for an order,
determined from results analysis as follows:
Actual costs * planned revenue / planned costs
Capacity (Cost Accounting) The output of a cost center and activity that is technically possible during a
specific period. Differentiated by category and arranged hierarchically.
Capacity (Production Planning) Capability of a work center to perform a specific task. Capacities are
differentiated according to capacity category and are arranged hierarchically
under a work center.
Capacity Planning Includes the following:
• Long-term rough-cut capacity planning (RCCP)
• Medium-term planning
• Short-term detailed planning (CRP)
Capital Investment Measure A project or order that is too large or that contains too much internal activity
to be posted to fixed assets as direct capitalization. The master record of a
capital investment measure stores both the actual cost data and the planned
values.
Capitalized Costs The difference between the actual costs and the calculated costs of an order,
calculated by results analysis. With deficit orders, this figure is reduced to
allow for the loss realized.
Capitalized Profit Calculated in results analysis by subtracting the capitalized costs from the
value of the inventory from which revenue can be generated.
Cardinality The number of lines in a dependent table to which the table under
consideration, in principle, can or must relate. A line in a table may be
related to another dependent line in a cardinality of one-to-one
correspondence. The relationship may be one-to-many if there can be
several dependent lines for any referenced line.
CCMS
Computing Center Management System.
CIM Computer Integrated Manufacturing.
Classification When an object is assigned to a class, values for the object are assigned to
characteristics belonging to the class.
Client The highest level in SAP R/3. Client is a self-contained unit in an R/3
system with its own master data and configuration tables, so the data of one
client may not be accessed by another client. Often a training client and a
testing client are present, in addition to the client code that represents your
group or corporate identity and under which the SAP system runs normal
business. Some data is managed at the client level because everyone in the
corporate group of companies wants to refer to exactly the same information
and ascertain that it has been maintained as up-to-date and correct. Vendor
addresses are an example of data managed at the client level.
Client Caches Work areas set up in the database application servers for data frequently
accessed by the client’s applications.
Co-Products Products made in the same manufacturing process.
Commitment Item A contractual or scheduled commitment that is not yet reflected in financial
accounting but will lead to actual expenditures in the future. Commitment
item management provides for early records and analysis for cost and
financial effects. Commitment items are also referred to in SAP as open
items.
Company Code A unit within a client that maintains accounting balances independently and
creates the legally required balance sheet and the profit and loss statement.
Compiler A tool that translates source code statements written in a general
programming language into statements written in a machine-oriented
programming language.
Contingency Order A results-analysis object in which the costs of complaints are collected.
Reserves are created by results analysis for the expected cost of complaints
and are drawn from as costs are incurred.
Control Indicator Determines, in cost accounting, which application components are active,
how certain data are stored, and what types of validation are to take place.
Control Key Determines how an activity or activity element is to be processed in such
operations as orders, costings, and capacity planning.
Controlling Area An area within an organization that shares a cost accounting configuration;
normally the same as company code. For cross-company cost accounting,
one controlling area may be assigned to multiple company codes of one
organization.
Controlling Area Currency The default currency in cost accounting objects, cost centers, orders, and so
on.
Conversion Translation from one data format to another; for example, from decimal to
binary code.
Cost Center Place in which costs are incurred; a unit within a company distinguished by
area of responsibility, location, or accounting method.
Cost Component A group of cost origins.
Cost Component Layout (Product Cost Accounting and Cost Center
Accounting) A technical term. Controls how results of a product cost estimate are saved.
Assigns cost elements to cost components and determines the following:
• How the costs for raw materials and finished and semi-finished products
are rolled up in a multilevel assembly structure
• Which portion of the costs are treated as fixed costs
• Which costs are treated as the cost of goods manufactured
• Which are sales and administration costs
• Which are the cost of goods sold
Cost Element Mandatory criteria for classifying costs arising in a company code to the
following areas:
• Primary cost elements for goods and services procured externally
• Secondary (internal activity) cost elements
Primary cost elements are maintained in the General Ledger master records.
Secondary cost elements have no counterpart in the financial accounts and
are maintained exclusively in cost accounting.
NOTE: Primary costs are not necessarily always those procured externally. Similarly, secondary costs
are not always those that are maintained in cost accounting. It is possible to have secondary costs, such
as salaries, shown in the General Ledger.
Cost Element Group A technical term for a conjunction of cost elements used to select records for
reporting and to define lines and columns in reports. These can be used for
planning purposes and also in periodic allocations.
Cost Element Planning Planning primary and secondary costs on a cost center, order, or project.
Cost Element Type Classification of cost elements by uses or origin; for example, material cost
elements, settlement cost elements for orders, and cost elements for internal
cost allocations.
Cost Object An account assignment term for individual cost objects to which actual data
such as costs, budgets, and sales revenues can be assigned. For example,
costs may be assigned to products, product groups, cost centers, orders, and
so on.
Cost Object Hierarchy The structure of cost objects as nodes to which actual data can be assigned.
Cost Origin The logical category to which costs may be assigned.
NOTE: Activity types and cost elements can be thought of as cost origins.
Cost Planning Planning the costs to be incurred during a transaction.
Cost Planning Type A technical term that indicates the purpose of a cost planning method, such
as those that follow:
• Rough planning estimates of costs to be incurred for an order or for an
element in a work breakdown structure
• Cost element planning
• Unit costing
Cost-Of-Sales Accounting A form of results analysis. Sales deductions and unit costs are assigned to
the sales transaction.
Costing Calculating total production costs of individual product units, which may be
a piece, a batch, a lot, or an order, for example. Costing may also take place
on the provision of services.
Costing Type A technical term used to control unit costing and product costing. The
costing type determines the following:
• For which reference object a costing may be used
• Which costing object will be updated (for example, material master
standard price)
• How the key of the costing file is made up
• Which costing application can use this costing type
Costing Variant Technical term to determine criteria for a cost estimate. Comprises mainly
the following:
• Costing type
• Valuation variant
• Organizational level
• Quantity structure determination, which includes the date control
parameter
Costing Version A number that differentiates between cost estimates for the same material
but is calculated using different quantity structures. When production
alternatives exist, more than one product cost estimate can be made for a
material. Cost estimates with different production alternatives are given
different version numbers.
CPI-C Common Programming Interface-Communications. A set of standardized
definitions for communications between programs.
Current Cost Estimate A costing type that uses the value structure (prices) that has changed during
the planning period to recalculate the cost of goods manufactured for a
product.
Customizing An SAP tool, provided as part of the SAP R/3 system, comprising two
components: implementation guides and customizing menus with the
associated functions. It does not change the program coding. This tool
provides support for all the activities necessary for the following:
• Initial configuration of the SAP system before going into production
• Adjustment of the system during production
• Implementation of additional SAP applications
Data Element of a Field A description of the contents of a record or field in terms of their business
significance.
Database Interface A work area to receive data from ABAP/4 Data Dictionary tables, and from
which any data that is changed may be passed to the database.
DBMS Database Management System. A software system used to set up and
maintain a database. It includes SQL facilities.
DDL Data Definition Language, used to define database objects under the DBMS.
Delta Management System of transferring only data that has changed when using Remote
Function Call (RFC).
Dialog Module A group of dialog steps in a program.
Direct Cost Costs that are directly and fully identifiable with a reference object
according to the costs-by-cause principle.
Distribution (Controlling)
A business transaction used to allocate primary costs. The original primary
cost elements are retained on the receiver cost center. Information on the
sender and the receiver is documented in the cost accounting document.
Distribution Key Contains rules on how the costs are to be distributed. It is used in planning
to spread costs over the planning period.
DLL Dynamic Link Library, which is integral to the functioning of the Windows
architecture at runtime.
DMS Document Management System.
Domain A description of the technical attributes of a table field, such as the type,
format, length, and value range. Several fields with the same technical
attributes can refer to the same domain.
Dynpro A dynamic program that controls the screen and its associated validation and
processing logic to control exactly one dialog step.
EBCDIC Extended Binary-Coded Decimal Interchange Code.
EDI Electronic data interchange. A standardized scheme for exchanging business
data between different systems via defined business documents such as
invoices and orders.
Enqueue Service An SAP R/3 system mechanism for the management of locks on business
objects throughout client/server environments.
Entity The smallest possible collection of data that makes sense from a business
point of view and that is represented in the SAP R/3 system.
Entity Relationship Model Entities may be linked by logical relationships that have business
significance. Entities and their interrelations can be used to build static
models of the enterprise, which are portrayed in the respective computer
application with its tables.
Environment Analyzer A help program that generates a list of both the development objects that
belong together and the boundaries between development classes.
EPC Event Driven Process Chain. A process chain describes the chronological
and logical relationship of functions of the R/3 system and business system
statuses, which initialize the functions or are generated as a result of
function execution.
Equivalence Number
A specification of how any given value is to be distributed to the different
receiving objects.
Event (Reference Model) A status that has business relevance. It can trigger an SAP system function,
or it can be the result of such a function.
Event (Workflow Management) A collection of attributes of objects that describes the change in the state of
an object.
External Activities Non-stock components and/or activities in a production order that are
produced or performed outside the company.
Float A period of time that permits you to start a network or activity at a later date
without incurring a delay in scheduling.
Follow-up Costs Incurred after the actual manufacturing process has been completed; for
example, costs of rework and warranties.
Foreign Key Defines a relationship between two tables by assigning fields of one table
(the foreign key table) to the primary key fields of another table (the check
table).
Forward Scheduling A way of scheduling a network, starting from the basic start date and adding
durations to determine the earliest start and finish dates for successive
activities.
Free Float The time that an activity can be shifted into the future without affecting the
earliest start date of the following activity or the end date of the project.
Must not be less than zero or greater than the total float.
Function Module A program module that has a clearly defined interface and can be used in
several programs. The function module library manages all function
modules and provides search facilities in the development environment.
Function-Oriented Cost Accounting Assigning costs to a business function for the purpose of analysis.
General Costs Activity A type of activity in a network that plans general costs incurred during the
lifetime of a project. Examples of such planned costs are insurance, travel,
consulting fees, and royalties.
GUI Graphical User Interface. The SAPGUI is designed to give the user an
ergonomic and attractive means of controlling and using business software.
Hypertext
Online documentation that is set up like a network, with active references
pointing to additional text and graphics.
IDOC Intermediate document. The SAP R/3 system EDI interface and the ALE
program link enabling standardized intermediate documents to
communicate.
IMG Implementation Guide. A component of the SAP R/3 system that provides
detailed steps for configuring and setting the applications.
Imputed Costs The value changes that do not represent operational expenditure or
correspond to external expenditures in either content or timing (for example,
depreciation and interest).
Indirect Costs Costs for which one single receiving object cannot be directly and fully
identified according to the cost-by-cause-principle. The following are
examples:
• Indirect expenses, such as building insurance
• Indirect labor cost, such as supervisor wages
• Indirect materials cost, such as coolant cleaning materials
Initial Cost Split Cost component split for raw materials procurement, showing such details
as the following:
• Purchase price
• Freight charges
• Insurance contributions
• Administration costs
Inventory from Which Revenue Can Be Generated The revenue expected in view of the costs already incurred can be divided
into capitalized costs and capitalized profits. This is calculated as Calculated
Revenue minus Actual Revenue. Results analysis calculates the inventory
for sales orders.
Job Order Cost Accounting An instrument for the detailed planning and controlling of costs. Serves for
the following:
• Collecting
• Analyzing
• Allocating the costs incurred for the internal production of non-capitalized
goods
Kerberos A technique for checking user authorizations across open distributed
systems.
Library Network
A generic network structure that can be used by many projects. Used in a
project system for repetitive processes or for process planning.
Line Item A display of posting according to activity and document number.
Logical Database A set of predefined paths for accessing the tables in a specific database
system. Once defined and coded, they can be used by any report program.
Logical System A system on which applications integrated on a common data basis run. In
SAP terms, this is a client in a database.
Loop A circular path through activities and their relationships.
Lot-Size Variance Variances between the fixed planned costs and the fixed allocated actual
costs that occur because part of the total cost for an order or a cost object
does not change with output quantity changes; for example, setup costs that
do not change no matter how long the operation takes.
LU6.2 The IBM networking protocol used by the SAP R/3 system to communicate
with mainframe computers.
LUW Logical Unit of Work. An elementary processing step that is part of an SAP
transaction. A logical unit of work is either executed entirely or not at all. In
particular, database access is always accomplished by separate LUWs, each
of which is terminated when the database is updated or when the COMMIT
WORK command is entered.
Make-to-Order Production Type of production in which a product is generally manufactured only once
and to a specific customer order.
MAPI Messaging Application Programming Interface. Part of the Microsoft
Windows Open Service Architecture (WOSA).
Master Data Data relating to individual objects; remains unchanged for a long time.
Matchcode An index key code attached to the original data that can be used to perform
quick interactive searches for this data.
Material Requirements Planning Generic term for activities involved in creating a production schedule or a
procurement plan for the materials in a plant, company, or company group.
Material Type An indicator that subdivides materials into groups (such as raw materials,
semi-finished materials, and operating supplies) and that also determines the
user screen sequence, the numbering in the material master records, the type
of inventory management, and the account determination.
Measuring Point The physical and/or logical place at which a status is described. Examples
follow:
• Temperature inside a reactor
• Speed of revolution of a wind wheel
Menu Painter An SAP R/3 system tool for developing standardized menus, function keys,
and pushbuttons in accord with the SAP Style Guide.
Metadata Information about data structures used in a program. Examples of metadata
are table and field definitions, domains, and descriptions of relationships
between tables.
Mode A user interface window in which an activity can be conducted in parallel
with other open modes.
Modified Standard Cost Estimate A costing type that uses the quantity structure that has changed during the
planning period to recalculate the cost of goods manufactured for a product.
Moving Average Price Value of the material divided by the quantity in stock. Changes
automatically after each goods movement or invoice entry.
Network In SAP R/3, a structure containing instructions on how to carry out activities
in a specific way, in a specific order, and in a specific time period. Made
from activities and relationships.
Network Type Distinguishes networks by their usage. The network type controls the
following:
• Costing variants for plan, target, and actual costs
• Order type
• Number ranges
• Open items
• Status profile
• Authorizations
Object Currency The currency of cost accounting objects. The currency of the controlling
area is the default currency of a cost accounting object, such as a cost center,
an order, and so on.
Object Overview Customized list of data and line-display layout (for example, routings,
inspection plans, maintenance tasks, and networks).
ODBC
Open Data Base Connectivity. A Microsoft standard based on SQL Access
Group definitions for table-oriented data access.
OLE Object Linking and Embedding. A Microsoft technology to enable the
connection and incorporation of objects across many programs or files.
Open Item Contractual or scheduled commitment that is not yet reflected in financial
accounting but will lead to actual expenditures in the future. Open-item
management provides for early records and analysis for cost and financial
effects. Also referred to in SAP as a commitment item.
Operating Concern An organizational unit to which one or more controlling areas and company
codes can be assigned. Certain criteria and value fields are valid for a
specific operating concern. The criteria define business segments, and the
value fields are then updated for these objects.
Operating Level The planned and/or actual performance of a cost center for a period; for
example, output quantity, production time, and machine hours.
Operating Rate The ratio of actual operating level to planned operating level. Measures the
effective utilization of a cost center or activity.
Operating Resources The personnel and material necessary to carry out a project. Can be used
once or many times. Defined in value or quantity units. Planned for a period
or a point in time. Includes, for example, materials, machines, labor, tools,
jigs, fixtures, external services, and work centers.
Operational Area A technical term used to signify a logical subdivision of a company for
accounting or operational reasons and therefore indicated in the EDM-
Enterprise Data Model. An operation area is an organizational unit within
logistics that subdivides a maintenance site plant according to the
responsibility for maintenance.
Operations Layout List, sorted by operations, of costing results from product costing and final
costing.
Order An instrument for planning and controlling costs. Describes the work to be
done in a company in terms of which task is to be carried out and when,
what is needed to carry out this task, and how the costs are to be settled.
Order Category The SAP application to which the order belongs; for example, SD.
Order Group A technical term for grouping orders into hierarchies. Used to create reports
on several orders, to combine orders, and to create the order hierarchy.
Order Hierarchy Hierarchical grouping of orders for processing at the same time as in order
planning and order reporting.
Order Phase A system control instrument for the order master data. Allows and prohibits
operations on orders, depending on the following phase or stage: opened,
released, completed, or closed.
Order/Project Results Analysis A periodic evaluation of long-term orders and projects. The o/p results
analysis evaluates the ratio between costs and a measure of an order’s
progress toward completion, such as revenue or the quantity produced. The
results analysis data includes the following:
• Cost of sales
• Capitalized costs or works in progress
• Capitalized profits
• Reserves for unrealized costs
• Reserves for the cost of complaints and commissions
• Reserves for imminent loss
Order Settlement The complete or partial crediting of an order. The costs that have accrued to
an order are debited to one or more receivers belonging to financial or cost
accounting.
Order Status The instrument to control whether an order may be planned or posted to.
Reflects the operational progress of an order along the sequence of
Released, Revenue Posted, Fully Invoiced, and Completed. Determines the
following:
• Whether planning documents are created during cost element planning
• The transactions allowed at the moment (phase), such as planning, posting
actual costs, and so on
• When an order may be flagged for deletion
Order Summarization Allows you to summarize data by putting orders into hierarchies. Also
allows you to analyze the order costs at a higher level, such as by product or
plant.
Order Type Differentiates orders according to their purpose; for example, repair,
maintenance, marketing, or capital expenditure.
Overall Network Network resulting from the relationships between all the existing networks.
Overhead The total cost of indirect expenses, indirect labor, and indirect materials
(indirect costs). Allocated to cost objects by means of overhead rates.
Overhead Cost Management
The entirety of cost accounting activities for planning and controlling the
indirect costs, as follows:
• Responsibility-oriented overhead cost management by cost centers
• Decision-oriented overhead cost management by action-oriented objects,
which are orders and projects
Overhead Costing Most common method in product cost accounting. Method as follows:
• Assign the direct costs to the cost object.
• Apply the indirect (overhead) costs to the cost object in proportion to the
direct costs, expressed as a percentage rate.
Overhead Group Key that groups materials to which the same overheads are applied.
PA Settlement Structure To settle costs incurred on a sender to various business segments, depending
on the cost element. The Profitability Analysis settlement structure is a
combination of assignments of cost element groups to business segments.
Period Accounting One basis for Profitability Analysis. Costs are identified in the period in
which they occur, irrespective of the period in which the corresponding
revenue occurs.
Plan Version Control parameters for comparative analyses in planning in cost accounting.
The plan version determines whether the following actions occur:
• Planning changes are documented.
• A beginning balance is to be generated.
• The planning data of another version can be copied or referenced.
Planned Activity The planned cost center activity required to meet the demand, measured in
the corresponding physical or technical units.
Planned Delivery Time The number of days required to procure the material via external
procurement.
Planning Assigning estimates of the costs of all activities required to carry out the
business of an organizational unit over the planning period.
Planning Document The line item for documenting planning changes.
Planning Element The work breakdown structure (WBS) element in which cost planning can
be carried out.
Pooled Table A database table used to store control data, such as program parameters, or
temporary data. Several pooled tables can be combined to form a table pool,
which corresponds to a physical table on the database.
Price Difference Account Records price differences for materials managed under standard prices, or
differences between purchase order and billing prices.
Price Variance Occurs if planned costs are evaluated in one way and the actual costs in
another. The planned standard rates for activities might change in the
meantime, for example. Can also be the result of exchange-rate fluctuations.
Primary Cost Planning Planning of primary costs by values and quantities of activities.
Primary Costs Incurred due to the consumption of goods and services supplied to the
company from outside. Costs for input factors and resources procured
externally; for example, as follows:
• Brought-in parts
• Raw materials
• Supplies
• Services
Process Manufacturing A production type; continuous manufacturing process from raw materials to
finished product.
Product Costing Tool for planning costs and setting prices. Calculates the cost of goods
manufactured and the cost of goods sold for each product unit using the data
in the PP-Production Planning module.
Product costing based on bills of material and routings is used for
calculating production costs of an assembly with alternatives for the
following:
• Showing the costs of semi-finished products
• Detailed estimate of the cost components, down to their lowest production
level
Production Costs, Total The costs of finished products bought for resale, or the costs of goods
manufactured plus sales overhead, special direct costs of sales, and
administration overhead.
Production Cycle A manufacturing process in which the output of the final manufacturing
level (or part of it) becomes input for lower manufacturing levels of the
same process (recycle).
Production Order Instruction for the Production department to produce a material. It contains
operations, material components, production resources and tools, and
costing data.
Production Resources and Tools (PRT)
Needed for carrying out operations at work centers. Assigned to activities
for whose execution they are necessary. Stored as various master data in the
form of material master, equipment master, or document master.
Includes the following:
• Job instructions
• Tools
• Test equipment
• Numerically controlled programs
• Drawings
• Machinery
Profit Center An area of responsibility for which an independent operating profit is
calculated. Responsible for its own profitability. Separate divisional result is
calculated.
Profit Order An order whose planned revenue is greater than the planned costs. Results
analysis uses the profit percentage rate of a profit order to calculate the
inventory from which revenue can be generated, and to calculate the cost of
sales.
Profit Percentage Rate Planned revenue divided by planned costs of an order.
Profitability Analysis In SAP R/3, accomplished by cost-of-sales approach or period accounting.
Project Definition Framework laid down for all the objects created within a project. The data,
such as dates and organizational data, is binding for the entire project.
Project Management An organizational structure created just for the life of the project, to be
responsible for planning, controlling, and monitoring of the project.
Project Structure All significant relationships between the elements in a project.
Project Type Capital spending or customer project, for example.
Q-API Queue Application Program Interface, which supports asynchronous
communication between applications of different systems by using managed
queues or waiting lines.
Quantity Structure The quantity-related basis for calculating costs. The bill of material and the
routing form the quantity structure for product costing and the preliminary
costing of a production order.
Quantity Variance
Difference between the target costs and the actual costs, which results from
the difference between the planned and actual quantities of goods or activity
used; for example:
• More raw materials from stock for a production order
• Fewer activities from a cost center than were planned
Rate of Capacity Utilization Ratio of output to capacity. Fixed costs can be divided into used capacity
costs and idle time costs.
Realized Loss Usage of reserves for imminent loss by results analysis. Loss can be realized
when actual costs are incurred and/or when revenue is received. Results
analysis realizes loss as the difference either between the actual costs and
the calculated revenue, or between the calculated costs and the actual
revenue, as follows:
• Actual costs minus calculated revenue
• Calculated costs minus actual revenue
Reference Date Using the reference dates and the offsets, the start and finish dates of the
sub-operation or the production resource/tool usage are determined.
This is a time within an activity (for example, the start date). Reference
dates also are used to determine usage dates for production resources/tools.
NOTE: You can enter time intervals for reference dates.
Relationship (Project System) Link between start and finish points of two activities in a network or library
network. In SAP R/3, the relationship types are the following:
• SS—start-start
• FF—finish-finish
• SF—start-finish
• FS—finish-start
Repetitive Manufacturing A production type. Many similar products are manufactured together on the
same production line, using more simplified functionality than that for
production orders. In SAP R/3, bills of materials and routings are created for
each product.
Reserves for Costs of Complaints and Sales Deductions Inventory cannot be created for certain costs, such as costs arising under
warranties or because of sales deductions. For such costs, results analysis
creates reserves equal to the planned costs. These reserves are then used
when (and if) actual costs are incurred.
Reserves for Imminent Loss Results analysis creates reserves equal to the planned loss. These reserves
are reduced as (and if) this loss is realized.
Reserves for Unrealized Costs
Calculated in results analysis by subtracting the actual costs from the cost of
sales.
Resource-Usage Variance Occurs if the used resource is different from the planned one; for example,
the actual raw material used is different from the planned raw material.
Results Analysis Periodic evaluation of long-term orders. Results analysis compares the
calculated costs and the actual cost of an order as it progresses toward
completion. It calculates either inventory (if actual costs are greater than
calculated costs) or reserves (if actual costs are less than calculated costs).
The data calculated during results analysis is stored in the form of the
following:
• Cost of sales
• Capitalized costs
• Capitalized profit
• Reserves for unrealized costs
• Reserves for costs of complaints and commissions
• Reserves for imminent loss
Results Analysis Account A General Ledger account that records the figures calculated during results
analysis.
Results Analysis Data The outcome of an evaluation of the costs and revenue in relation to the
quantity of goods or services in an order. The results are reported in the
following format:
• Work in progress and capitalized costs
• Reserves
• Cost of sales
Results Analysis Key Determines the following for results analysis:
• Whether revenue-based, quantity-based, or manual
• Basis on which it is carried out (planned or actual results)
• How profits are to be realized
• Whether to split inventory, reserves, and cost of sales
Results Analysis Version Describes the business purpose for which results analysis was carried out.
Determines the following, for example:
• Whether the business is in accordance with German and American law
• Financial accounting purposes
• Profitability analysis
• Results analysis accounts to be posted
• How the life cycle of an object is to be broken down into open and closed
periods
Revenue
The operational output valued at market price in the corresponding currency
and sales quantity unit.
Quantity * Revenue–Sales
RFC Remote Function Call. A protocol written in ABAP/4 for accessing function
modules in other computers. RFC-SDK is a kit for integrating PC
applications so that they can access SAP R/3 functions.
RPC Remote Procedure Call. A protocol for accessing procedures residing in
other computers from C programming environments. Corresponds to RFC.
Scheduling, Network Determines earliest and latest start dates for activities and calculates the
required capacity, as well as floats.
Screen Painter An ABAP/4 Development Workbench tool that can be used to create,
modify, display, and delete dynpros.
Secondary Cost Element Cost centers require services from other cost centers to produce activity of
their own. These are secondary costs. Planned assessment is used to plan the
secondary costs. Activity input is used to plan the secondary cost quantities.
Settlement Parameters The control data required for order settlement, as follows:
• Allocation group
• Settlement cost element
• Settlement receiver
Simultaneous Costing Process Displays the actual costs incurred to date for such things as an order. The
process describes all costings of an order in the SAP system, including order
settlement. These costings come in the form of preliminary costings and
actual costings. The values can then be analyzed in final analysis.
Spooling Buffered relaying of information to output media, across multiple computers
if necessary.
SQL Structured Query Language. Defined by American National Standards
Institute (ANSI) as a fourth-generation language for defining and
manipulating data.
Standard Cost Estimate Calculates the standard price for semi-finished and finished products.
Relevant to the evaluation of materials with standard price control. Usually
created once for all products at the beginning of the fiscal year or a new
season. The most important type of costing in product costing. The basis for
profit planning or variance-oriented product cost controlling.
Standard Hierarchy
The tree structure for classifying all data objects of one type. For example,
the cost centers belonging to a company from a cost accounting point of
view are represented by a standard hierarchy copied from the R/3 Reference
Model and then customized.
Standard Price The constant price with which a material is evaluated, without taking into
account goods movements and invoices. For semi-finished and finished
products calculated in product costing.
Style Guide A collection of the SAP design standards for uniform design and consistent
operation routines for SAP applications.
Summarization Object An object containing data calculated during order summarization, project
summarization, or the summarization of a cost object hierarchy. A
summarization object, for example, can contain the costs incurred for all the
orders of a specific order type and a specific responsible cost center.
Surcharge A supplement, usually as percentage, used to apply overhead in absorption
costing.
Target Costs Calculated using the planned costs, along with the following:
• The actual activities divided by the planned activities (for cost centers)
• The actual quantities divided by the planned quantities of goods
manufactured (for orders)
Task List Type Distinguishes task lists according to their functionality. In production
planning task lists, for example, a distinction is drawn between routings and
master recipes.
TCP/IP Transmission Control Protocol/Internet Protocol. The standard network
protocol for open systems.
Time Interval A period of time between at least two activities linked in a relationship. The
relationship type determines how start and finish times are used in the
calculation.
Total Float Time that an activity can be shifted out into the future, starting from its
earliest dates without affecting the latest dates of its successors or the latest
finish date of the network.
Transaction The series of related work steps required to perform a specific task on a
business data-processing system. One or more screens may be required.
From the user’s point of view, it represents a self-contained unit. In terms of
dialog programming, it is a complex object that consists of a module pool,
screens, and so on, and is called with a transaction code.
Transaction Currency Currency in which the actual business transaction was carried out.
Unit Costing A method of costing in which bills of material and routings are not used.
Used to determine planned costs for assemblies or to support detailed
planning of cost accounting objects such as cost centers or orders.
Usage Variance Difference between planned and actual costs caused by higher usage of
material, time, and so on.
User-Defined Field Types A classification code used to interpret the meaning of a user-defined field.
For example, a user may designate a specific field as one of the following
types:
• General field of 20 characters to be used for codes or text
• Quantity fields with a unit
• Value fields with a unit
• Date fields
• Check boxes
User-Defined Fields Entry fields that can be freely defined for an activity or a work breakdown
structure element (Project System) or an operation (Production Planning).
User Exit An interface provided by an SAP R/3 application that enables the user
company to insert into a standard R/3 component a call to an additional
ABAP/4 program that will be integrated with the rest of the application.
Valuation Date The date on which materials and internal and external activities are
evaluated in a costing.
Valuation Variant Determines how the resources used, the external activities, and the
overheads are to be valued in a costing (in other words, at what prices).
Variance Category Distinguishes variances according to their causes, such as the following:
• Input: price and usage variances
• Yield: scrap, mix variances, labor efficiency variances, schedule variances
• Output or allocation: fixed-cost variances, over-absorption variances,
under-absorption variances
Variance Key Technical term. Controls how variances are calculated. Assigning a variance
key to an object determines, for example, whether variances are calculated
for the object by period or for the life of the object. The object may be a cost
center, an order, or a cost object identifier (ID).
Variance Version Technical term. Specifies the basis for the calculation of variances, as
follows:
• How the target costs are calculated
• Which actual data is compared with the target costs
• Which variance categories are calculated
View A relational method used to generate a cross-section of data stored in a
database. A virtual table defined in the ABAP/4 Dictionary can define a
view by specifying how information is selected from whichever tables are
targeted.
Volume Variance Cost difference between the fixed costs estimated for the products (based on
standard capacity) and the allocated fixed costs that are either too low or too
high due to operating either below or above capacity.
WBS Work Breakdown Structure. A model of a project. Represents in a hierarchy
the actions and activities to be carried out on a project. Can be displayed
according to phase, function, and object.
WBS Element A concrete task or a partial task that can be subdivided.
Work in Progress Unfinished products, the costs of which are calculated by subtracting the
costs of the order that have already been settled from the actual costs
incurred for the order or by evaluating the yield confirmed to date.
Work Order Generic term for the following order types:
• Production order
• Process order
• Maintenance order
• Inspection order
• Network
Work Process An SAP R/3 system task that can be assigned independently to, for instance,
a dedicated application server; for example, dialog processing, updating a
database from change documents, background processing, spooling, and
lock management.
Workflow Management Tool for automatic transaction processing used in a specific business
environment.

APPENDIX B
A Consultant’s Perspective
In this chapter
Analyzing SAP from Consultant One’s Perspective 430
Analyzing SAP from Consultant Two’s Perspective 436
This book has tried to offer a comprehensive and accurate guide to the FICO
modules. For the experienced consultant, this book should be a good reference
manual; for the new consultant, this book should be more of a companion, referred
to on a regular basis. For many readers going through their first implementation, or
working with FICO modules for the first time, you don’t have the benefit of
experience. This appendix contains the experience of skilled and seasoned
consultants.
The views expressed in the following sections are entirely individual and are not
necessarily those of the other contributors to this book. Consultants with very
different backgrounds have anonymously donated them. They are meant to be
honest opinions, perhaps more subjective than objective. In the space given, there
isn’t room to cover all aspects of FICO, but it is generally believed that one’s first
comments are useful indicators. By making the contributions anonymous, it is
hoped that the consultants were able to say what they really think, and not
necessarily what they think people want to hear.
Analyzing SAP from Consultant One’s Perspective
His SAP experience spans over 7 years. Initially coming into contact with SAP
with the R/2 mainframe product, he was a user as an accounting supervisor in the
general ledger and inter-company accounting areas. He then moved on to a
business support group role for SAP R/2, acting as a trainer and help desk support
for R/2 users, and helped develop and extend the functionality in the Accounts
Receivable area. After that, he became a consultant. The rest of this section is his
view of SAP.
The Finance function in SAP is delivered within four main modules. These are:
• Financial Accounting (FI) dealing with external (statutory or legal)
accounting
• Controlling (CO) dealing with internal (management) accounting
• Enterprise Controlling (EC) with enterprise-wide accounting
• Treasury (TR) dealing with cash management and cash budgeting
It is unlikely, therefore, to find a single consultant who is versed in the
implementation of the entire financial application in SAP. The core of the system,
however, is FI and CO. It is common for financial implementations to include FI
and CO at the same time, providing the entire scope of financial controls and
reporting.
Let us consider, then, each of these modules in turn, and then discuss the points
and issues of integration between the two. We will then conclude with some
observations on the remaining financial modules.
Using FI
Financial Accounting is broken down into the following components:
• General Ledger
• Accounts Payable
• Accounts Receivable
• Fixed Assets
• Consolidation
• Special Purpose Ledger
Using Organizational Structures within FI
In the implementation of FI, the organizational structures are the Company Code
and the Business Area. The Company Code presents little configuration difficulty,
being readily identified by the legal reporting entities. The use of the Business
Area is somewhat more complex. Where there is a requirement to report internal
balance sheets and profit and loss accounts within a Company Code or across
Company Codes, the Business Area is the correct organizational tool.
Consideration of the strategic product lines within an organization can usually
identify Business Areas. It is essential that the number of separate Business Areas
remains limited due to the volume of automatic adjustments needed to prepare true
Business Area balance sheets. The allocation of cash items between the relevant
Business Areas remains a thorny issue in this regard. For most organizations
though, this is normally accepted as an organizational issue rather than a system
one.
Using the General Ledger
In the implementation of the General Ledger, the vital component is the definition
of the Chart of Accounts which identifies all the account numbers that are to be
used to record financial transactions. Indeed, the importance of this stage extends
to every single SAP module because all other modules rely on account assignment
to reflect the value flows in accounting, based on the quantity flows of logistics.
This of course presents problems in an implementation, because often agreement
of the definitive Chart of Accounts, especially in international implementations, is
not necessarily straightforward. Complications also exist where there is a
requirement to consider the provisions for local statutory accounting and
consolidated accounting. Completion of the Chart of Accounts also includes
configuration of all the numerous automatic account assignments.
Once this step is completed, the remaining implementation stages are relatively
easier. Adapting standard SAP-delivered document types and posting keys
provides you with all the necessary steps to record financial transactions in the
General Ledger.
Using Subledgers (Accounts Payable and Accounts Receivable)
The treatment of the subledger applications of Accounts Payable and Accounts
Receivable are almost identical. This is not surprising as they represent two sides
of the same coin—trading. For this reason, SAP also refers to customer and vendor
master records collectively as Business Partners.
In Accounts Payable and Accounts Receivable, the important stages are the
definition of the master records and the financial programs for payment and
dunning (receivables payment reminders).
The master records present design considerations because they are integrated
master records that are used by logistics. A Phase 1 FI/CO implementation may
give rise to a Phase 2 logistics implementation. Therefore, consultants need to
consider the possible requirements for sales and purchases in the future when
configuring customer and vendor master records.
Of all the FI configuration steps, the payment program is probably the most
complex. There are many stages to complete, and in certain countries there is no
definitive standard recognized for the format of the electronic bank transfer.
An effective FI implementation also relies on configuration of the display formats
for accounts analysis of General Ledger, Accounts Payable, and Accounts
Receivable balances to meet the informational needs of the organization.
Outside of the main components of an FI implementation, there may also be
requirements for Fixed Assets and Cash Management functions.
Using Fixed Assets
Fixed Assets requires the correct definition of General Ledger accounts to record
the Acquisition and Production Cost (APC) and cumulative depreciation accounts
on the Balance Sheet, the depreciation charge, and gain or loss on disposal
accounts in the profit and loss.
A further organizational structure must be defined, the Chart of Depreciation,
which identifies the depreciation values to be calculated. This is linked to the
Company Code. Care must be exercised if parallel currencies are being
implemented in Financial Accounting to ensure the Chart of Depreciation is
compatible with these currencies.
The requirement to identify asset types, together with the depreciation methods and
the automatic account assignments, completes the scope of Assets Accounting.
Normally it is the data transfer side and reporting side, which can cause the main
implementation headaches for this area of FI.
Cash Management and Cash Budgeting
Cash management and cash budgeting is often a Phase 2 or even Phase 3 part of an
SAP implementation. It is relatively easy to configure on top of the standard at a
later date. It is also necessary to have the SD and MM modules already
implemented to use the full functionality of cash management.
Cash management draws in information from Accounts Payable and Accounts
Receivable for short term forecasting, but can also access, in an integrated SAP
system, sales and purchase orders for medium-term forecasting. Implementation of
cash management requires establishing the correct settings on the relevant General
Ledger and customer and vendor master records.
Cash budget management provides the ability to analyze the cash flow statement
and requires the definition of commitment items, which must be assigned to the
relevant General Ledger accounts. A further organization structure, the Funds
Management Area, must also be created and assigned to each relevant company
code in turn.
Using CO
The previous management areas considered the use of FI Financial Accounting
which provides the required functions for External Reporting which, due to
statutory regulation, is reasonably uniform for most organizations. In contrast, the
functions of Internal Reporting and control need a more flexible approach. This is
ably provided by the CO module.
If we now consider the CO module, we see again a series of sub-modules within
CO that are all designed for a specific task in mind. Thus the configuration issues
vary, depending on which part of CO is being implemented. CO provides different
information requirements for different analyses of profit and cost control and
performance. It also causes more design issues than FI. Within FI, the business
requirements for standard functions (General Ledger, Accounts Payable, and
Accounts Receivable) are broadly similar in most organizations. With CO,
however, the requirements will vary widely between organizations, especially in
different industry sectors. Even organizations operating within the same industry
can have particular requirements for management accounts unique to their
organizations. Thus, obtaining information about cost management and profit
responsibility requires good input from Financial Controllers within the
organization. They need to identify the costing methods adopted and the
requirements for analyzing the results.
Controlling Overhead Cost
Controlling overhead cost is the core part of CO. All organizations have a
requirement for cost control. Cost center accounting typically allows divisions of
costs across departments and product lines. Internal order allows the identification
of costs for discrete events.
Within CO, cost centers and internal orders are the main cost collectors used to
control and report overhead costs.
Using CO-CCA Cost Center Accounting
Cost centers identify where costs are spent and who has the responsibility for those
costs. Cost centers need to be organized in a logical structure, which is enforced in
SAP via the standard hierarchy. A company can typically identify a standard
hierarchy based around its organizational structure. Alternative hierarchies may
also be required to identify a grouping of cost centers from a different viewpoint
(for example, geographically). A decision must also be made concerning the use of
activities in a non-production implementation. Activity types provide useful
mechanisms for cost allocation and allow divisions of cost into fixed and variable,
which is essential to certain costing methods. They are also a necessary inclusion
where SAP production planning is implemented because they provide the cost
drivers for product costing.
We also need to identify the relevant cost accounts from FI that should be created.
This is important because creation of a cost element necessitates the need for a cost
object which can have a dramatic impact on automatic account assignments in CO.
Revenue elements should only be created if Profitability Analysis is also being
implemented. Revenue elements require a real cost object assignment of which a
business segment in PA is the expected default.
The analysis of how detailed planning is conducted and how this relates to the
budget allocation must be defined. The quality of the planning information and,
hence, control is directly related to the planning effort expended. SAP allows the
creation of planning layouts, or user-defined screens, which can facilitate planning.
It is also necessary that the correct authorizations be assigned to these layouts in
order to maintain confidentiality and consistency of plan data.
Finally the methods of allocation for shared overheads must be established. The
appropriate statistics required for allocation are identified for direct recording on
the cost centers, or are possibly transferred from the Logistics Information System.
The cycles for these allocations must be maintained and tested. Good naming
conventions for segments within a cycle should be adopted to ease maintenance
and understanding. It is also a good idea, with complex allocations, to plan these
methodically on paper first, before executing them.
Using CO-IO Internal Orders
The nature and use for internal orders can be undertaken in parallel with the cost
center activity. Internal orders are very flexible cost collectors, and it is possible
that certain types of orders are constantly being created, while others are
infrequent. This will all be dictated by the nature of the organization’s business.
Broadly speaking, they are used to collect costs temporarily for events, jobs, or
small projects in an organization. The nature of the final allocation of the order
also needs to be addressed. This can identify judicious use of statistical orders that
will prevent the added complication of settlement for these orders.
Order statuses for each order type need to be determined, and this can give a good
deal of control over the life cycle of an order but involves detailed configuration.
This must be tied to the internal procedures and associated business transactions
that are to be undertaken at each stage in an order’s life.
As for cost centers, we need to define how the organization plans and budgets
internal orders. This can include configuration of budget availability, budget
supplements, and budget returns, as well as integration into the overall capital-
spending budget.
Settlement structures and layouts need to be defined, and it is important that this is
coordinated with the cost element creation. Configuration inconsistencies arise
quickly where development of the interrelated parts of CO is not coordinated.
Internal order and cost center relationships need to be established and built. The
plan integration between these areas in CO also needs to be tested.
Controlling Profitability
Having established the main components of overhead management, the
organization needs to consider the area of profitability. There is a need to measure
profitability on a cost-of-sales basis, period-basis, or both. There is also the need to
focus on the external and internal view of profitability.
Given these requirements, SAP offers within CO the Profitability Analysis (CO-
PA) module and Profit Center Accounting (CO-PCA) module.
Using CO-PCA Profit Center Accounting
CO-PCA provides the internally focused analysis of profit, and there are similar
considerations to cost center accounting. Profit Centers need to be organized into a
standard hierarchy. Alternative hierarchies may also need to be constructed.
Considerations for planning and plan transfer from other modules need to be
addressed.
A further decision regarding Profit Centers is whether it is required to record
certain balance sheet items. It is possible to assign fixed and working capital items.
This allows for return on investment reporting, and a Profit Center used in this way
could be thought of as an Investment Center. Profit Center accounting provides
powerful associations between SAP cost objects and the related Profit Center,
which must also be assigned. This assignment allows the inclusion of overhead
costs in a Profit Center.
Using CO-PA Profitability Analysis
CO-PA is a powerful and flexible tool for Sales and Marketing, focusing on the
external view of profit. The challenge posed by CO-PA is that the database has to
be designed to suit each individual organization. It is imperative that this is
designed in the most efficient manner possible if the database performance is to
remain manageable. There is also complex configuration between the areas of
Sales and Distribution (SD) and Product Costing (CO-PC). For this reason the use
of CO-PA without SD is usually not recommended. This requires building details
of a sales order into the financial accounting (FI) document.
The key impact of all the CO modules is only realized with the provision of
effective reports. Without effective reporting, we end up with a system that could
be described as “Data rich, information drip.” The SAP modules provide
efficiently designed databases, or the tools to define your own, in CO-PA. This
data storage is limited, however, unless proper attention is spent on the analysis of
information requirements and the creation of effective reports. SAP delivers
standard interrogation and drill-down reports in all of its CO modules, but these
can be greatly enhanced and added to with the Report writing tools available in
CO.
Integrating FI and CO
A discussion of the main integration points of FI and CO is now relevant. In the
organizational setup, the Controlling Area in CO is linked to the Company Code in
FI. Multiple Company Codes may be assigned, which allows cross-Company Code
controlling. This is only possible, however, when all Company Codes are assigned
to the same Chart of Accounts. This is because a Controlling Area is designed to
analyze by cost object the cost and revenue elements, which must be uniform.
Therefore, the creation of cost elements is dependent on the creation of certain
General Ledger accounts. Tools exist in CO that allow the automatic creation of
cost elements.
Where there is a requirement to analyze FI accounts by business area, the cost
objects in CO can be assigned to the relevant business area. As well as the product
strategic business areas, there should also be a general business area for assignment
of non-product specific costs.
Using Other Functions in FI
Two remaining functions in FI to mention are Special Purpose Ledger and
Consolidation.
Special Purpose Ledger, FI-SPL, is used in the definition of specific ledgers which
are necessary to meet a unique reporting requirement that is not fulfilled by any
other standard SAP financial module. The term ledger is used to signify that we
create a ledger to analyze account balances by a non-standard reporting field. In the
creation of these ledgers, the correct definition of the reporting dimensions and the
corresponding set up of the ledger and data transfer are critical to ensure the
efficiency of the reporting.
Consolidation, FI-LC, provides functionality to support legal consolidation of
organizations. FI-LC in turn relies on purpose-built ledgers defined within FI-SPL
to capture the data from individual Company Codes and perform the necessary
inter-company elimination. In order to achieve this, we require proper coordination
of the Chart of Accounts. This must consist of group account numbers which, in
turn, must be linked and related to financial statement items. Collectively, these
items form a financial statement version, the tool used to report the balance sheet
and profit and loss account. A decision must also be made as to whether data
transfers to the consolidation ledger should be in real-time or performed at period-
end. Where data exists in different clients, the latter method would be the only
choice for cross-client data transfer.
Using Other Functions in CO
CO consists of one final module, EIS or Executive Information System. This can
be regarded as a stand-alone module as it provides the capability to define a series
of databases that are capable of storing and reporting all information that is vital
and relevant to an organization. Note this includes more than just the SAP data
sources. Indeed, it is important within an organization to collect information from
other internal systems, and also external sources, regarding the competition and
markets. SAP facilitates data transfer from existing SAP systems into the EIS
databases. It provides a standard tool for building data transfers from other sources.
While providing a version of the Report Painter tool for reporting, EIS is also well
supported by a Complimentary Software Product, Insight. This provides a visually
intuitive and integrated front-end for information processing.
It can be seen, from the insight into FI and CO, that these modules contain a vast
variety of applications to assist an organization and challenge a consultant. It is
seldom likely that the entirety of FI and CO is implemented at one time. Certain
parts of an FICO implementation may also take place during different phases.
Finally, a good FICO consultant has a mind for the information requirements of an
organization and the best financial SAP tool to suit a particular requirement.
Good luck with your FICO implementation.
Analyzing SAP from Consultant Two’s Perspective
I was attracted to specializing in SAP for two main reasons. First, I had spent at
least 10 years on contracts at different companies around the world. I spent this
time struggling to master the custom systems that clients had written (often at
phenomenal expense). After one or two years learning a system—thinking I had
mastered something useful—I would then go to another project and almost have to
start all over again. This eventually became tiresome. Secondly, I saw something
new in SAP that I did not see in other packages. It was the determination of SAP to
try and produce a suite of modules which reflected “best in class” practices as well
as a mass-market attitude. I realized that it was only a question of time before all
the major companies would at least evaluate SAP, as they looked to retire their
ever-aging legacy systems, and take the opportunity to downsize their IS staff to
reduce costs.
As a Certified Accountant by training, I was always closer to working in finance
areas, rather than manufacturing, sales, logistics, and so on. I therefore naturally
gravitated towards the FI/CO modules, or to be precise, they gravitated towards
me. Getting a break in SAP is a bit like the “chicken and egg situation;” you cannot
get in because you don’t have the experience, and you can’t get the experience
because you can’t get in. I got my break while on a project for a global customer
who was switching to SAP R/3 and retiring about 100 systems in the process. They
were prepared to “bite the bullet” with me, but the learning curve was steep and
there was no formal training. That opportunity, which lasted about 6 months,
opened more doors. Thereafter it got easier, but took time. Most of the consultants
I see these days either joined a consultancy and received SAP or internal training
or learned their SAP skills at their employers, and then, for whatever reason, left to
join the ever-growing consulting market.
I find that there are generally two types of SAP projects. The first type is a brand-
new implementation. This type often replaces made-to-order legacy systems with
R/3. It is normally done just in a division of a company—rarely the whole
company at one go. These require a lot of knowledge, either about the client’s
industry and/or the client’s systems. And by the time you arrive, most of the
analysis work is done already. They expect you to “hit the deck running,” even
though they’ve been working on it for months or even years. Typically, there are
also many interfaces to other systems passing and receiving data, which
complicates things.
The second type of project (and these seem to be more R/2-related) is where the
client has been using SAP for a few years and wants to change the configuration
because their business has changed. These bring new problems to the consultant
because staff are trained to use the system only in a specific way, and any process
changes are difficult to introduce. At some point, these clients will have to migrate
to R/3 or R/4, so there will always be a lot of work in this area—perhaps
increasingly so over the next decade.
One of my biggest problems, and something with which I still struggle, is knowing
all the possibilities of the system. The modules are so vast and cover so much, that
a detailed knowledge can often only be learned by “on the job training” over many
years. Unfortunately, the system documentation is of limited help at times, but it
pays to ask around because on a large project, somebody else will often know
something about it. Unfortunately, from my experience some of the delivered SAP
processes/functionality (for example, European VAT handling, Activity Based
Costing, Management Reporting) don’t work well as yet. But, as an integrated
Transaction Processing system, R/2 or R/3 takes a lot of beating, so SAP must also
be a compromise.
FI/CO are the more passive modules, by that I mean they’re used more for record
keeping and historic analysis, and often where the processes are more standard in
all organizations. However being at the back-end of the chain, this also presents a
new problem because if anything goes wrong with the financial numbers, it is often
largely due to somebody in SD or MM changing a flag or using the wrong order
type. Because of the tight integration, there is an immediate impact all over the
system, and often there is no “undo” button. Sometimes you don’t even see the
error until the end of the month. This can be both a strength and a weakness of
SAP. It comes as no surprise, therefore, that the most critical time for these types
of errors is just after going live—when users experiment in the Production
environment. Therefore, good training and documentation are prerequisites that
should not be overlooked.
Management generally sees the FI module as a cornerstone to their business, but it
is often not the most important. Good sales, logistics, and materials handling will
be of far more value to any company. However, all these modules need, at some
point in a process, to access FI for information, the cost of writing many interfaces
becomes prohibitive. The FI module, in my experience, is always implemented.
The U.S., in particular, extensively uses the Special Purpose Ledger (SPL) to
combine SAP and Non-SAP ledgers, often to feed a management reporting
database or consolidation system. Use of the SPL is not as widespread in Europe,
but growing.
The CO module has differing uses, and is not always implemented. In a
manufacturing organization, you can take specific advantage of the links with cost
objects like Production Orders (CO-OPA), which are closely linked to MM and
PPS (Production Planning & Scheduling) so that you can, for example, determine
the Profit or Loss per Production Order against a standard cost. In a more service-
related organization, perhaps CO-CCA Cost Center accounting is more relevant in
enabling all costs to be settled onto Cost Centers so managers can monitor their
spending. Often, both are used.
CO can be added later, if required, and FI has the ability to validate Cost Centers
even if CO is not present. Tools also exist to retrospectively populate CO with Cost
Center data. Both FI and CO have budgeting capabilities, but it is more common to
set detailed plans at a cost-center level in CO than on an account number level in
FI. The FI function exists purely to support the financial statement version.
I have not yet seen or heard of an organization that uses SAP without some
additional modifications. These modifications involve either writing new tables
and new ABAPs, so as to get the system to do what they want, or at least writing
new reports to get the system to show what they want. The larger the company, the
more complex the solution often becomes. On top of this, SAP rarely replaces
everything in an organization, so there is inevitably the payroll interface or the feed
to a consolidation system or something similar to consider. Again, the larger the
organization, the more legacy environments that are being gradually replaced, the
more interfaces there are to consider. These processes never fail to impact the
FI/CO configuration and operation. Fortunately, there are some processes, more so
within FI, which are fairly static. For example, the functions in Accounts Payable,

Accounts Receivable, and Monthly Closing don’t radically change from company
to company, and, once mastered, are not forgotten.
Because SAP is changing all the time, it is always exciting to see what new things
they find to bring out with which to test us.
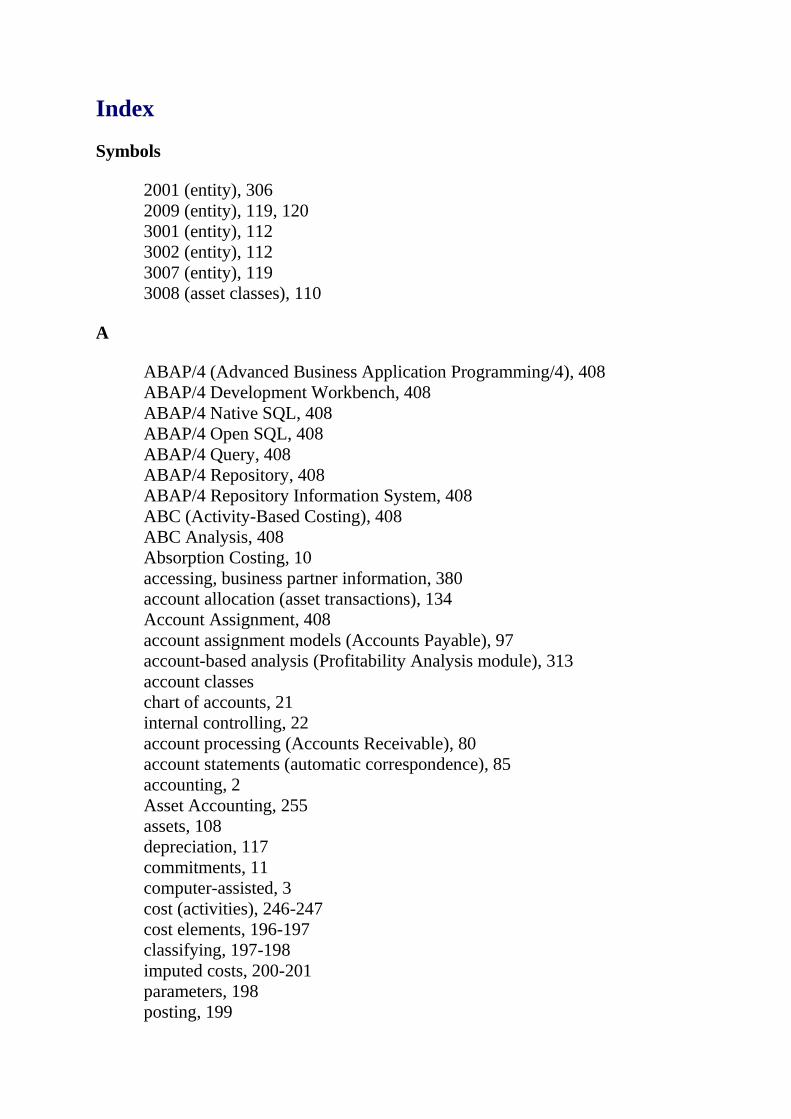
Index
Symbols
2001 (entity), 306
2009 (entity), 119, 120
3001 (entity), 112
3002 (entity), 112
3007 (entity), 119
3008 (asset classes), 110
A
ABAP/4 (Advanced Business Application Programming/4), 408
ABAP/4 Development Workbench, 408
ABAP/4 Native SQL, 408
ABAP/4 Open SQL, 408
ABAP/4 Query, 408
ABAP/4 Repository, 408
ABAP/4 Repository Information System, 408
ABC (Activity-Based Costing), 408
ABC Analysis, 408
Absorption Costing, 10
accessing, business partner information, 380
account allocation (asset transactions), 134
Account Assignment, 408
account assignment models (Accounts Payable), 97
account-based analysis (Profitability Analysis module), 313
account classes
chart of accounts, 21
internal controlling, 22
account processing (Accounts Receivable), 80
account statements (automatic correspondence), 85
accounting, 2
Asset Accounting, 255
assets, 108
depreciation, 117
commitments, 11
computer-assisted, 3
cost (activities), 246-247
cost elements, 196-197
classifying, 197-198
imputed costs, 200-201
parameters, 198
posting, 199
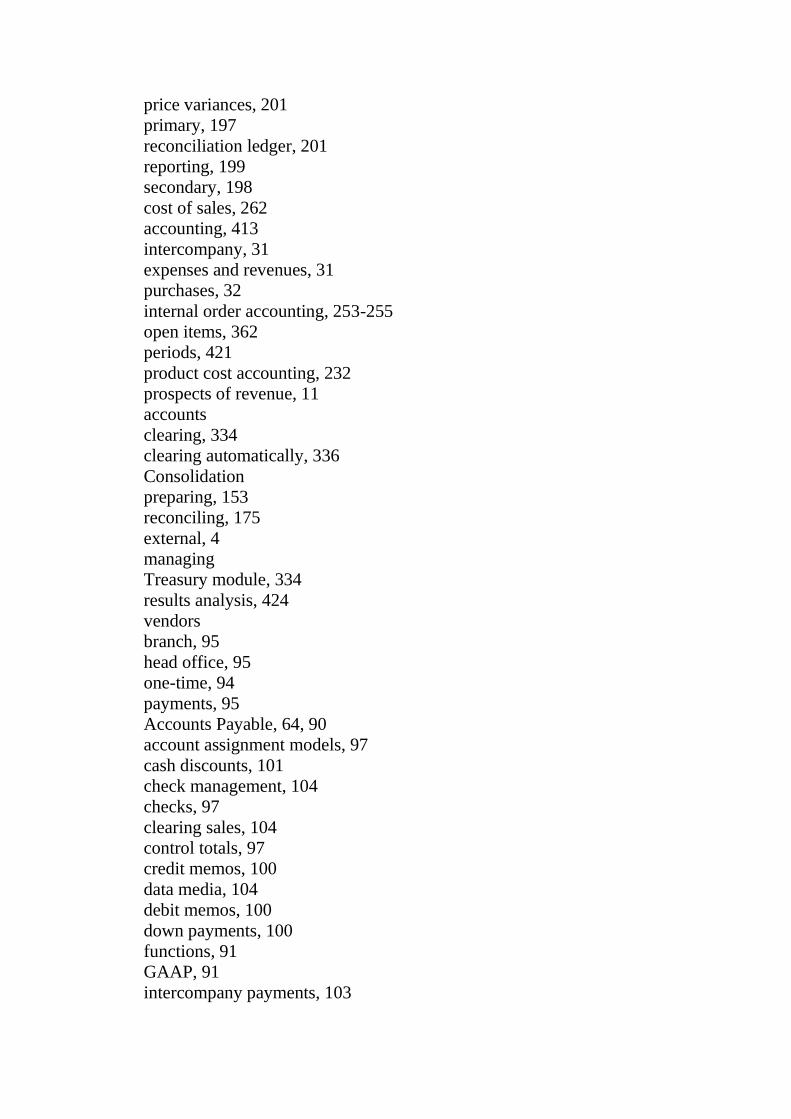
price variances, 201
primary, 197
reconciliation ledger, 201
reporting, 199
secondary, 198
cost of sales, 262
accounting, 413
intercompany, 31
expenses and revenues, 31
purchases, 32
internal order accounting, 253-255
open items, 362
periods, 421
product cost accounting, 232
prospects of revenue, 11
accounts
clearing, 334
clearing automatically, 336
Consolidation
preparing, 153
reconciling, 175
external, 4
managing
Treasury module, 334
results analysis, 424
vendors
branch, 95
head office, 95
one-time, 94
payments, 95
Accounts Payable, 64, 90
account assignment models, 97
cash discounts, 101
check management, 104
checks, 97
clearing sales, 104
control totals, 97
credit memos, 100
data media, 104
debit memos, 100
down payments, 100
functions, 91
GAAP, 91
intercompany payments, 103
invoices
manual entry, 96
scanning, 96
vendors, 95
multinational accounting, 102
net posting, 99
open items, 98
payment
automatic, 100
program, 102
proposals, 101
preliminary documents, 98
recurring entries, 97
reverse documents, 104
SAPscript, 104
transactions, 92-95
account assignment models, 97
automatic payment, 100
cash discounts, 101
check management, 104
checks, 97
clearing sales, 104
control totals, 97
credit memos, 100
data media, 104
debit memos, 100
down payments, 100
EDI (Electronic Document Interchange), 96
intercompany payments, 103
invoices, 95-96
multinational accounting, 102
net posting, 99
open items, 98
payment program, 102
payment proposals, 101
preliminary documents, 98
recurring entries, 97
reverse documents, 104
SAPscript, 104
vendors, 91
branch accounts, 95
head office accounts, 95
master records, 92-93
one-time accounts, 94
payments, 95
Accounts Receivable, 64
account processing, 80
correspondence, 84
account statements, 85
balance confirmation, 86
extracts, 86
letters, 85
payment notices, 84
customer credit, 87
limiting, 88
master sheets, 89
monitoring, 88
payment behavior, 89
customer master record, 65
alternate payers, 68
branch office accounts, 68
head office accounts, 68
intercompany sales, 66
one-time accounts, 68
processing, 67
customer transactions, 69
advice notes, 75
automatic banking, 76
currencies, 70
debit memos, 76
exchange rates, 71
invoices, 70
manual check deposit, 76
partial payments, 75
payments, 71
searching open items, 72
document processing, 80
changing documents, 81
dunning, 82
automatic, 84
EDI (Electronic Document Interchange), 84
letters, 83
levels, 82
General Ledger, 64
line items, 80
reporting, 86
special transactions, 77
bills of exchange, 78
discounting (bills of exchange), 79
down payments, 77
guarantees, 80
security deposits, 79
accruals, 3
acquiring (fixed assets), 135-136
acquisitions (fixed assets), 143
Active SAP R/3 Repository, 408
activities
confirmation, 290
actual costs, 291
actual dates, 291
actual payments, 292
actual revenues, 292
cost accounting, 246
allocation bases, 247
cost drivers, 252
cost planning, 249
indirect allocation of costs, 250
internal accounting, 247
parallel, 252
planning, 248
political prices, 249
process cost rates, 253
quantity accounting, 248
simulation, 248
subprocesses, 253
variances, 250-251
cost of sales accounting, 262
external, 415
loops, 417
projects
balance sheet comparison, 296
billing, 296
billing (resource-related), 297
confirming, 290-292
earned value analysis, 294
orders, 292
periodic processing, 293
results analysis, 295
settlements, 296
subproject prices, 297
subproject views, 298
surcharges, 293
time float, 426
time intervals, 426
Activity (Controlling), 408
Activity (Project System), 408
activity costs (Capital Investment measures), 367
Activity Input, 408
Activity Logs, 409
activity types (Profitability Analysis), 309, 409
Activity-Based Cost Accounting module, 248
Activity-Based Costing, 408
Actual Cost Accounting, 10
actual costs, 409
adult learners (FICO education and training), 396
ALE (Application Link Enabling), 6, 353, 409
Profitability Analysis module, 316
allocation
assessment, 213
costs (indirect), 250
special purpose ledger, 57
surcharge calculation, 213
allocation bases (cost accounting), 247
Allocation Groups, 409
allocation receiver, 409
alternate payers (Accounts Receivable), 68
alternate reports (assets), 147
analyzing
balance sheets, 53
investments proposals, 357
profitability, 304
Profitability Analysis module data, 325
annual cash plan (Market Risk Management module), 342
annual reporting (Consolidation), 158
auditing, 161
Auditor Workstation, 161
customized reports, 158
interactive, 158
interim periodic financial statements, 160
options, 161
ratio analysis, 159
validation, 161
APC (Acquisition or Production Costs), 409
API (Application Programming Interface), 409
Application Link Enabling (ALE), 353
Application Programming Interface (API), 409
application skills (FICO education and training), 390
application tools (Customizing tool), 414
applications
ABAP/4 (Advanced Business Programming/4), 408
background process, 409
client caches, 411
dynpro, 415
environment analyzer, 415
logical system, 417
R/3, 209
third-party, 387
see also software
archiving portfolios (assets), 116
areas (General Ledger), 23
chart of accounts, 23-24
company code, 23
ASCII, 409
Assessment (Controlling), 409
assessments
controlling costing, 213
special purpose ledger (General Ledger), 41
Asset Accounting, 361
fixed assets (acquiring), 137
master records, 361
Asset Class, 409
Asset under Construction (AuC), 409
assets, 108
accounting, 108
APC (Acquisition or Production Costs), 409
AuC (Assets under Construction), 140
capitalization, 140
cost schedules, 142
investments, 141
open items, 140
orders, 141
settlement of capital spending orders, 142
Capital Investment measures (creating), 363
classes, 110
catalog, 111
depreciation areas, 113
fixed, 112
group, 112
history sheets, 113
line items, 113
master records, 111-112
reporting, 113
super-numbers, 112
Consolidation
intercompany transfers, 177
reclassifying sales as, 176
depreciation, 117
accounting, 117
backlog, 124
calculating, 126-128
currencies, 128-129
disasters, 118
group valuation, 125
imputed interest, 124
individual, 126
insurance, 124
investments, 123
one-time revaluation, 124
replacement values, 123
reserves, 119
simulating, 125, 130-133
special valuation, 123
tax-based, 125
taxes, 118
transferring reserves, 119
unplanned, 118
depreciation areas, 119
book, 120
chart, 122
cost accounting, 121
currencies, 129
derived, 122
maintenance, 122
net asset, 121
reporting valuation, 121
tax, 120
enterprise data model, 109
Financial Information System (FIS), 144
fiscal year, 128
fixed, 361
acquiring, 135-137
periodic depreciation posting, 137
purchasing, 136
retiring, 138-139
special transactions, 143-144
write-ups, 137
flat-rate investment procedure, 361
hierarchy, 109
identifying, 110
international management, 148
master records, 113
archiving portfolios, 116
elements, 114
maintenance levels, 115
mass change procedure, 116
numbering, 115
parameters, 115
portfolios, 116
screens, 114
substitution conditions, 115
time-dependent data, 115
validation conditions, 115
viewing, 115
workflow, 116
receipt principle, 108
reporting, 144
alternate reports, 147
customizing reports, 147
history, 146
history sheets, 145
manipulating reports, 147
selection tree, 145
year-end, 145
transactions, 134
account allocation, 134
collective, 135
types, 134
valuation techniques, 117
Assets Management, 354
assigning costs to cost objects, 228
associating (project structures), 275, 277
Asynchronous Database Updating, 409
AuC (Assets under Construction), 140, 409
capitalization, 140
cost schedules, 142
down payments, 141
investments, 141
open items, 140
orders, 141
settlement of capital spending orders, 142
AuC Data Object (Capital Investment), 365
auditing (Consolidation), 161
Auditor workstation (R/3 Audit Information System), 161, 376
authorization (cost center planning), 218
automatic correspondence (Accounts Receivable), 84-85
account statements, 85
balance confirmation, 86
extracts, 86
payment notices, 84
automatic dunning (Accounts Receivable), 84
automatic investment Consolidation, 178
automatically clearing accounts, 336
availability (Materials Management), 287
availability control
budgets, 367
Funds Management module, 347
B
background process, 409
backlog depreciation (special valuation), 124
backward scheduling, 409
balance confirmation (Accounts Receivable), 86
balance sheets
analyzing, 53
company codes, 411
Consolidation, 172
adjustment postings, 174
fixed asset transfers, 177
intercompany profit and loss, 175
reclassifying profits to inventory, 176
reclassifying sales to capitalized assets, 176
reconciling accounts, 175
trading partner ID codes, 175
General Ledger, 28, 51
key figure reports, 53
projects, comparing costs and revenues, 296
balances (eliminating), 156
BAPI (Business Application Programming Interface), 378-379
benefits of FICO education and training, 396
billing element, 410
billing projects, 296
resource-related, 297
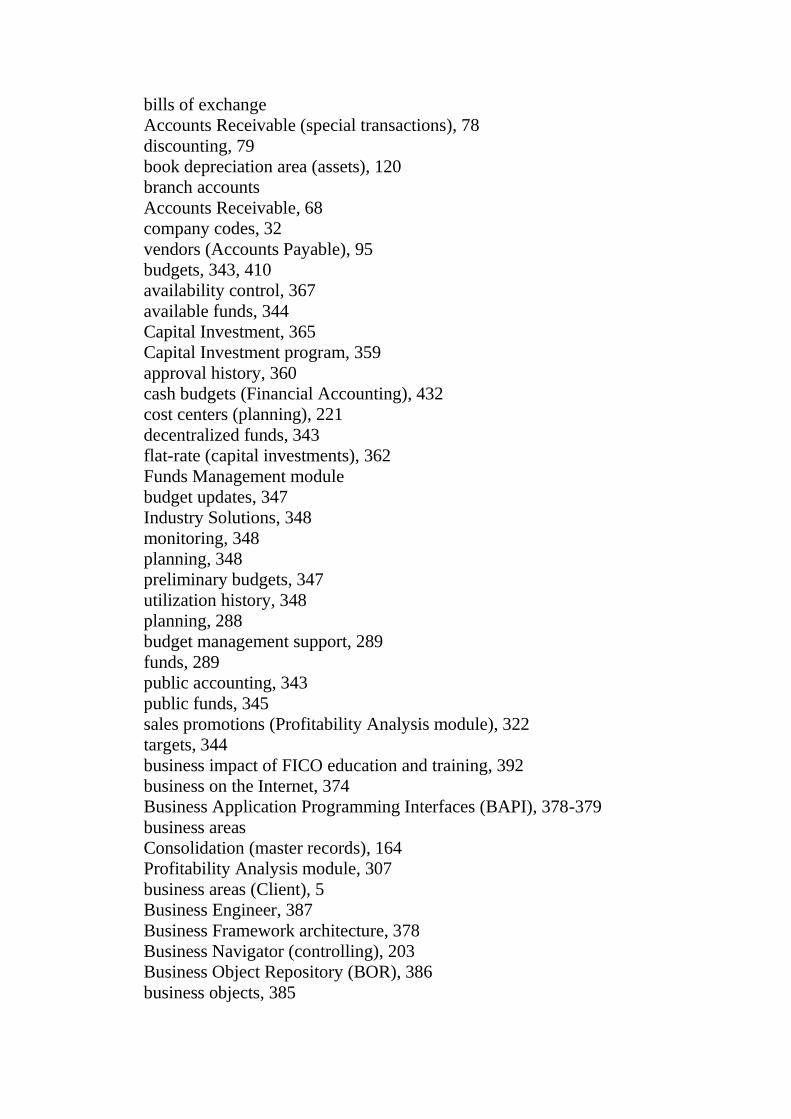
bills of exchange
Accounts Receivable (special transactions), 78
discounting, 79
book depreciation area (assets), 120
branch accounts
Accounts Receivable, 68
company codes, 32
vendors (Accounts Payable), 95
budgets, 343, 410
availability control, 367
available funds, 344
Capital Investment, 365
Capital Investment program, 359
approval history, 360
cash budgets (Financial Accounting), 432
cost centers (planning), 221
decentralized funds, 343
flat-rate (capital investments), 362
Funds Management module
budget updates, 347
Industry Solutions, 348
monitoring, 348
planning, 348
preliminary budgets, 347
utilization history, 348
planning, 288
budget management support, 289
funds, 289
public accounting, 343
public funds, 345
sales promotions (Profitability Analysis module), 322
targets, 344
business impact of FICO education and training, 392
business on the Internet, 374
Business Application Programming Interfaces (BAPI), 378-379
business areas
Consolidation (master records), 164
Profitability Analysis module, 307
business areas (Client), 5
Business Engineer, 387
Business Framework architecture, 378
Business Navigator (controlling), 203
Business Object Repository (BOR), 386
business objects, 385
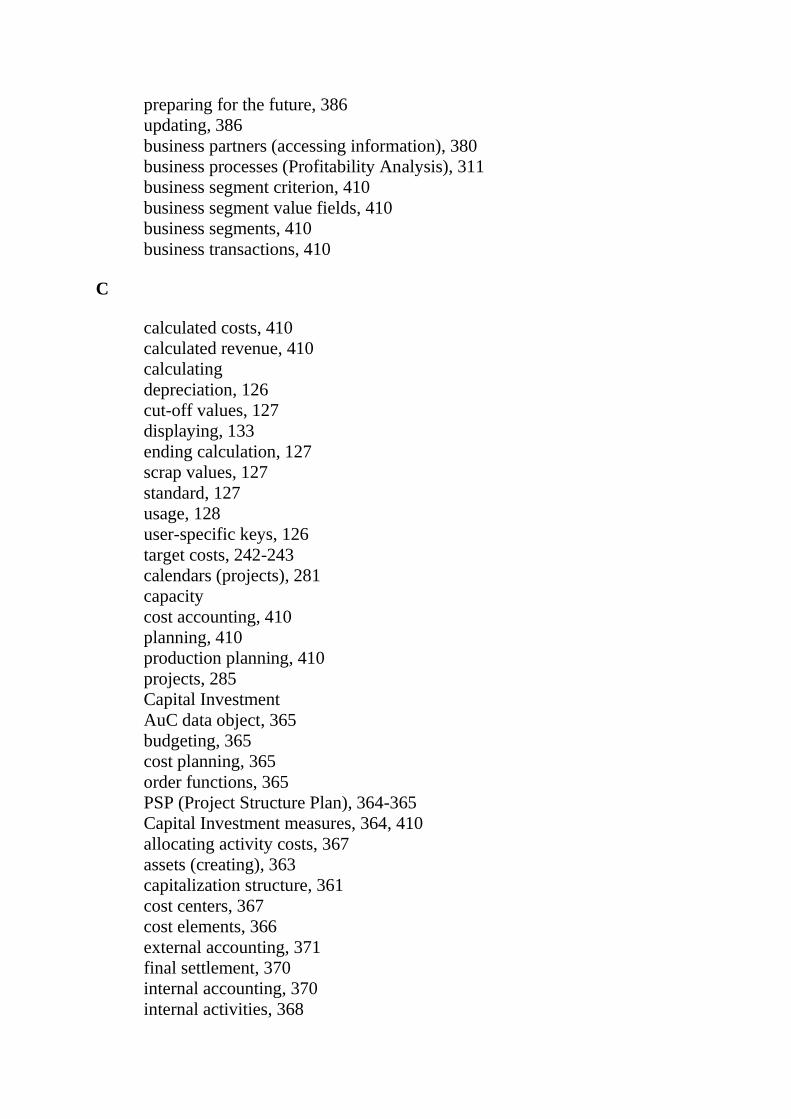
preparing for the future, 386
updating, 386
business partners (accessing information), 380
business processes (Profitability Analysis), 311
business segment criterion, 410
business segment value fields, 410
business segments, 410
business transactions, 410
C
calculated costs, 410
calculated revenue, 410
calculating
depreciation, 126
cut-off values, 127
displaying, 133
ending calculation, 127
scrap values, 127
standard, 127
usage, 128
user-specific keys, 126
target costs, 242-243
calendars (projects), 281
capacity
cost accounting, 410
planning, 410
production planning, 410
projects, 285
Capital Investment
AuC data object, 365
budgeting, 365
cost planning, 365
order functions, 365
PSP (Project Structure Plan), 364-365
Capital Investment measures, 364, 410
allocating activity costs, 367
assets (creating), 363
capitalization structure, 361
cost centers, 367
cost elements, 366
external accounting, 371
final settlement, 370
internal accounting, 370
internal activities, 368
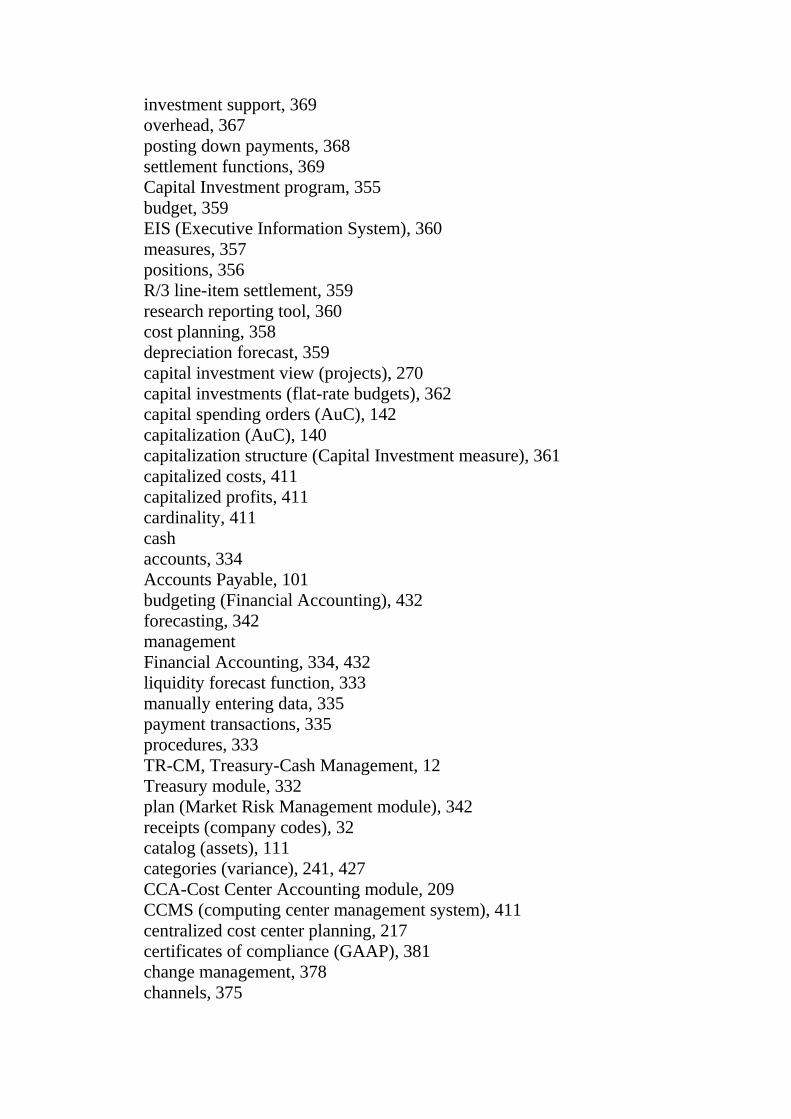
investment support, 369
overhead, 367
posting down payments, 368
settlement functions, 369
Capital Investment program, 355
budget, 359
EIS (Executive Information System), 360
measures, 357
positions, 356
R/3 line-item settlement, 359
research reporting tool, 360
cost planning, 358
depreciation forecast, 359
capital investment view (projects), 270
capital investments (flat-rate budgets), 362
capital spending orders (AuC), 142
capitalization (AuC), 140
capitalization structure (Capital Investment measure), 361
capitalized costs, 411
capitalized profits, 411
cardinality, 411
cash
accounts, 334
Accounts Payable, 101
budgeting (Financial Accounting), 432
forecasting, 342
management
Financial Accounting, 334, 432
liquidity forecast function, 333
manually entering data, 335
payment transactions, 335
procedures, 333
TR-CM, Treasury-Cash Management, 12
Treasury module, 332
plan (Market Risk Management module), 342
receipts (company codes), 32
catalog (assets), 111
categories (variance), 241, 427
CCA-Cost Center Accounting module, 209
CCMS (computing center management system), 411
centralized cost center planning, 217
certificates of compliance (GAAP), 381
change management, 378
channels, 375
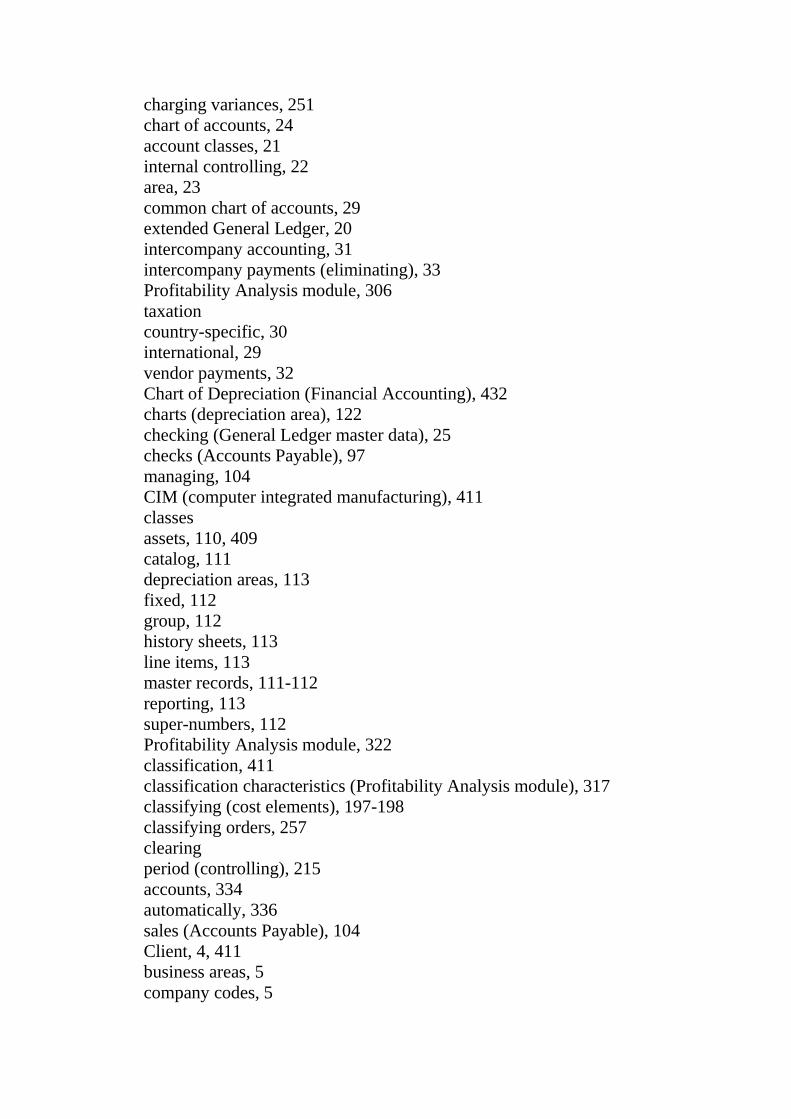
charging variances, 251
chart of accounts, 24
account classes, 21
internal controlling, 22
area, 23
common chart of accounts, 29
extended General Ledger, 20
intercompany accounting, 31
intercompany payments (eliminating), 33
Profitability Analysis module, 306
taxation
country-specific, 30
international, 29
vendor payments, 32
Chart of Depreciation (Financial Accounting), 432
charts (depreciation area), 122
checking (General Ledger master data), 25
checks (Accounts Payable), 97
managing, 104
CIM (computer integrated manufacturing), 411
classes
assets, 110, 409
catalog, 111
depreciation areas, 113
fixed, 112
group, 112
history sheets, 113
line items, 113
master records, 111-112
reporting, 113
super-numbers, 112
Profitability Analysis module, 322
classification, 411
classification characteristics (Profitability Analysis module), 317
classifying (cost elements), 197-198
classifying orders, 257
clearing
period (controlling), 215
accounts, 334
automatically, 336
sales (Accounts Payable), 104
Client, 4, 411
business areas, 5
company codes, 5
cost accounting areas, 6
cost elements, 7
data fields, 5
profit centers, 6
client caches, 411
closing
Financial Calendar, 60
General Ledger
operational structure, 51
subledgers, 46
period (controlling), 215
projects, 266
year-end (General Ledger), 28, 35-36
CO-Controlling module
cost centers, 433
Financial Accounting, 433
functions (Executive Information System), 436
integrating with FI, 435
internal orders, 434
overhead costs, 433
parallel costing systems, 10
profit analysis, 435
profit center accounting, 435
profitability, 434
special purpose ledgers, 9
see also controlling
CO-ABC Activity-Based Cost Accounting module, 248
see also cost accounting
CO-OPA Order and Project Accounting module, 253
CO-PA Profitability Analysis module
see Profitability Analysis module
co-products, 411
collective assets (transactions), 135
commitment items, 411
see also open items
commitments, accounting for, 11
common chart of accounts, 29
common programming interface (CPI-C), 414
companies
Consolidation (types), 166
Profitability Analysis module, 307
company codes, 411
branches, 32
cash receipts, 32
Client, 5
companies, 307
credit limits, 337
currency, 34
enterprises, 14
General Ledger (areas), 23
head office, 32
Profitability Analysis module, 307
compilers, 411
components
BAPI, 379
IAC (Internet Application Component), 379
Java Virtual Machine, 378
Open FI, 375
computer integrated manufacturing (CIM), 411
computer-assisted accounting, 3
computers (Consolidation, transferring data), 171
computing center management system (CCMS), 411
confirming activities, 290
actual costs, 291
actual dates, 291
actual payments, 292
actual revenues, 292
Consolidation, 14, 152
annual reporting, 158
auditing, 161
Auditor Workstation, 161
customized reports, 158
interactive, 158
interim periodic financial statements, 160
options, 161
ratio analysis, 159
validation, 161
balance sheets, 172
adjustment postings, 174
currency conversion, 174
fixed asset transfers, 177
intercompany profit and loss, 175
reclassifying profits to inventory, 176
reclassifying sales to capitalized assets, 176
reconciling accounts, 175
trading partner ID codes, 175
companies (types), 166
customizing, 161
EIS, 163
management consolidation, 162
special ledgers, 163
step consolidation, 162
equity method, 168
FI functions, 436
financial statements, 152
interfaces, 153
investments, 178
automatic, 178
fair value adjustment, 178
goodwill, 178
legal entity of a corporate group, 153
master records, 164
business areas, 164
FS Items Catalog, 165
statistical lines, 166
performing
first, 167
subsequent, 167
planning group-wide, 154
preparation, 155
currency translation, 156
eliminating balances, 156
forecasting, 158
investments, 157
simulating, 158
standardizing entries, 156
preparing accounts, 153
proportional, 168
purchase method, 168
reporting (subgroups), 169
reporting tree, 179
customizing reports, 180
drill-down, 182
Excel, 181
interim statements, 183
key figures, 182
simulating, 184
revaluation method, 168
simultaneous, 168
software advantages, 155
step, 168
subsidiary level, 169
fixed assets, 170
intercompany posting transactions, 169
valuation areas, 170
trading partners, 155
transferring data, 170
consolidation groups, 171
personal computers, 171
validation, 172
consultant one (Financial Accounting), 430
cash budgeting, 432
cash management, 432
Chart of Depreciation, 432
CO module, 433
fixed assets, 432
General Ledger, 431
organizational structures, 431
subledgers, 431
consultant two, 436
contingency orders, 411
continuous flow (costing), 225
contributing margin accounting (Profitability Analysis module), 313
control indicators, 411
control key, 412
control totals (Accounts Payable), 97
controlling, 13, 188
activities, 408
assessment, 409
Business Navigator, 203
cost, 202
cost accounting procedures, 190
cost centers, 191, 209
actual costing, 211
assessment, 213
authorization, 218
budgets, 221
CCA-Cost Center Accounting module, 209
data transfer, 215, 218
dependencies, 220
distribution of costs, 212
internal orders, 219
iteration, 219
key figures, 214
period clearing, 215
period closing, 215
planning, 213, 215-220
revaluing, 218
structure, 194
surcharge calculations, 213
cost objects, 191, 207, 224, 233, 237
assigning costs, 228
continuous flow, 225
cost drivers, 226
defining, 192
hierarchy, 244-246
industries, 233
make-to-order, 225
make-to-stock, 225
matching needs of company, 225
order costing, 227
period-end closing, 238, 239
planning, 231
preliminary costing, 237
production variance, 241-242
reporting, 231
results, 229
settlement, 243
simulation, 231
simultaneous costing, 238
surcharges, 240
target costs, 242
unit costing, 226
valuation methods, 230
work in process, 240
EDM (Enterprise Data Model), 194
EIS, 208
Financial Accounting, 206
functional, 195
General Ledger, 206
job orders, 196
marginal costs, 191
operational, 195
overhead costs, 189-190
management, 193
overhead surcharges, 190
planning, 207
profit, 202
Profitability Analysis, 191
profitability segments, 204
projects, 196
R/3 applications, 209
reporting, 208
static costing, 190
transactions, 204
controlling area currency, 412
controlling areas (Profitability Analysis), 308, 412
controlling view (projects), 269
conversion, 412
converting currency (Consolidation), 174
corrections (fixed assets), 144
correspondence (Accounts Receivable), 84
account statements, 85
balance confirmation, 86
extracts, 86
letters, 85
payment notices, 84
cost accounting
activities, 246
allocation bases, 247
cost drivers, 252
cost planning, 249
indirect allocation of costs, 250
internal accounting, 247
parallel, 252
planning, 248
political prices, 249
process cost rates, 253
quantity accounting, 248
simulation, 248
subprocesses, 253
types, 247
variances, 250-251
capacity, 410
controlling area, 412
controlling area currency, 412
function-oriented, 416
internal order accounting, 253
asset accounting, 255
job order, 417
object currency, 418
overhead cost management, 420
parallel methods, 10
plan versions, 421
Profitability Analysis module, 308
activity types, 309
business processes, 311
controlling areas, 308
cost centers, 309
cost elements, 309
cost objects, 311
investment centers, 309
object classes, 312
operating concerns, 312
order types, 310
profit centers, 309
projects, 310
revenue elements, 309
WBS (Work Breakdown Structure), 311
transactions, 260
cost accounting areas (Client), 6
cost accounting depreciation area (assets), 121
Cost Accounting module, 7
cost accounting procedures (controlling), 190
cost calculation objects (imputed costs), 201
cost center accounting (production variance), 241
categories, 241
results, 242
settlement, 243
target costs, 242
cost centers, 7
accounting (cost component layout), 412
allocation receiver, 409
Capital Investment measures, 367
CO-Controlling module, 433
controlling, 191, 209
actual costing, 211
assessment, 213
CCA-Cost Center Accounting, 209
data transfer, 215
distribution of costs, 212
key figures, 214
period clearing, 215
period closing, 215
planning, 213
structures, 194
surcharge calculations, 213
operating levels, 419
operating rates, 419
planning, 215-217
authorization, 218
budgets, 221
customized scheme, 219
data transfer, 218
dependencies, 220
internal orders, 219
iteration, 219
revaluing, 218
secondary costs, 220
Profitability Analysis, 309
cost component, 412
cost controlling, 202
cost drivers
activities, 252
costing, 226
cost elements, 7, 412
accounting, 196, 197
classifying, 198
imputed costs, 200-201
parameters, 198
posting, 199
price variances, 201
reconciliation ledger, 201
reporting, 199
classifying, 197
Capital Investment measures, 366
group, 412
planning, 412
primary, 197
Profitability Analysis, 309
reports (projects), 299
secondary, 198, 425
type, 413
cost objects, 413
controlling, 191, 207, 224, 233, 237
assigning costs, 228
continuous flow, 225
cost drivers, 226
defining, 192
make-to-order, 225
make-to-stock, 225
matching needs of company, 225
order costing, 227
period-end closing, 239
planning, 231
preliminary costing, 237
period-end closing, 238
production variance, 241-242
reporting, 231
results, 229
settlement, 243
simulation, 231
simultaneous costing, 238
surcharges, 240
target costs, 242
unit costing, 226
valuation methods, 230
work in process, 240
hierarchy, 244, 413
product-related, 246
responsibility-related, 246
industries, 233
Profitability Analysis, 311
cost origin, 413
cost planning, 413
Capital Investment, 365
Capital Investment program, 358
type, 413
cost schedules
AuC (Assets under Construction), 142
cost-of-sales (Profitability Analysis module), 314, 321
cost-of-sales accounting, 11, 262, 413
costing, 413
Activity-Based Accounting, 408
continuous flow, 225
controlling
actual, 211
cost objects, 233
cost drivers, 226
current cost estimate, 414
inventory, 224
make-to-order, 225
make-to-stock, 225
matching company needs, 225
modified standard cost estimate, 418
operations layout, 419
order costing, 227
overhead, 420
product, 422
product cost accounting, 232
production orders, 224
products, 234
costing lot sizes variant, 235
indirect costs, 235
itemization, 236
key dates, 236
manual input, 237
production, 235
results, 236
stock variant, 235
target costing, 235
transfer options, 234
simultaneous process, 425
surcharges as overhead, 293
type, 413
unit, 226, 427
variant, 413
version, 414
costing lot sizes (product costs), 235
costs, 6
actual, 409
balance sheets (comparing with revenues), 296
calculated costs, 410
capitalized, 411
controlling, 189-190
marginal, 191
static standard, 190
surcharges, 190
direct costs, 414
distribution (controlling), 414
distribution key, 414
follow-up, 415
general costs activity, 416
imputed, 416
indirect, 416
indirect allocation, 250
initial split, 416
lot-size variance, 417
order, 8, 419
overhead, 420
controlling, 193
parallel costing systems, 10
planning
classifying orders, 257
cost accounting transactions, 260
open items, 259
order data formats, 256
order status, 257
order summary evaluations, 262
planning orders, 258
schedules, 256
settlement rules, 261
settling orders, 260
price variance, 421
primary, 421
primary cost planning, 421
production, 236, 422
products
costing lot sizes, 235
indirect costs, 235
itemization, 236
key dates, 236
manual input, 237
planning, 234
production, 235
results, 236
stock variant, 235
target costing, 235
transfer options, 234
projects (planning), 283
reconciliation ledgers, 8
recording, 6
secondary (planning), 220
standard cost estimate, 426
targets, 426
variances, 250
charging, 251
WBS (actual), 291
costs of complaints and sales deductions (reserves), 424
country-specific taxation, 30
courses (education)
demonstrations, 403
functional, 401
overview, 401
walk-throughs, 403
workshops, 402
post-implementation support, 404
software implementation, 404
CPI-C (common programming interface communications), 414
credit (Accounts Receivable)
customers, 87
limiting, 88
master sheets, 89
monitoring, 88
payment behavior, 89
credit limits, 337
credit memos (Accounts Payable), 100
credits (order settlement), 420
currency
Accounts Receivable, 70
company codes, 34
Consolidation
converting, 174
translation, 156
controlling area currency, 412
depreciation, 128-129
foreign, 129
parallel (General Ledger), 129
regions of legal force, 129
exchange differences, 35
General Ledger, 34
object, 418
transactions, 426
current cost estimate, 414
customer master record
Accounts Receivable, 65
alternate payers, 68
branch office accounts, 68
head office accounts, 68
intercompany sales, 66
one-time accounts, 68
processing, 67
customer transactions (Accounts Receivable), 69
advice notes, 75
automatic banking, 76
currencies, 70
debit memos, 76
exchange rates, 71

invoices, 70
manual check deposit, 76
partial payments, 75
payments, 71
recurring entries, 69
searching open items, 72
customers
accounts (reporting), 86
credit, 87
limiting, 88
master sheets, 89
monitoring, 88
payment behavior, 89
fixed assets (retiring), 138
payment histories, 337
customizing
Consolidation, 161
EIS, 163
management consolidation, 162
special ledgers, 163
step consolidation, 162
cost center planning, 219
reports
assets, 147
Consolidation, 158, 180
Customizing tool, 414
cut-off values (calculating depreciation), 127
D
daily closings (General Ledger), 35
data
entity, 415
master, 417
transferring (Consolidation), 170
data definition language (DDL), 414
data element of a field, 414
data entry, posting to the General Ledger, 46
Data Feed (Treasury Management), 340
data fields (Client), 5
data flow (Profitability Analysis module), 315
data formats (orders), 256
data media (Accounts Payable), 104
data mining
open information warehouse, 383
patterns, 384
data objects
Client, 4
company codes (Client), 5
Cost Centers, 7
open information warehouse, 383
data transfer
controlling, 215
cost center planning, 218
data translation (conversion), 412
data volume (Profitability Analysis module), 325
database interface, 414
database management system (DBMS), 414
databases
Asynchronous Database Updating, 409
logical, 417
dates
product costs, 236
valuation, 427
WBS (actual), 291
year 2000-compliance, 381
DBMS (database management system), 414
DDL (data definition language), 414
debit memos (Accounts Payable), 100
decentralized (cost center planning), 217
decentralized funds (budgets), 343
defining projects, 276
delta management, 414
demonstrations (training), 403
dependencies (planning), 220
depreciation
APC (Acquisition or Production Costs), 409
assets, 117, 352
accounting, 117
disasters, 118
reserves, 119
taxes, 118
transferring reserves, 119
unplanned, 118
calculating, 126
cutoff values, 127
ending calculation, 127
scrap values, 127
standard, 127
usage, 128
user-specific keys, 126
currencies, 128
foreign, 129
parallel (General Ledger), 129
regions of legal force, 129
simulating, 130
displaying calculation, 133
displaying values, 132
planned investments, 132
previewing accounts, 131
transactions, 132
special valuation, 123
backlog, 124
group valuation, 125
imputed interest, 124
individual, 126
insurance, 124
investments, 123
one-time revaluation, 124
replacement value, 123
simulated, 125
tax-based, 125
depreciation areas
assets, 113, 119
book, 120
chart, 122
cost accounting, 121
derived, 122
maintenance, 122
net asset, 121
reporting valuation, 121
tax, 120
currencies, 129
depreciation forecast (Capital Investment program), 359
derived depreciation area (assets), 122
Development Workbench, 408
dialog module, 414
Direct Cost Accounting, 10
direct costs, 414
disasters (asset depreciation), 118
discounting (bills of exchange), 79
displaying
calculation (simulated depreciation), 133
values (simulated depreciation), 132
distributed systems, 6
reconciliation ledgers, 8
distribution
special purpose ledger, 57
special purpose ledger (General Ledger), 41
distribution (controlling), 414
distribution key, 414
special purpose ledger, 59
distribution of costs (controlling), 212
DLL (dynamic link library), 414
DMS-Document Management System, 383, 414
document processing (Accounts Receivable), 80-81
documents (Accounts Payable)
preliminary, 98
reverse, 104
domain, 415
down payments
Accounts Payable, 100
Accounts Receivable (special transactions), 77
AuC (Assets under Construction), 141
Capital Investment measures, 368
drill-down reports (Consolidation), 182
dunning (Accounts Receivable), 82
automatic, 84
EDI (Electronic Document Interchange), 84
letters, 83
levels, 82
dynamic agents, 266
dynamic link library (DLL), 414
dynpro, 415
Screen Painter, 425
E
earned value analysis (projects), 294
EBCDIC (extended binary-coded decimal interchange code), 415
EDI (electronic data interchange), 415
Accounts Payable, 96
dunning, 84
EDM (Enterprise Data Module)
controlling, 194
education, 390
adult learners, 396
business impact, 392
expected benefits, 396
in-house courses, 394
key message, 392
learning zones, 390
application skills, 390
information skills, 391
management skills, 391
technical skills, 390
management skills, 392
SAP courses, 393
training plan, 395
user attitudes, 391
see also training
EIS (Executive Information System), 14
Capital Investment program, 360
Consolidation, 163
controlling, 208
electric commerce, SET (Secure Electronic Transaction), 380
electric commerce (security), 380
electronic banking, 335
electronic commerce, 374
SAP International Development, 381
electronic data interchange (EDI), 415
electronic delivery channels, 375
elements
master records, 114
WBS, 428
email (SAPoffice email system), 387
enqueue service, 415
entering invoices manually, 96
enterprise controlling view (projects), 272
enterprise data model (assets), 109
entities, 415
3001, 112
3002, 112
type 2001, 306
type 2009, 119, 120
type 3007, 119
type 3008 (asset classes), 110
entity relationship model, 415
entries
Accounts Payable (recurring), 97
Consolidation (standardizing), 156
environment analyzer, 415
EPC (event driven process chain), 415
equity method (Consolidation), 168
equivalence number, 415
evaluations
order/project results analysis, 420
results analysis, 424
results analysis data, 424
event (reference model), 415
event (workflow management), 415
event driven process chain
(EPC), 415
Excel reports (Consolidation), 181
exchange differences (currency), 35
exchange rates (Accounts Receivable), 71
executing (projects), 290
Executive Information System (CO functions), 436
expenses (intercompany accounting), 31
extended binary-coded decimal interchange code (EBCDIC), 415
extended General Ledger, 20
chart of accounts, 20
account classes, 21
external accounting (Capital Investment measures), 371
external accounts, 4
external activities, 415
extracts (Accounts Receivable), 86
F
fair value adjustment (investment Consolidation), 178
FI functions
Consolidation, 436
integrating with CO, 435
Special Purpose Ledger, 436
FI-AA Asset-Accounting module, see Asset Accounting
FI-AM Assets Management, see Assets Management
FI-AP Accounts Payable, see Accounts Payable
FI-AR Accounts Receivable, see Accounts Receivable
FI-Financial Accounting see Financial Accounting
FI-GL General Ledger, see General Ledger
FI-IM Investment Management, see Investment Management
FI-LC Legal Consolidation module, see Consolidation
FICO education and training, 390
adult learners, 396
benefits, 396
business impact, 392
expected benefits, 396
in-house courses, 394
key message, 392
learning zones, 390
application skills, 390
information skills, 391
management skills, 391
technical skills, 390
management skills, 392
SAP courses, 393
training plan, 395
user attitudes, 391
see also training
fields
data element of a field, 414
user-defined, 427
final settlement (Capital Investment measures), 370
finance view (projects), 269
Financial Accounting, 25, 354
cash management, 334
consultant one, 430
cash budgeting, 432
cash management, 432
Chart of Depreciation, 432
CO module, 433
fixed assets, 432
General Ledger, 431
organizational structures, 431
subledgers, 431
controlling, 206
General Ledger, 26
Financial Calendar, 60
financial document interfaces (General Ledger), 52
Financial Information System (FIS), 53
assets, 144
balance sheets (analyzing), 53
Financial Investments (Investment Management), 354
financial statements
Consolidation, 152
interim periodic, 160
General Ledger, 50
financing, 11
firewalls, 380
fiscal year (asset accounting period), 128
fixed assets, 112, 361
acquiring, 135
Asset Accounting, 137
investments, 136
periodic depreciation posting, 137
plant maintenance, 136
procedures, 136
purchasing, 136
classes, 112
Consolidation (intercompany transfers), 177
Consolidation (subsidiary), 170
depreciation
periodic depreciation posting, 137
write-ups, 137
Financial Accounting, 432
reporting
alternate reports, 147
customizing reports, 147
history, 146
history sheets, 145
manipulating reports, 147
selection tree, 145
year-end, 145
retiring, 138
customers, 138
mass retirements, 138
transfers to affiliates, 139
value transfers, 139
special transactions, 143
investments, 143
leased, 144
post-capitalization corrections, 144
reserves, 144
subnumbers, 143
subsequent acquisitions, 143
fixed cost absorption accounting (profitability), 305
fixed prices (projects), 297
flat-rate budgets (capital investments), 362
flat-rate investment procedure, 361
float, 415
floats (projects), 282
follow-up costs, 415
forecasting
cash, 342
Consolidation, 158
depreciation (Capital Investment program), 359
Profitability Analysis module (proportional rate), 324
foreign currencies (depreciation), 129
foreign exchange (Treasury module), 333
foreign key, 415
forward scheduling, 415
free float, 416
FS Items Catalog (master records), 165
function module, 416
function-oriented cost accounting, 416
functional areas (Profitability Analysis module), 307
functional controlling, 195
functional courses (training), 401
functions
Accounts Payable, 91
CO (Executive Information System), 436
earned value analysis, 294
FI
Consolidation, 436
Special Purpose Ledger, 436
Profitability Analysis, 312
special purpose ledger, 55-57
funds
budgets (availability), 344
project budgets, 289
funds management, 12
Funds Management module, 345
availability control, 347
budgets
monitoring, 348
planning, 348
updates, 347
utilization history, 348
Industry Solution for Insurance and Real Estate, 349
Industry Solutions, 348
Investment Management module, 349
preliminary budgets, 347
special funds, 348
G
GAAP
Accounts Payable, 91
certificates of compliance, 381
general costs activity, 416
General Ledger, 18
Accounts Receivable, 64
areas, 23
chart of accounts, 23
company codes, 23
balance sheet, 28, 51
chart of accounts, 24
common chart of accounts, 29
closing
operational structure, 51
subledgers, 46
closings (year-end), 36
controlling, 206
currencies (parallel), 129
currency, 34
daily closings, 35
extended (chart of accounts), 20
Financial Accounting, 431
Financial Accounting Application, 26
financial document interfaces, 52
Financial Information System (FIS), 53
financial statements, 50
functions, 28
languages, 33
master data, 24
checking, 25
monetary values, 37
monthly closings, 35
numerical values, 37
posting, 44
data entry, 46
subledgers, 45
profit and loss, 28, 51
profitability, 27
reporting, 47
output, 49
Report Painter, 48
Report Writer, 48
standard reports, 47
rules, 35
special, 28
special purpose ledger, 37-38
actions, 40
allocation, 57
centralized planning, 43
comparing ledgers, 56
decentralized planning, 43
distribution, 41, 57
distribution keys, 59
functions, 55-57
inflow, 40
interface, 57
planning, 39, 58
planning parameters, 59
reporting, 60
scope, 59
set concept, 42, 58
subledgers, 27
transaction data, 26
transaction log, 19
transactions, 18
year-end (closing), 28
year-end results (anticipating), 26
Generally Accepted Accounting Principles (GAAP), 376
goodwill (investment Consolidation), 178
graphical user interface (GUI), 416
graphics (project analysis), 302
gross operating profits (Profitability Analysis module), 323
group assets (classes), 112
group valuation, depreciation (special valuation), 125
group-wide planning (Consolidation), 154
groups (transferring data), 171
guarantees, Accounts Receivable (special transactions), 80
GUI (graphical user interface), 416
H
head office (company codes), 32
head office accounts
Accounts Receivable, 68
vendors (Accounts Payable), 95
hierarchies
assets, 109
cost objects, 244, 413
product-related, 246
responsibility-related, 246
standard, 426
history sheets (assets), 113
reporting, 145-146
hypertext, 416
I
IAC (Internet Application Component), 379
identifying (assets), 110
IDES (International Demonstration and Education System), 377
IDOC (intermediate document), 416
IM-Investment Management, 13
IM-FA Tangible Fixed Assets, see Tangible Fixed Assets
IM-FI Financial Investments, see Financial Investments
IMG (implementation guide), 416
imminent losses (reserves), 424
implementation
Business Engineer, 387
training completed, 400
implementation guide (IMG), 416
implementing software (avoiding mistakes), 3
imputed costs, 416
accruals (cost elements), 200
calculation objects, 201
surcharges, 200
target = actual procedure, 201
imputed interest, depreciation (special valuation), 124
in-house courses (FICO education and training), 394
indexing (matchcode), 417
indirect allocation of costs, 250
indirect costs, 416
product costs, 235
individual, depreciation (special valuation), 126
industries (cost objects), 233
Industry Solution for Insurance and Real Estate Management, 349
Industry Solutions, 348
information, accessing, 380
information skills (FICO education and training), 391
initial cost split, 416
insurance depreciation (special valuation), 124
Integrated Asset Accounting module, 135
integrating
cost center planning with other plans, 216
FI and CO, 435
interactive reports (Consolidation), 158
intercompany accounting
expenses and revenues, 31
purchases, 32
intercompany payments
Accounts Payable, 103
chart of accounts, 33
eliminating, 33
intercompany sales (Accounts Receivable), 66
interest tables, 368
interface (special purpose ledger), 57
interfaces
Consolidation, 153
financial documents (General Ledger), 52
interim periodic financial statements (Consolidation), 160
interim reports (profitability), 305
interim statements (Consolidation), 183
intermediate document (IDOC), 416
internal accounting
allocation methods, 247
Capital Investment measures, 370
internal activities (Capital Investment measures), 368
internal controlling (account classes), 22
internal order accounting, 253
asset accounting, 255
internal orders
CO module, 434
cost center planning, 219
international management (assets), 148
international taxation, 29
Internet (business opportunities), 374
Internet Application Component (IAC), 379
investment management, 13
inventory, 416
Consolidation (reclassifying profits as), 176
costing, 224
investment centers (Profitability Analysis), 309
Investment Management, 354
components, 355
Financial Investments, 354
installing components, 355
Tangible Fixed Assets, 354
Treasury, 355
Investment Management module, 349
investment support (Capital Investment measures), 369
investments, 352
ALE (Application Link Enabling), 353
AuC (Assets under Construction), 141
Capital Investment
AuC data object, 365
budgeting, 365
cost planning, 365
flat-rate investment procedure, 361
order functions, 365
PSP (Project Structure Plan), 364-365
Capital Investment measure (capitalization structure), 361
Capital Investment program, 355, 359
budget, 359, 360
cost planning, 358
depreciation forecast, 359
EIS (Executive Information System), 360
measures, 357
positions, 356
Research reporting tool, 360
common-sense measures, 352
Consolidation, 178
automatic, 178
fair value adjustment, 178
goodwill, 178
preparation, 157
depreciation (special valuation), 123
simulating, 132
Financial Accounting, 354
fixed assets
special transactions, 143
fixed assets (acquiring), 136
flat-rate
budgets, 362
Investment procedure, 361
interest tables, 368
managing, 352-353
multinational companies, 353
organizing data, 355
proposals (analyzing), 357
values (planned, budgeted, distributed), 358
invoices
Accounts Payable
manual entry, 96
scanning, 96
vendors, 95
Accounts Receivable, 70
dunning, 82
itemization (product costs), 236
iteration (cost center planning), 219
J–K
Java Virtual Machine, 378
job order
controlling, 196
cost accounting, 417
kerberos, 417
key figure reports (balance sheets), 53
key figures
controlling, 214
Profitability Analysis module, 318
reports (Consolidation), 182
key message, FICO education and training, 392
L
languages (General Ledger), 33
launching (training program), 398
application skills, 390
information skills, 391
learning zones (FICO), 390
management skills, 391
technical skills, 390
leased assets (special transactions), 144
ledger-based period accounting (Profitability Analysis module), 326
structure, 327
ledgers
comparing, 56
reconciliation (cost elements), 201
reconciliation, 8
special purpose, 9
subsidiary, 4
letters
Accounts Receivable, 85
dunning (Accounts Receivable), 83
levels (dunning), 82
library networks, 417
limiting (credit), 88
line items
Accounts Receivable, 80
assets, 113
reports (projects), 299
line-item, 417
liquidity, 336
analyzing, 337
liquidity forecast function (Cash Management), 333
locks (enqueue service), 415
logical databases, 417
logical system, 417
logical unit of work (LUW), 417
logs (Activity Logs), 409
loops, 417
losses (realized), 423
lot-size variance, 417
LU6.2, 417
LUW (logical unit of work), 417
M
mainframes (LU6.2), 417
maintenance (depreciation area assets), 122
maintenance levels (assets master records), 115
make-to-order costing, 225
make-to-order production, 417
make-to-stock costing, 225
management (project), 423
management accounting, see controlling
management consolidation, 162
management skills (FICO education and training), 391
managerial leadership (FICO education and training), 392
managing assets internationally, 148
manual input (unit costing), 237
manufacturing
co-products, 411
process, 422
production cycles, 422
repetitive, 424
manufacturing view (projects), 267
MAPI (messaging application programming interface), 417
margin analysis (Profitability Analysis module), 324
Marginal Costing, 10
marginal costs (controlling), 191
Market Risk Management module, 341
cash plan, 342
mass change procedure (assets master records), 116
mass retirements (fixed assets), 138
master data, 417
Accounts Receivable, 65
General Ledger, 24-25
master records
assets, 113
accounting, 361
archiving portfolios, 116
classes, 111-112
elements, 114
maintenance levels, 115
mass change procedure, 116
numbering, 115
parameters, 115
portfolios, 116
screens, 114
substitution conditions, 115
time-dependent data, 115
validation conditions, 115
viewing, 115
workflow, 116
Consolidation, 164
business areas, 164
FS Items Catalog, 165
statistical lines, 166
orders (data formats), 256
vendors (Accounts Payable), 92-93
master sheets (credit), 89
matchcode, 417
material requirements planning, 417
material types, 418
Materials Management
availability checking, 287
view (projects), 268
measures (Capital Investment), 357, 364
allocating activity costs, 367
cost centers, 367
cost elements, 366
external accounting, 371
final settlement, 370
internal accounting, 370
internal activities, 368
investment support, 369
overhead, 367
posting down payments, 368
settlement functions, 369
measuring point, 418
menu painter, 418
messaging application programming interface (MAPI), 417
metadata, 418
milestones (project structures networks), 279
MM-Materials Management module
availability checking, 287
view (projects), 268
mode, 418
models (SAP International Development), 381
modified standard cost estimate, 418
module dialog, 414
modules
Accounts Payable, 64, 90
Accounts Receivable, 64
account processing, 80
correspondence, 84-86
customer transactions (automatic banking), 76
customer credit, 87-89
customer master record, 65-68
customer transactions, 69-71, 75-76
document processing, 80-81
dunning, 82-84
General Ledger, 64
line items, 80
reporting, 86
special transactions, 77-80
CCA-Cost Center Accounting, 209
CO-Controlling
cash budgets (financial accounting), 433
cost centers, 433
internal orders, 434
overhead costs, 433
profit analysis, 435
profit center accounting, 435
profitability, 434
CO-ABC Activity-Based Cost Accounting, 248
Consolidation, 152
function module, 416
Integrated Asset Accounting, 135
MM-Materials Management module, 287
Order and Project Accounting, 253
Profit Center Accounting (CO-PCA), 434
Profitability Analysis (CO-PA), 304, 434
business areas, 307
charts of accounts, 306
companies, 307
company codes, 307
cost accounting, 308
fixed cost absorption accounting, 305
functional areas, 307
interim reports, 305
profit sources, 306
PS-Project System, 264
monetary values (General Ledger), 37
monitoring budgets (Funds Management module), 348
monitoring credit, 88
monthly closings (General Ledger), 35
moving average price, 418
multinational accounting (Accounts Payable), 102
multinational companies (investments), 353
multinational management (assets), 148
N
Native SQL, 408
net asset depreciation area (assets), 121
net operating profit (proportional rate), 324
net posting (Accounts Payable), 99
network types, 418
networks, 418
backward scheduling, 409
forward scheduling, 415
library, 417
overall, 420
project structures, 278
activity relationships, 278
milestones, 279
production resources, 280
types, 279
scheduling, 425
workflow, 377
numbering (assets master records), 115
numerical values (General Ledger), 37
O
object classes (Profitability Analysis), 312
object currency, 418
object linking and embedding
(ODBC), 419
(OLE), 419
object overview, 418
objects
business, 385
preparing for the future, 386
updating, 386
Business Object Repository (BOR), 386
summarization, 426
ODBC (object linking and embedding), 419
OLE (object linking and embedding), 419
one-time accounts
Accounts Receivable, 68
vendors (Accounts Payable), 94
one-time revaluation, depreciation (special valuation), 124
online hypertext, 416
Open FI, 374
Auditor workstation, 376
components, 375
workflow sequences, 376
open information warehouse, 382
data mining, 383
patterns, 384
data sources, 382
Document Management System, 383
master data objects, 383
open items, 419
Accounts Payable, 98
AuC (Assets under Construction), 140
commitment items, 411
planning, 259
updating, 362
Open SQL, 408
operating concerns, 419
Profitability Analysis, 312
operating levels, 419
operating profit (Profitability Analysis module)
gross, 323
net, 324
operating rates, 419
operating resources, 419
operational areas, 419
operational controlling, 195
operational structure (General Ledger), 51
operations layout, 419
options (Consolidation), 161
Order and Project Accounting module, 253
order category, 419
order costing, 227
order functions (Capital Investment), 365
order group, 419
order hierarchy, 419
order phase, 419
order settlement, 420
order status, 420
order summarizations, 420
order types, 420
Profitability Analysis, 310
order/project results analysis, 420
orders, 8, 419
allocation receiver, 409
AuC (Assets under Construction), 141
classifying, 257
contingency order, 411
cost center planning, 219
data formats, 256
internal order accounting, 253
asset accounting, 255
internal orders (CO module), 434
planning, 258
projects, 292
settling, 260
settlement rules, 261
status (schedules), 257
summary evaluations, 262
work orders, 428
organizational structures (Financial Accounting), 431
organizing investment data, 355
output reports (General Ledger), 49
overall networks, 420
overhead, 420
Capital Investment measures, 367
costing surcharges as, 293
overhead cost management, 420
overhead costs, 420
CO module, 433
controlling, 189-190, 193
surcharges, 190
overhead group, 421
overview courses (training), 401
P
PA settlement structure, 421
parallel activities, 252
parallel costing systems (methods), 10
parallel currencies (General Ledger), 129
parallel processes (Profitability Analysis module), 313
parameters
assets master records, 115
cost elements, 198
settlement, 425
patterns (data mining), 384
payment advice notice, 333
payment behaviour (credit), 89
payment histories, 337
payment notices
Accounts Receivable, 84
payment program
Accounts Payable, 102
payment transactions
cash management, 335
payments
Accounts Payable
automatic, 100
proposals, 101
electronic banking, 335
vendors (Accounts Payable), 95
WBS (actual), 292
performing consolidations, 167
Period Accounting, 11, 421
period clearing (controlling), 215
period closing (controlling), 215
period-end closing (cost objects)
order-related, 238
sales-order-related, 239
periodic depreciation posting, 137
periodic processing (projects), 293
personal computers (transferring data), 171
personnel projects (planning), 286
plan versions, 421
planned activity, 421
planned amounts (General Ledger), 42
planned delivery time, 421
planner profiles (cost center planning), 217
planning, 421
activity-based costs, 249
board, 281
budgets, 288
budget management support, 289
funds, 289
Funds Management module, 348
Capital Investment, 365
Capital Investment program
costs, 358
depreciation, 359
Consolidation
group-wide, 154
controlling, 207, 213
cost accounting, 248
cost drivers, 252
indirect allocation of costs, 250
parallel, 252
process cost rates, 253
subprocesses, 253
variances, 250-251
cost centers, 215
authorization, 218
budgets, 221
centralized, 217
customized scheme, 219
data transfer, 218
decentralized, 217
dependencies, 220
integrating with other plans, 216
internal orders, 219
iteration, 219
planner profiles, 217
revaluing, 218
secondary costs, 220
cost elements, 412
costing, 231
costs
classifying orders, 257
cost accounting transactions, 260
costing lot sizes, 235
indirect costs, 235
itemization, 236
key dates, 236
manual input, 237
open items, 259
order data formats, 256
order status, 257
order summary evaluations, 262
planning orders, 258
production, 235
products, 234
schedules, 256
settlement rules, 261
settling orders, 260
stock variant, 235
target costing, 235
transfer options, 234
materials management, 287
availability checking, 287
orders, 258
production capacity, 410
Profitability Analysis (profits), 319
Profitability Analysis module, 315
multiple planning versions, 321
sales quantities, 319
projects, 265, 281
calendars, 281
capacity, 285
capacity leveling, 285
cost planning, 283
dynamic agents, 266
floats, 282
network schedules, 282
personnel, 286
planning board, 281
resources, 265
schedules, 282
simulating depreciation, 130
software integration, 207
special purpose ledger (General Ledger), 39, 58
centralized, 43
decentralized, 43
planning data (parallel costing systems), 10
planning document, 421
planning element, 421
planning parameters (special purpose ledger), 59
plant maintenance (fixed assets), 136
political prices (cost accounting), 249
pooled tables, 421
portfolios
assets, archiving, 116
graphics (project analysis), 302
positions (Capital Investment program), 356
posting
Consolidation (adjusting balance sheets), 174
cost elements, 199
General Ledger, 44
data entry, 46
subledgers, 45
pre-investment analysis, 358
preliminary budgets (Funds Management module), 347
preliminary costing (cost objects), 237
preparation
Consolidation, 155
currency translation, 156
eliminating balances, 156
forecasting, 158
investments, 157
simulating, 158
standardizing entries, 156
preparing accounts (Consolidation), 153
previewing simulated depreciation, 131
prices
difference accounts, 421
projects (subprojects), 297
standard, 426
subprojects, 297
variances, 421
cost elements, 201
primary cost elements, 197
primary cost planning, 421
primary costs, 421
procedures
cost accounting, 190
RPC (Remote Procedure Call), 425
process cost rates (activities), 253
process manufacturing, 422
processes
Profitability Analysis, 312
account based, 313
contribution margin accounting, 313
cost-of-sales, 314
parallel, 313
relative direct cost, 313
processing
accounts (Accounts Receivable), 80
documents (Accounts Receivable), 80
changing documents, 81
master data (Accounts Receivable), 67
product cost accounting, 232
product costing, 422
product-related hierarchy, 246
production
capacity, 410
costs, total, 235, 422
cycles, 422
facilities, improving time-to-market, 377
make-to-order, 417
order costing, 224
orders, 422
resources and tools, 422
schedules (material requirements planning), 417
variance
categories, 241
cost objects, 241
results, 242
settlement, 243
target costs, 242
products
co-products, 411
cost accounting (cost component layout), 412
costing, 234
costing lot sizes, 235
indirect costs, 235
key dates, 236
production, 235
stock variant, 235
target, 235
transfer options, 234
profitability, 224
profiles (planner), 217
profit and loss
Consolidation (eliminating intercompany), 175
General Ledger, 28, 51
profit center accounting
CO module, 435
Profitability Analysis module, 326
ledger-based period accounting, 326-327
Profit Center Accounting (CO-PCA) module, 434
profit centers, 422
Client, 6
Profitability Analysis, 309
profit controlling, 202
profit orders, 422
profit percentage rate, 422
profit sources
Profitability Analysis module, 306
business areas, 307
charts of accounts, 306
companies, 307
company codes, 307
functional areas, 307
profitability analysis, 422
settlement structure, 421
business segments, 410
CO module, 434
General Ledger, 27
products, 224
Profitability Analysis (CO-PA) module, 304, 434
analyzing data, 325
classes, 322
cost accounting, 308
activity types, 309
business processes, 311
controlling areas, 308
cost centers, 309
cost elements, 309
cost objects, 311
investment centers, 309
object classes, 312
operating concerns, 312
order types, 310
profit centers, 309
projects, 310
revenue elements, 309
WBS (Work Breakdown Structure), 311
data volume, 325
fixed cost absorption accounting, 305
forecasting, 324
functions, 312
gross operating profits, 323
interim reports, 305
margin analysis, 324
net operating profit, 324
planning
profits, 319
sales quantities, 319
processes, 312
account based, 313
contribution margin accounting, 313
cost-of-sales, 314
parallel, 313
relative direct cost, 313
profit center accounting, 326
ledger-based period accounting, 326, 327
profit sources, 306
business areas, 307
charts of accounts, 306
companies, 307
company codes, 307
functional areas, 307
profitability segments, 314
ALE (Application Link Enabling), 316
classification characteristics, 317
data flow, 315
key features, 318
planning, 315
reporting, 316
reports, 325
revenue element accounting, 320
cost of sales, 321
elements, 320
multiple planning versions, 321
sales promotions, 322
valuation by proportional rate, 323
profitability segments, 204
key figures, 318
Profitability Analysis, 314
ALE (Application Link Enabling), 316
classification characteristics, 317
data flow, 315
planning, 315
reporting, 316
profitability view (projects), 271
profits
capitalized, 411
controlling (profitability analysis), 191
Profitability Analysis module
planning, 319, 320
programming
Reference Model, 386
UML (Unified Modeling Language), 386
programming languages (compilers), 411
project definition, 422
project information system, 298
accessing information, 301
graphics, 302
reports, 299
cost element, 299
line item, 299
structure, 299
summarization, 300
Structure/Dates view, 300
project management, 423
project structures, 423
project system (relationship), 423
project type, 423
projects, 8, 264
activities
actual costs, 291
actual dates, 291
actual payments, 292
actual revenues, 292
confirmation, 290
balance sheets
comparing costs and revenues, 296
billing, 296
resource-related, 297
budgets, 288
management support, 289
closing, 266
controlling, 196
defining, 276
earned value analysis, 294
executing, 290
funds, 289
orders, 292
periodic processing, 293
planning, 265, 281
calendars, 281
capacity, 285
capacity leveling, 285
cost planning, 283
dynamic agents, 266
floats, 282
network schedules, 282
personnel, 286
planning board, 281
resources, 265
schedules, 282
Profitability Analysis, 310
project information system, 298
accessing information, 301
cost element reports, 299
graphics, 302
line item reports, 299
reports, 299
structure reports, 299
Structure/Dates view, 300
summarization reports, 300
PS-Project System, 273
R/3 Basis system, 272
R/3 Reference Model, 273
releases, 290
reporting, 298
cost element reports, 299
line item reports, 299
reports, 299
statistics, 300
structure reports, 299
Structure/Dates view, 300
summarization reports, 300
resource availability, 280
results analysis, 295
settlements, 296
structures
associating, 275-277
networks, 278, 279
production resources, 280
WBS, 277
subproject
prices, 297
views, 298
supervising, 266
surcharges (costing as overhead), 293
valuation (periodic processing), 293
views, 267
capital investment, 270
controlling, 269
enterprise controlling, 272
finance, 269
manufacturing, 267
materials management, 268
profitability, 271
sales, 267
WBS (Work Breakdown Structure), 8
proportional Consolidation, 168
proposals
investments (analyzing), 357
payment, 101
proportional valuation (Profitability Analysis module), 323
prospects of revenue, accounting for, 11
PS-Project System, 273
PSP (Project Structure Plan), 364-365
public accounting (budgets), 343
public funds (budgets), 345
purchase method (Consolidation), 168
purchases (intercompany accounting), 32
purchasing (fixed assets), 136
Q
Q-API (queue application program interface), 423
quantity accounting (allocation methods), 248
quantity structure, 423
quantity variance, 423
Query, 408
queue application program interface (Q-API), 423
R
R/3 applications (controlling), 209
R/3 Audit Information System, 376
R/3 Basis system, 272
R/3 line-item settlement, 359
R/3 PS-Project System module, 264
R/3 Reference Model, 273
R/3 Workflow Wizards, 377
rate of capacity utilization, 423
ratio analysis (Consolidation), 159
realized losses, 423
receipt principle (assets), 108
reclassifying (Consolidation)
profits as inventory, 176
sales as capitalized assets, 176
reconciliation ledgers, 8, 201
recording costs, 6
records
asset accounting, 361
see also master records
recurring entries
Accounts Payable, 97
Accounts Receivable, 69
reference dates, 423
Reference Model, 386, 415
relationship (project system), 423
relative direct cost (Profitability Analysis module), 313
releases (projects), 290
remote function call (RFC), 425
delta management, 414
Remote Procedure Call (RPC), 425
repetitive manufacturing, 424
replacement value, depreciation (special valuation), 123
Report Painter (General Ledger), 48
Report Writer (General Ledger), 48
reporting
Accounts Receivable, 86
assets, 113, 144
alternate reports, 147
customizing reports, 147
history, 146
history sheets, 145
manipulating reports, 147
selection tree, 145
year-end, 145
Consolidation, 158
auditing, 161
Auditor Workstation, 161
customized reports, 158
interactive, 158
interim periodic financial statements, 160
options, 161
ratio analysis, 159
subgroups, 169
validation, 161
controlling, 208
cost elements, 199
costing, 231
General Ledger, 47
output, 49
Report Painter, 48
Report Writer, 48
standard reports, 47
Profitability Analysis module, 316
projects, 298
cost element reports, 299
line item reports, 299
reports, 299
statistics, 300
structure reports, 299
Structure/Dates view, 300
summarization reports, 300
Query, 408
special purpose ledger, 60
Treasury Management, 340
reporting tree
Consolidation, 179
customizing reports, 180
drill-down, 182
Excel, 181
interim statements, 183
key figures, 182
simulating, 184
reporting valuation depreciation area (assets), 121
reports (Profitability Analysis module), 325
Repository
ABAP/4, 408
Active SAP R/3, 408
Information System, 408
Research reporting tool (Capital Investment program), 360
reserves
assets (depreciation), 119
fixed assets (special transactions), 144
reserves for costs of complaints and sales deductions, 424
reserves for imminent losses, 424
reserves for unrealized costs, 424
resource-usage variances, 424
resources (projects), 265-267
availability, 280
billing, 297
resources and tools (production), 422
responsibility-related hierarchy, 246
results (costing a cost object), 229
results (variance categories), 242
results analysis, 424
data, 424
key, 424
projects, 295
version, 425
retiring (fixed assets), 138
customers, 138
mass retirements, 138
transfers to affiliates, 139
value transfers, 139
revaluation method (Consolidation), 168
revaluing (cost center planning), 218
revenue, 425
balance sheets (comparing with costs), 296
calculated, 410
intercompany accounting, 31
inventory, 416
WBS (actual), 292
revenue element accounting (Profitability Analysis module), 309, 320
cost of sales, 321
multiple versions, 321
sales promotions, 322
reverse documents (Accounts Payable), 104
RFC (remote function call), 425
routines (style guides), 426
RPC (Remote Procedure Call), 425
rules
currencies (depreciation), 129
General Ledger, 35
S
sales
Accounts Payable (clearing), 104
cost-of-sales accounting, 413
sales promotions (revenue element accounting), 322
sales quantities (planning), 319
sales view (projects), 267
SAP courses (FICO education and training), 393
SAP International Development, 381
SAPoffice email system, 387
SAPscript (Accounts Payable), 104
scanning invoices, 96
schedules
costs (planning), 256
projects, 282
network, 282
training, 399
scheduling
backward, 409
float, 415
forward, 415
networks, 425
scope (special purpose ledger), 59
scrap values (calculating depreciation), 127
Screen Painter, 425
screens (assets master records) 3, 114
searching
open items (Accounts Receivable), 72
data mining, 383
open information warehouse, 383
patterns, 384
secondary costs, 198, 425
planning, 220
security, 380
firewalls, 380
SET (Secure Electronic Transaction), 380
time stamping documents, 3
transactions, 3
security deposits (special transactions), 79
segments, profitability (controlling), 204
selection tree (asset reporting), 145
SET (Secure Electronic Transaction), 380
set concept (special purpose ledger), 58
settlement
costing, 243
orders, 260, 262
parameters, 425
projects, 296
rules, 261
settlement functions (Capital Investment measures), 369
sharing tools (Treasury Management), 340
simulating
Consolidation, 158
cost accounting, 248
costing, 231
depreciation, 130
displaying calculation, 133
displaying values, 132
planned investments, 132
previewing accounts, 131
special valuation, 125
transactions, 132
reports (Consolidation), 184
simultaneous
Consolidation, 168
cost objects, 238
costing process, 425
software
Consolidation, 155
design (avoiding mistakes), 3
integration (planning), 207
see also applications
special funds (Funds Management module), 348
special General Ledger, 28
special ledgers (Consolidation), 163
special purpose ledger, 9
allocation, 57
comparing ledgers, 56
decentralized planning, 43
distribution, 57
distribution keys, 59
functions, 55-57, 436
General Ledger, 37-38
actions, 40
centralized planning, 43
distribution, 41
inflow data, 40
planning, 39
set concept, 42
interface, 57
planning, 58
planning parameters, 59
reporting, 60
scope, 59
set concept, 58
special transactions
Accounts Receivable, 77
bills of exchange, 78
discounting (bills of exchange), 79
down payments, 77
guarantees, 80
security deposits, 79
fixed assets, 143
investments, 143
leased, 144
post-capitalization corrections, 144
reserves, 144
subnumbers, 143
subsequent acquisitions, 143
see also transactions
special valuation (depreciation of assets), 123
backlog, 124
group valuation, 125
imputed interest, 124
individual, 126
insurance, 124
investments, 123
one-time revaluation, 124
replacement value, 123
simulated, 125
tax-based, 125
spooling, 425
SQL (Structure Query Language), 426
Native, 408
Open, 408
standard cost accounting, 10
standard cost estimate, 426
standard depreciation, 127
standard hierarchies, 426
standard prices, 426
standard reports (General Ledger), 47
statements (company code), 411
static costing (controlling), 190
statistical lines (master records), 166
statistics (project reporting), 300
step consolidation, 162, 168
stock (product costs), 235
strategies (training), 398
defining user competency, 399
final implementation, 400
identifying job roles and expertise, 398
ongoing support, 400
schedules, 399
selecting trainers, 399
structure reports (projects), 299
Structure/Dates view, reports (projects), 300
structures (projects)
associating, 275, 277
networks, 278, 279
production resources, 280
style guides, 426
subgroups (Consolidation reporting), 169
subledgers
Financial Accounting, 431
General Ledger, 27
closing, 46
posting, 45
subnumbers (special transactions), 143
subprocesses (activities), 253
subprojects (views), 298
subsidiary ledger, 4
subsidiary level Consolidation, 169
fixed assets, 170
intercompany posting transactions, 169
valuation areas, 170
substitution conditions (assets master records), 115
summaries (orders), 420
summarization
objects, 426
reports (projects), 300
summary evaluations (orders), 262
super-numbers (assets), 112
supervising projects, 266
support
training (ongoing), 400
workshops, post-implementation support, 404
see also education
surcharges, 426
controlling, 190
calculating, 213
cost objects, 240
imputed costs, 200
projects (costing as overhead), 293
T
tables
cardinality, 411
domain, 415
entity relationship model, 415
foreign-key, 415
logical database, 417
pooled, 421
Tangible Fixed Assets, 354
target = actual procedure (imputed costs), 201
target costs, 235, 246
calculating, 242
target marketing, 375
task list types, 426
tax depreciation area (assets), 118, 120
tax-based depreciation (special valuation), 125
taxation
country-specific, 30
international, 29
TCP/IP, 426
technical skills (FICO education and training), 390
templates (workflow), 377
third-party applications, 387
time float
activities, 426
free, 416
time intervals (activities), 426
time stamping documents, 3
time-dependent data (assets master records), 115
time-to-market, 377
TR-CM Treasury-Cash Management, 12
TR-FM Treasury-Funds Management, 12
TR-TM Treasury-Treasury Management, 12
TR-Treasury, 332, 355
cash accounts, 334
cash management, 332
financial accounting, 334
functions, 333
manually entering data, 335
procedures, 333
clearing accounts, 334
automatically, 336
electronic banking, 335
foreign exchange, 333
see also treasury
tracking, 338
trading partners (Consolidation), 155
ID codes, 175
training, 397
demonstrations, 403
FICO education and training, 390, 395
functional courses, 401
identifying job roles and expertise, 398
launching, 398
ongoing support, 400
overall environment, 397
overview courses, 401
strategies, 398
defining user competency, 399
implementation, 400
schedules, 399
selecting trainers, 399
walk-throughs, 403
workshops, 402
post-implementation support, 404
software implementation, 404
transaction log, 19
transaction security, 3
transactions, 18, 426
Accounts Payable, 92, 95
account assignment models, 97
automatic payment, 100
cash discounts, 101
check management, 104
checks, 97
clearing sales, 104
control totals, 97
credit memos, 100
data media, 104
debit memos, 100
down payments, 100
EDI, 96
intercompany payments, 103
invoices, 95-96
multinational accounting, 102
net posting, 99
open items, 98
payment program, 102
payment proposals, 101
preliminary documents, 98
recurring entries, 97
reverse documents, 104
SAPscript, 104
searching open items, 72
Accounts Receivable, 69
advice notes, 75
automatic banking, 76
currencies, 70
debit memos, 76
exchange rates, 71
invoices, 70
manual check deposit, 76
partial payments, 75
payments, 71
recurring entries, 69
special, 77
assets, 134
account allocation, 134
collective, 135
types of transaction, 134
business, 410
Consolidation (intercompany posting), 169
controlling, 204
cost accounting, 260
currency, 426
depreciation (simulating), 132
General Ledger, calling up data, 26
payment (cash management), 335
payment histories, 337
reconciliation ledgers, 8
see also special transactions
transfer options (product costs), 234
transferring (fixed assets), 177
transferring data
Consolidation, 170
groups, 171
personal computers, 171
validation, 172
controlling, 215
cost center planning, 218
transferring reserves (depreciation), 119
transfers (fixed assets)
affiliates, 139
value, 139
treasury, 11
budgets, 343
available funds, 344
decentralized funds, 343
public accounting, 343
public funds, 345
targets, 344
credit limits, 337
Financial Controlling module, 343
Funds Management module, 345
availability control, 347
budget history, 348
budget monitoring, 348
budget planning, 348
budget updates, 347
Investment Management module, 349
preliminary budgets, 347
special funds, 348
liquidity, 336
management, 12
Market Risk Management module, 341
annual cash plan, 342
cash plan, 342
payment histories, 337
planning, 12
TR-TM Treasury-Treasury Management, 12
tracking items, 338
Treasury Management, 338
Treasury Data Feed component, 340
Treasury Management module, 338
reporting, 340
sharing tools, 340
Treasury Data Feed component, 340
Treasury module, 332
cash accounts, 334
cash management, 332
financial accounting, 334
functions, 333
manually entering data, 335
payment transactions, 335
procedures, 333
clearing accounts, 334
automatically, 336
electronic banking, 335
foreign exchange, 333
Investment Management, 355
types of companies (Consolidation), 166
U
UML (Unified Modeling Language), 386
unit costing, 226, 427
unplanned asset depreciation, 118
unrealized costs (reserves), 424
updating
budgets (Funds Management module), 347
business objects, 386
open items, 362
usage (calculating depreciation), 128
usage variance, 427
user attitudes (FICO education and training), 391
user authorizations (kerberos), 417
user exit, 427
user-defined fields, 427
user-specific keys (calculating depreciation), 126
utilization history (budgets), 348
V
validation (Consolidation), 161
transferring data, 172
validation conditions (assets master records) 3, 115
valuation
areas, Consolidation (subsidiary), 170
costing, 230
dates, 427
methods (costing), 230
Profitability Analysis module (proportional rate), 323
projects periodic, 293
techniques (assets), 117
variant, 427
value-chain management, 377
values
depreciation (displaying), 132
investments, 358
variance
categories, 427
charging, 251
costs (actual and planned), 250
key, 427
usage, 427
version, 427
volume, 428
variants
costing, 413
valuation, 427
vendor payments (chart of accounts), 32
vendors (Accounts Payable), 91
branch accounts, 95
head office accounts, 95
invoices, 95
master records, 92, 93
one-time accounts, 94
payments, 95
Venn diagrams (portfolio graphics), 302
viewing
assets master records, 115
calculation (simulated depreciation), 133
values (simulated depreciation), 132
views, 428
projects, 267
capital investment, 270
controlling, 269
enterprise controlling, 272
finance, 269
manufacturing, 267
materials management, 268
profitability, 271
sales, 267
subprojects, 298
Structure/Dates view (projects), 300
volume variance, 428
W
walk-throughs (training), 403
WBS (Work Breakdown Structures), 8, 277, 428
actual costs, 291
actual dates, 291
actual payments, 292
actual revenues, 292
billing element, 410
elements, 428
Profitability Analysis, 311
projects (orders), 292
WfMC Workflow Management Coalition, 377
workflow (Financial Calculator), 60
work in process, 428
cost objects, 240
work orders, 428
work processes, 428
workflow
altering the system, 378
assets master records, 116
change management, 378
event, 415
IDES (International Demonstration and Education System), 377
management, 428
networks, 377
sequences, 376
templates, 377
WfMC Workflow Management Coalition, 377
workshops (training), 402
post-implementation support, 404
software implementation, 404
write-ups, fixed assets (depreciation), 137
X–Y–Z
year 2000 compliance, 381
converting third-party dates, 382
year-end
assets (reporting), 145
General Ledger
closing, 28, 36
results, 26