Adjusting for Miscoding of Indian Race on State Death ... · Prior research has consistently...
51
ADJUSTING FOR .MISCODING OF INDIAN RACE ON STATE DEATH CERIIDCATES
Transcript of Adjusting for Miscoding of Indian Race on State Death ... · Prior research has consistently...
ADJUSTING FOR
.MISCODING OF
INDIAN RACE ON
STATE DEATH
CERIIDCATES
FINAL REPORT
MeTbo3ology FOK A31usnng IHS MOKTaLzry DaTa
FOK InconsISTenT Classipcanon OF Race-ETbnzciry OF Amemcan In3zans
an3 Alaska Nanves BeTWeen STaTe DeaTb CeKnpcaTes
an3 IHS PanenT RegIS'OOlnon RecoK3s
Submzrreo ro:
Dzvzszon Of PRO(jRam Srarzsrzcs
Ofpce Of PLannzng, EvaLuarzon, ano LegzsLarzon
Inozan HeaLrh SeRvzce
NovemheR 1996
SuhmlTTeO by:
SuppoRT SeRvzces InreRnarzonaL, Inc.
STafF OF rhe D1v1swn OF PRO(j Raro Srarrsrrcs, IHS,
afreR consuLrar1on w1rh rhe srafF Of rhe D1v1swn OF VzraL Sransrzcs,
NarwnaL CenreR FOR heaLrh Srar1sr1cs, CDC, DHHS
r

ACKNOWLEDGMENTS
IHS PROJECT OFFICER
Aaron Handler, Chief, Demographic Statistics Branch Office of Planning, Evaluation, and Legislation Indian Health Service
SSI STAFF
Walter Hillabrant, Ph.D., Project Director Judy Earp, Research Associate Brian Colhoff, Research Associate Caleb Brutus, Document Specialist
CONSULTANTS
Pat Koslowe, D.Ph., Epistat William Checkley, M.Ph.
This project benefitted from the assistance of several IHS staff in addition to the Project
Officer, Aaron Handler. Anthony D 'Angelo and Linda Querec provided valuable critique and
guidance, and JoAnn Pappalardo provided assistance in using the matched IHS-NDI data
developed in Phase 1 of the project. Any errors or omissions in this report are the sole respon
sibility of SSI and in no way are the responsibility of IHS staff.
This report is made pursuant to Contract No. 282-91-0053, Delivery Order No. 11.
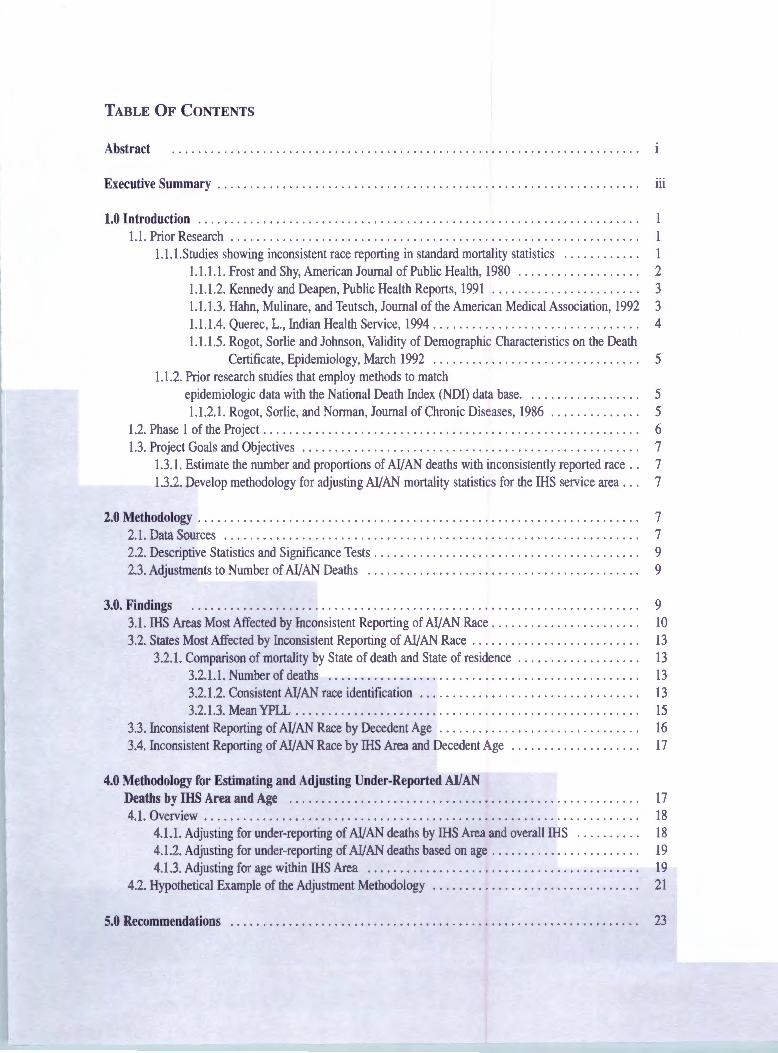
TABLE OF CONTENTS
Abstract
Executive Summary . . . . . . . . . . . . . . . . . . . . . . . . . . . . . . . . . . . . . . . . . . . . . . . . . . . . . . . . . . . . . . . . . 111
1.0 Introduction .. ............. .................... . .. .. . . .. ....................... . I. I. Prior Research .. ......................... ... ... ...... . .. . . .. . . . .. ...... .. ... .
I. I. I.Studies showing inconsistent race reporting in standard mortality statistics . . . . . . . . . . . . 1 1.1.1.1. Frost and Shy, American Journal of Public Health, I 980 . . . . . . . . . . . . . . . . . . . 2 1.1 .1.2. Kennedy and Deapen, Public Health Reports, 1991 . . . . . . . . . . . . . . . . . . . . . . . 3 1.1.1.3. Hahn, Mulinare, and Teutsch, Journal of the American Medical Association, 1992 3 1.1.1.4. Querec, L., Indian Health Service, 1994 . . . . . . . . . . . . . . . . . . . . . . . . . . . . . . . . 4 1.1.1.5. Rogot, Sorlie and Johnson, Validity of Demographic Characteristics on the Death
Certificate, Epidemiology, March I992 . . . . . . . . . . . . . . . . . . . . . . . . . . . . . . . . 5 1.1.2. Prior research studies that employ methods to match
epidemiologic data with the National Death Index (NDI) data base. . . . . . . . . . . . . . . . . . 5 1.1.2. I. Rogot, Sorlie, and Norman, Journal of Chronic Diseases, 1986 . . . . . . . . . . . . . . 5
1.2. Phase 1of the Project . . . . . . . . . . . . . . . . . . . . . . . . . . . . . . . . . . . . . . . . . . . . . . . . . . . . . . . . . . 6 1.3. Project Goals and Objectives . . . . . . . . . . . . . . . . . . . . . . . . . . . . . . . . . . . . . . . . . . . . . . . . . . . . 7
1.3.1. Estimate the number and proportions of Al/AN deaths with inconsistently reported race . . 7 1.3.2. Develop methodology for adjusting Al/AN mortality statistics for the IHS service area. . . 7
2.0 Methodology . . . . . . . . . . . . . . . . . . . . . . . . . . . . . . . . . . . . . . . . . . . . . . . . . . . . . . . . . . . . . . . . . . . . 7 2.1. Data Sources . . . . . . . . . . . . . . . . . . . . . . . . . . . . . . . . . . . . . . . . . . . . . . . . . . . . . . . . . . . . . . . . 7 2.2. Descriptive Statistics and Significance Tests . . . . . . . . . . . . . . . . . . . . . . . . . . . . . . . . . . . . . . . . . 9 2.3. Adjustments to Number of Al/AN Deaths . . . . . . . . . . . . . . . . . . . . . . . . . . . . . . . . . . . . . . . . . . 9
3.0. Findings . . . . . . . . . . . . . . . . . . . . . . . . . . . . . . . . . . . . . . . . . . . . . . . . . . . . . . . . . . . . . . . . . . . . . 9 3.1. IHS Areas Most Affected by Inconsistent Reporting of Al/AN Race. . . . . . . . . . . . . . . . . . . . . . . 10 3.2. States Most Affected by Inconsistent Reporting of Al/AN Race . . . . . . . . . . . . . . . . . . . . . . . . . . 13
3.2.1. Comparison of mortality by State of death and State of residence . . . . . . . . . . . . . . . . . . . 13 3.2.1.1. Number of deaths . .. . .. . .. . . . . .. .. . . . . .. .. . . . . . . . . . . .. . . . .. . . . . . . 13 3.2.1.2. Consistent Al/AN race identification . . . . . . . . . . . . . . . . . . . . . . . . . . . . . . . . . . 13 3.2.1.3. Mean YPLL . . . . . . . . . . . . . . . . . . . . . . . . . . . . . . . . . . . . . . . . . . . . . . . . . . . . . 15
3.3. Inconsistent Reporting of Al/AN Race by Decedent Age . . . . . . . . . . . . . . . . . . . . . . . . . . . . . . . 16 3.4. Inconsistent Reporting of Al/AN Race by IHS Area and Decedent Age . . . . . . . . . . . . . . . . . . . . 17
4.0 Methodology for Estimating and Adjusting Under-Reported AI/AN Deaths by IHS Area and Age . . . . . . . . . . . . . . . . . . . . . . . . . . . . . . . . . . . . . . . . . . . . . . . . . . . . . . 17 4. I. Overview . . . . . . . . . . . . . . . . . . . . . . . . . . . . . . . . . . . . . . . . . . . . . . . . . . . . . . . . . . . . . . . . . . . I8
4.1.1. Adjusting for under-reporting of Al/AN deaths by IHS Area and overall IHS . . . . . . . . . . 18 4.1.2. Adjusting for under-reporting of Al/AN deaths based on age............ . .... .. .. . . 19 4.1.3. Adjusting for age within IHS Area . . . . . . . . . . . . . . . . . . . . . . . . . . . . . . . . . . . . . . . . . . I9
4.2. Hypothetical Example of the Adjustment Methodology . . . . . . . . . . . . . . . . . . . . . . . . . . . . . . . . 21
5.0 Recommendations . . . . . . . . . . . . . . . . . . . . . . . . . . . . . . . . . . . . . . . . . . . . . . . . . . . . . . . . . . . . . . . 23

Appendix 1. Description of Data Eliminated from the Analyses . . . . . . . . . . . . . . . . 25
Appendix 2. Computation of IHS Area and Age Group Adjustment Factors . . . . . . . 27
Appendix 3. Computation of Adjustment Factors
for State of Residence and State of Death . . . . . . . . . . . . . . . . . . . . . . . . . . . . . . . . . 29
Appendix 4. Adjusting Reported Deaths of Males and Females by IHS Area . . . . . . 32
List of Figures and Tables . . . . . . . . . . . . . . . . . . . . . . . . . . . . . . . . . . . . . . . . . . . . . . . . . . . . . . . . . . . 34
Bibliography . . . . . . . . . . . . . . . . . . . . . . . . . . . . . . . . . . . . . . . . . . . . . . . . . . . . . . 35
References . . . . . . . . . . . . . . . . . . . . . . . . . . . . . . . . . . . . . . . . . . . . . . . . . . . . . . . . 36
INDEX . . . . . . . . . . . . . . . . . . . . . . . . . . . . . . . . . . . . . . . . . . . . . . . . . . . . . . . . . . . 37

ABSTRACT
As the second phase in a two-stage project, this study analyzed 12,086 records from the
National Death Index (NDI) matched to records from the patient registration system main
tained by the Indian Health Service (IHS). These records represent persons who presented
sufficient proof to indicate that they had some degree of American Indian (AI) or Alaska
Native (AN) ancestry when they sought care at Indian Health Service (IHS) health care facil
ities or the !HS-funded health care facilities. This study reviews the race reported on the
12,086 State death certificates of persons who were classified as being of American Indian or
Alaska Native ancestry by IHS. The study revealed that on 11 percent of the matched IHS
NDI records the race reported for the decedent was other than American Indian or Alaska
Native with the percentage of records with inconsistent classification of race reaching over 28
percent for some IHS Areas. The States with the most severe inconsistency in identifying the
race of AI/AN decedents were identified, and a method of adjusting IHS mortality statistics
was developed.

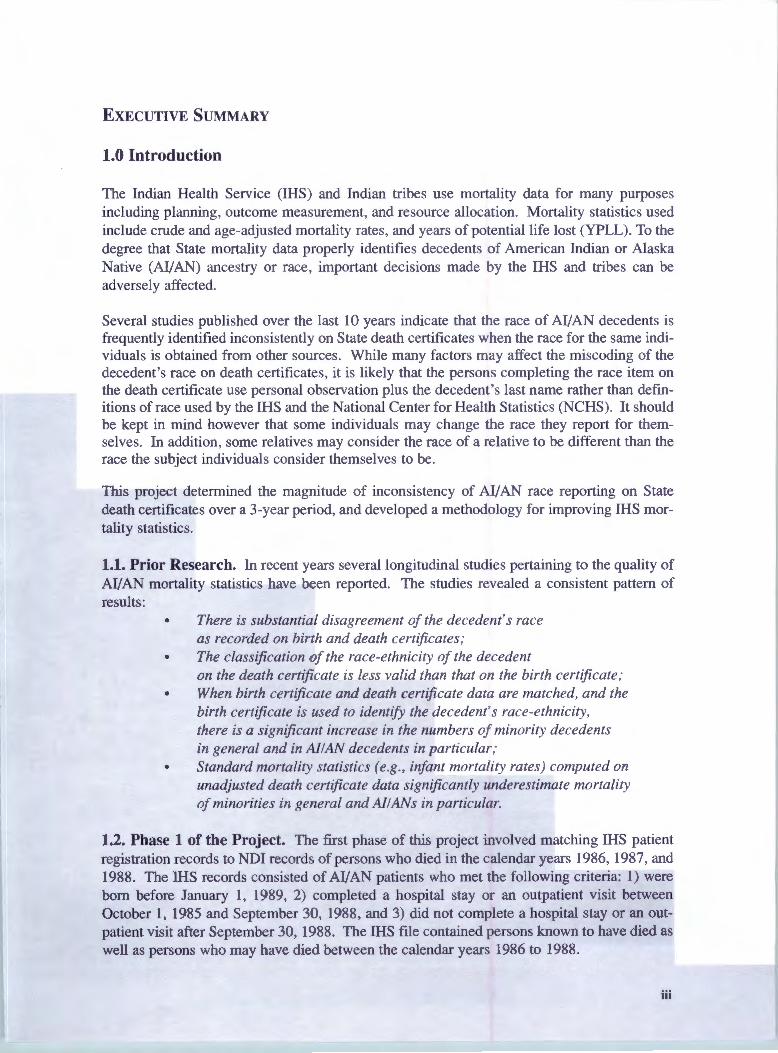
EXECUTIVE SUMMARY
1.0 Introduction
The Indian Health Service (IHS) and Indian tribes use mortality data for many purposes including planning, outcome measurement, and resource allocation. Mortality statistics used include crude and age-adjusted mortality rates, and years of potential life lost (YPLL). To the degree that State mortality data properly identifies decedents of American Indian or Alaska Native (AI/AN) ancestry or race, important decisions made by the IHS and tribes can be adversely affected.
Several studies published over the last 10 years indicate that the race of AI/ AN decedents is frequently identified inconsistently on State death certificates when the race for the same individuals is obtained from other sources. While many factors may affect the miscoding of the decedent's race on death certificates, it is likely that the persons completing the race item on the death certificate use personal observation plus the decedent's last name rather than definitions of race used by the IHS and the National Center for Health Statistics (NCHS). It should be kept in mind however that some individuals may change the race they report for themselves. In addition, some relatives may consider the race of a relative to be different than the race the subject individuals consider themselves to be.
This project determined the magnitude of inconsistency of AI/AN race reporting on State death certificates over a 3-year period, and developed a methodology for improving IHS mortality statistics.
1.1. Prior Research. In recent years several longitudinal studies pertaining to the quality of AI/AN mortality statistics have been reported. The studies revealed a consistent pattern of results:
• There is substantial disagreement of the decedent's race as recorded on birth and death certificates;
• The classification of the race-ethnicity of the decedent on the death certificate is less valid than that on the birth certificate;
• When birth certificate and death certificate data are matched, and the birth certificate is used to identify the decedent's race-ethnicity, there is a significant increase in the numbers of minority decedents in general and in Al/AN decedents in particular;
• Standard mortality statistics (e.g., infant mortality rates) computed on unadjusted death certificate data significantly underestimate mortality ofminorities in general and Al/ANs in particular.
1.2. Phase 1 of the Project. The first phase of this project involved matching IHS patient registration records to NDI records of persons who died in the calendar years 1986, 1987, and 1988. The IHS records consisted of AI/AN patients who met the following criteria: 1) were born before January 1, 1989, 2) completed a hospital stay or an outpatient visit between October 1, 1985 and September 30, 1988, and 3) did not complete a hospital stay or an outpatient visit after September 30, 1988. The IHS file contained persons known to have died as well as persons who may have died between the calendar years 1986 to 1988.
iii

The matching methodology involved both deterministic and probabilistic matching of IHS and NDI records. Matching of records involved comparison of characteristics such as decedent's first and last names, middle initial, age, sex, date of birth, social security number, States of birth and residence, and marital status. Identifiers of IHS Areas (based on the IHS Area in which the !HS-funded facility was located) were indicated on each record.
1.3. Project Goals and Objectives. The goal of the project was to develop an empirically based method for improving the consistency of IHS mortality statistics when compared with race reported for the same decedents obtained from other sources. The two principal objectives were to 1) determine the nature and scope of inconsistent identification of race ofAI/AN deaths on State death certificates for the IHS "user" population, and 2) develop a methodology for adjusting IHS mortality statistics for the level of inconsistency by race identified. These two objectives are described below.
Using the matched IHS-NDI data developed in Phase 1 of the project, the numbers and proportions of AI/AN deaths were identified for each of the 33 Reservation States (the count during 1986-1988) and for each of the 12 IHS Areas. Identification of the States with sign~cant inconsistency ofAI/AN race on death certificates will enable IHS to work with State and local officials to improve racial classification.
Based on the analyses of the linked IHS-NDI data, a methodology to adjust IHS mortality statistics for inconsistent identification of the race of AI/AN decedents was proposed. Adjustments to the number of AI/AN deaths could impact all IHS mortality statistics. The adjusted mortality statistics, if adopted, could facilitate better health planning and evaluation.
2.0 Methodology
2.1. Data Sources. The primary data source for this study was 12,086 matched NDI-IHS records for the calendar years 1986-1988 developed by the IHS in Phase 1 of the study. The NDI contribution to the matched records included decedent race as recorded on the State death certificate. The IHS contribution to the matched record included information from the IHS patient registration file . The matched records represent decedents known to have been AI/ANs (i.e., IHS beneficiaries). Thus, it was possible to compute the number and proportions of matched records in which AI/AN race was consistently and inconsistently recorded on State death certificates (when compared with the race reported on the IHS patient registration records for the same individuals).
2.2. Descriptive Statistics and Significance Tests. Descriptive statistics were compiled for the matched IHS-NDI records. The descriptive statistics included the total number of deaths, the percentage of records with AI/ AN race consistently identified, the percentage of females, the mean and standard deviation ofYPLL. These statistics were computed by IHS Area, State of residence, and State of death. Significance tests were computed for differences across IHS Areas for several measures including percentages of records with AI/AN race inconsistently classified, mean age of death, and mean YPLL.
iv

2.3. Adjustments to Number of AI/AN Deaths. Based on the descriptive statistics compiled, a method for adjusting the number of deaths for inconsistent classification of AI/AN race was proposed.
3.0. Findings
Prior research has consistently demonstrated inconsistent classification of race on State death certificates of AI/AN infants with the consequence of spuriously low AI/AN infant mortality rates. This study extended these findings to AI/AN decedents of all ages. The under-reporting of AI/AN deaths quantified in this study was used to 1) develop factors to adjust the number of AI/AN deaths in each IHS Area, and 2) identify States with the greatest inconsistent coding of AI/AN race on death certificates. The methodology calls for the use of adjusted numbers of deaths based on the results described in this section.
3.1. IHS Areas Most Affected by Inconsistent Reporting of AI/AN Race. There was large variation in the number of deaths reported from 1986-1988 across IHS Areas ranging from a high of 2,710 in the Oklahoma City Area to a low of 207 in the California Area. There were proportionally fewer deaths for some Areas compared to the size of the IHS service population-proportionally fewer deaths were reported for the California and Portland Areas, and proportionally more deaths reported for the Alaska and Tucson Areas.
The IHS Areas with the greatest percentage of inconsistent classifications of AI/AN race were California QQ.~, Oklahoma City (28.0%), Bemidji (16.1 %), and Nashville (12.1 %). These findings indicate that the methodology for adjusting IHS mortality statistics for inconsistent classification of AI/ AN race must take into account IHS Area.
3.2. States Most Affected by Inconsistent Reporting of AI/AN Race.
Comparison of mortality data by State of death and State of residence. Analyses compared mortality data for the State of residence and the State of death for the matched IHS-NDI data. There was general agreement between the two sets of State data with respect to the number of deaths, the percent of records with consistent race on the death certificates, and mean YPLL. This agreement is to be expected because most decedents (87%) resided and died in the same State; any differences are attributable to those decedents who died in a State different from the one in which they resided.
Number of deaths. There was much variation in the number of deaths reported in the matched IHS- NDI data across States of occurrence from a low of 31 in Missouri to a high of 2,407 in Oklahoma. Presentation and analysis at the State level data was limited to States having 20 or more matched pairs of records for deaths occurring in their State.
Consistency of AI/AN race identification. There was great variation in the percentage of consistently reported AI/AN race identification on State death records and IHS patient registration records by State of residence ranging from a low of 52.9 percent in Texas to a high of 98.1 percent in South Dakota. The overall percentage of the records with AI/AN race consistently identified was 89.1 percent.
v
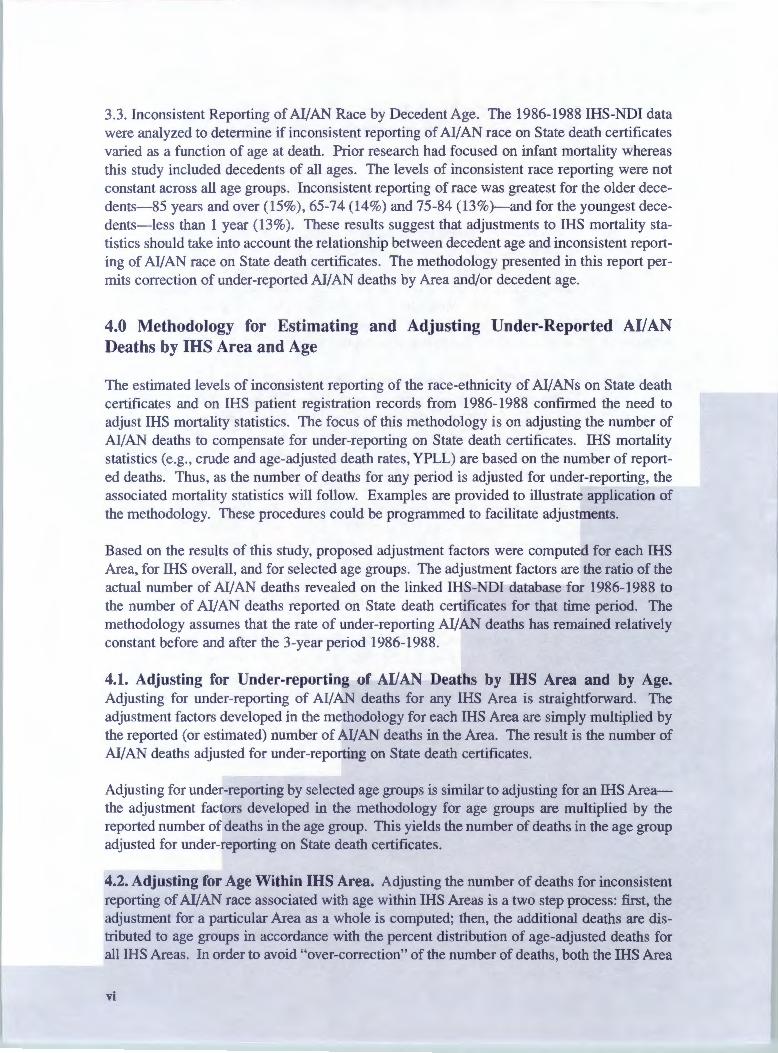
3.3. Inconsistent Reporting of Al/AN Race by Decedent Age. The 1986-1988 IHS-NDI data were analyzed to determine if inconsistent reporting of Al/AN race on State death certificates varied as a function of age at death. Prior research had focused on infant mortality whereas this study included decedents of all ages. The levels of inconsistent race reporting were not constant across all age groups. Inconsistent reporting of race was greatest for the older decedents-85 years and over (15 %), 65-74 (14%) and 75-84 (13%)-and for the youngest decedents-less than 1 year (13%). These results suggest that adjustments to IHS mortality statistics should take into account the relationship between decedent age and inconsistent reporting of Al/AN race on State death certificates. The methodology presented in this report permits correction of under-reported Al/AN deaths by Area and/or decedent age.
4.0 Methodology for Estimating and Adjusting Under-Reported AI/AN Deaths by IHS Area and Age
The estimated levels of inconsistent reporting of the race-ethnicity of Al/ANs on State death certificates and on IHS patient registration records from 1986-1988 confirmed the need to adjust IHS mortality statistics. The focus of this methodology is on adjusting the number of AI/AN deaths to compensate for under-reporting on State death certificates. IHS mortality statistics (e.g. , crude and age-adjusted death rates, YPLL) are based on the number of reported deaths. Thus, as the number of deaths for any period is adjusted for under-reporting, the associated mortality statistics will follow. Examples are provided to illustrate application of the methodology. These procedures could be programmed to facilitate adjustments.
Based on the results of this study, proposed adjustment factors were computed for each IHS Area, for IHS overall, and for selected age groups. The adjustment factors are the ratio of the actual number of AI/AN deaths revealed on the linked IHS-NDI database for 1986-1988 to the number of AI/AN deaths reported on State death certificates for that time period. The methodology assumes that the rate of under-reporting Al/AN deaths has remained relatively constant before and after the 3-year period 1986-1988.
4.1. Adjusting for Under-reporting of AI/AN Deaths by IHS Area and by Age. Adjusting for under-reporting of AI/AN deaths for any IHS Area is straightforward. The adjustment factors developed in the methodology for each IHS Area are simply multiplied by the reported (or estimated) number of AI/ AN deaths in the Area. The result is the number of Al/AN deaths adjusted for under-reporting on State death certificates.
Adjusting for under-reporting by selected age groups is similar to adjusting for an IHS Areathe adjustment factors developed in the methodology for age groups are multiplied by the reported number of deaths in the age group. This yields the number of deaths in the age group adjusted for under-reporting on State death certificates.
4.2. Adjusting for Age Within IHS Area. Adjusting the number of deaths for inconsistent reporting of AI/AN race associated with age within IHS Areas is a two step process: first, the adjustment for a particular Area as a whole is computed; then, the additional deaths are distributed to age groups in accordance with the percent distribution of age-adjusted deaths for all IHS Areas. In order to avoid "over-correction" of the number of deaths, both the IHS Area
vi

and the age adjustment factors should not be applied successively. Rather, the Area adjustment is computed first; then the additional deaths are distributed in proportion to the inconsistent identification of AI/AN race on State death certificates as a function of decedent's age. This approach assumes that the age distribution of the inconsistently classified AI/ AN deaths is constant over all IHS Areas. While this assumption is not likely to be true, this is the best practical approach until sufficient data become available to permit reliable determination of the distribution of inconsistent classifications of AI/ AN race by age groups within each IHS Area.
The age within Area adjustment methodology consists of four steps. These steps and an example showing each step in the computations is presented.
5.0 Recommendations
Based on the analyses of the IHS-NDI matched data, the following recommendations are made.
1. Replicate the study using data on deaths occurring since 1988. While the results of this study are unambiguous-substantial numbers of AI/AN deaths are under-reported in most States and in most IHS Areas-the analysis of more recent data would permit the determination of trends as well as the updating of the adjustment factors reported in this study.
With additional data, it may be possible to expand and enhance the methodology to 1) establish a single set of adjustment factors that express both Area and age effects, and 2) to determine if there is a relationship between specific causes of death and inconsistent classification of AI/AN race on death certificates. If such relationships were found, appropriate adjustment factors could be developed for specific causes of death.
2. Use adjustment factors developed in this study. When publishing information on death rates and when basing decisions on death rates, the IHS should consider using the adjustment factors computed in this study rather than the unadjusted numbers reported by States or other sources based on unadjusted State data (e.g., NDI). The adjustment factors can be applied to death statistics retroactively as well as prospectively.
3. Work with States to decrease inconsistent race reporting. IHS should work with States and local agencies to improve the classification of AI/AN race on death certificates. This report identifies the States with the most severe problems in consistently identifying AI/ AN race (excluding States with less than 20 matched pairs of NDI and IHS patient registration records)-Arkansas, California, Kansas, Michigan, Minnesota, Missouri, New York, Oklahoma, Oregon, Texas, Washington, and Wisconsin. Targeting these States is likely to produce the greatest improvement for resources invested.
vii
FINAL REPORT
Methodology for Adjusting IHS Mortality Data for Inconsistent Classification of Race-Ethnicity of American Indians and Alaska Natives Between State Death Certificates
and IHS Patient Registration Records
1.0 INTRODUCTION
The Indian Health Service (IHS) and Indian tribes use mortality data for many purposes including planning, outcome measurement, and resource allocation. Mortality statistics used include crude and age-adjusted mortality rates, and years of potential life lost (YPLL). To the degree that State mortality data properly identifies decedents of American Indian and Alaska Native (AI/AN) ancestry or race, important decisions made by the IHS and tribes can be adversely affected.
Several studies published over the last 10 years (see section 1.1.1 below) indicate that the race of AI/AN decedents is frequently identified inconsistently on State death certificates when the race of the same individuals is obtained from other sources. While many factors may affect the mis-recording of the decedent's race on death certificates, it is likely that the persons completing the race item on the death certificate use personal observation plus the decedent's last name rather than definitions of race used by the IHS and the National Center for Health Statistics (NCHS). It should be kept in mind however that some individuals may change the race they report for themselves. In addition, some relatives may consider the race of a relative to be different than the race the subject individuals consider themselves to be.
This project determined the magnitude of inconsistency of AI/ AN race reporting on State death certificates over a 3-year period, and developed a methodology for improving IHS mortality statistics.
1.1. Prior Research
In recent years there has been a significant amount of research pertaining to longitudinal studies of mortality and to mortality statistics pertaining to AI/ANs. This review presents a selection of relevant research to describe the context in which the present study was conducted.
1.1.1. Studies showing inconsistent race reporting in standard mortality statistics. Three studies, reviewed below, compared infant mortality rates computed by standard methods to infant mortality rates based on consistent coding of decedent race-ethnicity at birth and death. The studies focused on different populations (Washington, Oklahoma, and nation-wide data) and on different time periods between 1968 to 1988. The studies revealed a consistent pattern of results:
1

• There is substantial disagreement of the decedent's race as recorded on birth and death certificates-the level of disagreement has ranged from 4 percent to 15 percent;
• For studies involving a birth and death record match, the race-ethnicity reported for the decedent on the death certificate is considered by the authors to be less valid than that on the birth certificate (since the mother in a controlled environment, rather than a third party, reports the race entries on the State birth certificate);
• When birth certificate and death certificate data are linked, and the birth certificate is used to identify the decedent's race-ethnicity, there is a significant increase in the numbers of minority decedents in general and in Al/AN decedents in particular;
• Standard mortality statistics (e.g., infant mortality rate) computed on unadjusted death certificate data significantly underestimate mortality of minorities in general and Al!ANs in particular.
1.1.1.1. Frost and Shy, American Journal of Public Health, 1980. This study examined the effect of two different methods of identifying the race of infants who died in the State of Washington over a 10 year period, 1968-1977. The methods studied were 1) the race specified on the death record, and 2) the race on the corresponding linked birth record. The second method resulted in substantial increases in the numbers of infants classified as having a nonwhite race. Using the linked birth-death records, there was a 39 percent increase (114/293) in the number of infants classified as AI/ANs.
Linkages were made between birth and death records based on 5 criteria: 1) name, 2) birth date, 3) sex, 4) mother's name, and 5) father's name. Linkages were made for 8,390 out of a total of 9,118 infant deaths. Race was determined from birth and death certificates in accordance with the "pre-1989 standards" developed by the NCHS. For mixtures of white and nonwhite races, the nonwhite race was assigned. For mixtures of two nonwhite races, the race of the father was assigned, except for the Hawaiian race, which always takes precedence[ I]. As in most States, in Washington birth certificates are generally completed by birth attendants or hospital personnel, and death certificates are generally completed by funeral directors.
Cross-tabulations of decedent race at birth and race at death showed that in 4 percent of the linked records, the race at death differed from the race at birth. For each nonwhite race, the number of infant deaths increased when coded by race at birth rather than race at death. There was a 39 percent increase in the number of infants classified as Al/AN. This effect was greater when the age of death was less than 7 days. There was no relation between the cause of death and the under-reporting of nonwhite deaths on the death certificates.
The under-reporting of Al/AN race on death certificates was shown to have significant impact on infant mortality rates for Al/ANs. Between 1968 and 1977, the American Indian infant mortality rate was 24.2 per 1,000 live births using standard death certificate data; however, when calculated using linked birth certificate data, the infant mortality rate was 33.6. The
2
authors noted that, since 1962, the neonatal mortality rate (death within the first 28 days of life) of AI/ANs had been less than that of the general population. The authors also noted that infant mortality rates are often used as a measure of the effectiveness of health care initiatives and programs, and concluded that race-specific infant mortality rates should be calculated with race as stated on the birth certificate from linked birth and death certificates.
1.1.1.2. Kennedy and Deapen, Public Health Reports, 1991. This study examined the effect of inconsistent classification of decedent race on death certificates in the State of Oklahoma for a 14 year period, 1975 to 1988. The impetus for the study was the unexpectedly low infant mortality rate reported for Al/ANs in Oklahoma. Birth and death certificates were linked in this study in a manner similar to that in the Frost and Shy study described above. Linkages were made for 7,631 of 8,487 deaths of infant Oklahoma residents.
The study found inconsistent classifications for all racial categories and in both directions. For example, infants classified as black at birth were classified as AI/ANs at death and vice versa. Over the 14 year study period, 737 death certificates were matched to AI/AN birth certificates; of these 109 (14.8%) were classified as a race other than AI/AN on the death certificate. The authors concluded that the inconsistent classification of AI/AN race on death certificates most often occurred when one of the parents is not an AI/AN. Analysis of the data over time indicated that the inconsistent classification of Al/ANs on death certificates increased over time.
Using the matched data for the period 1975 to 1988, the authors recomputed Al/AN infant mortality rates. The unadjusted rate was 8.87 per 1,000 Al/AN births and the adjusted infant mortality rate was 12.47. The unadjusted infant mortality rate for Al/ANs in Oklahoma was lower than most other IHS Areas; the adjusted infant mortality rate (12.47) was said to be higher than the overall infant mortality rate (9.7) for AI/ANs reported by the IHS for the year 1985. The authors concluded that conventional methods of computing race-specific infant mortality are flawed.
1.1.1.3. Hahn, Mulinare, and Teutsch, Journal of the American Medical Association, 1992. This study examined the consistency of racial-ethnic classification on birth and death certificates for all infants who died in the United States from 1983 to 1985. Want mortality rates computed by standard methods were compared to infant mortality rates based on linked birth and death certificates. The primary data source for the study was linked infant birth and death data provided by NCHS plus additional data on the race-ethnicity of the infants recorded at death. The race of an infant at birth was determined by an NCHS algorithm incorporating information on the race of the infant's parents as recorded on the birth certificate. This algorithm was changed in 1989. The pre-1989 algorithm is described in the review of Frost and Shy (1980) presented above. After 1989, NCHS began to present birth data by the race of the mother, not the race of the child (that had previously been assigned by NCHS by a computer algorithm of the race reported for each parent, not a direct question about the race of the child).
The authors noted that in "standard" infant mortality rates, infant deaths in a given year are divided by births in the same year. Since infants who die in a given year may have been born in a previous year, and since infants born in a given year may die in the following year, stan..: dard infant mortality rates are ratios rather than true rates. The linked infant birth-death file permitted calculation of true infant mortality rates since it included all deaths (over a 2 year span) occurring in a cohort of infants (born in a single year). The analyses assessed 1) the
3

consistency of infants' race-ethnicity assigned at birth and at death, and 2) the implications of inconsistent race-ethnicity on the birth and death certificates.
The study found that 3.7 percent of the 4,288 linked records analyzed had inconsistent raceethnicity on the birth and death records with infants classified as white at birth having the lowest inconsistency (1.2%), and AI/ANs having a high degree of inconsistency (36.6%). As with other racial-ethnic groups, the most common inconsistency for Al/ANs was to be classified as white at death.
The study reported three inf ant mortality rates; these infant mortality rates were based on: 1) the pre-1989 NCHS algorithm, 2) the new (1989) NCHS algorithm, and 3) estimates from linked birth-death data with mother's race assigned to the infant at birth and death. The results for AI/ AN s are summarized in Table 1 with infant mortality rates expressed in deaths per thousand. The authors concluded that, for infants not classified as white or black at birth, the classification of race at birth and at death was remarkably inconsistent. The inconsistent classification of race at birth and death was attributed to different methods of identifying race for the two events: race at birth is based on the race reported by the parent(s) whereas race at death is based on observation (by funeral directors or other certifiers). The authors also concluded that race-specific infant mortality rates should be calculated on linked birth-death data.
Table 1. Comparison of AI/AN and white infant mortality rates (IMRs) based on different methods of identifying decedent race
IMR Using Pre-1989 IMR Using 1989 IMR Using Infant Race NCHS Algorithm NCHS Algorithm Linked data
White 9.5 9.4 9.3
AI/AN 9.8 12.3 14.4
1.1.1.4. Querec, L., Indian Health Service, 1994. This is the third in a series of IHS reports on infant mortality using linked birth and death data. The report describes a method for adding IHS Area and Service Unit identifiers to linked records. The linked records were assembled by NCHS.
Using the NCHS linked birth and infant death data with the IHS Area identifiers added, this study analyzed data for a 5-year period, 1983 to 1987. Compared to standard mortality data based on State death certificates, Querec found that Al/AN infant deaths were under-reported in most IHS Areas for each of the 5 years studied. The IHS Areas with the greatest underreporting of Al/AN infant deaths were California, Oklahoma, and Portland. The number of actual Al/AN deaths compared to the numbers reported in standard methods were 2.2 times, 1.7 times, and 1.4 times greater in the California, Oklahoma, and Portland Areas respectively. Infant mortality rates were computed for each IHS Area using the adjusted numbers of Al/AN deaths; the adjusted infant mortality rates were inflated in proportion to the number of previously unreported AI/AN deaths. The study computed true infant mortality rates based on mortality in cohorts of infants as was done by Hahn et al 1992.
4

1.1.1.5. Rogot, Sorlie and Johnson, Validity of Demographic Characteristics on the Death Certificate, Epidemiology, March 1992, Vol. 3, No. 2, p.p. 181-184. Agreement for American Indians between the Current Population Survey (CPS) (self-reported) and the State death certificate was 73.6 percent (of 216 American Indians self reporting in the CPS surveys (1979 to 1985), 177 were reported as American Indians on State death certificates). The authors concluded that; "the direction of disagreement suggests that current estimates of mortality rates for American Indians are underestimated."
1.1.2. Prior research studies that employ methods to match epidemiologic data with the National Death Index (NDI) data base. The NDI is a set of computer files of all deaths in the United States since 1979. Each file includes information contained on the State death certificate for the calendar year in which the person died. The NDI is maintained by the NCHS. The data analyzed in the present study consisted of a data base formed by matches of NDI data with the IHS patient registration system. The matching process involved millions of records (almost 2.2 million records in the NDI and about 1.2 million IHS user population records for each year 1986-1988) and was facilitated by the use of probabilistic matching methodology. The study reviewed below describes methods for matching epidemiologic data to decedents in the NDI data base.
1.1.2.1. Rogot, Sorlie, and Norman, Journal of Chronic Diseases, 1986. This study describes a method for matching decedents in large computer files such as the NDI. Epidemiologic mortality studies often use the NDI to determine which members of a population of interest have died. With large numbers of observations, it is difficult to match known decedents on the NDI with persons in the study population such as IHS beneficiaries. Given an input record (from the study population), the NDI produces a list of possible matches with matching scores ranging from zero to 15. The user must determine which record, if any, is the correct match.
When matching NDI records and records from other sources, there may be a perfect match between the critical variables such as first and last names, social security number, dates of birth and death, States of birth and death, etc. Such a match is said to be a "deterministic match." Frequently, however, one or more death records may share some of the critical variables with the record found in another data file with which it is matched. In some cases, deciding which death record matches a given other record is relatively easy. For example, if all the critical variables on a death record match those on another type of record with the exception of the State of birth, it is likely that the State of birth was miscoded on the death certificate. As the amount of missing or inconsistent data increases between similar death and other types of records, less confidence can be given to the inference that the two records "match" (i.e., refer to the same person).
The abstract to this report contains the following paragraph. "In a pilot study to the larger mortality follow-up, Census Bureau files containing 226,000 person records were matched to the 1979 NDI. The results of this match were used to generate a probabilistic method to separate the possible matches into categories of true positives, false positives and those of questionable status requiring manual review of the Census record and the death certificate. Of the 5,542 possible matches about one-third were ultimately determined to be true positives and two-thirds false positives. The probabilistic method was validated by replications on subsets of the data and promises to save considerable time in review of records in the large national study of mortality."
5

The probabilistic methodology presented was developed to facilitate matching NDI and study population data. The probabilistic method allows researchers to use automated procedures to quickly identify matches that, while not perfect, have a high probability of being correct. The authors of this report concluded that; "In general, the probabilistic method is a sound procedure to screen hits generated by an NDI match and can be applied in any large study."
1.2. Phase 1 of the Project
The first phase of this project involved matching IHS patient registration records to NDI records of persons who died in the calendar years 1986, 1987, and 1988. The IHS records consisted of AI/ AN patients who met the following criteria:
were born before January 1, 1989, completed a hospital stay or an outpatient visit between October 1, 1985 and September 30, 1988, and did not complete a hospital stay or an outpatient visit after September 30, 1988.
The IHS file contained persons known to have died as well as persons who may have died between the calendar years 1986 to 1988. A total of 279,906 IHS patient registration records met these criteria and were submitted to be matched with the NDI database.
The matching methodology involved both deterministic and probabilistic matching (see section 2.1 below) of IHS and NDI records. Matching of records involved comparison of characteristics such as decedent's first and last names, middle initial, age, sex, date of birth, social security number, States of birth and residence, and marital status. Identifiers of IHS Areas (based on the IHS Area in which the !HS-funded facility is located) were indicated on each record. Of the 279,906 IHS patient registration records submitted to the NDI database for matching purposes, 40,741 pairs of IHS patient registration records and NDI records were considered "possible" matches. These "possible" matches were based upon age, race, sex, dates of birth and death (month, day, year), decedent's name (and father's surname for females), marital status, State of residence, State of birth, and Social Security Number (if available).
To determine which "possible" matches were the most likely or "true" matches, a decision algorithm computer program, developed by staff of the statistical methods, Division of the U.S. Bureau of the Census, was applied to the 40,741 matched pairs of IHS and NDI records. Based on the matching criteria contained in this computer algorithm 12,086 pairs of IHS and NDI matched records were considered to be "true" matched pairs of records. (A description of the computer matching algorithm and its application can be found in Eugene Rogot, Paul Sorlie, and Norman Johnson, Probabilistic Methods in Matching Census Samples to the National Death Index, Journal of Chronic Diseases, Volume 39, No. 9, pp. 719-734, 1986, printed in Great Britain, Pergamon Journals Ltd.)
An independent check of the work performed by the Census Bureau (described above) was conducted through a manual review of 1,000 copies of Washington State death certificates that were also contained on the NDI files for calendar years 1986 to 1988. Through a manual
6
review of these Washington State death certificate records (e.g., an American Indian "sounding" name; residence on an American Indian Reservation, in a tribally run nursing home, or in an American Indian community; etc.), it was determined that the assignment of "true" matches and "probable" matches, through use of a computer algorithm appeared to be working well.
1.3. Project Goals and Objectives
The goal of the project was to develop an empirically based method for improving the consistency of IHS mortality statistics when compared with race reported for the same decedents obtained from other sources. The two principal objectives were to 1) determine the nature and scope of inconsistent classifications of AI/ AN deaths on State death certificates for the IHS "active registered Indian" population, and 2) develop a methodology for adjusting IHS mortality statistics for the level of inconsistency by race identified.[2] These two objectives are described below.
1.3.1. Estimate the number and proportions of AI/ AN deaths with inconsistently reported race. Using the linked IHS-NDI data developed in Phase 1 of the project, the numbers and proportions of AI/ AN deaths were identified for each of the 33 Reservation States (the count during 1986-1988) and for each of the 12 IHS Areas.[3] Identification of the States with significant inconsistency of AI/AN race on death certificates will enable IHS to work with State and local officials to improve racial classification.
1.3.2. Develop methodology for adjusting AI/ AN mortality statistics for the IHS service area. Based on the analyses of the linked IHS-NDI data, a methodology to adjust IHS mortality statistics for inconsistent identification of the race of AI/ AN decedents was proposed. Adjustments to the number of AI/AN deaths could impact all IHS mortality statistics. Unlike the prior research reviewed in section 1.1, this project is not limited to infant mortality-there is no restriction of decedent age. The adjusted mortality statistics, if adopted, could facilitate better health planning and evaluation.
2.0 METHODOLOGY
2.1. Data Sources
The primary data source for this study was 12,086 matched NDI-IHS records for the years 1986-1988 developed by the IHS in Phase 1 of the study. The NDI contribution to the matched records included decedent race as recorded on the State death certificate. The IHS contribution to the matched record included information from the IHS patient registration file. The matched records represent decedents known to have been AI/ANs (i.e., members of the IHS active registered Indian population).[4] Thus, it was possible to compute the number and proportions of matched records in which AI/ AN race was consistently and inconsistently recorded on State death certificates (when compared with the race reported on the IHS patient registration records for the same individuals).
7
It is important to note the distinctions between the matched data analyzed in this study and the mortality data generally presented in IHS publications (e.g., Trends in Indian Healthpreviously referred to as the "IHS Chartbook"). The mortality data reported in Trends in Indian Health include deaths of all AI/ANs who reside in counties within the IHS service area. Trends in Indian Health data include AI/AN decedents who may not have used an IHS facility in the last 3 years and, thus, would not be included in the IHS patient registration system. The decedents included in the IHS-NDI matched file do not represent all decedents of either the IHS service or user populations.[5] Thus, while the matched IHS-NDI records are useful in determining the magnitude of misclassification of AI/AN race on death certificates, mortality statistics (e.g., crude and age-adjusted mortality rates, YPLL) cannot be accurately computed for the IHS-NDI matched file because the size of the appropriate population is unknown.
The matched file contained 51 variables including the decedent's first and last names, middle initial, social security number, dates of birth and death, sex, race, States of birth, residence and death, and IHS Area of residence. Of the 12,086 matched records, 745 (6.2%) were excluded from the analyses because they lacked one or more variables critical to the study or had "impossible" values. Thus, a total of 11,341 records were available for analysis. Comparisons of the 745 excluded and 11,341 included records indicated that both sets of records had similar levels of misclassification of AI/AN race; however, the excluded records had significantly more females than the included records. Appendix 1 presents these analyses.
The Technical Appendix to the annual mortality reports of the National Center for Health Statistics, CDC, DHHS, contains the following discussion of how race is classified by vital records registrars for each State of the United States, and the quality of race reported on State death certificates.
Race-For vital statistics in the United States deaths are currently classified by race-white, black, American Indian, Chinese, Hawaiian, Japanese, Filipino, Other Asian or Pacific Islander, and Other. Mortality data for Filipino and Other Asian or Pacific Islander were shown for the first time in 1979.
The white category includes, in addition to persons reported as white, those reported as Mexican, Puerto Rican, Cuban, and all other Caucasians. The American Indian category includes American, Alaskan, Canadian, Eskimo, and Aleut. If the racial entry on the death certificate indicates a mixture of Hawaiian and any other race, the entry is coded to Hawaiian. If the race is given as a mixture of white and any other race, the entry is coded to the appropriate nonwhite race. If a mixture of race other than white is given (except Hawaiian), the entry is coded to the first race listed. This procedure for coding the first race listed has been used since 1969. Before 1969, if the entry for race was a mixture of black and any other race except Hawaiian, the entry was coded to black.
Race not stated-Death records with race entry not stated are assigned to a racial designation as follows. If the preceding record is coded white, the code assignment is made to white; if the code is other than white, the assignment is made to black.
8

Quality of race data-A number of studies have been conducted on the reliability of race reported on the death certificate. These studies compare race reported on the death certificate with that reported on another data collection instrument such as the census or a survey. Differences may arise in the results of the studies because of differences in who provides race information on the compared records. Race information on the death certificate is reported by the funeral director as provided by an informant, on the basis of observation. In contrast, race on the census or the Current Population Survey (CPS) is self-reported and, therefore, may be considered more valid. A high level of agreement between the death certificate and the census or survey report is essential to ensure unbiased death rates by race.
All of these studies show that persons self-reported as American Indian or Asian on census and survey records (and by informants in the Followback Survey) were sometimes reported as white on the death certificate. The net effect of misclassification is an underestimation of deaths and death rates for the smaller minority races.
2.2. Descriptive Statistics and Significance Tests
Descriptive statistics were compiled for the matched IHS-NDI records. The descriptive statistics included the total number of deaths, the percentage of records with AI/ AN race consistently identified, the percentage of females, the mean and standard deviation of YPLL. These statistics were computed by IHS Area, State of residence, and State of death. Significance tests were computed for differences across IHS Areas for 1) the percentages of records with AI/AN race inconsistently reported, and 2) mean YPLL.
2.3. Adjustments to Number of AI/ AN Deaths
Based on the descriptive statistics compiled, a method for adjusting the number of deaths for inconsistent classification of AI/AN race was proposed. This method is presented in Section 4.0.
3.0. FINDINGS
Prior research has consistently demonstrated inconsistent classification of race on State death certificates of AI/AN infants with the consequence of spuriously low Al/AN infant mortality rates. This study extended these findings to AI/AN decedents of all ages. The under-reporting of AI/AN deaths quantified in this study was used to 1) develop adjustment factors to adjust the number of Al/AN deaths in each IHS Area, and 2) identify States with the greatest inconsistent coding of AI/ AN race on death certificates. The methodology calls for the use of adjusted numbers of deaths based on the results described in this section.
9
3.1. IHS Areas Most Affected by Inconsistent Reporting of AI/ AN Race
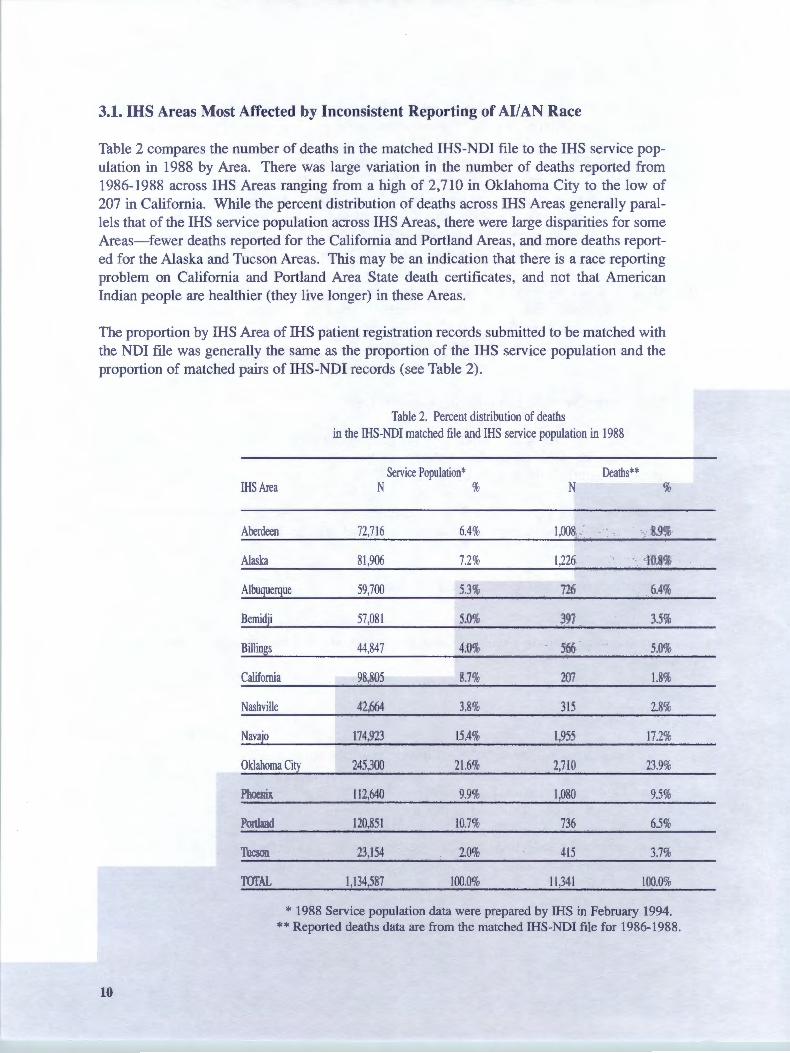
Table 2 compares the number of deaths in the matched IHS-NDI file to the IHS service population in 1988 by Area. There was large variation in the number of deaths reported from 1986-1988 across IHS Areas ranging from a high of 2,710 in Oklahoma City to the low of 207 in California. While the percent distribution of deaths across IHS Areas generally parallels that of the IHS service population across IHS Areas, there were large disparities for some Areas-fewer deaths reported for the California and Portland Areas, and more deaths reported for the Alaska and Tucson Areas. This may be an indication that there is a race reporting problem on California and Portland Area State death certificates, and not that American Indian people are healthier (they live longer) in these Areas.
The proportion by IHS Area of IHS patient registration records submitted to be matched with the NDI file was generally the same as the proportion of the IHS service population and the proportion of matched pairs of IHS-NDI records (see Table 2).
Table 2. Percent distribution of deaths in the IHS-NDI matched file and IHS service population in 1988
Service Population* Deaths** IHS Area N % N %
Aberdeen 72,716 6.4% 1,008 8.9%
Alaska 81 ,906 7.2% 1,226 10.8%
Albuquerque 59,700 5.3% 726 6.4%
Bemidji 57,081 5.0% 397 3.5%
Billings 44,847 4.0% 566 5.0%
California 98,805 8.7% 207 1.8%
Nashville 42,664 3.8% 315 2.8%
Navajo 174,923 15.4% 1,955 17.2%
Oklahoma City 245,300 21.6% 2,7LO 23.9%
Phoenix 112,640 9.9% 1,080 9.5%
Portland 120,851 10.7% 736 6.5%
Tucson 23,154 2.0% 415 3.7%
TOTAL 1,134,587 100.0% 11,341 100.0%
* 1988 Service population data were prepared by IllS in February 1994. **Reported deaths data are from the matched IHS-NDI file for 1986-1988.
10

Table 2a. IHS patient registration records by type submitted to the NDI for matching purposes by IHS Area of residence of the patient
Grand Total of IHS Patient Year of Death
Registration for Records of Records Submitted Known Decedents Years of Last Visit/Update
!HS Area N % 1986 1987 1988 1986 1987 1988
Aberdeen 24,345 8.7 167 232 253 5,263 6,770 11 ,660
Alaska 22,370 8.0 97 577 428 5,537 7,455 8,276
Albuquerque 20,365 7.3 164 177 194 4,055 5,323 10,452
Bemidji 13,741 4.9 91 80 76 2,6 17 3,762 7,115
Billings 6,253 2.2 194 255 242 1,074 2,470 2,01 8
California 17,275 6.2 22 40 91 4,775 5,046 7,301
Nashville 7, 11 2 2.5 129 129 124 953 1,467 4,310
Navajo 52,452 18.7 356 363 337 7,734 16,488 27,174
Oklahoma City 74,378 26.6 576 611 643 16,813 21,171 34,564
Phoenix 25,751 9.2 174 186 261 5,133 7,351 12,646
Portland 13,583 4.9 196 23 1 259 2,459 3,867 6,571
Tucson 2,281 0.8 116 165 181 665 422 732
TOTAL 279,906 100.0 2,282 3,046 3,089 57,078 81,592 132,8 19
Table 3 summarizes some descriptive statistics of the matched IHS-NDI data for 1986-1988 by IHS Area. The column headed by " % Race Consistent" indicates the percent of the IHSNDI records in which the race of the Al/AN decedent was consistently reported when reviewing the racial entry on the subject individual's State death certificate and on that same individual's IHS patient registration record. These percentages range from a low of 69.6 for California to a high of 98.8 for the Navajo Area. Chi Square test of difference among proportions indicated significant disparities across IHS Areas for the percent of records with consistent Al/AN race classification (Chi Square= 1.3, df=ll, p<.001).[6]
The column headed "% Race Inconsistent" is the complement of the "% Race Consistent" data (i.e., 100 percent minus the Percent Race Consistent). This column shows that the IHS Areas with the greatest percentage of inconsistent classifications of Al/AN race were California (30.4%), Oklahoma City (28.0%), Bemidji (16.1 %), and Nashville (12.1 %). These findings agree with those reported by Querec (1994) for State infant death records and suggest that the methodology for adjusting IHS mortality statistics for inconsistent classification of Al/AN race must take into account IHS Area.
11
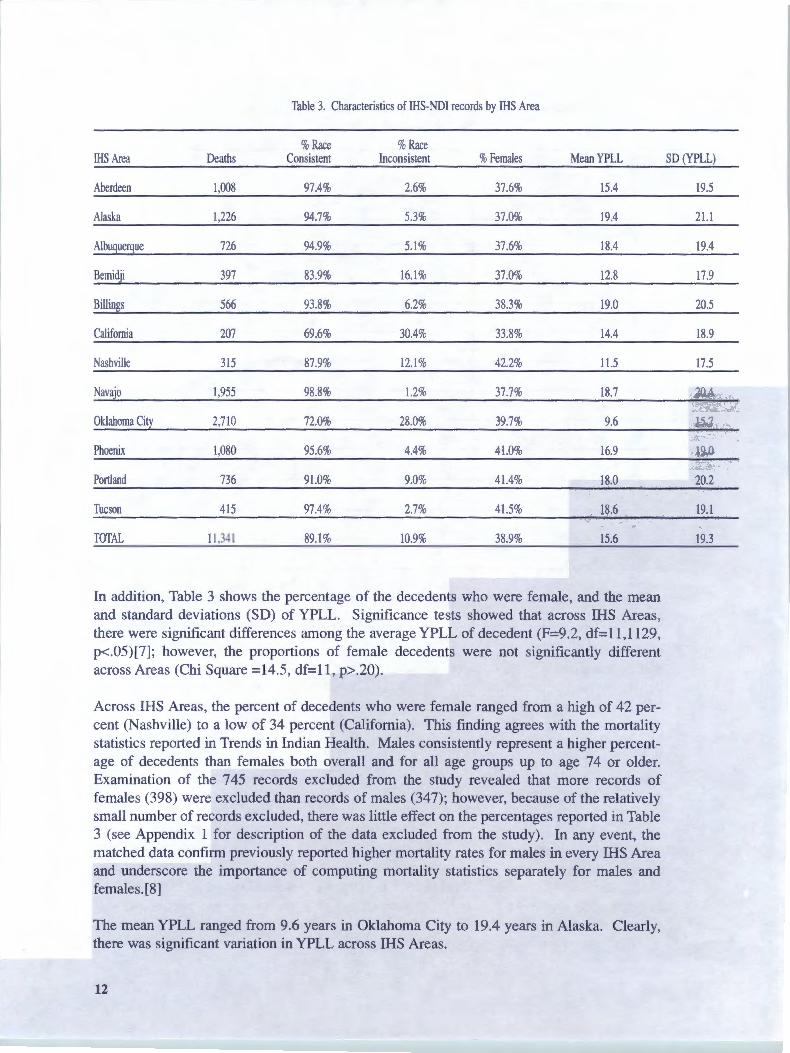
Table 3. Characteristics of IHS-NDI records by IHS Area
%Race %Race !HS Area Deaths Consistent Inconsistent %Females Mean YPLL SD (YPLL)
Aberdeen 1,008 97.4% 2.6% 37.6% 15.4 19.5
Alaska 1,226 94.7% 5.3% 37.0% 19.4 21.1
Albuquerque 726 94.9% 5.1 % 37.6% 18.4 19.4
Bemidji 397 83.9% 16.1% 37.0% 12.8 17.9
Billings 566 93.8% 6.2% 38.3% 19.0 20.5
California 207 69.6% 30.4% 33.8% 14.4 18.9
Nashville 315 87.9% 12.1% 42.2% l l.5 17.5
Navajo l,955 98.8% l.2% 37.7% 18.7 20.4
Oklahoma City 2,710 72.0% 28.0% 39.7% 9.6 15.7
Phoenix l,080 95.6% 4.4% 41.0% 16.9 19.0
Portland 736 91.0% 9.0% 41.4% 18.0 20.2
Tucson 415 97.4% 2.7% 41.5% 18.6 19.l
TOTAL 11,341 89.1 % 10.9% 38.9% 15.6 19.3
In addition, Table 3 shows the percentage of the decedents who were female, and the mean and standard deviations (SD) of YPLL. Significance tests showed that across IHS Areas, there were significant differences among the average YPLL of decedent (F=9 .2, df= 11, 1129, p<.05)[7]; however, the proportions of female decedents were not significantly different across Areas (Chi Square =14.5, df=l 1, p>.20).
Across IHS Areas, the percent of decedents who were female ranged from a high of 42 percent (Nashville) to a low of 34 percent (California). This finding agrees with the mortality statistics reported in Trends in Indian Health. Males consistently represent a higher percentage of decedents than females both overall and for all age groups up to age 74 or older. Examination of the 745 records excluded from the study revealed that more records of females (398) were excluded than records of males (347); however, because of the relatively small number of records excluded, there was little effect on the percentages reported in Table 3 (see Appendix 1 for description of the data excluded from the study). In any event, the matched data confirm previously reported higher mortality rates for males in every IHS Area and underscore the importance of computing mortality statistics separately for males and females.[8]
The mean YPLL ranged from 9.6 years in Oklahoma City to 19.4 years in Alaska. Clearly, there was significant variation in YPLL across IHS Areas.
12

3.2. States Most Affected by Inconsistent Reporting of AI/AN Race
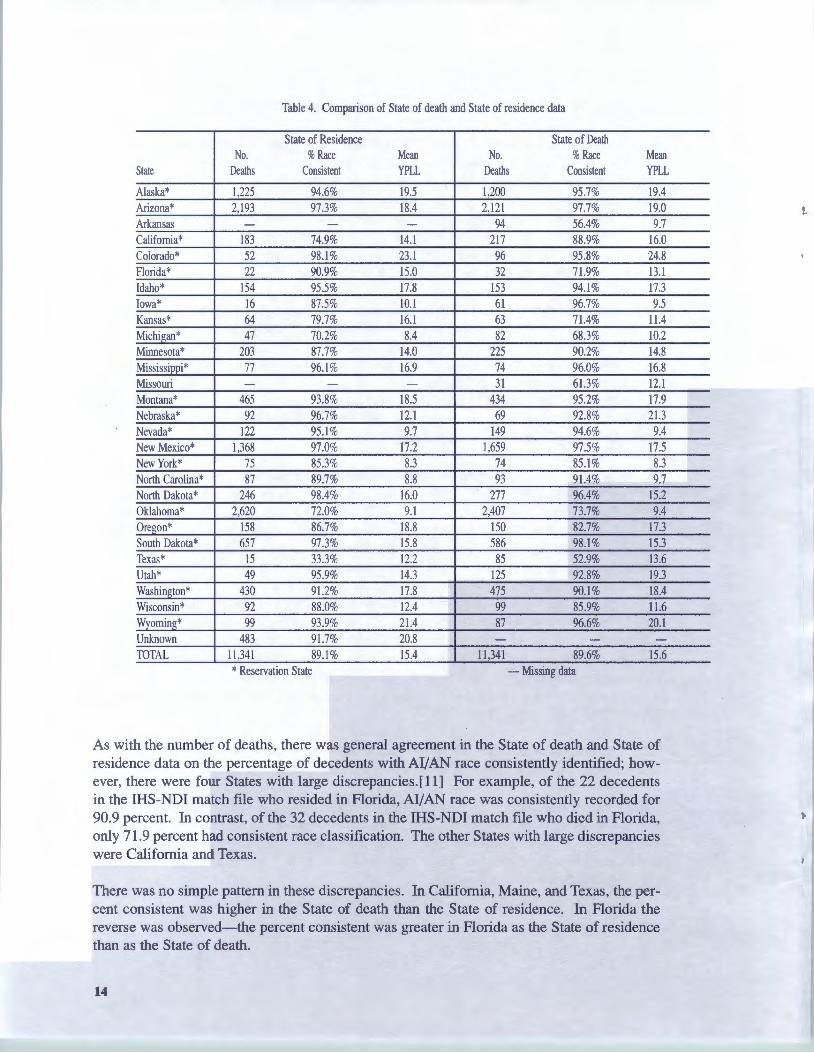
3.2.1. Comparison of mortality by State of death and State of residence. Table 4 presents mortality data for the State of residence and the State of death for the matched IHS-NDI data. States excluded from Table 4 are those with less than 20 deaths in both State of residence and State of death. There is general agreement between the two sets of State data with respect to the number of deaths, the percent of records with consistent race on the death certificates, and mean YPLL. This agreement is to be expected because most decedents (87%) resided and died in the same State; any differences are attributable to those decedents who died in a State different from the one in which they resided.
Table 4 includes data for the 33 Reservation States (the count during 1986-1988, excluding Alabama, Connecticut, Louisiana, Maine, Massachusetts, Pennsylvania and Rhode Island, each of which had less than 20 matched pairs of NDI and IHS patient registration records) plus any other State reporting the death of a person in the IHS-NDI file. In addition to the 33 Reservation States, the IHS-NDI match file contained State of death data for the remaining States. Because the IHS-NDI match file contains records only for AI/ANs who were members of the IHS "active registered user" population, there should be few records with a State of residence other than a Reservation State. [9]
While there is general agreement between the State of death and State of residence, there are many differences. For example, Table 4 shows that only 16 of the decedents resided in Iowa but 61 AI/ANs died in that State. Likewise, 47 AI/AN decedents resided in Michigan but 82 AI/ANs died in that State. No AI/AN decedent resided in Missouri (Missouri is not a Reservation State) but 31 AI/ AN s died in that State. There were 49 AI/ AN decedents who resided in Utah but 125 AI/ANs died in that State. There were no AI/AN decedents who resided in Arkansas (Arkansas is not a Reservation State), but there were 94 AI/ANs who died in that State. The reader should keep in mind the fact that this study included records of AI/ AN s who were active registrants in the IHS patient registration system. Some of these people may not have been residing in the IHS service area but were provided care during the previous 3 years at an IHS direct care facility (see footnote 5). In addition, some AI/AN people may have been in transit at the time of their death, which could have occurred in any county and in any State of the United States. The cause of death (e.g., motor vehicle accident) was not available in the records reviewed.
3.2.1.1. Number of deaths. There was much variation in the number of deaths reported across States of occurrence from a low of 31 in Missouri to a high of 2,407 in Oklahoma.[10]
3.2.1.2. Consistent AI/ AN race identification. There was great variation in the percentage of consistently reported AI/AN race identification on State death records and IHS patient registration records by State of occurrence ranging from a low of 52.9 percent in Texas to a high of 98.1 percent in South Dakota. The overall percentage of the records with AI/AN race consistently identified was 89.1 percent.
13
1
Table 4. Comparison of State of death and State of residence data
State of Residence State of Death No. %Race Mean No. %Race Mean
State Deaths Consistent YPLL Deaths Consistent YPLL
Alaska* 1,225 94.6% 19.5 1,200 95.7% 19.4 Arizona* 2,193 97.3% 18.4 2,121 97.7% 19.0 Arkansas - - - 94 56.4% 9.7 California* 183 74.9% 14.1 217 88.9% 16.0 Colorado* 52 98.1% 23.1 96 95.8% 24.8 Florida* 22 90.9% 15.0 32 71.9% 13.1 Idaho* 154 95.5% 17.8 153 94.1% 17.3 Iowa* 16 87.5% I0.1 61 96.7% 9.5 Kansas* 64 79.7% 16.1 63 71.4% 11.4 Michigan* 47 70.2% 8.4 82 68.3% I0.2 Minnesota* 203 87.7% 14.0 225 90.2% 14.8 Mississippi* 77 96.1 % 16.9 74 96.0% 16.8 Missouri - - - 31 61.3% 12.1 Montana* 465 93.8% 18.5 434 95.2% 17.9 Nebraska* 92 96.7% 12.1 69 92.8% 21.3 Nevada* 122 95.1 % 9.7 149 94.6% 9.4 New Mexico* 1,368 97.0% 17.2 1,659 97.5% 17.5 New York* 75 85.3% 8.3 74 85.1% 8.3 I
North Carolina* 87 89.7% 8.8 93 91.4% 9.7 North Dakota* 246 98.4% 16.0 277 96.4% 15.2 Oklahoma* 2,620 72.0% 9.1 2,407 73.7% 9.4 Oregon* 158 86.7% 18.8 150 82.7% 17.3 South Dakota* 657 97.3% 15.8 586 98.1% 15.3 Texas* 15 33.3% 12.2 85 52.9% 13.6 Utah* 49 95.9% 14.3 125 92.8% 19.3 Washington* 430 91.2% 17.8 475 90.1% 18.4 Wisconsin* 92 88.0% 12.4 99 85.9% 11.6 Wyoming* 99 93.9% 21.4 87 96.6% 20.1 Unknown 483 91.7% 20.8 - - TOTAL 11,341 89.1 % 15.4 11,341 89.6% 15.6•
* Reservation State - Missing data
As with the number of deaths, there was general agreement in the State of death and State of residence data on the percentage of decedents with Al/AN race consistently identified; however, there were four States with large discrepancies.(11] For example, of the 22 decedents in the IHS-NDI match file who resided in Florida, Al/AN race was consistently recorded for 90.9 percent. In contrast, of the 32 decedents in the IHS-NDI match file who died in Florida, only 71.9 percent had consistent race classification. The other States with large discrepancies were California and Texas.
There was no simple pattern in these discrepancies. In California, Maine, and Texas, the percent consistent was higher in the State of death than the State of residence. In Florida the reverse was observed-the percent consistent was greater in Florida as the State of residence than as the State of death.
14
l
The State of death data can be used to target States with high inconsistency rates in the identification of AI/AN race on death certificates. Table 4A presents the State of death data showing the total number of deaths reported as well as the number and percent of records with AI/AN race inconsistently identified on the State death certificate. The States are ranked from highest to lowest as a function of the percentage of decedents with AI/AN race inconsistently classified. The States with the greatest numbers of inconsistencies include Oklahoma (632), Alaska (52), Arizona (48), Washington (47), Arkansas (41), New Mexico (41), and Texas (40).
Table 4A shows several States with more than 100 AI/AN deaths which inconsistently classified the race of a high proportion of AI/AN decedents, including Oklahoma (26.3%), Oregon (17.3%), and California (11.1%).
3.2.1.3. Mean YPLL. Years of Potential Life Lost (YPLL) is computed as 65 minus the person's age at death, with the minimum value set at zero (i.e., negative values are treated as zero). While mortality rates cannot be computed for the matched IHS-NDI data (see section 2.1), it is possible to compute the mean YPLL (and other statistics) by IHS Area, State of death, and State of residence. Table 4 shows that the mean YPLL was generally similar for State of death and State of residence. Nevertheless, there were large discrepancies between mean YPLL for some States (e.g., Alabama and Nebraska). The mean YPLL was 4.5 for the 17 decedents who resided in Alabama compared to the mean YPLL of 13.7 for the 15 AI/ANs who died there. Similarly, in Nebraska, the mean YPLL for residents was 12.1 compared to 21.3 for AI/ANs who died there.
Based on the results of this study, approaches to identifying and targeting States (of death) for initiatives to improve the procedures used to identify the race of AI/AN decedents include:
States with the largest numbers ofA/JAN decedents with inconsistently classified race, States with the largest percentages ofA/JAN decedents with inconsistently classified race, a joint function of the number and percentage ofAllAN decedents with inconsistently classified race .
A joint function approach was used in this study-States were identified for targeting based on the number of AI/AN deaths with race inconsistently classified, so long as at least 10 AI/ANs were inconsistently classified and the percentage of classification was 10 percent (rounded) or more.[12] Using this criterion, States targeted for an initiative to improve identification of the race of AI/AN decedents would include Arkansas (43.6%), California (11.1 %), Kansas (28.6%), Michigan (31.7%), Minnesota (9.8%), Missouri (38.7%), New York (14.9%), Oklahoma (26.3%), Oregon (17.3%), Texas (47.1%), Washington (9.9%), and Wisconsin (14.1 % ).
15
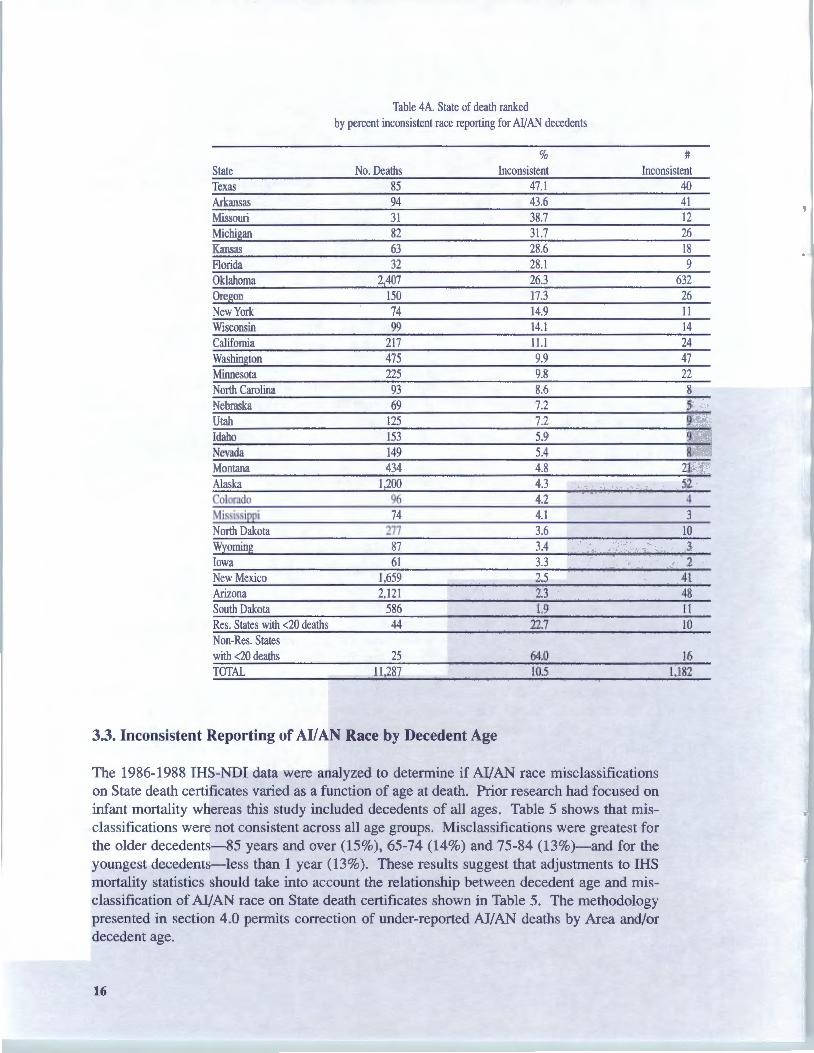
Table 4A. State of death ranked by percent inconsistent race reporting for AI/AN decedents
State No. Deaths %
Inconsistent #
Inconsistent Texas 85 47.l 40 Arkansas 94 43.6 41 Missouri 31 38.7 12 Michigan 82 31.7 26 Kansas 63 28.6 18 Florida 32 28.1 9 Oklahoma 2,407 26.3 632 Ore on 150 17.3 26 New York 74 14.9 11 Wisconsin 99 14.1 14 California 217 11.l 24 Washington 475 9.9 47 Minnesota 225 9.8 22 North Carolina 93 8.6 8 Nebraska 69 7.2 5 Utah 125 7.2 9 Idaho 153 5.9 9 Nevada 149 5.4 8 Montana 434 4.8 21 Alaska 1,200 4.3 52 Colorado 96 4.2 4 Mississippi 74 4.1 3 North Dakota 277 3.6 10 Wyoming 87 3.4 3 Iowa 61 3.3 2 New Mexico 1,659 2.5 41 Arizona 2,121 2.3 48 South Dakota 586 1.9 11 Res. States with <20 deaths 44 22.7 10 Non-Res. States with <20 deaths 25 64.0 16 TOTAL 11,287 10.5 1,182
3.3. Inconsistent Reporting of AI/ AN Race by Decedent Age
The 1986-1988 IHS-NDI data were analyzed to determine if AI/AN race misclassifications on State death certificates varied as a function of age at death. Prior research had focused on infant mortality whereas this study included decedents of all ages. Table 5 shows that misclassifications were not consistent across all age groups. Misclassifications were greatest for the older decedents-85 years and over (15%), 65-74 (14%) and 75-84 (13%)-and for the youngest decedents-less than 1 year (13%). These results suggest that adjustments to IHS mortality statistics should take into account the relationship between decedent age and misclassification of AI/AN race on State death certificates shown in Table 5. The methodology presented in section 4.0 permits correction of under-reported AI/AN deaths by Area and/or decedent age.
16
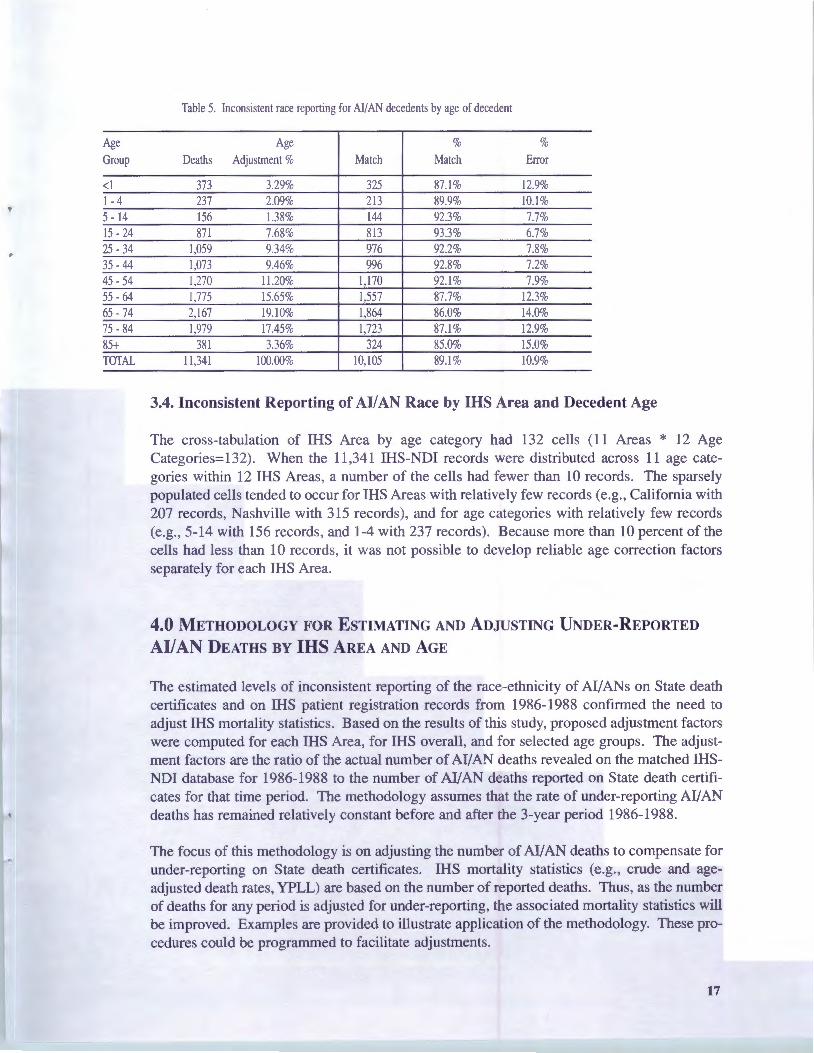
Table 5. Inconsistent race reporting for Al/AN decedents by age of decedent
Age Age % % Group Deaths Adjustment % Match Match Error
<l 373 3.29% 325 87.1% 12.9% 1-4 237 2.09% 213 89.9% 10.1 % 5 - 14 156 1.38% 144 92.3% 7.7% 15 - 24 871 7.68% 813 93.3% 6.7% 25 - 34 1,059 9.34% 976 92.2% 7.8% 35 - 44 1,073 9.46% 996 92.8% 7.2% 45 - 54 1,270 11.20% 1,170 92.1% 7.9% 55 - 64 1,775 15.65% 1,557 87.7% 12.3% 65 - 74 2,167 19.10% 1,864 86.0% 14.0% 75 - 84 1,979 17.45% 1,723 87.1% 12.9% 85+ 381 3.36% 324 85.0% 15.0% TOTAL 11,341 100.00% 10,105 89.1% 10.9%
3.4. Inconsistent Reporting of AI/ AN Race by IHS Area and Decedent Age
The cross-tabulation of IHS Area by age category had 132 cells (11 Areas * 12 Age Categories=132). When the 11 ,34 1 IHS-NDI records were distributed across 11 age categories within 12 IHS Areas, a number of the cells had fewer than 10 records. The sparsely populated cells tended to occur for IHS Areas with relatively few records (e.g., California with 207 records, Nashville with 315 records), and for age categories with relatively few records (e.g., 5-14 with 156 records, and 1-4 with 237 records) . Because more than 10 percent of the cells had less than 10 records, it was not possible to develop reliable age correction factors separately for each IHS Area.
4.0 METHODOLOGY FOR ESTIMATING AND ADJUSTING UNDER-REPORTED
Al/AN DEATHS BY IHS AREA AND AGE
The estimated levels of inconsistent reporting of the race-ethnicity of AI/ANs on State death certificates and on IHS patient registration records from 1986-1988 confirmed the need to adjust IHS mortality statistics. Based on the results of this study, proposed adjustment factors were computed for each IHS Area, for IHS overall, and for selected age groups. The adjustment factors are the ratio of the actual number of Al/AN deaths revealed on the matched IHSNDI database for 1986-1988 to the number of AI/AN deaths reported on State death certificates for that time period. The methodology assumes that the rate of under-reporting AI/AN deaths has remained relatively constant before and after the 3-year period 1986-1988.
The focus of this methodology is on adjusting the number of AI/AN deaths to compensate for under-reporting on State death certificates. IHS mortality statistics (e.g., crude and ageadjusted death rates, YPLL) are based on the number of reported deaths. Thus, as the number of deaths for any period is adjusted for under-reporting, the associated mortality statistics will be improved. Examples are provided to illustrate application of the methodology. These procedures could be programmed to facilitate adjustments.
17

4.1. Overview
4.1.1. Adjusting for under-reporting of AllAN deaths by IHS Area and overall IHS. Adjusting for under-reporting of Al/AN deaths for any IHS Area is straightforward. The adjustment factor for the Area(s) in question is simply multiplied by the reported (or estimated) number of Al/AN deaths in the Area(s) for a given year (shown on Table 6). The "reported deaths" are hypothetical data used to illustrate the proposed adjustment procedures; the "Adjustment Factors" are the actual factors to be used to adjust the number of deaths. The data in the column headed "Additional Deaths" are the product of the corresponding reported deaths multiplied by the adjustment factor. In this example, 9 additional persons would be added to the 327 reported in the Aberdeen Area to give a total of 336 deaths adjusted for under-reporting of Al/AN deaths specific to the Aberdeen Area. If the proposed adjustment methodology were adopted, all mortality statistics for the Aberdeen Area would be based on the adjusted number rather than the reported number of deaths.
Table 6 has the virtue of simplicity; however, the high percentage of males (61 %) in the matched IHS- NDI file (see discussion on page 12) suggests the importance of reporting mortality statistics by sex. While there were not enough observations in the IHS-NDI match file to permit the computation of reliable adjustment factors by sex within age group or IHS Area, adjusted deaths (computed using the proposed methodology) can be applied separately to males and females or to other groups. Table A4-1 in Appendix 4 illustrates the adjustment of reported deaths of males and females by IHS Area.
Table 6. Adjusting reported deaths by IRS Area
Reported Adjustment Adjusted Additional IHS Area Deaths Factor Deaths* Deaths*
Aberdeen 327 1.0264 336 9 Alaska 387 1.0559 409 22 Albuguergue 230 1.0537 242 12 Bemidji 111 J.l 921 132 21 Billings 177 1.0659 189 12 California 48 1.4375 69 21 Nashville 92 1.1371 105 13 Navajo 644 1.0124 652 8 Oklahoma City 650 1.3890 903 253 Phoenix 344 1.0465 360 16 Portland 223 1.0985 245 22 Tucson 135 1.0272 139 4 Total 3,368 3,781 413
*Rounded
18
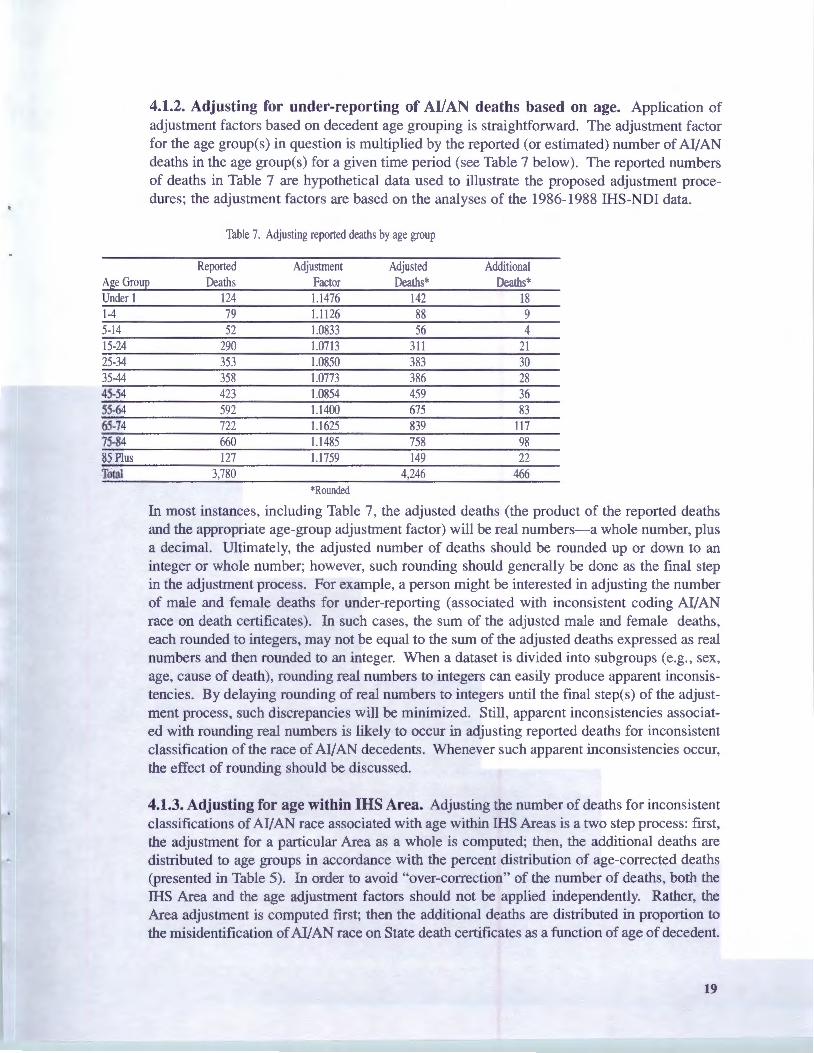
4.1.2. Adjusting for under-reporting of AllAN deaths based on age. Application of adjustment factors based on decedent age grouping is straightforward. The adjustment factor for the age group(s) in question is multiplied by the reported (or estimated) number of AI/AN deaths in the age group(s) for a given time period (see Table 7 below). The reported numbers of deaths in Table 7 are hypothetical data used to illustrate the proposed adjustment procedures; the adjustment factors are based on the analyses of the 1986-1988 IHS-NDI data.
Table 7. Adjusting reported deaths by age group
Reported Adjustment Adjusted Additional Age Group Deaths Factor Deaths* Deaths* Under 1 124 1.1476 142 18 1-4 79 1.1126 88 9 5-14 52 1.0833 56 4 15-24 290 1.0713 311 21 25-34 353 1.0850 383 30 35-44 358 1.0773 386 28 45-54 423 1.0854 459 36 55-64 592 1.1400 675 83 65-74 722 1.1625 839 117 75-84 660 1.1485 758 98 85 Plus 127 1.1759 149 22 Total 3,780 4,246 466
*Rounded
In most instances, including Table 7, the adjusted deaths (the product of the reported deaths and the appropriate age-group adjustment factor) will be real numbers-a whole number, plus a decimal. Ultimately, the adjusted number of deaths should be rounded up or down to an integer or whole number; however, such rounding should generally be done as the final step in the adjustment process. For example, a person might be interested in adjusting the number of male and female deaths for under-reporting (associated with inconsistent coding AI/AN race on death certificates). In such cases, the sum of the adjusted male and female deaths, each rounded to integers, may not be equal to the sum of the adjusted deaths expressed as real numbers and then rounded to an integer. When a dataset is divided into subgroups (e.g., sex, age, cause of death), rounding real numbers to integers can easily produce apparent inconsistencies. By delaying rounding of real numbers to integers until the final step(s) of the adjustment process, such discrepancies will be minimized. Still, apparent inconsistencies associated with rounding real numbers is likely to occur in adjusting reported deaths for inconsistent classification of the race of AI/AN decedents. Whenever such apparent inconsistencies occur, the effect of rounding should be discussed.
4.1.3. Adjusting for age within IHS Area. Adjusting the number of deaths for inconsistent classifications ofAI/AN race associated with age within IHS Areas is a two step process: first, the adjustment for a particular Area as a whole is computed; then, the additional deaths are distributed to age groups in accordance with the percent distribution of age-corrected deaths (presented in Table 5). In order to avoid "over-correction" of the number of deaths, both the IHS Area and the age adjustment factors should not be applied independently. Rather, the Area adjustment is computed first; then the additional deaths are distributed in proportion to the misidentification of AI/AN race on State death certificates as a function of age of decedent.
19
This approach assumes that the age distribution of the inconsistently classified Al/AN deaths is constant over all IHS Areas. While this assumption is not likely to be true, this is the best approach available until sufficient data become available to permit reliable determination of the distribution of inconsistent classifications of Al/AN race by age groups within each IHS Area.
The age within Area adjustment methodology consists of four steps described below. The hypothetical example presented in section 4.2 illustrates the methodology.
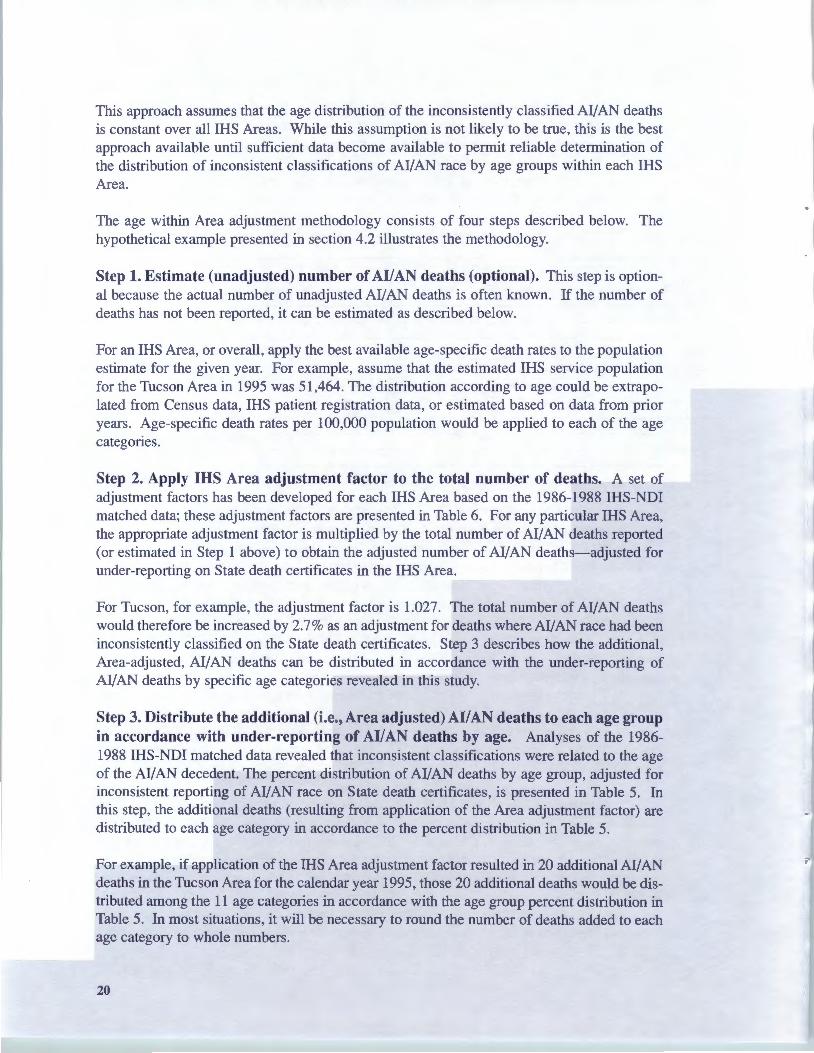
Step 1. Estimate (unadjusted) number of AI/AN deaths (optional). This step is optional because the actual number of unadjusted Al/AN deaths is often known. If the number of deaths has not been reported, it can be estimated as described below.
For an IHS Area, or overall, apply the best available age-specific death rates to the population estimate for the given year. For example, assume that the estimated IHS service population for the Tucson Area in 1995 was 51,464. The distribution according to age could be extrapolated from Census data, IHS patient registration data, or estimated based on data from prior years. Age-specific death rates per 100,000 population would be applied to each of the age categories.
Step 2. Apply IHS Area adjustment factor to the total number of deaths. A set of adjustment factors has been developed for each IHS Area based on the 1986-1988 IHS-NDI matched data; these adjustment factors are presented in Table 6. For any particular IHS Area, the appropriate adjustment factor is multiplied by the total number of Al/AN deaths reported (or estimated in Step 1 above) to obtain the adjusted number of Al/AN deaths-adjusted for under-reporting on State death certificates in the IHS Area.
For Tucson, for example, the adjustment factor is 1.027. The total number of Al/AN deaths would therefore be increased by 2.7% as an adjustment for deaths where AI/AN race had been inconsistently classified on the State death certificates. Step 3 describes how the additional, Area-adjusted, Al/AN deaths can be distributed in accordance with the under-reporting of Al/AN deaths by specific age categories revealed in this study.
Step 3. Distribute the additional (i.e., Area adjusted) AI/ AN deaths to each age group in accordance with under-reporting of AI/AN deaths by age. Analyses of the 19861988 IHS-NDI matched data revealed that inconsistent classifications were related to the age of the Al/AN decedent. The percent distribution of Al/AN deaths by age group, adjusted for inconsistent reporting of Al/AN race on State death certificates, is presented in Table 5. In this step, the additional deaths (resulting from application of the Area adjustment factor) are distributed to each age category in accordance to the percent distribution in Table 5.
For example, if application of the IHS Area adjustment factor resulted in 20 additional Al/AN deaths in the Tucson Area for the calendar year 1995, those 20 additional deaths would be distributed among the 11 age categories in accordance with the age group percent distribution in Table 5. In most situations, it will be necessary to round the number of deaths added to each age category to whole numbers.
20

Step 4. {Optional) Computation of YPLL and other mortality statistics. In computations involving YPLL, each death added as a result of applying the Area and/or age adjustment factors should be assigned a specific age. Since the actual age of death will be unknown for each death added as part of the adjustment procedure, the median age of the age group to which each death is assigned is a reasonable proxy for the purpose of computing YPLL.
The adjusted numbers of deaths are easily incorporated into some mortality statistics such as crude death rates and age-adjusted mortality rates-the adjusted number of deaths (adjusted for miscoding of AI/AN race on death certificates) are simply substituted for the reported number of deaths; however, the utilization of the adjusted numbers of deaths is more complicated for other mortality statistics including distributions for specific causes of death and mortality rates for specific causes of death. The IHS-NDI match file contained no information on the cause of death. Absent such information, the adjustment methodology cannot, at this time, incorporate adjustments for specific causes of death. One way of distributing the additional deaths produced by the adjustment methodology would be to distribute the additional deaths in proportion to the percent distribution of causes of death for the age and sex group to which the additional deaths have been assigned. When the adjusted number of deaths is small, as in the following hypothetical example, only a few causes of death are likely to be affected by the distribution of additional deaths resulting from the adjustment methodology.
For some IHS Areas or age groups, the addition of only one death to a specific cause of death might greatly affect the rate for that specific cause. To the degree that the additional death is influenced by rounding or other factor unrelated to the under-reporting of AI/AN death because of errors on death certificates, the assignment of additional deaths to specific causes of death could be misleading; however, at least for the IHS-NDI data analyzed in this project, the under-reporting of AI/ AN deaths is known and quantified by IHS Area and age of decedent. Thus, distribution of the additional deaths to specific cause of death categories should increase the validity of the corresponding rate notwithstanding modest rounding effects.
4.2. Hypothetical Example of the Adjustment Methodology
Step 1. Compute unadjusted number of expected AI/ AN deaths (if data needed to perform this calculation are available). Assume a population projection for a given IHS Area in a given time period is 51,464, and that the population is stratified into 11 age groups. Age group "less than 1 year" (<1) includes 2,000 people; age group "1 -4 years" includes 5,000 people; age group "85+" includes 464 people with the remaining 10-year age groups distributed as shown in Table 8 (see column "B" in Table 8). Assume the age-specific death rates [unadjusted for under-reporting AI/AN deaths on State death certificates] for each of the age strata have been identified as shown in column "C" of Table 8. Therefore, the expected number of deaths could be determined by multiplying the population in each age strata for a given year (column "B" in Table 8) by the death rate per thousand in each age strata (column "C") and then dividing by 1,000-this expected number of deaths is shown in column "D" in Table 8; the total expected number of deaths (rounded to whole numbers) in this example is 240.
This step will be unnecessary if the (unadjusted) number of AI/AN deaths is known.
21
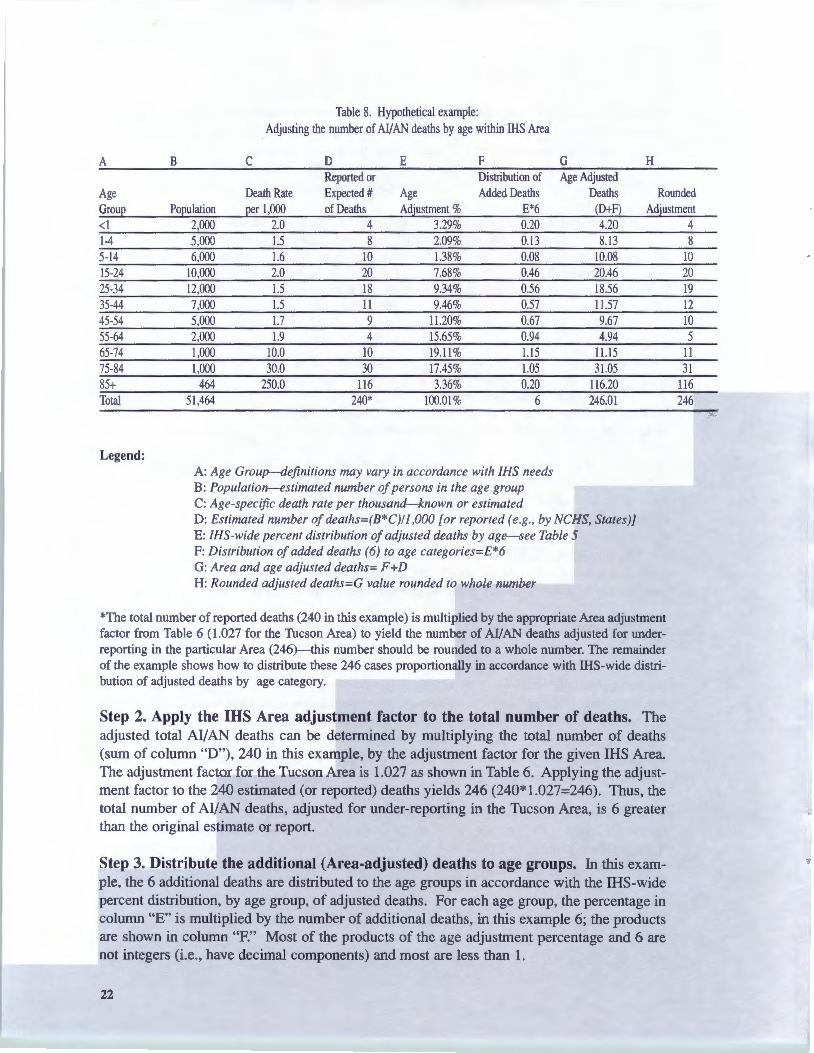
Table 8. Hypothetical example: Adjusting the number of AJ.fAN deaths by age within IHS Area
A B c D E F G H Reported or Distribution of Age Adjusted
Age Death Rate Expected# Age Added Deaths Deaths Rounded Group Population per 1,000 of Deaths Adjustment % E*6 (D+F) Adjustment <l 2,000 2.0 4 3.29% 0.20 4.20 4 1-4 5,000 1.5 8 2.09% 0.13 8.13 8 5-14 6,000 1.6 10 1.38% 0.08 10.08 10 15-24 10,000 2.0 20 7.68% 0.46 20.46 20 25-34 12,000 1.5 18 9.34% 0.56 18.56 19 35-44 7,000 1.5 11 9.46% 0.57 11.57 12 45-54 5,000 1.7 9 11.20% 0.67 9.67 10 55-64 2,000 1.9 4 15.65% 0.94 4.94 5 65-74 1,000 10.0 10 19.11 % 1.15 11.15 11 75-84 1,000 30.0 30 17.45% 1.05 31.05 31 85+ 464 250.0 116 3.36% 0.20 116.20 116 Total 51,464 240* 100.01% 6 246.01 246
Legend: A: Age Group--definitions may vary in accordance with /HS needs B: Population-estimated number ofpersons in the age group C: Age-specific death rate per thousand-known or estimated D: Estimated number ofdeaths=(B*C)/1,000 [or reported (e.g., by NCHS, States)] E: /HS-wide percent distribution ofadjusted deaths by age-see Table 5 F: Distribution of added deaths (6) to age categories=E*6 G: Area and age adjusted deaths= F +D H: Rounded adjusted deaths=G value rounded to whole number
*The total number ofreported deaths (240 in this example) is multiplied by the appropriate Area adjustment factor from Table 6 (1.027 for the Tucson Area) to yield the number of AI/AN deaths adjusted for underreporting in the particular Area (246)-this number should be rounded to a whole number. The remainder of the example shows how to distribute these 246 cases proportionally in accordance with IHS-wide distribution of adjusted deaths by age category.
Step 2. Apply the IHS Area adjustment factor to the total number of deaths. The adjusted total Al/AN deaths can be determined by multiplying the total number of deaths (sum of column "D"), 240 in this example, by the adjustment factor for the given IHS Area. The adjustment factor for the Tucson Area is 1.027 as shown in Table 6. Applying the adjustment factor to the 240 estimated (or reported) deaths yields 246 (240* 1.027=246). Thus, the total number of Al/AN deaths, adjusted for under-reporting in the Tucson Area, is 6 greater than the original estimate or report.
Step 3. Distribute the additional (Area-adjusted) deaths to age groups. In this example, the 6 additional deaths are distributed to the age groups in accordance with the IHS-wide percent distribution, by age group, of adjusted deaths. For each age group, the percentage in column "E" is multiplied by the number of additional deaths, in this example 6; the products are shown in column "F." Most of the products of the age adjustment percentage and 6 are not integers (i.e., have decimal components) and most are less than 1.
22

The added deaths, distributed by age category, in column "F", are added to the expected (or reported) deaths in column "D"; the resulting sums are displayed in column "G." Finally, the number of deaths, now adjusted by IHS Area and by age group for inconsistent race reporting, are rounded to whole numbers in column "H." In this example, the adjusted total of deaths is 246 persons-the additional 6 deaths are assigned to the 25-34, 35-44, 45-54, 55-64, 65-74, 75-84 age groups. This same procedure can be used for alternate age strata.
5.0 RECOMMENDATIONS
Based on the analyses of the IHS-NDI matched data, the following recommendations are made.
1. Replicate the study using data on deaths occurring since 1988. While the results of this study are unambiguous-substantial numbers of Al/AN deaths are under-reported in most States and in most IHS Areas-the analysis of more recent data would permit the determination of trends as well as the updating of the adjustment factors reported in this study.
With additional data, it may be possible to expand and enhance the methodology to 1) establish a single set of adjustment factors that express both Area and age effects, and 2) to determine if there is a relationship between specific causes of death and inconsistent reporting of Al/AN race on death certificates. If such a relationship were found, appropriate adjustment factors could be developed.
2. Use adjustment factors developed in this study. When publishing information on and when basing decisions on death rates, IHS should consider using the adjustment factors computed in this study rather than the unadjusted numbers reported by States or other sources based on unadjusted State data (e.g., NDI). The adjustment factors can be applied to death statistics retroactively as well as prospectively.
3. Work with States to decrease inconsistent race reporting. IHS should work with States and local agencies to improve the classification of Al/ AN race on death certificates. This report identifies the States with the most severe problems (based on the number of Al/AN decedents inconsistently reported, with at least 10 percent (rounded) Al/ANs inconsistently reported)-Arkansas, California, Kansas, Michigan, Minnesota, Missouri, New York, Oklahoma, Oregon, Texas, Wisconsin, and Washington. Targeting these States is likely to produce the greatest improvement for resources invested.
23

APPENDIX 1. DESCRIPTION OF DATA ELIMINATED FROM THE ANALYSES
Of the 12,086 records in the IHS-NDI matched file developed in Phase 1 of this study, a total of 745 (6.2%) records were excluded from the analysis because they lacked one or more critical variables (e.g., date of birth, sex, race) or because they had "impossible" values (e.g., date of birth later than date of death). Thus, a total of 11,341 records were available for analysis. Despite missing data which might be useful to determining the level of inconsistent reporting of Al/AN race on State death certificates, some or all of the 745 eliminated records could be compared to the 11,341 records included in the analyses. These comparisons are presented below.
Table Al-1 compares the included and excluded records across IHS Areas. The number of excluded records range from a low of 13 in California to a high of 190 in Oklahoma. The last column of Table A 1-1 shows the percentage of the total records excluded by Area. These percentages range from a low of 4.1 percent for Bemidji to a high of 8.4 percent for Albuquerque. The total 745 records excluded represents 6.2 percent of the total 12,086 records in the IHSNDI match file .
Table Al-1. Inconsistent identification of AI/AN race for included and excluded records
INCLUDED CASES EXCLUDED CASES Total No. of %Race % No. of %Race % %
IHS Area Records Deaths Consistent Inconsistent Deaths Consistent Inconsistent Excluded Aberdeen 1,060 1,008 97.4% 2.6% 52 98.1% 1.9% 4.9% Alaska 1,296 1,226 94.7% 5.3% 70 95.7% 4.3% 5.4% Albuquerque 793 726 94.9% 5.1% 67 92.5% 7.5% 8.4% Bemidji 414 397 83.9% 16.1% 17 76.5% 23.5% 4.1% Billings 606 566 93.8% 6.2% 40 97.5% 2.5% 6.6% California 220 207 69.6% 30.4% 13 61.5% 38.5% 5.9% Nashville 334 315 87.9% 12.1% 19 84.2% 15.8% 5.7% Navajo 2,107 1,955 98.8% 1.2% 152 98.7% 1.3% 7.2% Oklahoma City 2,900 2,710 72.0% 28.0% 190 73.7% 26.3% 6.6% Phoenix 1,127 1,080 95.6% 4.4% 47 91.5% 8.5% 4.2% Portland 789 736 91.0% 9.0% 53 88.7% 11.3% 6.7% Tucson 440 415 97.3% 2.7% 25 100.0% 0.0% 5.7% TOTAL 12,086 11,341 89.1% 10.9% 745 88.7% 11.3% 6.2%
Overall, AI/AN race was inconsistently reported on 10.9 percent of the included cases compared to 11 .3 percent on the excluded cases. While this difference is not significant (Chi Square=0.1, df=l, >.05), the direction of the difference suggests that the exclusion of the faulty records slightly attenuated the level of inconsistent race reporting in the study. There is no pattern in the differences in the consistency of Al/AN race between the included and excluded groups across IHS Areas-for 5 of the 12 IHS Areas, the percent inconsistently reported was greater in the included cases, and for 7 of the Areas the reverse was the case. The size of the disparity was greatest for the Bemidji (16.1 % vs. 23.5%), California (30.4% vs. 38.5%), and Phoenix (4.4% vs. 8.5%) Areas. In each of these Areas, the percentage of inconsistent race reporting was greater in the excluded than the included records. Nevertheless, the number of cases excluded in these three Areas (17, 13, and 47) are small in
24
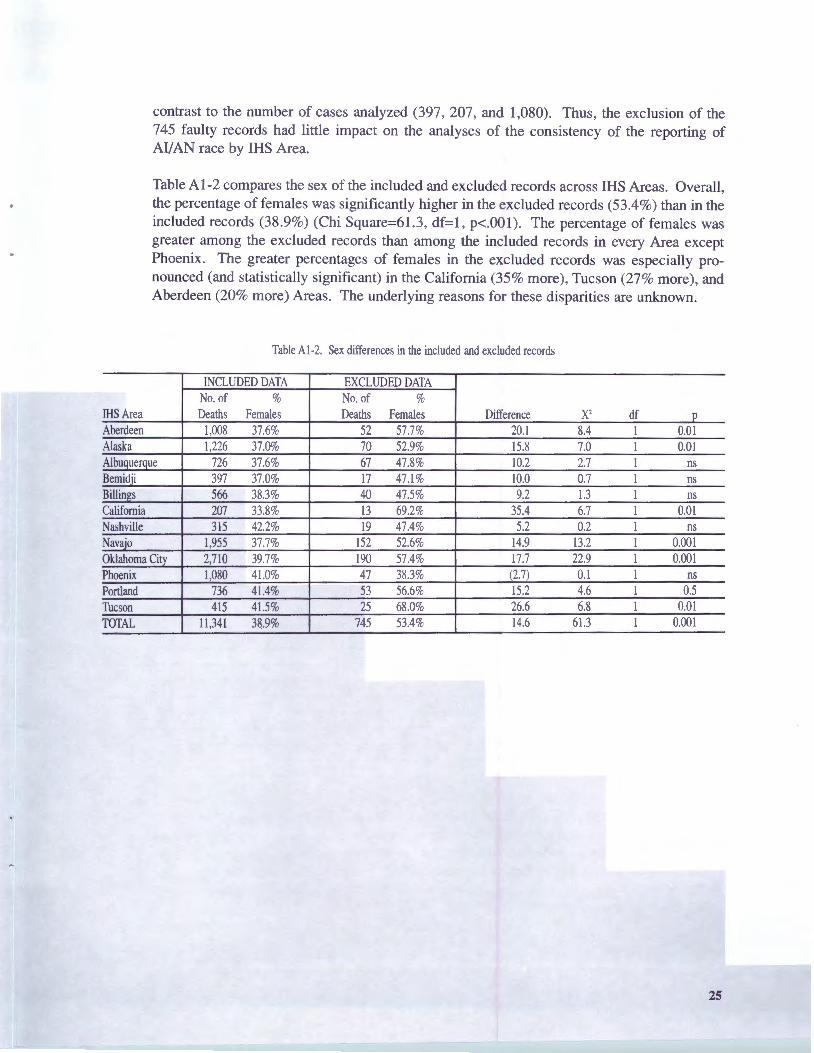
contrast to the number of cases analyzed (397, 207, and 1,080). Thus, the exclusion of the 745 faulty records had little impact on the analyses of the consistency of the reporting of Al/ AN race by IHS Area.
Table Al-2 compares the sex of the included and excluded records across IHS Areas. Overall, the percentage of females was significantly higher in the excluded records (53.4%) than in the included records (38.9%) (Chi Square=61.3, df=l, p<.001). The percentage of females was greater among the excluded records than among the included records in every Area except Phoenix. The greater percentages of females in the excluded records was especially pronounced (and statistically significant) in the California (35% more), Tucson (27% more), and Aberdeen (20% more) Areas. The underlying reasons for these disparities are unknown.
Table Al-2. Sex differences in the included and excluded records
INCLUDED DATA EXCLUDED DATA No. of % No. of %
IHS Area Deaths Females Deaths Females Difference x2 df 0
Aberdeen 1,008 37.6% 52 57.7% 20.1 8.4 I 0.01 Alaska 1,226 37.0% 70 52.9% 15.8 7.0 I 0.01 Albuquerque 726 37.6% 67 47.8% 10.2 2.7 I ns Bemid ji 397 37.0% 17 47.1% 10.0 0.7 I ns Billin11:s 566 38.3% 40 47.5% 9.2 1.3 I ns California 207 33.8% 13 69.2% 35.4 6.7 I 0.01 Nashville 315 42.2% 19 47.4% 5.2 0.2 I ns Navajo 1,955 37.7% 152 52.6% 14.9 13.2 I 0.001 Oklahoma Citv 2,710 39.7% 190 57.4% 17.7 22.9 I 0.001 Phoenix 1,080 41.0% 47 38.3% (2.7) 0.1 I ns Portland 736 41.4% 53 56.6% 15.2 4.6 I 0.5 Tucson 415 41.5% 25 68.0% 26.6 6.8 1 0.01 TOTAL 11,341 38.9% 745 53.4% 14.6 61.3 1 0.001
25

.APPENDIX 2. COMPUTATION OF IHS AREA AND AGE GROUP ADJUsrMENf FACTORS
Table A2-1 summarizes the 1986-1988 IHS-NDI matched data by IHS Area. The IHS Areas are listed in column "A." The total number of deaths recorded in the IHS-NDI matched file are presented in column "B ." The number of IHS-ND I records in which race of the decedent was consistently identified as AI/AN on the State death certificates (when compared to the IHS patient registration record for the same person) appears in column "C." The percentage of IHS-NDI records with AI/ AN race consistently identified is presented in column "D"-the values in column "D" are equal to the number of records with AI/ AN race consistent! y coded (column "C") divided by the total number of records for the IHS Area (column B) multiplied by 100. The percentage of records with AI/AN race inconsistently reported on State death certificates appears in column E-these values are equal to 100 minus the corresponding percent race consistent (column "D"). Finally, the adjustment factor for each IHS Area is presented in column "F"-these values are the quotient of the total deaths reported (column "B") divided by the number of records with AI/AN race consistently identified (column "C"). Thus, by multiplying the adjustment factor times the number of decedents identified as AI/AN on State death certificates, the adjusted number of AI/AN deaths is obtained.
Table A2-l. Factors for adjusting number of AI/AN deaths, by IHS Area, based on analyses of 1986-1988 IHS-NDI matched data
Number IHS Area Al/AN Race %AI/AN Race %Race Adjustment
IHS Area Deaths Consistent Consistent Inconsistent Factor A B c D E F Aberdeen l,008 982 97.4% 2.6% 1.026 Alaska 1,226 1,161 94.7% 5.3% 1.056 Albuguergue 726 689 94.9% 5.1 % 1.054 Bemidji 397 333 83.9% 16.1% 1.192 Billings 566 531 93.8% 6.2% 1.066 California 207 144 69.6% 30.4% 1.438 Nashville 315 277 87.9% 12.1% 1.137 Navajo 1,955 1,931 98.8% 1.2% 1.012 Oklahoma City 2,710 1,951 72.0% 28.0% 1.389 Phoenix 1,080 1,032 95.6% 4.4% 1.047 Portland 736 670 91.0% 9.0% 1.099 Tucson 415 404 97.4% 2.7% 1.027 TOTAL 11341 10105 89.1 % 10.9% 1.122
Table A2-2 summarizes the 1986-1988 IHS-NDI matched data by decedent age. The data in Table A2-2 parallel that of Table A2-1 with the exception that age-groups appear in column "A." Thus, the adjusted number of AI/AN deaths can be obtained, for any age group, by multiplying the number of AI/AN deaths reported on State death certificates by the adjustment factor for that group.
26
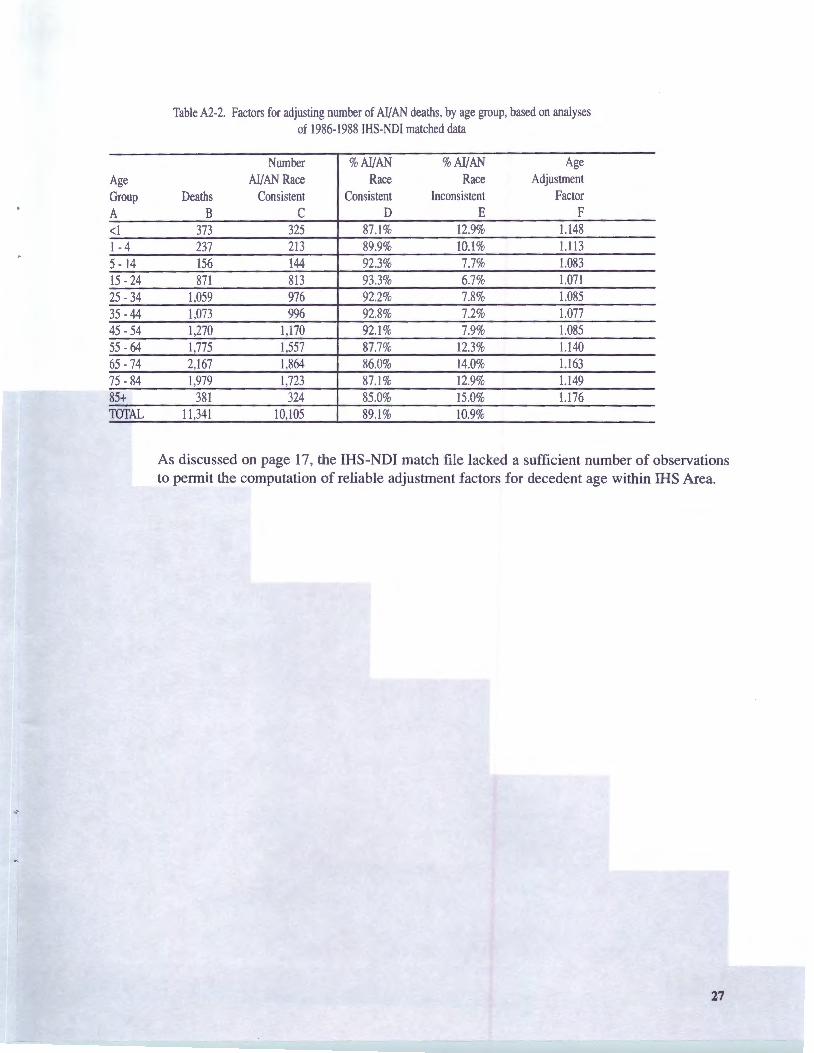
Table A2-2. Factors for adjusting number of Al/AN deaths, by age group, based on analyses of 1986-1988 IHS-NDI matched data
Number %Al/AN %Al/AN Age Age Al/AN Race Race Race Adjustment Group Deaths Consistent Consistent Inconsistent Factor A B c D E F <I 373 325 87.1% 12.9% 1.148 I - 4 237 213 89.9% 10.1% 1.113 5 - 14 156 144 92.3% 7.7% 1.083 15 - 24 871 813 93.3% 6.7% 1.071 25 - 34 1,059 976 92.2% 7.8% 1.085 35 - 44 1,073 996 92.8% 7.2% 1.077 45 - 54 1,270 1,170 92.1 % 7.9% 1.085 55 - 64 1,775 1,557 87.7% 12.3% 1.140 65 - 74 2,167 1,864 86.0% 14.0% 1.163 75 - 84 1,979 1,723 87.1 % 12.9% 1.149 85+ 381 324 85.0% 15.0% 1.176 TOTAL 11 ,341 10,105 89.1% 10.9%
As discussed on page 17, the IHS-NDI match file lacked a sufficient number of observations to permit the computation of reliable adjustment factors for decedent age within IHS Area.
27
APPENDIX 3. COMPUTATION OF ADJUSTMENT FACTORS FOR STATE OF REsIDENCE AND
STATE OF DEATH
Table A3-1 summarizes the 1986-1988 IHS-NDI matched data by State of residence. The decedent's State of residence is listed in column "A." The total number of deaths recorded for the State in the IHS-NDI matched file are presented in column "B." The number of IHS-NDI records in which race of the decedent was consistently identified as AI/AN on the State death certificates appears in column "C." The percentage of IHS-NDI records with AI/AN race consistently identified is presented in column "D"-the values in column "D" are equal to the number of records with AI/AN race consistently coded (column "C") divided by the total number of records for the State of residence (column B) multiplied by 100. The percentage of records with AI/AN race inconsistently identified on State death certificates appears in column E-these values are equal to 100 minus the corresponding percent race consistently identified (column "D"). Finally, the adjustment factor for each State of residence is presented in column "F"-these values are the quotient of the total deaths reported (column "B") divided by the number of records with AI/AN race consistently identified (column "C"). Thus, by multiplying the adjustment factor times the number of decedents identified as AI/AN on State death certificates, the adjusted number of AI/AN deaths is obtained. Table 3.2 presents comparable data by State of death. It is important to note that some of the States in Tables 3-1 and 3-2 reported very few AI/AN deaths. For States with fewer than 30 AI/AN deaths, the reported adjustment factors should be considered unreliable and used only with great caution.
Inspection of Table A3-1 and Table A3-2 reveals that there were insufficient numbers of observations in the IHS-NDI match file to compute reliable adjustment factors by age group or sex for most States. Most of the States would have less than 10 observations in some or all of the 11 age categories or the 22 age by sex categories. In reporting mortality statistics based on adjusted numbers of deaths, the adjusted deaths can be distributed by sex and age as shown in Appendix 4 or as discussed on page 18.
28
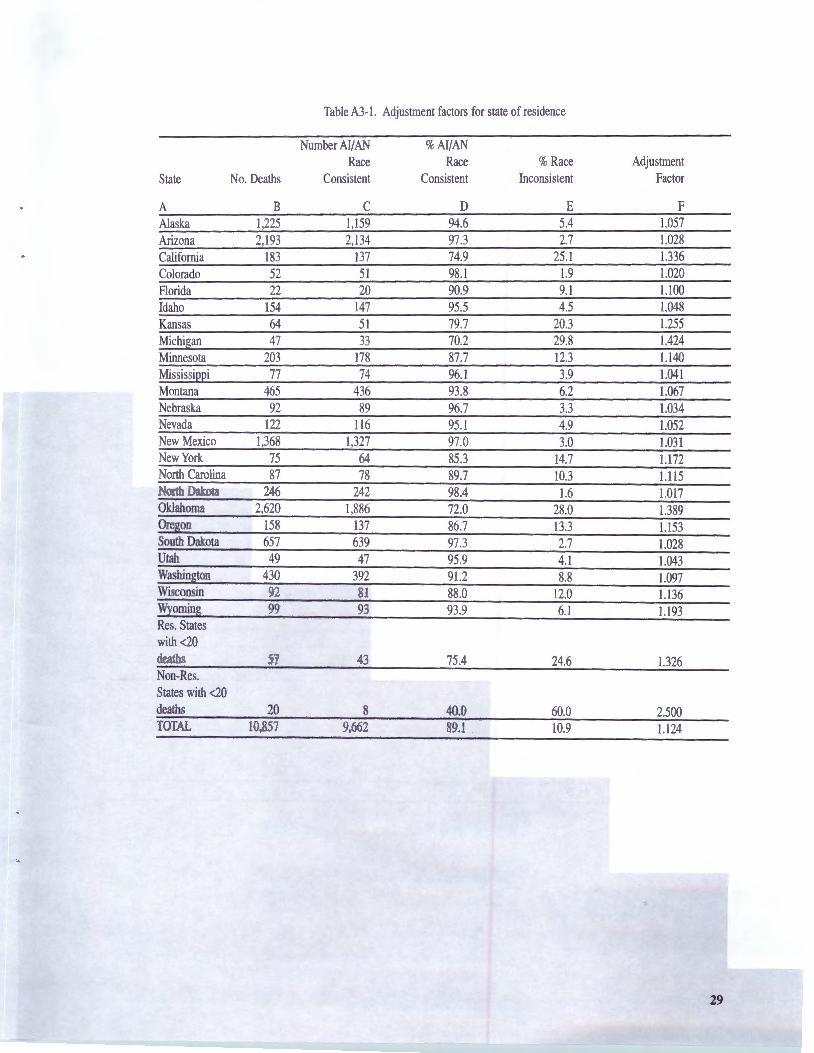
Table A3- l. Adjustment factors for state of residence
Number Al/AN %AI/AN Race Race %Race Adjustment
State No. Deaths Consistent Consistent Inconsistent Factor
A B c D E F Alaska 1,225 1,159 94.6 5.4 1.057 Arizona 2,193 2,134 97.3 2.7 1.028 California 183 137 74.9 25 .l 1.336 Colorado 52 51 98.l 1.9 1.020 Florida 22 20 90.9 9.1 1.100 Idaho 154 147 95.5 4.5 1.048 Kansas 64 51 79.7 20.3 1.255 Michigan 47 33 70.2 29.8 1.424 Minnesota 203 178 87.7 12.3 1.140 Mississippi 77 74 96.1 3.9 1.041 Montana 465 436 93.8 6.2 1.067 Nebraska 92 89 96.7 3.3 1.034 Nevada 122 116 95.1 4.9 1.052 New Mexico 1,368 1,327 97.0 3.0 1.031 New York 75 64 85.3 14.7 1.172 North Carolina 87 78 89.7 10.3 1.115 North Dakota 246 242 98.4 1.6 1.017 Oklahoma 2,620 1,886 72.0 28.0 1.389 Oregon 158 137 86.7 13.3 1.153 South Dakota 657 639 97.3 2.7 1.028 Utah 49 47 95.9 4.1 1.043 Washington 430 392 91.2 8.8 1.097 Wisconsin 92 81 88.0 12.0 1.136 Wyoming 99 93 93.9 6.1 1.193 Res. States with <20 deaths 57 43 75.4 24.6 1.326 Non-Res. States with <20 deaths 20 8 40.0 60.0 2.500 TOTAL 10,857 9,662 89.l 10.9 1.124
29
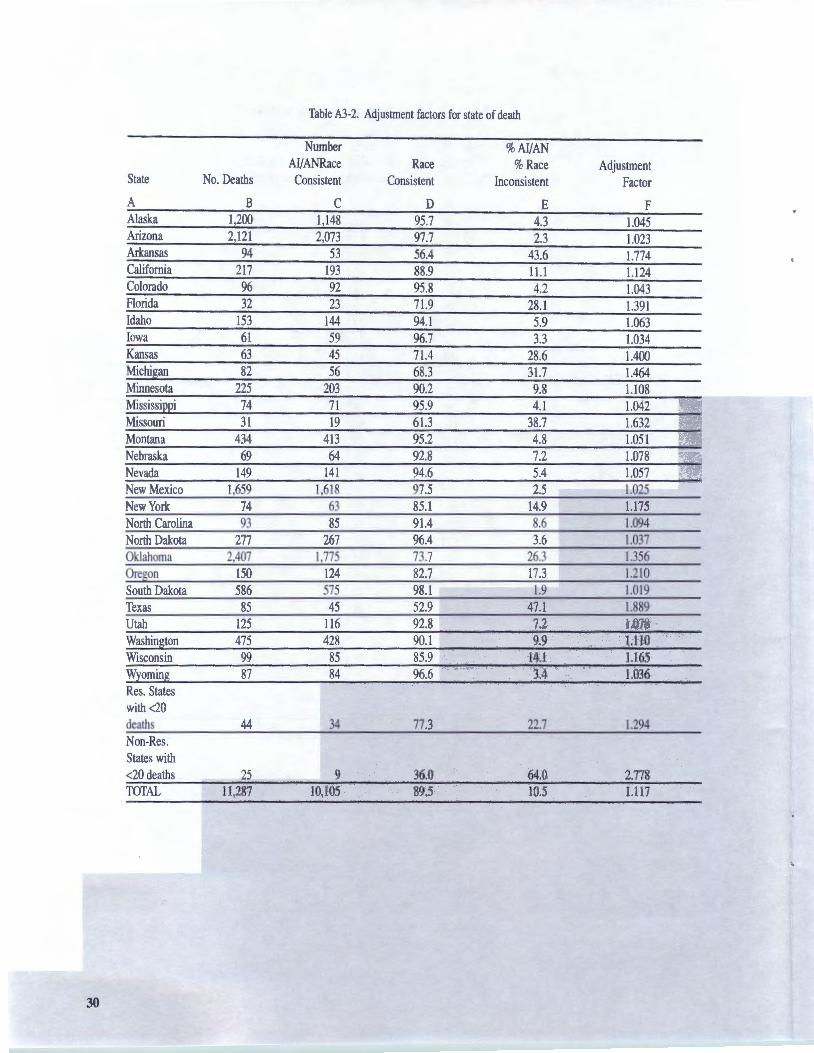
Table A3-2. Adjustment factors for state of death
Number %AI/AN AI/ANRace Race %Race Adjustment
State No. Deaths Consistent Consistent Inconsistent Factor
A B c D E F Alaska 1,200 1,148 95.7 4.3 1.045 Arizona 2,121 2,073 97.7 2.3 1.023 Arkansas 94 53 56.4 43.6 1.774 California 217 193 88.9 11.1 1.124 Colorado 96 92 95.8 4.2 1.043 Florida 32 23 71.9 28.1 1.391 Idaho 153 144 94.1 5.9 1.063 Iowa 61 59 96.7 3.3 1.034 Kansas 63 45 71.4 28.6 1.400 Michigan 82 56 68.3 31.7 1.464 Minnesota 225 203 90.2 9.8 1.108 Mississippi 74 71 95.9 4.1 1.042 Missouri 31 19 61.3 38.7 1.632 Montana 434 413 95.2 4.8 1.051 Nebraska 69 64 92.8 7.2 1.078 Nevada 149 141 94.6 5.4 1.057 New Mexico 1,659 1,618 97.5 2.5 1.025 New York 74 63 85.l 14.9 1.175 North Carolina 93 85 91.4 8.6 1.094 North Dakota 277 267 96.4 3.6 1.037 Oklahoma 2,407 1,775 73.7 26.3 1.356 Oregon 150 124 82.7 17.3 1.210 South Dakota 586 575 98.1 1.9 1.019 Texas 85 45 52.9 47.1 1.889 Utah 125 116 92.8 7.2 1.078 Washington 475 428 90.1 9.9 1.110 Wisconsin 99 85 85.9 14.1 1.165 Wyoming 87 84 96.6 3.4 1.036 Res. States with <20 deaths 44 34 77.3 22.7 1.294 Non-Res. States with <20 deaths 25 9 36.0 64.0 2.778 TOTAL 11,287 10,105 89.5 10.5 1.117
30

APPENDIX 4. ADJUSTING REPoRTED DEATHS OF MALES AND FEMALES BY IllS AREA
Table 6 on page 19 illustrated how IHS Area adjustment factors (AFs) could be applied to adjust for under-reporting of AI/AN deaths on State death certificates. Table A4-1 below shows how Area AFs can be applied to males and females within Areas. The total reported, adjusted, and additional deaths are the same in Table 6 and Table A4-l. Of course, the Area AFs are the same too; however, Table A4-1 breaks out the total reported, adjusted, and additional deaths by sex (the numbers used for male and female reported deaths are hypothetical, used for purposes of illustrating the methodology). Examination of Table A4-1 reveals that problems associated with rounding real numbers up or down to integers can occur. For example, for the Aberdeen Area, the adjusted deaths for males and females is 209.4 and 126.3 respectively, and the sum of these values is 335.7. Note that the sum of the rounded numbers is 335 (209 + 126); however the sum of the two real numbers (335.7) rounds to 336. The same rounding problem occurs for the corresponding additional deaths for the Aberdeen Area. Differences in rounding account for the slight differences in the totals of Table 6 and Table A4-l.
A practical approach to the rounding problem is to perform the rounding at the most important level of analysis to the user. In this example, if the user is more interested in comparisons of Area totals, rounding would be performed on Area totals. If the user is more interested in issues associated with the sex of the decedent, the data would be rounded for each sex, and the totals would be based on these rounded values in order to maximize internal consistency of the data and analyses.
Table A4-1. Adjusting reported male and female deaths by IHS Area
Reported Deaths Adjusted Deaths Additional Deaths IHS Area Males Females Total Adjustment Males Females Total Males Females Total
Factor Aberdeen 204 123 327 1.0264 209.4 126.3 335.7 5.4 3.3 8.7 Alaska 244 143 387 1.0559 257.7 151.0 408.7 13.7 8.0 21.7 Albu9uer9ue 144 86 230 1.0537 151.7 90.6 242.4 7.7 4.6 12.4 Bemidji 70 41 111 1.1921 83.5 48.9 132.3 13.5 7.9 21.3 Billings 109 68 177 1.0659 116.2 72.5 188.7 7.2 4.5 11.7 California 32 16 48 1.4375 46.0 23.0 69.0 14.0 7.0 21.0 Nashville 53 39 92 1.1371 60.3 44.4 104.6 7.3 5.4 12.6 Navajo 401 243 644 1.0124 406.0 246.0 652.0 5.0 3.0 8.0 Oklahoma Ci!X 392 258 650 1.3890 544.5 358.4 902.9 152.5 100.4 252.9 Phoenix 203 141 344 1.0465 212.4 147.6 360.0 9.4 6.6 16.0 Portland 131 92 223 1.0985 143.9 101.1 245.0 12.9 9.1 22.0 Tucson 79 56 135 1.0272 81.2 57.5 138.7 2.2 1.5 3.7 Total 2,062 1,306 3,368 1.1223 2,312.7 1,467.l 3,779.8 250.7 161.1 411.8
As with the Area adjustments described above, one can adjust male and female deaths by age category. Table 7 on page 19 illustrated the adjustment of under-reporting of AI/AN deaths by age group. A4-2 shows adjustments applied to males and females within the 11 age categories.
31
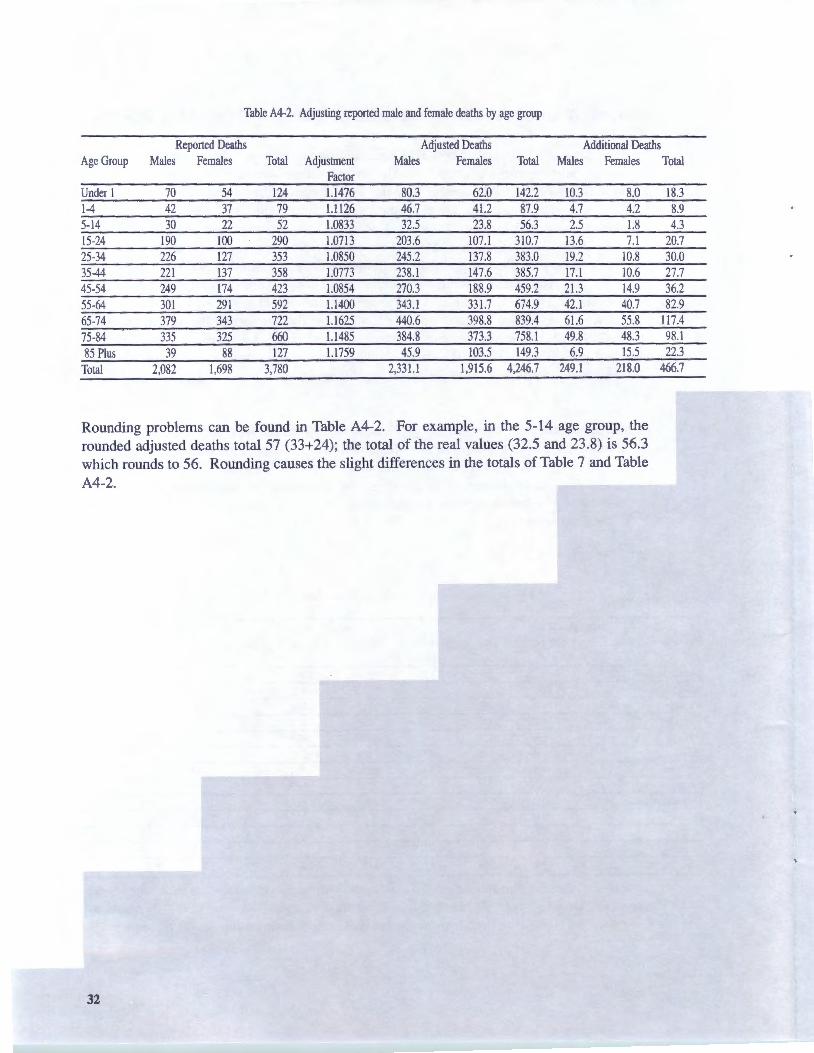
Table A4-2. Adjusting reported male and female deaths by age group
Reported Deaths Adjusted Deaths Additional Deaths Age Group Males Females Total Adjustment Males Females Total Males Females Total
Factor Under 1 70 54 124 1.1476 80.3 62.0 142.2 10.3 8.0 18.3 1-4 42 37 79 1.1126 46.7 41.2 87.9 4.7 4.2 8.9 5-14 30 22 52 1.0833 32.5 23.8 56.3 2.5 1.8 4.3 15-24 190 100 290 1.0713 203.6 107.l 310.7 13.6 7.1 20.7 25-34 226 127 353 1.0850 245.2 137.8 383.0 19.2 10.8 30.0 35-44 221 137 358 1.0773 238.l 147.6 385.7 17.1 10.6 27.7 45-54 249 174 423 1.0854 270.3 188.9 459.2 21.3 14.9 36.2 55-64 301 291 592 1.1400 343.l 331.7 674.9 42.l 40.7 82.9 65-74 379 343 722 1.1625 440.6 398.8 839.4 61.6 55.8 117.4 75-84 335 325 660 1.1485 384.8 373.3 758.1 49.8 48.3 98.l 85 Plus 39 88 127 1.1759 45.9 103.5 149.3 6.9 15.5 22.3
Total 2,082 1,698 3,780 2,331.1 1,915.6 4,246.7 249.l 218.0 466.7
Rounding problems can be found in Table A4-2. For example, in the 5-14 age group, the rounded adjusted deaths total 57 (33+24); the total of the real values (32.5 and 23.8) is 56.3 which rounds to 56. Rounding causes the slight differences in the totals of Table 7 and Table A4-2.
32

LIST OF FIGURES AND TABLES
Table 1. Comparison of AI/AN and white infant mortality rates (IMRs) based on different methods of identifying decedent race . . . . . . . . . . . . . . . . . . . . . . . . . . 4
Table Al-1. Inconsistent identification of AI/AN race for included and
Table A2-1. Factors for adjusting number of AI/AN deaths, by IHS Area, based
Table A2-2. Factors for adjusting number of AI/AN deaths, by age group, based
Table 2. Percent distribution of deaths in the IHS-NDI matched file and IHS service population in 1988 . . . . . . . . . . . . . . . . . . . . . . . . . . . . . . . . . . . . . . . . . 10
Table 2a. IHS patient registration records by type submitted to the NDI for matching purposes by IHS Area of residence of the patient . . . . . . . . . . . . . . . . 11
Table 3. Characteristics of IHS-NDI records by IHS Area . . . . . . . . . . . . . . . . . . . . . . . . 12
Table 4. Comparison of State of death and State of residence data . . . . . . . . . . . . . . . . . 14
Table 4A. State of death ranked by percent inconsistent race reporting for AI/AN decedents . . . . . . . . . . . . . . . . . . . . . . . . . . . . . . . . . . . . . . . . . . . . . . . . 16
Table 5. Inconsistent race reporting for AI/AN decedents by age of decedent . . . . . . . . . 17
Table 6. Adjusting reported deaths by IHS Area . . . . . . . . . . . . . . . . . . . . . . . . . . . . . . . 18
Table 7. Adjusting reported deaths by age group . . . . . . . . . . . . . . . . . . . . . . . . . . . . . . . 19
Table 8. Hypothetical example: Adjusting the number of AI/AN deaths by age within IHS Area . . . . . . . . . . . . . . . . . . . . . . . . . . . . . . . . . . . . . . . . . . . . . . . . 22
excluded Records . . . . . . . . . . . . . . . . . . . . . . . . . . . . . . . . . . . . . . . . . . . . . . . 24
Table Al-2. Sex differences in the included and excluded records . . . . . . . . . . . . . . . . . . . . . 25
on analyses of 1986-1988 IHS-NDI matched data . . . . . . . . . . . . . . . . . . . . . . . 26
on analyses of 1986-1988 IHS-NDI matched data . . . . . . . . . . . . . . . . . . . . . . . 27
Table A3-1. Adjustment factors for State of residence . . . . . . . . . . . . . . . . . . . . . . . . . . . . . . 29
Table A3-2. Adjustment factors for State of death . . . . . . . . . . . . . . . . . . . . . . . . . . . . . . . . . 30
Table A4-1. Adjusting reported male and female deaths by IHS Area . . . . . . . . . . . . . . . . . . 31
Table A4-2. Adjusting reported male and female deaths by age group . . . . . . . . . . . . . . . . . 32
33
BIBLIOGRAPHY
Frost, Floyd, MPH and Shy, Kirkwood K., MD, MPH. Racial Differences between Linked Birth and Infant Death Records in Washington State. American Journal ofPublic Health, September 1980, 70, 974-976.
Hahn, Robert A., Ph.D., MPH; Mulinare, Joseph, MD, MPH; and Teutsch, Steven M., MD, MPH. Inconsistencies in Coding of Race and Ethnicity Between Birth and Death in US Infants: ANew Look at Infant Mortality, 1983 Through 1985. Journal of the American Medical Association, January 1992, 267, 259-263.
Kennedy, Richard D., MS and Deapen, Roger E., Ph.D. Differences Between Oklahoma Indian Infant Mortality and Other Races. Public Health Reports, January-February 1991, 106, 97-99.
Querec, Linda, MA. Measuring Under-reporting ofAmerican Indian Infant Mortality:Methodology and Findings. Division of Program Statistics, Demographic Statistics Branch, U.S. Department of Health and Human Services, November 1994.
Trends in Indian Health-1994. Indian Health Service, Office of Planning, Evaluation, and Legislation, Division of Program Statistics.
34
REFERENCES
[l] NCHS definitions of race-ethnicity differ from the definition of AI/AN used by the IHS for purposes of defining eligibility for IHS services according to IHS eligibility regulations, a IHS beneficiary must have Indian ancestry which may derive from either parent.
[2] Active registered Indian population includes AI/AN users of IHS services who completed at least 1 out patient visit or inpatient stay during the previous 3 fiscal years from the reference year, whether or not the user resided in the IHS service area.
[3] A Reservation State is defined by IHS as a State in which IHS has responsibilities for providing health care to AI/ANs.
[4] IHS beneficiaries are required to present written documentation of membership in a Federally recognized tribe.
[5] The IHS service population is a count of those individuals in the IHS service area who identified themselves as American Indian, Eskimo, or Aleut during the U.S. Decennial Census. The service population count is revised each year when counts of American Indians and Alaska Natives who are born or who die are obtained from the National Center for Health Statistics (based on State birth and death certificate reports).
The IHS user population is a count of AI/ANs eligible for IHS services who have used those services at least once during the last three-year period and who reside in the IHS service area. This study included AI/ANs who may not be counted in the IHS user population. We refer to the population in this study as the active registered Indian population these are AI/ANs eligible for IHS services who have used those services at least once during the last three-year period, and who may or may not reside in the IHS service area.
[6] For each IHS Area, the observed number of deaths with the decedents race correctly identified can be derived from Table 3 by multiplying the % Race Correct by the number of deaths reported. The corresponding expected number of deaths (i.e., with decedent race correctly identified) can be found by multiplying the number of deaths reported for the Area by the overall proportion of decedents with race correctly identified across all Areas (0.109 for Table 3). The Chi Square statistics can be computed for the overall table with df=l l (the number of Areas minus 1). The contribution of each Area Chi Square component to the overall Chi Square Statistic can be examined for significance with df=l. A statistically significant component indicates that the percentage of decedents with correctly identified race in the Area in question is significantly different from the overall percentage across all Areas.
[7] Reported F tests are for independent one-way analyses of variance with IHS Area as the classification variable and decedent YPLL as the dependent variable.
[8] There were insufficient records in the IHS-NDI match file (11,341) to permit computation of reliable correction factors separately for males and females within IHS Areas or within age groups. Nevertheless, mortality statistics based on sex, age, cause of death, or other factors can use adjusted deaths (based on application of the methodology presented in this report) rather than the unadjusted deaths reported.
[9] It is possible for an IHS beneficiary to have received service in, say, 1986, and to subsequently establish residence in a non- Reservation State and die prior to 1988. This probably explains why the IHS-NDI file contained a few records with State of residence in Georgia (2), South Carolina (2), and Tennessee (1).
[10] As with all data analyzed in this study, Table 4 contains data only for the IHS-NDI match file. Thus, the analyses do not reflect mortality for all AI/ANs in the period 1986-1988.
[11] A large discrepancy was judged to occur whenever 1) at least 10 AI/AN decedents on the IHS-NDI match file resided in the State, 2) at least 10 AI/ANs died in the State, and 3) the discrepancy in the percentage of decedents with race correctly identified on the death certificate was at least 10 percentage points different for the State of residence and State of death.
[12] While a floor of 10 percent (rounded) misclassification is arbitrary, it serves to avoid targeting States that have been doing a relatively good job in classifying the race of AI/AN decedents. Similarly, the arbitrary floor of 10 AI/AN decedents misclassified from 1986-1988 serves to avoid targeting States in which the absolute number of misclassified AI/AN decedents is small.
35

INDEX
birth attendants, 2
cohort of infants, 4
definitions of race, 1, 1, 2
excluded records, 8, 24, 25
funeral directors, 2, 4
general population, 3
Haw a iian race, 2
hospital personnel, 2
!HS service population, 8, 10, 20
IMRs, 4
infant mortality rates, 1, 3, 1-4, 9
NCHS, 1, 1-5, 22
neonatal mortality rate, 3
outcome measurement, 1, 1
patient registration file, 2, 7
primary data source, 2, 3, 7
probabilistic matching methodology, 5
Reservation states, 2, 7, 13
resource allocation, 1, 1
significance tests, 2, 9, 12
State death certificates, 1, 3, 1-5, 1, 4-10, 16, 17, 20, 24, 26, 28, 31
State of birth, 5, 6
36


![DETECTION OF DNA ADDUCTS DERIVED BY …1].pdf · performance liquid chromatography/electrospray ionisation ... Elaine M. Tompkins, ... miscoding lesion26,27.](https://static.fdocuments.in/doc/165x107/5adaa4747f8b9a53618cdcc2/detection-of-dna-adducts-derived-by-1pdfperformance-liquid-chromatographyelectrospray.jpg)