![THE INVESTIGATION OF FRICTIONAL CHARACTERISTICS ...- PTFE seals shows evidence of remarkable wear at relatively higher sliding speeds. 5. REFERENCES [1] Salant R.F., Flaherty A.L.:](https://static.fdocuments.in/doc/165x107/6109cc8f7555696b1b53f546/the-investigation-of-frictional-characteristics-ptfe-seals-shows-evidence.jpg)
Adhesive Wear and Frictional Behaviour of Glass Fibre Reinforced Thermoset...
85
ii University of Southern Queensland, Faculty of Engineering and Surveying Adhesive Wear and Frictional Behaviour of Glass Fibre Reinforced Thermoset composites A dissertation submitted by MR GABREL MEHOUB 00610123160 In fulfilment of the requirements of Course ENG8002 Project and Dissertation Towards the degree of Master of Engineering Technology (METC) (Mechanical Engineering) Submitted: June, 2013
Transcript of Adhesive Wear and Frictional Behaviour of Glass Fibre Reinforced Thermoset...

ii
University of Southern Queensland, Faculty of Engineering and
Surveying
Adhesive Wear and Frictional Behaviour of Glass
Fibre Reinforced Thermoset composites
A dissertation submitted by
MR GABREL MEHOUB
00610123160
In fulfilment of the requirements of
Course ENG8002 Project and Dissertation
Towards the degree of
Master of Engineering Technology (METC)
(Mechanical Engineering)
Submitted: June, 2013

iii
Abstract
Friction and dry wear behaviour of glass fibre reinforced epoxy (GFRE) and glass
fibre reinforced polyester (GFRP) composites are studied in the current project.
Three sliding orientations of fibre with respect to the sliding distance are considered
in the investigation, i.e. parallel orientation (P-O), anti-parallel orientation (AP-O),
and normal orientation (N-O). On the other hand, different sliding distances (0- 15)
km are accounted. The adhesive wear experiments were carried out using block-on-
ring (BOR) configuration at room temperature, applied load of (30N), and sliding
velocity of (2.8 m/s). Interface temperature and frictional force were captured and
recorded during the sliding. Worn surfaces were examined by using (SEM) to
classify the damage. The results revealed that the highest wear rate is taken place in
(AP-O) of GFRE. (P-O) is the highest wear rate of GFRP. On the other hand, the
lowest wear rate is exhibited for (N-O) at longer sliding distance. The maximum
friction coefficient is observed when sliding take place in (N-O and P-O) at higher
speed level. Although, (AP-O) shows 0.25 which is the lowest friction coefficient
value than other orientations. (P-O) orientation of GFRP gave higher wear rate at
maximum speed test in comparing to normal orientation.

iv
DISCLAIMER
Prof. S. Rain
Acting Dean
Faculty of Engineering and Surveying
Certification

v
I certify that the ideas, designs and experimental work, results, analyses and
conclusions set out in this dissertation are entirely my own work and effort, except
where otherwise indicated and acknowledged.
I further certify that the work is original and has not been previously submitted for
assessment in any other course or institution, except where specifically stated.
Student Name: Gabrel Mehoub
Student Number: 0061023160
____________________________
Signature
____________________________
Date

vi
Acknowledgements
This research project would not have been possible without the support of many
people. First of all, i wish to express my gratitude to my supervisor, Dr Belal B
Yousif who was abundantly helpful and offered invaluable assistance, support and
guidance during the duration of my project. As a result, I felt more optimistic and so
confortable during this project. Furthermore, the University of Southern Queensland
creates extremely supportive and motivational area for study by providing their
equipment and facilities such as laboratories, library, software and qualified staff. I
am highly appreciated all my friends and their assistance in all the matters, especially
Abdolarazag Hassan, Hamza Muftah, and Yousef Arhaim. Also i am thankful to Dr
Abdulla Shalwan, for his time and enhanced me by creating significant assistances.
Last but not least, I wish to avail myself of this opportunity to express a sense of
gratitude and love to my beloved parents and whole family back home. Deepest
gratitude is also to my wife, and my son for their understanding and endless care
during the duration of my studies. Moreover, I deeply appreciate my honest
gratitude to my father who usually encourages me to provide the best and singular
form of advice.
Finally, special thanks also to the Libyan cultural attaché for their manual support,
strength, and help and for everything they have done for the good of me.
Gabrel Ahmad,

vii
TABLE OF CONTENTS
Abstract ....................................................................................................................... iii
DISCLAIMER ............................................................................................................ iv
Certification................................................................................................................. iv
Acknowledgements ..................................................................................................... vi
LIST OF FIGURES .................................................................................................... ix
CHAPTER 1: INTRODUCTION ................................................................................ 1
1.1 INTRODUCTION ......................................................................................... 1
1.2 OBJECTIVES of this study ........................................................................... 4
1.3 CONTRIBUTIONS AND SIGNIFICANCES .............................................. 4
1.4 DISSERTATION LAYOUT ......................................................................... 5
Recent Works on Synthetic Fibre Polymer Composites ....................................... 6
CHAPTER 2: LITERATURE REVIEW ..................................................................... 7
2.1 INTRODUCTION TO TRIBOLOGY. .............................................................. 7
2.2 TRIBOLOGY OF POLYMERS ........................................................................ 9
2.2.1 TRIBOLOGY OF FIBRE POLYMER COMPOSITES ............................ 13
2.2.2 Adhesive Wear Behaviour Of Fibre Polymer Composites ........................ 15
2.2.3 Frictional Behaviour Of Fibre Polymer Composites ................................. 18
2.2.4 influence of interface temperature on wear and frictional behaviour of fibre
polymer composites ............................................................................................ 21
2.3 Recent works on synthetic fibre polymer composites ...................................... 25
2.4 SUMMARY OF THE LITERATURE REVIEW ............................................ 25
CHAPTER 3: METHODOLOG ................................................................................ 27
3.1 MATERIALS PREPARATION ....................................................................... 27
3.2.3 SPECIFIC WEAR RATE AND FRICTION FORCE READINGS............ 34
3.2.4 SURFACE PERCEPTIONS ........................................................................ 34
3.2.5 MAHR PERTHOMETER ......................................................................... 35
3.2.6 (SEM) SCANNING ELECTRON MICROSCOPY .................................. 35
3.6.3 OPTICAL MICROSCOPY........................................................................ 35
3.6.4 DEMONSTRATE THE THERMAL-IMAGER ....................................... 36
3.6.5 EXPERIMENTAL PARAMETERS ............................................................. 36

viii
CHAPTER4: RESULTS AND DISCUSSION .......................................................... 37
4.1 WEAR BEHAVIOUR .................................................................................. 37
CHAPTER 5: ............................................................................................................. 57
CONCLUSION AND RECOMMENDATION ......................................................... 57
5.1 CONCLUSIONS .............................................................................................. 57
5.2 RECOMMENDATION ................................................................................. 58
REFERENCES ........................................................................................................... 59

ix
LIST OF FIGURES
Figure 1.1: Dissertation Layout.................................................................................... 6
Figure 2.1: Friction coefficient and specific wear rate of common ........................... 12
Figure 2.2: 1 Friction coefficient and Specific wear rate of common fibre polymer . 15
Figure 3.1: Micrographs of the original composites surface for a) GFRP and b)
GFRE 29
Figure 3.3: 1 Photo showing the Block-on-Ring configuration ................................ 31
Figure 4.1: 1 Specific wear rate against sliding distance of GFRP and GFRE ......... 39
Figure 4.2: 1 Summary of the specific wear rate of the selected materials after
reaching the steady state. ...................................................................... 41
Figure 4.4: 1 Summary of the friction coefficient of the selected materials after
reaching the steady state after 10 km ................................................... 46
Figure 4.5: 1 Interface temperature vs. sliding distance the selected materials under
30 N applied load .................................................................................. 48
Figure 4.6: 1 Samples of the roughness profile of the selected materials at different
operating parameters ............................................................................. 50
Figure 4.7: 1 Roughness value of the selected materials after test under 30 N applied
load for 10 15km sliding distance ......................................................... 52
Figure 4.8: 1 Micrographs of GFRE worn surface after the test under 30 N applied
load in N-Orientation ............................................................................ 53
Figure 4.9: 1: Micrographs of GFRP worn surface after the test .............................. 54

1
CHAPTER 1: INTRODUCTION
1.1 INTRODUCTION
As a result of the rapid development that the world witnesses and the challenge in
using metal materials in tribological industrial applications, the tribological
behaviour of polymeric composites has recently experienced a creative
development, and attention by many researchers. Fibre reinforced polymeric
composites have numerous advantages compared to the metal materials due to
their competitive mechanical properties of high specific strength, low weight, low
cost of raw materials, low processing cost…etc. Recently, composites materials
are heavily used in many applications that have been determined for these
materials. Furthermore, composites materials have been provided superlative
solutions to produce structural materials of aerospace industries, (Pihtili, 2009).
Tribological properties of such materials have been a core of interest for many
scholars and researchers. The friction and wear performance are the significance
characteristics that have been taking place by several researches,(Yousif, 2013b,
Bajpai et al., 2013) focusing on the composite application in brakes, clutches,
bolts and nuts. On the other hand, Shalwan and Yousif (2013) have been
expounded that friction is the value of energy which dissipated at the material
contact surface. Wear, the resistance to remove of solid surface, has been defined
in various aspects such as weight loss, wear resistance and specific wear rate,

2
(Bajpai et al., 2013). Friction and wear are classified to become a main effect on
the machinery in the field of industry as so to work efficiently. Such deficiencies
are mainly related to lifetime of the machinery, (Holmberg et al., 2012). In other
words, it is important to arouse many researches to study the tribological
behaviour of polymeric composites.
Nowadays, friction and wear are the most common problems that are encountered
in industrial engineering and machine parts which cause to the replacement of
components and assemblies in engineering, (Unal et al., 2004). As a result, the
uses of polymer materials have been increased by industrial countries. Therefore,
the need to understand the tribological behaviour of polymer is clear of this fact of
polymer science and engineering (Brostow et al., 2010). There have been several
types of productive friction and wear such as brakes, clutches, bolts and nuts.
Also the unproductive friction and wear is equally considerable such as gas
turbine, cams and bearings, and external combustion engines, (Bhushan et al.,
1995). Nevertheless, the influences of deformation and adhesion of friction are
addressed. Friction on surface energy is affected by different factors which are
sliding velocity, applied load, and temperature, (Myshkin et al., 2005). In
addition, the authors have reported that friction comprises of three elements
namely, interfacial bonds, strength, and shearing and rupture of rubbing around
the contact area of materials. It may also lead to damage materials’ surface and
then change the mechanical properties of the composite. Finally, the results from
friction are temperature during converting mechanical energy to heat, this heat is

3
produced by friction and deformation of materials leads to generate heat. On the
other hand, few beneficial applications are provided by the friction such as tyres
and brakes friction.
There are several studies have been done to inspect the tribological performance
of polymeric composites based on synthetic fibres such as glass, (Pihtili, 2009).
Carbone fibres were investigated by (Suresha and Kumar, 2009). From the
literature, there is a lack of understanding on the tribological behaviour of
thermoset composites based on synthetic fibres such as glass. In the recent work
by Shalwan and Yousif (2013), it is highly recommended further studies on the
thermoset composites to identify the wear and frictional characteristics of
thermoset composites based on glass fibres. This motivates the current study.
In the current report, the wear and frictional behaviour of two fibre thermoset
composites are considered as epoxy and polyester. Three different orientations of
fibre with respect to the sliding distance are accounted in the study and different
sliding distance (0- 15) km.

4
1.2 OBJECTIVES OF THIS STUDY
1. To study the specific wear rate and friction behaviour of epoxy and polyester
composite based on glass fibre.
2. To study the influence of fibre orientations on specific wear rate and friction
coefficient.
3. To examine the worn surfaces of the composite after the test and categorize the
wear mechanism.
4. To understand the influence of interface temperature on specific wear rate and
friction behaviour
5. To investigate the influence of the rubbing process on the roughness profile of
the composite.
1.3 CONTRIBUTIONS AND SIGNIFICANCES
1. Understanding the wear behaviour of new materials will assist the designers in
materials selection since there is no much available date on such materials.
2. This research is going to be a base of new research at USQ.
3. The outcomes of the research will contribute to the tribological science and
will become a base for the new researches in this area. Furthermore, the
findings will be published in international journals.

5
1.4 DISSERTATION LAYOUT
This dissertation organized for six parts as shown in figure 1.1 bellow. Firstly, the
introduction explains the objectives of this work in reasonable pattern. Moreover,
it indicates the aims behind this project which substantially defines the activities
undertaken and the direction to complete this project. Secondly, the literature
review provides significant researches that have been reported in this area. These
articles reach to the damage that materials surface is subjected by different sliding
parameters; damage face in applicable materials is also focused such as epoxy and
polyester. Thirdly, the methodology demonstrates the equipment’s and the used
materials that are processed so as to achieve this work. This methodology is
involved materials such as glass fibre reinforced epoxy/polyester. Furthermore,
tribology machine and thermo-imager camera are used. Fourthly, the
experiments' results and discussion are obtained in this chapter. Fifthly, the
comparison between the outcomes is presented. Finally, conclusion and
recommendations are provided. Appendices show project specification,
conference paper and further outcomes respectively.

6
Tribology of
Polymers
Tribology of
Fibre
Polymer Composites
Adhesive
Wear
Behaviour of
Fibre
Polymer
Composites
Frictional
Behaviour of
Fibre
Polymer
Composites
Influence of
Interface
Temperature
on Wear and
Frictional
Behaviour of
Recent Works on
Synthetic Fibre Polymer
Summary of the Literature Review
The Interface
Temperature
Standardization
SPECIFIC WEAR
RATE AND
FRICTION FORCE
READINGS
Surface Perceptions
Experimental
Parameters
Wear and
Friction
Results of
GFRP
Interface
Temperatu
re Results
Interface
temperature
results
Conclusion
Chapter 1
Introduction Chapter 2
Literature
Review
Chapter 3
Methodology Chapter 4
Results and
Discussion
Chapter 5
Conclusion
Objectives
Contributions
and
Significances
Introduction
to Tribology
Materials
and
Orientations
Materials
Preparation and
Test Specimen
Tribology
Experimental
Preparations and
Illustrate the Main
Machine
Wear and
Friction
Results of
GFRE
Recommend
ation
Project Layout
Figure 1.1: Dissertation Layout

7
CHAPTER 2: LITERATURE REVIEW
2.1 INTRODUCTION TO TRIBOLOGY.
Tribology is one of the important branches used in the mechanical engineer
sectors(Nosonovsky and Bhushan, 2012). Tribology is the Greek word ' tribo'
which verbatim indicates the science of rubbing, (Bhushan 2002). Tribology
comprehends the science and technology that explore wear, lubrication, and
friction of interacting surface in relative motion, (Friedrich et al., 1995). The
principle of tribology is evidently the minimization of the deterioration of the
surface resulting of friction and wear, (Khonsari and Booser 2008). The
fundamental benefit in tribology exists in various fields involving lubrication,
friction, wear, and other machine element such as piston rings, magnetic desk
drives, and hydraulic lifts, (Khonsari and Booser, 2008).
Friction and wear, are the most common problems that encountered in industrial
engineering and machine element which leads to the replacement of components
and assemblies in engineering, (Unal et al., 2006). As a result, the use of polymer
materials in dentistry continues to increase. Therefore, the need to understand the
tribological behaviour of polymer is clear of this fact of polymer science and
engineering, (Brostow et al., 2003). Bushan (1995) reported that tribology is
greatly importance to modern machinery which applies sliding and rolling
surfaces. The author mentioned that there have been several types of productive
friction and wear such as brakes, clutches, bolts and nuts. Also the unproductive
8
friction and wear is equally considerable such as gas turbine, cams and bearings,
and external combustion engines. Moreover, Tooth wear studies have recently
been appointed that dental tribology science is considerably since wear
operations; exhaustion, corrosion and abrasion are particular to dental tribology,
(Addy and Shellis, 2006).
Friction is defined as strength of contact surface in proportional motion and the
coefficient of friction is (µ). the constant of friction is resolute by the magnitude
of the real rubbing area, (van Kuilenburg et al., 2012). Other definition for friction
is the magnitude of energy that squandered at the material surface, (Shalwan and
Yousif, 2012). Based on the friction mechanisms which are namely severity
deformation, adhesion and ploughing, (Shalwan and Yousif, 2012). Wear is a
resistance of process of removal of solid surface, and it can be determined in
various aspects such as weight loss, wear resistance and specific wear rate,
(Hutchings, 1992). Bhushan (1995) highlighted that the energy resources in the
world have markedly appeared as friction in one model or/and more. In order to
overcome the importance of reducing the friction to some of the drawbacks of
natural fibres experience such as hygroscopic and hydrophilic in nature as it tends
to diminish the relationship strength between the natural fibre and polymer resin.

9
Yousif (2012) Notified that Friction, wear and lubrication are detected to
tribological circumferences. In the previous industries, designers are not
considered the tribological factors. Furthermore, mechanical engineering
designers have recently been provided that tribological mechanism is an initial
consideration in their works. It is an indisputable fact that tribological technique
has become a core of advantage in mechanical studies areas so as to obtain typical
product quality.
2.2 TRIBOLOGY OF POLYMERS
Tribology of polymers is a historical science which has been well-known in the
area of design engineering. In the last decades, tribological behaviour of
polymers is represented specifically the mid-20th century even today. New
contact adhesion measurement has been defined with different coatings of surface
energy,(Myshkin et al., 2005). Moreover, tribological researches have been
executed under especial situations of dry sliding on the wear and friction
behaviour of polymers, (Budinski and Budinski, 2009). Also Myshikin,
Petrokovets (2005) have illustrated that the influences of deformation and
adhesion of friction are addressed. Friction on surface energy is affected by
different factors which are sliding velocity, applied load, and temperature.
Nowadays, applications of polymeric materials require sufficient knowledge of
tribological properties. It is important that tribology of polymeric exists to be
taken into consideration in material technology and engineering industries,
(Brostow et al., 2010). There are several structural applications which are

10
depended on polymer matrix. In addition, polymer and their composites have
excessively used in order to offer advanced engineering applications in the
aerospace, automotive, and improvement the metallic materials, (Basavarajappa
and Ellangovan, 2012a).
Yousif (2008) highlighted that polymers and their composites are one of the
important materials used in the machine elements which are designed to avoid
tribological loading situations. Also the researcher has mentioned that the
possibility understand of the wearing technique under appointed sliding
circumstances. As a result, it is an essential that composite materials behaviour
has known under operational conditions such as friction and wear resistance. On
the other hand, tribological behaviour of polymeric composite has been paid
attention to surface temperature as another imperative parameter, (Basavarajappa
and Ellangovan 2012).
Blau (2010) has pointed out that the high-temperature; friction and wear are
controlled in applications such as internal combustion engines, and aerospace
propulsion systems. There have been two principal features that the polymers and
their composites was made to ensure that its characteristics meet technical
specification which are friction, wear resistance and surface temperature to
minimize such issues in the future. Hence, these materials has become desirable
compared to ordinary metallic performance,(Pihtili, 2009). In view of this, Yousif

11
(2008) has demonstrated that it also presupposes a preferable understanding of
sliding wear mechanisms as so to design parts which have friction and wear
resistance characteristics of the impacting loads on worn surfaces.
Numerous studies of friction are shown that the main non-interacting components
of friction are considered which are adhesion and deformation,(Myshkin et al.,
2005), Fig. 2.1. Friction comprises of three elements namely, interfacial bonds,
strength, and shearing and rupture of rubbing around the contact area of materials,
(Myshkin et al., 2005). The wear resistance is considered as one of the significant
mechanical characteristics when the part of machine is subjected to a form of
slipping contact, (Ben Cheikh Larbi et al., 2005). Also Cheikh Larbi, Cherif
(2005) mentioned that Variation of the surface layer obtained from the chemical
reaction , temperature and mechanical stresses. Polymers are sensitive to these
factors because of that particular structure and mechanical behaviour are acquired.

12
Fig. 2. 1: Friction coefficient and specific wear rate of common
[*](El-Tayeb et al., 2008), [**](Shi et al., 2003), [***](Cong et al., 2008),
[****](Unal et al., 2004).
Drawing on obtained views, the polymers and their composites are prestigious
materials that provide the idealist mechanical properties of technical fields.
Therefore, polymers were accepted by the designers to be used to minimize the
frictional loss between the layers of material. Based on the previous studies, the
required wear resistance and surface temperature were added to the technical
considerations.
0
0.05
0.1
0.15
0.2
0.25
0.3
0
0.1
0.2
0.3
0.4
0.5
0.6
0.7
0.8
0.9
polyester[*] Epoxy[**] HDPE[***] PTFE[****]
Sp
ecif
ic W
ear
Rate
, m
m3/N
.m
Fri
ctio
n C
off
ecie
nt
(µ)
Material Type
Friction cofficient
Specific wear rate

13
2.2.1 TRIBOLOGY OF FIBRE POLYMER COMPOSITES
Global warming is considered significant. As a result of certain comprehensive
issues, some regulations are seriously taken to constrict environmentalist
pollutions and contaminations have generally required for bio-composites
materials, (Shalwan and Yousif, 2012). From tribological point of view, the
application of polymer is usually used for tribological objectives which are
increased and extending into even more new field. Many researches have been
carried out on the tribology of polymer due to their usage in several applications
and industries, (Brostow et al., 2010).
Nowadays, polymer matrix composites are became the most attractive for many
applications which are aerospace, automotive, and chemical industries. Also
polymer composites can be used in mechanical industrials such as wheels,
impellers, brakes, clutches, conveyors, gears, cams, transmission belts, bushes and
bearings, (Basavarajappa and Ellangovan, 2012b). furthermore, polymer matrix
composites are investigated under special conditions in terms of sliding and
abrasive wear by several studies, these results indicate that wear performance
depends on applied load and sliding velocity, (Quintelier et al., 2006).
Pihtili(2009) has reported that composites materials are widely used because of
their properties such as low density and cost. For the few decades, glass fibre is
kind of these materials; numerous studies have been allocated for these materials
in terms of wear resistance, coefficient of frictional behaviour, and the effect of
elevated temperature. For instance, the sliding wear is caused to reduce the wear

14
resistance, for example in the case of adhesion and fatigue of wear. Moreover,
this decreasing in wear performance is because of the pressure carrying capacity
of the fibres. the results have provided that there is an existence remarkable
characteristics on the worn contact surfaces, (Quintelier et al., 2006). El-Tayeb et
al., (2006) Investigated that the wear resistance of glass fibre reinforced polyester
composites have higher wear resistance compared to plain polyester. also there are
three contact direction which are parallel(P), anti-parallel (AP), and normal
direction (N), as a result the wear performance rises dramatically whereas
increasing in the normal load for various orientations.
Myshkin (2006) has presented that there have been other impacts on friction in
terms of temperature, by converting mechanical energy to heat, temperature is
generated from friction and the main source of this heat is deteriorated of surface.
In addition, surface contact of various coating can be determined with adhesion
parameter. The author studied the deformation and adhesion of friction. This
research is shown the principles effects of applied load, sliding velocity, and
temperature. Hence, In the light of this weight, the applied load specified
increases. As a result, the friction coefficient is likely to increase.

15
2.2.2 Adhesive Wear Behaviour Of Fibre Polymer Composites
Adhesion can be defined as friction impact between two surfaces is applied,
surface forces were formed of attraction and repulsion distribute between the
molecules and atoms of two approaching surfaces. These forces equalize each
other, (Myshkin et al., 2005), Fig. 2.2. Likewise, Myshkin, Petrokovets et (2005)
have explained that measure adhesion can be determined by measuring the
molecular forces, which are effectively between two solids with particular agents.
Also, they have employed a set of procedures to measure molecular attractive
forces based on validation of outcomes. However, molecular forces have been
recently measured by using atomic for microscopy.
Fig. 2. 2 Friction coefficient and Specific wear rate of common fibre polymer
composites, [*](El-Tayeb et al., 2008), [**](Pihtili, 2009), [***](Suresha and
Kumar, 2009).
0
1
2
3
4
5
6
7
8
0
0.05
0.1
0.15
0.2
0.25
0.3
G/P[*] G/E,P-O[**]C/Viny[***]G/Viny[***]
Sp
ecif
ic W
ear
Rate
, m
m3/N
.m
Fri
ctio
n C
off
ecie
nt(
µ)
Material Type
Friction
Coefficient(µ)specific wear rate

16
Adhesion and deformation are measured the source of frictional forces. Therefore,
deformation appears while two slides surface contact to each other, such as plastic
and elastic deformation, viscoelastic deformation, these may cause to mechanical
energy dispersion, (Myshkin et al., 2005). There are several influences on
friction in terms of load, velocity, and temperature. Firstly, coefficient of friction
and applied load are proportional to friction force, at load between 10-100
Newton coefficient of friction stays constant. Secondly, friction force will
minimize because of short period of contact, sliding velocity resistance will
maximize and at high velocity. Finally, the results from friction are temperature
during converting mechanical energy to heat, this heat is produced by friction and
deformation of materials leads to generate this heat.
According to the tribological of view, there have been implemented several works
on jute, cotton, oil, palm, sugarcane, coir, and bamboo fibres concerning their
applications in tribo-polymeric composites. For example, oil palm fibre
reinforced polyester composite is detected that oil palm fibres reinforced the wear
performance of polyester by three to four compounds. In other study on
cotton/polyester composite, the particular wear rate of polyester reduced markedly
with the addendum of cotton fibre. Furthermore, sugarcane fibre has been
influenced on tribo-characteristics of polyester composites. fibre mats oriented
parallel to the sliding direction presented that wear performance of fibre mats
oriented parallel to the sliding direction is lower than fibres oriented anti-parallel
under the same test situations, (Nirmal et al., 2010b).

17
The influences of the coir fibres can be measured in terms of frictional and wear
performance, block-on-disk (BOD) machine used in specific circumstances. As a
result, experiments came up with worn surface, by use of scanning electron
microscope wear rate and friction coefficient were studied in various aspects
which are applied load between 10N to 100N, and sliding distance between 0km
to 4.2km, (El-Tayeb et al., 2008).
It is generally accepted that the adhesive wear behaviour of polymers has been
affected by several issues such as high friction of coefficient, stick slip behaviour,
and high material removal. Therefore, many authors have reported that the most
common mechanism is used to enhance the feathers of adhesive wear of polymers
by providing carbon as synthetic fibres, (Friedrich et al., 2005), and glass,
(Samuel et al., 2012). The tribological properties of the polymer depend on
different thermoplastic and thermoset of synthetic fibres. In addition to that,
interfacial adhesion of the fibre with the matrix is considered as one of several
factors are controlled the performance of synthetic fibre/polymer composites,
(Monteiro et al., 2012). For instance, the wear performance of polyester is
enhanced by reducing the wear rate in glass fibres. Moreover, the performance of
wear and frictional relies on some parameters which are applied load, sliding
velocity, and fibre orientations. Hence, process parameters are effectively
controlling the wear and the frictional behaviour of composites, (Chauhan et al.,
2012). Adhesive wear applications of using betelnut fibres to reinforced
polyester composites have been studied by Yousif and El-Tayeb (2010). Also the

18
researcher has explained that high micro and macro crack diffusion on the
interface of the composite surfaces. However, the shear force is resisted and
managed by the end of the fibres to protect the polyester area. The large diameter
is the main reason that it can be caused to disseminate of crack whether micro
and/or macro on the rubbing surface.
Tribo-performance of polymeric composites is influenced by the contact
conditions, which are wet and dry. From the previously reported, some of
polymeric composites such as PA, UHMWPE, (Suresha et al., 2009), and betelnut
fibres, (Nirmal et al., 2010a), have been enhanced during wet contact conditions
compared to dry. Many researchers have been explored the effect of adhesion of
elastic. Whereas, the elastic half-space comes in contact with a smooth sphere the
Hertzian elastic theory is established the contact area. In addition, adhesive
friction comprises strong long-range bulk forces, and weak short-range adhesive
forces. To sum up, the adhesive friction includes the technicality of energy
consumption, due to hysteresis and fracturing adhesive between the contacting
areas, (Nosonovsky and Bhushan, 2007b).
2.2.3 Frictional Behaviour Of Fibre Polymer Composites
Throughout history, friction has been defiance for humanness. Hence, Myshkin
and Petrokovets (2006) defined that friction is the resistance of motion contact
between thin surface layers of bodies which the fundamental way for heat transfer

19
between tribology is caused by friction and concept of convection. Friction is the
magnitude of energy that consumed at the surface. Frictional behaviour has been
an essence of interest for many scientists and researchers. Three mechanisms
have been attributable to frictional behaviour which is adhesion and blouging, and
cruelty deformation. Also, researchers have made attempts to determine that the
total friction coefficient can be evaluated by quantitative treatment. In addition to
that, the behaviour of these mechanisms depends on operating conditions and the
type of material which are namely the contact surface topography, (Shalwan and
Yousif, 2012).
Nosonovsky and Bhushan (2007a) Paid attention to the mechanisms of dry
friction, the unique mechanisms of dry friction are deformation of severities,
adhesion, fracture and third body mechanisms. Based on these studies, the
theoretical rules to measure the coefficient of friction are the equal normal load to
the ratio of the friction force. In the light of this weight, Suresha, and Shiva
Kumar (2010) examined that the coefficient of friction of polymeric composites
depends on applied load, and sliding velocity. Additionally, their experimental
results shows that the coefficient of friction is directly proportional to applied load
and/or sliding velocity. Shalwan and Yousif (2012) have applied an experiment
to measure the friction behaviour of the natural fibres under dry sliding
provisions; the authors reported that the frictional coefficient of epoxy is reduced
by the existence of kenaf fibres in the composites. Also polyester with coir and

20
betelnut and oil palm fibres achieve respectively reduction of the friction
coefficient.
Diverse works have focused on volume friction behaviour of natural fibres. These
researchers have investigated that frictional behaviour of polymeric composites
can be strongly influenced by the volume friction, Yousif and El-Tayeb (2008a)
have explored that the effort of replacing seed oil palm fibres(SOPF) with woven
glass fibre(WGF) for tribo-polymeric composites. Moreover, many experiments
have been done under dry sliding contact by using (BOD) with special conditions
which are sliding distances up to 5 km, applied load 20N, and sliding velocity 2.8
m/s. In addition, Chin and Yousif (2009) have pointed out that kenaf fibres as
reinforced with epoxy matrix have been used for bearing applications.
(BOD) machine is used to examine the frictional behaviour of fabricated
composite at different conditions in terms of applied loads (10-100), sliding
distances up to 5 km, sliding velocities (1.1-3.9 m/s). Kenaf fibres afford greater
wear and friction coefficient as support to the matrix compared to oil palm, coir
fibres, and sugarcane. Subsequently, set of results are exposed that the specific
wear rate (ws) of woven glass reinforced polyester (GRP) and 35% volume of
seed oil palm reinforced polyester (SOPRP) were comparable, (Yousif and El-
Tayeb, 2008a). The study also provided that the applied load and sliding velocity
have sparse influence on the KFRE composites. However, the fibre orientation

21
has obviously affected on the frictional behaviour and wear performance of the
composites, (Chin and Yousif, 2009).
In summary, frictional behaviour is one of the important technologies used in
tribology and materials sector. Yet, there remains an argument whether the
frictional behaviour has brought positive and/or negative impacts of different
applications. For instance, in the USA, reducing friction in engine parts has
economized 120$ billion per year, (Yan et al., 2010). Advantageous, friction has
used for everyday applications such as tyres, brakes friction. On the other hand,
shear force and heat generation are occasionally caused by friction between
sliding surfaces, which always lead to surface deterioration and deformation in
changing degrees, (Yan et al., 2010). Likewise, Kenneth Holmberg (2012)
employed a set of techniques to determinate the friction in the engine of
passenger cars, tires, and breaks. Friction, lubrication, and wear have been
respected to provide a great effect on the machinery in terms of efficiency and
lifetime and then in the economy of the UK.
2.2.4 Influence of interface temperature on wear and frictional behaviour
of fibre polymer composites
Interface temperature is a fundamental parameter in understanding tribological
behaviour of polymeric composites, (Pihtili, 2009). Blau (2010) indicates that it
is important to control of elevated-temperature friction and wear in several

22
applications such as internal combustion engines, bearing of aerospace propulsion
systems, and manufacturing equipment. Furthermore, higher interfacial
temperatures can be produced by frictional contact and external sources. For
instance, car brakes generate temperature enhancements due to frictional contact.
Moreover, different properties are caused due to the increase of temperature such
as mechanical and thermo-physical characteristics. Metals and alloys yield
strength is decreased so as to keeping temperature in enhancements. For example,
alloys yield strength has progressively decreased after critical point of yield
strength such as nickel alloys, (Blau, 2010). Also, the researcher has studied the
relationship between modulus of elasticity and temperature; he employed a set of
experiments to determine maximum elastic stress for 8 mm long and 9.53 mm
diameter. From the experiment's results the author has proved that high
temperature lead to decrease elastic contact stress.
There are many influences of interface temperature on the wear and frictional
behaviour. Pihtili (2009) has investigated that the wear of glass-woven reinforced
composites is influenced due to two thermosetting resins epoxy and polyester
under dry conditions. The previous works focus on the polymeric composite
material in terms of the wear and friction properties. low thermal conductivity
and high stiffness have been specified under particular conditions which are high
temperature at the sliding surfaces meanwhile friction and after a specific critical
temperature, wear performance were discovered to be increased very markedly,
(Pihtili, 2009).

23
Several experimental have been done by Yousif and El-Tayeb (2008b) to
investigate interface temperature and frictional behaviour of chopped strand mat
fiberglass reinforced polyester (CGRP). The researchers have used three various
orientations, namely parallel (P), anti-parallel (AP) and normal orientation (N).
Also they are several parameters, namely normal load (30, 60&90), sliding
velocity (2.8, 3.52 & 3.9 m/s), and sliding distance (0-2.51km). Experimental
results show that friction and interface temperature properties of the
CGRP/stainless steel based on principal roles which are pattern's orientations, and
the tested parameters. The result from measurements, which proposed by the
researchers, were exhibited that the interface temperature of (AP & P) orientation
respectively is clearly similar. It will reduce due to lower sliding velocity,
maximum interface temperature is obtained while the CGPR was examined in
AP-orientation during higher friction rates, and however, the interface temperature
was likely to decrease comparing with P-orientation as so to the rubbing operation
mechanism.
According to Blau (2010), there have been immense mechanical properties of
metals and their wear resistance which are connected to oxidation, sulfidation, and
other chemistry operation of tribo-contact. Therefore, the researchers have paid
attention to the effects of elevated temperature on thermodynamics and reaction
kinetics. As a result, the Ellingham diagrams are used to measure the change of
the Gibbes free energy (G) by comparing with function of temperature which is
various oxidation reactions. Based on the previous discussion chemical reaction

24
rates are inclined to increase while temperature increases. Furthermore, Blau
investigate that the role of tribo-layers “glazes" is described as formula on sliding
layers during frictional contact. Temperature resulting can be specified as the sum
of the temperature of the associated plus.
From the tribological point of view, polymer composites are considered
significant, central benefits in using these materials in tribological applications
such as bearings, bushings and sliding surfaces. However, these materials are
subjected to deterioration due to heat generated by the friction and/or shear force
are generated by tribological loading. Moreover, the researchers have discussed
the tribological behaviour of polymer composites reinforced by natural fibres such
as Jute, Cotton, Oil palm, Sisal, and Kenaf. Eventually, the interface temperature
and frictional behaviour have a major impact on the tribological performance of
polymeric composites. However, the case of synthetic fibre enhanced epoxy
composites investigated that the interface temperature has more influence
compared to the frictional force. Furthermore, the friction and wear behaviour of
the polymeric composites are controlled by equal operating parameters and fibre
orientations, (Yousif, 2013c).

25
2.3 Recent works on synthetic fibre polymer composites
Synthetic fibres have brought more sufficient as advanced composites and
applications have been heavily studied. The petroleum issues have made bio
composites markedly important. However, these materials are continuously under
pressure from the international market, which in turn, presupposes continuous
research, (Faruk et al., 2012). Synthetic fibres have several features compared to
inorganic fibres, i.e. anisotropic, non-abrasive, compostable, and recyclable,
(Sena Neto et al., 2013).
There are immense works on Synthetic fibres polymer composites focusing on the
mechanical properties of the composites. In the recent decade, there is high
attention paid to use the Synthetic fibre as reinforcements for polymeric
composites in tribological applications. In the coming sections, literatures on the
previous works are addressed covering the mechanical and tribological researches
on such composites.
2.4 SUMMARY OF THE LITERATURE REVIEW
There have been many articles that have been done in materials science and they
clarify different studies under different sliding parameters. The literature review
can publicize obvious explanations of previous researches or/and studies that have
been published to determine surface damage control under different sliding
parameters. For example, (Yousif et al., 2006), have studied interface temperature
and friction coefficient of glass fibre/polyester under different applied loads and

26
different sliding distance. They found the interface temperature approximately
24-48 ºC and the increase of friction coefficient is discovered between the glass
fibre and the polyester. According to these previous works different surface
damage features are resulted from experiments under different sliding conditions.
No much researches concentrated on the study between the friction force and wear
resistance with surface observations. This research will study the influences of
friction force, specific wear rate, and interface temperature on the surface damage
by tribological loading.

27
CHAPTER 3: METHODOLOG
3.1 MATERIALS PREPARATION
This study proposed to use these materials in terms of their surface damage
characteristics meanwhile they were experimented under diverse sliding
conditions. Hence these materials have to be used in these experiments easier than
other materials which may appear no surface damage. This project has used well
known materials such as Neat Epoxy (NE), Glass Fibre Reinforced Epoxy
(GFRE).
There are combinations of materials being used to meet technical procedures.
Glass fibres based composites have been specified of a set of mechanical
characteristic. In addition, this work has been used the liquid of epoxy resin (DER
331). It is occasionally used for several purposes such as automotive parts and
casting. Epoxy resin supplies good resistance to adhesive and alkalis properties.
The epoxy resin and hardener has been mixed with 2:1 of ratio. Also the mixture
was systematically made, melted down in the mould and placed in the vacuum
room (MCP 004PLC). In order to dispose of air bubbles between fibres in the
mould at room temperature 24 hour. Glass fibre reinforced epoxy and glass fibre
reinforced polyester were chosen as reinforcement materials. In order to provide
prestigious properties for, this specimens were conducted with the specific
volume of fibre is vf =48%. Micrographs of the original composite surface for
both materials selected are shown in Fig.3.1. Consequently, the orientations of

28
fibre have been paid attention. GFRP were used as a reinforcement material that it
provides a high chemical resistance and high resistance to environmental
influences. Epoxy resins are preferred so as to commonly of available rates from
high melting solids, and viscous liquids. They have numerous of mechanical
properties, and chemical resistance. Furthermore, epoxy resin had approximately
less than 2% of the shrinkage and high hardness. The provided composites were
formed in size 30mm*20mm*20mm and different orientations of fibres were
displayed in Fig.3.2.

29
Fig. 3. 1 Micrographs of the original composites surface for a) GFRP and b)
GFRE
Glass fibre Polyester
a) GFRE
b) GFRP

30
Fig. 3. 2 Schematic drawing showing the orientation of the fibre
Similar techniques are conducted in fabricating the synthetic specimen, three
orientations have been considered in the tests. Polyester is a thermosetting resin
that has been used a. Glass fibre reinforced polyester has been produced under a
different of lengths, widths, and weights. 20-30mm, 450g/m2 are used as
measurements of current specimen of fibre lengths and mass of fibre respectively.
(Revesol P9509) is an unsaturated and addition of Methyl Ethyl Ketone Peroxide
(MEKP) which can be used for ambient the surrounding temperature. Kong Tat
Company of fiberglass engineering (Malaysia) has been provided both
reinforcement and polyester materials.

31
3.2 EXPERIMENTAL SET UP
Block-On-Ring (BOR) is the main machine that it has been used to conduct the
experiments. The specimens surface (10mm*10mm*20mm) was tested against a
counterface made of stainless steel (AISI 304, hardness =1250HB, Ra=0.1µm).
Before each test, (Sic G2000) was utilized to smooth the counterface and
thereafter a piece of wet cloth with acetone was used to clean the counterface. Fig.
3 shows the block on ring step up showing the load cell, samples, counterface and
the sample holder. The load cell is connected to the computer to capture the
frictional force during the experiments.
Fig. 3. 3 Photo showing the Block-on-Ring configuration of multi-purpose
machine, (Yousif, 2013a).
The roughness of the wear track was gauged before and after experiment by using
Mahr Perthometer S2, As a result for higher close contact between the stainless

32
steel and the specimen, abrasive paper (Sic G2000) and dry soft brush was used to
polish and cleaned respectively the specimens contact surface. The composite
surface varies in each orientation in terms of the roughness. For instance, in N-O,
the composite roughness measures were in rate of the (0.70µm). While, in P-and
AP-orientation were the average of (0.30µm).
3.2.1 EXPERIMENTAL PROCEDURE
The experiments were processed at appropriateness parameters hich are constant
applied load ( ) sliding velocity of . m s and sliding distance ( - m) at
room temperature ( C). he used of a ne specimen had to be done for each
sliding distance. Before and after the test, the dry soft brush cleaned the prepared
composite specimen continually. Serta weight balancer (±0.1mg) being used in
this operation to determine and ensure the weights of the composite specimen
before and after test and then weight loss was evaluated. In addition, thermo-
imager camera was applied as so to determine the initial interface temperature.
SEM (JEOL) was used to investigate the composite surface morphology. The
composite specimen surface was coated before to use the SEM machine. Thus,
each tribological test was repeatedly done several times and the average of the
magnitudes was measured. The weights of the specimens before and after test
using Sera balancer and then specific wear rate were determined for each test
condition by using Eq1.
(1)

33
In the light of this weight, during and after the experiment interface temperature
was standardized. Using a thermo imager can be used while after the test, can
also show the heat allocation during the materials sample. Moreover, the
temperature was generated and the thermo imager camera has been used because
of interface temperature was calibrated during periods of time. The specific wear
performance is one of the expected results as so to explore the impact of the wear
damage on the specimen surface. Therefore, theoretical rules were applied to
measure the relationship between the sliding distance and the weight of the
specimen before and after the test in order to investigate the specific wear rate.
As a result the required friction force can be obtained by the tribology software
which was connected with the Block-on-Ring machine. Hence, shear force
readings were automatically registered according to the results data.
3.2.2 INTERFACE TEMPERATURE
In the light of this weight, during and after the experiment interface temperature
was standardized. Using a thermo imager can be used while after the test, can
also show the heat allocation during the materials sample. Moreover, the
temperature was generated and the thermo imager camera has been used because
of interface temperature was calibrated during periods of time.

34
3.2.3 SPECIFIC WEAR RATE AND FRICTION FORCE READINGS
The specific wear performance is one of the expected results as so to explore the
impact of the wear damage on the specimen surface. Therefore, theoretical rules
were applied to measure the relationship between the sliding distance and the
weight of the specimen before and after the test in order to investigate the specific
wear rate. As a result the required friction force can be obtained by the tribology
software which was connected with the Block-on-Ring machine. Hence, shear
force readings were automatically registered according to the results data.
3.2.4 SURFACE PERCEPTIONS
There are different surface procedures in order to obtain the required outcomes
and determine the surface damages being affected, which involving
1. Mahr Perthometer was supplied from the University of Southern
Queensland (USQ).
2. (SEM) scanning electron microscopy was provided from University of
Southern Queensland (USQ).
3. Thermo imager camera and thermometer.
Engineering and Surveying Faculty at University Of Southern Queensland has
supplied the generality of this equipment. As a result, the valid and accurate
outcomes were taken by using these techniques.

35
3.2.5 MAHR PERTHOMETER
The roughness of the surface is important parameters that can be measured before
the test by using this tool. Moreover, Mahr Perthometer can be used in every
single test for every specimen to avoid any possible error during the experiments.
3.2.6 (SEM) SCANNING ELECTRON MICROSCOPY
Demonstration of specimen surface is clearly shown by using this device after
operation test with particular sliding conditions. Some of micrographs were
provided in this study.
3.6.3 OPTICAL MICROSCOPY
Although, optical microscopy is an important instrument due to it is a procedure
in which surface observation is collected systematically about a set of damage
features; however, this equipment is not able to present results in micro. On the
other hand, the micrographs from microscopy were considered significant
compared to the outcomes from optical microscopy. Thus, SEM is provided to be
the preferable surface observation procedure.

36
3.6.4 DEMONSTRATE THE THERMAL-IMAGER
Heat distributions were investigated by using this Thermal-Imager in terms of
accurate results that might provide from infrared thermometer. Based on heat
distribution in the specimen some of random samples of images has been attached
in the appendix C especially results were collected as so to illustrate the
generation of temperature through the sample.
3.6.5 EXPERIMENTAL PARAMETERS
According to previous studies, sliding conditions have been chosen due to the
surface damage was showed. Therefore, this study will attempt to use these
experimental parameters which are: Applied load of 30 N, Sliding velocity =
2.8m/s, time from 0 to 90 min, and sliding distance 0 to 15 Km.

37
CHAPTER4: RESULTS AND DISCUSSION
Tribological experimental results of glass fibre reinforced epoxy or polyester are
presented in this chapter at various operating parameters. Frictional and wear
behaviour of the composites and the thermoset are introduced in a form of friction
coefficient, interface temperature, and specific wear rate. Surface morphology and
roughness profile of the worn surfaces are given to assist in explaining the
experimental wear and frictional results.
4.1 WEAR BEHAVIOUR
In order to study the wear behaviour of neat epoxy, (NE), neat polyester (NP), glass
fibre reinforced epoxy (GFRE) and glass fibre reinforced polyester (GFRP), a series
of experiments have been conducted at different operating parameters and
orientations. The orientations are (N-O, P-O, and AP-O)
The specific wear rate of the GFRE and NE against the sliding distance of different
orientations is given in Fig. 4.1.a. Since the specific wear rate (SWR) value of all the
selected materials is very small, the presented values are multiplied by 1000000, and
i.e. the values should be multiplied by E-6. Moreover, the specific wear rate of the
epoxy is relatively high compared to its composites that are why its values are on the
right vertical axis with different scale. From this figure, one can see that the neat
epoxy exhibits very high specific wear rate and reached the steady state after about 5

38
km. on the other hand, the epoxy composites show lower specific wear rate
compared to the neat epoxy for all the fibre orientations. The steady state of the
composites reached after about 10 km since the interaction between the asperities
took longer time to adopt. Further explanation will be given with the assist of the
roughness profile in the next section.
Regarding to the composite, (AP-O) orientation indicates poorly wear rate compared
to (P-O) and (N-O) orientations, the composite in (P-O) and (N-O) directions exhibit
lower wear rate after sliding distance of 5 km. moreover, in comparison with Neat
epoxy and three orientations found that AP- orientation has approximately 30% less
than Neat epoxy while (P-O) and (N-O) orientations give about (20% less). The
realization for this can be explained that the proportionally harder phase (CSM) is
pulled out, broken, fractured of glass fibres and removed from CSM. It is generally
accepted that the weight loss of the composite specimens have significantly increased
with the effect of constant sliding velocity and sliding distance when applied load
was about 30 N.

39
a) GFRE
a) GFRP
Fig. 4. 1 Specific wear rate against sliding distance of neat polyester, neat epoxy,
and GFRP and GFRE composites
0
0.05
0.1
0.15
0.2
0.25
0
0.01
0.02
0.03
0.04
0.05
0.06
0.07
0 5 10 15 20
SW
R,
mm
3/N
.m E
-6
SW
R,
mm
3/N
.m E
-6
Sliding distrance, km
GFRE-NO
GFRE-AP
GFRE-P
Neat Epoxy
0
0.05
0.1
0.15
0.2
0.25
0.3
0.35
0.4
0.45
0.5
0
0.05
0.1
0.15
0.2
0.25
0.3
0.35
0.4
0.45
0.5
0 5 10 15 20
SW
R, m
m3/N
.m 10 -
6
Sliding distance,km
NEAT P
GFRP N-O
GFRP-AP-O
GFRP P-O

40
The result of specific wear rate of glass/polyester and neat polyester against the
sliding distance of different orientations is represented in Fig 4.1.b. It shows the
specific wear rate of glass/polyester at various orientations with the neat polyester.
Since the highest wear rate value is registered for the (P-O) at sliding distance of
about 3 km since the interaction between the hardness some time to adopt, the right
vertical axis is presented the values of specific wear rate. Because the specific wear
rate (SWR) is very small, the obtained values are multiplied by 1000000. It is
generally seen that the polyester composites show the lowest specific wear rate for
(AP-O and N-O) at approximately after 3 km. Likewise, the composites reached the
steady state after 6 km. Concerning to the composite, the wear rate has significantly
decreased with increasing the sliding distance for the orientations, i.e. (AP-O and N-
O) This lowering is pronounced after about 3 km. After about 6 km all the
composites have reach the steady state. Meanwhile, for (N-O) gives less wear rate
compared to the others for all levels of sliding distances are tested. Furthermore,
there is no markedly difference in wear rate for all the composites when they reached
the steady state. Differently, in comparison with (N- O) exhibits less wear rate at
lower sliding direction and slightly decrease in wear rate at higher sliding distance.
It is accepted that glass fibre gives superior wear performance and through the
sliding of the (N-O) orientation. (Ws) Values of the composites are obviously
decreased as a result the better wear behaviour of the composite is achieved for (N-
O). Therefore, it could be due to the reinforcement of the adhesion properties
between the glass fibre and the polyester resin. From the mechanical point of view,
the interface adhesion is enhanced the mechanical characteristics of the composite.
hus the material’s strengthens is another reason hich can cause to lo er eight

41
removal. However, Summary of the specific wear rate of the selected materials after
reaching the steady state at 10 km is shown in Fig.4.2. It seems that there is general
value of specific wear rate of GFRE and GFRP in which the best wear performance
can be achieved, i.e. (N-O) for both fibre composites exhibited an optimum value.
On the other hand, neat epoxy and neat polyester are reached the highest value for
both composite. GFRP is shown the higher value compared to GFRE in the case of
(AP-O). Moreover, there is markedly difference value between the composites in (P-
O). However, the optimum wear value is produced in the (N-O) for both materials.
Due to the lowering in the hardness of the film in the composite surface this can be
related to the mechanical properties in term of interfacial adhesion and strength.
Fig. 4. 2 Summary of the specific wear rate of the selected materials after reaching
the steady state.
0
0.01
0.02
0.03
0.04
0.05
0.06
0
0.01
0.02
0.03
0.04
0.05
0.06
0.07
NEAT N-O P-O AP-O
Ws,
mm
³/N
.m 1
0 -6
Materials' Orientations
GFRP GFRE

42
4.2 FRICTION COEFFICIENT
Fig 4.3.a shows the distinction of friction coefficient values for all materials with
sliding distance for three orientations and applied load 30N, and sliding velocity
2.8m/s. It can be indicated that the trend of the friction coefficient is slightly
decreased with increasing the sliding distance for the neat epoxy. Moreover, friction
coefficient of the normal and parallel orientations is partially increased at about 6 km
and starts to reach a steady state. Differently, anti-parallel orientation provides the
lowest value of friction coefficient comparing to neat epoxy (about 29% lass). As a
result, the values of friction coefficient have evidently increased for the most
orientations. The glass fibre epoxy composite confirms that similar behaviour to
three orientations. However, the friction coefficient of the composite with fibres is
higher than the glass fibre where glass fibre demonstrates about the range of 0.29 to
0.45 while the neat epoxy gives above 0.49 of friction coefficient.
In the light of this, there is difference between the three orientations of the composite
in terms of friction coefficient. It can be seen that there are close values for the
friction coefficient between normal and parallel, however, the trend of the anti-
parallel orientation exhibits the lowest value of (0.25-0.3) than the others.
The effect of sliding distance and applied load on friction coefficient of GFRP is
presented in Fig 4.3.b. In addition to that, the influence of glass fibres on the
tribological behaviour of the neat polyester and the composite are clarified.

43
Regarding to the composite, the findings of friction coefficient are provided as a
function of sliding distance at 30N applied load. Generally, it can be seen that the
friction coefficient increases at the beginning and starts to reduce at approximately (5
km) sliding distance. However, it appears that normal and anti-parallel (N-O and
AP-O) orientations have achieved the lowest friction coefficient at the applied load
of 30N which are about 0.23 and 0.28 respectively. Consequently, the higher value
of friction coefficient is evident for the neat polyester, which is about 0.42 while the
glass fibre composite at different orientations exhibit 0.2 to 0.3 of friction coefficient.
There is no significant effect on the friction coefficient at different sliding distance.
It can be seen that friction coefficient does not reach steady state at all sliding
distance. Nevertheless, the friction coefficient is minimized whilst the sliding
distance increasing. This cause can be due to the strongly transfer film on the
counterface and the existence of the fibres and polyester. During longer sliding may
lead to impairs the adhesion between the two sliding surfaces and then associated
interaction takes place between them. The influence of the friction coefficient and
wear performance will be illustrated by the help of the micrographs of the
composite's worn surface. With regards to the glass fibre polymer composite, the
friction coefficient of both GFRP and GFRE are summarised in Fig 4.4. The highest
friction coefficient during tribological conditions at 10 km is represented for neat
composite. However, the friction coefficient is high for other direction of the
composite. This can be noted that the deponding of fibre and the strong of interfacial
adhesion are avoided breakage and bending. As a result, (AP-O) show the lowest
friction value for both materials. Whereas, (N-O) in GFRE has a higher value than

44
(N-O) in GFRP. However, (AP-O) in GFRP is achieved the lowest value compared
with all the orientations for both composite.

45
a) GFRE
b) GFRP
Fig. 4. 3 Friction coefficient against sliding distance of GFRP and GFRE
composites

46
Fig. 4. 4 Summary of the friction coefficient of the selected materials after
reaching the steady state after 10 km sliding distance
4.3 INTERFACE TEMPERATURE
Fig 4.5.a shows the influence of the applied load and different sliding distance on the
interface temperature of GFRE composite in different orientations (N-O, P-O, and
AP-O) and the comparison with the neat epoxy composite. The friction coefficient,
applied load and sliding distance are maximised. As a result, interface temperature is
expected that it is likely to increase. There is intimate relation between the interface
temperatures and sliding distance, at applied load of 30N interface temperature
reaches gradually the high temperature when the sliding distance increases. it can be
0
0.1
0.2
0.3
0.4
0.5
0.6
0
0.1
0.2
0.3
0.4
0.5
0.6
NEAT N-O P-O AP-O
Fri
ctio
n C
oef
fici
ent,
µ
Materials's Orientations
GFRP GFRE

47
noted that there is linear trend of temperature at the beginning of the sliding distance
until approximately 5Km, the highest degree is about 50ºC, after 14 Km for (NE).
Meanwhile, in the case of (AP-O) and (N-O), there is no severe effect on the
temperature degrees compared with (P-O) which reached 47ºC after 12km. Several
experiments have indicated that temperature trend is elevated gradually when the
sliding distance has long term effect on the composite. However, these outcomes
have been gained with the assist of thermo-imager camera which has been used for
every separate experiment at 30 N applied load, 2.8 m/s sliding velocity. Meanwhile,
the GFRE (N-orientation) is examined at 2.8 m/s, increasing in the sliding distance
does not observe any change in the temperature from 10 km until 14km.
Fig 4.5.b shows the maximum interface temperature that is evaluated during the
rubbing, i.e. at sliding distance 15km at 30N. The highest interface temperature is
measured due to the high friction coefficient of NP and GFRP (in P-O); higher
interface temperature is gauged in NP compared to NE composite. Since AP-O has
the lower temperature value than GFRE (in AP-O). Generally, the sliding distance
has close relation with the interface temperature, and friction coefficient of the entire
composite are increased. Therefore, we can record that the temperature starts in
increase after 10 km. Finally, thermo-image camera has been applied for every test
and provided more results.

48
a) GFRE
b) GFRP
Fig. 4. 5 Interface temperature vs. sliding distance the selected materials under 30
N applied load
4.4 COMPOSITE SURFACE OBSERVATION
Further explanation will be exhibited with the assist of the roughness profile in the
next dictation. The results from the test are recorded in the direction of the
counterface and against the direction of the counterface. Fig 4.6 shows some samples
0
10
20
30
40
50
60
0 2 4 6 8 10 12 14 16
Tem
per
atu
re C
Sliding distance,km
GFRE,N 30NGFRE,APO 30NGFRE, PO 30NNE,30N
0
10
20
30
40
50
60
0 2 4 6 8 10 12 14 16
Tem
per
ature
, C
Sliding distance,km
GFRP,N-OGFRP,AP-OGFRP,P-ONP

49
of the roughness profile of the selected materials GFRE/GFRP at different operating
parameters. On the other hand, Fig 4.7 summarises the roughness values of the
selected materials after test under 30 N applied load for 15 km sliding distance. Fig
4.7.a shows the roughness value of GFRE. It seems that the highest value is recorded
in the case of (AP-O) in the direction of the counterface while the lowest value is
provided in (P-O). Compared to the GFRE, Fig 4.7.b shows significantly reduce the
roughness value of the GFRP in (AP-O) for both directions; moreover, one can
notice that (P-O) shows less effect value on the counterface in the direction of the
counterface.
Regarding to the surface roughness profile of the neat polyester and GFRP in three
orientations, it seems that the roughness profile of the (N-O) orientation has reached
the highest value of roughness profile of 3.536m. However, the roughness profile of
the AP-O is the lower value. Fig 4.7.b shows the relation between the roughness
values of the GFRP after test under 30N applied load for 15 sliding distance. In
addition to that, the roughness profile of the neat polyester is slightly decrease
compared to the surface roughness profile of the neat epoxy in the previous section.

50
Fig. 4. 6 Samples of the roughness profile of the selected materials at different
operating parameters

51
Fig 4.8 shows the effect of the sliding distance on the worn surface of the GFRE and
GFRP composites. Concerning the composite, severe damage on the worn surface of
the GFRE (N-O) is recorded. At the maximum value of the sliding distance the
rubbing is partially different compared with lower distance. In order to reduce the
friction coefficient, a set of fibre has been removed and peeled off from the rubbing
area. At 2Km and 30 N, there is no indication of movement of fibres. Whereas,
micro-cracks have risen on the surface, indicate the elevated wear performance of the
composite at the rubbing region. As a result, it can be concluded that at ruthless
conditions of higher load and/or sliding distance micro-cracks dominate on the wear
resistance of GFRE in (N-O).

52
a) GFRE
b) GFRP
Fig. 4. 7 Roughness value of the selected materials after test under 30 N applied
load for 10 15km sliding distance

53
Fig. 4. 8 Micrographs of GFRE worn surface after the test under 30 N applied
load in N-Orientation
Fibre end
Depondi
ng
Micro-crack
Debris

54
Fig 4.9 represents that micrograph of GFRP worn surface after the test under 30 N
applied load in AP-Orientation. The weakened interfacial adhesion in the fibre
end is between the fibre and the resin zone. This concludes that (at sliding
distance) the wear mechanism of GFRP in N-O is dominated which related with
the same orientation and its wear mechanism.
Fig. 4. 9 Micrographs of GFRP worn surface after the test under 30 N applied
load in AP-Orientation
Fibre end
Plastic
Deformation

55
4.5. Discussions and Comparison with Previous Published Works
In this chapter, the experimental results on neat epoxy, glass fibre reinforced
epoxy/polyester composite in three orientations as (N-O, P-O, and AP-O) are
compared with some of the studies in terms of weight loss and frictional behaviour at
various operating parameters. Fig 4.10 presents several researches and studies that
have determined the values of specific wear rate and frictional behaviour of several
composites, and current outputs are painted of different colour. Shi et al., (2003)
have investigated the highest value of specific wear rate of neat epoxy composite
compared to the specific wear rate of this work (Shi et al., 2003). Furthermore, neat
polyester has marked the lower friction coefficient and weight loss, specific wear rate
and friction coefficient were measured about (0.03234), and (0.23) respectively, (El-
Tayeb, 2008). Moreover, the present specific wear rate of glass fibre/epoxy shows
the lowest value and the highest friction coefficient is recorded than the other one
which was studied by Pihtili (2009)(Pihtili, 2009). The friction coefficient and wear
rate of glass fibre/polyester composite are shown in figure below. The same friction
coefficient is produced compared to the value was defined by Shalwan and Yousif
(2012) (Yousif, 2012). However, glass fibre/polyester exhibits low specific wear
rate (0.02).

56
Fig. 4. 10 Specific wear rate and frictional behaviour of several composites,
(El-Tayeb et al., 2008)*,(Shi et al., 2003)**,(Pihtili, 2009)x,(Suresha and Kumar,
2009)xx

57
CHAPTER 5:
CONCLUSION AND RECOMMENDATION
5.1 CONCLUSIONS
Few points are concluded as follows:
1. Presence of fibres and oriented have a significant influence on the wear and
frictional behaviour of polymeric composites. In the case of glass fibre
reinforced epoxy composite, the better wear and frictional behaviour were
performed when the composite was tested in N-O.
2. The fibre orientations has highly influence and similar in controlling the
friction and wear performance. However, the specific wear rate of the
composite is consistently and essentially high in AP-O compared to N-O of
the composites. Moreover, the sliding distance and applied load have a little
influence on the tribological properties.
3. The detachment and breakage of fibres were the most effect on the wear
mechanism. Meanwhile, micro-cracks at the end of the fibres is the declare
wear technique in (N-O and P-O).
4. The worn surface of the composite showed different wear mechanisms. For
the GFRP, plastic deformation was clear and softening process occurred
during the sliding which deteriorates the composite surface. For the GFRE,

58
this less damage on the surface with the presence of the micro-cracks which
indicate the high wear resistance in the interface.
5. even though, the increasing temperature and frictional force have a substantial
and consequently effect on the tribological properties of both polymeric
composite. However, the interface temperature has a pronounce influence on
the frictional force on the material removal from the composite surface.
Moreover, there are different appearances of wear mechanism depending on
the temperature can be resulted by the heat generated by the frictional force.
5.2 RECOMMENDATION
It is suggested that more researches have to be done on other type of materials in
order to evince and reach the existing work returns. While the tribology is the
interaction between different responses to the polymers, metals are preferred due to
their responses to the interaction. Additional discussion has to be the main
consideration so as to reduce the friction force of the glass fibre based on epoxy
and/or polyester composites. Therefore, the high friction coefficient of the glass fibre
reinforced epoxy composite is minimized by using solid lubricants.

59
REFERENCES
ADDY, M. & SHELLIS, R. 2006. Interaction between attrition, abrasion and erosion
in tooth wear.
BAJPAI, P. K., SINGH, I. & MADAAN, J. 2013. Tribological behavior of natural
fiber reinforced PLA composites. Wear, 297, 829-840.
BASAVARAJAPPA, S. & ELLANGOVAN, S. 2012a. Dry sliding wear
characteristics of glass-epoxy composite filled with silicon carbide and
graphite particles. Wear.
BASAVARAJAPPA, S. & ELLANGOVAN, S. 2012b. Dry sliding wear
characteristics of glass–epoxy composite filled with silicon carbide and
graphite particles. Wear, 296, 491-496.
BEN CHEIKH LARBI, A., CHERIF, A. & TARRES, M. A. 2005. Improvement of
the adhesive wear resistance of steel by nitriding quantified by the energy
dissipated in friction. Wear, 258, 712-718.
BHUSHAN, B., ISRAELACHVILI, J. N. & LANDMAN, U. 1995. Nanotribology:
friction, wear and lubrication at the atomic scale. Nature, 374, 607-616.
BLAU, P. J. 2010. Elevated-temperature tribology of metallic materials. Tribology
International, 43, 1203-1208.
BROSTOW, W., DEBORDE, J. L., JACLEWICZ, M. & OLSZYNSKI, P. 2003.
Tribology with emphasis on polymers: friction, scratch resistance and wear.
Journal of Materials Education, 25, 119-132.
BROS OW W. KOVAČEVIC V. VRSALJKO D. & WHI WOR H J. .
Tribology of polymers and polymer-based composites. Journal of Materials
Education, 32, 273.
BUDINSKI, K. G. & BUDINSKI, M. K. 2009. Engineering materials. Nature, 25,
28.
CHAUHAN, S., GAUR, B. & DASS, K. 2012. Synergistic Effects of Micro Size
Flyash Particulate and Glass Fiber on Friction and Wear of Vinylester Hybrid

60
Composites under Dry and Water Lubricated Sliding Condition. International
Journal of Materials Engineering, 2, 23-31.
CHIN, C. & YOUSIF, B. 2009. Potential of kenaf fibres as reinforcement for
tribological applications. Wear, 267, 1550-1557.
CONG, P., XIANG, F., LIU, X. & LI, T. 2008. Effect of crystalline form on the
tribological properties of PA46/HDPE polyblends. Wear, 265, 1106-1113.
EL-TAYEB, N., YOUSIF, B. & YAP, T. 2006. Tribological studies of polyester
reinforced with CSM 450-R-glass fiber sliding against smooth stainless steel
counterface. Wear, 261, 443-452.
EL-TAYEB, N. S. M. 2008. A study on the potential of sugarcane fibers/polyester
composite for tribological applications. Wear, 265, 223-235.
EL-TAYEB, N. S. M., YOUSIF, B. F. & YAP, T. C. 2008. An investigation on worn
surfaces of chopped glass fibre reinforced polyester through SEM
observations. Tribology International, 41, 331-340.
FARUK, O., BLEDZKI, A. K., FINK, H.-P. & SAIN, M. 2012. Biocomposites
reinforced with natural fibers: 2000–2010. Progress in Polymer Science, 37,
1552-1596.
FRIEDRICH, K., LU, Z. & HAGER, A. 1995. Recent advances in polymer
composites' tribology. Wear, 190, 139-144.
FRIEDRICH, K., ZHANG, Z. & SCHLARB, A. K. 2005. Effects of various fillers
on the sliding wear of polymer composites. Composites Science and
Technology, 65, 2329-2343.
HOLMBERG, K., ANDERSSON, P. & ERDEMIR, A. 2012. Global energy
consumption due to friction in passenger cars. Tribology International, 47,
221-234.
HUTCHINGS, I. M. 1992. Tribology: friction and wear of engineering materials,
Butterworth-Heinemann Ltd.
KHONSARI, M. M. & BOOSER, E. R. 2008. Applied tribology: bearing design and
lubrication, Wiley.
MONTEIRO, S. N., CALADO, V., RODRIGUEZ, R. J. S. & MARGEM, F. M.
2012. Thermogravimetric behavior of natural fibers reinforced polymer

61
composites—An overview. Materials Science and Engineering: A, 557, 17-
28.
MYSHKIN, N., PETROKOVETS, M. & KOVALEV, A. 2006. Tribology of
polymers: adhesion, friction, wear, and mass-transfer. Tribology
International, 38, 910-921.
MYSHKIN, N. K., PETROKOVETS, M. I. & KOVALEV, A. V. 2005. Tribology of
polymers: Adhesion, friction, wear, and mass-transfer. Tribology
International, 38, 910-921.
NIRMAL, U., YOUSIF, B., RILLING, D. & BREVERN, P. 2010a. Effect of
betelnut fibres treatment and contact conditions on adhesive wear and
frictional performance of polyester composites. Wear, 268, 1354-1370.
NIRMAL, U., YOUSIF, B. F., RILLING, D. & BREVERN, P. V. 2010b. Effect of
betelnut fibres treatment and contact conditions on adhesive wear and
frictional performance of polyester composites. Wear, 268, 1354-1370.
NOSONOVSKY, M. & BHUSHAN, B. 2007a. Multiscale friction mechanisms and
hierarchical surfaces in nano- and bio-tribology. Materials Science and
Engineering: R: Reports, 58, 162-193.
NOSONOVSKY, M. & BHUSHAN, B. 2007b. Multiscale friction mechanisms and
hierarchical surfaces in nano-and bio-tribology. Materials Science and
Engineering: R: Reports, 58, 162-193.
NOSONOVSKY, M. & BHUSHAN, B. 2012. Green Tribology: Biomimetics,
Energy Conservation and Sustainability, Springer.
PIHTILI, H. 2009. An experimental investigation of wear of glass fibre–epoxy resin
and glass fibre–polyester resin composite materials. European Polymer
Journal, 45, 149-154.
QUINTELIER, J., DE BAETS, P., SAMYN, P. & VAN HEMELRIJCK, D. 2006.
On the SEM features of glass–polyester composite system subjected to dry
sliding wear. Wear, 261, 703-714.
SAMUEL, O. D., AGBO, S. & ADEKANYE, T. A. 2012. Assessing Mechanical
Properties of Natural Fibre Reinforced Composites for Engineering
Applications. Journal of Minerals and Materials Characterization and
Engineering, 11, 780-784.

62
SENA NETO, A. R., ARAUJO, M. A. M., SOUZA, F. V. D., MATTOSO, L. H. C.
& MARCONCINI, J. M. 2013. Characterization and comparative evaluation
of thermal, structural, chemical, mechanical and morphological properties of
six pineapple leaf fiber varieties for use in composites. Industrial Crops and
Products, 43, 529-537.
SHALWAN, A. & YOUSIF, B. 2012. In State of Art: Mechanical and Tribological
Behaviour of Polymeric Composites Based on Natural Fibres. Materials &
Design.
SHALWAN, A. & YOUSIF, B. F. 2013. In State of Art: Mechanical and tribological
behaviour of polymeric composites based on natural fibres. Materials &
Design, 48, 14-24.
SHI, G., ZHANG, M. Q., RONG, M. Z., WETZEL, B. & FRIEDRICH, K. 2003.
Friction and wear of low nanometer Si3N4 filled epoxy composites. Wear,
254, 784-796.
SURESHA, B. & KUMAR, K. N. S. 2009. Investigations on mechanical and two-
body abrasive wear behaviour of glass/carbon fabric reinforced vinyl ester
composites. Materials & Design, 30, 2056-2060.
SURESHA, B., SEETHARAMU, S. & KUMARAN, P. S. 2009. Investigations on
the influence of graphite filler on dry sliding wear and abrasive wear
behaviour of carbon fabric reinforced epoxy composites. Wear, 267, 1405-
1414.
SURESHA, B., SHIVA KUMAR, K., SEETHARAMU, S. & SAMPATH
KUMARAN, P. 2010. Friction and dry sliding wear behavior of carbon and
glass fabric reinforced vinyl ester composites. Tribology International, 43,
602-609.
UNAL, H., MIMAROGLU, A. & ARDA, T. 2006. Friction and wear performance of
some thermoplastic polymers and polymer composites against unsaturated
polyester. Applied Surface Science, 252, 8139-8146.
U AL H. MIMAROGLU A. KADıOGLU U. & EKIZ, H. 2004. Sliding friction
and wear behaviour of polytetrafluoroethylene and its composites under dry
conditions. Materials & Design, 25, 239-245.
63
VAN KUILENBURG, J., MASEN, M. A., GROENENDIJK, M. N. W., BANA, V.
& VAN DER HEIDE, E. 2012. An experimental study on the relation
between surface texture and tactile friction. Tribology International, 48, 15-
21.
YAN, D., QU, N., LI, H. & WANG, X. 2010. Significance of dimple parameters on
the friction of sliding surfaces investigated by orthogonal experiments.
Tribology Transactions, 53, 703-712.
YOUSIF, B. 2012. Design of newly fabricated tribological machine for wear and
frictional experiments under dry/wet condition. Materials & Design.
YOUSIF, B. & EL-TAYEB, N. 2008a. High-stress three-body abrasive wear of
treated and untreated oil palm fibre-reinforced polyester composites.
Proceedings of the Institution of Mechanical Engineers, Part J: Journal of
Engineering Tribology, 222, 637-646.
YOUSIF, B. F. 2013a. Design of newly fabricated tribological machine for wear and
frictional experiments under dry/wet condition. Materials & Design, 48, 2-13.
YOUSIF, B. F. 2013b. Editorial for SI: Materials, design and tribology. Materials
and Design.
YOUSIF, B. F. & EL-TAYEB, N. S. M. 2008b. Wear and friction characteristics of
CGRP composite under wet contact condition using two different test
techniques. Wear, 265, 856-864.
YOUSIF, B. F., LAU, S. T. W. & MCWILLIAM, S. 2010. Polyester composite
based on betelnut fibre for tribological applications. Tribology International,
43, 503-511.
YOUSIF, Y. H. A. A. B. F. 2013c. Correlation between Frictional force, Interface
Temperature and Specific Wear Rate of Fibre Composites. Center of
Excellence in Engineered Fibre Composites(EEC).

64
APPENDIX A: PROJECT SPECIFICATION
ENG8002 Research Project
PROJECT SPECIFICATION
Project title: Adhesive Wear and Frictional Behaviour of
Glass Fibre Reinforced Thermoset composites
Student: Gabrel Mehoub
Supervisor: Dr Belal F Yousif
Amis and Objectives:
1. To study the specific wear rate and friction behaviour of epoxy and
polyester composite based on glass fibre.
2. To study the influence of fibre orientations on specific wear rate and
friction coefficient.
3. To examine the worn surfaces of the composite after the test and
categorize the wear mechanism.
4. To understand the influence of interface temperature on specific wear rate
and friction behaviour
5. To investigate the influence of the rubbing process on the roughness
profile of the composite.

65
Project Synopsis:
There are many troubles in the field of industries. It is known that the friction is the
major pronounce resulting from the motion of contacted surface; therefore, high
temperature and shear force are generated in the rubbing area. Friction and dry wear
behaviour of glass fibre reinforced epoxy (GFRE) and glass fibre reinforced
polyester (GFRP) composites will be studied in the current project. The adhesive
wear experiments will be carried out using block-on-ring (BOR) configuration at
room temperature, applied load of (30N), and sliding velocity of (2.8 m/s). Interface
temperature and frictional force will be captured and recorded during the sliding.
Worn surfaces will be examined by using (SEM) to classify the damage.

66
APPENDIX B: CONFERENCE PAPER
Adhesive Wear and Frictional Behaviour of Glass Fibre Reinforced Thermoset
composites
G. A. Mehoub, C.W. Chin, A. Shalwan and B.F. Yousif Faculty of Engineering and
Surveying, the University Southern Queensland, QLD4350, Toowoomba, Australia.
Abstract
Friction and dry wear behaviour of glass fibre reinforced epoxy (GFRE) and glass fibre
reinforced polyester (GFRP) composites are studied in the current project. Three sliding
orientations of fibre with respect to the sliding distance are considered in the investigation,
i.e. parallel orientation (P-O), anti-parallel orientation (AP-O), and normal orientation (N-
O). On the other hand, different sliding distances 0- 15 km are accounted. The adhesive
wear experiments were carried out using block-on-ring (BOR) configuration at room
temperature, applied load of 30N, and sliding velocity of 2.8 m/s. Interface temperature and
frictional force were captured and recorded during the sliding. Worn surfaces were
examined by using (SEM) to classify the damage. The results revealed that the highest wear
rate is taken place in (AP-O) of GFRE. (P-O) is the highest wear rate of GFRP. On the other
hand, the lowest wear rate is exhibited for (N-O) at longer sliding distance. The maximum
friction coefficient is observed when sliding take place in N-O and P-O at higher speed
level. Although, AP-O shows 0.25 which is the lowest friction coefficient value than other
orientations. (P-O) orientation of GFRP gave higher wear rate at maximum speed test in
comparing to normal orientation.
Keywords: Adhesive wear, Thermoset, Fibre, orientation
1. Introduction
As a result of the rapid development that the world
witnesses and the challenge in using metal materials
in tribological industrial applications, the tribological
behaviour of polymeric composites has recently
experienced a create development, and attention by
many researchers. Fibre reinforced polymeric
composites have numerous advantages compared to
the metal materials due to their competitive
mechanical properties of high specific strength, low
weight, low cost of raw materials, low processing
cost…etc. Recently, composites materials are heavily
used in many applications that have been determined
for these materials. Furthermore, composites
materials have been provided superlative solutions to
produce structural materials of aerospace industries,
(Pihtili, 2009). Tribological properties of such
materials have been a core of interest for many
scholars and researchers. The friction and wear
performance are the significance characteristics that
have taken place by several researches,(Yousif,
2013b, Bajpai et al., 2013) focusing on the composite
application in brakes, clutches, bolts and nuts. On the
other hand, Shalwan and Yousif (2013) have been
expounded that friction is the value of energy which
dissipated at the material contact surface. Wear, the
resistance to remove of solid surface, has been
defined in various aspects such as weight loss, wear
resistance and specific wear rate, (Bajpai et al.,
2013). Friction and wear are classified to become a
main effect on the machinery in the field of industry
as so to work efficiently. Such deficiencies are
mainly related to lifetime of the machinery,
(Holmberg et al., 2012). In other words, it is
important to arouse many researches to study the
tribological behaviour of polymeric composites.
Nowadays, friction and wear are the most common
problems that encountered in industrial engineering
and machine parts which causes to the replacement of
components and assemblies in engineering, (Unal et

67
al., 2004). As a result, the uses of polymer materials
have been increased by industrial countries.
Therefore, the need to understand the tribological
behaviour of polymer is clear of this fact of polymer
science and engineering, (Brostow et al., 2010).
There have been several types of productive friction
and wear such as brakes, clutches, bolts and nuts.
Also the unproductive friction and wear is equally
considerable such as gas turbine, cams and bearings,
and external combustion engines, (Bhushan et al.,
1995). Nevertheless, the influences of deformation
and adhesion of friction are addressed. Friction on
surface energy is affected by different factors which
are sliding velocity, applied load, and temperature,
(Myshkin et al., 2005). In addition, the authors have
reported that friction comprises of three elements
namely, interfacial bonds, strength, and shearing and
rupture of rubbing around the contact area of
materials. It may also lead to damage materials’
surface and then change the mechanical properties of
the composite. Finally, the results from friction are
temperature during converting mechanical energy to
heat, this heat is produced by friction and
deformation of materials leads to generate heat. On
the other hand, few beneficial applications are
provided by the friction such as tyres, and brakes
friction. There are several studies have been done to
inspect the tribological performance of polymeric
composites based on synthetic fibres such as glass,
(Pihtili, 2009). Carbone fibres were investigated by
(Suresha and Kumar, 2009). From the literature, there
is a lack of understanding on the tribological
behaviour of thermoset composites based on
synthetic fibres such as glass. In the recent work by
Shalwan and Yousif (2013), it is highly
recommended further studies on the thermoset
composites to identify the wear and frictional
characteristics of thermoset composites based on
glass fibres. This motivates the current study. In the
current report, the wear and frictional behaviour of
two fibre thermoset composites are considered as
epoxy and polyester. Three different orientations of
fibre with respect to the sliding distance are
accounted in the study and different sliding distance
0- 15 km. As a result of the rapid development that
the world witnesses and the challenge in using metal
materials in tribological industrial applications, the
tribological behaviour of polymeric composites has
recently experienced a create development, and
attention by many researchers. Fibre reinforced
polymeric composites have numerous advantages
compared to the metal materials due to their
competitive mechanical properties of high specific
strength, low weight, low cost of raw materials, low
processing cost etc. Recently, composites materials
are heavily used in many applications that have been
determined for these materials. Furthermore,
composites materials have been provided superlative
solutions to produce structural materials of aerospace
industries, (Pihtili, 2009). Tribological properties of
such materials have been a core of interest for many
scholars and researchers. The friction and wear
performance are the significance characteristics that
have taken place by several researches,(Yousif,
2013b, Bajpai et al., 2013) focusing on the composite
application in brakes, clutches, bolts and nuts. On the
other hand, Shalwan and Yousif (2013) have been
expounded that friction is the value of energy which
dissipated at the material contact surface. Wear, the
resistance to remove of solid surface, has been
defined in various aspects such as weight loss, wear
resistance and specific wear rate, (Bajpai et al.,
2013). Friction and wear are classified to become a
main effect on the machinery in the field of industry
as so to work efficiently. Such deficiencies are
mainly related to lifetime of the machinery,
(Holmberg et al., 2012). In other words, it is
important to arouse many researches to study the
tribological behaviour of polymeric composites.
Nowadays, friction and wear are the most common
problems that encountered in industrial engineering
and machine parts which causes to the replacement of
components and assemblies in engineering, (Unal et
al., 2004). As a result, the uses of polymer materials
have been increased by industrial countries.
Therefore, the need to understand the tribological
behaviour of polymer is clear of this fact of polymer
science and engineering, (Brostow et al., 2010).
There have been several types of productive friction
and wear such as brakes, clutches, bolts and nuts.
Also the unproductive friction and wear is equally
considerable such as gas turbine, cams and bearings,
and external combustion engines, (Bhushan et al.,
1995). Nevertheless, the influences of deformation
and adhesion of friction are addressed. Friction on
surface energy is affected by different factors which
are sliding velocity, applied load, and temperature,
(Myshkin et al., 2005). In addition, the authors have
reported that friction comprises of three elements
namely, interfacial bonds, strength, and shearing and
rupture of rubbing around the contact area of
materials. It may also lead to damage materials’
surface and then change the mechanical properties of
the composite. Finally, the results from friction are
temperature during converting mechanical energy to
heat, this heat is produced by friction and
deformation of materials leads to generate heat. On
the other hand, few beneficial applications are
provided by the friction such as tyres, and brakes
friction. There are several studies have been done to
inspect the tribological performance of polymeric
composites based on synthetic fibres such as glass,
(Pihtili, 2009). Carbone fibres were investigated by
(Suresha and Kumar, 2009). From the literature, there

68
is a lack of understanding on the tribological
behaviour of thermoset composites based on
synthetic fibres such as glass. In the recent work by
Shalwan and Yousif (2013), it is highly
recommended further studies on the thermoset
composites to identify the wear and frictional
characteristics of thermoset composites based on
glass fibres. This motivates the current study.
In the current article, the wear and frictional
behaviour of two fibre thermoset composites are
considered as epoxy and polyester. Three different
orientations of fibre with respect to the sliding
distance are accounted in the study and different
sliding distance 0- 15 km.
2. Materials preparation and experimental
procedure
2.1. Materials preparation
This study proposed to use these materials in terms of
their surface damage characteristics meanwhile they
were experimented under diverse sliding conditions.
Hence these materials have to be used in these
experiments easier than other materials which may
appear no surface damage. This project has used well
known materials such as Neat Epoxy (NE), Glass
Fibre Reinforced Epoxy (GFRE).
There are combinations of materials being used to
meet technical procedures. Glass fibres based
composites have been specified of a set of
mechanical characteristic. In addition, this work has
been used the liquid of epoxy resin (DER 331). It is
occasionally used for several purposes such as
automotive parts and casting. Epoxy resin supplies
good resistance to adhesive and alkalis properties.
The epoxy resin and hardener has been mixed with
2:1 of ratio. Also the mixture was systematically
made, melted down in the mould and placed in the
vacuum room (MCP 004PLC). In order to dispose of
air bubbles between fibres in the mould at room
temperature 24 hour. Glass fibre reinforced epoxy
and glass fibre reinforced polyester were chosen as
reinforcement materials. In order to provide
prestigious properties for, this specimens were
conducted with the specific volume of fibre is vf
=48%. Micrographs of the original composite surface
for both materials selected are shown in Fig.1.
Consequently, the orientations of fibre have been
paid attention. GFRP were used as a reinforcement
material that it provides a high chemical resistance
and high resistance to environmental influences.
Epoxy resins are preferred so as to commonly of
available rates from high melting solids, and viscous
liquids. They have numerous of mechanical
properties, and chemical resistance. Furthermore,
epoxy resin had approximately less than 2% of the
shrinkage and high hardness. The provided
composites were formed in size 30mm*20mm*20mm
and different orientations of fibres were displayed in
Fig.2.
a) GFRP
a) GFRE
Fig.1 Micrographs of the original composite surface
for a) GFRP and b) GFRE
Fig. 2 Schematic drawing showing the orientation of
the fibre with respect to the sliding direction
Similar techniques are conducted in fabricating the
synthetic specimen, three orientations have been
considered in the tests. Polyester is a thermosetting
resin that has been used a. Glass fibre reinforced
polyester has been produced under a different of
Glass
Epox
y
Polyester Glass fibre

69
lengths, widths, and weights. 20-30mm, 450g/m2 are
used as measurements of current specimen of fibre
lengths and mass of fibre respectively. (Revesol
P9509) is an unsaturated and addition of Methyl
Ethyl Ketone Peroxide (MEKP) which can be used
for ambient the surrounding temperature. Kong Tat
Company of fiberglass engineering (Malaysia) has
been provided both reinforcement and polyester
materials.
2.2. Experimental set up and procedure
2.2.1 Experimental set ups
Block-On-Ring (BOR) is the main machine that it has
been used to conduct the experiments. The specimens
surface (10mm*10mm*20mm) was tested against a
counterface made of stainless steel (AISI 304,
hardness =1250HB, Ra=0.1µm). Before each test,
(Sic G2000) was utilized to smooth the counterface
and thereafter a piece of wet cloth with acetone was
used to clean the counterface. Fig. 3 shows the block
on ring step up showing the load cell, samples,
counterface and the sample holder. The load cell is
connected to the computer to capture the frictional
force during the experiments.
Fig. 3 Photo showing the Block-on-Ring
configuration of multi-purpose machine, (Yousif,
2013a).
The roughness of the wear track was gauged before
and after experiment by using Mahr Perthometer S2,
As a result for higher close contact between the
stainless steel and the specimen, abrasive paper (Sic
G2000) and dry soft brush was used to polish and
cleaned respectively the specimens contact surface.
The composite surface varies in each orientation in
terms of the roughness. For instance, in N-O, the
composite roughness measures were in rate of the
(0.70µm). While, in P-and AP-orientation were the
average of (0.30µm).
2.2.2 Experimental Procedure
The experiments were processed at appropriateness
parameters hich are constant applied load ( )
sliding velocity of . m s and sliding distance ( -
m) at room temperature ( C). he used of a ne
specimen had to be done for each sliding distance.
Before and after the test, the dry soft brush cleaned
the prepared composite specimen continually. Serta
weight balancer (±0.1mg) being used in this
operation to determine and ensure the weights of the
composite specimen before and after test and then
weight loss was evaluated. In addition, thermo-
imager camera was applied as so to determine the
initial interface temperature. SEM (JEOL) was used
to investigate the composite surface morphology.
The composite specimen surface was coated before to
use the SEM machine. Thus, each tribological test
was repeatedly done several times and the average of
the magnitudes was measured. The weights of the
specimens before and after test using Sera balancer
and then specific wear rate were determined for each
test condition by using Eq1.
(1)
In the light of this weight, during and after the
experiment interface temperature was standardized.
Using a thermo imager can be used while after the
test, can also show the heat allocation during the
materials sample. Moreover, the temperature was
generated and the thermo imager camera has been
used because of interface temperature was calibrated
during periods of time. The specific wear
performance is one of the expected results as so to
explore the impact of the wear damage on the
specimen surface. Therefore, theoretical rules were
applied to measure the relationship between the
sliding distance and the weight of the specimen
before and after the test in order to investigate the
specific wear rate. As a result the required friction
force can be obtained by the tribology software which
was connected with the Block-on-Ring machine.
Hence, shear force readings were automatically
registered according to the results data.
3. Results and Discussion
Tribological experimental results of glass fibre /
epoxy and polyester are presented at various
operating parameters. Frictional and wear behaviour
of the composites and the thermoset are introduced in
a form of friction coefficient, interface temperature,
and specific wear rate. Surface morphology and
roughness profile of the worn surfaces are given to
assist in explaining the experimental wear and
frictional results.

70
3.1.1. Wear Behaviour
In order to study the wear behaviour of neat epoxy,
(NE), neat polyester (NP), glass fibre reinforced
epoxy (GFRE) and glass fibre reinforced polyester
(GFRP), a series of experiments have been conducted
at different operating parameters and orientations.
The orientations are (N-O, P-O, and AP-O)
The specific wear rate of the GFRE and NE against
the sliding distance of different orientations is given
in Fig. 4.a. Since the specific wear rate (SWR) value
of all the selected materials is very small, the
presented values are multiplied by 1000000, and i.e.
the values should be multiplied by E-6. Moreover, the
specific wear rate of the epoxy is relatively high
compared to its composites that are why its values are
on the right vertical axis with different scale. From
this figure, one can see that the neat epoxy exhibits
very high specific wear rate and reached the steady
state after about 5 km. on the other hand, the epoxy
composites show lower specific wear rate compared
to the neat epoxy for all the fibre orientations. The
steady state of the composites reached after about 10
km since the interaction between the asperities took
longer time to adopt. Further explanation will be
given with the assist of the roughness profile in the
next section.
b) GFRE
c) GFRP
Fig. 4 Specific wear rate against sliding distance of
neat polyester, neat epoxy, GFRP and GFRE
composites
Regarding to the composite, (AP-O) orientation
indicates poorly wear rate compared to (P-O) and (N-
O) orientations, the composite in (P-O) and (N-O)
directions exhibit lower wear rate after sliding
distance of 5 km. moreover, in comparison with Neat
epoxy and three orientations found that AP-
orientation has approximately 30% less than Neat
epoxy while P and N orientations gave about (20%
less). The realization for this can be explained that
the proportionally harder phase (CSM) is pulled out,
broken, fractured of glass fibres and removed from
CSM. It is generally accepted that the weight loss of
the composite specimens have significantly increased
with the effect of constant sliding velocity and sliding
distance when applied load was about 30 N.
The results of specific wear rate of glass/polyester
and neat polyester versus the sliding distance of
different orientations is represented in Fig 4.b. It
shows the specific wear rate of glass/polyester at
various orientations with the neat polyester. Since
the highest wear rate value is registered for the (P-O)
at sliding distance of about 3 km since the interaction
between the hardness some time to adopt, the right
vertical axis is presented the values of specific wear
rate. Because the specific wear rate (SWR) is very
small, the obtained values are multiplied by 1000000.
It is generally seen that the polyester composites
show the highest specific wear rate for (AP-O and N-
O) at approximately 3 km. Likewise, the composites
reached the steady state after 6 km. Concerning to
the composite, the wear rate has significantly
decreased with increasing the sliding distance for the
orientations, i.e. (AP-O and N-O) This lowering is
pronounced after about 3 km. After about 6 km all
the composites have reach the steady state.
Meanwhile, for (N-O) gives less wear rate compared
to the others for all levels of sliding distances are
tested. Furthermore, there is no markedly difference
in wear rate for all the composites when they reached
the steady state. Differently, in comparison with (N-
O) exhibits less wear rate at lower sliding direction
and slightly decrease in wear rate at higher sliding
distance. It is accepted that glass fibre gives superior
wear performance and through the sliding of the (N-
O) orientation. (Ws) Values of the composites are
obviously decreased as a result the better wear
behaviour of the composite is achieved for (N-O).
Therefore, it can be due to the reinforcement of the
adhesion properties between the glass fibre and the
polyester resin. From the mechanical point of view,
the interface adhesion is enhanced the mechanical
characteristics of the composite. hus the material’s
strengthens is another reason, which can cause to
lower weight removal. However, Summary of the
specific wear rate of the selected materials after
reaching the steady state at 10 km is shown in Fig.5.
It seems that there is universal value of specific wear
0
0.05
0.1
0.15
0.2
0.25
0
0.01
0.02
0.03
0.04
0.05
0.06
0.07
0 5 10 15 20
SW
R,
mm
3/N
.m 1
0-6
SW
R,
mm
3/N
.m 1
0-6
Sliding distrance, km
GFRE-NOGFRE-APGFRE-P
0
0.05
0.1
0.15
0.2
0.25
0.3
0.35
0.4
0.45
0.5
0
0.05
0.1
0.15
0.2
0.25
0.3
0.35
0.4
0.45
0.5
0 5 10 15 20
SW
R,
mm
3/N
.m 1
0 -
6
Sliding distance,km
NEAT PGFRP N-OGFRP-AP-OGFRP P-O

71
rate of GFRE and GFRP in which the best wear
performance can be achieved, i.e. (N-O) for both
fibre composites exhibited an optimum value. On the
other hand, neat epoxy and neat polyester are reached
the highest value for both composite. GFRP is shown
the higher value compared to GFRE in the case of
(AP-O). Moreover, there is markedly difference value
between the composites in (P-O). However, the
optimum wear value is produced in the (N-O) for
both materials. Due to the lowering in the hardness of
the film in the composite surface this can be related
to the mechanical properties in term of interfacial
adhesion and strength.
Fig. 5 Summary of the specific wear rate of the
selected materials after reaching the steady state.
3.1.2. Friction Coefficient
Fig 6.a shows the distinction of friction coefficient
values for all materials with sliding distance for three
orientations and applied load 30N, and sliding
velocity 2.8m/s. It can be indicated that the trend of
the friction coefficient is slightly decreased with
increasing the sliding distance for the neat epoxy.
Moreover, friction coefficient of the normal and
parallel orientations is partially increased at about 6
km and starts to reach a steady state. Differently,
anti-parallel orientation provides the lowest value of
friction coefficient comparing to neat epoxy (about
29% lass). As a result, the values of friction
coefficient have evidently increased for the most
orientations. The glass fibre epoxy composite
confirms that similar behaviour to three orientations.
However, the friction coefficient of the composite
with fibres is higher than the glass fibre where glass
fibre demonstrates about the range of 0.29 to 0.45
while the neat epoxy gives above 0.49 of friction
coefficient.
In the light of this, there is difference between the
three orientations of the composite in terms of
friction coefficient. It can be seen that there are close
values for the friction coefficient between normal and
parallel, however, the trend of the anti-parallel
orientation exhibits the lowest value of (0.25-0.3)
than the others.
The effect of sliding distance and applied load on
friction coefficient of GFRP is presented in Fig 6.b.
In addition to that, the influence of glass fibres on the
tribological behaviour of the neat polyester and the
composite are clarified.
Regarding to the composite, the findings of friction
coefficient are provided as a function of sliding
distance at 30N applied load. Generally, it can be
seen that the friction coefficient increases at the
beginning and starts to reduce at approximately (5
km) sliding distance. However, it appears that
normal and anti-parallel (N-O and AP-O) orientations
have achieved the lowest friction coefficient at the
applied load of 30N which are about 0.23 and 0.28
respectively. Consequently, the higher value of
friction coefficient is evident for the neat polyester,
which is about 0.42 while the glass fibre composite at
different orientations exhibit 0.2 to 0.3 of friction
coefficient. There is no significant effect on the
friction coefficient at different sliding distance. It
can be seen that friction coefficient does not reach
steady state at all sliding distance. Nevertheless, the
friction coefficient is minimized whilst the sliding
distance increasing.
a) GFRE
b) GFRP
Fig. 6 Friction coefficient against sliding distance of
neat polyester, neat epoxy, GFRP and GFRE
composites
0
0.01
0.02
0.03
0.04
0.05
0.06
0
0.01
0.02
0.03
0.04
0.05
0.06
0.07
NEAT N-O P-O AP-O
Ws,
mm
³/N
.m 1
0 -6
Materials' Orientations
GFRP
GFRE

72
This cause can be due to the strongly transfer film on
the counterface and the existence of the fibres and
polyester. During longer sliding may lead to impairs
the adhesion between the two sliding surfaces and
then associated interaction takes place between them.
The influence of the friction coefficient and wear
performance will be illustrated by the help of the
micrographs of the composite's worn surface. With
regards to the glass fibre polymer composite, the
friction coefficient of both GFRP and GFRE are
summarised in Fig 7. The highest friction coefficient
during tribological conditions at 10 km is represented
for neat composite. However, the friction coefficient
is high for other direction of the composite. This can
be noted that the deponding of fibre and the strong of
interfacial adhesion are avoided breakage and
bending. As a result, (AP-O) show the lowest friction
value for both materials. Whereas, (N-O) in GFRE
has a higher value than (N-O) in GFRP. However,
(AP-O) in GFRP is achieved the lowest value
compared with all the orientations for both
composite.
Fig. 7 Summary of the friction coefficient of the
selected materials after reaching the steady state after
10 km sliding distance
3.1.3. Interface Temperature
Fig 8.a shows the influence of the applied load and
different sliding distance on the interface temperature
of GFRE composite in different orientations (N-O, P-
O, and AP-O) and the comparison with the neat
epoxy composite. The friction coefficient, applied
load and sliding distance are maximised. As a result,
interface temperature is expected that it is likely to
increase. There is intimate relation between the
interface temperatures and sliding distance, at applied
load of 30N interface temperature reaches gradually
the high temperature when the sliding distance
increases. it can be noted that there is linear trend of
temperature at the beginning of the sliding distance
until approximately 5Km, the highest degree is about
50ºC, after 14 Km for (NE). Meanwhile, in the case
of (AP-O) and (N-O), there is no severe effect on the
temperature degrees compared with (P-O) which
reached 47ºC after 12km. Several experiments have
indicated that temperature trend is elevated gradually
when the sliding distance has long term effect on the
composite. However, these outcomes have been
gained with the assist of thermo-imager camera
which has been used for every separate experiment at
30 N applied load, 2.8 m/s sliding velocity.
Meanwhile, the GFRE (N-orientation) is examined at
2.8 m/s, increasing in the sliding distance does not
observe any change in the temperature from 10 km
until 14km.
Fig 8.b shows the maximum interface temperature
that is evaluated during the rubbing, i.e. at sliding
distance 15km at 30N. The highest interface
temperature is measured due to the high friction
coefficient of NP and GFRP (in P-O); higher
interface temperature is gauged in NP compared to
NE composite. Since AP-O has the lower
temperature value than GFRE (in AP-O). Generally,
the sliding distance has close relation with the
interface temperature, and friction coefficient of the
entire composite are increased. Therefore, we can
record that the temperature starts in increase after 10
km. Finally, thermo-image camera has been applied
for every test and provided more results.
a) GFRE
b) GFRP
Fig. 8 Interface temperature vs. sliding distance the
selected materials under 30 N applied load
0
0.1
0.2
0.3
0.4
0.5
0.6
0
0.1
0.2
0.3
0.4
0.5
0.6
NEAT N-O P-O AP-O
Fri
ctio
n C
oef
fici
ent,
µ
Materials's Orientations
GFRP GFRE
0
10
20
30
40
50
60
0 2 4 6 8 10 12 14 16
Tem
per
atu
re C
Sliding distance,km
GFRE,N 30N
GFRE,APO 30N
GFRE, PO 30N
NE,30N
0
10
20
30
40
50
60
0 2 4 6 8 10 12 14 16
Tem
per
atu
re
Sliding distance,km
GFRP,N-OGFRP,AP-OGFRP,P-ONP
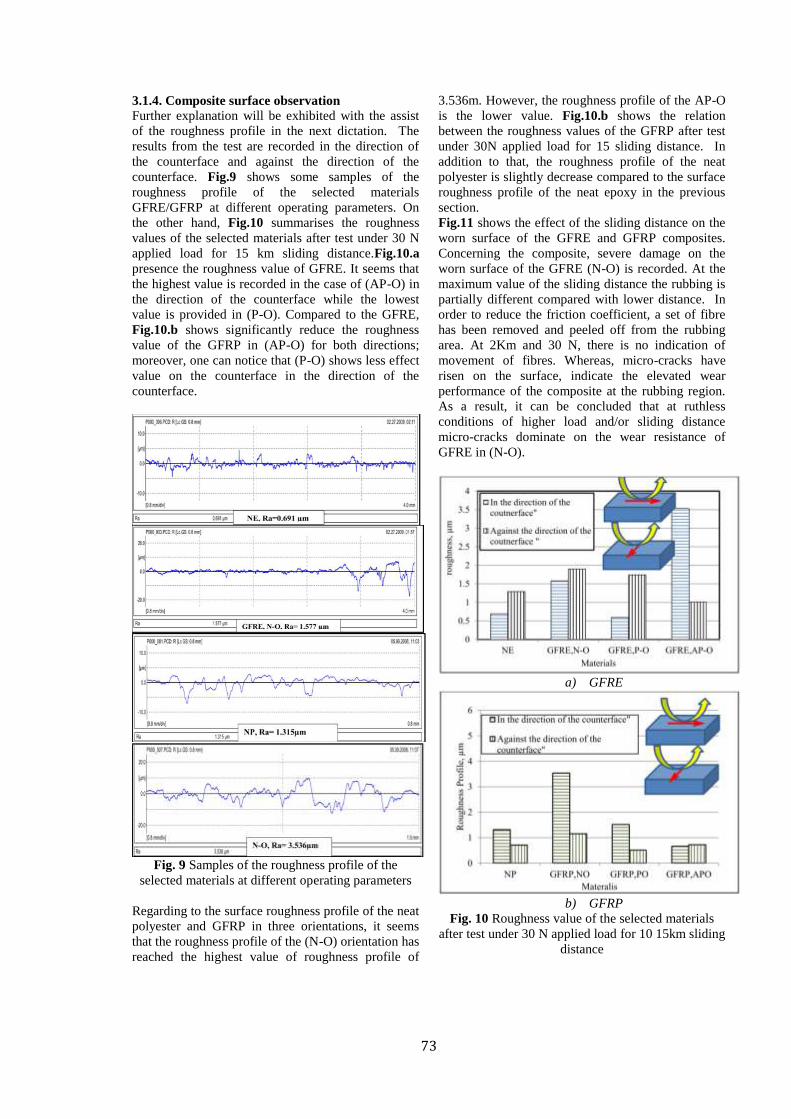
73
3.1.4. Composite surface observation
Further explanation will be exhibited with the assist
of the roughness profile in the next dictation. The
results from the test are recorded in the direction of
the counterface and against the direction of the
counterface. Fig.9 shows some samples of the
roughness profile of the selected materials
GFRE/GFRP at different operating parameters. On
the other hand, Fig.10 summarises the roughness
values of the selected materials after test under 30 N
applied load for 15 km sliding distance.Fig.10.a
presence the roughness value of GFRE. It seems that
the highest value is recorded in the case of (AP-O) in
the direction of the counterface while the lowest
value is provided in (P-O). Compared to the GFRE,
Fig.10.b shows significantly reduce the roughness
value of the GFRP in (AP-O) for both directions;
moreover, one can notice that (P-O) shows less effect
value on the counterface in the direction of the
counterface.
Fig. 9 Samples of the roughness profile of the
selected materials at different operating parameters
Regarding to the surface roughness profile of the neat
polyester and GFRP in three orientations, it seems
that the roughness profile of the (N-O) orientation has
reached the highest value of roughness profile of
3.536m. However, the roughness profile of the AP-O
is the lower value. Fig.10.b shows the relation
between the roughness values of the GFRP after test
under 30N applied load for 15 sliding distance. In
addition to that, the roughness profile of the neat
polyester is slightly decrease compared to the surface
roughness profile of the neat epoxy in the previous
section.
Fig.11 shows the effect of the sliding distance on the
worn surface of the GFRE and GFRP composites.
Concerning the composite, severe damage on the
worn surface of the GFRE (N-O) is recorded. At the
maximum value of the sliding distance the rubbing is
partially different compared with lower distance. In
order to reduce the friction coefficient, a set of fibre
has been removed and peeled off from the rubbing
area. At 2Km and 30 N, there is no indication of
movement of fibres. Whereas, micro-cracks have
risen on the surface, indicate the elevated wear
performance of the composite at the rubbing region.
As a result, it can be concluded that at ruthless
conditions of higher load and/or sliding distance
micro-cracks dominate on the wear resistance of
GFRE in (N-O).
a) GFRE
b) GFRP
Fig. 10 Roughness value of the selected materials
after test under 30 N applied load for 10 15km sliding
distance

74
Fig. 11 Micrographs of GFRE worn surface after the
test under 30 N applied load in N-Orientation
Fig.12 represented that micrograph of GFRP worn
surface after the test under 30 N applied load in AP-
Orientation..
Fig. 12 Micrographs of GFRP worn surface after the
test under 30 N applied load in AP-Orientation
The weakened interfacial adhesion in the fibre end is
between the fibre and the resin zone. This concludes
that (at sliding distance) the wear mechanism of
GFRP in N-O is dominated which related with the
same orientation and its wear mechanism
4. Discussion And Comparison With Previous
Published Works
In this chapter, the experimental results on neat
epoxy, glass fibre reinforced epoxy/polyester
composite in three orientations as (N-O, P-O, and
AP-O) are compared with some of the studies in
terms of weight loss and frictional behaviour at
various operating parameters. Fig 13 presents several
researches and studies that have determined the
values of specific wear rate and frictional behaviour
of several composites, and current outputs are painted
of different colour. Shi et al., (2003) have
investigated the highest value of specific wear rate of
neat epoxy composite compared to the specific wear
rate of this work (Shi et al., 2003). Furthermore, neat
polyester has marked the lower friction coefficient
and weight loss, specific wear rate and friction
coefficient were measured about (0.03234), and
(0.23) respectively, (El-Tayeb, 2008). Moreover, the
present specific wear rate of glass fibre/epoxy shows
the lowest value and the highest friction coefficient is
recorded than the other one which was studied by
Pihtili (2009)(Pihtili, 2009). The friction coefficient
and wear rate of glass fibre/polyester composite are
shown in figure below. The same friction coefficient
is produced compared to the value was defined by
Shalwan and Yousif (2012) (Yousif, 2012).
However, glass fibre/polyester exhibits low specific
wear rate (0.02).
Fig. 13 Specific wear rate and frictional behaviour of
several composites, (El-Tayeb et al., 2008)*,(Shi et
al., 2003)**,(Pihtili, 2009)x,(Suresha and Kumar,
2009)xx
Fibre
Debondi
Micro-crack
Debris
Fibre end
Plastic

75
5. Conclusions
Few points are concluded as follows:
1. Presence of fibres and oriented have a
significant influence on the wear and frictional
behaviour of polymeric composites. In the case of
glass fibre reinforced epoxy composite, the better
wear and frictional behaviour were performed when
the composite was tested in N-O.
2. The fibre orientations has highly influence
and similar in controlling the friction and wear
performance. However, the specific wear rate of the
composite is consistently and essentially high in AP-
O compared to N-O of the composites. Moreover,
the sliding distance and applied load have a little
influence on the tribological properties.
3. The detachment and breakage of fibres were
the most effect on the wear mechanism. Meanwhile,
micro-cracks at the end of the fibres is the declare
wear technique in (N-O).
4. The worn surface of the composite showed
different wear mechanisms. For the GFRP, plastic
deformation was clear and softening process occurred
during the sliding which deteriorates the composite
surface. For the GFRE, this less damage on the
surface with the presence of the micro-cracks which
indicate the high wear resistance in the interface.
5. Even though, the increasing temperature and
frictional force have a substantial and consequently
effect on the tribological properties of both polymeric
composite. However, the interface temperature has a
pronounce influence on the frictional force on the
material removal from the composite surface.
Moreover, there are different appearances of wear
mechanism depending on the temperature can be
resulted by the heat generated by the frictional force.
REFERENCES
1.Pihtili, H., An experimental investigation of wear of glass fibre–epoxy resin and glass fibre–polyester resin composite materials. European Polymer Journal, 2009. 45(1): p. 149-154.
2. Yousif, B.F., Editorial for SI: Materials, design and tribology. Materials and Design, 2013.
3. Bajpai, P.K., I. Singh, and J. Madaan, Tribological behavior of natural fiber reinforced PLA composites. Wear, 2013. 297(1–2): p. 829-840.
4. Shalwan, A. and B.F. Yousif, In State of Art: Mechanical and tribological behaviour of polymeric composites based on natural fibres. Materials & Design, 2013. 48(0): p. 14-24.
5. Holmberg, K., P. Andersson, and A. Erdemir, Global energy consumption due to friction in passenger cars. Tribology International, 2012. 47(0): p. 221-234.
6. Unal, H., et al., Sliding friction and wear behaviour of polytetrafluoroethylene and its composites under dry conditions. Materials & Design, 2004. 25(3): p. 239-245.
7. Brostow, W., et al., Tribology of polymers and polymer-based composites. Journal of Materials Education, 2010. 32(5): p. 273.
8. Bhushan, B., J.N. Israelachvili, and U. Landman, Nanotribology: friction, wear and lubrication at the atomic scale. Nature, 1995. 374(6523): p. 607-616.
9. Myshkin, N.K., M.I. Petrokovets, and A.V. Kovalev, Tribology of polymers: Adhesion, friction, wear, and mass-transfer. Tribology International, 2005. 38(11–12): p. 910-921.
10. Suresha, B. and K.N.S. Kumar, Investigations on mechanical and two-body abrasive wear behaviour of glass/carbon fabric reinforced vinyl ester composites. Materials & Design, 2009. 30(6): p. 2056-2060.
11. Yousif, B.F., Design of newly fabricated tribological machine for wear and frictional experiments under dry/wet condition. Materials & Design, 2013. 48(0): p. 2-13.
12. Shi, G., et al., Friction and wear of low nanometer Si3N4 filled epoxy composites. Wear, 2003. 254(7–8): p. 784-796.
13. El-Tayeb, N.S.M., A study on the potential of sugarcane fibers/polyester composite for tribological applications. Wear, 2008. 265(1-2): p. 223-235.
14. Yousif, B., Design of newly fabricated tribological machine for wear and frictional experiments under dry/wet condition. Materials & Design, 2012.
15. El-Tayeb, N.S.M., B.F. Yousif, and T.C. Yap, An investigation on worn surfaces of chopped glass fibre reinforced polyester through SEM observations. Tribology International, 2008. 41(5): p. 331-340.

76
APPENDIX C: FURTHER RESULTS
1) Scanning electron microscopy observation
For GFRE
a) Micrographs of GFRE worn surface at normal orientation for 10 min
b) GFRE vergine surface
Glass Fibre
Epoxy

77
For GFRP
Micrographs of GFRP worn surface at 2.8 m/s
Plastic Deformation
Fibre End