GrocerSmart™ 4.0 RTF Subcommittee Approval of Adherence to Guidelines March 10, 2011.
Seediscussions,stats,andauthorprofilesforthispublicationat:https://www.researchgate.net/publication/301539749
Adherencetoguidelinesforhospitalizedcommunity-acquiredpneumoniaovertimeanditsimpactonhealthoutcomesand...
ArticleinInternalandEmergencyMedicine·April2016
DOI:10.1007/s11739-016-1445-3
CITATION
1
READS
51
6authors,including:
Someoftheauthorsofthispublicationarealsoworkingontheserelatedprojects:
SmokinginmoviesViewproject
MADESStudyViewproject
EliasAllara
UniversityofCambridge
37PUBLICATIONS116CITATIONS
SEEPROFILE
FilippoPatrucco
AziendaOspedalieroUniversitariaMaggiore…
16PUBLICATIONS7CITATIONS
SEEPROFILE
FabrizioFaggiano
AmedeoAvogadroUniversityofEasternPied…
188PUBLICATIONS4,351CITATIONS
SEEPROFILE
PieroEmilioBalbo
24PUBLICATIONS822CITATIONS
SEEPROFILE
AllcontentfollowingthispagewasuploadedbyEliasAllaraon21April2016.
Theuserhasrequestedenhancementofthedownloadedfile.Allin-textreferencesunderlinedinblueareaddedtotheoriginaldocumentandarelinkedtopublicationsonResearchGate,lettingyouaccessandreadthemimmediately.
IM - ORIGINAL
Adherence to guidelines for hospitalized community-acquiredpneumonia over time and its impact on health outcomesand mortality
Elisa Costantini1,2 • Elias Allara2,3 • Filippo Patrucco4,1,6 • Fabrizio Faggiano2 •
Fozia Hamid5 • Piero Emilio Balbo1
Received: 15 November 2015 / Accepted: 21 March 2016
� SIMI 2016
Abstract Compliance with validated guidelines is crucial
to guide management of patients hospitalized with com-
munity-acquired pneumonia (CAP). Data describing real-
life management and treatment of CAP are limited. We
aimed to evaluate the compliance with guidelines over
time, and to assess its impact on all-cause mortality and
clinical outcomes. We retrospectively compared two
cohorts of patients admitted to the hospital, throughout
2005, just after the implementation of a local clinical
pathway based on CAP international guidelines, and
7 years later over 2012. We included all patients with a
diagnosis of pneumonia and/or related complications. 564
patients were included. The Pneumonia Severity Index
calculation was better documented in 2012 (25.23 %)
compared to 2005 (17.70 %; p = 0.032), but compliance
with guideline empirical antibiotic therapy was lower in
2012 (56.70 %) than in 2005 (68.75 %; p = 0.004). Per-
formance of guideline recommended urinary antigen tests
was higher in 2012, and associated with 57.3 % lower odds
of in-hospital mortality (95 % CI 15.0–78.5 %) and with
65.9 % lower odds of 30-day mortality (95 % CI
31.5–83.0 %). Compliance with empirical antibiotic ther-
apy was associated with 2.9 days lower mean length of
hospital stay (95 % CI -4.2 to -1.6 days) and with
2.0 days lower mean duration of antibiotic therapy (95 %
CI -3.3 to -0.7 days). Compliance with guidelines
changed over time, with some effects on mortality and with
an apparent reduction in the length of hospital stay and the
duration of antibiotic therapy. Specific clinical training and
hospital control policies could achieve greater compliance
with guidelines, and thus reduce a burden on hospital
services.
Keywords Community-acquired pneumonia �Guidelines � Adherence compliance
Introduction
Community-acquired pneumonia (CAP) is the leading
cause of death for infectious disease worldwide, repre-
senting a considerable cause of morbidity and mortality,
especially among hospitalized patients [1, 2]. Both preva-
lence and hospitalization rates are particularly high in
elderly and comorbid patients; [3, 4] for people over
65 years early readmission to hospital has also been
increasing. [5] Today, if recurrences are excluded, the
mean European length of hospital stay is 9.0 days and in-
hospital mortality rates vary from 0 to 17.5 % across
countries [6].
Given, the high burden of disease and the wide spectrum
of clinical severity, use of validated guidelines are crucial
in guiding diagnostic and therapeutic approaches. Com-
pliance with guidelines has been found to improve clinical
outcomes, independently of contextual and patient-specific
& Filippo Patrucco
1 Medical Department, Division of Respiratory Medicine,
Ospedale ‘‘Maggiore della Carita’’, Novara, Italy
2 Department of Translational Medicine, Universita del
Piemonte Orientale, Novara, Italy
3 School of Public Health, University of Torino, Turin, Italy
4 Cardiothoracic Department, Division of Respiratory
Medicine, ‘‘Citta della Salute e della Scienza’’ Hospital and
University of Torino, Turin, Italy
5 Department of Primary Care and Public Health,
Imperial College London, London, UK
6 Corso Bramante 88/90, 10126 Turin, Italy
123
Intern Emerg Med
DOI 10.1007/s11739-016-1445-3
variables (such as the decision to hospitalize and the
rapidity of administration of the first antibiotic dose), [6]
and to reduce unnecessary hospitalizations and readmis-
sions, length of hospital stay, costs, and mortality [7–19].
Although compliance with guidelines varies among
clinicians, and is conditioned by various factors, [20] site
of care, i.e. management outside or inside hospital, and
correct timing of antibiotic therapy are vital factors in
reducing risk of complications and mortality from CAP
[21]. These aspects, as well as choice of empirical antibi-
otic therapy, are most critical when applying guideline
indications [6].
To comply with international guidelines, in 2005 we
implemented a CAP clinical pathway (CP) based on
American Thoracic Society and British Thoracic Society
guidelines, which is still largely compatible with the most
updated guidelines available in 2015 [22, 23].
Objectives
We aimed to evaluate to what extent compliance with the
local CAP CP in our hospital changed over time from 2005
to 2012. We also aimed to evaluate the impact of hospital-
wide compliance with the local CAP CP over time on (1)
in-hospital all-cause mortality, (2) 30-day all-cause mor-
tality, (3) length of hospital stay, and (4) length of antibi-
otic therapy.
Materials and methods
This report was written in compliance with the STROBE
Statement for observational studies. [24]
Clinical pathway elaboration
In 2004 we outlined, and in 2005 implemented, a CAP CP
based on then current American Thoracic Society and
British Thoracic Society guidelines [22, 23]. Our intent
was to provide hospital clinicians with a concise and useful
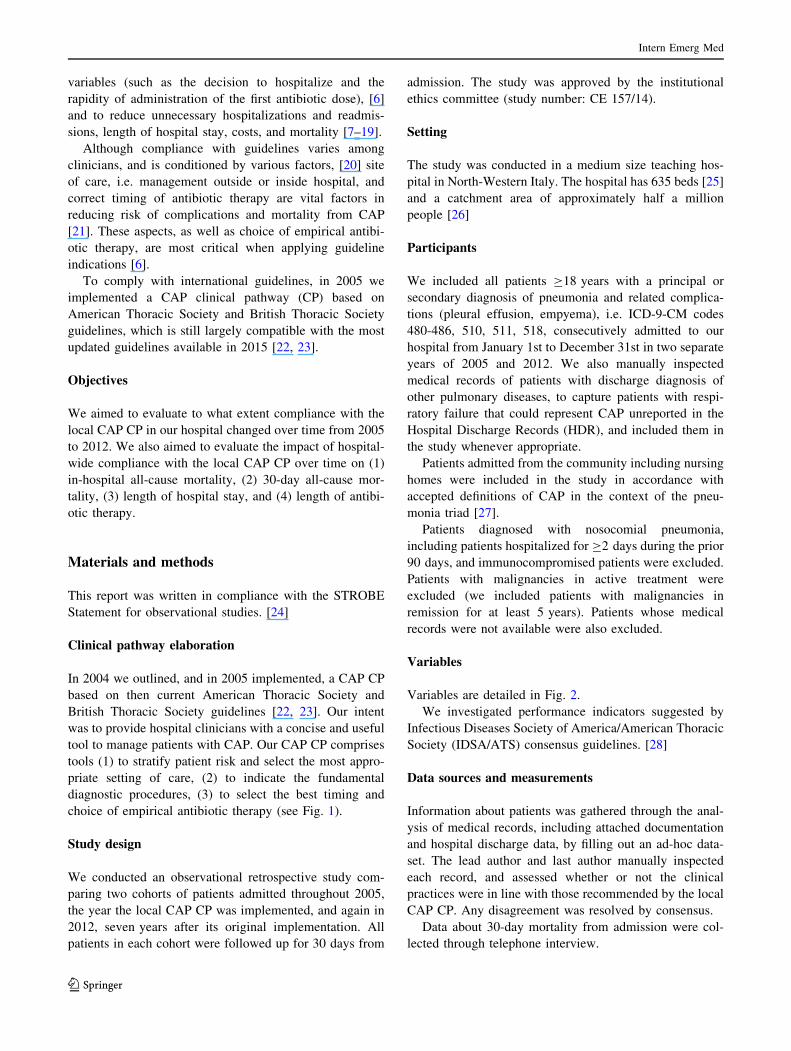
tool to manage patients with CAP. Our CAP CP comprises
tools (1) to stratify patient risk and select the most appro-
priate setting of care, (2) to indicate the fundamental
diagnostic procedures, (3) to select the best timing and
choice of empirical antibiotic therapy (see Fig. 1).
Study design
We conducted an observational retrospective study com-
paring two cohorts of patients admitted throughout 2005,
the year the local CAP CP was implemented, and again in
2012, seven years after its original implementation. All
patients in each cohort were followed up for 30 days from
admission. The study was approved by the institutional
ethics committee (study number: CE 157/14).
Setting
The study was conducted in a medium size teaching hos-
pital in North-Western Italy. The hospital has 635 beds [25]
and a catchment area of approximately half a million
people [26]
Participants
We included all patients C18 years with a principal or
secondary diagnosis of pneumonia and related complica-
tions (pleural effusion, empyema), i.e. ICD-9-CM codes
480-486, 510, 511, 518, consecutively admitted to our
hospital from January 1st to December 31st in two separate
years of 2005 and 2012. We also manually inspected
medical records of patients with discharge diagnosis of
other pulmonary diseases, to capture patients with respi-
ratory failure that could represent CAP unreported in the
Hospital Discharge Records (HDR), and included them in
the study whenever appropriate.
Patients admitted from the community including nursing
homes were included in the study in accordance with
accepted definitions of CAP in the context of the pneu-
monia triad [27].
Patients diagnosed with nosocomial pneumonia,
including patients hospitalized for C2 days during the prior
90 days, and immunocompromised patients were excluded.
Patients with malignancies in active treatment were
excluded (we included patients with malignancies in
remission for at least 5 years). Patients whose medical
records were not available were also excluded.
Variables
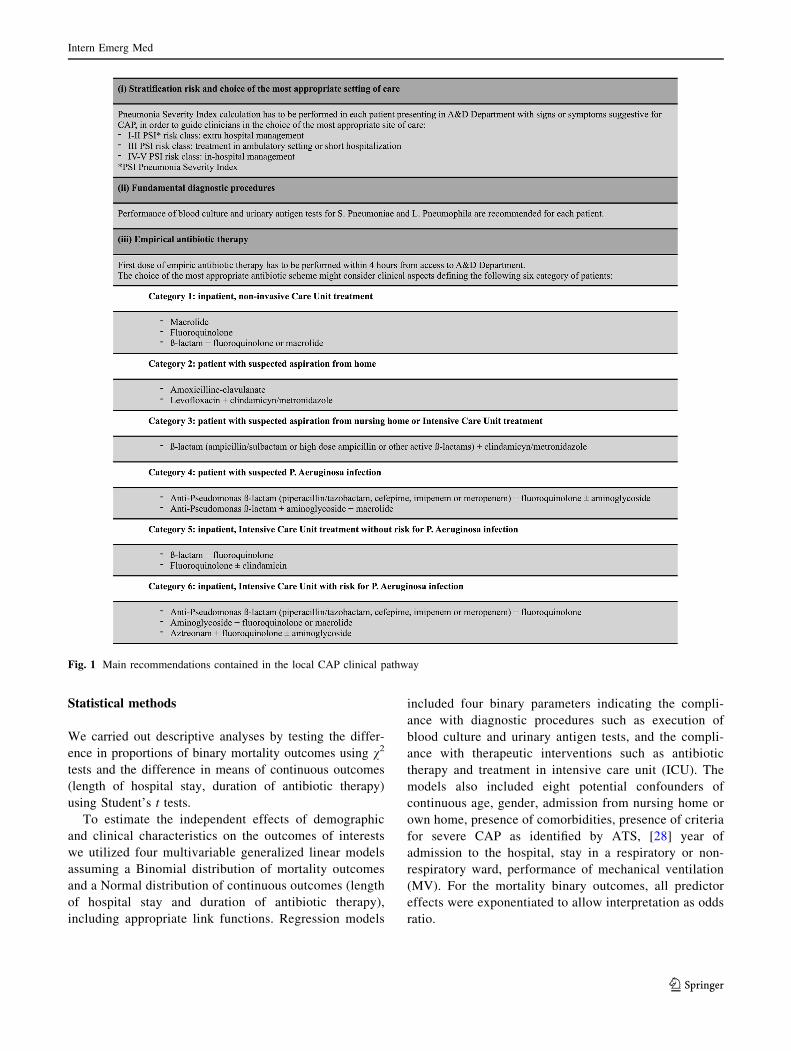
Variables are detailed in Fig. 2.
We investigated performance indicators suggested by
Infectious Diseases Society of America/American Thoracic
Society (IDSA/ATS) consensus guidelines. [28]
Data sources and measurements
Information about patients was gathered through the anal-
ysis of medical records, including attached documentation
and hospital discharge data, by filling out an ad-hoc data-
set. The lead author and last author manually inspected
each record, and assessed whether or not the clinical
practices were in line with those recommended by the local
CAP CP. Any disagreement was resolved by consensus.
Data about 30-day mortality from admission were col-
lected through telephone interview.
Intern Emerg Med
123
Statistical methods
We carried out descriptive analyses by testing the differ-
ence in proportions of binary mortality outcomes using v2
tests and the difference in means of continuous outcomes
(length of hospital stay, duration of antibiotic therapy)
using Student’s t tests.
To estimate the independent effects of demographic
and clinical characteristics on the outcomes of interests
we utilized four multivariable generalized linear models
assuming a Binomial distribution of mortality outcomes
and a Normal distribution of continuous outcomes (length
of hospital stay and duration of antibiotic therapy),
including appropriate link functions. Regression models
included four binary parameters indicating the compli-
ance with diagnostic procedures such as execution of
blood culture and urinary antigen tests, and the compli-
ance with therapeutic interventions such as antibiotic
therapy and treatment in intensive care unit (ICU). The
models also included eight potential confounders of
continuous age, gender, admission from nursing home or
own home, presence of comorbidities, presence of criteria
for severe CAP as identified by ATS, [28] year of
admission to the hospital, stay in a respiratory or non-
respiratory ward, performance of mechanical ventilation
(MV). For the mortality binary outcomes, all predictor
effects were exponentiated to allow interpretation as odds
ratio.
Fig. 1 Main recommendations contained in the local CAP clinical pathway
Intern Emerg Med
123
Results
Participants
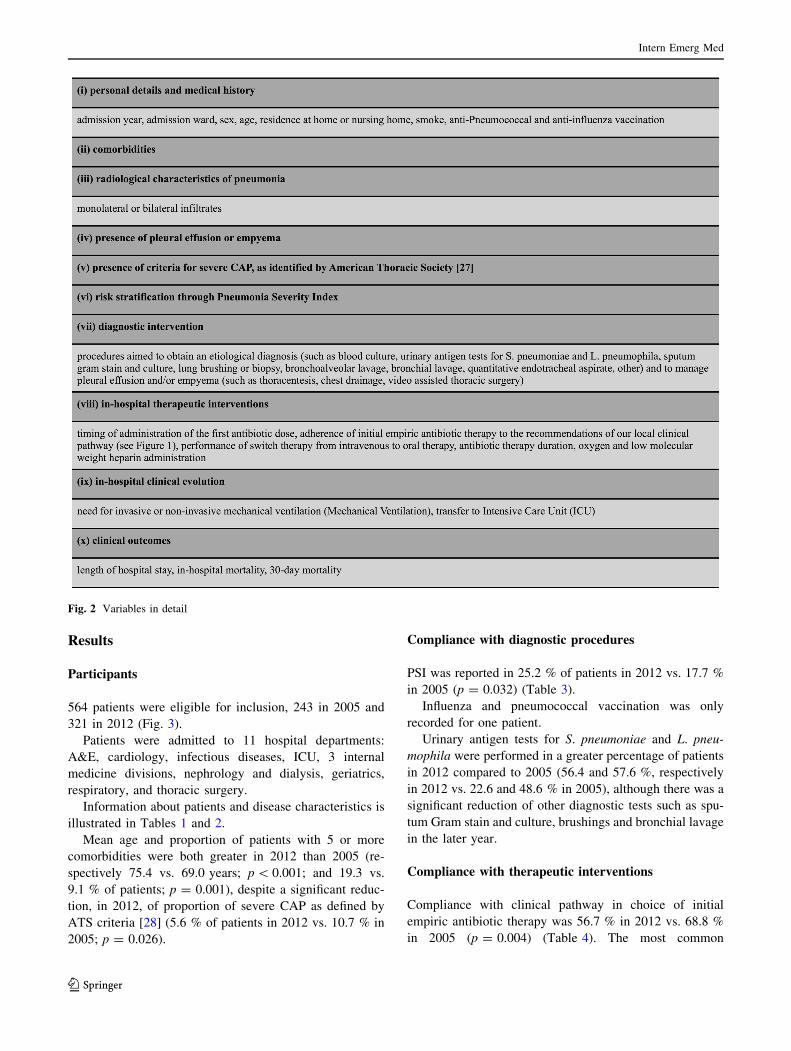
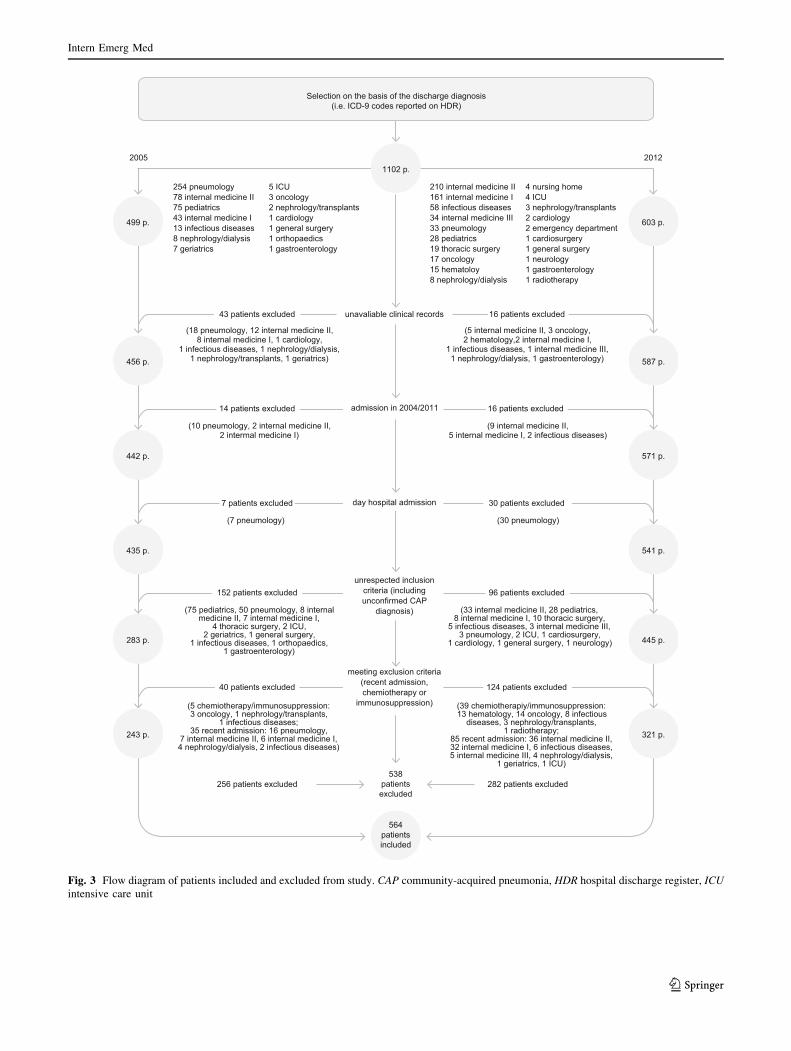
564 patients were eligible for inclusion, 243 in 2005 and
321 in 2012 (Fig. 3).
Patients were admitted to 11 hospital departments:
A&E, cardiology, infectious diseases, ICU, 3 internal
medicine divisions, nephrology and dialysis, geriatrics,
respiratory, and thoracic surgery.
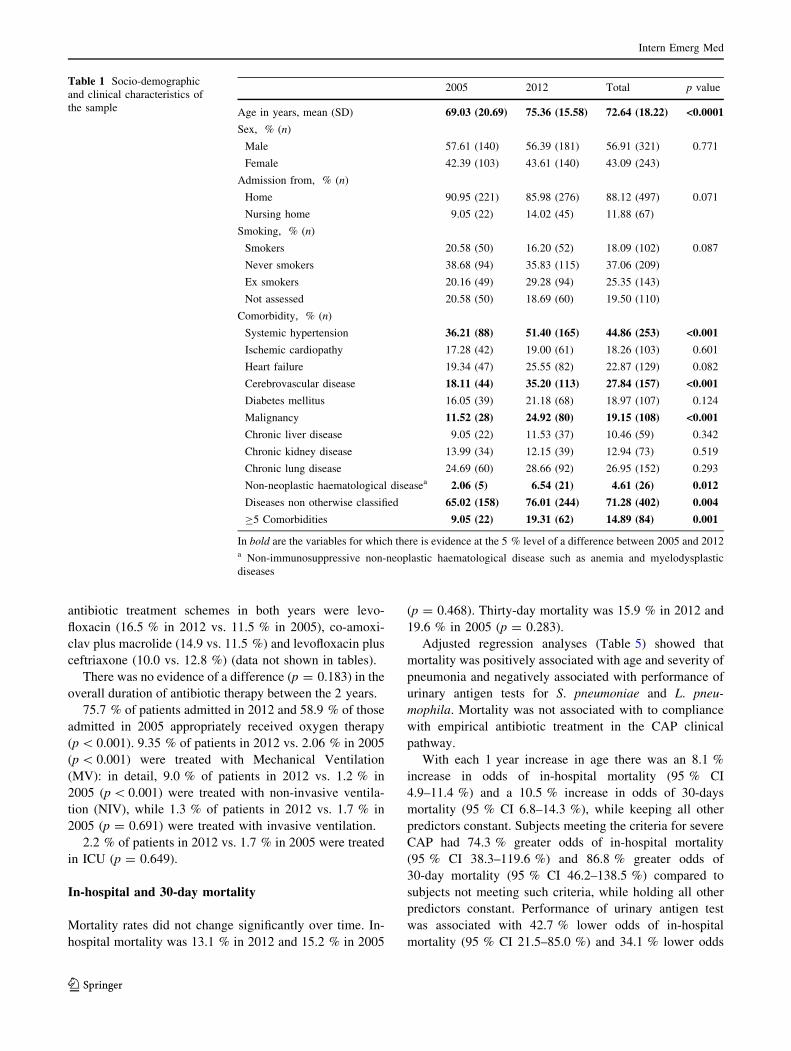
Information about patients and disease characteristics is
illustrated in Tables 1 and 2.
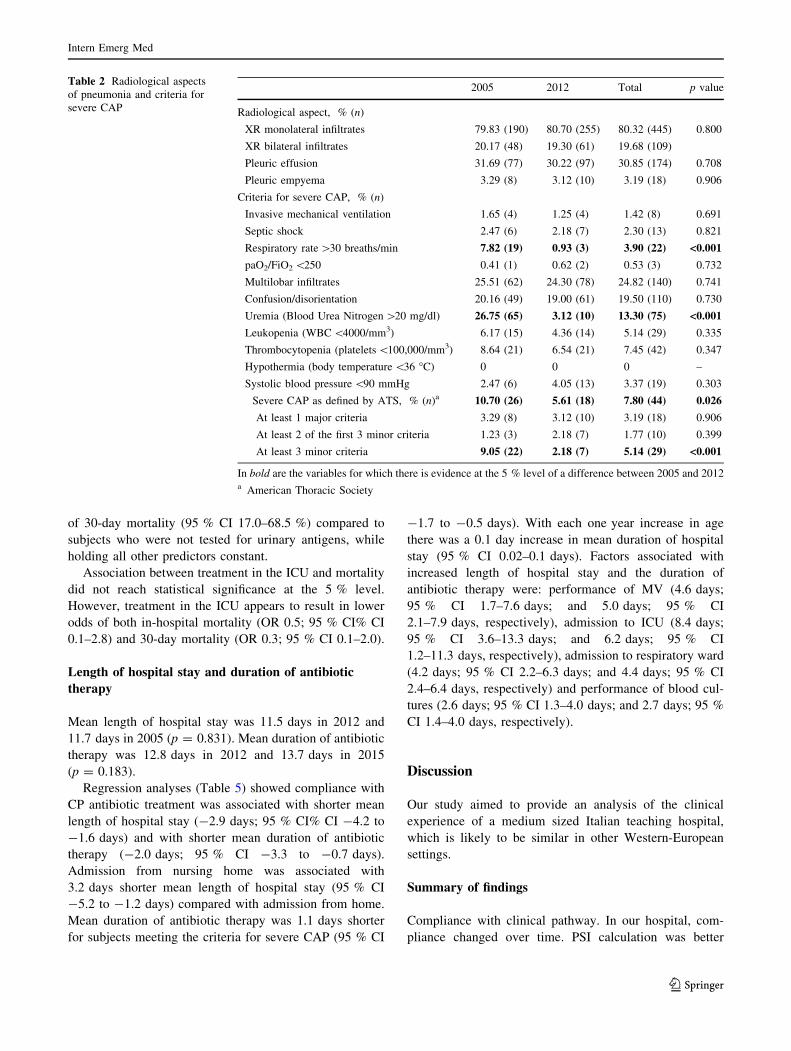
Mean age and proportion of patients with 5 or more
comorbidities were both greater in 2012 than 2005 (re-
spectively 75.4 vs. 69.0 years; p\ 0.001; and 19.3 vs.
9.1 % of patients; p = 0.001), despite a significant reduc-
tion, in 2012, of proportion of severe CAP as defined by
ATS criteria [28] (5.6 % of patients in 2012 vs. 10.7 % in
2005; p = 0.026).
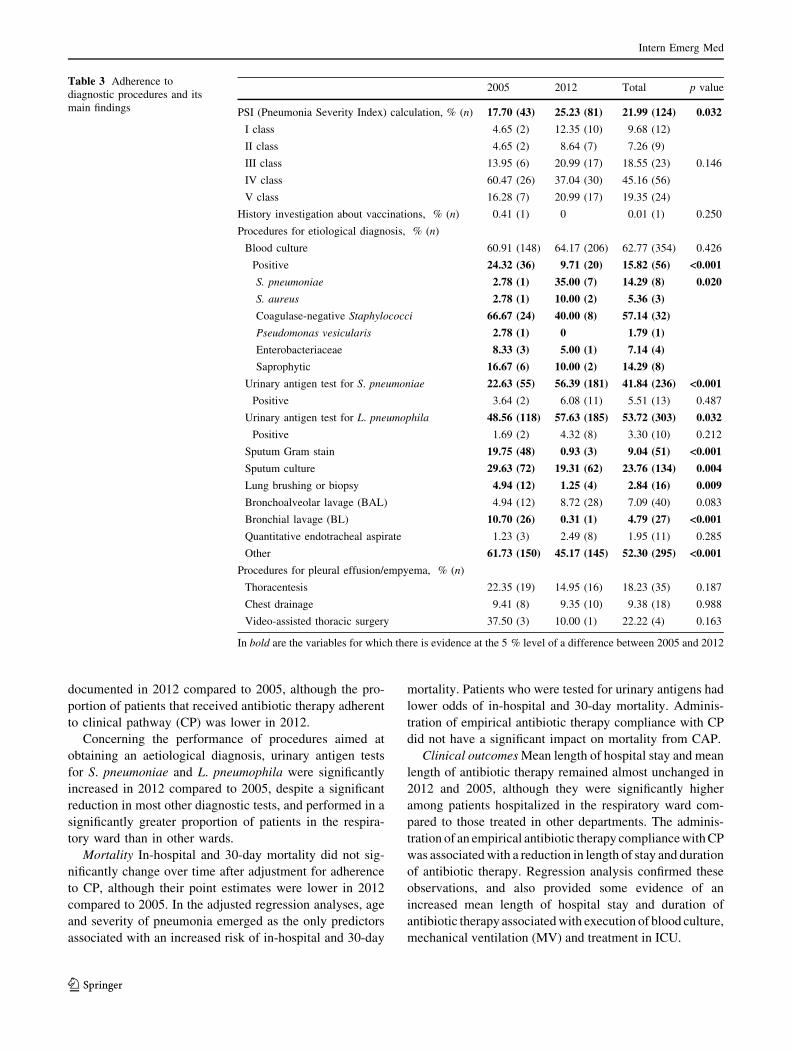
Compliance with diagnostic procedures
PSI was reported in 25.2 % of patients in 2012 vs. 17.7 %
in 2005 (p = 0.032) (Table 3).
Influenza and pneumococcal vaccination was only
recorded for one patient.
Urinary antigen tests for S. pneumoniae and L. pneu-
mophila were performed in a greater percentage of patients
in 2012 compared to 2005 (56.4 and 57.6 %, respectively
in 2012 vs. 22.6 and 48.6 % in 2005), although there was a
significant reduction of other diagnostic tests such as spu-
tum Gram stain and culture, brushings and bronchial lavage
in the later year.
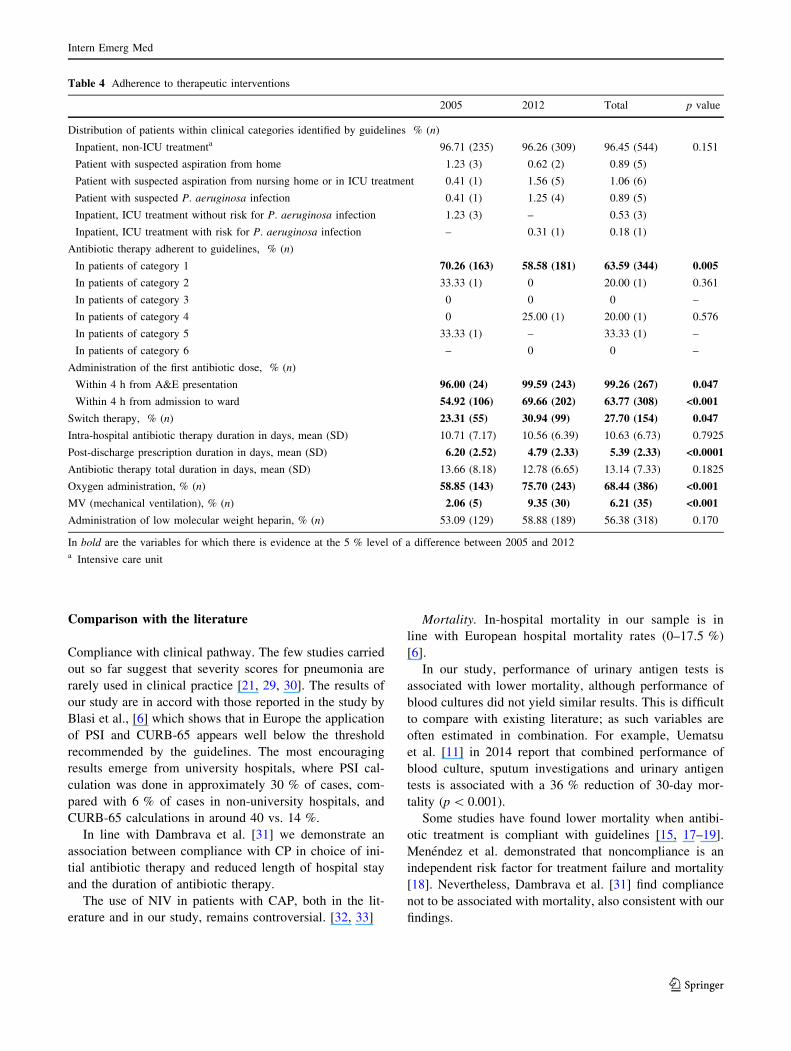
Compliance with therapeutic interventions
Compliance with clinical pathway in choice of initial
empiric antibiotic therapy was 56.7 % in 2012 vs. 68.8 %
in 2005 (p = 0.004) (Table 4). The most common
Fig. 2 Variables in detail
Intern Emerg Med
123
Selection on the basis of the discharge diagnosis(i.e. ICD-9 codes reported on HDR)
1102 p.
unavaliable clinical records
admission in 2004/2011
43 patients excluded
499 p.
456 p.
2005 2012
603 p.
587 p.
254 pneumology78 internal medicine II75 pediatrics43 internal medicine I13 infectious diseases8 nephrology/dialysis7 geriatrics
5 ICU3 oncology2 nephrology/transplants1 cardiology1 general surgery1 orthopaedics1 gastroenterology
(18 pneumology, 12 internal medicine II,8 internal medicine I, 1 cardiology,
1 infectious diseases, 1 nephrology/dialysis,1 nephrology/transplants, 1 geriatrics)
16 patients excluded
(5 internal medicine II, 3 oncology,2 hematology,2 internal medicine I,
1 infectious diseases, 1 internal medicine III,1 nephrology/dialysis, 1 gastroenterology)
14 patients excluded
442 p. 571 p.
(10 pneumology, 2 internal medicine II,2 intermal medicine I)
16 patients excluded
(9 internal medicine II,5 internal medicine I, 2 infectious diseases)
day hospital admission7 patients excluded
435 p. 541 p.
(7 pneumology)
30 patients excluded
(30 pneumology)
unrespected inclusion criteria (including unconfirmed CAP
diagnosis)
meeting exclusion criteria (recent admission, chemiotherapy or
immunosuppression)
152 patients excluded
283 p. 445 p.
(75 pediatrics, 50 pneumology, 8 internal medicine II, 7 internal medicine I,
4 thoracic surgery, 2 ICU,2 geriatrics, 1 general surgery,
1 infectious diseases, 1 orthopaedics,1 gastroenterology)
(5 chemiotherapy/immunosuppression:3 oncology, 1 nephrology/transplants,
1 infectious diseases;35 recent admission: 16 pneumology,
7 internal medicine II, 6 internal medicine I,4 nephrology/dialysis, 2 infectious diseases)
dedulcxe stneitap 282dedulcxe stneitap 652
(39 chemiotherapiy/immunosuppression:13 hematology, 14 oncology, 8 infectious
diseases, 3 nephrology/transplants,1 radiotherapy;
85 recent admission: 36 internal medicine II,32 internal medicine I, 6 infectious diseases,5 internal medicine III, 4 nephrology/dialysis,
1 geriatrics, 1 ICU)
(33 internal medicine II, 28 pediatrics,8 internal medicine I, 10 thoracic surgery,
5 infectious diseases, 3 internal medicine III,3 pneumology, 2 ICU, 1 cardiosurgery,
1 cardiology, 1 general surgery, 1 neurology)
96 patients excluded
40 patients excluded
243 p. 321 p.
124 patients excluded
210 internal medicine II161 internal medicine I58 infectious diseases34 internal medicine III33 pneumology28 pediatrics19 thoracic surgery17 oncology15 hematoloy8 nephrology/dialysis
4 nursing home4 ICU3 nephrology/transplants2 cardiology2 emergency department1 cardiosurgery1 general surgery1 neurology1 gastroenterology1 radiotherapy
538 patients excluded
564 patients included
Fig. 3 Flow diagram of patients included and excluded from study. CAP community-acquired pneumonia, HDR hospital discharge register, ICU
intensive care unit
Intern Emerg Med
123
antibiotic treatment schemes in both years were levo-
floxacin (16.5 % in 2012 vs. 11.5 % in 2005), co-amoxi-
clav plus macrolide (14.9 vs. 11.5 %) and levofloxacin plus
ceftriaxone (10.0 vs. 12.8 %) (data not shown in tables).
There was no evidence of a difference (p = 0.183) in the
overall duration of antibiotic therapy between the 2 years.
75.7 % of patients admitted in 2012 and 58.9 % of those
admitted in 2005 appropriately received oxygen therapy
(p\ 0.001). 9.35 % of patients in 2012 vs. 2.06 % in 2005
(p\ 0.001) were treated with Mechanical Ventilation
(MV): in detail, 9.0 % of patients in 2012 vs. 1.2 % in
2005 (p\ 0.001) were treated with non-invasive ventila-
tion (NIV), while 1.3 % of patients in 2012 vs. 1.7 % in
2005 (p = 0.691) were treated with invasive ventilation.
2.2 % of patients in 2012 vs. 1.7 % in 2005 were treated
in ICU (p = 0.649).
In-hospital and 30-day mortality
Mortality rates did not change significantly over time. In-
hospital mortality was 13.1 % in 2012 and 15.2 % in 2005
(p = 0.468). Thirty-day mortality was 15.9 % in 2012 and
19.6 % in 2005 (p = 0.283).
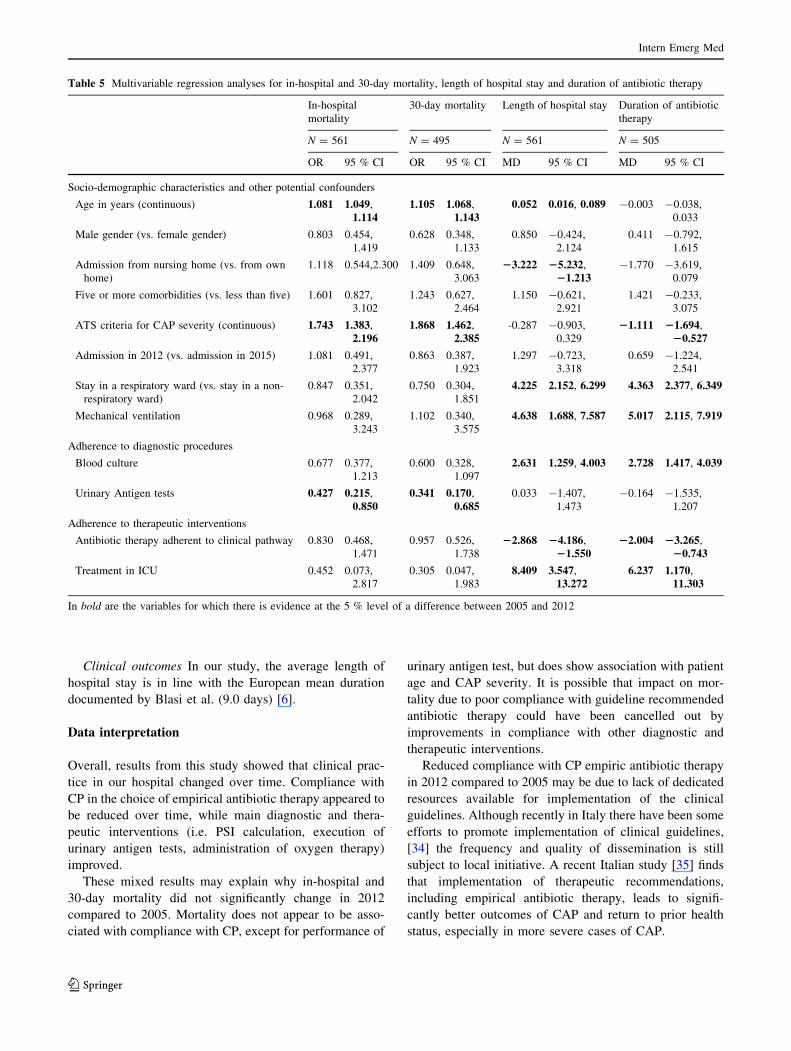
Adjusted regression analyses (Table 5) showed that
mortality was positively associated with age and severity of
pneumonia and negatively associated with performance of
urinary antigen tests for S. pneumoniae and L. pneu-
mophila. Mortality was not associated with to compliance
with empirical antibiotic treatment in the CAP clinical
pathway.
With each 1 year increase in age there was an 8.1 %
increase in odds of in-hospital mortality (95 % CI
4.9–11.4 %) and a 10.5 % increase in odds of 30-days
mortality (95 % CI 6.8–14.3 %), while keeping all other
predictors constant. Subjects meeting the criteria for severe
CAP had 74.3 % greater odds of in-hospital mortality
(95 % CI 38.3–119.6 %) and 86.8 % greater odds of
30-day mortality (95 % CI 46.2–138.5 %) compared to
subjects not meeting such criteria, while holding all other
predictors constant. Performance of urinary antigen test
was associated with 42.7 % lower odds of in-hospital
mortality (95 % CI 21.5–85.0 %) and 34.1 % lower odds
Table 1 Socio-demographic
and clinical characteristics of
the sample
2005 2012 Total p value
Age in years, mean (SD) 69.03 (20.69) 75.36 (15.58) 72.64 (18.22) <0.0001
Sex, % (n)
Male 57.61 (140) 56.39 (181) 56.91 (321) 0.771
Female 42.39 (103) 43.61 (140) 43.09 (243)
Admission from, % (n)
Home 90.95 (221) 85.98 (276) 88.12 (497) 0.071
Nursing home 9.05 (22) 14.02 (45) 11.88 (67)
Smoking, % (n)
Smokers 20.58 (50) 16.20 (52) 18.09 (102) 0.087
Never smokers 38.68 (94) 35.83 (115) 37.06 (209)
Ex smokers 20.16 (49) 29.28 (94) 25.35 (143)
Not assessed 20.58 (50) 18.69 (60) 19.50 (110)
Comorbidity, % (n)
Systemic hypertension 36.21 (88) 51.40 (165) 44.86 (253) <0.001
Ischemic cardiopathy 17.28 (42) 19.00 (61) 18.26 (103) 0.601
Heart failure 19.34 (47) 25.55 (82) 22.87 (129) 0.082
Cerebrovascular disease 18.11 (44) 35.20 (113) 27.84 (157) <0.001
Diabetes mellitus 16.05 (39) 21.18 (68) 18.97 (107) 0.124
Malignancy 11.52 (28) 24.92 (80) 19.15 (108) <0.001
Chronic liver disease 9.05 (22) 11.53 (37) 10.46 (59) 0.342
Chronic kidney disease 13.99 (34) 12.15 (39) 12.94 (73) 0.519
Chronic lung disease 24.69 (60) 28.66 (92) 26.95 (152) 0.293
Non-neoplastic haematological diseasea 2.06 (5) 6.54 (21) 4.61 (26) 0.012
Diseases non otherwise classified 65.02 (158) 76.01 (244) 71.28 (402) 0.004
C5 Comorbidities 9.05 (22) 19.31 (62) 14.89 (84) 0.001
In bold are the variables for which there is evidence at the 5 % level of a difference between 2005 and 2012a Non-immunosuppressive non-neoplastic haematological disease such as anemia and myelodysplastic
diseases
Intern Emerg Med
123
of 30-day mortality (95 % CI 17.0–68.5 %) compared to
subjects who were not tested for urinary antigens, while
holding all other predictors constant.
Association between treatment in the ICU and mortality
did not reach statistical significance at the 5 % level.
However, treatment in the ICU appears to result in lower
odds of both in-hospital mortality (OR 0.5; 95 % CI% CI
0.1–2.8) and 30-day mortality (OR 0.3; 95 % CI 0.1–2.0).
Length of hospital stay and duration of antibiotic
therapy
Mean length of hospital stay was 11.5 days in 2012 and
11.7 days in 2005 (p = 0.831). Mean duration of antibiotic
therapy was 12.8 days in 2012 and 13.7 days in 2015
(p = 0.183).
Regression analyses (Table 5) showed compliance with
CP antibiotic treatment was associated with shorter mean
length of hospital stay (-2.9 days; 95 % CI% CI -4.2 to
-1.6 days) and with shorter mean duration of antibiotic
therapy (-2.0 days; 95 % CI -3.3 to -0.7 days).
Admission from nursing home was associated with
3.2 days shorter mean length of hospital stay (95 % CI
-5.2 to -1.2 days) compared with admission from home.
Mean duration of antibiotic therapy was 1.1 days shorter
for subjects meeting the criteria for severe CAP (95 % CI
-1.7 to -0.5 days). With each one year increase in age
there was a 0.1 day increase in mean duration of hospital
stay (95 % CI 0.02–0.1 days). Factors associated with
increased length of hospital stay and the duration of
antibiotic therapy were: performance of MV (4.6 days;
95 % CI 1.7–7.6 days; and 5.0 days; 95 % CI
2.1–7.9 days, respectively), admission to ICU (8.4 days;
95 % CI 3.6–13.3 days; and 6.2 days; 95 % CI
1.2–11.3 days, respectively), admission to respiratory ward
(4.2 days; 95 % CI 2.2–6.3 days; and 4.4 days; 95 % CI
2.4–6.4 days, respectively) and performance of blood cul-
tures (2.6 days; 95 % CI 1.3–4.0 days; and 2.7 days; 95 %
CI 1.4–4.0 days, respectively).
Discussion
Our study aimed to provide an analysis of the clinical
experience of a medium sized Italian teaching hospital,
which is likely to be similar in other Western-European
settings.
Summary of findings
Compliance with clinical pathway. In our hospital, com-
pliance changed over time. PSI calculation was better
Table 2 Radiological aspects
of pneumonia and criteria for
severe CAP
2005 2012 Total p value
Radiological aspect, % (n)
XR monolateral infiltrates 79.83 (190) 80.70 (255) 80.32 (445) 0.800
XR bilateral infiltrates 20.17 (48) 19.30 (61) 19.68 (109)
Pleuric effusion 31.69 (77) 30.22 (97) 30.85 (174) 0.708
Pleuric empyema 3.29 (8) 3.12 (10) 3.19 (18) 0.906
Criteria for severe CAP, % (n)
Invasive mechanical ventilation 1.65 (4) 1.25 (4) 1.42 (8) 0.691
Septic shock 2.47 (6) 2.18 (7) 2.30 (13) 0.821
Respiratory rate[30 breaths/min 7.82 (19) 0.93 (3) 3.90 (22) <0.001
paO2/FiO2\250 0.41 (1) 0.62 (2) 0.53 (3) 0.732
Multilobar infiltrates 25.51 (62) 24.30 (78) 24.82 (140) 0.741
Confusion/disorientation 20.16 (49) 19.00 (61) 19.50 (110) 0.730
Uremia (Blood Urea Nitrogen[20 mg/dl) 26.75 (65) 3.12 (10) 13.30 (75) <0.001
Leukopenia (WBC\4000/mm3) 6.17 (15) 4.36 (14) 5.14 (29) 0.335
Thrombocytopenia (platelets\100,000/mm3) 8.64 (21) 6.54 (21) 7.45 (42) 0.347
Hypothermia (body temperature\36 �C) 0 0 0 –
Systolic blood pressure\90 mmHg 2.47 (6) 4.05 (13) 3.37 (19) 0.303
Severe CAP as defined by ATS, % (n)a 10.70 (26) 5.61 (18) 7.80 (44) 0.026
At least 1 major criteria 3.29 (8) 3.12 (10) 3.19 (18) 0.906
At least 2 of the first 3 minor criteria 1.23 (3) 2.18 (7) 1.77 (10) 0.399
At least 3 minor criteria 9.05 (22) 2.18 (7) 5.14 (29) <0.001
In bold are the variables for which there is evidence at the 5 % level of a difference between 2005 and 2012a American Thoracic Society
Intern Emerg Med
123
documented in 2012 compared to 2005, although the pro-
portion of patients that received antibiotic therapy adherent
to clinical pathway (CP) was lower in 2012.
Concerning the performance of procedures aimed at
obtaining an aetiological diagnosis, urinary antigen tests
for S. pneumoniae and L. pneumophila were significantly
increased in 2012 compared to 2005, despite a significant
reduction in most other diagnostic tests, and performed in a
significantly greater proportion of patients in the respira-
tory ward than in other wards.
Mortality In-hospital and 30-day mortality did not sig-
nificantly change over time after adjustment for adherence
to CP, although their point estimates were lower in 2012
compared to 2005. In the adjusted regression analyses, age
and severity of pneumonia emerged as the only predictors
associated with an increased risk of in-hospital and 30-day
mortality. Patients who were tested for urinary antigens had
lower odds of in-hospital and 30-day mortality. Adminis-
tration of empirical antibiotic therapy compliance with CP
did not have a significant impact on mortality from CAP.
Clinical outcomes Mean length of hospital stay and mean
length of antibiotic therapy remained almost unchanged in
2012 and 2005, although they were significantly higher
among patients hospitalized in the respiratory ward com-
pared to those treated in other departments. The adminis-
tration of an empirical antibiotic therapy compliance with CP
was associated with a reduction in length of stay and duration
of antibiotic therapy. Regression analysis confirmed these
observations, and also provided some evidence of an
increased mean length of hospital stay and duration of
antibiotic therapy associated with execution of blood culture,
mechanical ventilation (MV) and treatment in ICU.
Table 3 Adherence to
diagnostic procedures and its
main findings
2005 2012 Total p value
PSI (Pneumonia Severity Index) calculation, % (n) 17.70 (43) 25.23 (81) 21.99 (124) 0.032
I class 4.65 (2) 12.35 (10) 9.68 (12)
II class 4.65 (2) 8.64 (7) 7.26 (9)
III class 13.95 (6) 20.99 (17) 18.55 (23) 0.146
IV class 60.47 (26) 37.04 (30) 45.16 (56)
V class 16.28 (7) 20.99 (17) 19.35 (24)
History investigation about vaccinations, % (n) 0.41 (1) 0 0.01 (1) 0.250
Procedures for etiological diagnosis, % (n)
Blood culture 60.91 (148) 64.17 (206) 62.77 (354) 0.426
Positive 24.32 (36) 9.71 (20) 15.82 (56) <0.001
S. pneumoniae 2.78 (1) 35.00 (7) 14.29 (8) 0.020
S. aureus 2.78 (1) 10.00 (2) 5.36 (3)
Coagulase-negative Staphylococci 66.67 (24) 40.00 (8) 57.14 (32)
Pseudomonas vesicularis 2.78 (1) 0 1.79 (1)
Enterobacteriaceae 8.33 (3) 5.00 (1) 7.14 (4)
Saprophytic 16.67 (6) 10.00 (2) 14.29 (8)
Urinary antigen test for S. pneumoniae 22.63 (55) 56.39 (181) 41.84 (236) <0.001
Positive 3.64 (2) 6.08 (11) 5.51 (13) 0.487
Urinary antigen test for L. pneumophila 48.56 (118) 57.63 (185) 53.72 (303) 0.032
Positive 1.69 (2) 4.32 (8) 3.30 (10) 0.212
Sputum Gram stain 19.75 (48) 0.93 (3) 9.04 (51) <0.001
Sputum culture 29.63 (72) 19.31 (62) 23.76 (134) 0.004
Lung brushing or biopsy 4.94 (12) 1.25 (4) 2.84 (16) 0.009
Bronchoalveolar lavage (BAL) 4.94 (12) 8.72 (28) 7.09 (40) 0.083
Bronchial lavage (BL) 10.70 (26) 0.31 (1) 4.79 (27) <0.001
Quantitative endotracheal aspirate 1.23 (3) 2.49 (8) 1.95 (11) 0.285
Other 61.73 (150) 45.17 (145) 52.30 (295) <0.001
Procedures for pleural effusion/empyema, % (n)
Thoracentesis 22.35 (19) 14.95 (16) 18.23 (35) 0.187
Chest drainage 9.41 (8) 9.35 (10) 9.38 (18) 0.988
Video-assisted thoracic surgery 37.50 (3) 10.00 (1) 22.22 (4) 0.163
In bold are the variables for which there is evidence at the 5 % level of a difference between 2005 and 2012
Intern Emerg Med
123
Comparison with the literature
Compliance with clinical pathway. The few studies carried
out so far suggest that severity scores for pneumonia are
rarely used in clinical practice [21, 29, 30]. The results of
our study are in accord with those reported in the study by
Blasi et al., [6] which shows that in Europe the application
of PSI and CURB-65 appears well below the threshold
recommended by the guidelines. The most encouraging
results emerge from university hospitals, where PSI cal-
culation was done in approximately 30 % of cases, com-
pared with 6 % of cases in non-university hospitals, and
CURB-65 calculations in around 40 vs. 14 %.
In line with Dambrava et al. [31] we demonstrate an
association between compliance with CP in choice of ini-
tial antibiotic therapy and reduced length of hospital stay
and the duration of antibiotic therapy.
The use of NIV in patients with CAP, both in the lit-
erature and in our study, remains controversial. [32, 33]
Mortality. In-hospital mortality in our sample is in
line with European hospital mortality rates (0–17.5 %)
[6].
In our study, performance of urinary antigen tests is
associated with lower mortality, although performance of
blood cultures did not yield similar results. This is difficult
to compare with existing literature; as such variables are
often estimated in combination. For example, Uematsu
et al. [11] in 2014 report that combined performance of
blood culture, sputum investigations and urinary antigen
tests is associated with a 36 % reduction of 30-day mor-
tality (p\ 0.001).
Some studies have found lower mortality when antibi-
otic treatment is compliant with guidelines [15, 17–19].
Menendez et al. demonstrated that noncompliance is an
independent risk factor for treatment failure and mortality
[18]. Nevertheless, Dambrava et al. [31] find compliance
not to be associated with mortality, also consistent with our
findings.
Table 4 Adherence to therapeutic interventions
2005 2012 Total p value
Distribution of patients within clinical categories identified by guidelines % (n)
Inpatient, non-ICU treatmenta 96.71 (235) 96.26 (309) 96.45 (544) 0.151
Patient with suspected aspiration from home 1.23 (3) 0.62 (2) 0.89 (5)
Patient with suspected aspiration from nursing home or in ICU treatment 0.41 (1) 1.56 (5) 1.06 (6)
Patient with suspected P. aeruginosa infection 0.41 (1) 1.25 (4) 0.89 (5)
Inpatient, ICU treatment without risk for P. aeruginosa infection 1.23 (3) – 0.53 (3)
Inpatient, ICU treatment with risk for P. aeruginosa infection – 0.31 (1) 0.18 (1)
Antibiotic therapy adherent to guidelines, % (n)
In patients of category 1 70.26 (163) 58.58 (181) 63.59 (344) 0.005
In patients of category 2 33.33 (1) 0 20.00 (1) 0.361
In patients of category 3 0 0 0 –
In patients of category 4 0 25.00 (1) 20.00 (1) 0.576
In patients of category 5 33.33 (1) – 33.33 (1) –
In patients of category 6 – 0 0 –
Administration of the first antibiotic dose, % (n)
Within 4 h from A&E presentation 96.00 (24) 99.59 (243) 99.26 (267) 0.047
Within 4 h from admission to ward 54.92 (106) 69.66 (202) 63.77 (308) <0.001
Switch therapy, % (n) 23.31 (55) 30.94 (99) 27.70 (154) 0.047
Intra-hospital antibiotic therapy duration in days, mean (SD) 10.71 (7.17) 10.56 (6.39) 10.63 (6.73) 0.7925
Post-discharge prescription duration in days, mean (SD) 6.20 (2.52) 4.79 (2.33) 5.39 (2.33) <0.0001
Antibiotic therapy total duration in days, mean (SD) 13.66 (8.18) 12.78 (6.65) 13.14 (7.33) 0.1825
Oxygen administration, % (n) 58.85 (143) 75.70 (243) 68.44 (386) <0.001
MV (mechanical ventilation), % (n) 2.06 (5) 9.35 (30) 6.21 (35) <0.001
Administration of low molecular weight heparin, % (n) 53.09 (129) 58.88 (189) 56.38 (318) 0.170
In bold are the variables for which there is evidence at the 5 % level of a difference between 2005 and 2012a Intensive care unit
Intern Emerg Med
123
Clinical outcomes In our study, the average length of
hospital stay is in line with the European mean duration
documented by Blasi et al. (9.0 days) [6].
Data interpretation
Overall, results from this study showed that clinical prac-
tice in our hospital changed over time. Compliance with
CP in the choice of empirical antibiotic therapy appeared to
be reduced over time, while main diagnostic and thera-
peutic interventions (i.e. PSI calculation, execution of
urinary antigen tests, administration of oxygen therapy)
improved.
These mixed results may explain why in-hospital and
30-day mortality did not significantly change in 2012
compared to 2005. Mortality does not appear to be asso-
ciated with compliance with CP, except for performance of
urinary antigen test, but does show association with patient
age and CAP severity. It is possible that impact on mor-
tality due to poor compliance with guideline recommended
antibiotic therapy could have been cancelled out by
improvements in compliance with other diagnostic and
therapeutic interventions.
Reduced compliance with CP empiric antibiotic therapy
in 2012 compared to 2005 may be due to lack of dedicated
resources available for implementation of the clinical
guidelines. Although recently in Italy there have been some
efforts to promote implementation of clinical guidelines,
[34] the frequency and quality of dissemination is still
subject to local initiative. A recent Italian study [35] finds
that implementation of therapeutic recommendations,
including empirical antibiotic therapy, leads to signifi-
cantly better outcomes of CAP and return to prior health
status, especially in more severe cases of CAP.
Table 5 Multivariable regression analyses for in-hospital and 30-day mortality, length of hospital stay and duration of antibiotic therapy
In-hospital
mortality
30-day mortality Length of hospital stay Duration of antibiotic
therapy
N = 561 N = 495 N = 561 N = 505
OR 95 % CI OR 95 % CI MD 95 % CI MD 95 % CI
Socio-demographic characteristics and other potential confounders
Age in years (continuous) 1.081 1.049,
1.1141.105 1.068,
1.1430.052 0.016, 0.089 -0.003 -0.038,
0.033
Male gender (vs. female gender) 0.803 0.454,
1.419
0.628 0.348,
1.133
0.850 -0.424,
2.124
0.411 -0.792,
1.615
Admission from nursing home (vs. from own
home)
1.118 0.544,2.300 1.409 0.648,
3.063
23.222 25.232,
21.213-1.770 -3.619,
0.079
Five or more comorbidities (vs. less than five) 1.601 0.827,
3.102
1.243 0.627,
2.464
1.150 -0.621,
2.921
1.421 -0.233,
3.075
ATS criteria for CAP severity (continuous) 1.743 1.383,
2.1961.868 1.462,
2.385-0.287 -0.903,
0.329
21.111 21.694,
20.527
Admission in 2012 (vs. admission in 2015) 1.081 0.491,
2.377
0.863 0.387,
1.923
1.297 -0.723,
3.318
0.659 -1.224,
2.541
Stay in a respiratory ward (vs. stay in a non-
respiratory ward)
0.847 0.351,
2.042
0.750 0.304,
1.851
4.225 2.152, 6.299 4.363 2.377, 6.349
Mechanical ventilation 0.968 0.289,
3.243
1.102 0.340,
3.575
4.638 1.688, 7.587 5.017 2.115, 7.919
Adherence to diagnostic procedures
Blood culture 0.677 0.377,
1.213
0.600 0.328,
1.097
2.631 1.259, 4.003 2.728 1.417, 4.039
Urinary Antigen tests 0.427 0.215,
0.8500.341 0.170,
0.6850.033 -1.407,
1.473
-0.164 -1.535,
1.207
Adherence to therapeutic interventions
Antibiotic therapy adherent to clinical pathway 0.830 0.468,
1.471
0.957 0.526,
1.738
22.868 24.186,
21.55022.004 23.265,
20.743
Treatment in ICU 0.452 0.073,
2.817
0.305 0.047,
1.983
8.409 3.547,
13.2726.237 1.170,
11.303
In bold are the variables for which there is evidence at the 5 % level of a difference between 2005 and 2012
Intern Emerg Med
123

Limitations of our study
Our study limitations primarily stem from the observa-
tional study design, although we have accounted for the
most common potential confounders of the association
between compliance with CAP CP and clinical outcomes.
As in any retrospective study, missing data can influence
the effect size of associations as well as their precision.
Particularly, the data relating to administration of antibi-
otics within 4 h from access to A&E, and data about
pneumococcal and influenza vaccinations were only par-
tially complete, and such variables could not be accounted
for the analyses. However, most variables were carefully
recorded and could be included in the analyses.
In 2005 the majority (62.96 %) of CAP patients were
treated in the hospital’s respiratory ward, while in 2012,
due to a hospital-wide reorganisation, all CAP patients
were treated in non-respiratory wards. This could have
potentially influenced both compliance with CAP CP and
the clinical outcomes assessed in our study. However, we
have accounted for this potential confounding effect by
including ward type in the regression model.
Conclusion
Compliance with CAP guidelines can progressively change
over time, suggesting the need for continual efforts to
promote compliance with clinical guidelines.
In our study, mortality is not associated with compliance
with the clinical pathway, but it is positively associated
with patient age and CAP severity, and negatively associ-
ated with performance of urinary antigen tests. Compliance
with CP empirical antibiotic treatment is associated with a
lower length of hospital stay and shorter duration of
antibiotic therapy, suggesting overall improvement in
clinical care with compliance with the CP. Ongoing and
comprehensive approaches to favour guidelines imple-
mentation may result in improvement of the overall man-
agement of CAP and help to reduce a burden on hospital
services.
Acknowledgments Design of the study: PEB, EC, FP; acquisition
of data: EC, EA; interpretation of data: PEB, EC, EA, FP; drafting of
the manuscript: PEB, EC, EA, FP; critical revision of the manuscript:
PEB, EA, FF, FH.
Compliance with ethical standards
Conflict of interest The authors declares that they have no conflict
of interest.
Statement of human and animal rights All procedures performed
in studies involving human participants were in accordance with the
ethical standards of the institutional and/or national research
committee and with the 1964 Helsinki declaration and its later
amendments or comparable ethical standards.
Informed consent For this type of study formal consent is not
required.
References
1. Blasi F, Mantero M, Santus P et al (2012) Understanding the
burden of pneumococcal disease in adults. Clin Microbiol Infect
18:7–14
2. Ramirez JA, Anzueto AR (2011) Changing needs of community-
acquired pneumonia. J Antimicrob Chemother 66:3–9
3. Welte T, Torres A, Nathwani D (2012) Clinical and economic
burden of community-acquired pneumonia among adults in
Europe. Thorax 67:71–79
4. Bauer TT, Welte T, Ernen C et al (2005) Cost analyses of
community-acquired pneumonia from the hospital perspective.
Chest 128:2238–2246
5. Millett ERC, De Stavola BL, Quint JK et al (2014) Time trends
and risk factors for hospitalisation after community-acquired
pneumonia in older adults in England. Thorax 69:A10
6. Blasi F, Garau J, Medina J et al (2013) Current management of
patients hospitalized with community-acquired pneumonia across
Europe: outcomes from REACH. Respir Res 14:44
7. Capelastegui A, Espana PP, Quintana JM et al (2004) Improve-
ment of process-of-care and outcomes after implementing a
guideline for the management of community-acquired pneumo-
nia: a controlled before-and-after design study. Clin Infect Dis
39:955–963
8. Marrie TJ, Lau CY, Wheeler SL et al (2000) A controlled trial of
a critical pathway for treatment of community-acquired pneu-
monia. CAPITAL Study Investigators. Community-acquired
pneumonia intervention trial assessing levofloxacin. JAMA
283:749–755
9. Blasi F, Iori I, Bulfoni A et al (2008) Can CAP guideline
adherence improve patient outcome in internal medicine depart-
ments? Eur Resp J 32:902–910
10. McCabe C, Kirchner C, Zhang H et al (2009) Guideline-con-
cordant therapy and reduced mortality and length of stay in adults
with community-acquired pneumonia. Arch Intern Med
169:1525–1531
11. Uematsu H, Hashimoto H, Iwamoto T et al (2014) Impact of
guideline-concordant microbiological testing on outcomes of
pneumonia. Int J Qual Health Care 26:100–107
12. Frei CR, Restrepo MI, Mortensen EM et al (2006) Impact of
guideline-concordant empiric antibiotic therapy in community-
acquired pneumonia. Am J Med 119:865–871
13. Menendez R, Reyes S, Martinez R et al (2007) Economic eval-
uation of adherence to treatment guidelines in nonintensive care
pneumonia. Eur Respir J 29:751–756
14. Ostermann H, Garau J, Medina J et al (2014) Resource use by
patients hospitalized with community-acquired pneumonia in
Europe: analysis of the REACH study. BMC Pulm Med 14:36
15. Menendez R, Ferrando D, Valles JM et al (2002) Influence of
deviation from guidelines on the outcome of community-acquired
pneumonia. Chest 122:612–617
16. Dean NC, Bateman KA, Donnelly SM et al (2006) Improved
clinical outcomes with utilization of a community-acquired
pneumonia guideline. Chest 130:794–799
17. Mortensen EM, Restrepo M, Anzueto A et al (2004) Effects of
guideline-concordant antimicrobial therapy on mortality among
patients with community-acquired pneumonia. Am J Med
117:726–731
Intern Emerg Med
123
18. Menendez R, Torres A, Zalacaın R et al (2005) Guidelines for the
treatment of community-acquired pneumonia: predictors of
adherence and outcome. Am J Respir Crit Care Med 172:757–762
19. Dean NC, Silver MP, Bateman KA et al (2001) Decreased
mortality after implementation of a treatment guideline for
community-acquired pneumonia. Am J Med 110:451–457
20. Cabana MD, Rand CS, Powe NR et al (1999) Why don’t
physicians follow clinical practice guidelines? A framework for
improvement. JAMA 282:1458–1465
21. Woodhead M, Blasi F, Ewig S et al (2011) Guidelines for the
management of adult lower respiratory tract infections—full
version. Clin Microbiol Infect 17:E1–E59
22. Niederman MS, Mandell LA, Anzueto A et al (2001) American
Thoracic Society. Guidelines for the management of adults with
Community-Acquired Pneumonia. Am J Respir Crit Care Med
163:1730–1754
23. British Thoracic Society Standards of Care Committee (2001)
BTS guidelines for the management of community acquired
pneumonia in adults. Thorax 56:1–58
24. von Elm E, Altman DG, Egger M et al (2014) The strengthening
the reporting of observational studies in epidemiology (STROBE)
statement: guidelines for reporting observational studies. Int J
Surg 14:S1743–S9191
25. Ospedale Maggiore della Carita (2014) Standards of service of
the Trauma and Orthopaedics ward. Available at: http://www.
maggioreosp.novara.it/site/home/attivita-assistenziale/reparti-
e-servizi-sanitari/elenco-delle-strutture-sanitarie/documento8021
635.html. Accessed 10 Apr 2014
26. Italian National Institute of Statistics (ISTAT). ‘‘Geodemo’’
demographic data. 2013. Available at: http://demo.istat.it/
pop2013/index.html. Accessed 30 Aug 2014
27. Ewig S (2014) The pneumonia triad. In: Chalmers JD, Pletz MW,
Aliberti S (eds) Community-Acquired Pneumonia. Eur Respir
Monogr 63:13–24
28. Mandell LA, Wunderink RG, Anzueto A et al (2007) Infectious
Diseases Society of America/American Thoracic Society con-
sensus guidelines on the management of community-acquired
pneumonia in adults. Clin Infect Dis 44:S27–S72
29. Lim WS, Baudouin SV, George RC et al (2009) British Thoracic
Society guidelines for the management of community acquired
pneumonia in adults: update 2009. Thorax 64:1–55
30. Bonaiti G, Aliberti S, Suigo G et al (2013) When do we need to
hospitalize a patient with community-acquired pneumonia?
Rassegna di Patol dell’Apparato Respir 28:189–195
31. Dambrava PG, Torres A, Valles X et al (2008) Adherence to
guidelines’ empirical antibiotic recommendations and commu-
nity-acquired pneumonia outcome. Eur Respir J 32:892–901
32. Carrillo A, Gonzalez-Diaz G, Ferrer M et al (2012) Non-invasive
ventilation in community-acquired pneumonia and severe acute
respiratory failure. Intensive Care Med 38:458–466
33. Ferrer M, Cosentini R, Nava S (2012) The use of non-invasive
ventilation during acute respiratory failure due to pneumonia. Eur
J Intern Med 23:420–428
34. Conferenza Stato Regioni (2014) CSR del 5 agosto: definizione
degli standard qualitativi, strutturali, tecnologici e quantitativi
relativi all’assistenza ospedaliera
35. Iori I, Gussoni G, Blasi F et al (2008) Guidelines and manage-
ment of hospitalized patients with community-acquired pneu-
monia: the Italian experience of the FASTCAP study. Ital J Med
2:5–18
Intern Emerg Med
123
View publication statsView publication stats