Adelaide Street Underpass Active Transportation Connections · Adelaide Street Underpass Active...
30
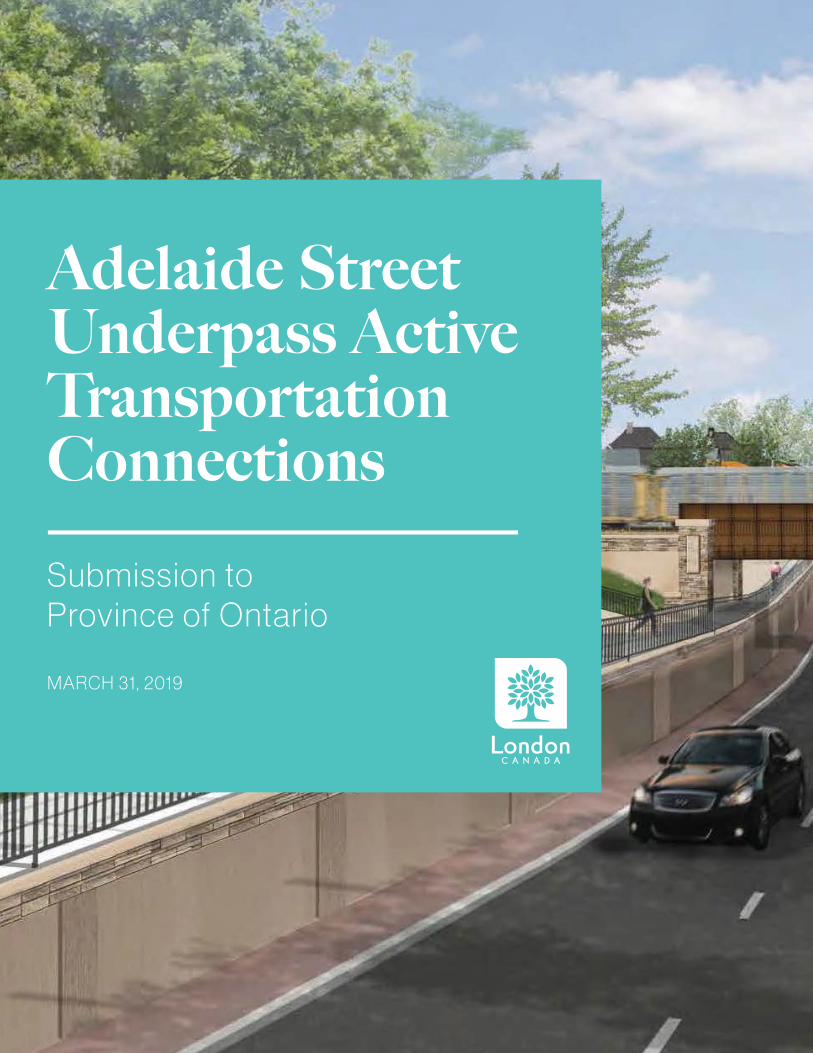
Adelaide Street Underpass Active Transportation Connections | 1 Adelaide Street Underpass Active Transportation Connections Submission to Province of Ontario MARCH 31, 2019
Transcript of Adelaide Street Underpass Active Transportation Connections · Adelaide Street Underpass Active...
Ad
elai
de
Str
eet U
nder
pas
s A
ctiv
e Tr
ansp
ort
atio
n C
onn
ectio
ns |
1
Adelaide Street Underpass Active Transportation Connections
Submission toProvince of Ontario
MARCH 31, 2019
Ad
elai
de
Str
eet U
nder
pas
s A
ctiv
e Tr
ansp
ort
atio
n C
onn
ectio
ns |
Sub
mis
sion
Let
ter
2
A TransportationSystem for All
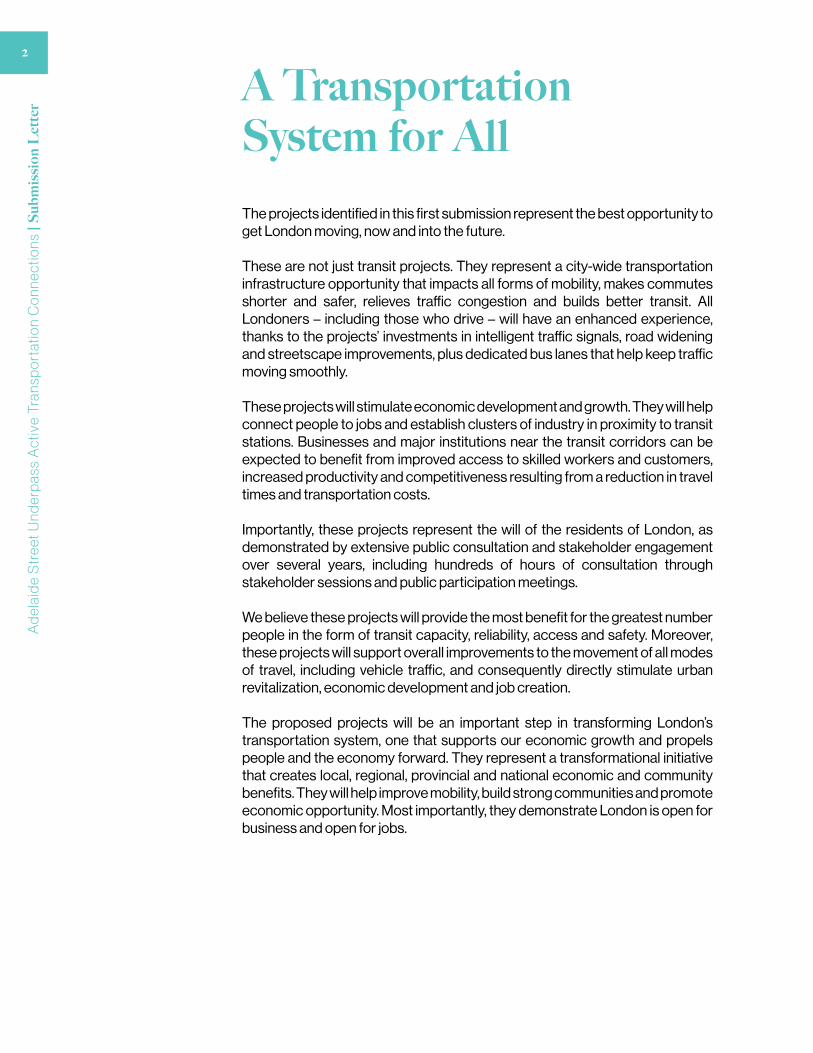
The projects identified in this first submission represent the best opportunity to get London moving, now and into the future.
These are not just transit projects. They represent a city-wide transportation infrastructure opportunity that impacts all forms of mobility, makes commutes shorter and safer, relieves traffic congestion and builds better transit. All Londoners – including those who drive – will have an enhanced experience, thanks to the projects’ investments in intelligent traffic signals, road widening and streetscape improvements, plus dedicated bus lanes that help keep traffic moving smoothly.
These projects will stimulate economic development and growth. They will help connect people to jobs and establish clusters of industry in proximity to transit stations. Businesses and major institutions near the transit corridors can be expected to benefit from improved access to skilled workers and customers, increased productivity and competitiveness resulting from a reduction in travel times and transportation costs.
Importantly, these projects represent the will of the residents of London, as demonstrated by extensive public consultation and stakeholder engagement over several years, including hundreds of hours of consultation through stakeholder sessions and public participation meetings.
We believe these projects will provide the most benefit for the greatest number people in the form of transit capacity, reliability, access and safety. Moreover, these projects will support overall improvements to the movement of all modes of travel, including vehicle traffic, and consequently directly stimulate urban revitalization, economic development and job creation.
The proposed projects will be an important step in transforming London’s transportation system, one that supports our economic growth and propels people and the economy forward. They represent a transformational initiative that creates local, regional, provincial and national economic and community benefits. They will help improve mobility, build strong communities and promote economic opportunity. Most importantly, they demonstrate London is open for business and open for jobs.
Lond
on
Can
ada
| L
ondo
n.ca
3
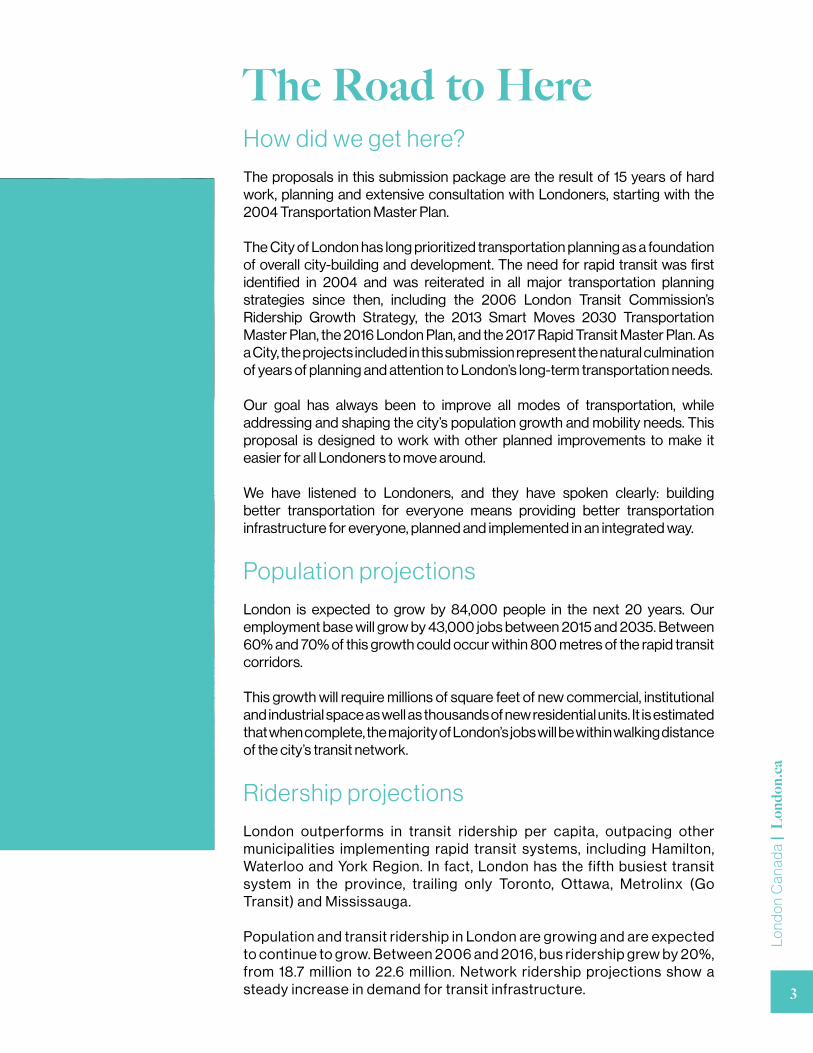
The Road to HereHow did we get here?
The proposals in this submission package are the result of 15 years of hard work, planning and extensive consultation with Londoners, starting with the 2004 Transportation Master Plan.
The City of London has long prioritized transportation planning as a foundation of overall city-building and development. The need for rapid transit was first identified in 2004 and was reiterated in all major transportation planning strategies since then, including the 2006 London Transit Commission’s Ridership Growth Strategy, the 2013 Smart Moves 2030 Transportation Master Plan, the 2016 London Plan, and the 2017 Rapid Transit Master Plan. As a City, the projects included in this submission represent the natural culmination of years of planning and attention to London’s long-term transportation needs.
Our goal has always been to improve all modes of transportation, while addressing and shaping the city’s population growth and mobility needs. This proposal is designed to work with other planned improvements to make it easier for all Londoners to move around.
We have listened to Londoners, and they have spoken clearly: building better transportation for everyone means providing better transportation infrastructure for everyone, planned and implemented in an integrated way.
Population projections
London is expected to grow by 84,000 people in the next 20 years. Our employment base will grow by 43,000 jobs between 2015 and 2035. Between 60% and 70% of this growth could occur within 800 metres of the rapid transit corridors.
This growth will require millions of square feet of new commercial, institutional and industrial space as well as thousands of new residential units. It is estimated that when complete, the majority of London’s jobs will be within walking distance of the city’s transit network.
Ridership projections
London outperforms in transit ridership per capita, outpacing other municipalities implementing rapid transit systems, including Hamilton, Waterloo and York Region. In fact, London has the fifth busiest transit system in the province, trailing only Toronto, Ottawa, Metrolinx (Go Transit) and Mississauga.
Population and transit ridership in London are growing and are expected to continue to grow. Between 2006 and 2016, bus ridership grew by 20%, from 18.7 million to 22.6 million. Network ridership projections show a steady increase in demand for transit infrastructure.
Ad
elai
de
Str
eet U
nder
pas
s A
ctiv
e Tr
ansp
ort
atio
n C
onn
ectio
ns |
Sub
mis
sion
Let
ter
4
Public and stakeholder consultation inputs
Consultation with Londoners has been ongoing for over a decade, through some of the city’s largest-ever public engagement exercises. By engaging tens of thousands of local residents, businesses, and First Nation communities these exercises laid the groundwork for a people-focused transportation network as part of the vision to meet our city’s unique transit needs.
The Road AheadProjects under consideration
We have worked with the provincial and federal government to develop a submission that responds to the desired goals of all governments under the Investing in Canada Plan. London’s 10 transportation projects approved by City Council were chosen from a short list of projects selected for consideration using the following two criteria:
1. Alignment with the federal program objectives, including:
u at least one of improved capacity of public transit infrastructure, improved quality and/or safety of transit systems and improved access to public transit;
u active transportation projects if they connect citizens to a public transit system;
u projects that are consistent with a land-use or transportation plan or strategy.
2. Current degree of technical and financial analysis for each project to minimize risk with respect to cost estimates, project implementation and the City’s capital and operating budgets.
Following a Public Participation Meeting on March 20, 2019, Council identified and endorsed ten projects to advance for provincial consideration. The five projects for initial submission to the Province of Ontario are included in our current submission, with the remaining projects moving through the internal development process in anticipation of the Government of Ontario’s review.
Lond
on
Can
ada
| L
ondo
n.ca
5
Top five recommended projects
The five selected projects included herein represent priority projects for the City of London that are ready to move forward immediately, providing the greatest benefit to Londoners.
The recommendation includes three rapid transit projects, combined with the efficiency of intelligent signalling and a long-overdue and resident-supported underpass project designed to improve mobility and transit connectivity. They are:
1. Downtown Loop
2. Wellington Gateway
3. East London Link
4. Intelligent Traffic Signals
5. Adelaide Street Underpass Active Transportation Connections
Why these five?
It is important to note that each of these five projects has been evaluated individually and is able to stand on its own merits.
Most importantly, these five projects present the best possible mix of transportation improvements within the current framework to get London moving forward, to provide the greatest short-term benefits to Londoners and all Ontarians, and to provide the foundations for ongoing transportation system improvements well into the future.
Investment in these high priority transit projects will improve road safety, smooth traffic patterns, decrease congestion, improve reliability, drive investment and job growth and improve transportation for all Londoners.
Ad
elai
de
Str
eet U
nder
pas
s A
ctiv
e Tr
ansp
ort
atio
n C
onn
ectio
ns |
Sub
mis
sion
Let
ter
6
Highlights of the project benefits include:
u Easing congestion and improving transit reliability and efficiency by separating buses from mixed traffic;
u Supporting greater access to transit services in London’s job-supporting industrial employment areas in association with planned frequency increases and enhancements to transit services;
u Upgrading intersection signals to improve traffic flow;
u Widening roads for lanes that can be flexible for future transportation needs;
u Coordinating construction with necessary upgrades to sewers, watermains, utilities infrastructure;
u Adding sidewalks and facilities for active transportation; and,
u Improving overall safety for transit users and vehicle commuters alike.
Key benefits
Improving transit
u The proposed projects will increase transit capacity. The result will be the ability to meet the expected growth in demand for transit services while maintaining the current vehicle capacity of the majority of roadways.
u Transit riders will have more choices and freedom because of improved frequency. They will have more reliable service because of dedicated lanes. They will have shorter waits at more comfortable rapid transit stations.
Improving vehicle travel
u Vehicle travel will be enhanced, with overall positive impacts on existing road networks, including much-needed infrastructure upgrades.
u By removing buses from mixed traffic, capacity for vehicles will increase while also increasing transit frequency and reliability.
Lond
on
Can
ada
| L
ondo
n.ca
7
Improving opportunity
u Combined, these projects are expected to generate 2,709 person-years of employment, representing $171.3 million in wages, during construction, plus an additional 167 person-years and $9.2 million in wages of long-term employment.
u Construction of separate rapid transit lanes, and accompanying efficiencies, are expected to result in savings of approximately 17.1 million person-hours of travel time by 2050.
u The increases in ridership due to the implementation of rapid transit will reduce congestion on our streets, linking goods to market and addressing the economic costs of traffic congestion.
u Support improved transit connections to London’s highest growth industrial and commercial areas, and to neighbouring communities alongside planned service frequency increases and enhancements to transit services.
u Enhancements to the health of Londoners through the incorporation of active transportation elements, improvements to air quality and overall reductions in greenhouse gas emissions.
Improving safety
u Road upgrades will improve safety for all vehicles.
u Centre medians will improve safety of loading and unloading passengers.
u Dedicated turn lanes at signalized intersections will improve vehicle safety.
u Critical response times will be reduced by allowing emergency service vehicles to use dedicated transit lanes.
Quick facts
u The projects will generate 2,709 person-years of employment, representing $171.3 million in wages, during construction, plus an additional 167 person-years ($9.2 million in wages) of long-term employment.
u Efficiencies gained will reduce the time Londoners spend commuting by 35.2 million person-hours by 2050.
u It is estimated that 60-70% of London’s future population growth will occur within 800 metres of rapid transit corridors throughout the city.
u The City of London has a large supply of vacant land close to proposed transit projects, including at least 43 parcels of land eligible for redevelopment with access to Wellington Road and Veterans Memorial Parkway.
u Travel in London, whether by transit or car, will be safer and more reliable.
Ad
elai
de
Str
eet U
nder
pas
s A
ctiv
e Tr
ansp
ort
atio
n C
onn
ectio
ns |
Pro
ject
Des
crip
tion
8
Estimated Cost
Shovel ready?
Projected Timeline
$18.9 million(Active Transportation
Components Only)
2021 – 2022 Yes
Project Description
u Construct active transportation connections, including wide, multi-use paths on both sides of the roadway in conjunction with a new railway underpass on Adelaide Street, south of Oxford Street
Construction Summary
Adelaide Street is a busy corridor that moves high volumes of vehicle, cycling and pedestrian traffic. It has been identified as a “civic boulevard” in the London Plan which prioritizes transit and active transportation and encourages mixed-use development to achieve higher densities and inspire people to use transit and active transportation.
The Adelaide Street crossing near downtown includes two train tracks entering the Canadian Pacific Railway (CPR) yard. All vehicles travelling north or south on this key corridor – including local and express transit buses – must cross these tracks, which experience frequent blockages and delays due to through and shunting trains from the CPR yard. Cyclists, pedestrians and those trying to reach nearby transit stops must also cross the tracks on foot.
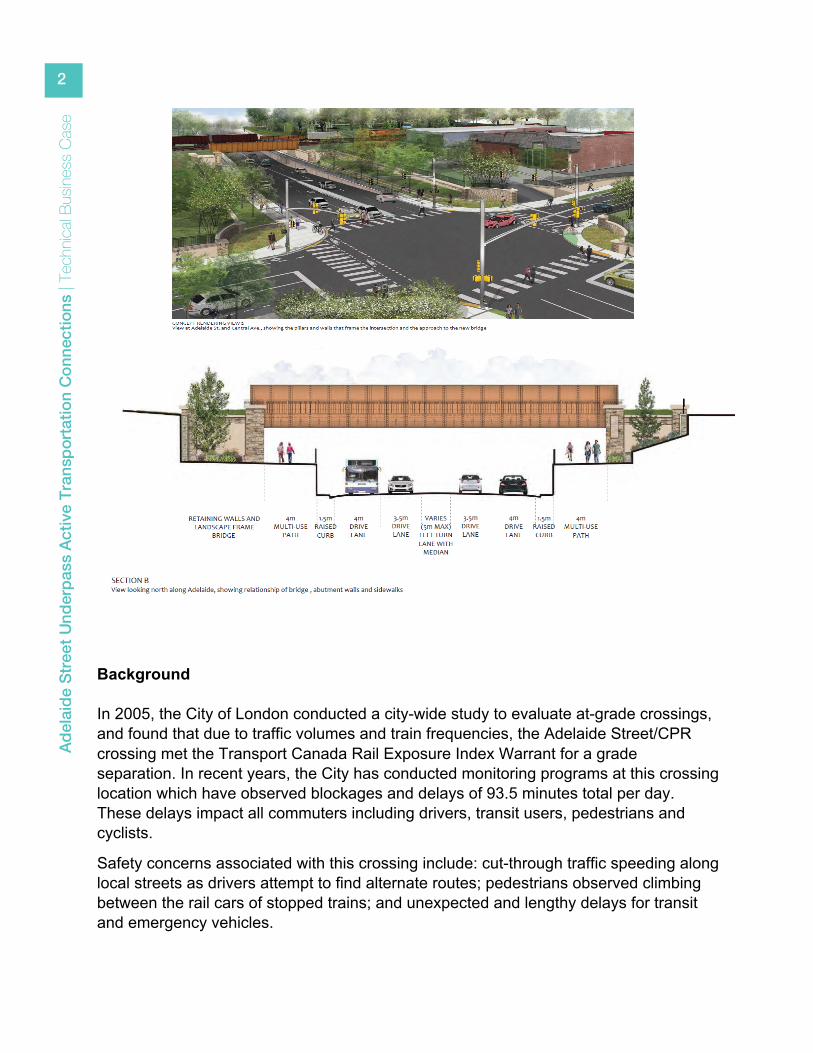
An Environmental Assessment (EA) completed for the crossing identified the need for an underpass (road under rail). The proposed underpass separates four general traffic lanes from rail traffic. The Active Transportation Connections project enhances the underpass with elevated four-metre wide multi-use paths on both sides, making it easier for Londoners to connect to transit stops. The project will also construct cycle lane connections on Central Avenue, immediately south of the underpass, to improve active transportation connections to transit.
Lond
on
Can
ada
| L
ondo
n.ca
9
Eligibility Criteria
The strategic case
u Frequent and lengthy blockages at the crossing create access issues for pedestrians and cyclists trying to use the corridor.
u The Adelaide Street underpass has been identified as critical supporting infrastructure for the rapid transit initiative, helping move local transit, pedestrians, and cyclists safely and efficiently to connecting points. Local transit on Adelaide Street would connect directly to the proposed East London Link rapid transit route.
Improved transit safety and quality
Improved transit access
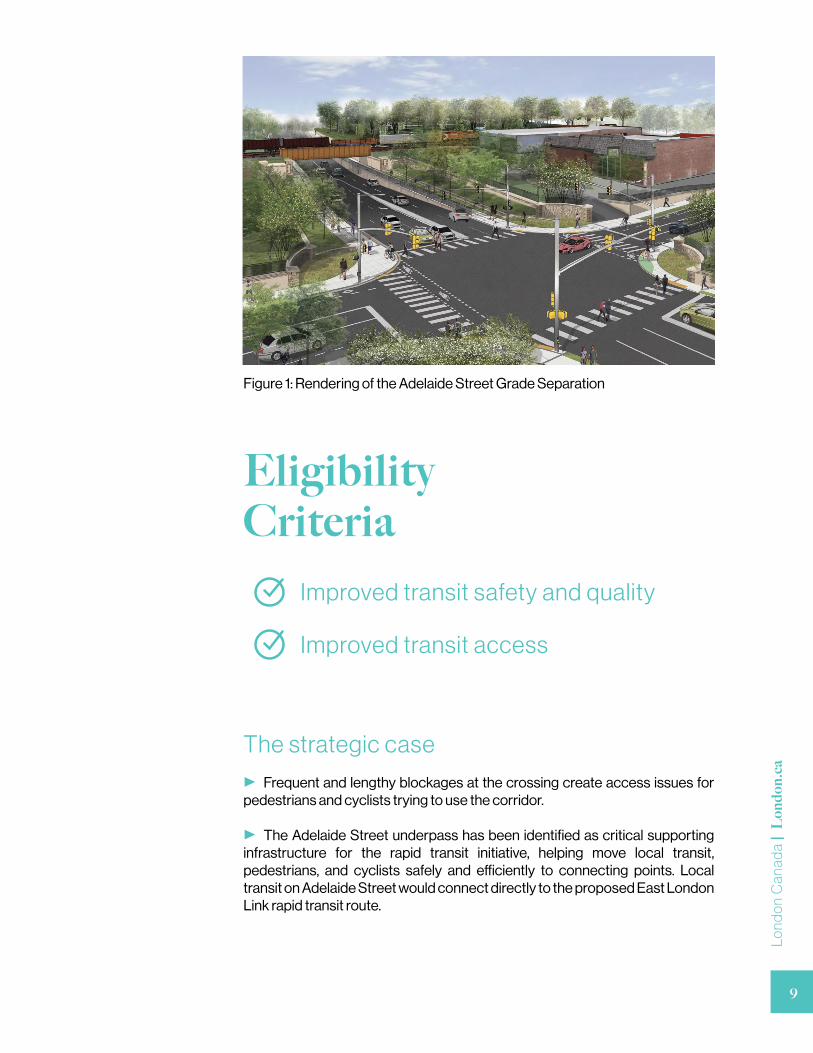
Figure 1: Rendering of the Adelaide Street Grade Separation
Ad
elai
de
Str
eet U
nder
pas
s A
ctiv
e Tr
ansp
ort
atio
n C
onn
ectio
ns |
Pro
ject
Des
crip
tion
10
Benefits
Transit for tomorrow
u Investment in this essential crossing is expected to improve road safety, reduce cut-through traffic through adjacent neighbourhoods, decrease overall congestion, improve transit reliability, and improve access to transit.
u Local transit service using Adelaide Street to connect to the proposed East London Link rapid transit corridor will build reliability expected to encourage modal shift to transit.
u This project will provide improved access to transit via enhanced pedestrian and cycling facilities.
Economic opportunity
u Construction of the Adelaide Street underpass will generate employment during construction.
u Improved access to more reliable transit, with a close connection to a proposed rapid transit corridor, increases peoples’ opportunities to get where they need to go for employment.
Improving car travel
u The underpass will remove the conflict between vehicles and trains, moving cars freely through the corridor.
Safer roads
u Removing potential conflict points between trains and vehicles, pedestrians, and cyclists increases safety for all road users.
u Reducing cut-through traffic in nearby residential areas during road blockages is expected to improve road safety on local streets.
u Critical response times will be reduced by removing the train crossing from the path of emergency service vehicles.

Appendix 1TECHNICAL BUSINES S CASE
Adel
aide
Stre
et U
nder
pass
Act
ive
Tran
spor
tatio
n Co
nnec
tions
| Te
chnic
al Bu
sines
s Ca
se
1
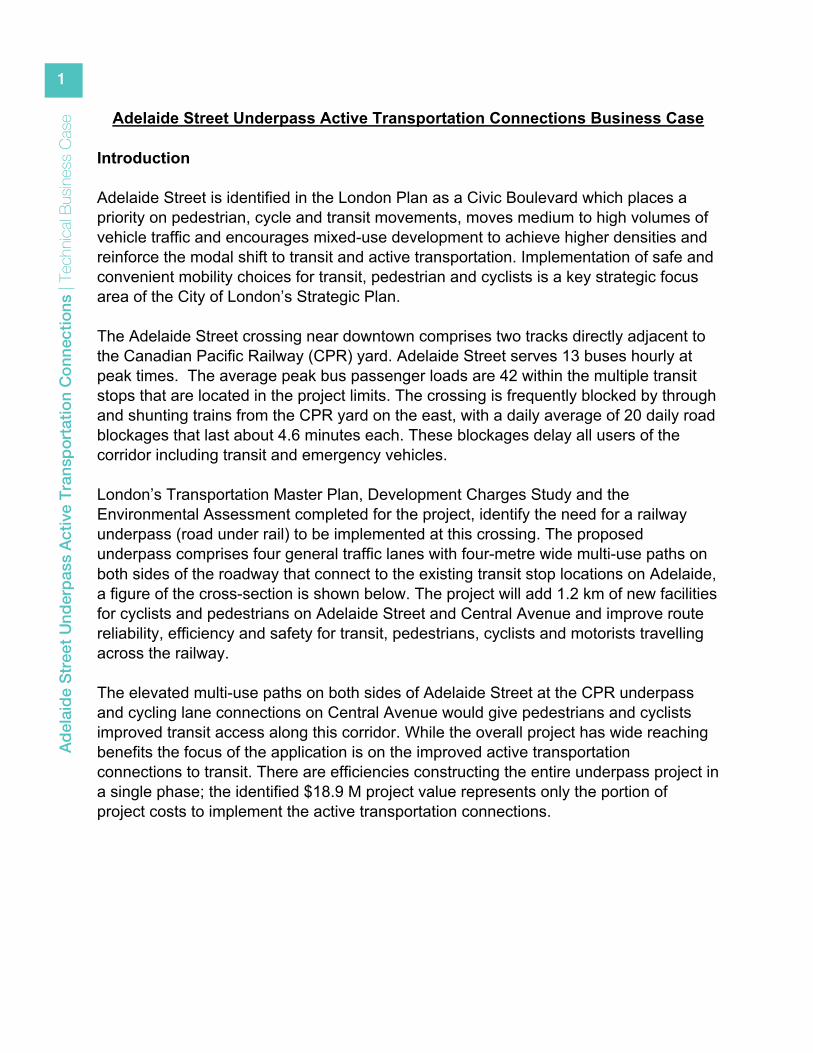
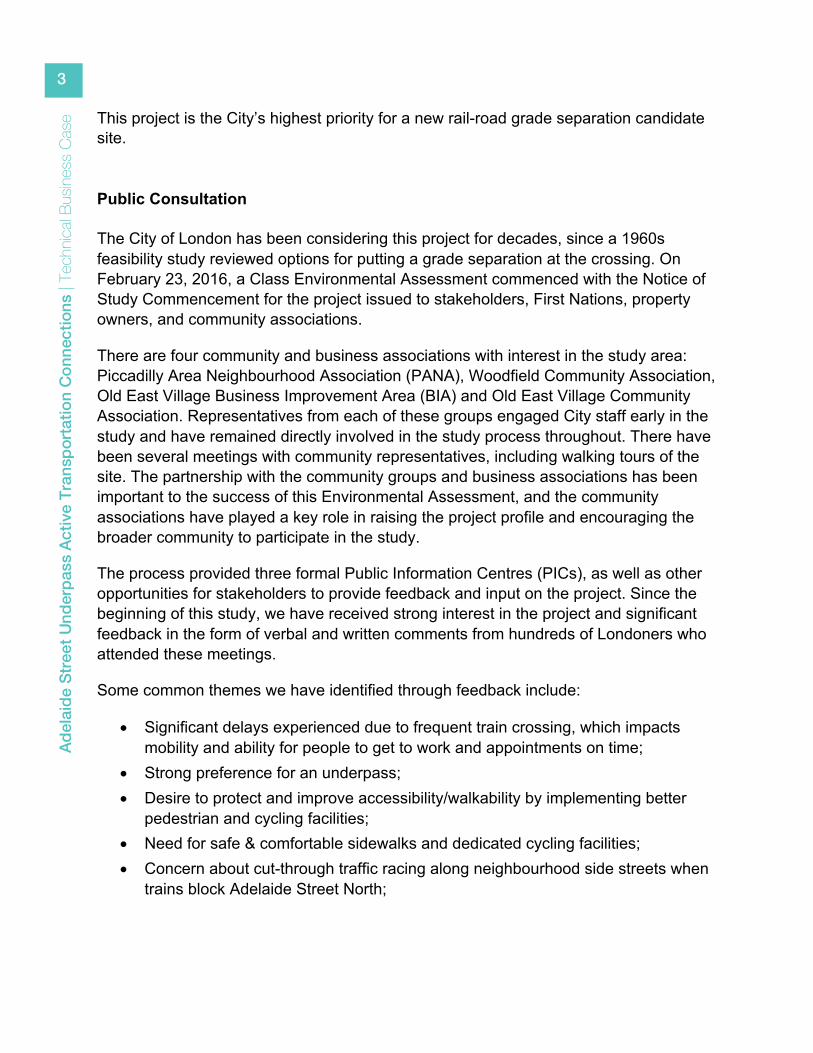
Adelaide Street Underpass Active Transportation Connections Business Case Introduction Adelaide Street is identified in the London Plan as a Civic Boulevard which places a priority on pedestrian, cycle and transit movements, moves medium to high volumes of vehicle traffic and encourages mixed-use development to achieve higher densities and reinforce the modal shift to transit and active transportation. Implementation of safe and convenient mobility choices for transit, pedestrian and cyclists is a key strategic focus area of the City of London’s Strategic Plan. The Adelaide Street crossing near downtown comprises two tracks directly adjacent to the Canadian Pacific Railway (CPR) yard. Adelaide Street serves 13 buses hourly at peak times. The average peak bus passenger loads are 42 within the multiple transit stops that are located in the project limits. The crossing is frequently blocked by through and shunting trains from the CPR yard on the east, with a daily average of 20 daily road blockages that last about 4.6 minutes each. These blockages delay all users of the corridor including transit and emergency vehicles. London’s Transportation Master Plan, Development Charges Study and the Environmental Assessment completed for the project, identify the need for a railway underpass (road under rail) to be implemented at this crossing. The proposed underpass comprises four general traffic lanes with four-metre wide multi-use paths on both sides of the roadway that connect to the existing transit stop locations on Adelaide, a figure of the cross-section is shown below. The project will add 1.2 km of new facilities for cyclists and pedestrians on Adelaide Street and Central Avenue and improve route reliability, efficiency and safety for transit, pedestrians, cyclists and motorists travelling across the railway. The elevated multi-use paths on both sides of Adelaide Street at the CPR underpass and cycling lane connections on Central Avenue would give pedestrians and cyclists improved transit access along this corridor. While the overall project has wide reaching benefits the focus of the application is on the improved active transportation connections to transit. There are efficiencies constructing the entire underpass project in a single phase; the identified $18.9 M project value represents only the portion of project costs to implement the active transportation connections.
Adel
aide
Stre
et U
nder
pass
Act
ive
Tran
spor
tatio
n Co
nnec
tions
| Te
chnic
al Bu
sines
s Ca
se
2
Background In 2005, the City of London conducted a city-wide study to evaluate at-grade crossings, and found that due to traffic volumes and train frequencies, the Adelaide Street/CPR crossing met the Transport Canada Rail Exposure Index Warrant for a grade separation. In recent years, the City has conducted monitoring programs at this crossing location which have observed blockages and delays of 93.5 minutes total per day. These delays impact all commuters including drivers, transit users, pedestrians and cyclists.
Safety concerns associated with this crossing include: cut-through traffic speeding along local streets as drivers attempt to find alternate routes; pedestrians observed climbing between the rail cars of stopped trains; and unexpected and lengthy delays for transit and emergency vehicles.
Adel
aide
Stre
et U
nder
pass
Act
ive
Tran
spor
tatio
n Co
nnec
tions
| Te
chnic
al Bu
sines
s Ca
se
3
This project is the City’s highest priority for a new rail-road grade separation candidate site.
Public Consultation The City of London has been considering this project for decades, since a 1960s feasibility study reviewed options for putting a grade separation at the crossing. On February 23, 2016, a Class Environmental Assessment commenced with the Notice of Study Commencement for the project issued to stakeholders, First Nations, property owners, and community associations.
There are four community and business associations with interest in the study area: Piccadilly Area Neighbourhood Association (PANA), Woodfield Community Association, Old East Village Business Improvement Area (BIA) and Old East Village Community Association. Representatives from each of these groups engaged City staff early in the study and have remained directly involved in the study process throughout. There have been several meetings with community representatives, including walking tours of the site. The partnership with the community groups and business associations has been important to the success of this Environmental Assessment, and the community associations have played a key role in raising the project profile and encouraging the broader community to participate in the study.
The process provided three formal Public Information Centres (PICs), as well as other opportunities for stakeholders to provide feedback and input on the project. Since the beginning of this study, we have received strong interest in the project and significant feedback in the form of verbal and written comments from hundreds of Londoners who attended these meetings.
Some common themes we have identified through feedback include:
• Significant delays experienced due to frequent train crossing, which impacts mobility and ability for people to get to work and appointments on time;
• Strong preference for an underpass; • Desire to protect and improve accessibility/walkability by implementing better
pedestrian and cycling facilities; • Need for safe & comfortable sidewalks and dedicated cycling facilities; • Concern about cut-through traffic racing along neighbourhood side streets when
trains block Adelaide Street North;
Adel
aide
Stre
et U
nder
pass
Act
ive
Tran
spor
tatio
n Co
nnec
tions
| Te
chnic
al Bu
sines
s Ca
se
4
In addition to these formal events, the project team met numerous times with property owners who would be most significantly impacted. Several proactive meetings occurred prior to Public Information Centre 2 and Public Information Centre 3 to provide early notification to those who would be impacted. Subsequent ongoing dialogue has occurred with interested parties throughout the study to the present time. Costs and Benefits A summary of the cost-benefit analysis for the entire project can be observed in Table 1. The anticipated total project cost is approximately $60 million. The active transportation component of the project is expected to be about a third of the total, or $18.9 million. The cost-benefit analysis result indicates significant user benefits for this total project. The main environmental benefit of this project would be a reduction of emissions which would be a result of reducing the wait times by providing a grade-separation between rail traffic and transit and vehicular traffic. The project reduces greenhouse gas emissions and decreases local emissions of smog related gases produced by idling vehicles waiting at the rail crossing.
In addition the quantitative benefits assessed through the cost-benefit analysis, qualitative improvements are also recognized through the introduction of the grade separation, including:
• Reduction in emergency services response times; • Increased safety for pedestrians, cyclists, transit and vehicles by removing
conflict at the tracks; • Reduced cut-through traffic infiltration through residential streets; • Increased transit service operations; • Reduced driver frustration that comes with delays
A cost-benefit analysis, including a sensitivity analysis, using the MicroBENCOST program showed an expected net benefit-cost ratio of 1.17. Internal rate of return for a 30-year analysis period with 10% discounted rate was 11.73%.
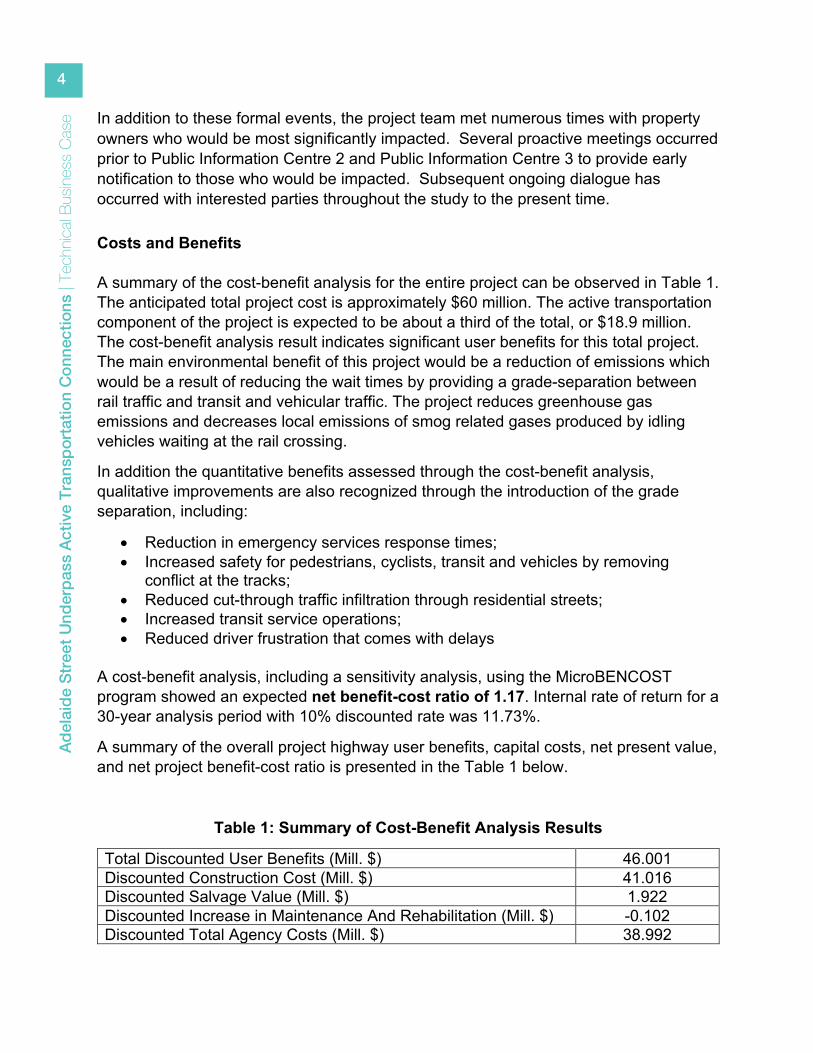
A summary of the overall project highway user benefits, capital costs, net present value, and net project benefit-cost ratio is presented in the Table 1 below.
Table 1: Summary of Cost-Benefit Analysis Results
Total Discounted User Benefits (Mill. $) 46.001 Discounted Construction Cost (Mill. $) 41.016 Discounted Salvage Value (Mill. $) 1.922 Discounted Increase in Maintenance And Rehabilitation (Mill. $) -0.102 Discounted Total Agency Costs (Mill. $) 38.992
Adel
aide
Stre
et U
nder
pass
Act
ive
Tran
spor
tatio
n Co
nnec
tions
| Te
chnic
al Bu
sines
s Ca
se
5
Fuel Consumption Savings (Mill. I.) 0.109 Carbon Monoxide Emissions Reduction (Mill. Kg.) 0.002 Net Present Value (Mill. $) 7.009 Gross Benefit-Cost Ratio 1.18 Netted Benefit-Cost Ratio 1.17 Internal Rate of Return (Percent) 11.73
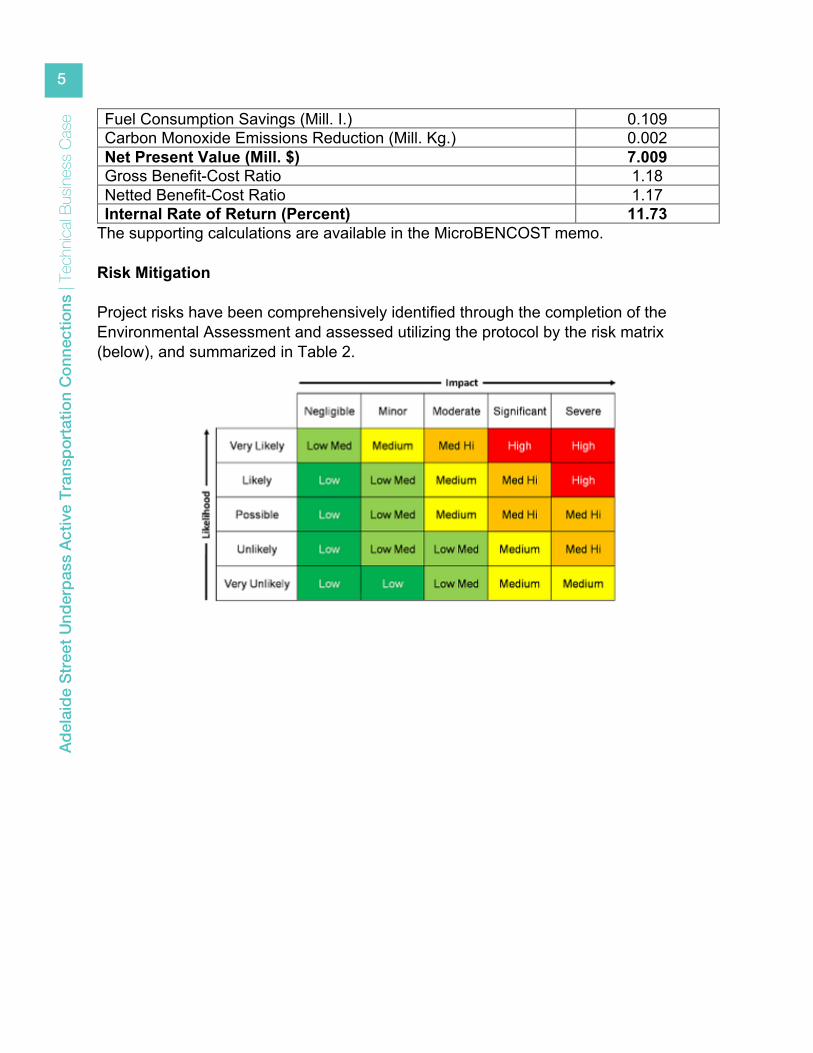
The supporting calculations are available in the MicroBENCOST memo. Risk Mitigation Project risks have been comprehensively identified through the completion of the Environmental Assessment and assessed utilizing the protocol by the risk matrix (below), and summarized in Table 2.
Adel
aide
Stre
et U
nder
pass
Act
ive
Tran
spor
tatio
n Co
nnec
tions
| Te
chnic
al Bu
sines
s Ca
se
6
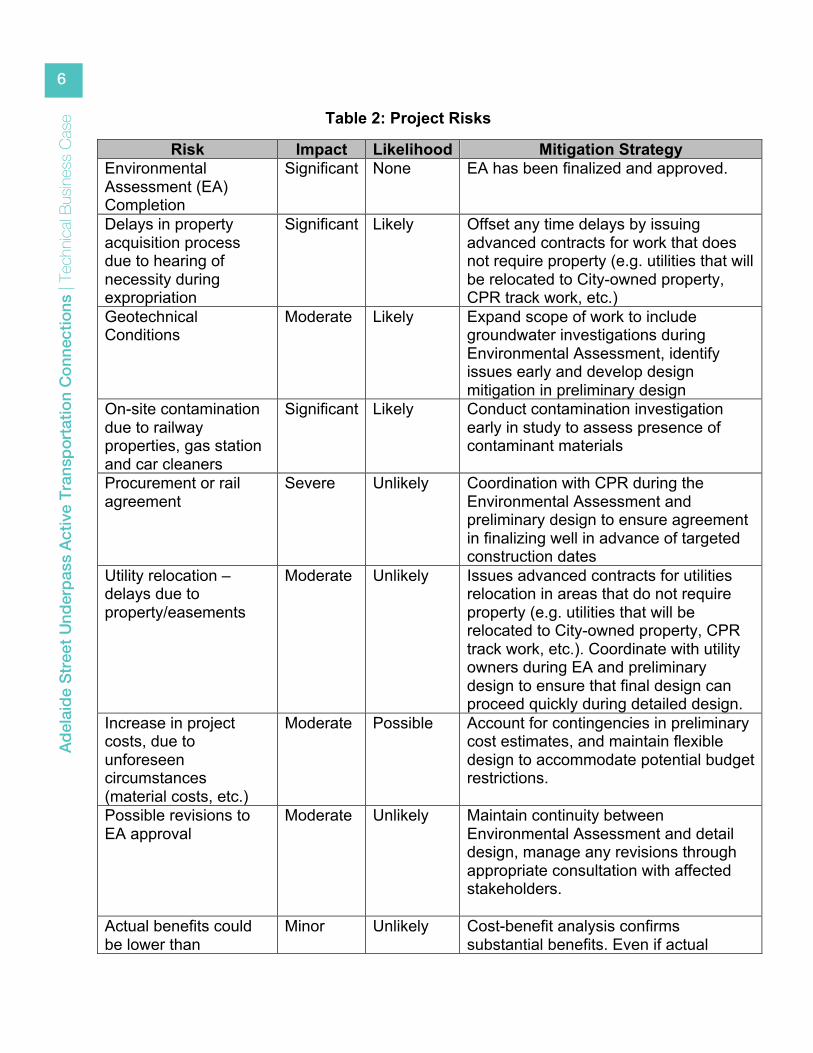
Table 2: Project Risks
Risk Impact Likelihood Mitigation Strategy Environmental Assessment (EA) Completion
Significant None EA has been finalized and approved.
Delays in property acquisition process due to hearing of necessity during expropriation
Significant Likely Offset any time delays by issuing advanced contracts for work that does not require property (e.g. utilities that will be relocated to City-owned property, CPR track work, etc.)
Geotechnical Conditions
Moderate Likely Expand scope of work to include groundwater investigations during Environmental Assessment, identify issues early and develop design mitigation in preliminary design
On-site contamination due to railway properties, gas station and car cleaners
Significant Likely Conduct contamination investigation early in study to assess presence of contaminant materials
Procurement or rail agreement
Severe Unlikely Coordination with CPR during the Environmental Assessment and preliminary design to ensure agreement in finalizing well in advance of targeted construction dates
Utility relocation – delays due to property/easements
Moderate Unlikely Issues advanced contracts for utilities relocation in areas that do not require property (e.g. utilities that will be relocated to City-owned property, CPR track work, etc.). Coordinate with utility owners during EA and preliminary design to ensure that final design can proceed quickly during detailed design.
Increase in project costs, due to unforeseen circumstances (material costs, etc.)
Moderate Possible Account for contingencies in preliminary cost estimates, and maintain flexible design to accommodate potential budget restrictions.
Possible revisions to EA approval
Moderate Unlikely Maintain continuity between Environmental Assessment and detail design, manage any revisions through appropriate consultation with affected stakeholders.
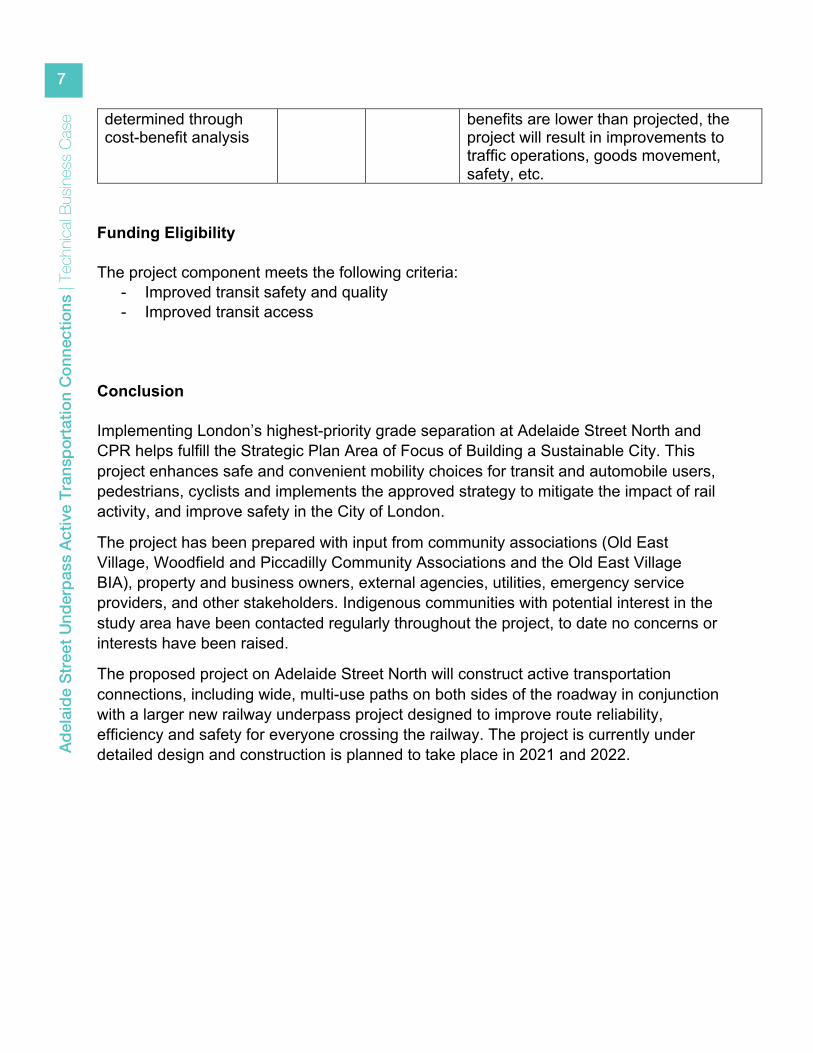
Actual benefits could be lower than
Minor Unlikely Cost-benefit analysis confirms substantial benefits. Even if actual
Adel
aide
Stre
et U
nder
pass
Act
ive
Tran
spor
tatio
n Co
nnec
tions
| Te
chnic
al Bu
sines
s Ca
se
7
determined through cost-benefit analysis
benefits are lower than projected, the project will result in improvements to traffic operations, goods movement, safety, etc.
Funding Eligibility The project component meets the following criteria:
- Improved transit safety and quality - Improved transit access
Conclusion Implementing London’s highest-priority grade separation at Adelaide Street North and CPR helps fulfill the Strategic Plan Area of Focus of Building a Sustainable City. This project enhances safe and convenient mobility choices for transit and automobile users, pedestrians, cyclists and implements the approved strategy to mitigate the impact of rail activity, and improve safety in the City of London.
The project has been prepared with input from community associations (Old East Village, Woodfield and Piccadilly Community Associations and the Old East Village BIA), property and business owners, external agencies, utilities, emergency service providers, and other stakeholders. Indigenous communities with potential interest in the study area have been contacted regularly throughout the project, to date no concerns or interests have been raised.
The proposed project on Adelaide Street North will construct active transportation connections, including wide, multi-use paths on both sides of the roadway in conjunction with a larger new railway underpass project designed to improve route reliability, efficiency and safety for everyone crossing the railway. The project is currently under detailed design and construction is planned to take place in 2021 and 2022.

Appendix 2ADELAIDE STREET GRADE
SEPARATION SUPPORTING ANALYSIS
www.wsp.com
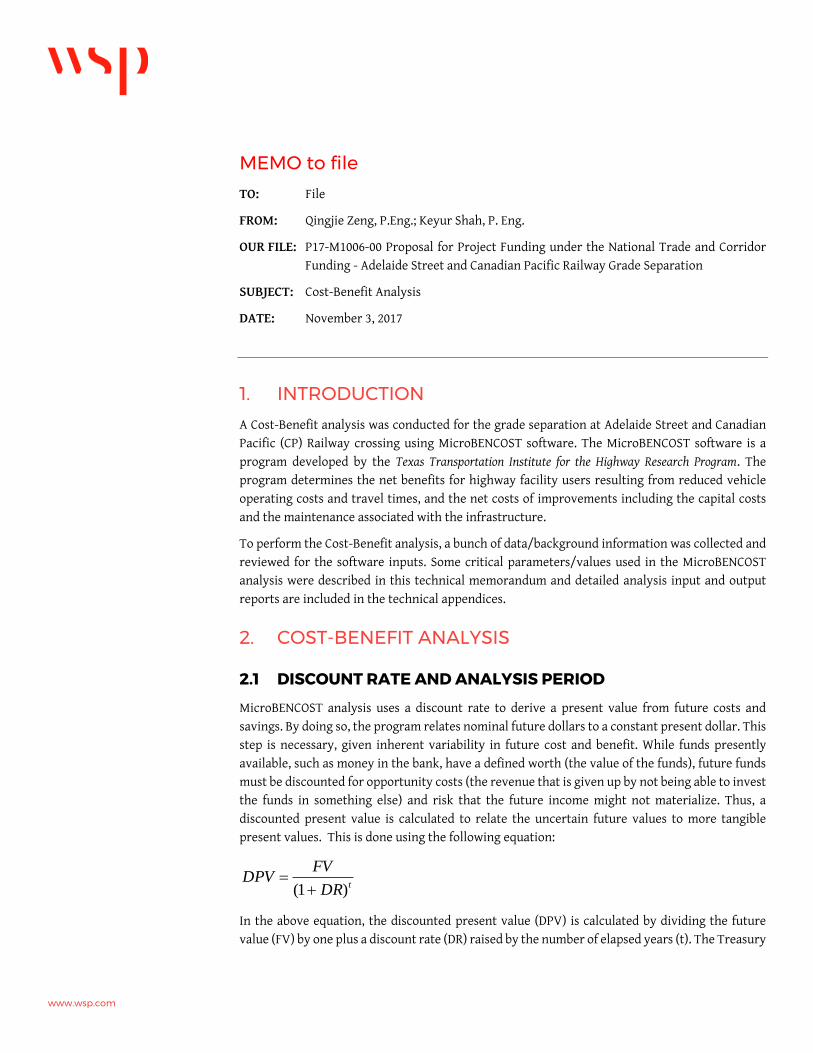
MEMO to file
TO: File
FROM: Qingjie Zeng, P.Eng.; Keyur Shah, P. Eng.
OUR FILE: P17-M1006-00 Proposal for Project Funding under the National Trade and Corridor Funding - Adelaide Street and Canadian Pacific Railway Grade Separation
SUBJECT: Cost-Benefit Analysis
DATE: November 3, 2017
1. INTRODUCTION
A Cost-Benefit analysis was conducted for the grade separation at Adelaide Street and Canadian Pacific (CP) Railway crossing using MicroBENCOST software. The MicroBENCOST software is a program developed by the Texas Transportation Institute for the Highway Research Program. The program determines the net benefits for highway facility users resulting from reduced vehicle operating costs and travel times, and the net costs of improvements including the capital costs and the maintenance associated with the infrastructure.
To perform the Cost-Benefit analysis, a bunch of data/background information was collected and reviewed for the software inputs. Some critical parameters/values used in the MicroBENCOST analysis were described in this technical memorandum and detailed analysis input and output reports are included in the technical appendices.
2. COST-BENEFIT ANALYSIS
2.1 DISCOUNT RATE AND ANALYSIS PERIOD
MicroBENCOST analysis uses a discount rate to derive a present value from future costs and savings. By doing so, the program relates nominal future dollars to a constant present dollar. This step is necessary, given inherent variability in future cost and benefit. While funds presently available, such as money in the bank, have a defined worth (the value of the funds), future funds must be discounted for opportunity costs (the revenue that is given up by not being able to invest the funds in something else) and risk that the future income might not materialize. Thus, a discounted present value is calculated to relate the uncertain future values to more tangible present values. This is done using the following equation:
tDR
FVDPV
)1(
In the above equation, the discounted present value (DPV) is calculated by dividing the future value (FV) by one plus a discount rate (DR) raised by the number of elapsed years (t). The Treasury
Page 2
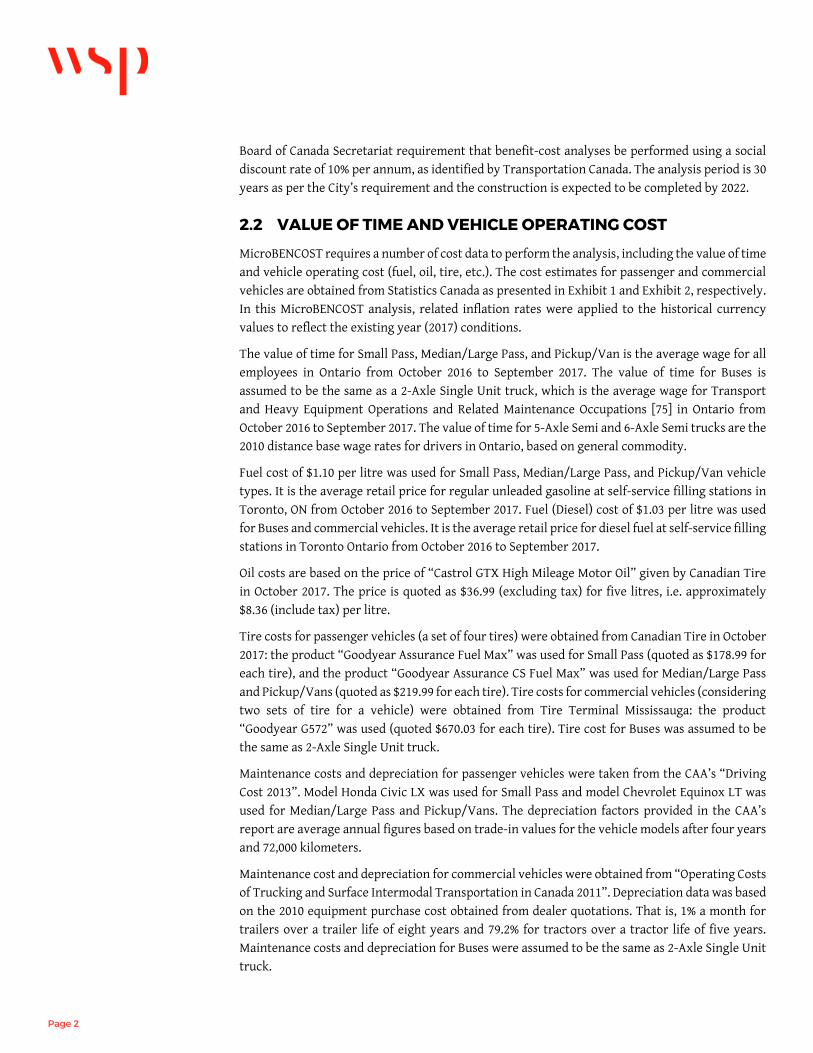
Board of Canada Secretariat requirement that benefit-cost analyses be performed using a social discount rate of 10% per annum, as identified by Transportation Canada. The analysis period is 30 years as per the City’s requirement and the construction is expected to be completed by 2022.
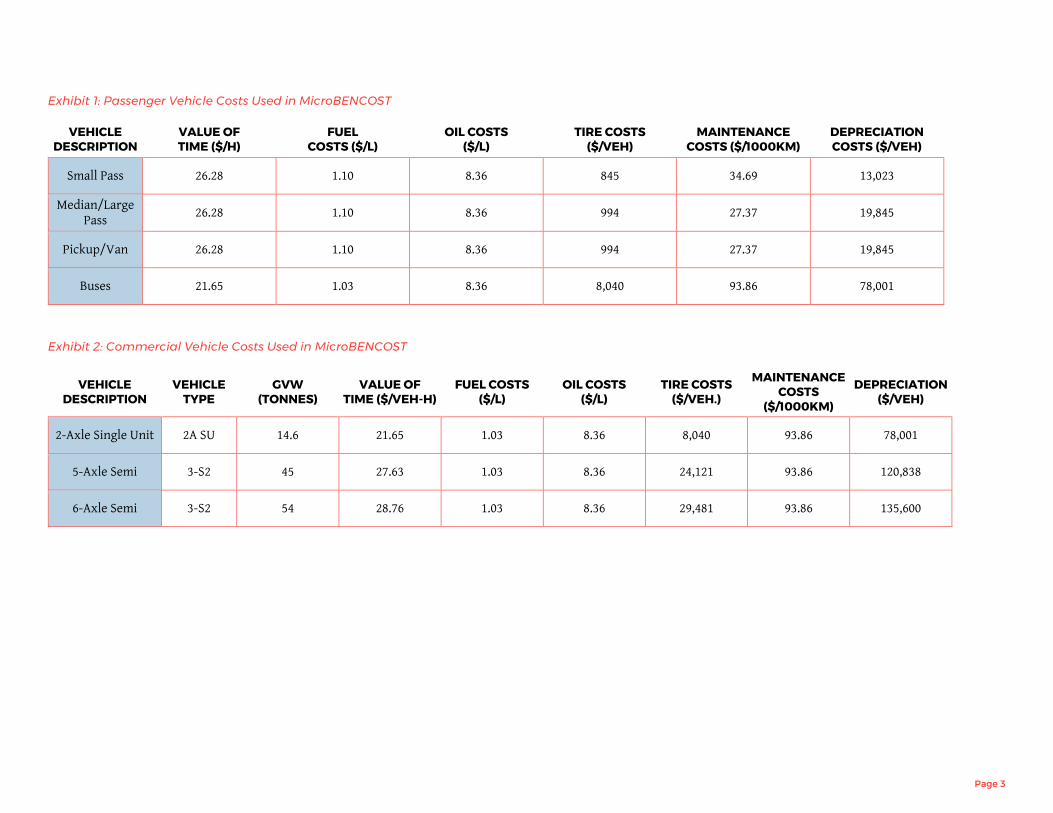
2.2 VALUE OF TIME AND VEHICLE OPERATING COST
MicroBENCOST requires a number of cost data to perform the analysis, including the value of time and vehicle operating cost (fuel, oil, tire, etc.). The cost estimates for passenger and commercial vehicles are obtained from Statistics Canada as presented in Exhibit 1 and Exhibit 2, respectively. In this MicroBENCOST analysis, related inflation rates were applied to the historical currency values to reflect the existing year (2017) conditions.
The value of time for Small Pass, Median/Large Pass, and Pickup/Van is the average wage for all employees in Ontario from October 2016 to September 2017. The value of time for Buses is assumed to be the same as a 2-Axle Single Unit truck, which is the average wage for Transport and Heavy Equipment Operations and Related Maintenance Occupations [75] in Ontario from October 2016 to September 2017. The value of time for 5-Axle Semi and 6-Axle Semi trucks are the 2010 distance base wage rates for drivers in Ontario, based on general commodity.
Fuel cost of $1.10 per litre was used for Small Pass, Median/Large Pass, and Pickup/Van vehicle types. It is the average retail price for regular unleaded gasoline at self-service filling stations in Toronto, ON from October 2016 to September 2017. Fuel (Diesel) cost of $1.03 per litre was used for Buses and commercial vehicles. It is the average retail price for diesel fuel at self-service filling stations in Toronto Ontario from October 2016 to September 2017.
Oil costs are based on the price of “Castrol GTX High Mileage Motor Oil” given by Canadian Tire in October 2017. The price is quoted as $36.99 (excluding tax) for five litres, i.e. approximately $8.36 (include tax) per litre.
Tire costs for passenger vehicles (a set of four tires) were obtained from Canadian Tire in October 2017: the product “Goodyear Assurance Fuel Max” was used for Small Pass (quoted as $178.99 for each tire), and the product “Goodyear Assurance CS Fuel Max” was used for Median/Large Pass and Pickup/Vans (quoted as $219.99 for each tire). Tire costs for commercial vehicles (considering two sets of tire for a vehicle) were obtained from Tire Terminal Mississauga: the product “Goodyear G572” was used (quoted $670.03 for each tire). Tire cost for Buses was assumed to be the same as 2-Axle Single Unit truck.
Maintenance costs and depreciation for passenger vehicles were taken from the CAA’s “Driving Cost 2013”. Model Honda Civic LX was used for Small Pass and model Chevrolet Equinox LT was used for Median/Large Pass and Pickup/Vans. The depreciation factors provided in the CAA’s report are average annual figures based on trade-in values for the vehicle models after four years and 72,000 kilometers.
Maintenance cost and depreciation for commercial vehicles were obtained from “Operating Costs of Trucking and Surface Intermodal Transportation in Canada 2011”. Depreciation data was based on the 2010 equipment purchase cost obtained from dealer quotations. That is, 1% a month for trailers over a trailer life of eight years and 79.2% for tractors over a tractor life of five years. Maintenance costs and depreciation for Buses were assumed to be the same as 2-Axle Single Unit truck.
Page 3
Exhibit 1: Passenger Vehicle Costs Used in MicroBENCOST
VEHICLE DESCRIPTION
VALUE OF TIME ($/H)
FUEL COSTS ($/L)
OIL COSTS ($/L)
TIRE COSTS ($/VEH)
MAINTENANCE COSTS ($/1000KM)
DEPRECIATION COSTS ($/VEH)
Small Pass 26.28 1.10 8.36 845 34.69 13,023
Median/Large Pass
26.28 1.10 8.36 994 27.37 19,845
Pickup/Van 26.28 1.10 8.36 994 27.37 19,845
Buses 21.65 1.03 8.36 8,040 93.86 78,001
Exhibit 2: Commercial Vehicle Costs Used in MicroBENCOST
VEHICLE DESCRIPTION
VEHICLE TYPE
GVW (TONNES)
VALUE OF TIME ($/VEH-H)
FUEL COSTS ($/L)
OIL COSTS ($/L)
TIRE COSTS ($/VEH.)
MAINTENANCE COSTS
($/1000KM)
DEPRECIATION ($/VEH)
2-Axle Single Unit 2A SU 14.6 21.65 1.03 8.36 8,040 93.86 78,001
5-Axle Semi 3-S2 45 27.63 1.03 8.36 24,121 93.86 120,838
6-Axle Semi 3-S2 54 28.76 1.03 8.36 29,481 93.86 135,600
Page 4
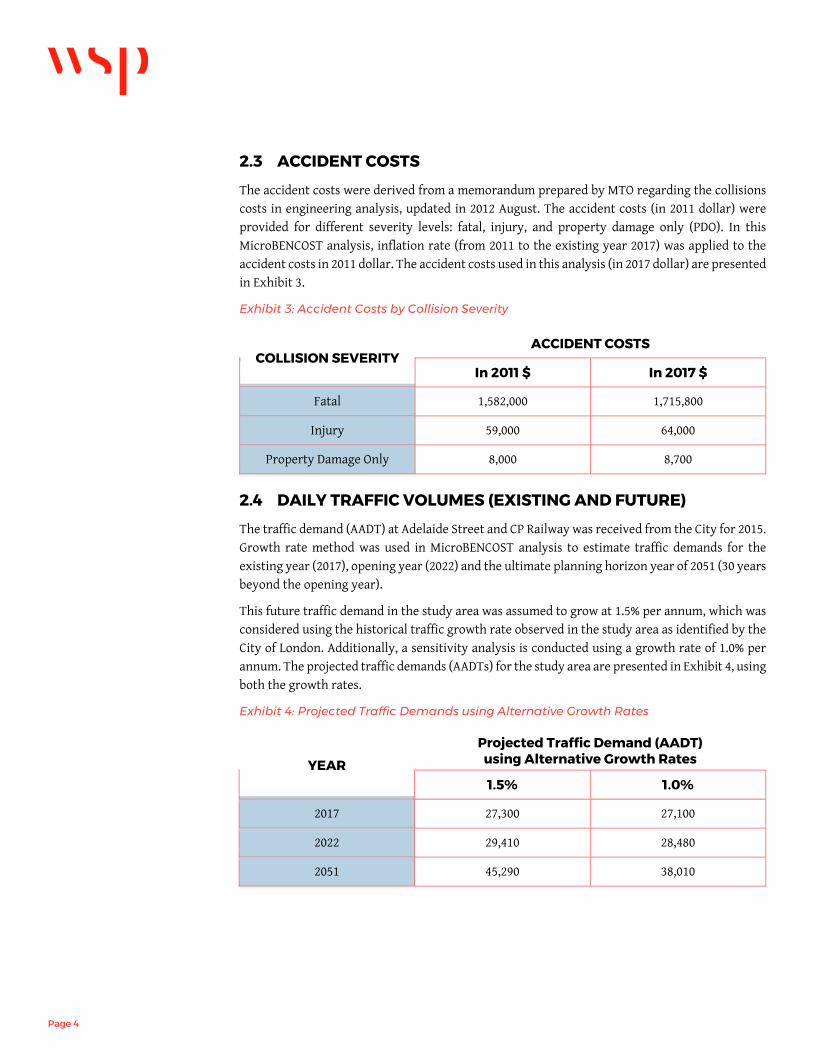
2.3 ACCIDENT COSTS
The accident costs were derived from a memorandum prepared by MTO regarding the collisions costs in engineering analysis, updated in 2012 August. The accident costs (in 2011 dollar) were provided for different severity levels: fatal, injury, and property damage only (PDO). In this MicroBENCOST analysis, inflation rate (from 2011 to the existing year 2017) was applied to the accident costs in 2011 dollar. The accident costs used in this analysis (in 2017 dollar) are presented in Exhibit 3.
Exhibit 3: Accident Costs by Collision Severity
COLLISION SEVERITY ACCIDENT COSTS
In 2011 $ In 2017 $
Fatal 1,582,000 1,715,800
Injury 59,000 64,000
Property Damage Only 8,000 8,700
2.4 DAILY TRAFFIC VOLUMES (EXISTING AND FUTURE)
The traffic demand (AADT) at Adelaide Street and CP Railway was received from the City for 2015. Growth rate method was used in MicroBENCOST analysis to estimate traffic demands for the existing year (2017), opening year (2022) and the ultimate planning horizon year of 2051 (30 years beyond the opening year).
This future traffic demand in the study area was assumed to grow at 1.5% per annum, which was considered using the historical traffic growth rate observed in the study area as identified by the City of London. Additionally, a sensitivity analysis is conducted using a growth rate of 1.0% per annum. The projected traffic demands (AADTs) for the study area are presented in Exhibit 4, using both the growth rates.
Exhibit 4: Projected Traffic Demands using Alternative Growth Rates
YEAR
Projected Traffic Demand (AADT) using Alternative Growth Rates
1.5% 1.0%
2017 27,300 27,100
2022 29,410 28,480
2051 45,290 38,010
Page 5
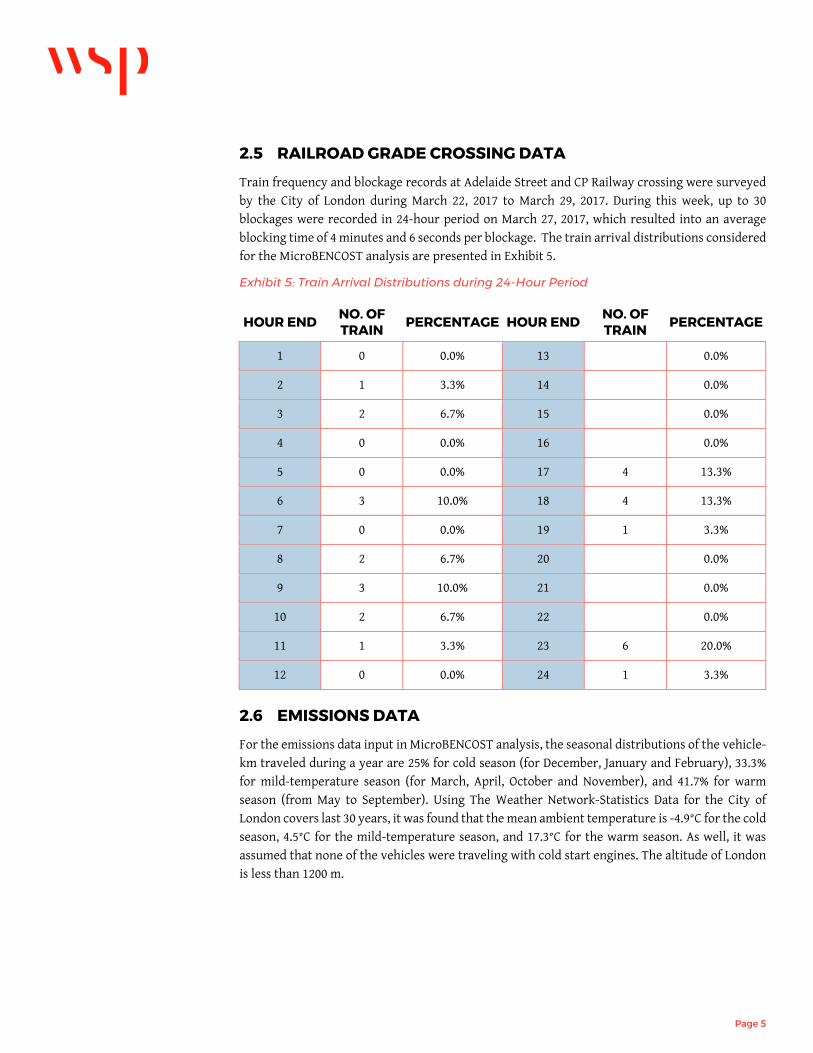
2.5 RAILROAD GRADE CROSSING DATA
Train frequency and blockage records at Adelaide Street and CP Railway crossing were surveyed by the City of London during March 22, 2017 to March 29, 2017. During this week, up to 30 blockages were recorded in 24-hour period on March 27, 2017, which resulted into an average blocking time of 4 minutes and 6 seconds per blockage. The train arrival distributions considered for the MicroBENCOST analysis are presented in Exhibit 5.
Exhibit 5: Train Arrival Distributions during 24-Hour Period
HOUR END NO. OF TRAIN PERCENTAGE HOUR END
NO. OF TRAIN PERCENTAGE
1 0 0.0% 13 0.0%
2 1 3.3% 14 0.0%
3 2 6.7% 15 0.0%
4 0 0.0% 16 0.0%
5 0 0.0% 17 4 13.3%
6 3 10.0% 18 4 13.3%
7 0 0.0% 19 1 3.3%
8 2 6.7% 20 0.0%
9 3 10.0% 21 0.0%
10 2 6.7% 22 0.0%
11 1 3.3% 23 6 20.0%
12 0 0.0% 24 1 3.3%
2.6 EMISSIONS DATA
For the emissions data input in MicroBENCOST analysis, the seasonal distributions of the vehicle-km traveled during a year are 25% for cold season (for December, January and February), 33.3% for mild-temperature season (for March, April, October and November), and 41.7% for warm season (from May to September). Using The Weather Network-Statistics Data for the City of London covers last 30 years, it was found that the mean ambient temperature is -4.9°C for the cold season, 4.5°C for the mild-temperature season, and 17.3°C for the warm season. As well, it was assumed that none of the vehicles were traveling with cold start engines. The altitude of London is less than 1200 m.
Page 6
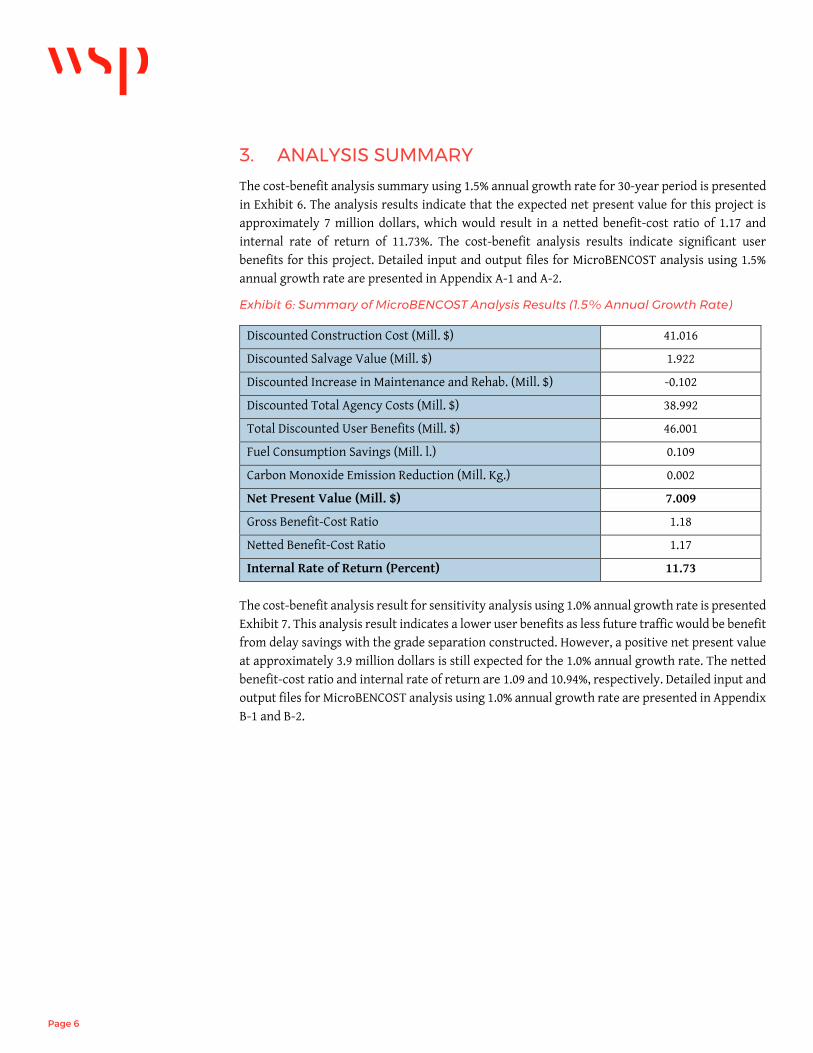
3. ANALYSIS SUMMARY
The cost-benefit analysis summary using 1.5% annual growth rate for 30-year period is presented in Exhibit 6. The analysis results indicate that the expected net present value for this project is approximately 7 million dollars, which would result in a netted benefit-cost ratio of 1.17 and internal rate of return of 11.73%. The cost-benefit analysis results indicate significant user benefits for this project. Detailed input and output files for MicroBENCOST analysis using 1.5% annual growth rate are presented in Appendix A-1 and A-2.
Exhibit 6: Summary of MicroBENCOST Analysis Results (1.5% Annual Growth Rate)
Discounted Construction Cost (Mill. $) 41.016
Discounted Salvage Value (Mill. $) 1.922
Discounted Increase in Maintenance and Rehab. (Mill. $) -0.102
Discounted Total Agency Costs (Mill. $) 38.992
Total Discounted User Benefits (Mill. $) 46.001
Fuel Consumption Savings (Mill. l.) 0.109
Carbon Monoxide Emission Reduction (Mill. Kg.) 0.002
Net Present Value (Mill. $) 7.009
Gross Benefit-Cost Ratio 1.18
Netted Benefit-Cost Ratio 1.17
Internal Rate of Return (Percent) 11.73
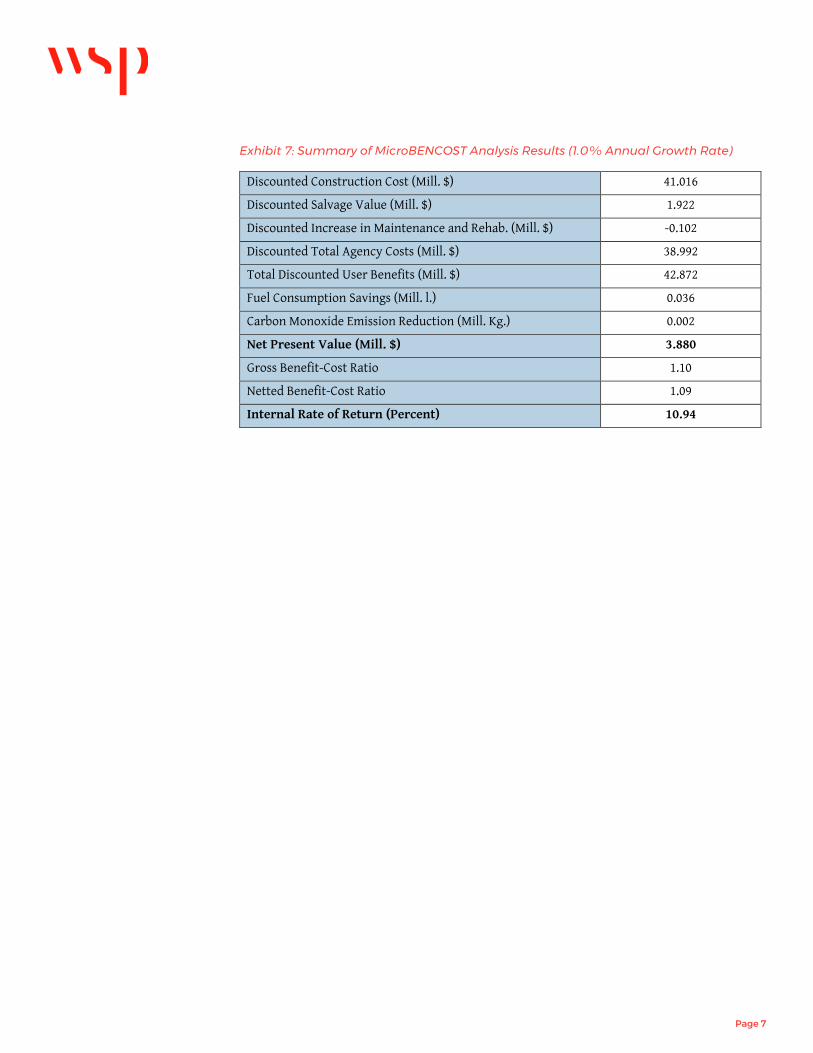
The cost-benefit analysis result for sensitivity analysis using 1.0% annual growth rate is presented Exhibit 7. This analysis result indicates a lower user benefits as less future traffic would be benefit from delay savings with the grade separation constructed. However, a positive net present value at approximately 3.9 million dollars is still expected for the 1.0% annual growth rate. The netted benefit-cost ratio and internal rate of return are 1.09 and 10.94%, respectively. Detailed input and output files for MicroBENCOST analysis using 1.0% annual growth rate are presented in Appendix B-1 and B-2.
Page 7
Exhibit 7: Summary of MicroBENCOST Analysis Results (1.0% Annual Growth Rate)
Discounted Construction Cost (Mill. $) 41.016
Discounted Salvage Value (Mill. $) 1.922
Discounted Increase in Maintenance and Rehab. (Mill. $) -0.102
Discounted Total Agency Costs (Mill. $) 38.992
Total Discounted User Benefits (Mill. $) 42.872
Fuel Consumption Savings (Mill. l.) 0.036
Carbon Monoxide Emission Reduction (Mill. Kg.) 0.002
Net Present Value (Mill. $) 3.880
Gross Benefit-Cost Ratio 1.10
Netted Benefit-Cost Ratio 1.09
Internal Rate of Return (Percent) 10.94

Appendix 3RENDERINGS
Ad
elai
de
Str
eet U
nder
pas
s A
ctiv
e Tr
ansp
ort
atio
n C
onn
ectio
ns |
Ren
deri
ngs
1
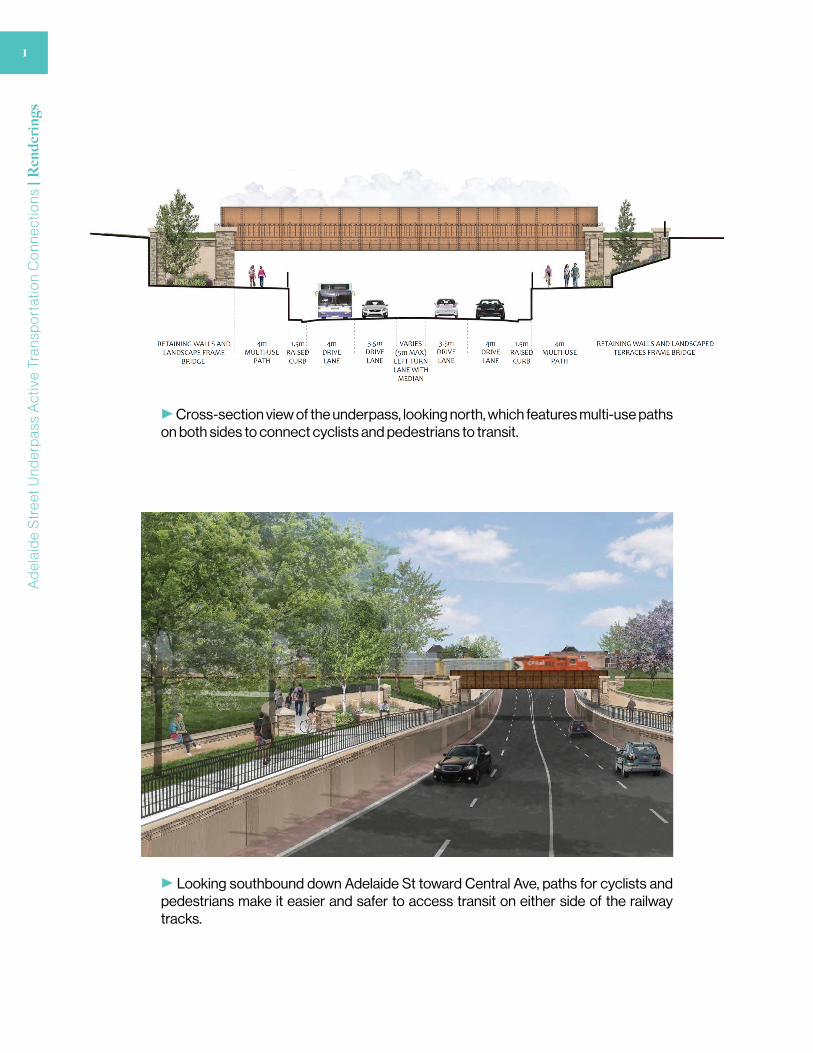
u Looking southbound down Adelaide St toward Central Ave, paths for cyclists and pedestrians make it easier and safer to access transit on either side of the railway tracks.
u Cross-section view of the underpass, looking north, which features multi-use paths on both sides to connect cyclists and pedestrians to transit.
Lond
on
Can
ada
| L
ondo
n.ca
2
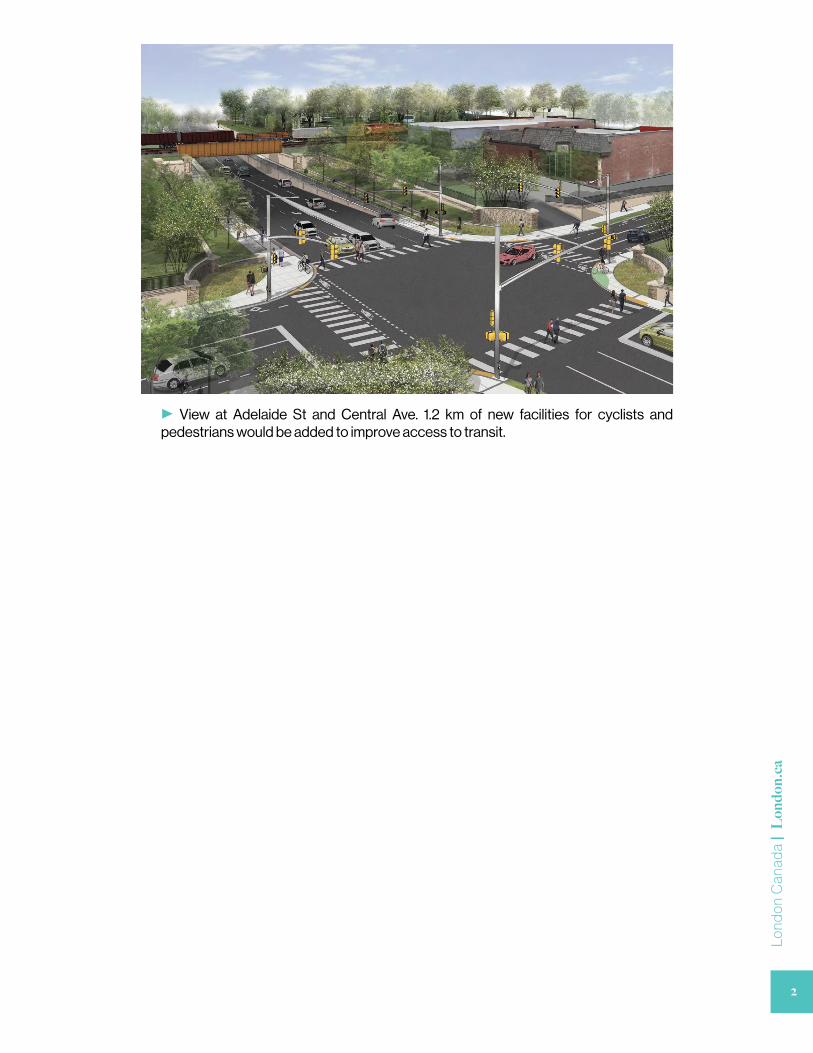
u View at Adelaide St and Central Ave. 1.2 km of new facilities for cyclists and pedestrians would be added to improve access to transit.
Accessibility
Alternate formats of this document are available upon request. Contact accessibil [email protected]
City of London
300 Dufferin Avenue London Ontario PO BOX 5035 N6A 4L9
Tel: 519-661-CITY (2489)London.ca