
Addressing Health Risk Factors
48
. ed erv es r ts gh i r l l A e. v ati ti Ini es Hom th y l Hea & n ee G r 6 01 ©2 . ed erv es r ts gh i r l l A e. v ati ti Ini es Hom th y l Hea & n ee G r 5 01 ©2 ©2017 Green & Healthy Homes Initiative. All rights reserved. Value-Based Purchasing Bootcamp Addressing Health Risk Factors An Overview and Roadmap 10 October 2017
Transcript of Addressing Health Risk Factors
.
ed
erv
es rtsghi rll A
e. vati tiIni
es
Hom
thy l
Hea& neeGr 601©2
.
ed
erv
es rtsghi rll A
e. vati tiIni
es
Hom
thy l
Hea& neeGr 501©2
©2017
Gre
en
&H
ealthy
Hom
es
Initia
tive.
All
rights
reserv
ed
.
Value-Based Purchasing Bootcamp
Addressing Health Risk FactorsAn Overview and Roadmap
10 October 2017
Presenter Bio
Ruth Ann Norton | President & CEO
Green & Healthy Homes Initiative
(o) +1.410.534.6477 | [email protected]
Ruth Ann Norton, President and CEO of the Green & Healthy Homes Initiative, is
an expert on health-based housing program design. Ms. Norton leads GHHI’s
ground breaking work in over 30 US cities that uses housing as a platform for
improved health, economic and social outcomes. The architect of Maryland’s 98%
reduction in childhood lead poisoning, she has led the development of numerous
action plans including GHHI’s 5 year national Strategic Plan to End Lead
Poisoning –A Blueprint for Action (2016) and a lead elimination plan for New
Jersey (2017). She has authored 35 pieces of healthy housing legislation, served
as a contributor to similar strategic plans for Pew Charitable Trust and the Center
for Healthy Housing.
Ms. Norton has crafted numerous policy initiatives with a focus on advancing the
role of the Medicaid, energy efficiency, education and philanthropic sectors as
investors in healthy housing.An economist by training, Ms. Norton led GHHI to
establish its cost benefit analysis practice to demonstrate the business case for
scaling interventions that create healthy, safe and energy efficient
housing. Honored by the Maryland AAP with its advocacy award, Ms. Norton
served as a liaison for the CDC Advisory Committee on Lead Poisoning
Prevention and was selected a Robert Wood Johnson Community Health Leader
and Weinberg Foundation Fellow.
© www.ghhi.org | 2
Presenter Bio
Andrew E Olson | Social innovation Specialist
Green & Healthy Homes Initiative
(m) +1.202.207.6817 | [email protected]
Andrew and avid dog-lover and recreational sport enthusiast, who’s favorite type
of animal is the non-bear bear.
His work includes health-policy planning and analysis, advanced economic and
financial modeling, conducting state-wide medical claims analysis with predictive
modeling, and publishing over a dozen works on public health including topics
related to sustainable funding to address the social determinants of health through
value-based purchasing, the economic dynamics of insurance markets, and
innovative financing mechanisms such as Pay for Success..
He is an energetic and passionate former consultant specializing in areas of
management, health care, finance, technology, and economic development. He
currently holds six academic degrees or certifications in philosophy, psychology,
foreign policy, international economic relations, business, and finance.
© www.ghhi.org | 3
© www.ghhi.org | 4Source(s): GHHI
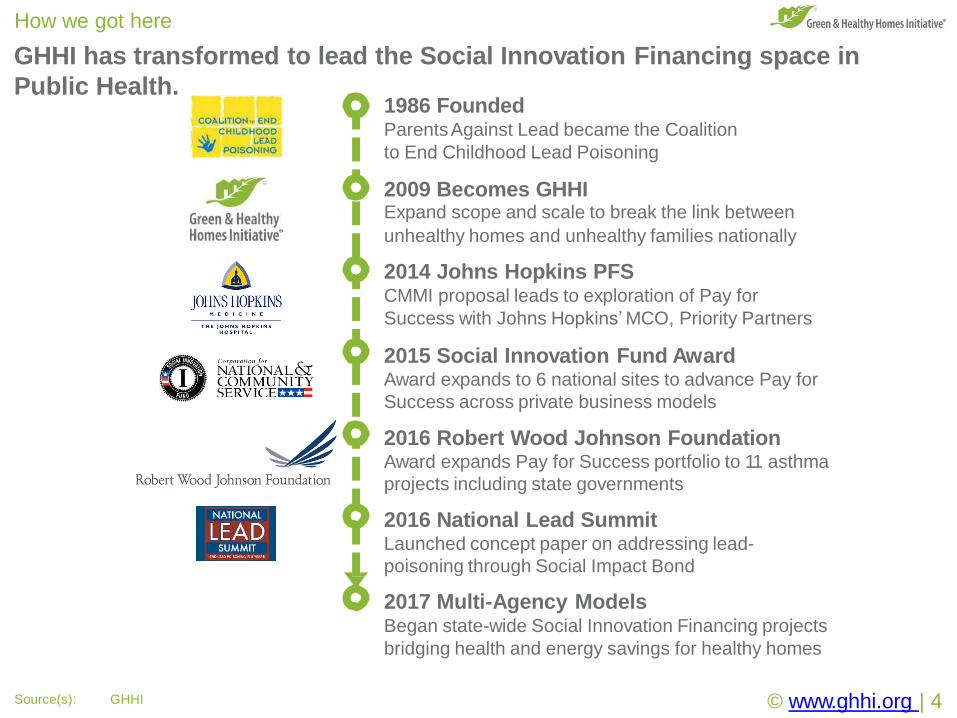
GHHI has transformed to lead the Social Innovation Financing space in
Public Health.
How we got here
1986 FoundedParentsAgainst Lead became the Coalition
to End Childhood Lead Poisoning
2009 Becomes GHHIExpand scope and scale to break the link between
unhealthy homes and unhealthy families nationally
2014 Johns Hopkins PFSCMMI proposal leads to exploration of Pay for
Success with Johns Hopkins’MCO, Priority Partners
2015 Social Innovation Fund AwardAward expands to 6 national sites to advance Pay for
Success across private business models
2016 Robert Wood Johnson FoundationAward expands Pay for Success portfolio to 11 asthma
projects including state governments
2016 National Lead SummitLaunched concept paper on addressing lead-
poisoning through Social Impact Bond
2017 Multi-Agency ModelsBegan state-wide Social Innovation Financing projects
bridging health and energy savings for healthy homes
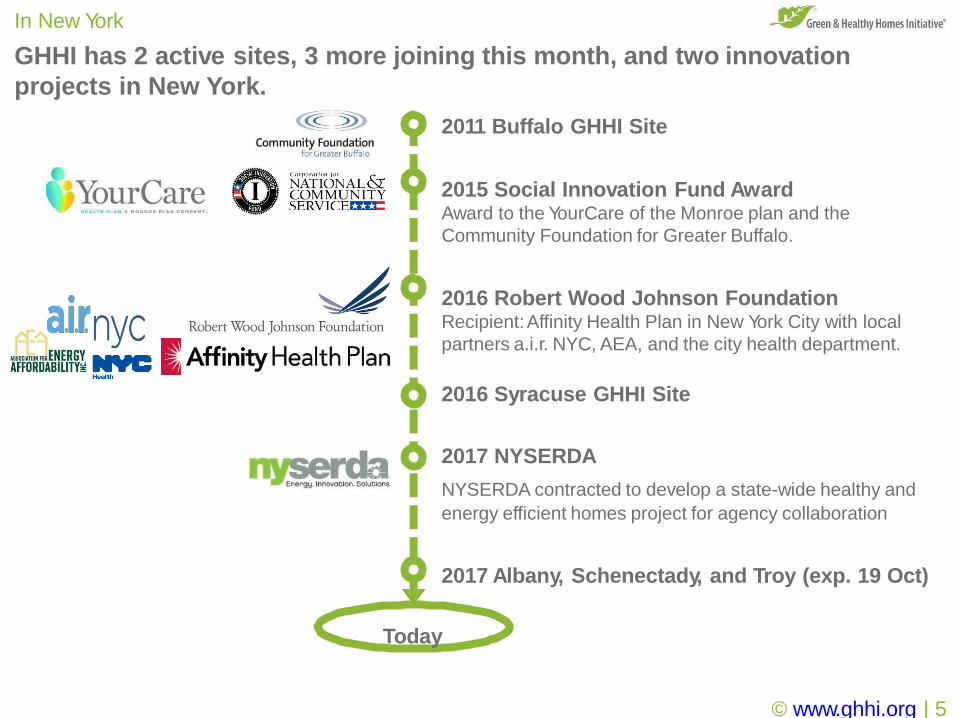
2011 Buffalo GHHI Site
2015 Social Innovation Fund AwardAward to the YourCare of the Monroe plan and the
Community Foundation for Greater Buffalo.
2016 Robert Wood Johnson FoundationRecipient:Affinity Health Plan in New York City with local
partners a.i.r. NYC, AEA, and the city health department.
2016 Syracuse GHHI Site
2017 NYSERDA
NYSERDA contracted to develop a state-wide healthy and
energy efficient homes project for agency collaboration
2017 Albany, Schenectady, and Troy (exp. 19 Oct)
Today
© www.ghhi.org | 5
GHHI has 2 active sites, 3 more joining this month, and two innovation
projects in New York.
In New York
© www.ghhi.org | 6Source(s): GHHI
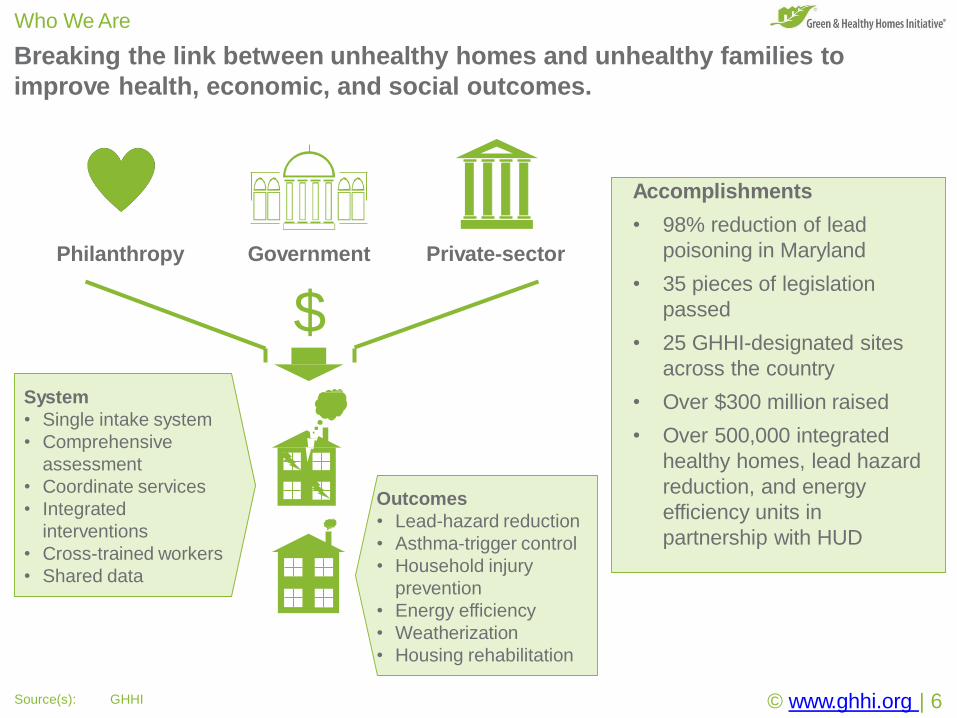
Breaking the link between unhealthy homes and unhealthy families to
improve health, economic, and social outcomes.
Who We Are
Accomplishments
• 98% reduction of lead
poisoning in Maryland
• 35 pieces of legislation
passed
• 25 GHHI-designated sites
across the country
• Over $300 million raised
• Over 500,000 integrated
healthy homes, lead hazard
reduction, and energy
efficiency units in
partnership with HUD
Philanthropy Government
$
Private-sector
System
• Single intake system
• Comprehensive
assessment
• Coordinate services
• Integrated
interventions
• Cross-trained workers
• Shared data
Outcomes
• Lead-hazard reduction
• Asthma-trigger control
• Household injury
prevention
• Energy efficiency
• Weatherization
• Housing rehabilitation
© www.ghhi.org | 7
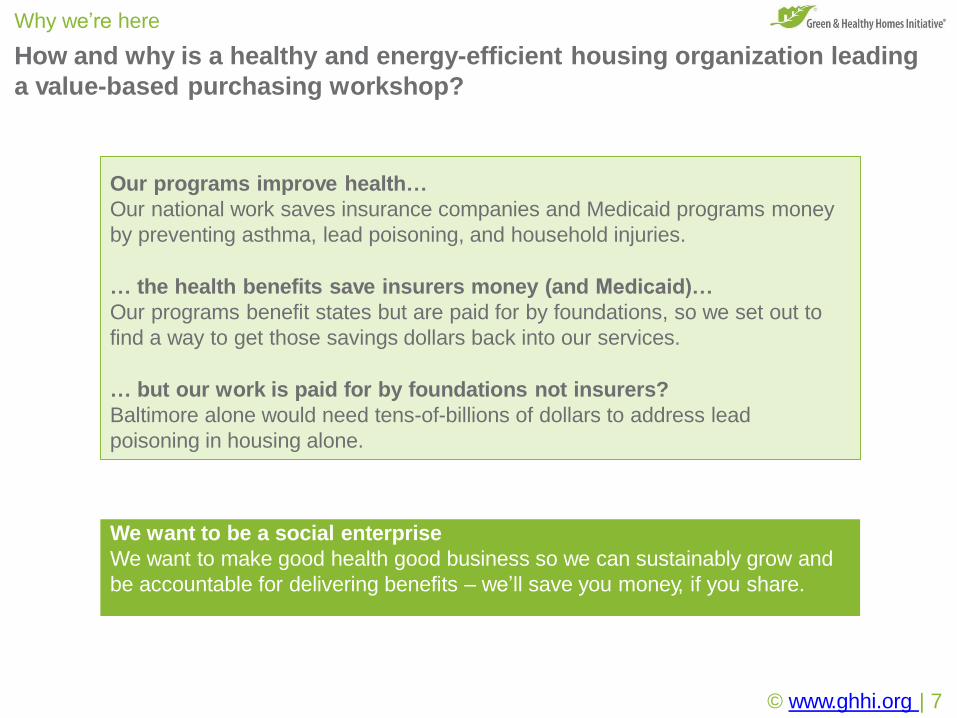
How and why is a healthy and energy-efficient housing organization leading
a value-based purchasing workshop?
Why we’re here
Our programs improve health…
Our national work saves insurance companies and Medicaid programs money
by preventing asthma, lead poisoning, and household injuries.
… the health benefits save insurers money (and Medicaid)…
Our programs benefit states but are paid for by foundations, so we set out to
find a way to get those savings dollars back into our services.
… but our work is paid for by foundations not insurers?
Baltimore alone would need tens-of-billions of dollars to address lead
poisoning in housing alone.
We want to be a social enterprise
We want to make good health good business so we can sustainably grow and
be accountable for delivering benefits – we’ll save you money, if you share.
© www.ghhi.org | 8
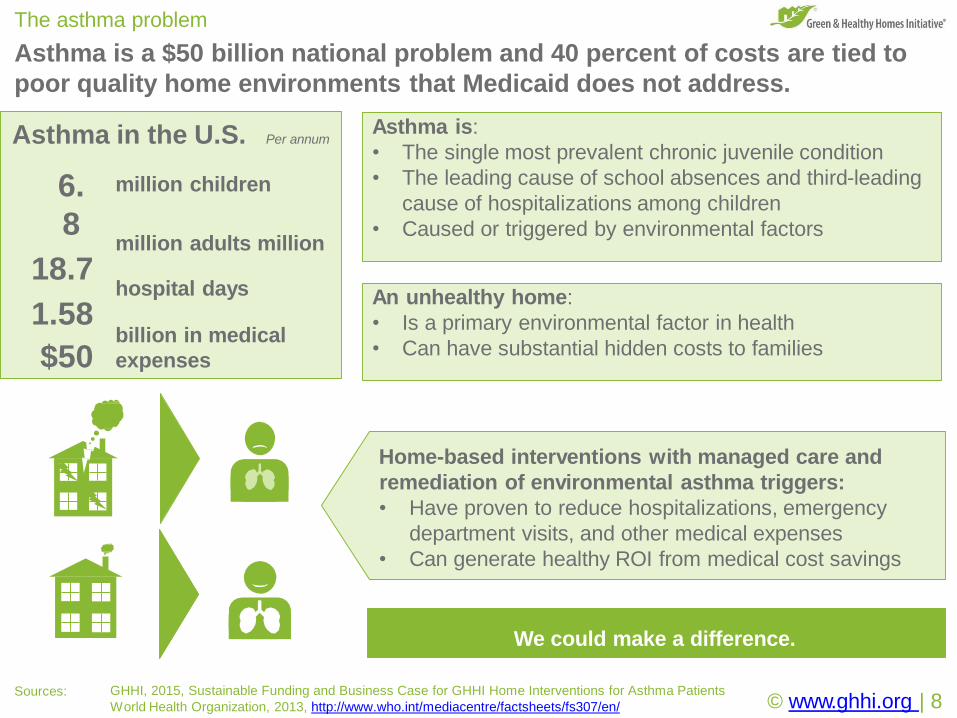
The asthma problem
Asthma is a $50 billion national problem and 40 percent of costs are tied to
poor quality home environments that Medicaid does not address.
Sources: GHHI, 2015, Sustainable Funding and Business Case for GHHI Home Interventions for Asthma Patients
World Health Organization, 2013, http://www.who.int/mediacentre/factsheets/fs307/en/
Asthma is:
• The single most prevalent chronic juvenile condition
• The leading cause of school absences and third-leading
cause of hospitalizations among children
• Caused or triggered by environmental factors
An unhealthy home:
• Is a primary environmental factor in health
• Can have substantial hidden costs to families
Home-based interventions with managed care and
remediation of environmental asthma triggers:
• Have proven to reduce hospitalizations, emergency
department visits, and other medical expenses
• Can generate healthy ROI from medical cost savings
We could make a difference.
6.
8
18.7
1.58
$50
million children
million adults million
hospital days
billion in medical
expenses
Asthma in the U.S. Per annum
© www.ghhi.org | 9
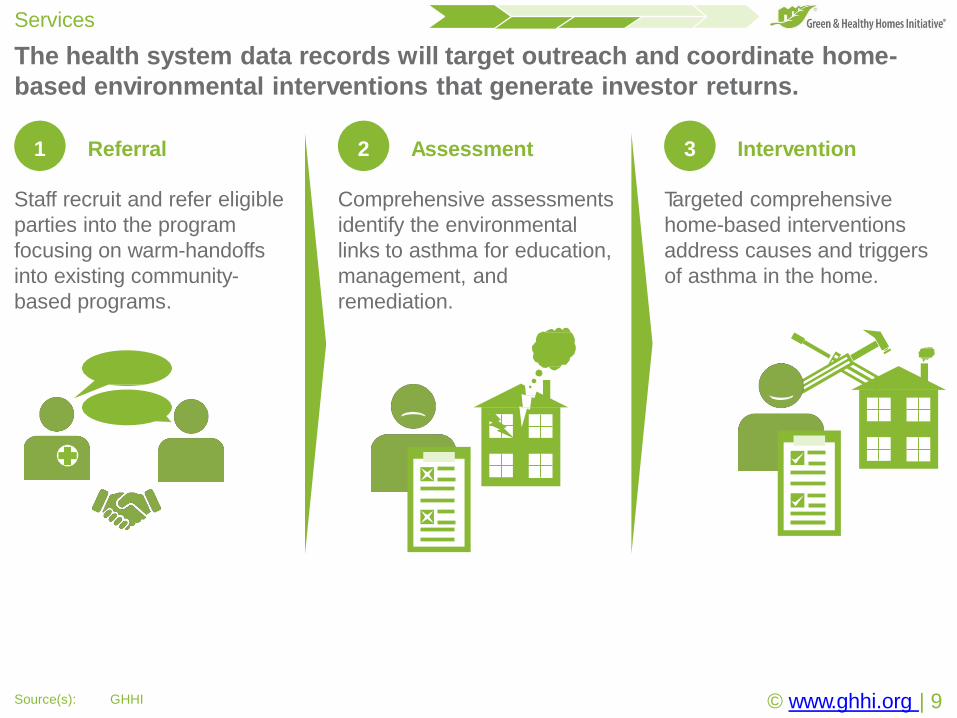
The health system data records will target outreach and coordinate home-
based environmental interventions that generate investor returns.
Services
Source(s): GHHI
2 Assessment
Comprehensive assessments
identify the environmental
links to asthma for education,
management, and
remediation.
1 Referral
Staff recruit and refer eligible
parties into the program
focusing on warm-handoffs
into existing community-
based programs.
3 Intervention
Targeted comprehensive
home-based interventions
address causes and triggers
of asthma in the home.
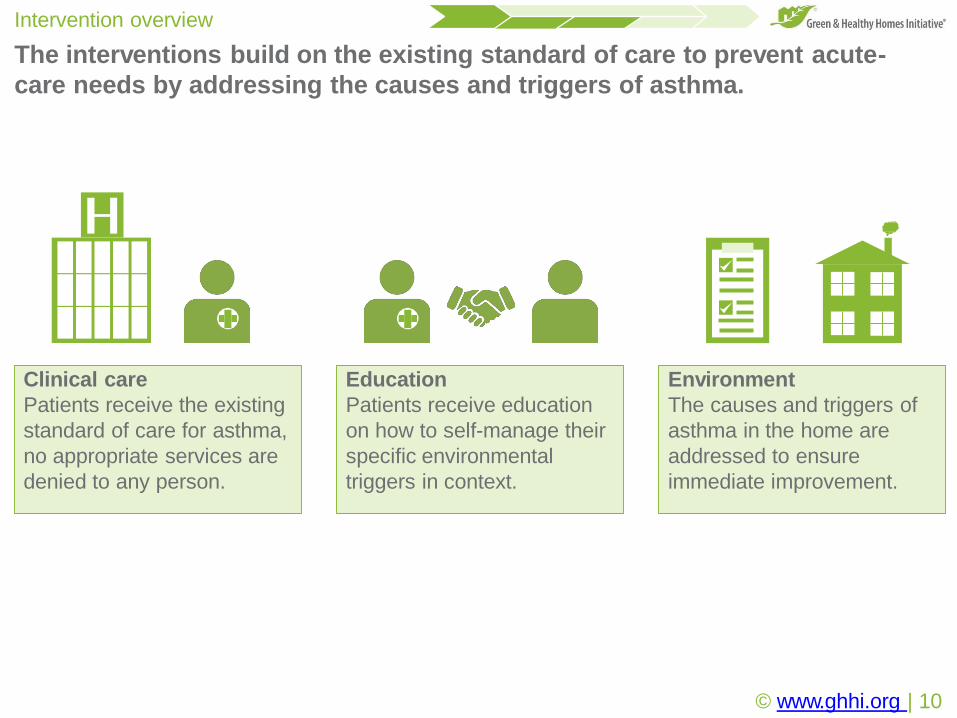
The interventions build on the existing standard of care to prevent acute-
care needs by addressing the causes and triggers of asthma.
Intervention overview
Clinical care
Patients receive the existing
standard of care for asthma,
no appropriate services are
denied to any person.
Education
Patients receive education
on how to self-manage their
specific environmental
triggers in context.
Environment
The causes and triggers of
asthma in the home are
addressed to ensure
immediate improvement.
© www.ghhi.org | 10
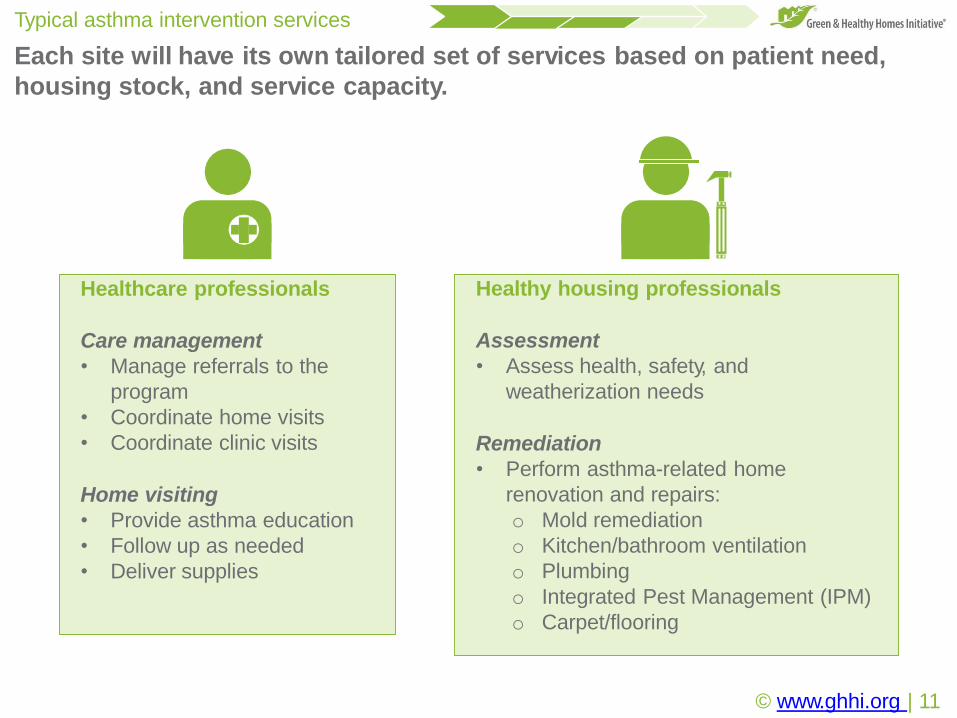
Each site will have its own tailored set of services based on patient need,
housing stock, and service capacity.
Typical asthma intervention services
Healthcare professionals
Care management
• Manage referrals to the
program
• Coordinate home visits
• Coordinate clinic visits
Home visiting
• Provide asthma education
• Follow up as needed
• Deliver supplies
Healthy housing professionals
Assessment
• Assess health, safety, and
weatherization needs
Remediation
• Perform asthma-related home
renovation and repairs:
o Mold remediation
o Kitchen/bathroom ventilation
o Plumbing
o Integrated Pest Management (IPM)
o Carpet/flooring
© www.ghhi.org | 11
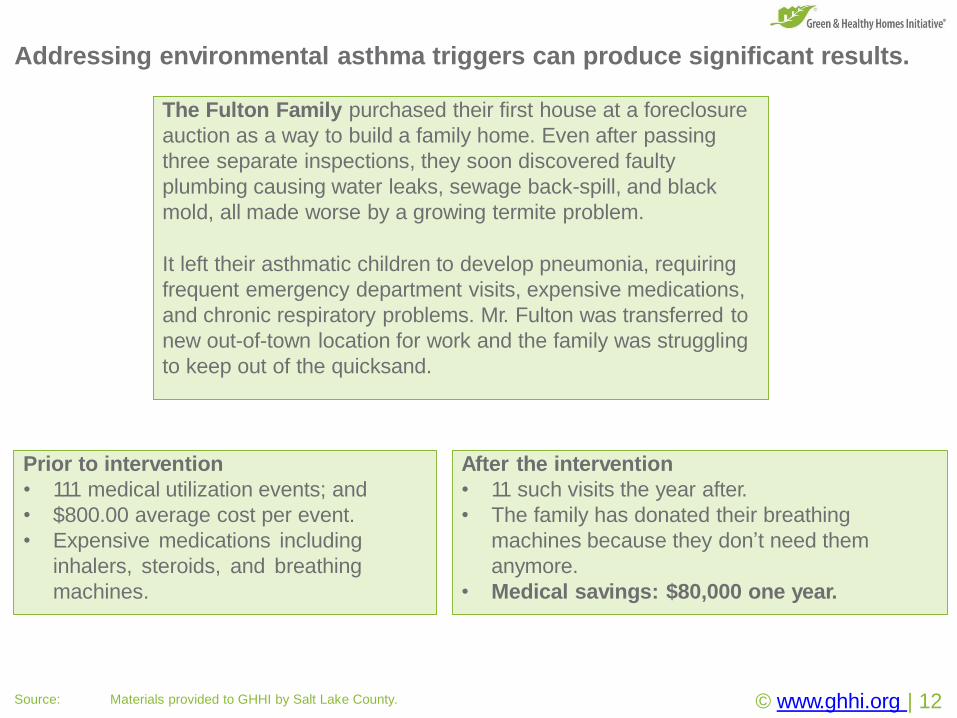
Addressing environmental asthma triggers can produce significant results.
© www.ghhi.org | 12Source: Materials provided to GHHI by Salt Lake County.
The Fulton Family purchased their first house at a foreclosure
auction as a way to build a family home. Even after passing
three separate inspections, they soon discovered faulty
plumbing causing water leaks, sewage back-spill, and black
mold, all made worse by a growing termite problem.
It left their asthmatic children to develop pneumonia, requiring
frequent emergency department visits, expensive medications,
and chronic respiratory problems. Mr. Fulton was transferred to
new out-of-town location for work and the family was struggling
to keep out of the quicksand.
Prior to intervention
• 111 medical utilization events; and
• $800.00 average cost per event.
• Expensive medications including
inhalers, steroids, and breathing
machines.
After the intervention
• 11 such visits the year after.
• The family has donated their breathing
machines because they don’t need them
anymore.
• Medical savings: $80,000 one year.
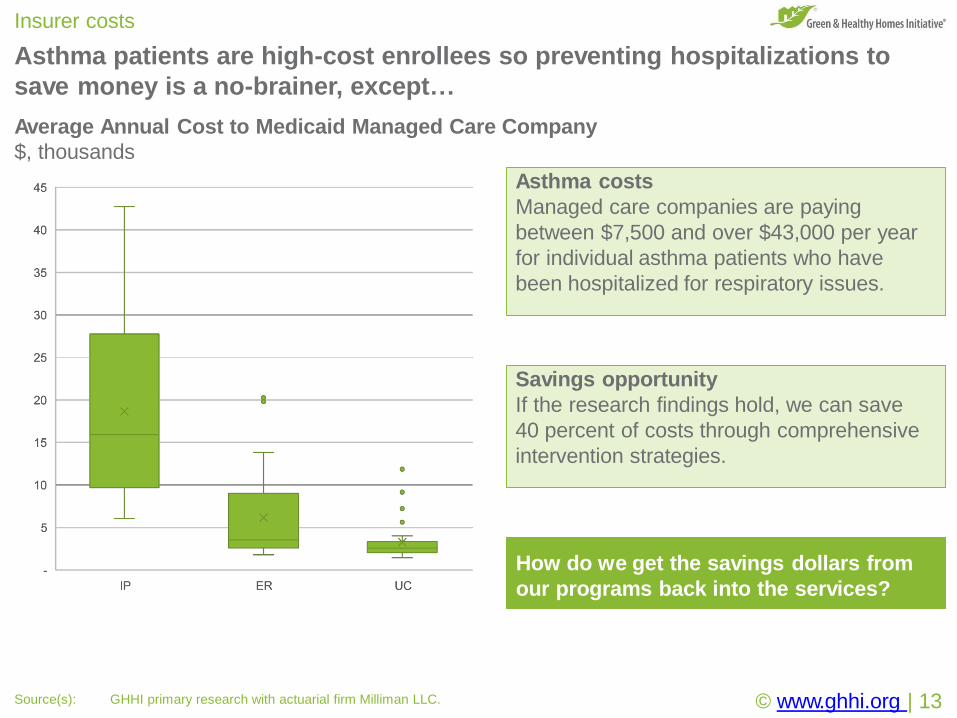
Asthma patients are high-cost enrollees so preventing hospitalizations to
save money is a no-brainer, except…
Insurer costs
Asthma costs
Managed care companies are paying
between $7,500 and over $43,000 per year
for individual asthma patients who have
been hospitalized for respiratory issues.
Average Annual Cost to Medicaid Managed Care Company
$, thousands
Savings opportunity
If the research findings hold, we can save
40 percent of costs through comprehensive
intervention strategies.
How do we get the savings dollars from
our programs back into the services?
© www.ghhi.org | 13Source(s): GHHI primary research with actuarial firm Milliman LLC.
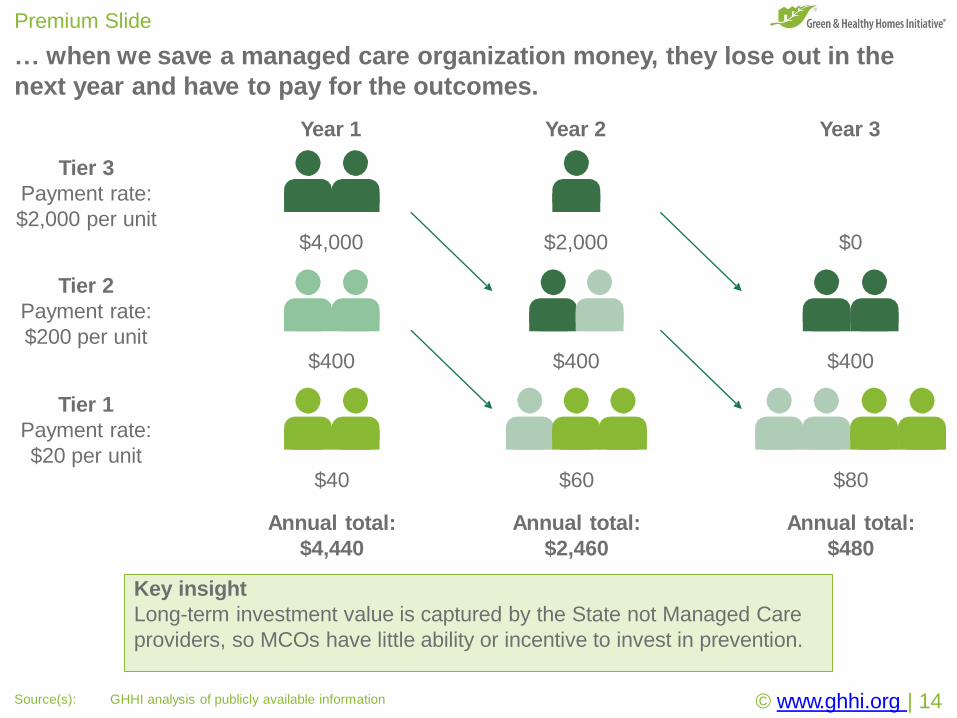
… when we save a managed care organization money, they lose out in the
next year and have to pay for the outcomes.
Premium Slide
$40
Annual total:
$4,440
$60
Annual total:
$2,460
$80
Annual total:
$480
Tier 2
Payment rate:
$200 per unit$400 $400 $400
Tier 1
Payment rate:
$20 per unit
Year 1 Year 2 Year 3
Tier 3
Payment rate:
$2,000 per unit
© www.ghhi.org | 14Source(s): GHHI analysis of publicly available information
$4,000 $2,000 $0
Key insight
Long-term investment value is captured by the State not Managed Care
providers, so MCOs have little ability or incentive to invest in prevention.
.
ed
erv
es rtsghi rll A
e. vati tiIni
es
Hom
thy l
Hea& neeGr 601©2
.
ed
erv
es rtsghi rll A
e. vati tiIni
es
Hom
thy l
Hea& neeGr 501©2
©2017
Gre
en
&H
ealthy
Hom
es
Initia
tive.
All
rights
reserv
ed
.
Paying for Value
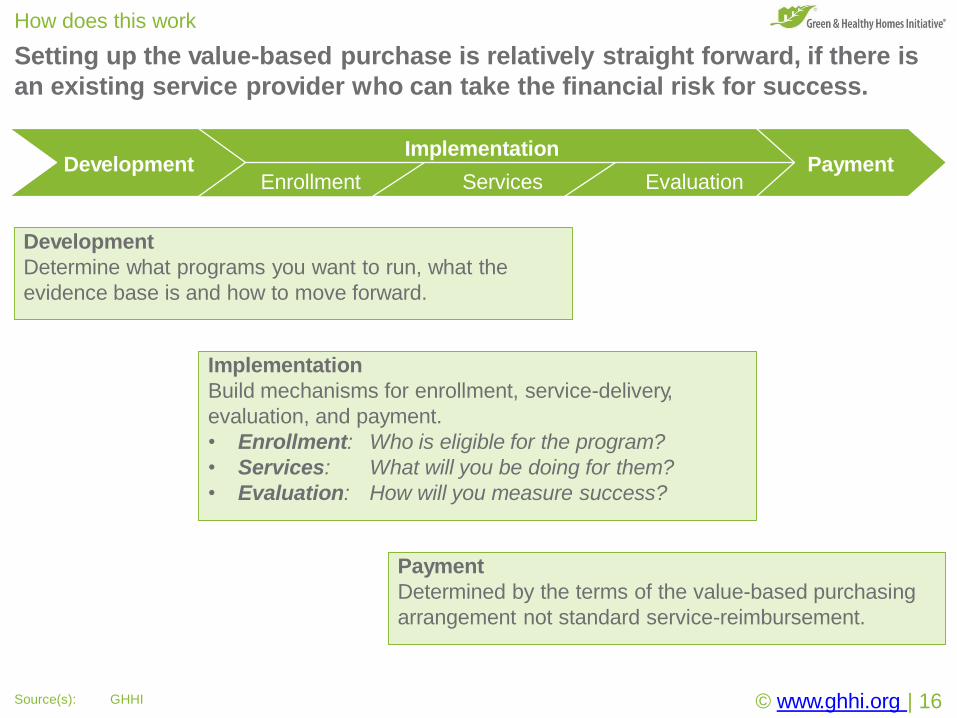
Setting up the value-based purchase is relatively straight forward, if there is
an existing service provider who can take the financial risk for success.
How does this work
Enrollment Services Evaluation
ImplementationPaymentDevelopment
© www.ghhi.org | 16Source(s): GHHI
Development
Determine what programs you want to run, what the
evidence base is and how to move forward.
Implementation
Build mechanisms for enrollment, service-delivery,
evaluation, and payment.
• Enrollment: Who is eligible for the program?
• Services: What will you be doing for them?
• Evaluation: How will you measure success?
Payment
Determined by the terms of the value-based purchasing
arrangement not standard service-reimbursement.
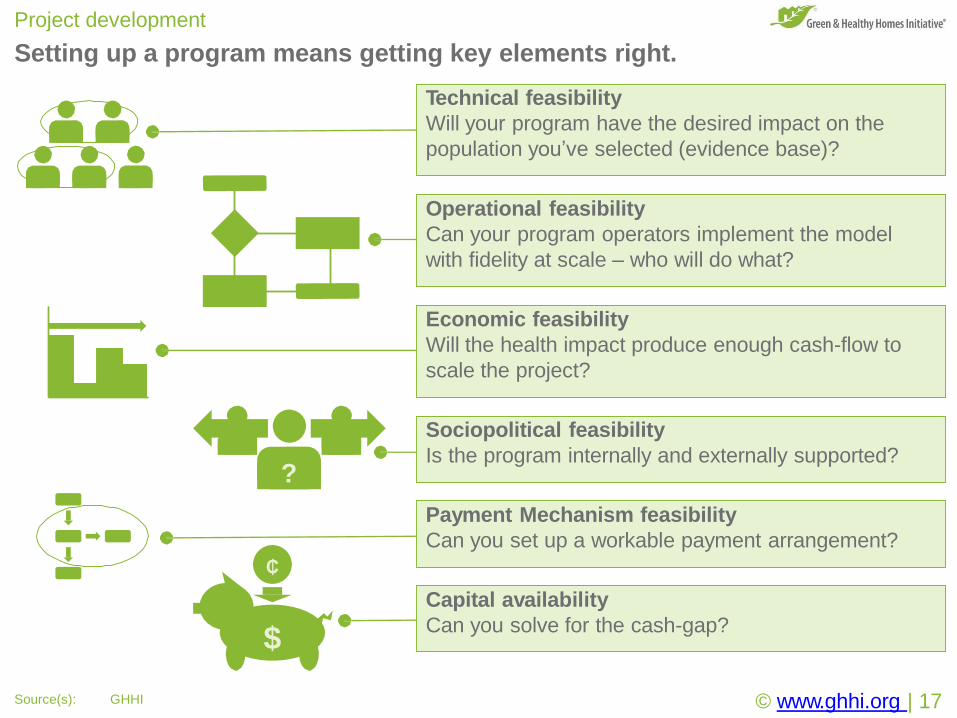
Project development
Setting up a program means getting key elements right.
Technical feasibility
Will your program have the desired impact on the
population you’ve selected (evidence base)?
Operational feasibility
Can your program operators implement the model
with fidelity at scale – who will do what?
Economic feasibility
Will the health impact produce enough cash-flow to
scale the project?
Sociopolitical feasibility
Is the program internally and externally supported?
Payment Mechanism feasibility
Can you set up a workable payment arrangement?
Capital availability
Can you solve for the cash-gap?
?
$
₵
© www.ghhi.org | 17Source(s): GHHI
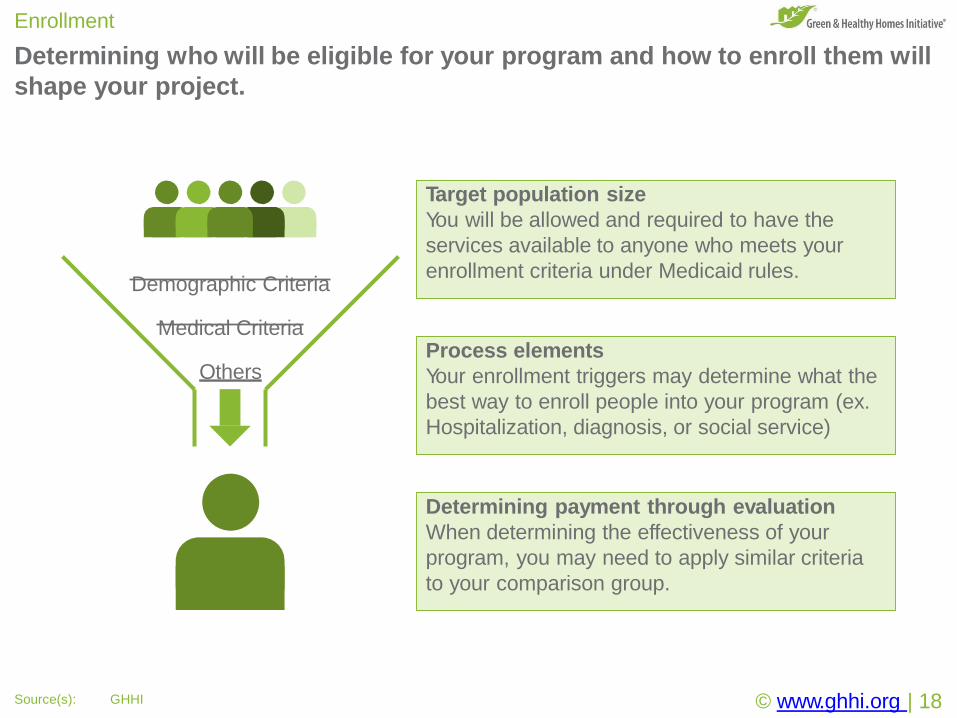
Determining who will be eligible for your program and how to enroll them will
shape your project.
Enrollment
Demographic Criteria
Medical Criteria
Others
Target population size
You will be allowed and required to have the
services available to anyone who meets your
enrollment criteria under Medicaid rules.
© www.ghhi.org | 18Source(s): GHHI
Process elements
Your enrollment triggers may determine what the
best way to enroll people into your program (ex.
Hospitalization, diagnosis, or social service)
Determining payment through evaluation
When determining the effectiveness of your
program, you may need to apply similar criteria
to your comparison group.
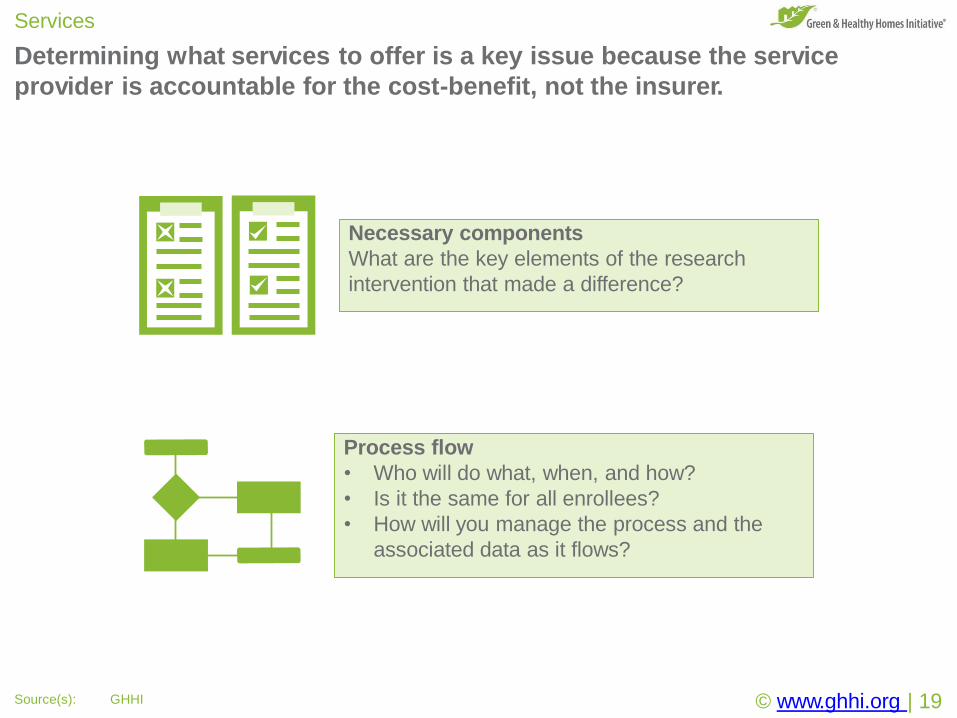
Determining what services to offer is a key issue because the service
provider is accountable for the cost-benefit, not the insurer.
Services
Process flow
• Who will do what, when, and how?
• Is it the same for all enrollees?
• How will you manage the process and the
associated data as it flows?
Necessary components
What are the key elements of the research
intervention that made a difference?
© www.ghhi.org | 19Source(s): GHHI
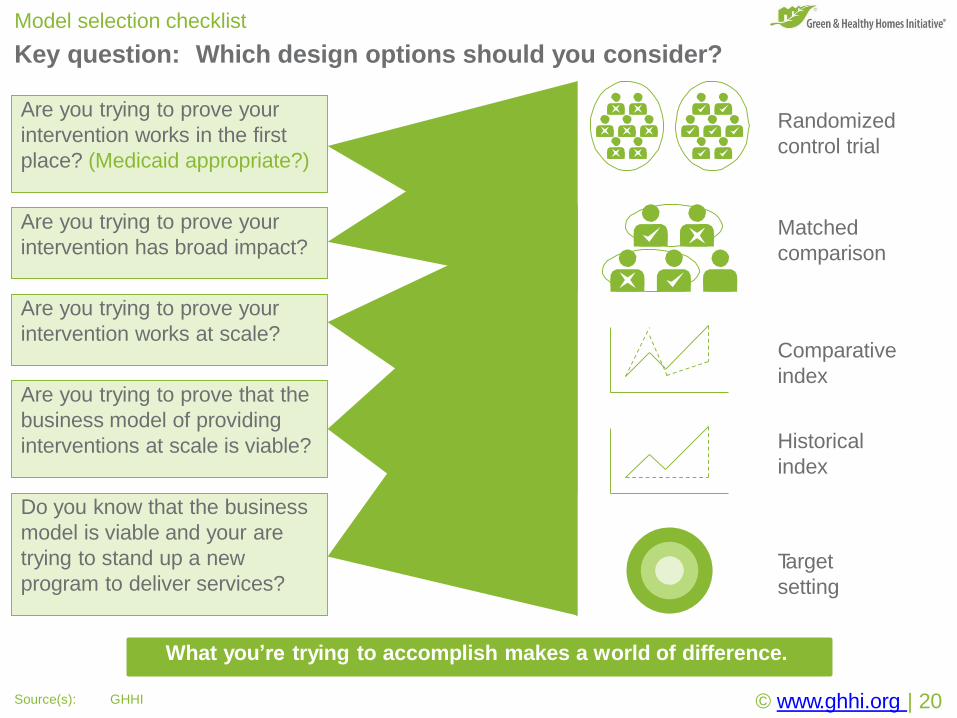
Key question: Which design options should you consider?
Model selection checklist
Are you trying to prove your
intervention works in the first
place? (Medicaid appropriate?)
Are you trying to prove your
intervention works at scale?
Are you trying to prove that the
business model of providing
interventions at scale is viable?
Do you know that the business
model is viable and your are
trying to stand up a new
program to deliver services?
Randomized
control trial
Matched
comparison
Comparative
index
Historical
index
Target
setting
What you’re trying to accomplish makes a world of difference.
Are you trying to prove your
intervention has broad impact?
© www.ghhi.org | 20Source(s): GHHI
.
ed
erv
es rtsghi rll A
e. vati tiIni
es
Hom
thy l
Hea& neeGr 601©2
.
ed
erv
es rtsghi rll A
e. vati tiIni
es
Hom
thy l
Hea& neeGr 501©2
©2017
Gre
en
&H
ealthy
Hom
es
Initia
tive.
All
rights
reserv
ed
.
Example Project: GHHI Asthma Cohort
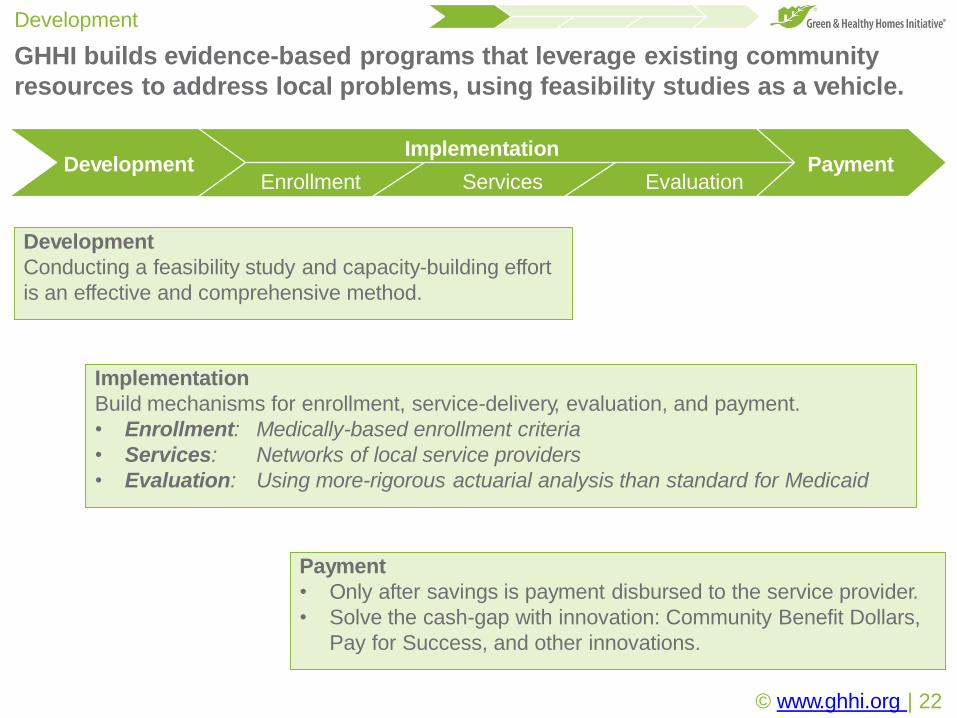
GHHI builds evidence-based programs that leverage existing community
resources to address local problems, using feasibility studies as a vehicle.
Development
Enrollment Services Evaluation
ImplementationPaymentDevelopment
© www.ghhi.org | 22
Development
Conducting a feasibility study and capacity-building effort
is an effective and comprehensive method.
Implementation
Build mechanisms for enrollment, service-delivery, evaluation, and payment.
• Enrollment: Medically-based enrollment criteria
• Services: Networks of local service providers
• Evaluation: Using more-rigorous actuarial analysis than standard for Medicaid
Payment
• Only after savings is payment disbursed to the service provider.
• Solve the cash-gap with innovation: Community Benefit Dollars,
Pay for Success, and other innovations.
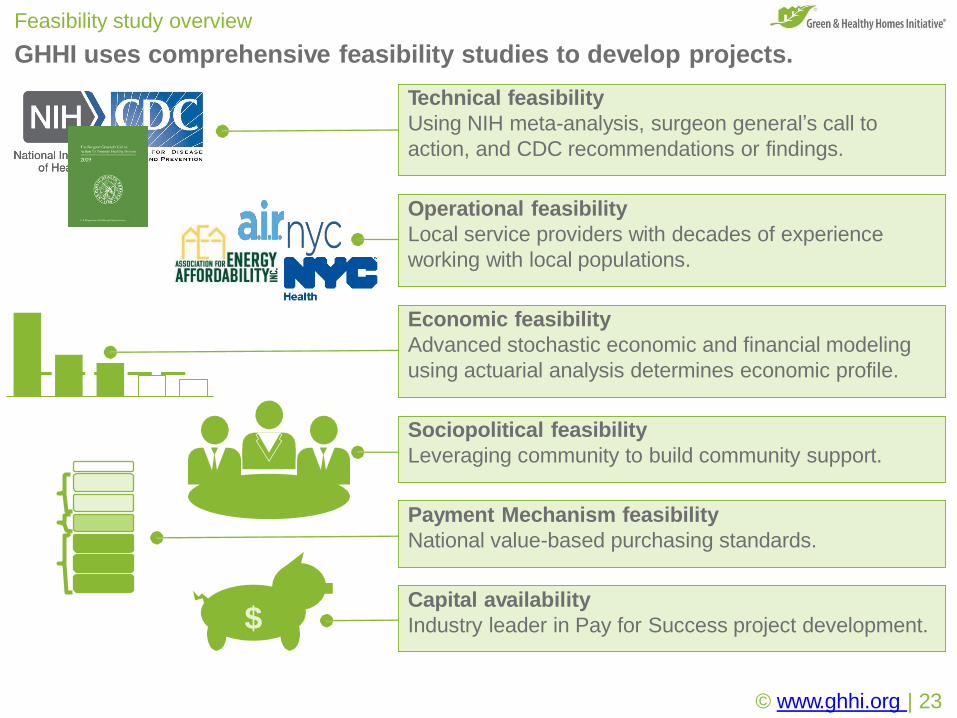
GHHI uses comprehensive feasibility studies to develop projects.
Feasibility study overview
Technical feasibility
Using NIH meta-analysis, surgeon general’s call to
action, and CDC recommendations or findings.
Operational feasibility
Local service providers with decades of experience
working with local populations.
Economic feasibility
Advanced stochastic economic and financial modeling
using actuarial analysis determines economic profile.
Sociopolitical feasibility
Leveraging community to build community support.
Payment Mechanism feasibility
National value-based purchasing standards.
Capital availability
Industry leader in Pay for Success project development.$
© www.ghhi.org | 23
© www.ghhi.org | 24
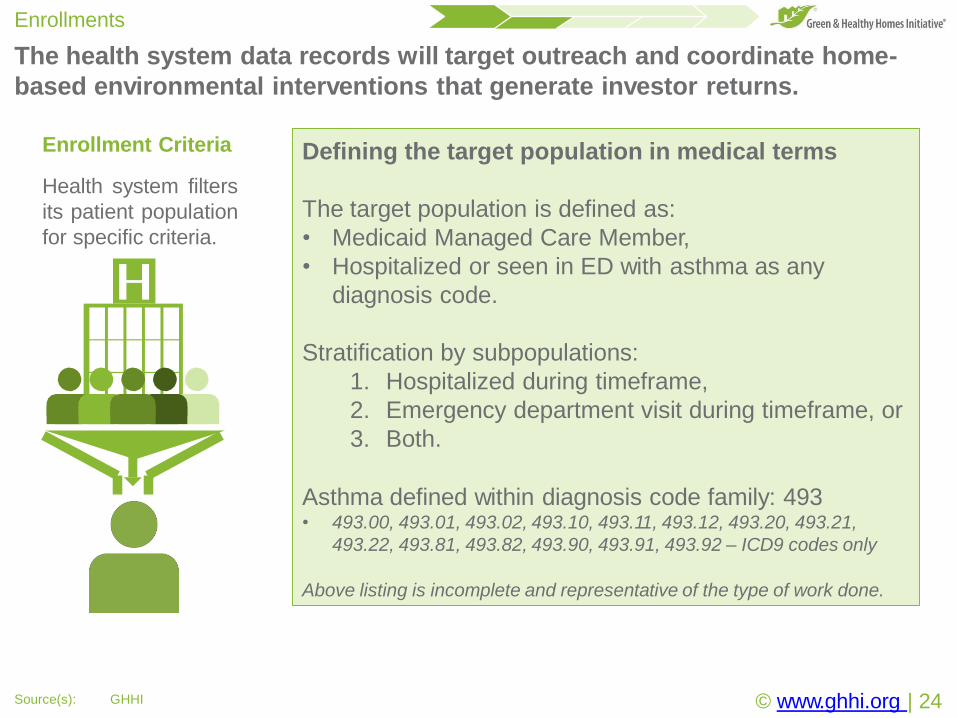
The health system data records will target outreach and coordinate home-
based environmental interventions that generate investor returns.
Enrollments
Source(s): GHHI
Enrollment Criteria
Health system filters
its patient population
for specific criteria.
Defining the target population in medical terms
The target population is defined as:
• Medicaid Managed Care Member,
• Hospitalized or seen in ED with asthma as any
diagnosis code.
Stratification by subpopulations:
1. Hospitalized during timeframe,
2. Emergency department visit during timeframe, or
3. Both.
Asthma defined within diagnosis code family: 493• 493.00, 493.01, 493.02, 493.10, 493.11, 493.12, 493.20, 493.21,
493.22, 493.81, 493.82, 493.90, 493.91, 493.92 – ICD9 codes only
Above listing is incomplete and representative of the type of work done.
© www.ghhi.org | 25
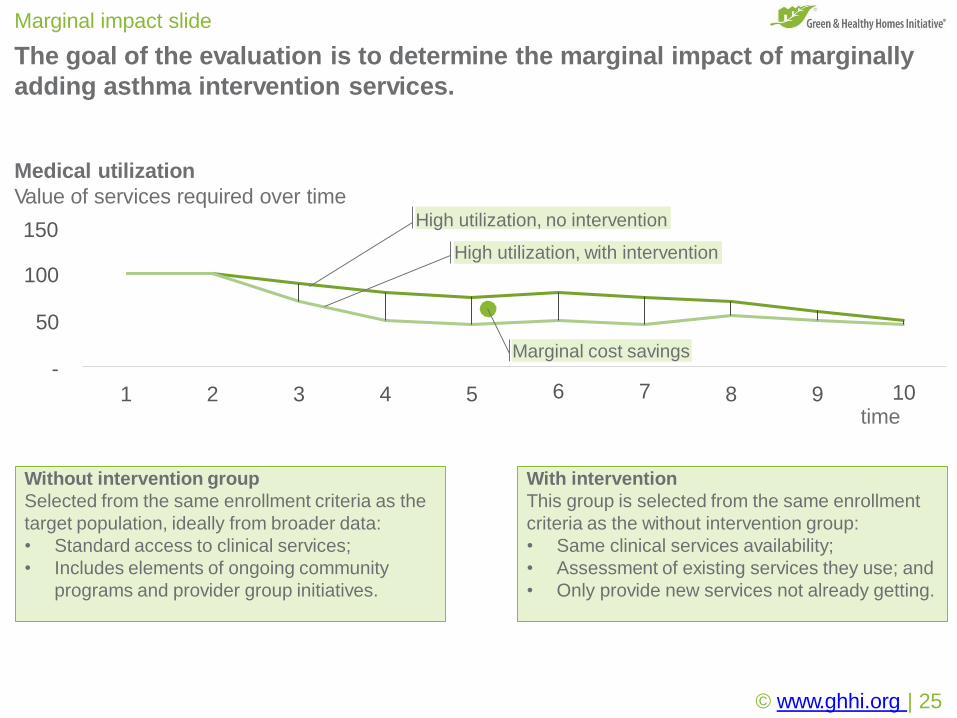
The goal of the evaluation is to determine the marginal impact of marginally
adding asthma intervention services.
Marginal impact slide
-
3 4 5 8 9 10time
High utilization, with intervention
100
50
Medical utilization
Value of services required over time
150
1 2
Marginal cost savings
6 7
High utilization, no intervention
Without intervention group
Selected from the same enrollment criteria as the
target population, ideally from broader data:
• Standard access to clinical services;
• Includes elements of ongoing community
programs and provider group initiatives.
With intervention
This group is selected from the same enrollment
criteria as the without intervention group:
• Same clinical services availability;
• Assessment of existing services they use; and
• Only provide new services not already getting.
© www.ghhi.org | 26
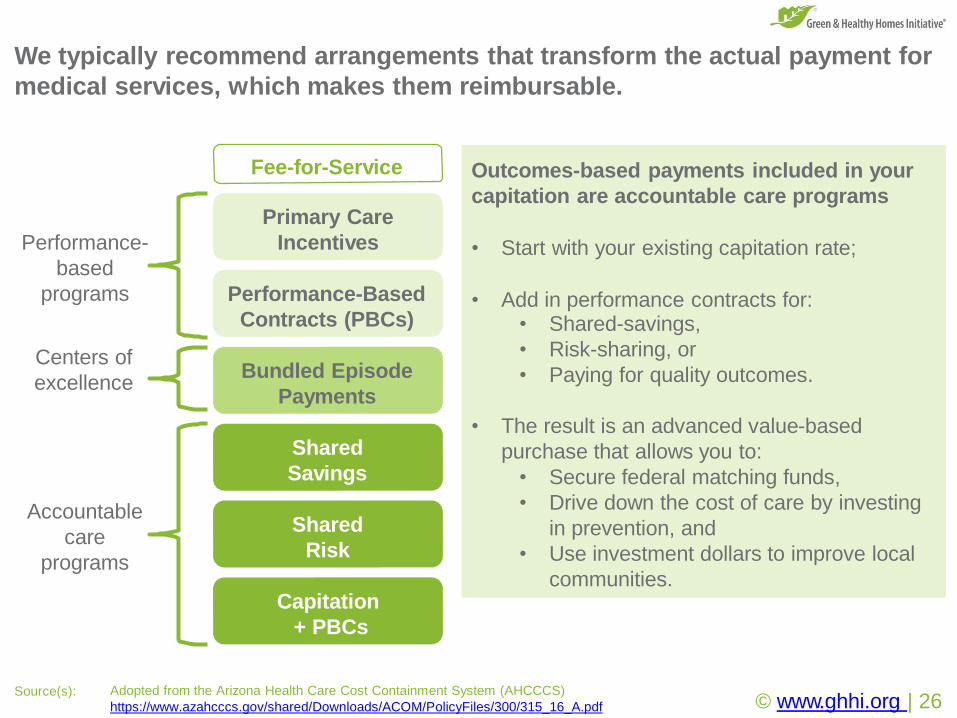
We typically recommend arrangements that transform the actual payment for
medical services, which makes them reimbursable.
Source(s): Adopted from the Arizona Health Care Cost Containment System (AHCCCS)
https://www.azahcccs.gov/shared/Downloads/ACOM/PolicyFiles/300/315_16_A.pdf
Fee-for-Service
Primary Care
Incentives
Performance-Based
Contracts (PBCs)
Bundled Episode
Payments
Shared
Savings
Shared
Risk
Capitation
+ PBCs
Performance-
based
programs
Accountable
care
programs
Centers of
excellence
Outcomes-based payments included in your
capitation are accountable care programs
• Start with your existing capitation rate;
• Add in performance contracts for:• Shared-savings,
• Risk-sharing, or
• Paying for quality outcomes.
• The result is an advanced value-based
purchase that allows you to:
• Secure federal matching funds,
• Drive down the cost of care by investing
in prevention, and
• Use investment dollars to improve local
communities.
© www.ghhi.org | 27
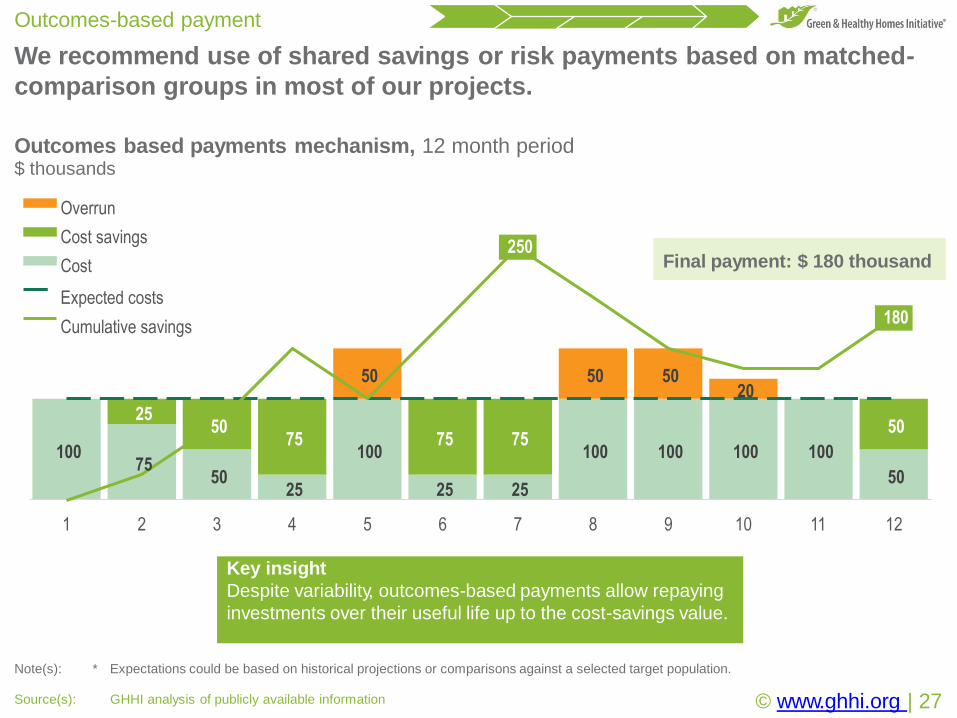
We recommend use of shared savings or risk payments based on matched-
comparison groups in most of our projects.
Outcomes-based payment
Source(s): GHHI analysis of publicly available information
Note(s): * Expectations could be based on historical projections or comparisons against a selected target population.
10075
5025
100
25 25
100 100 100 100
50
2550
75 75 7550
50 50 5020
250
180
1 2 3 4 5 6 7 8 9 10 11 12
Overrun
Cost savings
Cost
Expected costs
Cumulative savings
Outcomes based payments mechanism, 12 month period$ thousands
Final payment: $ 180 thousand
Key insight
Despite variability, outcomes-based payments allow repaying
investments over their useful life up to the cost-savings value.
© www.ghhi.org | 28
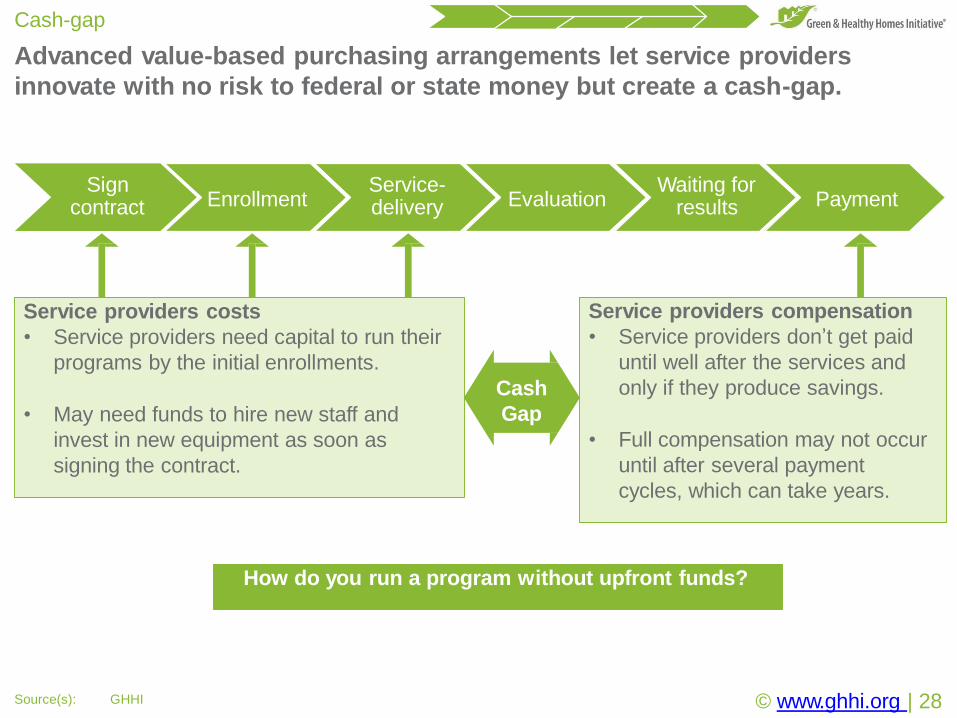
Advanced value-based purchasing arrangements let service providers
innovate with no risk to federal or state money but create a cash-gap.
Cash-gap
Source(s): GHHI
Sign contract Enrollment
Service-delivery Evaluation
Waiting for results Payment
Service providers costs
• Service providers need capital to run their
programs by the initial enrollments.
• May need funds to hire new staff and
invest in new equipment as soon as
signing the contract.
Service providers compensation
• Service providers don’t get paid
until well after the services and
only if they produce savings.
• Full compensation may not occur
until after several payment
cycles, which can take years.
How do you run a program without upfront funds?
Cash
Gap
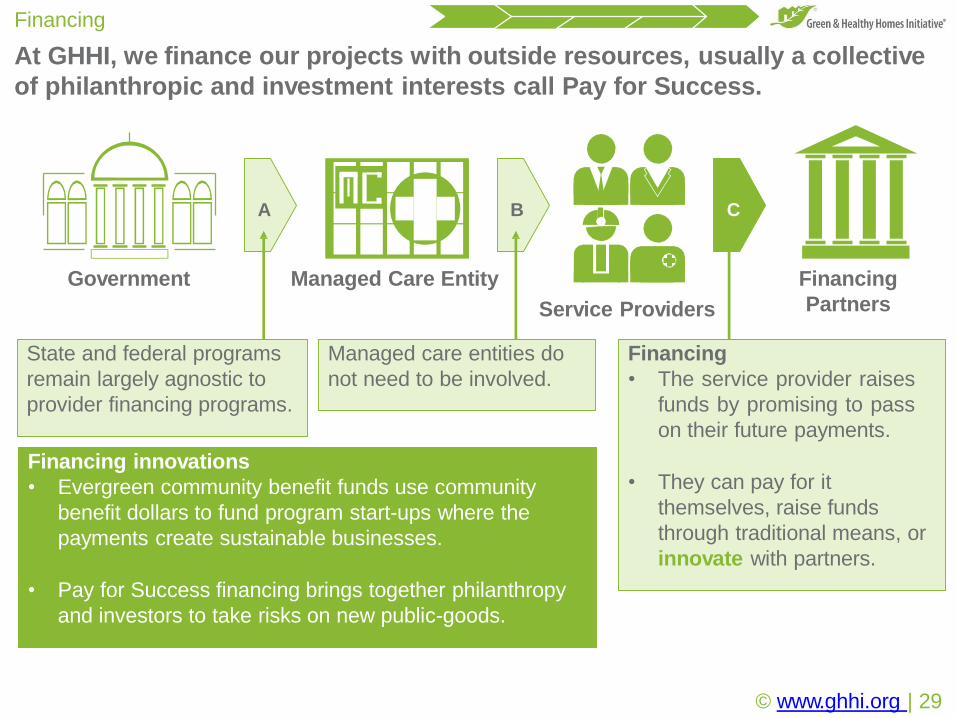
At GHHI, we finance our projects with outside resources, usually a collective
of philanthropic and investment interests call Pay for Success.
Financing
A B C
Government Managed Care Entity Financing
PartnersService Providers
Financing innovations
• Evergreen community benefit funds use community
benefit dollars to fund program start-ups where the
payments create sustainable businesses.
• Pay for Success financing brings together philanthropy
and investors to take risks on new public-goods.
Financing
• The service provider raises
funds by promising to pass
on their future payments.
• They can pay for it
themselves, raise funds
through traditional means, or
innovate with partners.
State and federal programs
remain largely agnostic to
provider financing programs.
Managed care entities do
not need to be involved.
© www.ghhi.org | 29
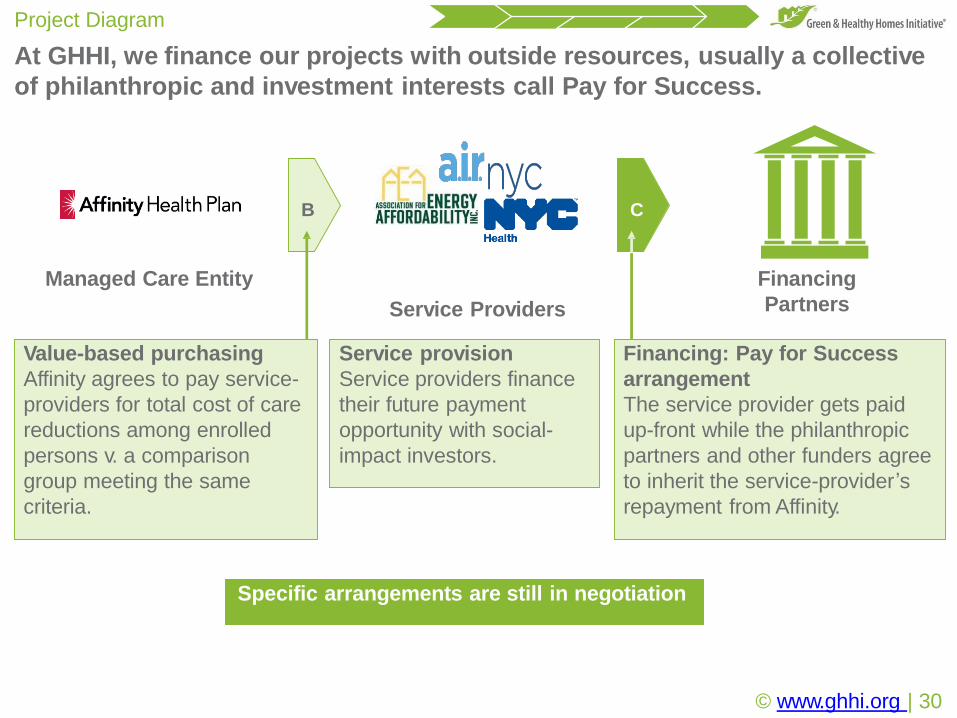
At GHHI, we finance our projects with outside resources, usually a collective
of philanthropic and investment interests call Pay for Success.
Project Diagram
B C
Service Providers
Financing
Partners
Value-based purchasing
Affinity agrees to pay service-
providers for total cost of care
reductions among enrolled
persons v. a comparison
group meeting the same
criteria.
Managed Care Entity
Financing: Pay for Success
arrangement
The service provider gets paid
up-front while the philanthropic
partners and other funders agree
to inherit the service-provider’s
repayment from Affinity.
Service provision
Service providers finance
their future payment
opportunity with social-
impact investors.
Specific arrangements are still in negotiation
© www.ghhi.org | 30

Each item in the playbook will be the focus of our webinar series.
Webinars
Registration links (all times eastern):
1.Coalition Meeting: 15 September 2017 at 13:00 hrs
https://attendee.gotowebinar.com/register/5043759288665528835
2.Playbook Overview: 22 September 2017 at 13:00 hrs
https://attendee.gotowebinar.com/register/8805253438473426947
3.Value-Based Purchasing PolicyAnalysis: 29 September 2017 at 13:00 hrs
https://attendee.gotowebinar.com/register/5942087776349479171
4.Contract Options for Innovation: 06 October 2017 at 13:00 hrs
https://attendee.gotowebinar.com/register/7663281970167756803
5. Evaluating Medicaid VBPs: 13 October 2017 at 13:00 hrs
https://attendee.gotowebinar.com/register/7098737724886279427
6.Outcomes-Based Payments Handbook: 20 October 2017 at 13:00 hrs
https://attendee.gotowebinar.com/register/708338760856912899
© www.ghhi.org | 32
We’re always here to help.
© www.ghhi.org | 33Source(s): GHHI
Contact information
Andrew E Olson
Social Innovation Specialist
[email protected] | +1.202.207.6817
Thank you for your time.
Ruth Ann Norton
President & CEO
[email protected] | +1.410.534.6477
Michael McKnight
Vice President of Policy and Innovation
[email protected] | +1.202.769.5763
.
ed
erv
es rtsghi rll A
e. vati tiIni
es
Hom
thy l
Hea& neeGr 601©2
.
ed
erv
es rtsghi rll A
e. vati tiIni
es
Hom
thy l
Hea& neeGr 501©2
©2017
Gre
en
&H
ealthy
Hom
es
Initia
tive.
All
rights
reserv
ed
.
Thank you for your time!
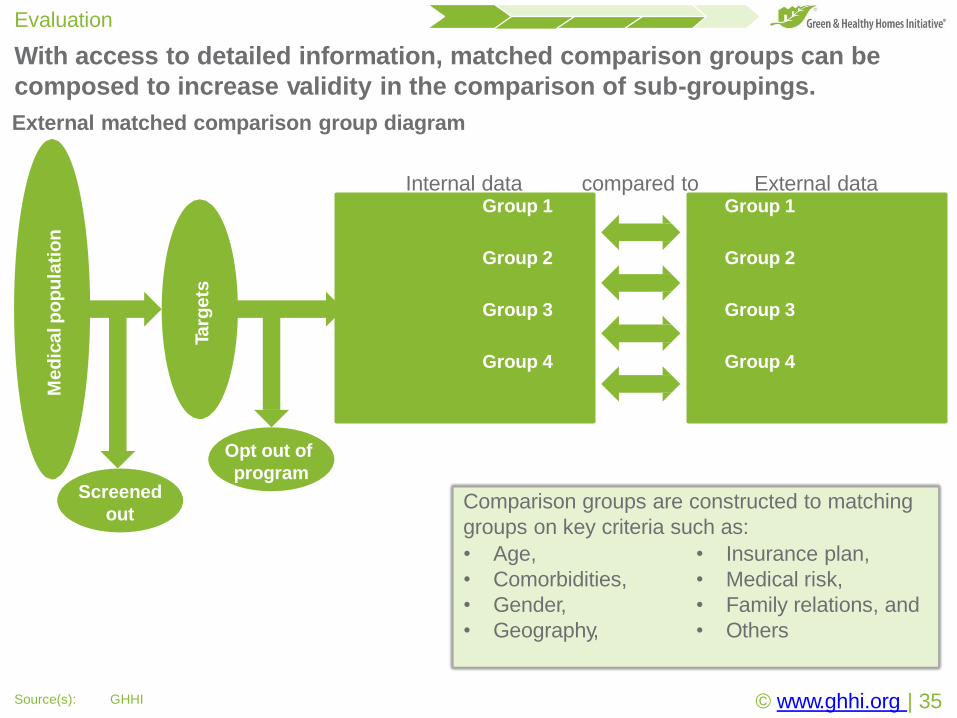
With access to detailed information, matched comparison groups can be
composed to increase validity in the comparison of sub-groupings.
Evaluation
Med
icalp
op
ula
tio
n
Screened
out
Targ
ets
Part
icip
an
ts
Group 1
Group 2
Group 3
Group 4
Exte
rnalp
op
ula
tio
n
Group 1
Group 2
Group 3
Group 4
Internal data compared to External data
External matched comparison group diagram
Comparison groups are constructed to matching
groups on key criteria such as:
• Age, • Insurance plan,
• Comorbidities, • Medical risk,
• Gender, • Family relations, and
• Geography, • Others
Opt out of
program
© www.ghhi.org | 35Source(s): GHHI
.
ed
erv
es rtsghi rll A
e. vati tiIni
es
Hom
thy l
Hea& neeGr 601©2
.
ed
erv
es rtsghi rll A
e. vati tiIni
es
Hom
thy l
Hea& neeGr 501©2
©2017
Gre
en
&H
ealthy
Hom
es
Initia
tive.
All
rights
reserv
ed
.
Issue #1:
Reimbursements and revenue losses
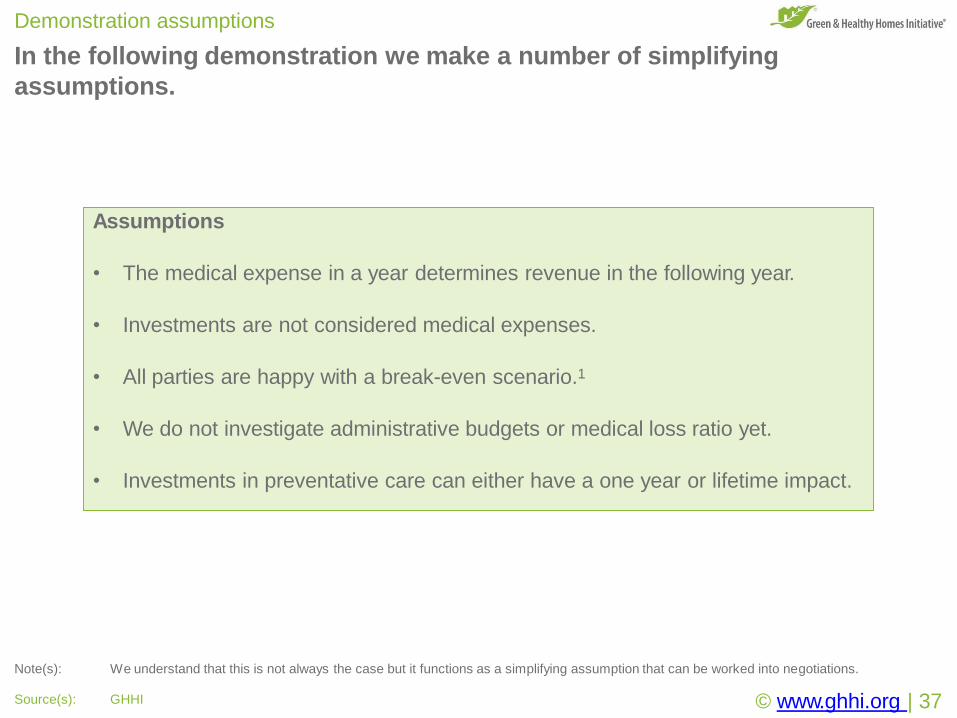
In the following demonstration we make a number of simplifying
assumptions.
© www.ghhi.org | 37Source(s): GHHI
Demonstration assumptions
Note(s): We understand that this is not always the case but it functions as a simplifying assumption that can be worked into negotiations.
Assumptions
• The medical expense in a year determines revenue in the following year.
• Investments are not considered medical expenses.
• All parties are happy with a break-even scenario.1
• We do not investigate administrative budgets or medical loss ratio yet.
• Investments in preventative care can either have a one year or lifetime impact.
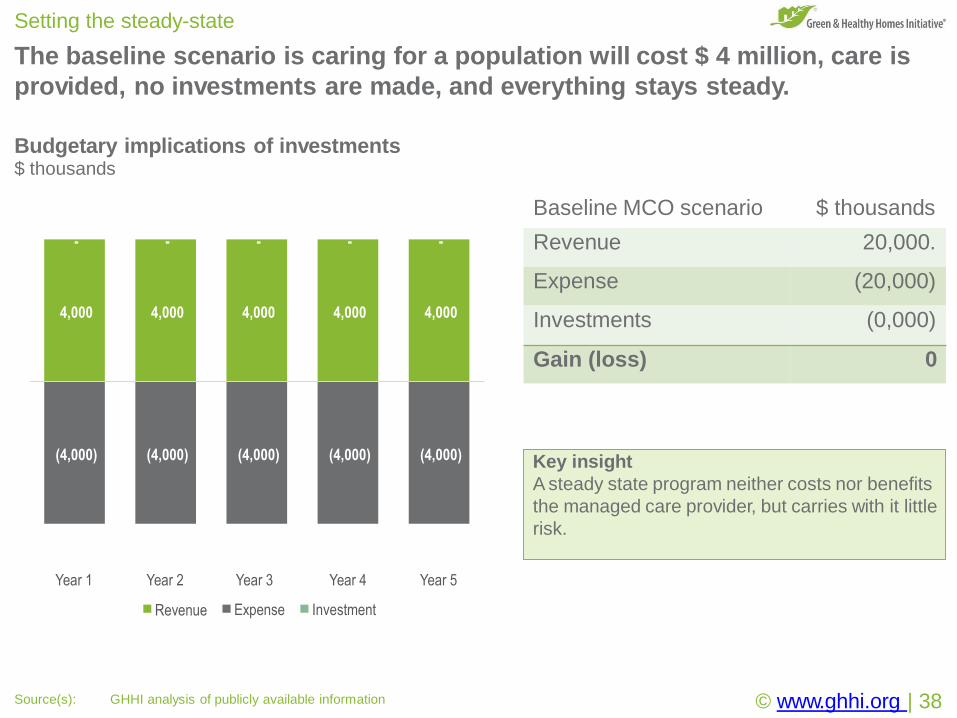
The baseline scenario is caring for a population will cost $ 4 million, care is
provided, no investments are made, and everything stays steady.
Setting the steady-state
Budgetary implications of investments$ thousands
Key insight
A steady state program neither costs nor benefits
the managed care provider, but carries with it little
risk.
4,000 4,000 4,000 4,000 4,000
(4,000) (4,000) (4,000) (4,000) (4,000)
- - - - -
Year 1 Year 2 Year 3
Expense
Year 4
Investment
© www.ghhi.org | 38Source(s): GHHI analysis of publicly available information
Year 5
Revenue
Baseline MCO scenario $ thousands
Revenue 20,000.
Expense (20,000)
Investments (0,000)
Gain (loss) 0
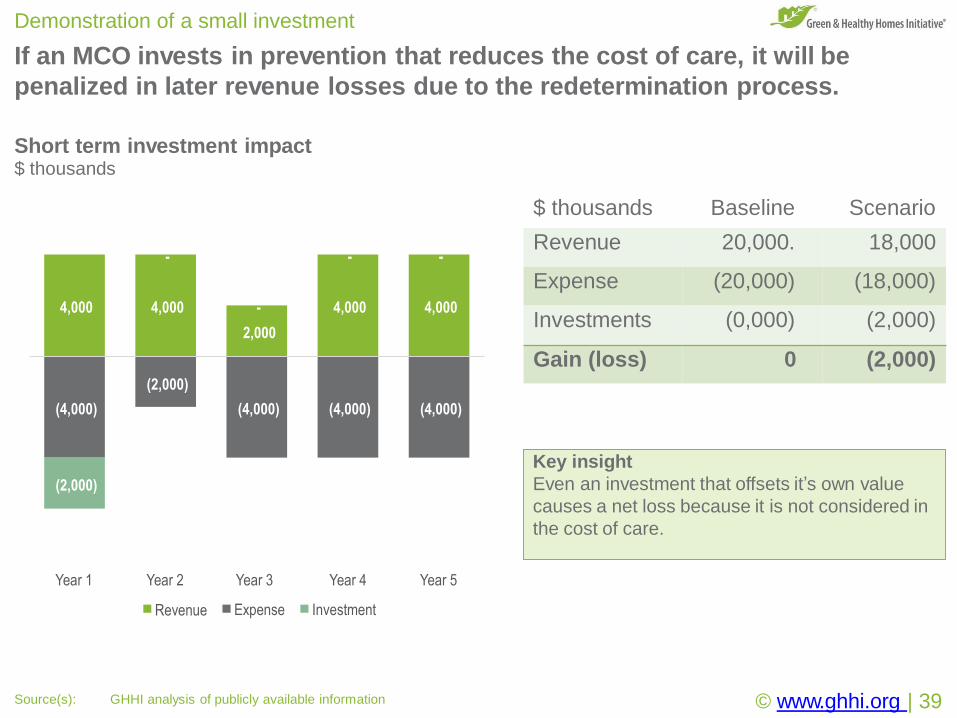
If an MCO invests in prevention that reduces the cost of care, it will be
penalized in later revenue losses due to the redetermination process.
Demonstration of a small investment
Short term investment impact$ thousands
Key insight
Even an investment that offsets it’s own value
causes a net loss because it is not considered in
the cost of care.
4,000 4,000
2,000
(2,000)
4,000 4,000
(4,000) (4,000) (4,000) (4,000)
(2,000)
-
-
- -
Year 1 Year 2 Year 3
Expense
Year 4
Investment
© www.ghhi.org | 39Source(s): GHHI analysis of publicly available information
Year 5
Revenue
$ thousands Baseline Scenario
Revenue 20,000. 18,000
Expense (20,000) (18,000)
Investments (0,000) (2,000)
Gain (loss) 0 (2,000)
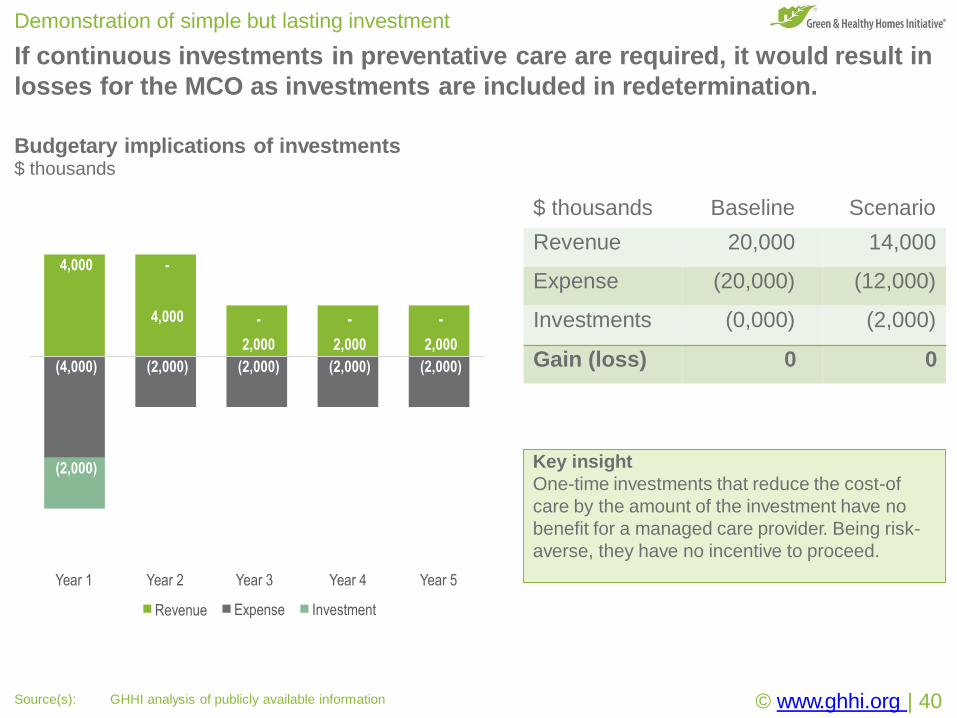
If continuous investments in preventative care are required, it would result in
losses for the MCO as investments are included in redetermination.
Demonstration of simple but lasting investment
Budgetary implications of investments$ thousands
Key insight
One-time investments that reduce the cost-of
care by the amount of the investment have no
benefit for a managed care provider. Being risk-
averse, they have no incentive to proceed.
Year 1 Year 2 Year 3
Expense
Year 4
Investment
© www.ghhi.org | 40Source(s): GHHI analysis of publicly available information
Year 5
Revenue
$ thousands Baseline Scenario
Revenue 20,000 14,000
Expense (20,000) (12,000)
Investments (0,000) (2,000)
Gain (loss) 0 0
4,000 -
4,000 -
2,000
-
2,000
-
2,000
(4,000) (2,000) (2,000) (2,000) (2,000)
(2,000)
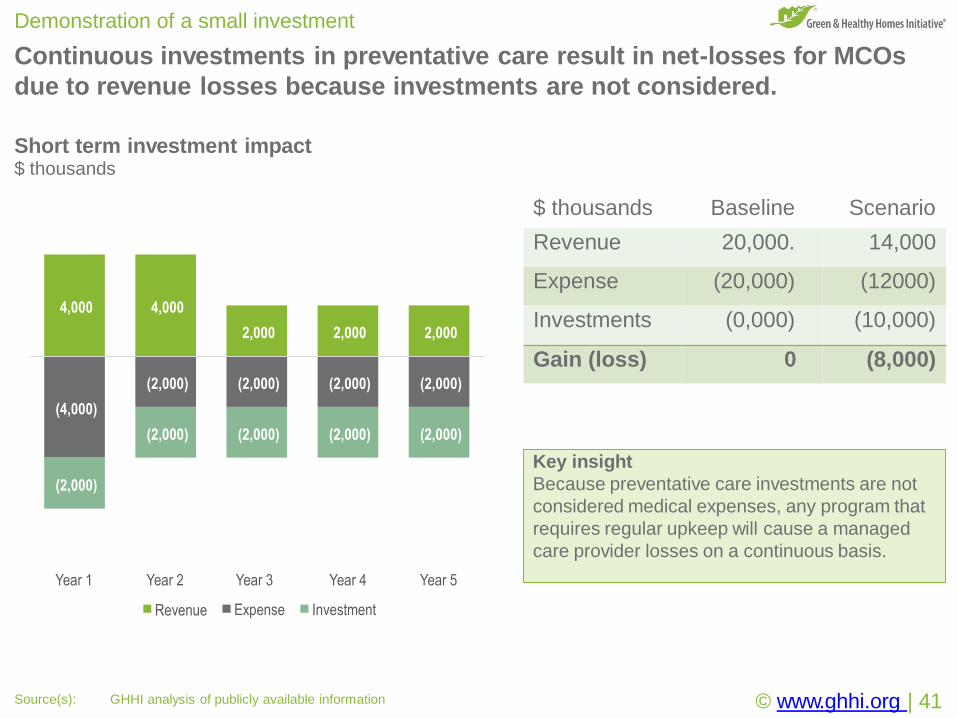
Continuous investments in preventative care result in net-losses for MCOs
due to revenue losses because investments are not considered.
Demonstration of a small investment
Short term investment impact$ thousands
4,000 4,000
2,000 2,000 2,000
(4,000)
(2,000) (2,000) (2,000) (2,000)
(2,000)
(2,000) (2,000) (2,000) (2,000)
Year 1 Year 2 Year 3
Expense
Year 4
Investment
© www.ghhi.org | 41Source(s): GHHI analysis of publicly available information
Year 5
Revenue
Key insight
Because preventative care investments are not
considered medical expenses, any program that
requires regular upkeep will cause a managed
care provider losses on a continuous basis.
$ thousands Baseline Scenario
Revenue 20,000. 14,000
Expense (20,000) (12000)
Investments (0,000) (10,000)
Gain (loss) 0 (8,000)
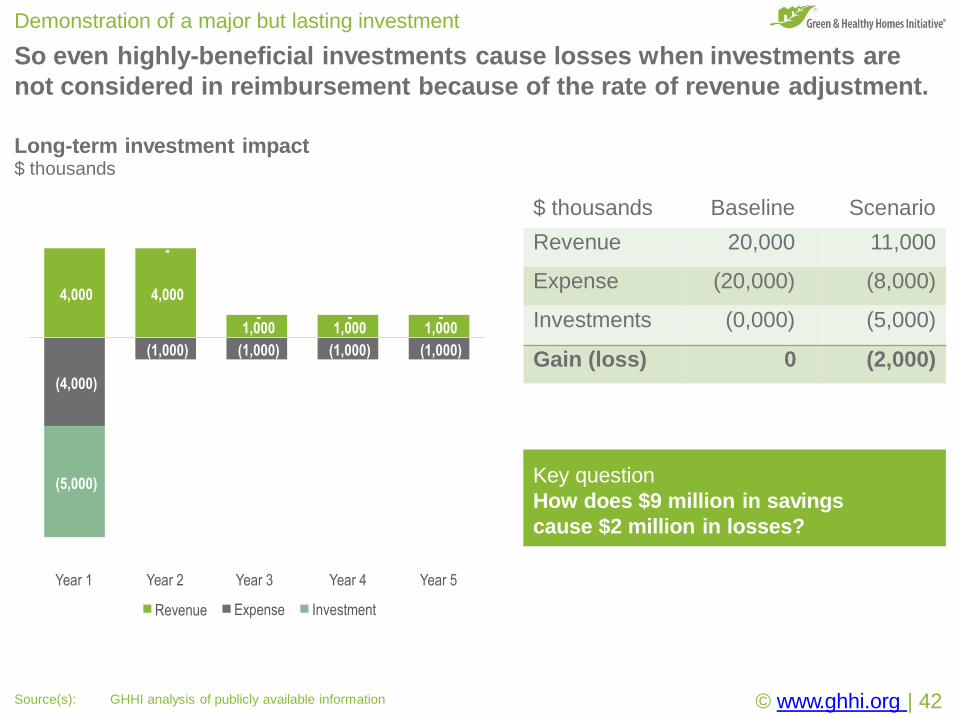
So even highly-beneficial investments cause losses when investments are
not considered in reimbursement because of the rate of revenue adjustment.
Demonstration of a major but lasting investment
Long-term investment impact$ thousands
4,000 4,000
1,000 1,000 1,000
(4,000)
(1,000) (1,000) (1,000) (1,000)
(5,000)
-
- - -
Year 1 Year 2 Year 3
Expense
Year 4
Investment
Year 5
Revenue
Key question
How does $9 million in savings
cause $2 million in losses?
© www.ghhi.org | 42Source(s): GHHI analysis of publicly available information
$ thousands Baseline Scenario
Revenue 20,000 11,000
Expense (20,000) (8,000)
Investments (0,000) (5,000)
Gain (loss) 0 (2,000)
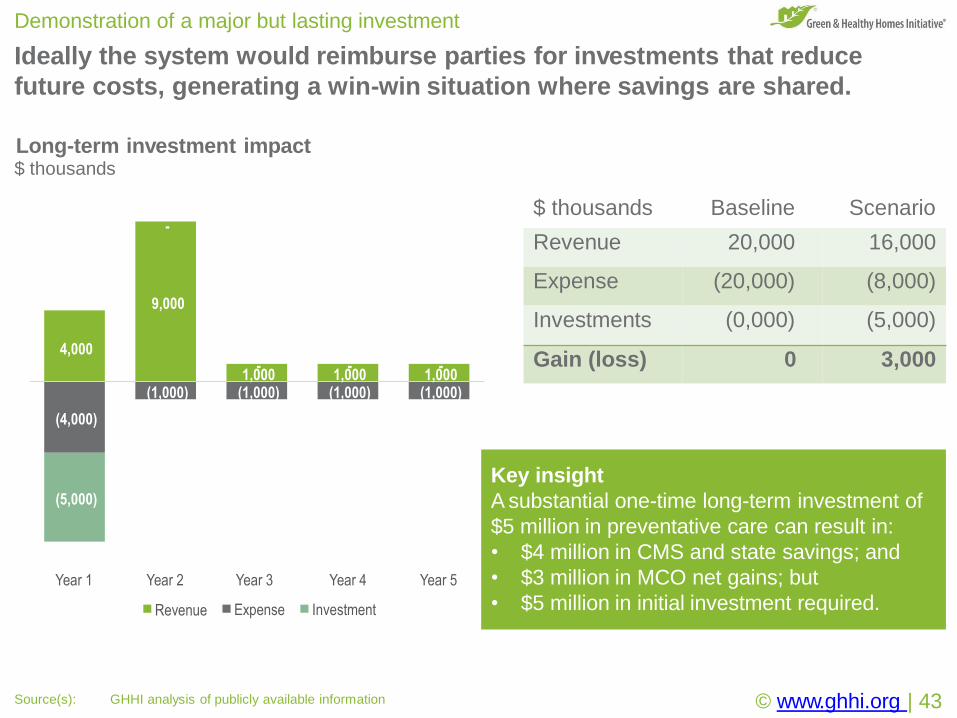
Ideally the system would reimburse parties for investments that reduce
future costs, generating a win-win situation where savings are shared.
Demonstration of a major but lasting investment
Long-term investment impact$ thousands
-
9,000
4,000
1,000 1,000 1,000
(4,000)
(1,000) (1,000) (1,000) (1,000)
(5,000)
- - -
Year 1 Year 2 Year 3
Expense
Year 4
Investment
Year 5
Revenue
Key insight
A substantial one-time long-term investment of
$5 million in preventative care can result in:
© www.ghhi.org | 43Source(s): GHHI analysis of publicly available information
• $4 million in CMS and state savings; and
• $3 million in MCO net gains; but
• $5 million in initial investment required.
$ thousands Baseline Scenario
Revenue 20,000 16,000
Expense (20,000) (8,000)
Investments (0,000) (5,000)
Gain (loss) 0 3,000
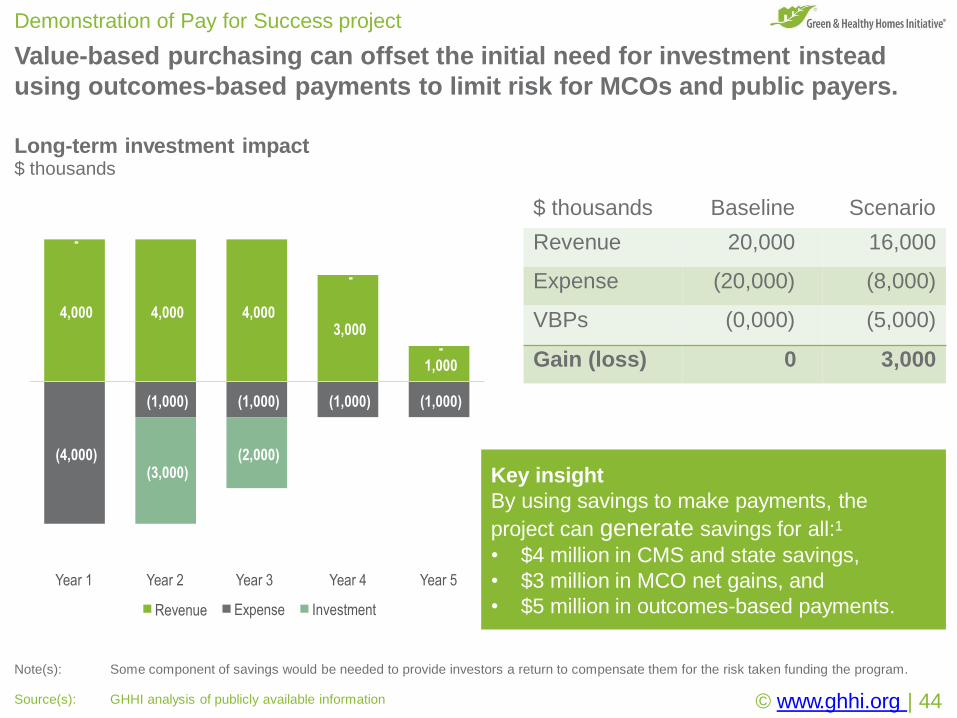
Key insight
By using savings to make payments, the
project can generate savings for all:1
• $4 million in CMS and state savings,
• $3 million in MCO net gains, and
• $5 million in outcomes-based payments.
Value-based purchasing can offset the initial need for investment instead
using outcomes-based payments to limit risk for MCOs and public payers.
Demonstration of Pay for Success project
Note(s): Some component of savings would be needed to provide investors a return to compensate them for the risk taken funding the program.
Long-term investment impact$ thousands
4,000 4,000 4,0003,000
-1,000
(4,000)
(1,000) (1,000) (1,000) (1,000)
-
-
(3,000)(2,000)
Year 1 Year 2 Year 3
Expense
Year 4
Investment
© www.ghhi.org | 44Source(s): GHHI analysis of publicly available information
Year 5
Revenue
$ thousands Baseline Scenario
Revenue 20,000 16,000
Expense (20,000) (8,000)
VBPs (0,000) (5,000)
Gain (loss) 0 3,000
.
ed
erv
es rtsghi rll A
e. vati tiIni
es
Hom
thy l
Hea& neeGr 601©2
.
ed
erv
es rtsghi rll A
e. vati tiIni
es
Hom
thy l
Hea& neeGr 501©2
©2017
Gre
en
&H
ealthy
Hom
es
Initia
tive.
All
rights
reserv
ed
.
Issue #2:
Spending classificationHow investing in prevention of medical expenses reduces revenue,
forces budget cuts, and penalizes managed care providers.
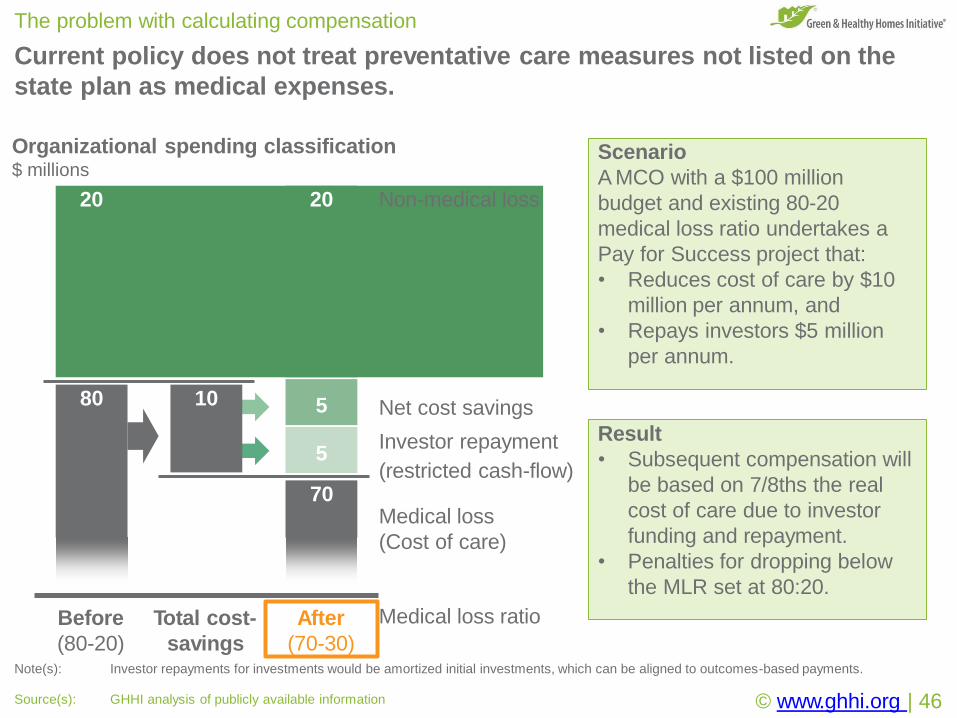
Current policy does not treat preventative care measures not listed on the
state plan as medical expenses.
The problem with calculating compensation
20 20 Non-medical loss
Net cost savings
Investor repayment
(restricted cash-flow)
Before Total cost- After
Organizational spending classification$ millions
Scenario
A MCO with a $100 million
budget and existing 80-20
medical loss ratio undertakes a
Pay for Success project that:
• Reduces cost of care by $10
million per annum, and
• Repays investors $5 million
per annum.
Result
• Subsequent compensation will
be based on 7/8ths the real
cost of care due to investor
funding and repayment.
• Penalties for dropping below
the MLR set at 80:20.
Medical loss
(Cost of care)
80
70
5
5
10
Medical loss ratio
(80-20) savings (70-30)Note(s): Investor repayments for investments would be amortized initial investments, which can be aligned to outcomes-based payments.
© www.ghhi.org | 46Source(s): GHHI analysis of publicly available information
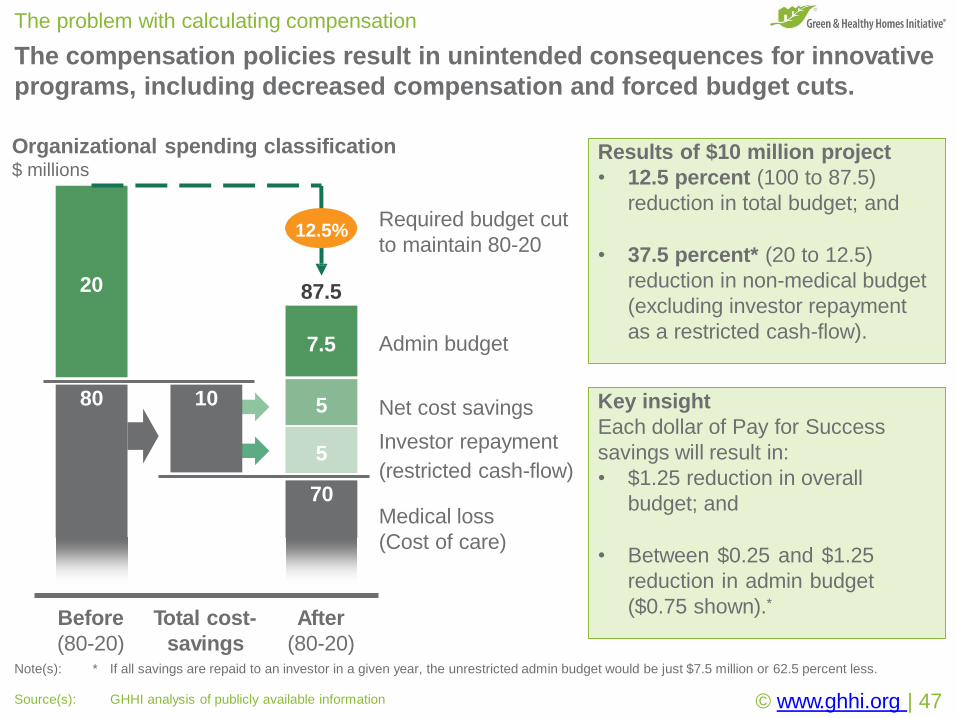
The compensation policies result in unintended consequences for innovative
programs, including decreased compensation and forced budget cuts.
The problem with calculating compensation
Total cost-
Medical loss
(Cost of care)
Organizational spending classification$ millions
(80-20) savings (80-20)Note(s): * If all savings are repaid to an investor in a given year, the unrestricted admin budget would be just $7.5 million or 62.5 percent less.
© www.ghhi.org | 47Source(s): GHHI analysis of publicly available information
80
20
10 Net cost savings
Investor repayment
(restricted cash-flow)
Admin budget
Required budget cut
to maintain 80-20
7.5
70
87.5
12.5%
Results of $10 million project
• 12.5 percent (100 to 87.5)
reduction in total budget; and
• 37.5 percent* (20 to 12.5)
reduction in non-medical budget
(excluding investor repayment
as a restricted cash-flow).
Key insight
Each dollar of Pay for Success
savings will result in:
• $1.25 reduction in overall
budget; and
• Between $0.25 and $1.25
reduction in admin budget
($0.75 shown).*
5
5
Before After
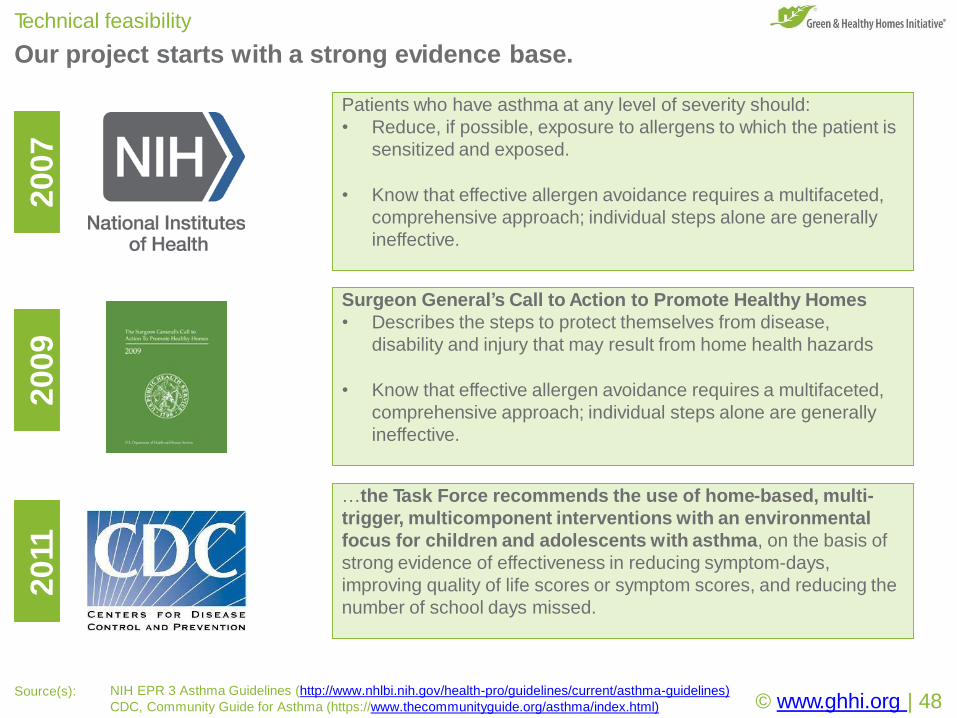
Our project starts with a strong evidence base.
Technical feasibility
Patients who have asthma at any level of severity should:
• Reduce, if possible, exposure to allergens to which the patient is
sensitized and exposed.
• Know that effective allergen avoidance requires a multifaceted,
comprehensive approach; individual steps alone are generally
ineffective.
…the Task Force recommends the use of home-based, multi-
trigger, multicomponent interventions with an environmental
focus for children and adolescents with asthma, on the basis of
strong evidence of effectiveness in reducing symptom-days,
improving quality of life scores or symptom scores, and reducing the
number of school days missed.
2007
2011
2009
Surgeon General’s Call to Action to Promote Healthy Homes
• Describes the steps to protect themselves from disease,
disability and injury that may result from home health hazards
• Know that effective allergen avoidance requires a multifaceted,
comprehensive approach; individual steps alone are generally
ineffective.
Source(s): NIH EPR 3 Asthma Guidelines (http://www.nhlbi.nih.gov/health-pro/guidelines/current/asthma-guidelines)
CDC, Community Guide for Asthma (https://www.thecommunityguide.org/asthma/index.html) © www.ghhi.org | 48