Significant Figures -why we use them -rules for sig. figs. -operations with sig. figs.
Upload
wilfrid-millerCategory
view
216download
0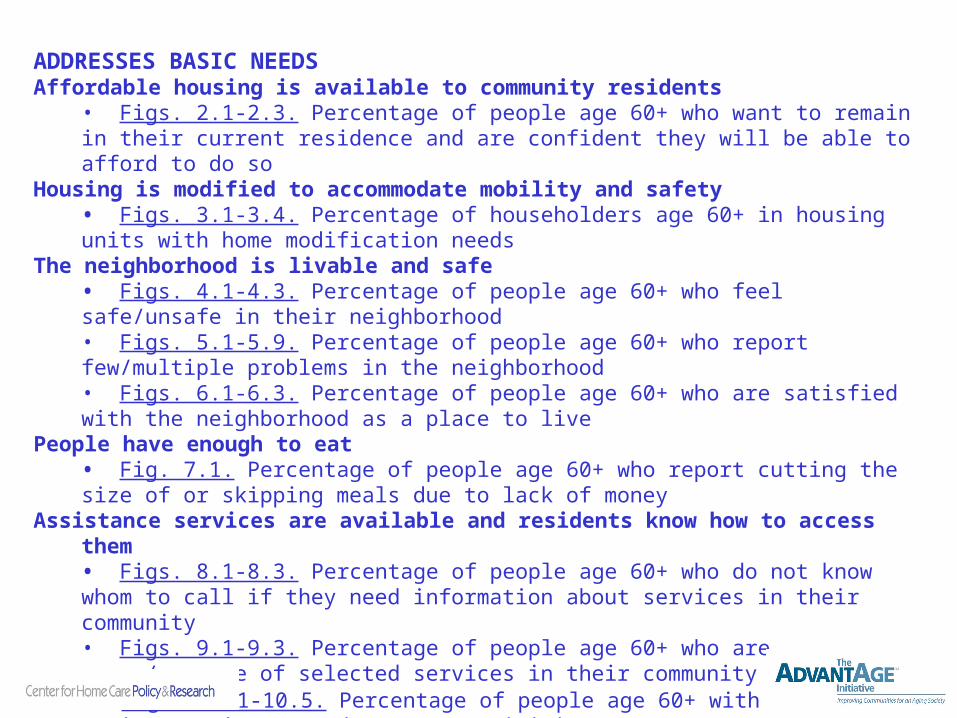
ADDRESSES BASIC NEEDSAffordable housing is available to community residents
• Figs. 2.1-2.3. Percentage of people age 60+ who want to remain in their current residence and are confident they will be able to afford to do so
Housing is modified to accommodate mobility and safety • Figs. 3.1-3.4. Percentage of householders age 60+ in housing units with home modification needs
The neighborhood is livable and safe • Figs. 4.1-4.3. Percentage of people age 60+ who feel safe/unsafe in their neighborhood • Figs. 5.1-5.9. Percentage of people age 60+ who report few/multiple problems in the neighborhood • Figs. 6.1-6.3. Percentage of people age 60+ who are satisfied with the neighborhood as a place to live
People have enough to eat • Fig. 7.1. Percentage of people age 60+ who report cutting the size of or skipping meals due to lack of money
Assistance services are available and residents know how to access them • Figs. 8.1-8.3. Percentage of people age 60+ who do not know whom to call if they need information about services in their community • Figs. 9.1-9.3. Percentage of people age 60+ who are aware/unaware of selected services in their community • Figs. 10.1-10.5. Percentage of people age 60+ with adequate assistance in ADL and/or IADL activities

Percentage of people age 60+ who want to remain in their current residence and are confident they will be able to afford to do so
Unweighted N=287Weighted N=20,256
Unweighted N=300Weighted N=21,059
Disagree3% Agree*
96%Very
Confident55%
Not VeryConfident**
45%
Neither/DK/RF
1%
We asked respondents whether they agree or disagree with the following statement: “What I’d really like to do is stay in my current residence for as long as possible.”
For people who answered “agree” we calculated the percentage of adults age 60+ who were very confident/not very confident that they will be able to afford to live in their current residence for as long as they would like.
*Agree includes those who said Strongly agree or Somewhat agree.**Not Very Confident includes those who said Somewhat confident, Not too confident, Not confident at all, Don’t know, or Refused.
Figure 2.1, Indiana-Area 15§
Note: Percentages may not add up to 100% due to rounding and/or missing information.
Source: AdvantAge Initiative Community Survey in Indiana 2008
§ Area 15 includes Crawford, Lawrence, Orange, and Washington Counties.
‡
‡ This percentage is based on fewer than 20 respondents (Unweighted N<20) and should be interpreted with caution.
‡
Percentage of people age 60+ who want to remain in their current residence and are confident they will be able to afford to do so,* by demographics
38%
51%
40%
47%
50%
45%
62%
49%
60%
53%
50%
55%
Not Very Confident** Very Confident
Note: Percentages may not add up to 100% due to rounding and/or missing information.*Base includes those who want to remain in their current residence for as long as possible.**Not Very Confident includes those who said Somewhat confident, Not too confident, Not confident at all, Don’t know, or Refused.
Unweighted N=287Weighted N=20,256
Figure 2.2, Indiana-Area 15§
Source: AdvantAge Initiative Community Survey in Indiana 2008
Total
Age 60-64
Age 65-74
Men
Women
Age 75+
§ Area 15 includes Crawford, Lawrence, Orange, and Washington Counties.

Percentage of people age 60+ who want to remain in their current residence and are confident they will be able to afford to do so,* by demographics (cont’d)
45%
45%
52%
44%
50%
36%
45%
55%
55%
48%
56%
50%
64%
55%
Not Very Confident** Very Confident
Note: Percentages may not add up to 100% due to rounding and/or missing information.
*Base includes those who want to remain in their current residence for as long as possible.**Not Very Confident includes those who said Somewhat confident, Not too confident, Not confident at all, Don’t know, or Refused.
Figure 2.3, Indiana-Area 15§
Source: AdvantAge Initiative Community Survey in Indiana 2008
Total
Education <HS
Ex/vg/good health
Education >HS
Fair/poor health
Live w/others
Live alone
Unweighted N=287Weighted N=20,256
§ Area 15 includes Crawford, Lawrence, Orange, and Washington Counties.
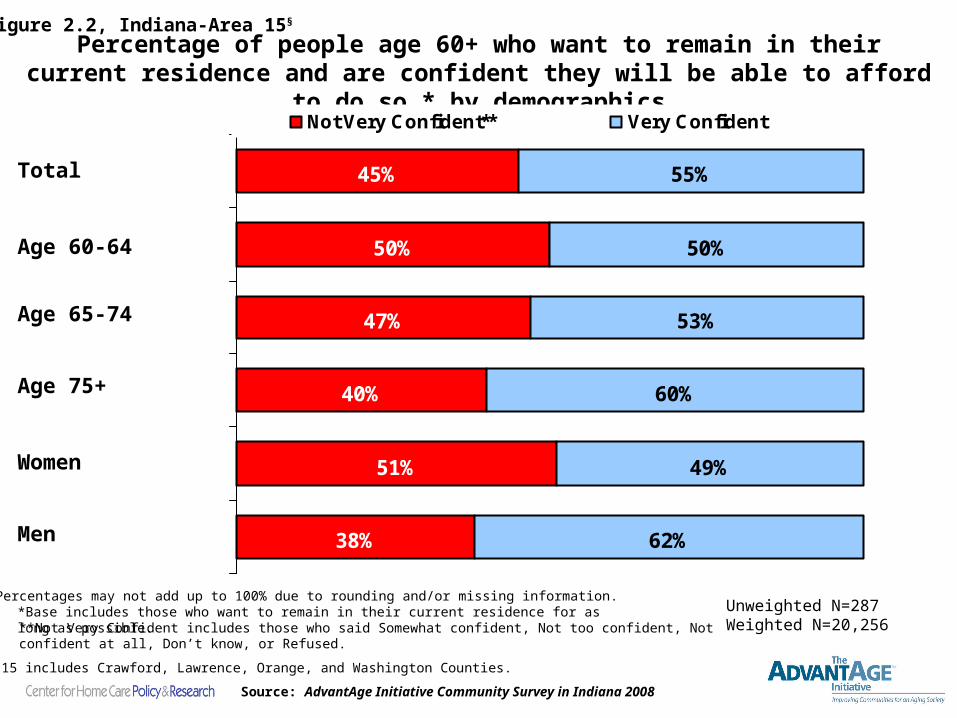
Percentage of householders age 60+ in housing units with home modification needs*
Unweighted N=50Weighted N=3,659
Unweighted N=300Weighted N=21,059
One or more modification
needed17%
No modifications
needed83%
Planning to modify
78%
Not planning to modify
*People were asked whether their current residence needs any significant repairs, modifications, or changes to improve their ability to live there over the next five years.
*People who said that their homes need modification were asked if they plan to make the change over the next five years.
Figure 3.1, Indiana-Area 15§
Note: Percentages may not add up to 100% due to rounding and/or missing information.
17%
5%DK/RF
Source: AdvantAge Initiative Community Survey in Indiana 2008
§ Area 15 includes Crawford, Lawrence, Orange, and Washington Counties.
‡ This percentage is based on fewer than 20 respondents (Unweighted N<20) and should be interpreted with caution.
‡
‡
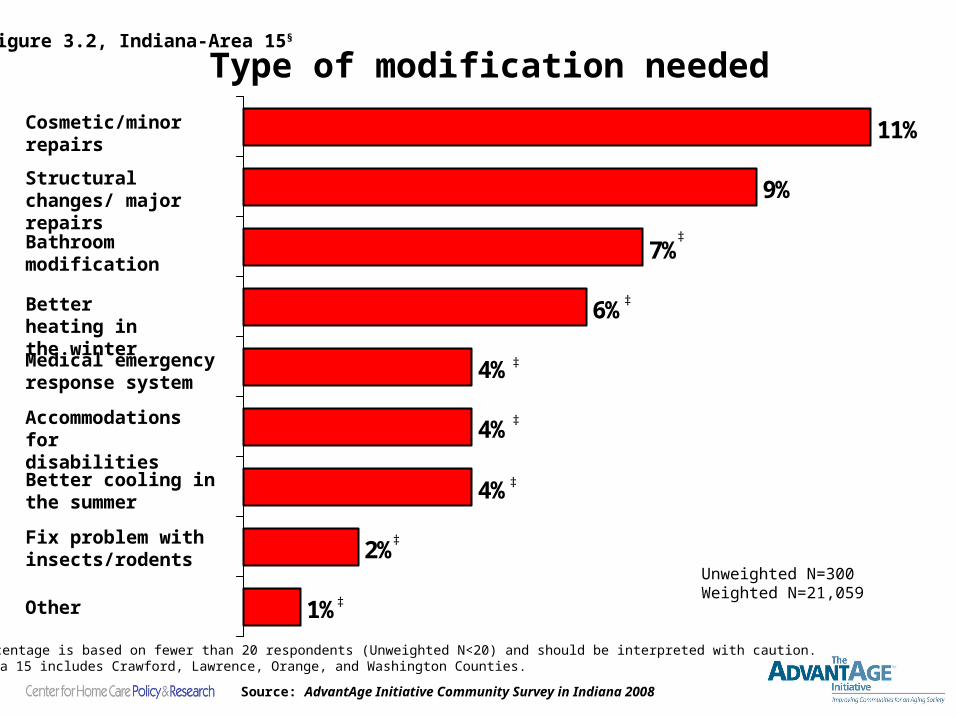
Type of modification needed
1%
2%
4%
4%
4%
6%
7%
9%
11%Cosmetic/minor repairs
Medical emergency response system
Accommodations for disabilities
Structural changes/ major repairs
Better heating in the winter
Better cooling in the summer
Fix problem with insects/rodents
Other
Bathroom modification
Figure 3.2, Indiana-Area 15§
Unweighted N=300Weighted N=21,059
Source: AdvantAge Initiative Community Survey in Indiana 2008
§ Area 15 includes Crawford, Lawrence, Orange, and Washington Counties.
‡ This percentage is based on fewer than 20 respondents (Unweighted N<20) and should be interpreted with caution.
‡
‡
‡
‡
‡
‡
‡

Percentage of householders age 60+ in housing units with home modification needs,* by demographics
13%
21%
18%
17%
18%
17%
Unweighted N= 300Weighted N= 21,059
Figure 3.3, Indiana-Area 15§
*People were asked whether their current residence needs any significant repairs, modifications, or changes to improve their ability to live there over the next five years.
Source: AdvantAge Initiative Community Survey in Indiana 2008
Total
Age 60-64
Age 65-74
Men
Women
Age 75+
§ Area 15 includes Crawford, Lawrence, Orange, and Washington Counties.
‡ This percentage is based on fewer than 20 respondents (Unweighted N<20) and should be interpreted with caution.
‡
‡

Percentage of householders age 60+ in housing units with home modification needs,* by demographics (cont’d)
23%
15%
28%
15%
20%
11%
17%
Figure 3.4, Indiana-Area 15§
*People were asked whether their current residence needs any significant repairs, modifications, or changes to improve their ability to live there over the next five years.
Source: AdvantAge Initiative Community Survey in Indiana 2008
Total
Education <HS
Ex/vg/good health
Education >HS
Fair/poor health
Live w/others
Live alone
Unweighted N= 300Weighted N= 21,059
§ Area 15 includes Crawford, Lawrence, Orange, and Washington Counties.
‡ This percentage is based on fewer than 20 respondents (Unweighted N<20) and should be interpreted with caution.
‡
‡

Percentage of people age 60+ who feel safe/unsafe in their neighborhood*
Unweighted N=300Weighted N=21,059
Note: Percentages may not add up to 100% due to rounding and/or missing information.
*People were asked whether safety in their neighborhood is excellent, very good, good, fair, or poor.
Figure 4.1, Indiana-Area 15§
Safety-Good23%
Safety-Excellent/Very Good
68%
8%
Source: AdvantAge Initiative Community Survey in Indiana 2008
Safety-Fair/poor
§ Area 15 includes Crawford, Lawrence, Orange, and Washington Counties.
DK/RF<1%
‡ This percentage is based on fewer than 20 respondents (Unweighted N<20) and should be interpreted with caution.
‡
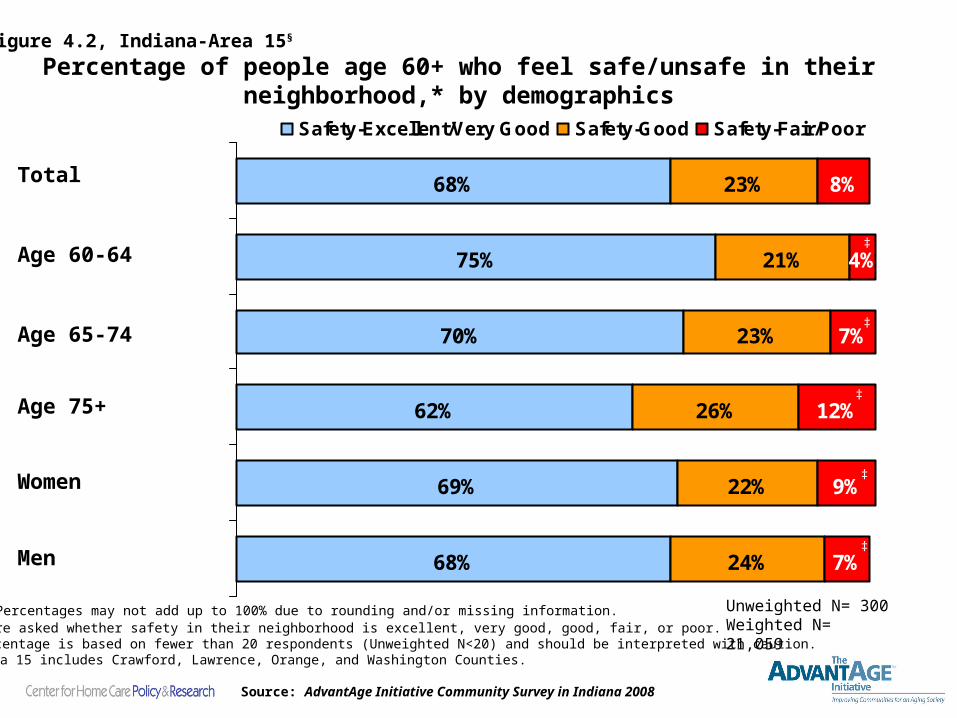
Percentage of people age 60+ who feel safe/unsafe in their neighborhood,* by demographics
68%
69%
62%
70%
75%
68%
24%
22%
26%
23%
21%
23%
7%
9%
12%
7%
4%
8%
Safety-Excellent/Very Good Safety-Good Safety-Fair/Poor
Note: Percentages may not add up to 100% due to rounding and/or missing information. Unweighted N= 300Weighted N= 21,059
Figure 4.2, Indiana-Area 15§
*People were asked whether safety in their neighborhood is excellent, very good, good, fair, or poor.
Source: AdvantAge Initiative Community Survey in Indiana 2008
Total
Age 60-64
Age 65-74
Men
Women
Age 75+
§ Area 15 includes Crawford, Lawrence, Orange, and Washington Counties.
‡ This percentage is based on fewer than 20 respondents (Unweighted N<20) and should be interpreted with caution.
‡
‡
‡
‡
‡
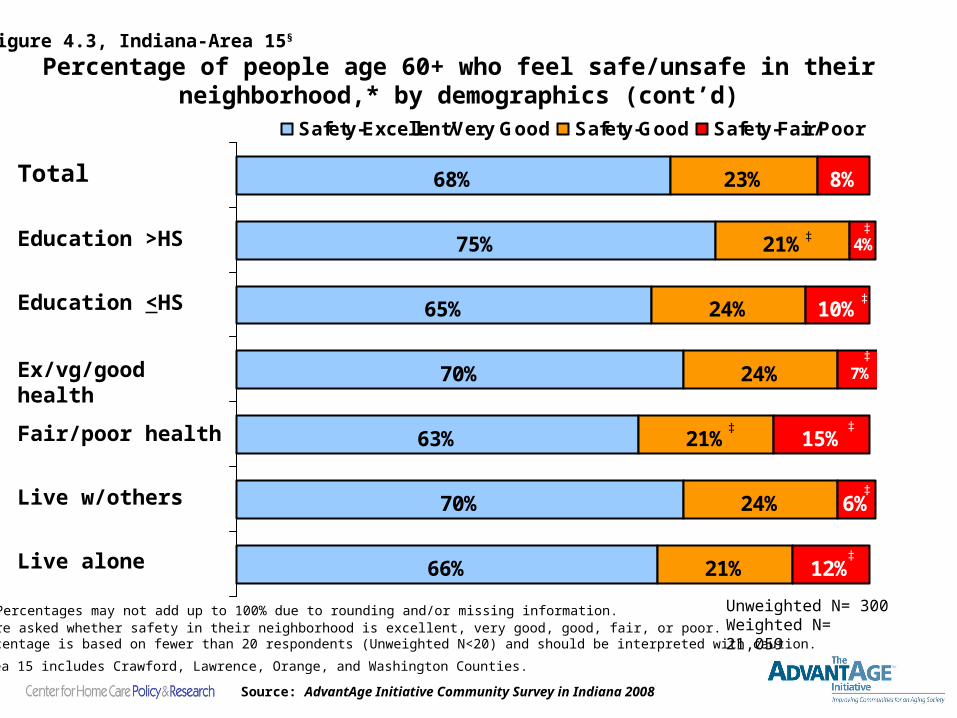
Percentage of people age 60+ who feel safe/unsafe in their neighborhood,* by demographics (cont’d)
66%
70%
63%
70%
65%
75%
68%
21%
24%
21%
24%
24%
21%
23%
12%
6%
15%
8%
10%
4%
7%
Safety-Excellent/Very Good Safety-Good Safety-Fair/Poor
Note: Percentages may not add up to 100% due to rounding and/or missing information.
Figure 4.3, Indiana-Area 15§
*People were asked whether safety in their neighborhood is excellent, very good, good, fair, or poor.
Source: AdvantAge Initiative Community Survey in Indiana 2008
Total
Education <HS
Ex/vg/good health
Education >HS
Fair/poor health
Live w/others
Live alone
Unweighted N= 300Weighted N= 21,059
§ Area 15 includes Crawford, Lawrence, Orange, and Washington Counties.
‡ This percentage is based on fewer than 20 respondents (Unweighted N<20) and should be interpreted with caution.
‡
‡
‡
‡
‡‡
‡
‡
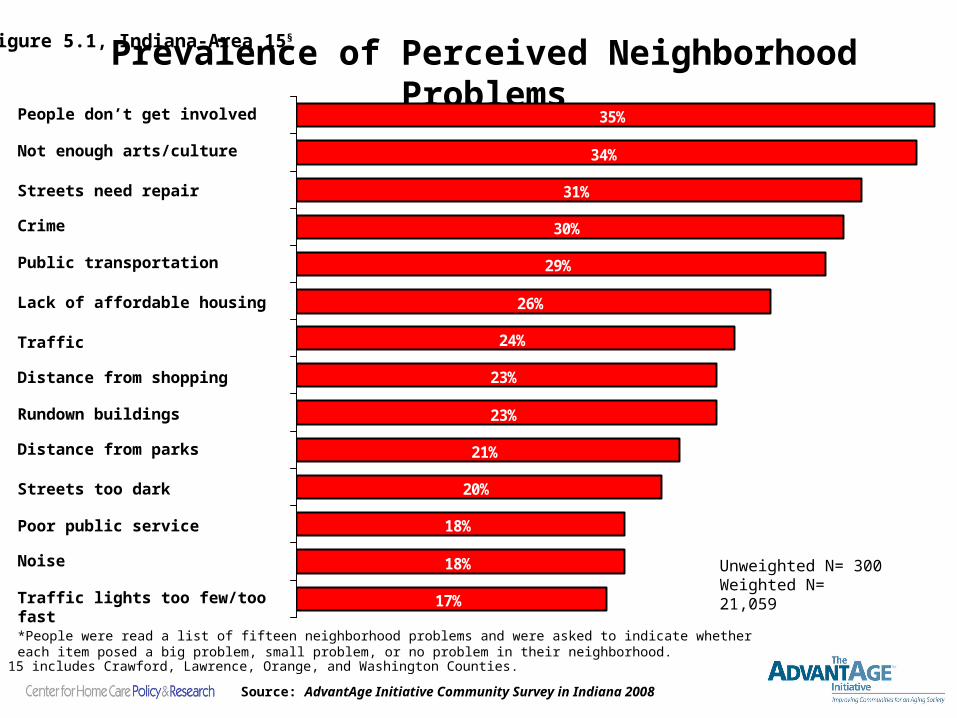
Prevalence of Perceived Neighborhood Problems
17%
18%
18%
20%
21%
23%
23%
24%
26%
29%
30%
31%
34%
35%
Streets need repair
Distance from parks
Traffic
Not enough arts/culture
Crime
Poor public service
Streets too dark
People don’t get involved
Public transportation
Figure 5.1, Indiana-Area 15§
Distance from shopping
Lack of affordable housing
Rundown buildings
Noise
*People were read a list of fifteen neighborhood problems and were asked to indicate whether each item posed a big problem, small problem, or no problem in their neighborhood.
Source: AdvantAge Initiative Community Survey in Indiana 2008
Unweighted N= 300Weighted N= 21,059
Traffic lights too few/too fast
§ Area 15 includes Crawford, Lawrence, Orange, and Washington Counties.
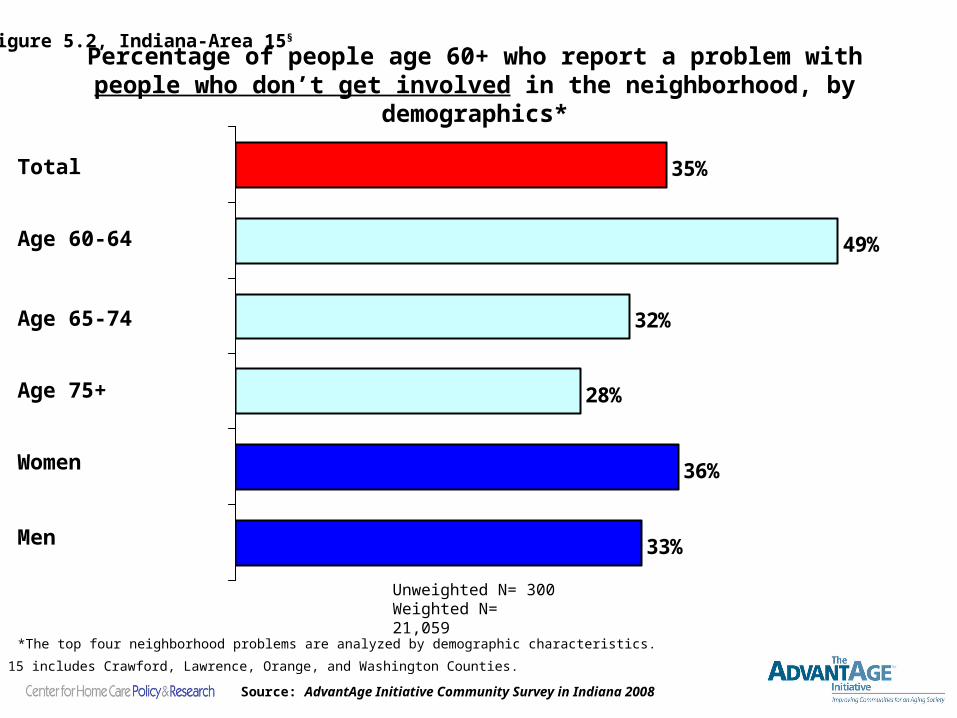
Percentage of people age 60+ who report a problem with people who don’t get involved in the neighborhood, by demographics*
33%
36%
28%
32%
49%
35%
Figure 5.2, Indiana-Area 15§
Source: AdvantAge Initiative Community Survey in Indiana 2008
Total
Age 60-64
Age 65-74
Men
Women
Age 75+
Unweighted N= 300Weighted N= 21,059
*The top four neighborhood problems are analyzed by demographic characteristics.§ Area 15 includes Crawford, Lawrence, Orange, and Washington Counties.
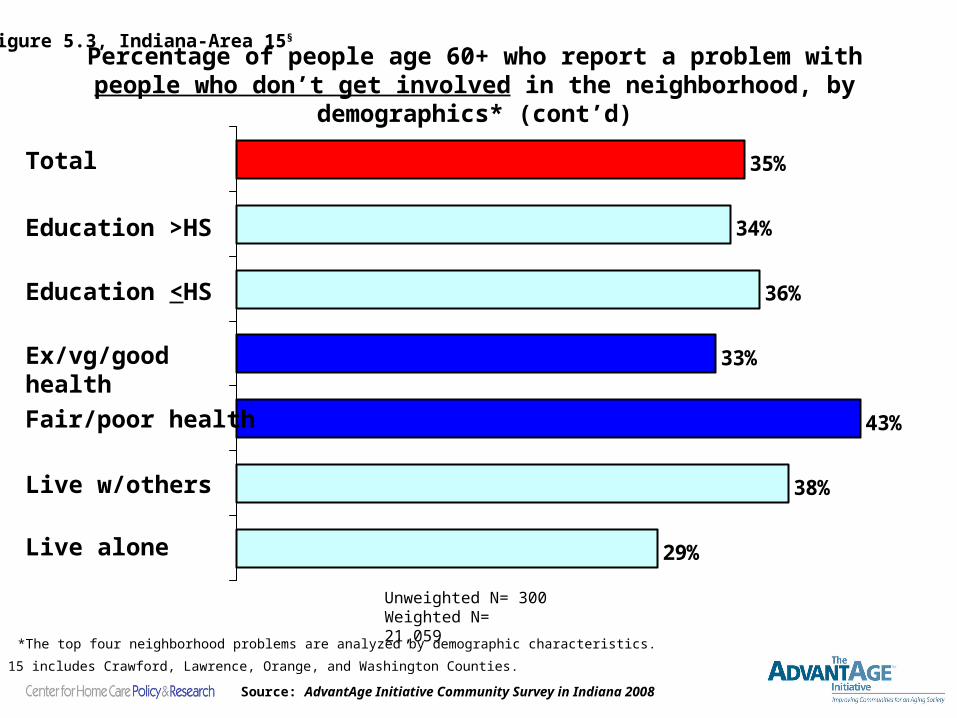
Percentage of people age 60+ who report a problem with people who don’t get involved in the neighborhood, by demographics* (cont’d)
29%
38%
43%
33%
36%
34%
35%Total
Education >HS
Education <HS
Live w/others
Ex/vg/good health
Fair/poor health
Figure 5.3, Indiana-Area 15§
Live alone
Source: AdvantAge Initiative Community Survey in Indiana 2008
Unweighted N= 300Weighted N= 21,059
*The top four neighborhood problems are analyzed by demographic characteristics.§ Area 15 includes Crawford, Lawrence, Orange, and Washington Counties.
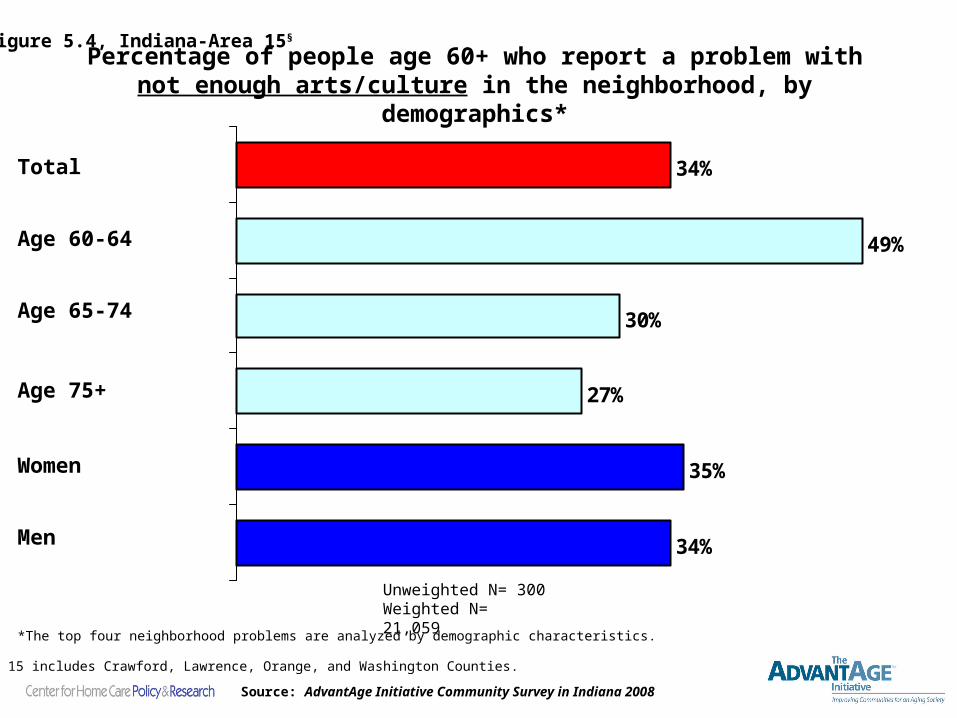
Percentage of people age 60+ who report a problem with not enough arts/culture in the neighborhood, by demographics*
34%
35%
27%
30%
49%
34%
Figure 5.4, Indiana-Area 15§
*The top four neighborhood problems are analyzed by demographic characteristics.
Source: AdvantAge Initiative Community Survey in Indiana 2008
Total
Age 60-64
Age 65-74
Men
Women
Age 75+
Unweighted N= 300Weighted N= 21,059
§ Area 15 includes Crawford, Lawrence, Orange, and Washington Counties.

Percentage of people age 60+ who report a problem with not enough arts/culture in the neighborhood, by demographics* (cont’d)
30%
36%
33%
34%
31%
40%
34%Total
Education >HS
Education <HS
Live w/others
Ex/vg/good health
Fair/poor health
Figure 5.5, Indiana-Area 15§
*The top four neighborhood problems are analyzed by demographic characteristics.
Live alone
Source: AdvantAge Initiative Community Survey in Indiana 2008
Unweighted N= 300Weighted N= 21,059
§ Area 15 includes Crawford, Lawrence, Orange, and Washington Counties.
‡
‡ This percentage is based on fewer than 20 respondents (Unweighted N<20) and should be interpreted with caution.

Percentage of people age 60+ who report a problem with streets needing repair in the neighborhood, by demographics*
29%
33%
29%
27%
41%
31%
Figure 5.6, Indiana-Area 15§
*The top four neighborhood problems are analyzed by demographic characteristics.
Source: AdvantAge Initiative Community Survey in Indiana 2008
Total
Age 60-64
Age 65-74
Men
Women
Age 75+
Unweighted N= 300Weighted N= 21,059
§ Area 15 includes Crawford, Lawrence, Orange, and Washington Counties.

Percentage of people age 60+ who report a problem with streets needing repair in the neighborhood, by demographics* (cont’d)
36%
29%
25%
33%
30%
35%
31%Total
Education >HS
Education <HS
Live w/others
Ex/vg/good health
Fair/poor health
Figure 5.7, Indiana-Area 15§
*The top four neighborhood problems are analyzed by demographic characteristics.
Live alone
Source: AdvantAge Initiative Community Survey in Indiana 2008
Unweighted N= 300Weighted N=21,059
§ Area 15 includes Crawford, Lawrence, Orange, and Washington Counties.
‡
‡ This percentage is based on fewer than 20 respondents (Unweighted N<20) and should be interpreted with caution.
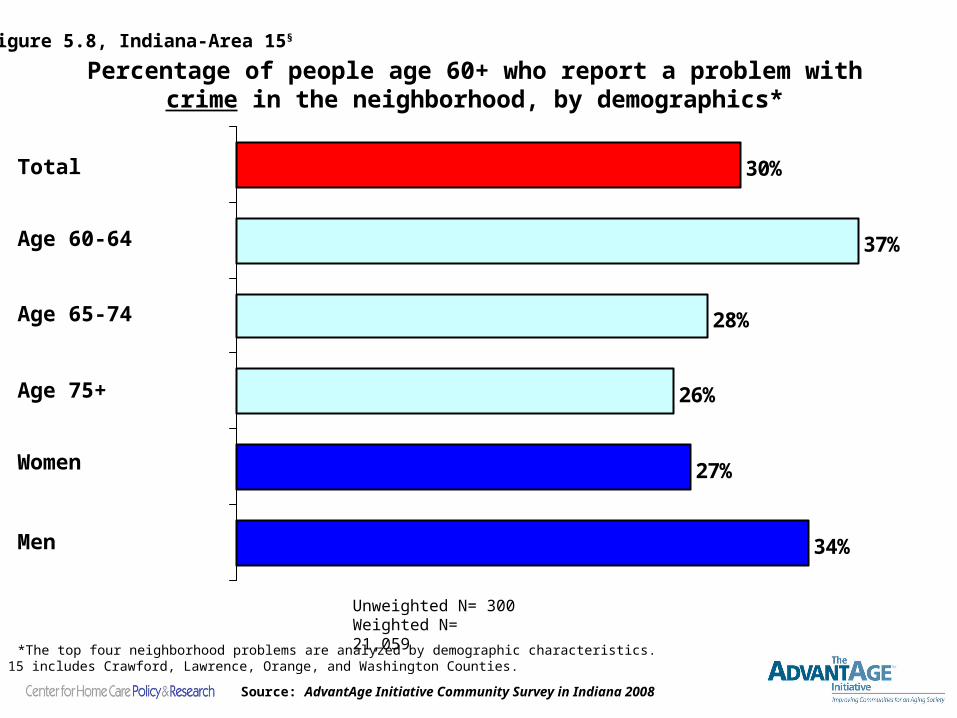
Percentage of people age 60+ who report a problem with crime in the neighborhood, by demographics*
34%
27%
26%
28%
37%
30%
Figure 5.8, Indiana-Area 15§
Source: AdvantAge Initiative Community Survey in Indiana 2008
Total
Age 60-64
Age 65-74
Men
Women
Age 75+
Unweighted N= 300Weighted N= 21,059
*The top four neighborhood problems are analyzed by demographic characteristics.§ Area 15 includes Crawford, Lawrence, Orange, and Washington Counties.

Percentage of people age 60+ who report a problem with crime in the neighborhood, by demographics* (cont’d)
29%
30%
25%
31%
30%
30%
30%Total
Education >HS
Education <HS
Live w/others
Ex/vg/good health
Fair/poor health
Figure 5.9, Indiana-Area 15§
*The top four neighborhood problems are analyzed by demographic characteristics.
Live alone
Source: AdvantAge Initiative Community Survey in Indiana 2008
Unweighted N= 300Weighted N= 21,059
§ Area 15 includes Crawford, Lawrence, Orange, and Washington Counties.
‡
‡ This percentage is based on fewer than 20 respondents (Unweighted N<20) and should be interpreted with caution.

Percentage of people age 60+ who are satisfied with the neighborhood as a place to live*
Unweighted N=300Weighted N=21,059
Note: Percentages may not add up to 100% due to rounding and/or missing information.
Figure 6.1, Indiana-Area 15§
Not VerySatisfied**
19%
Very Satisfied81%
*People were asked how satisfied they are with their neighborhood as a place to live.**The category “Not very satisfied” includes those who said they were somewhat satisfied, somewhat dissatisfied, or very dissatisfied with their neighborhood.
Source: AdvantAge Initiative Community Survey in Indiana 2008
§ Area 15 includes Crawford, Lawrence, Orange, and Washington Counties.

Percentage of people age 60+ who are satisfied with the neighborhood as a place to live,* by demographics
20%
18%
15%
23%
18%
19%
80%
82%
85%
77%
82%
81%
Not Very Satisfied** Very Satisfied
Note: Percentages may not add up to 100% due to rounding and/or missing information.Unweighted N= 300Weighted N= 21,059
Figure 6.2, Indiana-Area 15§
*People were asked how satisfied they are with their neighborhood as a place to live.**The category “Not very satisfied” includes those who said they were somewhat satisfied, somewhat dissatisfied, or very dissatisfied with their neighborhood.
Source: AdvantAge Initiative Community Survey in Indiana 2008
Total
Age 60-64
Age 65-74
Men
Women
Age 75+
§ Area 15 includes Crawford, Lawrence, Orange, and Washington Counties.
‡ This percentage is based on fewer than 20 respondents (Unweighted N<20) and should be interpreted with caution.
‡
‡
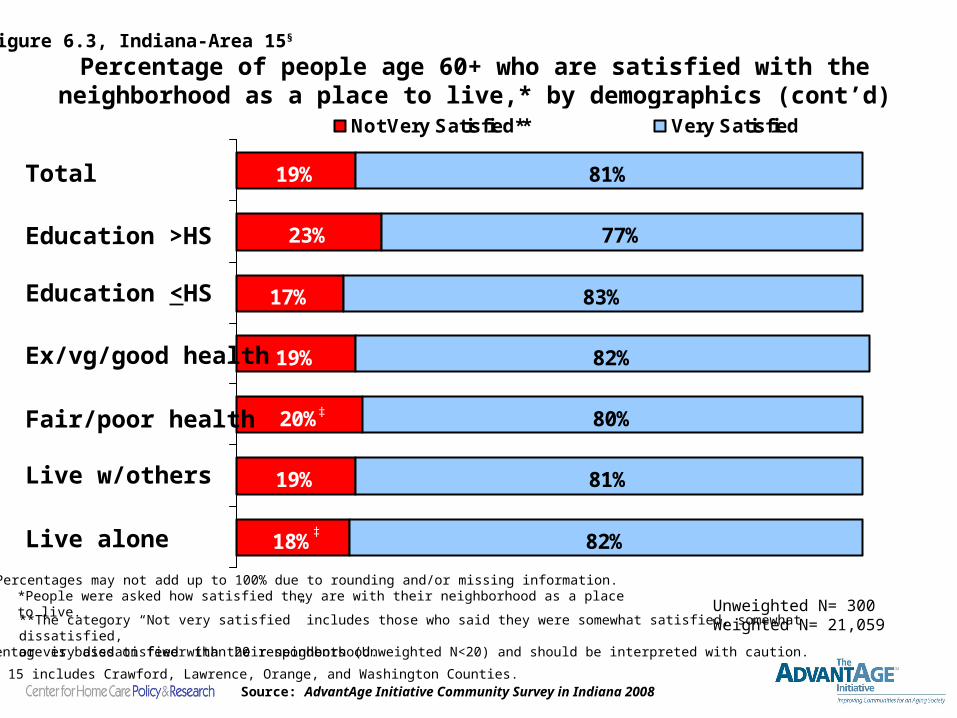
Percentage of people age 60+ who are satisfied with the neighborhood as a place to live,* by demographics (cont’d)
18%
19%
20%
19%
17%
23%
19%
82%
81%
80%
82%
83%
77%
81%
Not Very Satisfied** Very Satisfied
Total
Note: Percentages may not add up to 100% due to rounding and/or missing information.
Figure 6.3, Indiana-Area 15§
*People were asked how satisfied they are with their neighborhood as a place to live.
**The category “Not very satisfied” includes those who said they were somewhat satisfied, somewhat dissatisfied, or very dissatisfied with their neighborhood.
Source: AdvantAge Initiative Community Survey in Indiana 2008
Education >HS
Education <HS
Live w/others
Ex/vg/good health
Fair/poor health
Live alone
Unweighted N= 300Weighted N= 21,059
§ Area 15 includes Crawford, Lawrence, Orange, and Washington Counties.
‡
‡
‡ This percentage is based on fewer than 20 respondents (Unweighted N<20) and should be interpreted with caution.

Percentage of people age 60+ who report cutting the size of or skipping meals due to lack of money*
Note: Percentages may not add up to 100% due to rounding and/or missing information.
Figure 7.1, Indiana-Area 15§
*People were asked if in the past 12 months they or another adult in their household cut the size of or skipped meals because there wasn’t enough money for food.
Cut the size of or skipped
meals
Did not cut or skip meals97%
Source: AdvantAge Initiative Community Survey in Indiana 2008
3%
Unweighted N=300Weighted N= 21,059
§ Area 15 includes Crawford, Lawrence, Orange, and Washington Counties.
DK/RF<1%
‡
‡ This percentage is based on fewer than 20 respondents (Unweighted N<20) and should be interpreted with caution.
‡
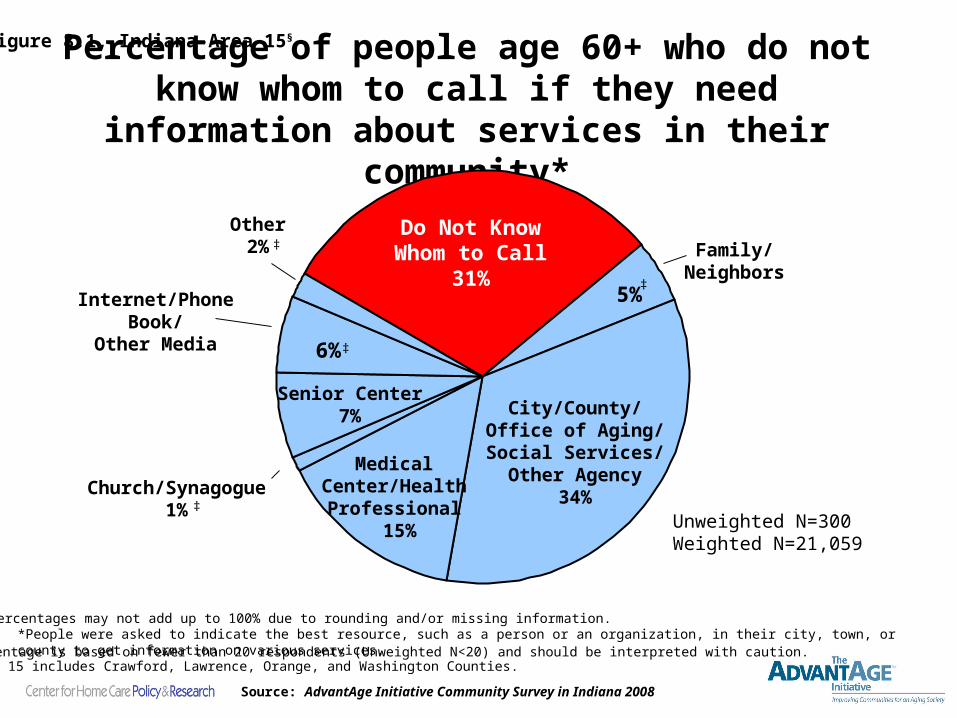
Percentage of people age 60+ who do not know whom to call if they need information about
services in their community*
Unweighted N=300Weighted N=21,059
Note: Percentages may not add up to 100% due to rounding and/or missing information.
Figure 8.1, Indiana-Area 15§
*People were asked to indicate the best resource, such as a person or an organization, in their city, town, or county to get information on various services.
Do Not Know Whom to Call
31%Family/
Neighbors
City/County/Office of Aging/Social Services/Other Agency
34%Church/Synagogue1%
Other2%
Internet/Phone Book/Other Media
Senior Center7%
Source: AdvantAge Initiative Community Survey in Indiana 2008
5%
Medical Center/Health Professional
15%
6%
§ Area 15 includes Crawford, Lawrence, Orange, and Washington Counties.‡ This percentage is based on fewer than 20 respondents (Unweighted N<20) and should be interpreted with caution.
‡
‡
‡
‡
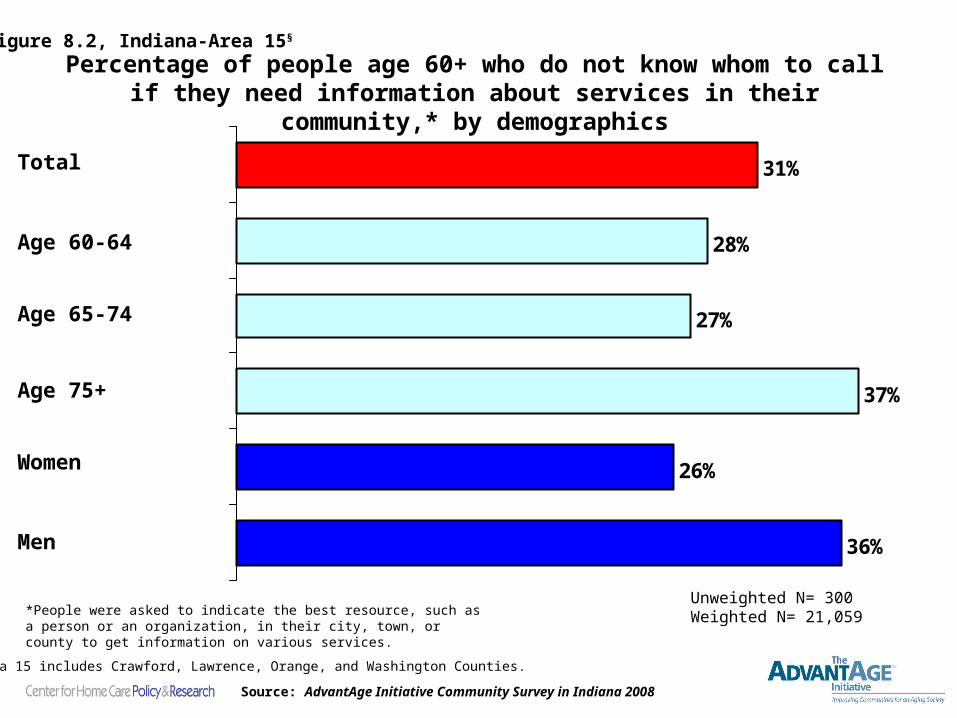
Percentage of people age 60+ who do not know whom to call if they need information about services in their community,* by demographics
36%
26%
37%
27%
28%
31%
Unweighted N= 300Weighted N= 21,059
Figure 8.2, Indiana-Area 15§
*People were asked to indicate the best resource, such as a person or an organization, in their city, town, or county to get information on various services.
Source: AdvantAge Initiative Community Survey in Indiana 2008
Total
Age 60-64
Age 65-74
Men
Women
Age 75+
§ Area 15 includes Crawford, Lawrence, Orange, and Washington Counties.

Percentage of people age 60+ who do not know whom to call if they need information about services in their community,* by demographics (cont’d)
28%
32%
32%
30%
33%
25%
31%Total
Figure 8.3, Indiana-Area 15§
*People were asked to indicate the best resource, such as a person or an organization, in their city, town, or county to get information on various services.
Source: AdvantAge Initiative Community Survey in Indiana 2008
Education >HS
Education <HS
Live w/others
Ex/vg/good health
Fair/poor health
Live alone
Unweighted N= 300Weighted N= 21,059
§ Area 15 includes Crawford, Lawrence, Orange, and Washington Counties.
‡
‡ This percentage is based on fewer than 20 respondents (Unweighted N<20) and should be interpreted with caution.

Note: Percentages may not add up to 100% due to rounding and/or missing information.
88%79% 77% 77%
71% 71% 67%60%
39%27%
6%
6% 11%15% 14%
15%19%
31%
26%
5%16% 12% 12% 13% 15% 18% 21%
29%
47%10%
Don't Know
No
Yes
SeniorCenter
Meals-on-
wheels
VisitingNurse
Special Trans-portation
Hospice CongregateMeals
HomeHealthAide
Home-maker
Service
HomeRepairService
Respite
Figure 9.1, Indiana-Area 15§
Percentage of people age 60+ who are aware/unaware of selected services in their community*
*Respondents were asked whether these 10 services are available in their area.
Unweighted N=300Weighted N=21,059
Source: AdvantAge Initiative Community Survey in Indiana 2008
§ Area 15 includes Crawford, Lawrence, Orange, and Washington Counties.‡ This percentage is based on fewer than 20 respondents (Unweighted N<20) and should be interpreted with caution.
‡‡
‡

Percentage of people age 60+ who are unaware of most selected services* in their community, by demographics
7%
5%
4%
5%
10%
6%
Unweighted N=300Weighted N=21,059
Figure 9.2, Indiana-Area 15§
*Most selected services is defined as 6 or more services. Respondents were asked whether the following 10 services exist in their community: Respite; Home repair service; Homemaker service; Home health aide; Congregate meals; Hospice; Senior center; Visiting nurse; Meals-on-wheels; Special transportation service.
Source: AdvantAge Initiative Community Survey in Indiana 2008
Total
Age 60-64
Age 65-74
Men
Women
Age 75+
§ Area 15 includes Crawford, Lawrence, Orange, and Washington Counties.‡ This percentage is based on fewer than 20 respondents (Unweighted N<20) and should be interpreted with caution.
‡
‡
‡
‡
‡
‡

Percentage of people age 60+ who are unaware of most selected services* in their community, by demographics (cont’d)
8%
4%
7%
6%
6%
5%
6%Total
Unweighted N=300Weighted N=21,059
Figure 9.3, Indiana-Area 15§
*Most selected services is defined as 6 or more services. Respondents were asked whether the following 10 services exist in their community: Respite; Home repair service; Homemaker service; Home health aide; Congregate meals; Hospice; Senior center; Visiting nurse; Meals-on-wheels; Special transportation service.
Source: AdvantAge Initiative Community Survey in Indiana 2008
Education >HS
Education <HS
Live w/others
Ex/vg/good health
Fair/poor health
Live alone
§ Area 15 includes Crawford, Lawrence, Orange, and Washington Counties.‡ This percentage is based on fewer than 20 respondents (Unweighted N<20) and should be interpreted with caution.
‡
‡
‡
‡
‡
‡
‡
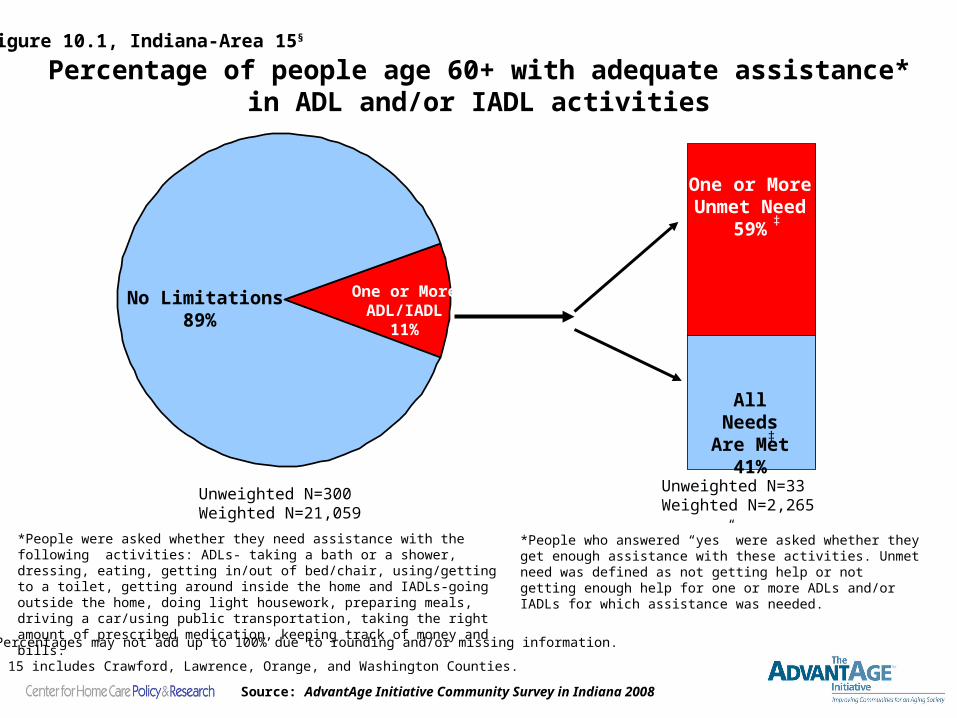
Percentage of people age 60+ with adequate assistance* in ADL and/or IADL activities
Unweighted N=33Weighted N=2,265
Unweighted N=300Weighted N=21,059
No Limitations89%
One or More ADL/IADL
11%
All Needs Are Met
41%
One or More Unmet Need
59%
Figure 10.1, Indiana-Area 15§
Note: Percentages may not add up to 100% due to rounding and/or missing information.
*People were asked whether they need assistance with the following activities: ADLs- taking a bath or a shower, dressing, eating, getting in/out of bed/chair, using/getting to a toilet, getting around inside the home and IADLs-going outside the home, doing light housework, preparing meals, driving a car/using public transportation, taking the right amount of prescribed medication, keeping track of money and bills.
*People who answered “yes” were asked whether they get enough assistance with these activities. Unmet need was defined as not getting help or not getting enough help for one or more ADLs and/or IADLs for which assistance was needed.
Source: AdvantAge Initiative Community Survey in Indiana 2008
§ Area 15 includes Crawford, Lawrence, Orange, and Washington Counties.
‡
‡

Percentage of people age 60+ who have one or more limitations with ADL and/or IADL activities,* by demographics
13%
9%
11%
10%
11%
11%
Unweighted N=300Weighted N=21,059
Figure 10.2, Indiana-Area 15§
*People were asked whether they need assistance with the following activities: ADLs- taking a bath or a shower, dressing, eating, getting in/out of bed/chair, using/getting to a toilet, getting around inside the home and IADLs-going outside the home, doing light housework, preparing meals, driving a car/using public transportation, taking the right amount of prescribed medication, keeping track of money and bills.
Source: AdvantAge Initiative Community Survey in Indiana 2008
Total
Age 60-64
Age 65-74
Men
Women
Age 75+
§ Area 15 includes Crawford, Lawrence, Orange, and Washington Counties.‡ This percentage is based on fewer than 20 respondents (Unweighted N<20) and should be interpreted with caution.
‡
‡
‡
‡
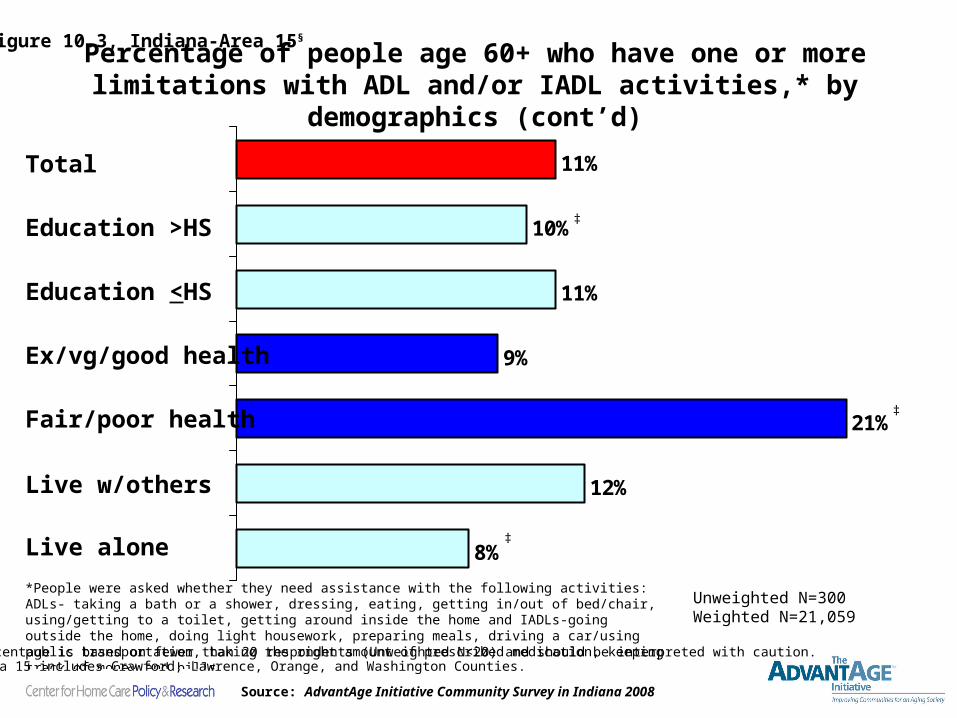
Percentage of people age 60+ who have one or more limitations with ADL and/or IADL activities,* by demographics (cont’d)
8%
12%
21%
9%
11%
10%
11%Total
Unweighted N=300Weighted N=21,059
Figure 10.3, Indiana-Area 15§
*People were asked whether they need assistance with the following activities: ADLs- taking a bath or a shower, dressing, eating, getting in/out of bed/chair, using/getting to a toilet, getting around inside the home and IADLs-going outside the home, doing light housework, preparing meals, driving a car/using public transportation, taking the right amount of prescribed medication, keeping track of money and bills.
Source: AdvantAge Initiative Community Survey in Indiana 2008
Education >HS
Education <HS
Live w/others
Ex/vg/good health
Fair/poor health
Live alone
§ Area 15 includes Crawford, Lawrence, Orange, and Washington Counties.‡ This percentage is based on fewer than 20 respondents (Unweighted N<20) and should be interpreted with caution.
‡
‡
‡
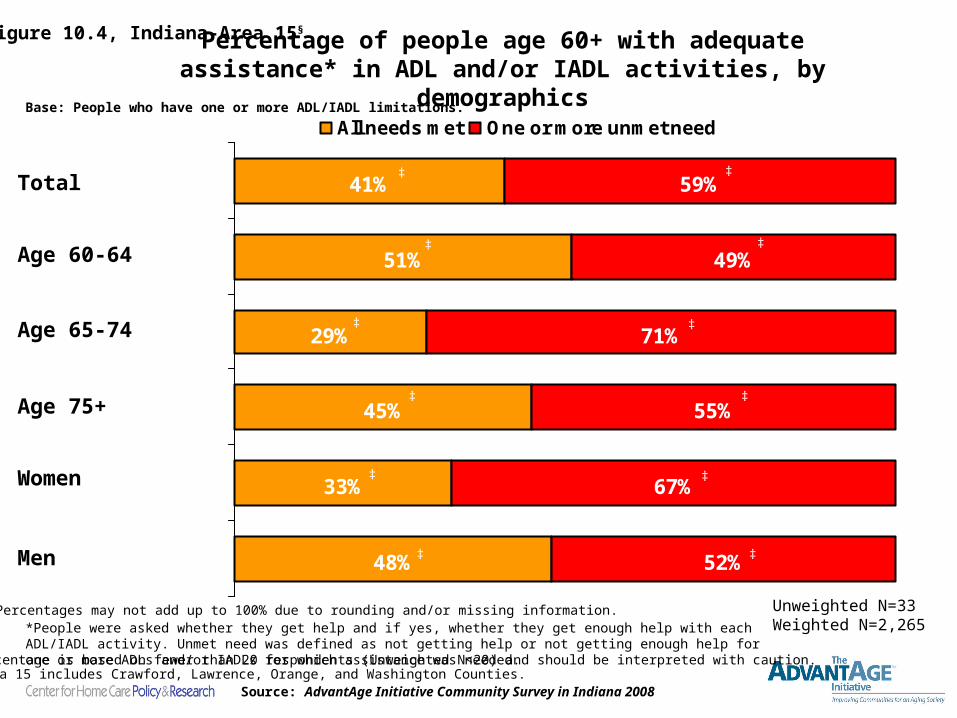
48%
33%
45%
29%
51%
41%
52%
67%
55%
71%
49%
59%
All needs met One or more unmet need
Figure 10.4, Indiana-Area 15§
Percentage of people age 60+ with adequate assistance* in ADL and/or IADL activities, by demographics
*People were asked whether they get help and if yes, whether they get enough help with each ADL/IADL activity. Unmet need was defined as not getting help or not getting enough help for one or more ADLs and/or IADLs for which assistance was needed.
Base: People who have one or more ADL/IADL limitations.
Note: Percentages may not add up to 100% due to rounding and/or missing information. Unweighted N=33Weighted N=2,265
Source: AdvantAge Initiative Community Survey in Indiana 2008
Total
Age 60-64
Age 65-74
Men
Women
Age 75+
§ Area 15 includes Crawford, Lawrence, Orange, and Washington Counties.‡ This percentage is based on fewer than 20 respondents (Unweighted N<20) and should be interpreted with caution.
‡ ‡
‡‡
‡ ‡
‡‡
‡ ‡
‡‡
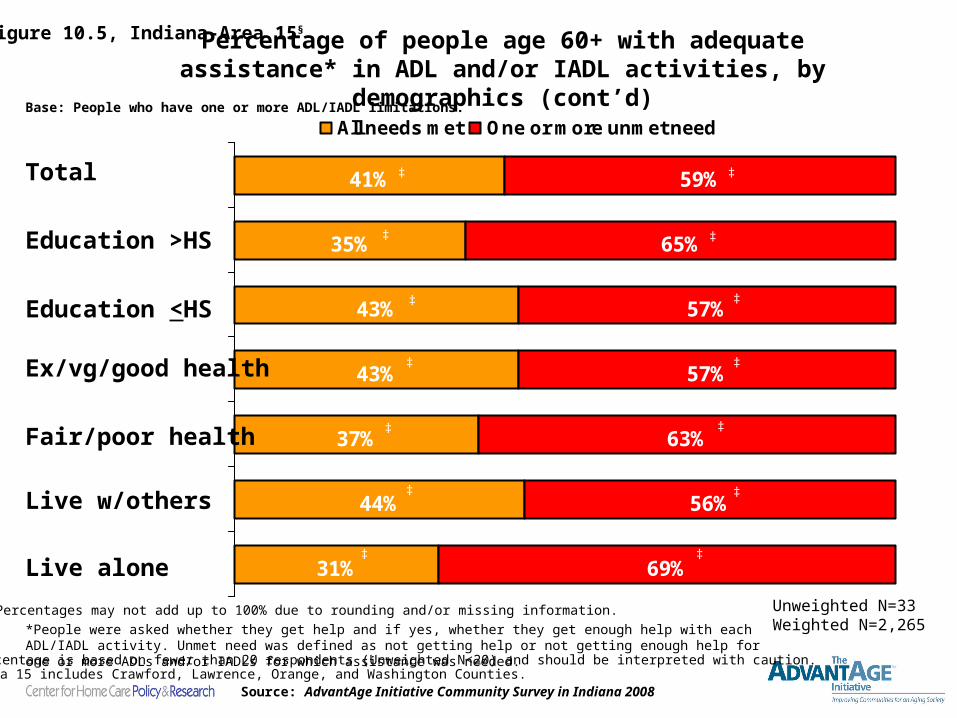
31%
44%
37%
43%
43%
35%
41%
69%
56%
63%
57%
57%
65%
59%
All needs met One or more unmet need
Total
Figure 10.5, Indiana-Area 15§
Percentage of people age 60+ with adequate assistance* in ADL and/or IADL activities, by demographics (cont’d)
*People were asked whether they get help and if yes, whether they get enough help with each ADL/IADL activity. Unmet need was defined as not getting help or not getting enough help for one or more ADLs and/or IADLs for which assistance was needed.
Base: People who have one or more ADL/IADL limitations.
Note: Percentages may not add up to 100% due to rounding and/or missing information.
Source: AdvantAge Initiative Community Survey in Indiana 2008
Education >HS
Education <HS
Live w/others
Ex/vg/good health
Fair/poor health
Live alone
§ Area 15 includes Crawford, Lawrence, Orange, and Washington Counties.
Unweighted N=33Weighted N=2,265
‡ This percentage is based on fewer than 20 respondents (Unweighted N<20) and should be interpreted with caution.
‡‡
‡ ‡
‡‡
‡ ‡
‡‡
‡ ‡
‡‡