Address the attribution problem - World...
14
21 time spent fetching water. If nothing else of importance happened during the period under study, attribution is so clear that there is no need to resort to anything other than before versus after to determine this impact. In general, the observed changes are only partly caused by the intervention of interest. Other interventions inside or outside the core area will often interact and strengthen/reduce the effects of the intervention of interest for the evaluation. In addition, other unplanned events or general change processes will often influence develop- ment, such as natural catastrophes, urbaniza- tion, growing economies, business cycles, war, or long-term climate change. For example, in evaluating the impact of microfinance on poverty, we have to control for the influences of changing market conditions, infrastruc- ture developments, or climate shocks such as droughts, and so on. A discussion that often comes up in impact evaluation is the issue of attribution of what. This issue is complementary to the indepen- dent variable question discussed in chapter 1. 4.1. The attribution problem The attribution problem is often referred to as the central problem in impact evaluation. The central question is to what extent changes in outcomes of interest can be attributed to a particular intervention. Attribution refers to both isolating and estimating accurately the particu- lar contribution of an intervention and ensuring that causality runs from the intervention to the outcome. The changes in welfare for a particular group of people can be observed by undertaking before and after studies, but these rarely accurately measure impact. Baseline data (before the intervention) and end-line data (after the intervention) give facts about the development over time and describe “the factual” for the treatment group (not the counterfactual). But changes observed by comparing before-after (or pre-post) data are rarely caused by the interven- tion alone, as other interventions and processes influence developments, both in time and space. There are some exceptions in which before versus after will suffice to determine impact. For example, supplying village water pumps reduces M ultiple factors can affect the livelihoods of individuals or the capaci- ties of institutions. For policy makers as well as stakeholders it is important to know what the added value of the policy intervention is, apart from these other factors. Address the attribution problem Chapter 4
Transcript of Address the attribution problem - World...

2 1
time spent fetching water. If nothing else of importance happened during the period under study, attribution is so clear that there is no need to resort to anything other than before versus after to determine this impact.
In general, the observed changes are only partly caused by the intervention of interest. Other interventions inside or outside the core area will often interact and strengthen/reduce the effects of the intervention of interest for the evaluation. In addition, other unplanned events or general change processes will often influence develop-ment, such as natural catastrophes, urbaniza-tion, growing economies, business cycles, war, or long-term climate change. For example, in evaluating the impact of microfinance on poverty, we have to control for the influences of changing market conditions, infrastruc-ture developments, or climate shocks such as droughts, and so on.
A discussion that often comes up in impact evaluation is the issue of attribution of what. This issue is complementary to the indepen-dent variable question discussed in chapter 1.
4.1. the attribution problemThe attribution problem is often referred to as the central problem in impact evaluation. The central question is to what extent changes in outcomes of interest can be attributed to a particular intervention. Attribution refers to both isolating and estimating accurately the particu-lar contribution of an intervention and ensuring that causality runs from the intervention to the outcome.
The changes in welfare for a particular group of people can be observed by undertaking before and after studies, but these rarely accurately measure impact. Baseline data (before the intervention) and end-line data (after the intervention) give facts about the development over time and describe “the factual” for the treatment group (not the counterfactual). But changes observed by comparing before-after (or pre-post) data are rarely caused by the interven-tion alone, as other interventions and processes influence developments, both in time and space. There are some exceptions in which before versus after will suffice to determine impact. For example, supplying village water pumps reduces
Multiple factors can affect the livelihoods of individuals or the capaci-ties of institutions. For policy makers as well as stakeholders it is important to know what the added value of the policy intervention
is, apart from these other factors.
Address the attribution problem
Chapter 4

2 2
I m pa c t E va l u at I o n s a n d d E v E l o p m E n t – n o n I E G u I d a n c E o n I m pa c t E va l u at I o n
The value of a target variable (point a) after an intervention should not be regarded as the intervention’s impact, nor is it simply the differ-ence between the before and after situation (a–b, measured on the vertical axis). The net impact (at a given point in time) is the difference between the target variable’s value after the intervention and the value the variable would have had if the intervention had not taken place (a–c).
The starting point for an evaluation is a good account of the factual—what happened in terms of the outputs/outcomes targeted by the interven-tion? A good account of the factual requires articulating the intervention theory (or theories) and connecting the different causal assumptions from intervention outputs to outcomes and impacts, as discussed earlier in chapter 3. This guidance will discuss several options for measur-ing the counterfactual.
Evaluations can either be experimental, as when the evaluator purposely collects data and designs evaluations in advance, or quasi-experi-mental, as when data are collected to mimic an experimental situation. Multiple regres-sion analysis is an all-purpose technique that can be used in virtually all settings (provided that data are available); when the experiment is organized in such a way that no controls are needed, a simple comparison of means can be used instead of a regression, because both will give the same answer. (Experimental and quasi-experimental approaches will be discussed in § 4.2.) We briefly introduce the general principles and the most common approaches. The idea of (quasi-) experimental counterfactual analysis is that the situation of a participant group (receiv-ing benefits from/affected by an intervention) is compared over time with the situation of an equivalent comparison group that is not affected by the intervention.
Several designs exist of combinations of ex ante and ex post measurements of participant and control groups (see § 4.2.). Randomization of intervention participation is considered the best way to create equivalent groups. Random assign-ment to the participant and control group leads
How the impact of the intervention is measured may be stated in several ways:
• What is the impact of an additional dollar of funding to program X?1
• What is the impact of country Y’s contribution to a particular intervention?
• What is the impact of intervention Z?
In this guidance we will focus on the third level of attribution: What is the impact of a particu-lar policy intervention (from very simple to complex), independent of the specific monetary and nonmonetary contributions of the (institu-tional) actors involved?
The issue of attributing impact to a particular intervention can be a quite complicated issue in itself (especially when talking about compli-cated interventions such as sector strategies or programs). Additional levels of attribution, such as tracing impact back from interventions to specific (financial) contributions of different donors, are either meaningless or too complicated to achieve in a pragmatic and cost-effective manner.
Analyzing attribution requires comparing the situation “with” an intervention to what would have happened in the absence of an interven-tion, the “without” situation (the counterfac-tual). Such comparison of the situation with and without the intervention is challenging because it is not possible to observe how the situation would have been without the intervention, so that has to be constructed by the evaluator. The counterfactual is illustrated in figure 4.1.
Figure 4.1: Graphic display of the net impact of an intervention
Before AfterTime
a
b
cValu
eta
rget
var
iabl
e

2 3
a d d r E s s t h E at t r I b u t I o n p r o b l E m
controlled trial (RCT) or the pipeline approach can be compromised by two sets of problems: contam-ination and unintended behavioral responses.
Contamination: Contamination (or contagion, treatment diffusion) refers to the problem of groups of people that are not supposed to be exposed to certain project benefits but in fact are benefiting from them. Contamination comes from two possible sources. The first is from the interven-tion itself, as a result of spill-over effects. Interven-tions are most often planned and implemented within a delimited space (a village, district, nation, region, or institution). The influence zone of an intervention may, however, be larger than the core area where the intervention takes place or is intended to generate results (geographical spill-over effects). To avoid contamination, control and comparison groups must be located outside the influence zone. Second, the selected compari-son group may be subject to similar interven-tions implemented by different agencies, or even somewhat dissimilar interventions that affect the same outcomes. The counterfactual is thus a different type of intervention rather than no intervention. This problem is often overlooked. A good intervention theory as a basis for designing a measurement instrument that records the differ-ent potential problems of contamination is a good way to address this problem.
Unintended behavioral responses: In any experiment people may behave differently when they know that they are part of the intervention or treatment. Consequently, this will affect data. The resulting bias is even more pronounced when the researcher has to rely on recall data or self-reported effects. Several unintended behavioral responses not caused by the interven-tion or by “normal” conditions might therefore disrupt the validity of comparisons between groups and hence the ability to attribute changes to project incentives. Important possible effects are the following (see Shadish et al., 2002; Rossi et al., 2004):
• Expected behavior or compliance behavior: Participants react in accordance with inter-vention staff expectations for reasons such
to groups with similar average characteristics2 for both observables and non-observables, except for the intervention. As a second best alternative, several matching techniques (e.g., propensity score matching) can be used to create control groups that are as similar to participant groups as possible (see below).
4.2. Quantitative methods addressing the attribution problem3
In this section we discuss experimental (e.g., randomized controlled trials), quasi-experimen-tal (e.g., propensity score matching), and regres-sion-based techniques.4, 5
Three related problems that quantitative impact evaluation methods attempt to address are the following:
• The establishment of a counterfactual: What would have happened in the absence of the intervention(s)?
• The elimination of selection effects, leading to differences between the intervention group (or treatment group) and the control group
• A solution for the problem of unobservables: The omission of one or more unobserved vari-ables, leading to biased estimates.
Selection effects occur, for example, when those in the intervention group are more or less motivated than those in the control group. It is particularly a problem when the variable in question, in this case motivation, is not easily observable. As long as selection is based on observable characteristics and these are measured in the evaluation, they may be included—and thus controlled for—in the regression analysis. However, not all relevant characteristics are observed or measured. This problem of selection of unobservables is one of the main problems in impact evaluation.
In the following sections we will discuss differ-ent techniques of quantitative impact evaluation, thereby mainly focusing our discussion on the selection bias issue. In trying to deal systemati-cally with selection effects, (quasi-) experimental design-based approaches such as the randomized

2 4
I m pa c t E va l u at I o n s a n d d E v E l o p m E n t – n o n I E G u I d a n c E o n I m pa c t E va l u at I o n
To determine if the intervention had a statistically significant impact, one simply performs a test of equality between the mean outcomes in the experiment and control group. Statistical analysis will tell you if the impact is statistically signifi-cant and how large it is. Of course, with larger samples, the statistical inferences will be increas-ingly precise; but if the impact of an intervention really is large, it can be detected and measured even with a relatively small sample.
A proper RCT addresses many attribution issues, but has to be planned and managed carefully to avoid contamination and other risks. Risks of a RCT are (i) different rates of attrition in the two groups, possibly caused by a high dropout in one of the two groups, (ii) spillover effects (contami-nation) resulting in the control group receiv-ing some of the treatment, and (iii) unintended behavioral responses.
4.2.2. Pipeline approachOne of the problems for the evaluation of development projects or programs is that evalua-tors rarely get involved early enough to design a good evaluation (although this is changing). Often, households or individuals are selected for a specific project, but not everybody participates (directly) in the project. A reason may be a gradual implementation of the project. Large projects (such as in housing or construction of schools) normally have a phased implementation.
In such a case, it may be possible to exploit this phase of the project by comparing the outcomes of households or communities that actually participate (the experiment group) with households or communities that are selected but do not participate (the compari-son group). A specific project (school building) may start, for instance, in a number of villages and be implemented later in other villages. This creates the possibility of evaluating the effect of school building on enrollment. One has to be certain, of course, that the second selection—the actual inclusion in the project—does not introduce a selection bias. If, for instance, at the start of the project a choice is made to start construction in a number of specific villages, the
as compliance with the established contract or certain expectations about future benefits from the organization (not necessarily the project).
• Compensatory equalization: Discontent among staff or recipients with inequality be-tween incentives might result in compensa-tion of groups that receive less than other groups.
• Compensatory rivalry: Differentiation of in-centives to groups of people might result in social competition between those receiving (many) intervention benefits and those receiv-ing fewer or no benefits.
• Hawthorne effect: The fact of being part of an experiment rather than the intervention as such causes people to change their behavior.
• Placebo effect: The behavioral effect is not the result of the incentives provided by the intervention but of people’s perception of the incentives and the subsequent anticipatory behavior.
These problems are relevant in most experimen-tal and quasi-experimental design approaches that are based on ex ante participant and control/comparison group designs.6 They are less relevant in regression-based approaches that use statisti-cal matching procedures or that do not rely on the participant-control group comparison for counterfactual analysis.7
4.2.1. Randomized controlled trialThe safest way to avoid selection effects is a randomized selection of the intervention and control groups before the experiment starts. When the experimental group and the control group are selected randomly from the same eligible population, both groups will have similar average characteristics (except that one group has been subjected to the intervention and the other has not). Consequently, in a well-designed and correctly implemented RCT, a simple compari-son of average outcomes in the two groups can adequately resolve the attribution problem and yield accurate estimates of the impact of the intervention on a variable of interest; by design, the only difference between the two groups was the intervention.

2 5
a d d r E s s t h E at t r I b u t I o n p r o b l E m
10 years from a small rural school with a high pupil:teacher ratio in a poor district another boy with the same observed characteristics. This would be a time-consuming procedure, especially for 100 pupils.
An alternative way to create a control group for this case is the method of propensity score matching. This technique involves forming pairs, not by matching every characteristic exactly, but by selecting groups that have similar probabilities of being included in the sample as the treatment group. The technique uses all available informa-tion to construct a control group (see box 4.1.).8 Rosenbaum and Rubin (1983) showed that this method makes it possible to create a control group ex post with characteristics that are similar to the intervention group that would have been created had its members been selected randomly before the beginning of the project.
It should be noted that the technique only deals with selection bias on observables and does not solve potential endogeneity bias (see appendix 4), which results from the omission of unobserved variables. Nevertheless, propen-sity score matching may be combined with the technique of double differencing to correct for the influence of time-invariant unobservables (see below). Moreover, the technique may require a large sample for the selection of the comparison
(relevant) characteristics of these villages must be similar to other villages that are eligible for new schools. Self-selection (of villages that are eager to participate) or other selection criteria (starting in remote areas or in urban areas) may introduce a selection bias.
4.2.3. Propensity score matchingWhen no comparison group has been created at the start of the project or program, a compari-son group may be created ex post through a matching procedure: for every member of the treatment group, one or more members in a control group are selected on the basis of similar observed (and relevant) characteristics.
Suppose there are two groups, one a relatively small intervention group of 100 pupils who will receive a specific reading program. If we want to analyze the effects of this program, we must compare the results of the pupils in the program with other pupils who were not included in the program. We cannot select just any control group, because the intervention group may have been self-selected on the basis of specific charac-teristics (pupils with relatively good results or relatively bad results, pupils from rural areas, from private schools or public schools, boys, girls, orphans, etc.). Therefore, we need to select a group with similar characteristics. One way of doing this would be to find for every boy age
The survey sample included 100 project communes and 100 non-project communes in the same districts. Using the same districts simplified survey logistics and reduced costs, but communes were still far enough apart to avoid “contamination” (control areas being affected by the project). A logit model of the prob-ability of participating in the project was used to calculate the propensity score for each project and non-project commune. Comparison communes were then selected with propensity scores similar to the project communes. The evaluation was also
able to draw on commune-level data collected for administra-tive purposes that cover infrastructure, employment, education, health care, agriculture, and community organization. These data will be used for contextual analysis, to construct commune-level indicators of welfare, and to test program impacts over time. The administrative data will also be used to model the process of project selection and to assess whether there are any selection biases.
Box 4.1: Using propensity scores to select a matched comparison group—The Vietnam Rural Roads Project
Sources: Van De Walle and Cratty (2005); Bamberger (2006).

2 6
I m pa c t E va l u at I o n s a n d d E v E l o p m E n t – n o n I E G u I d a n c E o n I m pa c t E va l u at I o n
their own ways to select the sample. Sometimes the selection is based on physical characteristics that can be observed (type of housing, distance from water and other services, type of crops or area cultivated), whereas in other cases selection is based on characteristics that require screening interviews (e.g., economic status, labor market activity, school attendance). In these latter cases, the interviewer must conduct quota sampling.
4.2.5. Double difference (difference in difference)Differences between the intervention group and the control group may be unobserved and therefore problematic. Nevertheless, even though such differences cannot be measured, the technique of double difference (or difference-in-difference) deals with these differences as long as they are time invariant. The technique measures differences between the two groups, before and after the intervention (hence the name double difference).
Suppose there are two groups, an intervention group I and a control group C. One measures, for instance, enrollment rates before (0) and after (1) the intervention. According to this method, the effect is
(I1 – I0) – (C1 – C0) or (I1 – C1) – (I0– C0).
For example, if enrolment rates at t = 0 would be 80% (for the intervention group) and 70% for the control group and at t = 1, these rates would be, respectively, 90% and 75%, then the effect of
group, which might pose a problem if secondary data are not available (see chapter 8).
4.2.4. Judgmental matching9
A less precise method for selecting control groups uses descriptive information from, for example, survey data to construct comparison groups.
Matching areas on observables. In consultation with clients and other knowledgeable persons, the researcher identifies characteristics that should be matched (e.g., access to services, type or quality of house construction, economic level, location, or types of agricultural production). Information from maps (sometimes including geographic informa-tion system data and/or aerial photographs), observation, secondary data (e.g., censuses, household surveys, school records), and key informants are then combined to select compari-son areas with the best match of characteristics. Operating under real-world constraints means that it will often be necessary to rely on easily observ-able or identifiable characteristics (e.g., types of housing and infrastructure). Although this may expedite matters, there may also be unobservable differences; the researcher must address these as much as possible through qualitative research and attach the appropriate caveats to any results.
Matching individuals or households on observ-ables. Similar procedures as those noted above can be used to match individuals and households. Sample selection can sometimes draw on existing survey data or ongoing household surveys; however, in many cases researchers must find
Table 4.1: Double difference and other designs
Intervention group control group difference across groups
Baseline I0 C0 I0–C0
Follow-up I1 C1 I1–C1
Difference across time I1–I0 C1–C0
Double-difference:(I1–C1) – (I0–C0) =(I1–I0) – (C1–C0)
Source: Adapted from Maluccio and Flores (2005).
2 7
a d d r E s s t h E at t r I b u t I o n p r o b l E m
between interventions, and interactions between interventions and specific characteristics, as long as the treatment (or intervention) and the characteristics of the subjects in the sample are observed (can be measured). With a regression approach, it may be possible to estimate the contribution of a specific intervention to the total effect or to estimate the effect of the interaction between two interventions. The analysis may include an explicit control group.
We must go beyond a standard regression-based approach when there are unobserved selection effects or endogeneity (see next section). A way to deal with unobserved selection effects is the application of the “difference-in-difference” approach in a regression model (see appendix 4). In such a model we do not analyze the (cross-section) effects between groups, but the changes (within groups) over time. Instead of taking the specific values of a variable in a specific year, we analyze the changes in these variables over time. In such an analysis, unobserved time-invariant variables drop from the equation.10
Again, the quality of this method as a solution depends on the validity of the assumption that unobservables are time invariant. Moreover, the quality of the method also depends on the quality of the underlying data. The method of double differencing is more vulnerable than some other methods to the presence of measurement error in the data.
4.2.7. Instrumental variablesAn important problem when analyzing the impact of an intervention is the problem of endogeneity. The most common example of endogeneity is when a third variable causes two other variables to correlate without there being any causality. For example, doctors are observed to be frequently in the presence of people with fevers, but doctors do not cause the fevers; it is the third variable (the illness) that causes the two other variables to correlate (people with fevers and the presence of doctors). In econometric language, when there is endogeneity an explanatory variable will be correlated with the error term in a mathemati-cal model (see appendix 4). When an explanatory
the intervention would be (90% – 80%) – (75% – 70%) = 5%.
The techniques of propensity score matching (see above) and double difference may be combined. Propensity score matching increases the likelihood that the treatment and control groups have similar characteristics, but cannot guarantee that all relevant characteristics are included in the selection procedure. The double difference technique can eliminate the effects of an unobserved selection bias, but this technique may work better when differences between the intervention group and the control group are eliminated as much as possible. The approach eliminates initial differences between the two groups (e.g., differences in enrollment rates) and therefore gives an unbiased estimate of the effects of the intervention, as long as these differ-ences are time invariant. When an unobserved variable is time variant (changes over time), the measured effect will still be biased.
4.2.6. Regression analysis and double differenceIn some programs the interventions are all or nothing (a household or individual is subjected to the intervention or not); in others they vary continuously over a range, as when programs vary the type of benefit offered to target groups. One example is a cash transfer program or a microfi-nance facility where the amount transferred or loaned may depend on the income of the partici-pant; improved drinking water facilities are another example. These facilities differ in capacity and are implemented in different circumstances with beneficiaries living at different distances to these facilities.
In addition to the need to deal with both discrete and continuous interventions, we also need to control for other factors that affect the outcome other than the magnitude of the intervention. The standard methodology for such an approach is a regression analysis. One of the reasons for the popularity of regression-based approaches is their flexibility: they may deal with the heterogeneity of treatment, multiple interventions, heterogene-ity of characteristics of participants, interactions

2 8
I m pa c t E va l u at I o n s a n d d E v E l o p m E n t – n o n I E G u I d a n c E o n I m pa c t E va l u at I o n
tion depends on income. On the left side of the cut-off point, people (or households) have an income that is just low enough to be eligible for participation; on the right side of the cut-off point, people are no longer allowed to partici-pate, even though their income is just slightly higher. There may be more criteria that define the threshold, and these criteria may be explicit or implicit. Regression discontinuity analysis compares the treatment group with the control group at the cut-off point. At that point, it is unlikely that there are unobserved differences between the two groups.
Suppose we want to analyze the effect of a specific program to improve learning achieve-ments. This program focuses on the poorest households: the program includes only households with an income below a certain level. We know that learning achievements are correlated with income,11 and therefore we cannot compare households participat-ing in the program with households that do not participate. Other factors may induce an endogeneity bias (such as differences in the educational background of parents or the distance to the school). Nevertheless, at the cut-off point, there is no reason to assume that there are systematic differences between the two groups of households (apart from small differences in income). Estimating the impact can now be done, for example, by comparing the mean difference between the regression line of learning achievements in function of income before the intervention with the regres-sion line after (see figure 4.2).
A major disadvantage of a regression discon-tinuity design is that the method assesses the marginal impact of the program only around the cut-off point for eligibility. Moreover, it must be possible to construct a specific threshold, and individuals should not be able to manipu-late the selection process (ADB, 2006: 14). Many researchers prefer regression discontinu-ity analysis above propensity score matching, because the technique generates a higher likelihood that estimates will not be biased by unobserved variables.12
variable is endogenous, it is not possible to give an unbiased estimate of the causal effect of this variable.
Selection effects also give rise to bias. Consider the following example. Various studies in the field of education find that repeaters produce lower test results than non-repeaters. A preliminary and false conclusion would be that repetition does not have a positive effect on student performance and that it is simply a waste of resources. But such a conclusion neglects the endogeneity of repeti-tion: intelligent children with well-educated parents are more likely to perform well and therefore not repeat. Less intelligent children, on the other hand, will probably not achieve good results and are therefore more likely to repeat. So, both groups of pupils (i.e., repeaters and non-repeaters) have different characteristics, which at first view makes it impossible to draw conclusions based on a comparison between them.
The technique of instrumental variables is used to address the endogeneity problem. An instrumental variable (or instrument) is a third variable that is used to get an unbiased estimate of the effect of the original endoge-nous variable (see appendix 4). A good instru-ment correlates with the original endogenous variable in the equation, but not with the error term. Suppose a researcher is interested in the effect of a training program. Actual participation in the program may be endogenous, because, for instance, the most motivated employ-ees may subscribe to the training. Therefore, one cannot compare employees who had the training with employees who did not without incurring bias. The effect of the training may be determined if a subset were assigned to the training by accident or through some process unrelated to personal motivation. In this case, the instrumental variables procedure essentially only uses data from that subset to estimate the impact of training.
4.2.8. Regression discontinuity analysisThe basic idea of regression discontinuity analysis is simple. Suppose program participa-

2 9
a d d r E s s t h E at t r I b u t I o n p r o b l E m
is a small n. The small n problem can arise either because the intervention was applied to a single unit (e.g., capacity building in a single ministry or a national policy change) or a small number of units or because there is heterogeneity in the intervention so that only a small number of units received support of a specific type. Where this is a small n, then a variety of other approaches can be used (see § 4.4.).
An important critique of the applicability of these methods refers to the nature of the intervention and the complexity of the context in which the intervention is embedded. The methodological difficulties of evaluating complicated interven-tions to some extent can be “neutralized” by deconstructing them into their “active ingredi-ents” (see, e.g., Vaessen and Todd, 2008).13 Consider the example of school reform in Kenya as described by Duflo and Kremer (2005). School reform constitutes a set of different simultaneous interventions at different levels, ranging from revisions in and decentralization of the budget allocation process, to addressing links between teacher pay and performance, to vouchers and school choice. Although the total package of interventions constituting school reform represents an impressive landscape of causal pathways of change at different levels,
4.3. Applicability of quantitative methods for addressing the attribution problemThere are some limitations to the applicabil-ity of the techniques discussed in the previous section. We briefly highlight some of the more important ones (for a more comprehensive discussion see, e.g., Bamberger and White, 2007). First, in general, counterfactual estimation is not applicable in full-coverage interventions such as price policies or regulation on land use, which affect everybody (although to different degrees). In this case there are still possibilities to use statistical “counterfactual-like” analyses, such as those that focus on the variability in exposure/participation in relation to changes in an outcome variable (see, e.g., Rossi et al., 2004). Second, there are several pragmatic constraints to applying this type of analysis, especially with respect to randomization and other design-based techniques. For example, there might be ethical objections to randomization or lack of data representing the baseline situation of intervention target groups (see chapter 8). Third, applicability of quantitative approaches (experimental and non-experimental) also largely depends on the number of observations (n) available for analysis. Quantitative analysis is only meaningful if n is reasonably large: statisti-cally based approaches are not applicable if there
Figure 4.2: Regression discontinuity analysis
0
1
2
3
4
0 10 20 30 40 50 60 70 80 90
5
6
7
8
9
10
Income (local currency)
Lear
ning
ach
ieve
men
ts (s
tand
ardi
zed
scor
e)

3 0
I m pa c t E va l u at I o n s a n d d E v E l o p m E n t – n o n I E G u I d a n c E o n I m pa c t E va l u at I o n
atic control of the influence of other factors can significantly increase the reliability of findings (see also chapter 8).
Some final remarks on attribution are in order. Given the centrality of the attribution issue in impact evaluation, we concur with many of our colleagues that there is scope for more quantita-tive impact evaluation, as these techniques offer a comparative advantage of formally addressing the counterfactual. Therefore, with a relatively large n, a quantitative approach is usually preferred. However, at the same time it is admitted that, given the limitations discussed above, the application of experimental and quasi-experimental design-based approaches will necessarily be limited to only a part of the total amount of interventions in development.14
The combination of theory-based evaluation and quantitative impact evaluation provides a powerful methodological basis for rigorous impact evaluation for several reasons:
• The intervention theory will help indicate which of the intervention components are amenable to quantitative counterfactual analy-sis through, for example, quasi-experimental evaluation and how this part of the analysis relates to other elements of the theory.15
• The intervention theory approach will help identify key determinants of impact variables to be taken into account in a quantitative im-pact evaluation.
• The intervention theory approach can pro-vide a basis for analyzing how an interven-tion affects particular individuals or groups in different ways; although quantitative impact evaluation methods typically result in quan-titative measures of average net effects of an intervention, an intervention theory can help to support the analysis of distribution of costs and benefits (see chapter 5).
• The intervention theory can help strengthen the interpretation of findings generated by quantitative impact evaluation techniques.
This symbiosis between theory-based evalua-tion and quantitative impact evaluation has been
directly and indirectly affecting individual school, teacher, and student welfare in different ways, it can be unpacked into different (workable) components, such as teacher incentives and their effects on student performance indicators or school vouchers and their effects on student performance.
True experimental designs have been relatively rare in development settings (but not rare in developing countries, as medical tests routinely use a randomized approach). Alternatively, quasi-experiments using non-random assign-ment to participant and control groups are more widely applicable. Preferably, double differ-ence (participant-control group comparisons over time) designs should be used. However, it is more usual that impact assessments are based on less rigorous—and reliable—designs, where—
• Baseline data are reconstructed or collected late during the implementation phase.
• Baseline data are collected only for the treat-ment group.
• There are no baseline data for the treatment or control group.
If no baseline data exist, then the impact of the intervention is measured by comparing the situation afterward between the treatment and control groups. This comparison of end-line data is measured by a single difference (see also appendix 14).
Some impact evaluations are based on pure “before and after” comparisons of change only for the treatment group, with no comparison group at all. The measure in such cases is also a single difference, but the lack of a proxy for the counterfactual makes conclusions based on this design less robust. This design gives a valid measure of impacts only in the rare situations when no other factors can explain the observed change, or when the intervention of interest is the only factor influencing the conditions. In other words, all other factors are stable, or there are no other cause-effect relationships than between the intervention and the observed change. A system-

3 1
a d d r E s s t h E at t r I b u t I o n p r o b l E m
check on the validity of the conclusions and can help one understand why the results are as they are. Pawson and Tilley (1997) criticized experi-mentalists by highlighting what they perceive as a lack of attention to explanatory questions in (quasi-) experiments. Consequently, GEM can be helpful by involving the evaluator in setting up a “competition” between the conclusions from the evaluation and possible other hypotheses.
A second example is causal contribution analysis (see Mayne, 2001; described in chapter 3). Contribution analysis relies on chains of logical arguments that are verified through careful analysis. Rigor in this type of causal analysis involves systematically identifying and investigat-ing alternative explanations for observed impacts. This includes being able to rule out implementa-tion failure as an explanation for lack of results and developing testable hypotheses and predic-tions to identify the conditions under which interventions contribute to specific impacts.
Some of these hypotheses can be tested using the quantitative methods discussed previously. In this sense, contribution analysis, and other variants of theory-based analysis, provide a framework in which quantitative methods of impact evaluation could be used to test particular causal assump-tions. If the latter is not possible, the verifica-tion and refinement of the causal story should exclusively rely on other (multiple) methods of inquiry (see chapter 5).
4.4.2. Participatory approaches18
Nowadays, participatory methods have become mainstream tools in development in almost every area of policy intervention. The roots of participa-tion in development lie in the rural sector, where Chambers (1995) and others developed the now widely used principles of participatory rural appraisal. Participatory evaluation approaches (see, e.g., Cousins and Whitmore, 1998) are built on the principle that stakeholders should be involved in some or all stages of the evaluation. As Greene (2006: 127ff) illustrates, “[P]articipa-tory approaches to evaluation directly engage the micropolitics of power by involving stakeholders in important decision-making roles within
acknowledged by a growing number of authors in both the general impact evaluation literature (e.g., Cook, 2000; Shadish et al., 2002; Rossi et al., 2004; Morgan and Winship, 2007) as well as in the literature on development impact evalua-tion (e.g., Bamberger et al., 2004; Bourguignon and Sundberg, 2007; Ravallion, 2008). When this combination is not feasible, alternative methods embedded in a theory-based evaluation framework should be applied.
4.4. other approachesIn this section we introduce a range of method-ological approaches that can be used to address the attribution problem or particular aspects of the impact evaluation.16
4.4.1. Alternative approaches for addressing the attribution problemThe methods discussed in the previous sections have the advantage of allowing for an estima-tion of the magnitude of change attributable to a particular intervention using counterfac-tual analysis. There are also other (qualitative) methods that can be useful in addressing the issue of attribution. However, these methods as such do not quantify effects attributable to an intervention.17
A first example of an alternative approach is the so-called General Elimination Methodology (GEM). This approach is epistemologically related to Popper’s falsification principle. Michael Scriven added it to the methodology of (impact) evalua-tions. Although in some papers he suggested that the GEM approach was particularly relevant for dissecting causality chains within case studies, both in his earlier work and in a more recent paper (Scriven, 1998), he makes clear that the GEM approach is relevant for every type of expert practice, including RCTs and case studies (see appendix 2 for a more detailed discussion).
What is the relevance of this approach for impact evaluation? Given the complexity of solving the attribution problem, GEM can help “test” different counterfactuals that have been put forward in a theoretical way. When doing (quasi-)experiments, using GEM can be an extra

3 2
I m pa c t E va l u at I o n s a n d d E v E l o p m E n t – n o n I E G u I d a n c E o n I m pa c t E va l u at I o n
ing an intervention theory or multiple theories,19 which subsequently can be refined or put to the test during further analysis.
Some of the latter benefits can also be realized by using qualitative methods that are nonparticipa-tory (see Mikkelsen, 2005; see also appendix 9). This brings us to an important point. There is a common misperception that there is a finite and clearly defined set of so-called “participatory” evaluation methods. Although certain methods are often (justifiably) classified under the banner of participatory methods because stakeholder participation is a defining feature, many methods not commonly associated with stakeholder partic-ipation (including, for example, (quasi-) experi-mental methods) can also be used in more or less participatory ways, with or without stakeholder involvement. The participatory aspect of method-ology is largely determined by the issues of who is involved and who does or decides on what and how. For example, the methodology for testing water quality to ascertain the impact of treatment facili-ties can become participatory if community-level water users are involved in deciding, for example, what aspects of water quality to measure and how to collect the data and report the results.
Methodologies commonly found under the umbrella of participatory (impact) evaluation include appreciative inquiry; beneficiary assess-ment; participatory impact pathway analysis; participatory impact monitoring (see box 4.2.); poverty and social impact analysis; social return on investment; systematic client consultation; self-esteem, associative strength, resourceful-ness, action planning and responsibility; citizen report cards; community score cards; and the Participatory Learning and Action toolbox20 (see, for example, IFAD, 2002; Mikkelsen, 2005; Pretty et al., 1995; Salmen and Kane, 2006).
These methods rely on different degrees of participation, ranging from consultation to collaboration to joint decision making. In general, the higher the degree of participation, the more costly and difficult it is to set up the impact evaluation. In addition, a high degree of participation might be difficult to realize in
the evaluation process itself. Multiple, diverse stakeholders collaborate as co-evaluators, often as members of an evaluation team.” Participa-tory evaluation can be perceived as a develop-mental process in itself, largely because it is “the process that counts” (Whitmore, 1991). In the case of impact evaluation, participation includes aspects such as the determination of objectives, indicators to be taken into account, as well as stakeholder participation in data collection and analysis. In practice it can be useful to differenti-ate between stakeholder participation as a process and stakeholder perceptions and views as sources of evidence (Cousins and Whitmore, 1998).
Participatory approaches to impact evaluation can be important for several reasons. First, one could ask the legitimate question of impact “according to whom.” Participatory approaches can be helpful in engaging stakeholders on the issue of what is to be valued in a particular impact evaluation. By engaging a range of stakeholders, a more comprehensive and/or appropriate set of valued impacts is likely to be identified (see the second key issue of this Guidance document). When identifying the (type and scope of the) intervention to be evaluated (see first chapter), participatory methods might be of particular use; aspects that might be “hidden” behind official language and political jargon (in documents) can be revealed by narrative analyses and by consult-ing stakeholders. More generally, the process of participation in some cases can enhance stakeholder ownership, the level of understand-ing of a problem among stakeholders, and utiliza-tion of impact evaluation results.
Within the light of the attribution issue, stakeholder perspectives can help improve an evaluator’s understanding of the complex reality surrounding causal relationships among interventions and outcomes and impacts. In addition, insight into the multiple and (potentially) contrasting assumptions about causal relationships between an intervention and processes of change can help enrich an evaluator’s perspective on the attribution issue. As discussed in chapter 3, stakeholder perspec-tives can be an important source for reconstruct-
3 3
a d d r E s s t h E at t r I b u t I o n p r o b l E m
• For testing/refining particular parts (i.e., as-sumptions) of the impact theory but not specif-ically focused on impact assessment as such
• For strengthening particular lines of argumen-tation with additional/detailed knowledge, useful for triangulation with other sources of evidence
• For deepening the understanding of the na-ture of particular relationships between inter-vention and processes of change.
The literature on (impact) evaluation methodol-ogy, as in any other field of methodology, is riddled with labels representing different (and sometimes not so different) methodological approaches. In essence however, methodologies are built upon specific methods. Survey data collection and (descriptive) analysis, semi-structured interviews, and focus-group interviews are but a few of the specific methods that are found throughout the landscape of methodological approaches to impact evaluation.
Evaluators, commissioners, and other stakehold-ers in impact evaluation should have a basic knowledge about the more common research techniques:24
large-scale comprehensive interventions such as sector programs.21
Apart from the previously discussed potential benefits of an impact evaluation involving some element of stakeholder participation, disadvan-tages of participatory approaches include the following:
• Limitations to the validity of information based on stakeholder perceptions (only); this prob-lem is related to the general issue of short-comings in individual and group perceptional data.
• The risk of strategic responses, manipulation, or advocacy by stakeholders can influence the validity of the data collection and analysis.22
• Limitations to the applicability of impact evalu-ation with a high degree of participation espe-cially in large-scale, comprehensive, multi-site interventions (aspects of time and cost).
4.4.3. Useful methods for data collection and analysis that are often part of impact evaluation designs23
In this section we distinguish a set of methods that are useful:
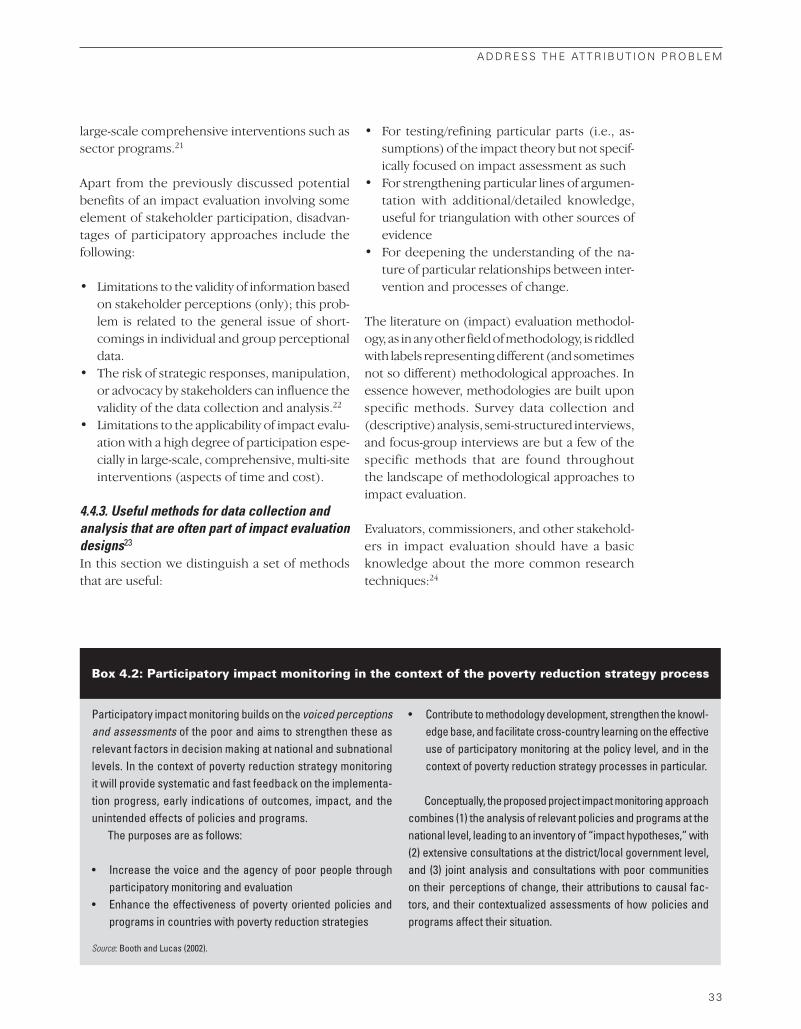
Participatory impact monitoring builds on the voiced perceptions and assessments of the poor and aims to strengthen these as relevant factors in decision making at national and subnational levels. In the context of poverty reduction strategy monitoring it will provide systematic and fast feedback on the implementa-tion progress, early indications of outcomes, impact, and the unintended effects of policies and programs.
The purposes are as follows:
• Increase the voice and the agency of poor people through participatory monitoring and evaluation
• Enhance the effectiveness of poverty oriented policies and programs in countries with poverty reduction strategies
• Contribute to methodology development, strengthen the knowl-edge base, and facilitate cross-country learning on the effective use of participatory monitoring at the policy level, and in the context of poverty reduction strategy processes in particular.
Conceptually, the proposed project impact monitoring approach combines (1) the analysis of relevant policies and programs at the national level, leading to an inventory of “impact hypotheses,” with (2) extensive consultations at the district/local government level, and (3) joint analysis and consultations with poor communities
on their perceptions of change, their attributions to causal fac-tors, and their contextualized assessments of how policies and programs affect their situation.
Box 4.2: Participatory impact monitoring in the context of the poverty reduction strategy process
Source: Booth and Lucas (2002).

3 4
I m pa c t E va l u at I o n s a n d d E v E l o p m E n t – n o n I E G u I d a n c E o n I m pa c t E va l u at I o n
or testing particular causal assumptions of the intervention theory. These techniques (including the first bullet point) are also used in the (quasi-)experimental and regression-based approaches described in § 4.2. For more information, see Agresti and Finlay (1997) or Hair et al. (2005) or, more specifically for development contexts, see Casley and Lury (1987) or Mukherjee et al. (1998).
“Qualitative methods” include widely used methods, such as semi-structured interviews, open interviews, focus group interviews, partici-pant observation, and discourse analysis—but also less conventional approaches such as mystery guests, unobtrusive measures (e.g., through observation; see Webb et al., 2000), etc. For more information, see Patton (2002) or, more specifically for development contexts, see Mikkelsen (2005) or Roche (1999).25
Descriptive statistical techniques (e.g., of survey or registry data): The statistician Tukey (e.g., Tukey, 1977) argued for more attention to explor-atory data analysis techniques as powerful and relatively simple ways to understand patterns in data. Examples include univariate and bivariate statistical analysis of primary or secondary data using graphical analysis and simple statistical summaries (e.g., for univariate analysis: mean, standard deviation, median, interquartile range; for bivariate analysis: series of boxplots, scatter-plots, odds ratios).
Inferential statistical techniques (e.g., of survey or registry data): Univariate analysis (e.g., confidence intervals around the mean; t-test of the mean), bivariate analysis (e.g., t-test for difference in means), and multivariate analysis (e.g., cluster analysis, multiple regression) can be rather useful in estimating impact effects
Address the attribution problem. Although there is no single method that is best in all cases (a gold standard), some methods are indeed best in specific cases. When empirically addressing the attribution problem, experimental and quasi-experimental designs embedded in a theory-based evaluation framework have clear advantages over other designs. If addressing the attribution problem can only be achieved by doing a contribution analysis, be clear about that and specify the limits and opportunities of this approach. Overall, for impact evaluations, well-designed quantitative methods may better address the attribution problem. Baseline data are critical when using quantita-tive methods. Qualitative techniques cannot quantify the changes attributable to interventions but should be used to evaluate important issues for which quantification is not feasible or practical, and to develop complementary and in-depth perspectives on processes of change induced by interventions (see next section). Evaluators need a good basic knowledge about all techniques before determining what method to use to address this problem.
Key message