AddMath F5 Project Work
33
SMK ABDUL RAHMAN TALIB ADDITIONAL MATHEMATICS PROJECT 2013 INDEX NUMBER NAME : CLASS : I/C NO. : TEACHER :
description
Form 5 Additional Mathematics Project Work example
Transcript of AddMath F5 Project Work
SMK ABDUL RAHMAN TALIB
ADDITIONAL MATHEMATICS
PROJECT 2013
INDEX NUMBER
NAME :
CLASS :
I/C NO. :
TEACHER :
CONTENT
NO.
CONTENT PAGE
1 TITLE2 CONTENT3 INTRODUCTION4 APPRECIATION5 HISTORY OF INDEX NUMBER6 PART 17 PART 28 PART 39 FURTHER EXPLORATION
10 REFLECTION11 CONCLUSION
INTRODUCTIONWe, student taking Additional Mathematics is required to carry out a project work while
we are in Form 5. This Year, the Curriculum Development Division, Ministry of Education has prepared four tasks. We are to choose and complete one task based on our area of interest. Upon completion of the Additional Mathematics Project Work. It is hoped that we will gain valuable experiences and able to :
Apply and adapt a variety of problem-solving strategies to solve routine and non-routine problems.
Experience classroom environments which are challenging, interesting and meaningful and hence improve their thinking skills.
Experience classroom environments where knowledge and skills are applied in meaningful ways in solving real-life problems.
Experience class environments where expressing ones mathematical thinking reasoning and communication are highly encouraged and expected.
Experience classroom environments that stimulates and enhances effective learning. Acquire effective mathematical communication through oral and writing, and to use the
language of mathematics to express mathematical ideas correctly and precisely. Enhance acquisition of mathematical knowledge and skills through problem solving in
ways that increases interest and confidence. Prepare ourselves for the demands of their future undertakings and in workplace. Realise that mathematics is an important and powerful tool in solving real life problems
and hence develop positive attitude towards mathematics. Train ourselves not only to be independent learners but also to collaborate, to
cooperate and share knowledge in an engaging and healthy environment. Use technology especially the ICT appropriately and effectively. Train ourselves to appreciate to intrinsic values of mathematics and to become more
creative and innovative. Realise and importance and the beauty of mathematics.

APPRECIATIONFirst and foremost, I would like to thank my Additional Mathematics teacher, Puan
Muzalifah Binti Mohd Yusoff as she gives us important guidance and commitment when carrying out this project work. She has been very supportive throughout the whole project.
I also would like to give thanks to my friends, Ruheine Naidu, Lavindran, Lim Jin Ann and Janarthan for helping me and always supporting during this project work. They have guided and help me in this project work. Without them, this project would never have its conclusion.
For their support, I would like to express my gratitude to my beloved parents for helping me to complete this project work. They had provided me money, assistance and moral support upon completion of this project work. They have always been by my side and I hope they will be supportive for the rest of my life.
Without support from all the individuals stated above, this project work would never be completed. Lastly, I too not forget all the people who were involved directly or indirectly towards making this project a reality.
I thank you all…

HISTORY OF INDEX NUMBER
A price index (plural: “price indices” or “price indexes”) is a normalized average (typically a weighted average) of prices for a given class of goods or services in a given region, during a given interval of time. It is a statistic designed to help to compare how these prices, taken as a whole, differ between time periods or geographical locations.
Price indexes have several potential uses. For particularly broad indices, the index can be said to measure the economy's price level or a cost of living. More narrow price indices can help producers with business plans and pricing. Sometimes, they can be useful in helping to guide investment.
Some notable price indices include:
Consumer price index Producer price index GDP deflator
History of Early Price Indices
No clear consensus has emerged on who created the first price index. The earliest reported research in this area came from Welshpoet Henry Rice Vaughan who examined price level change in his 1675 book A Discourse of Coin and Coinage. Vaughan wanted to separate the inflationary impact of the influx of precious metals brought by Spain from the New World from the effect due to currency debasement. Vaughan compared labor statutes from his own time to similar statutes dating back to Edward III. These statutes set wages for certain tasks and provided a good record of the change in wage levels. Vaughan reasoned that the market for basic labor did not fluctuate much with time and that a basic labor salary would probably buy the same amount of goods in different time periods, so that a labor’s salary acted as a basket of goods. Vaughan's analysis indicated that price levels in England had risen six to eightfold over the preceding century.
While Vaughan can be considered a forerunner of price index research, his analysis did not actually involve calculating an index.[1] In 1707 Englishman William Fleetwood created perhaps the first true price index. An Oxford student asked Fleetwood to help show how prices had changed. The student stood to lose his fellowship since a fifteenth century stipulation barred students with annual incomes over five pounds from receiving a fellowship. Fleetwood, who already had an interest in price change, had collected a large amount of price data going back hundreds of years. Fleetwood proposed an index consisting of averaged price relatives and used his methods to show that the value of five pounds had changed greatly over the course of 260 years. He argued on behalf of the Oxford students and published his findings anonymously in a volume entitled Chronicon Preciosum.

ADDITIONAL MATHEMATICSPROJECT WORK 2/2013
PART 1 :The prices of goods sold in shops vary from one shop to another. Shoppers tend to buy goods which are reasonably priced, giving value for their money. We, as consumers, should learn to spend wisely and keep out daily expenses to the minimum.
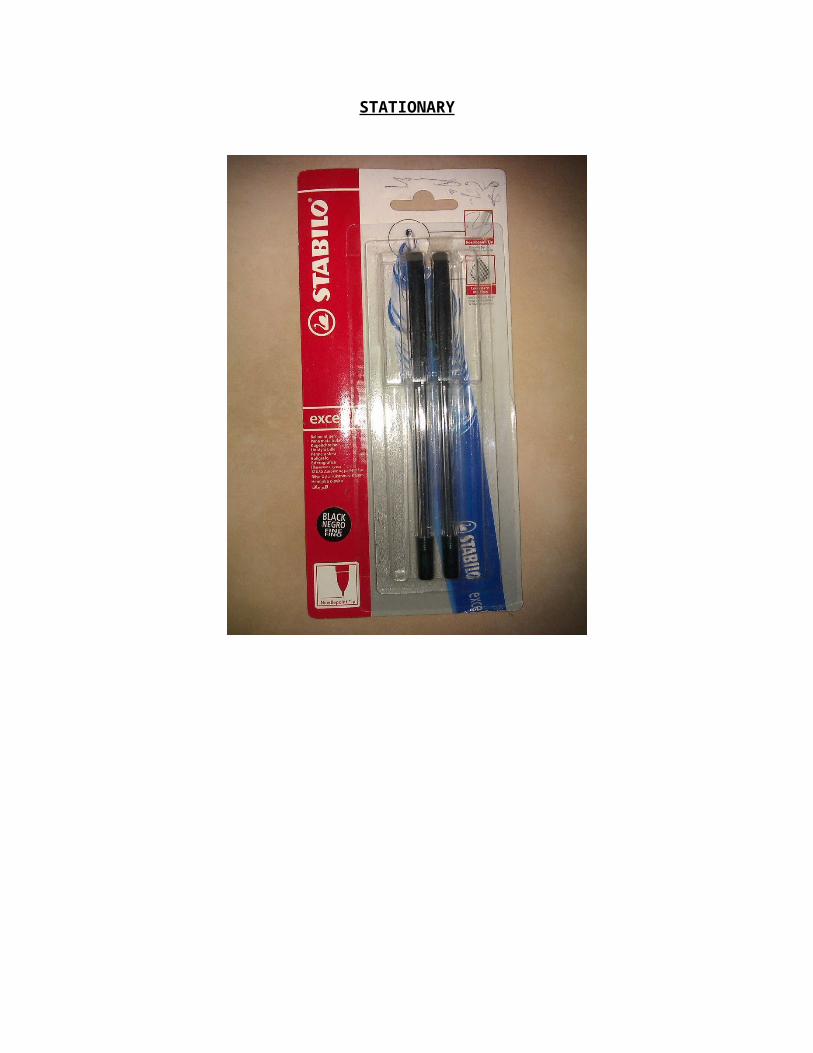
You are required to carry out a survey on three different items based on the following categories : food, detergent and stationary. The survey should be done in three different shops.
(a) Collect pictures, newspapers cuttings or photos on items that you have chosen. Design a collage to illustrate the chosen items.
ANSWERS :
FOOD

DETERGENT


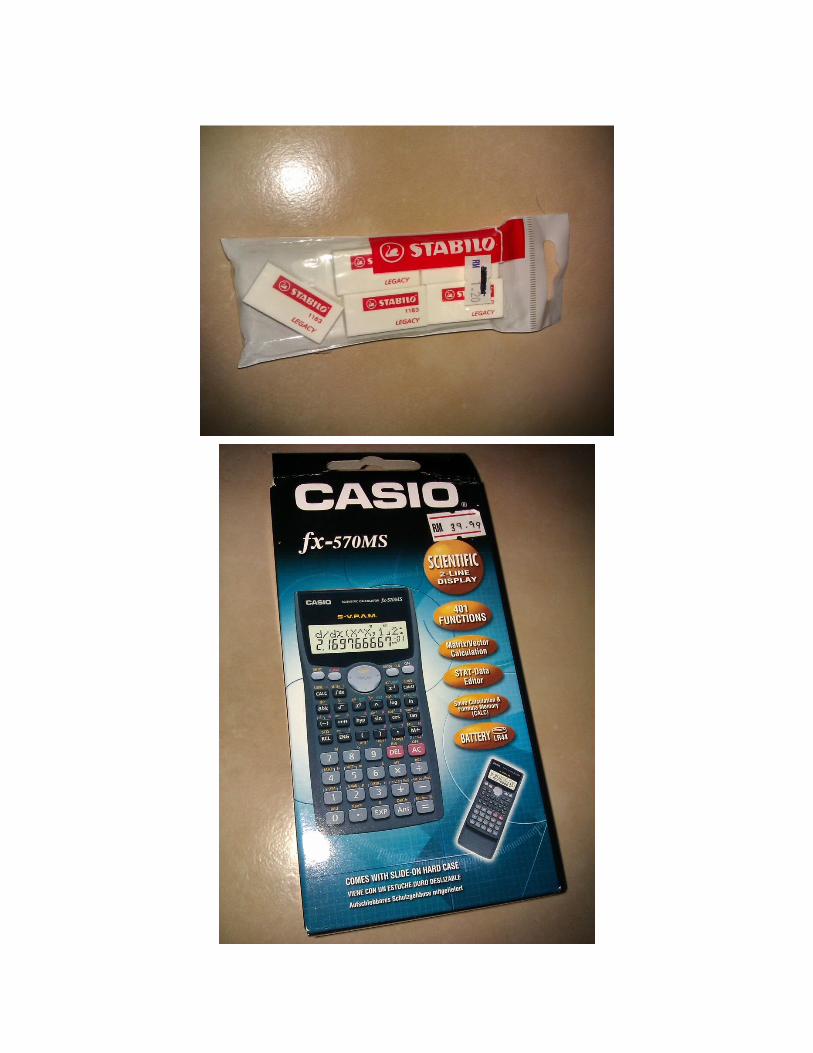
STATIONARY

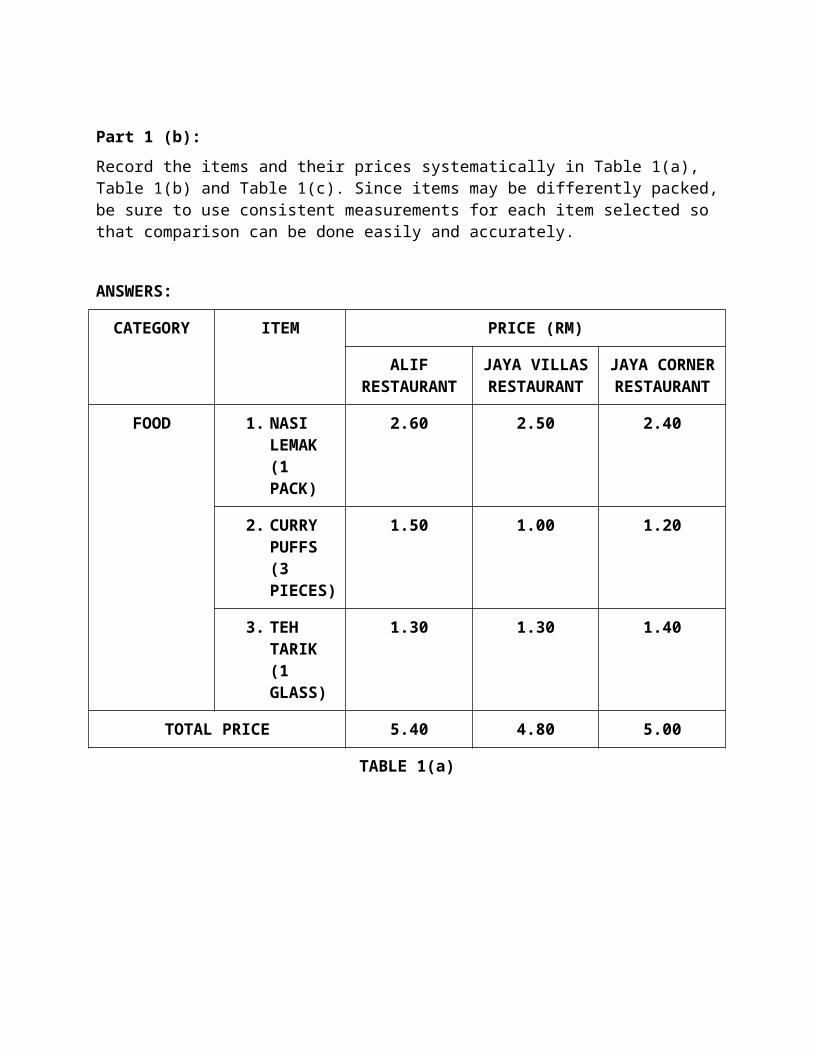
Part 1 (b):
Record the items and their prices systematically in Table 1(a), Table 1(b) and Table 1(c). Since items may be differently packed, be sure to use consistent measurements for each item selected so that comparison can be done easily and accurately.
ANSWERS:
CATEGORY ITEM PRICE (RM)
ALIF RESTAURANT
JAYA VILLAS RESTAURANT
JAYA CORNER RESTAURANT
FOOD 1. NASI LEMAK (1 PACK)
2.60 2.50 2.40
2. CURRY PUFFS (3 PIECES)
1.50 1.00 1.20
3. TEH TARIK (1 GLASS)
1.30 1.30 1.40
TOTAL PRICE 5.40 4.80 5.00
TABLE 1(a)
CATEGORY ITEM PRICE (RM)
ENG HONG SUPERMARKET
TUNAS MANJA SUPERMARKET
NIRVANA
DETERGENT 1. BREEZE LIQUID (4.4KG)
27.50 28.00 27.20
2. FAB (3.5KG)
23.99 24.30 22.99
3. TOP (4KG)
24.50 25.00 23.40
TOTAL PRICE 75.99 77.30 73.59
TABLE 1(b)
CATEGORY ITEM PRICE (RM)
MEN MEN BOOKSTORE
POPULAR BOOKSTORE
PUSTAKA SAUJANA
BOOKSTORE
STATIONARY 1. STABILO PEN (1 PACK)
4.50 4.80 4.80
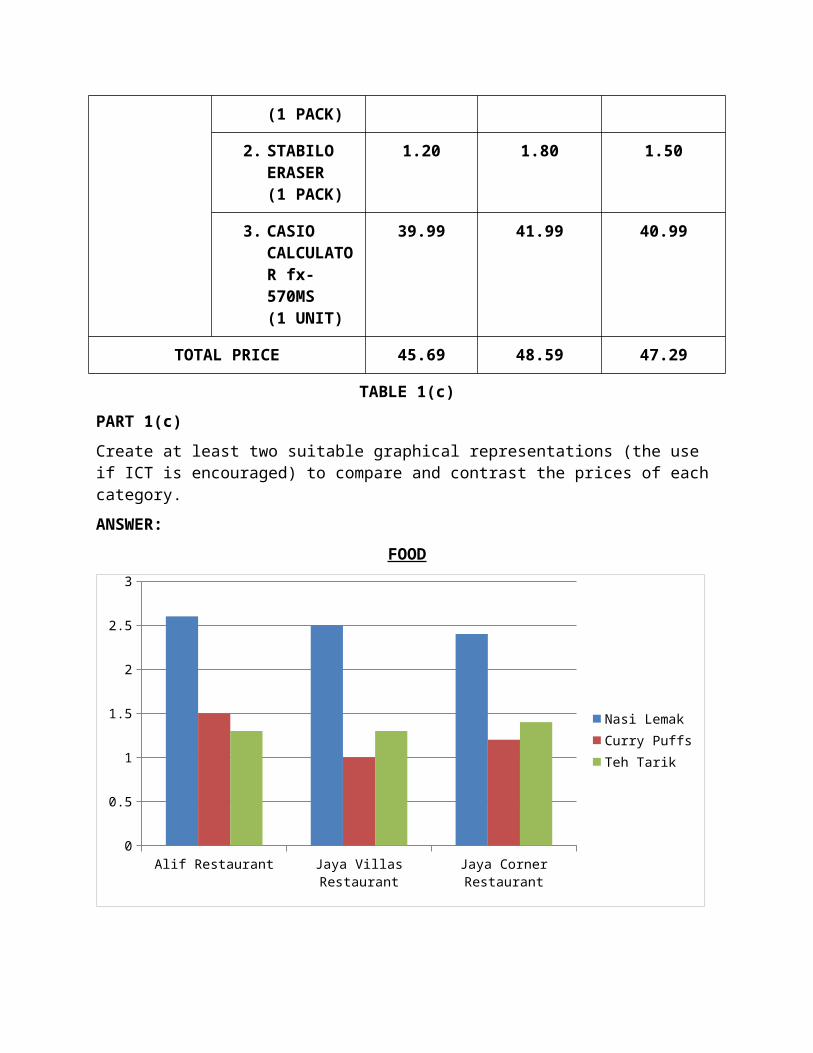
2. STABILO ERASER (1 PACK)
1.20 1.80 1.50
3. CASIO CALCULATOR fx-570MS (1 UNIT)
39.99 41.99 40.99
TOTAL PRICE 45.69 48.59 47.29
TABLE 1(c)
PART 1(c)
Create at least two suitable graphical representations (the use if ICT is encouraged) to compare and contrast the prices of each category.
ANSWER:
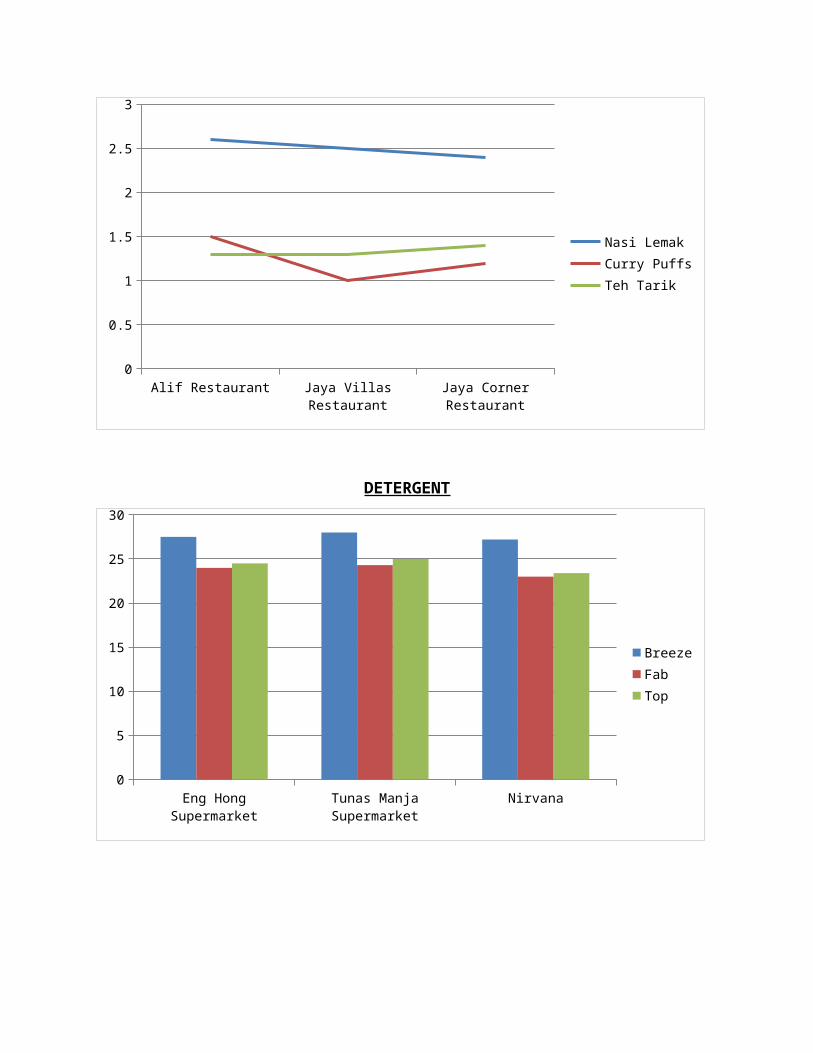
FOOD
Alif Restaurant Jaya Villas Restaurant Jaya Corner Restaurant0
0.5
1
1.5
2
2.5
3
Nasi LemakCurry PuffsTeh Tarik
Alif Restaurant Jaya Villas Restaurant Jaya Corner Restaurant0
0.5
1
1.5
2
2.5
3
Nasi LemakCurry PuffsTeh Tarik

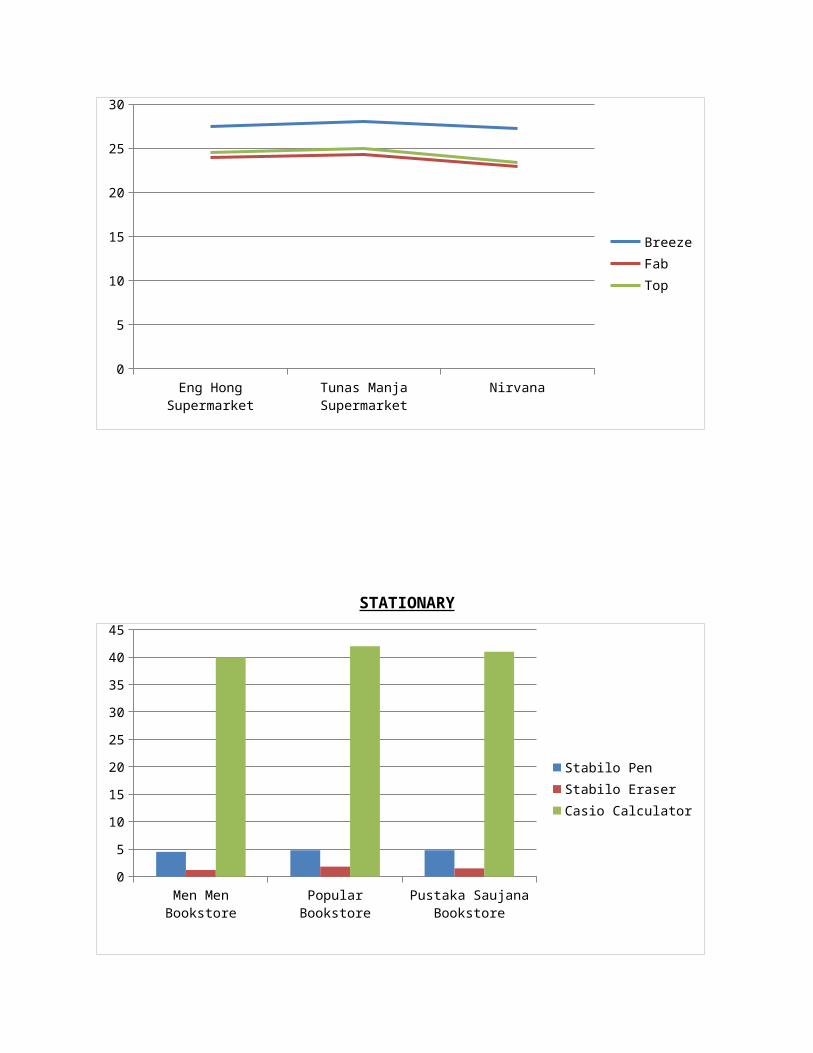
DETERGENT
Eng Hong Supermarket Tunas Manja Supermarket Nirvana0
5
10
15
20
25
30
BreezeFabTop
Eng Hong Supermarket Tunas Manja Supermarket Nirvana0
5
10
15
20
25
30
BreezeFabTop
STATIONARY
Men Men Bookstore Popular Bookstore Pustaka Saujana Bookstore0
5
10
15
20
25
30
35
40
45
Stabilo PenStabilo EraserCasio Calculator
Men Men Bookstore Popular Bookstore Pustaka Saujana Bookstore
0
5
10
15
20
25
30
35
40
45
Stabilo PenStabilo EraserCasio Calculator
PART 1 (d)
Based on the graphical representations that you have constructed in Part 1(c), interpret discuss and draw conclusions. Comment on your findings.
ANSWER:
Based on the graphical representations that I have constructed in Part 1 (c), it is shown that there is a small and large difference among the prices of items in each category between the shops. In the food category, curry puffs have the highest price difference among the three shops while teh tarik and nasi lemak has the smallest price difference among the three shops. In the detergent category, Top has the highest price difference while Breeze has the smallest price difference among the three shops. In the stationary category, the Casio Calculator has the highest price difference while Stabilo pen has the smallest price difference among the three bookstores.
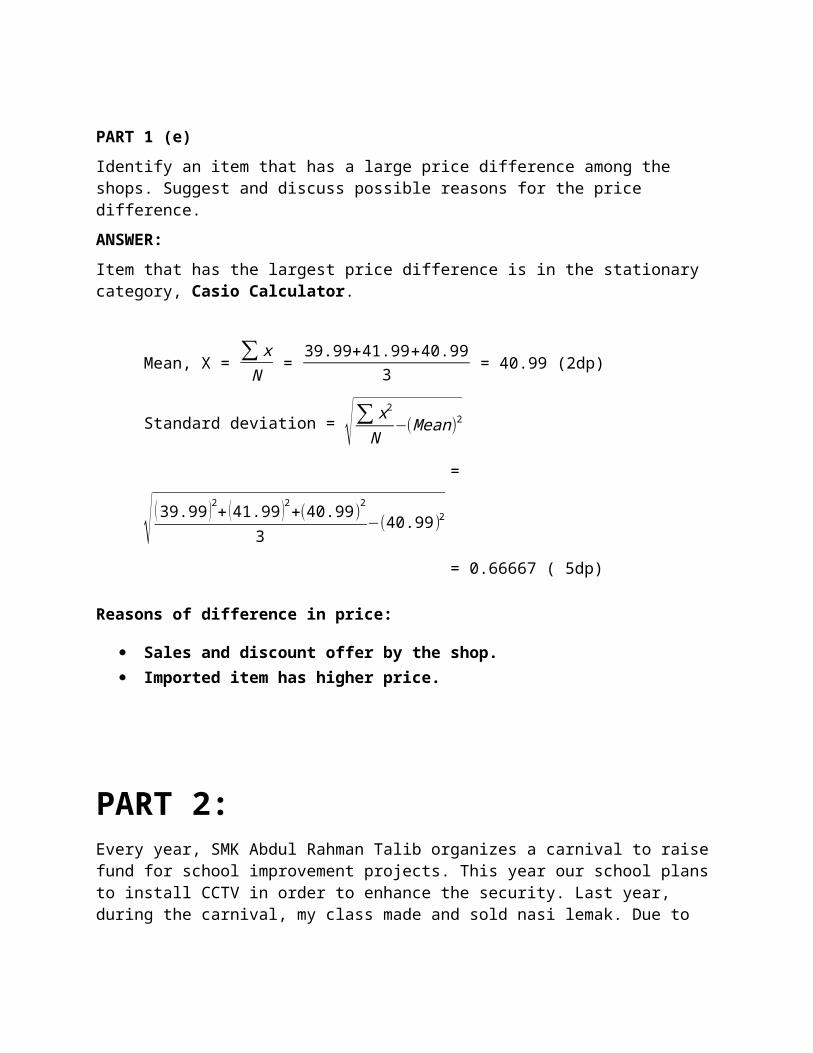
PART 1 (e)
Identify an item that has a large price difference among the shops. Suggest and discuss possible reasons for the price difference.
ANSWER:
Item that has the largest price difference is in the stationary category, Casio Calculator.
Mean, X = ∑ xN
= 39.99+41.99+40.99
3 = 40.99 (2dp)
Standard deviation = √∑ x2
N−(Mean)2
=√ (39.99 )2+ ( 41.99 )2+(40.99)2
3−(40.99)2
= 0.66667 ( 5dp)
Reasons of difference in price:
Sales and discount offer by the shop. Imported item has higher price.
PART 2:Every year, SMK Abdul Rahman Talib organizes a carnival to raise fund for school improvement projects. This year our school plans to install CCTV in order to enhance the security. Last year, during the carnival, my class made and sold nasi lemak. Due to the popularity of this local food, my class has decided to carry out the same project for this year’s carnival.
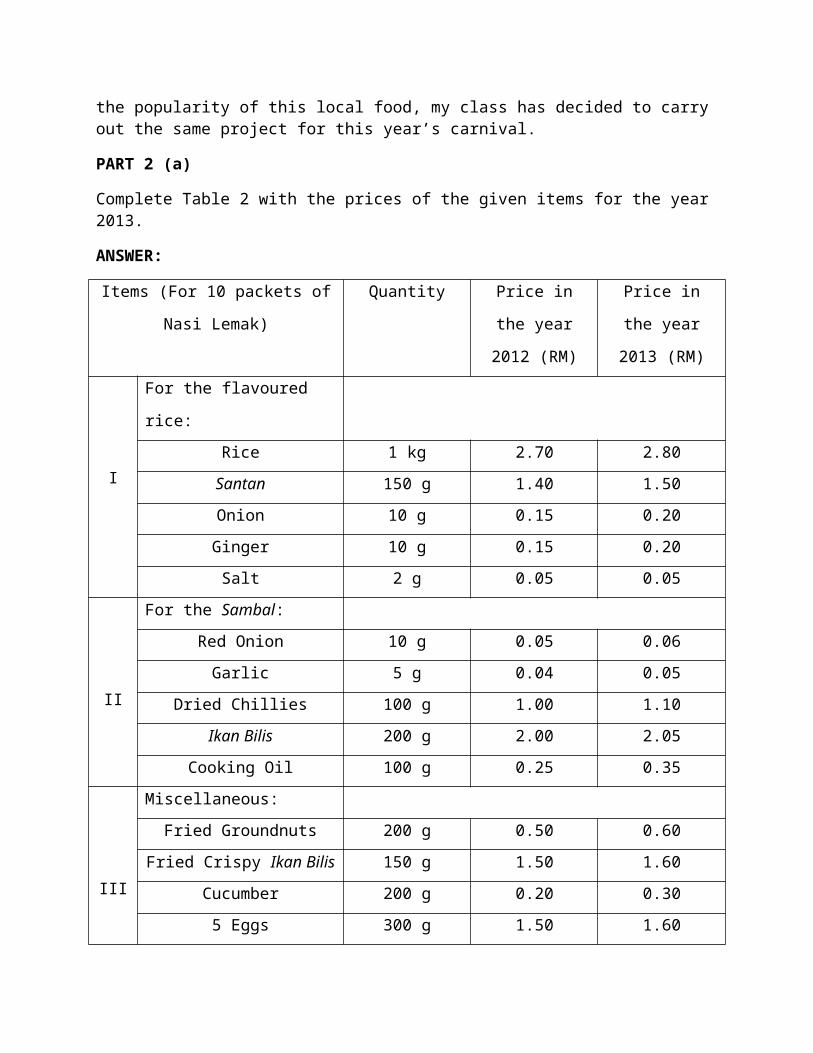
PART 2 (a)
Complete Table 2 with the prices of the given items for the year 2013.
ANSWER:
Items (For 10 packets of Nasi Lemak) Quantity Price in the year
2012 (RM)
Price in the year
2013 (RM)
I
For the flavoured rice:
Rice 1 kg 2.70 2.80
Santan 150 g 1.40 1.50
Onion 10 g 0.15 0.20
Ginger 10 g 0.15 0.20
Salt 2 g 0.05 0.05
II
For the Sambal:
Red Onion 10 g 0.05 0.06
Garlic 5 g 0.04 0.05
Dried Chillies 100 g 1.00 1.10
Ikan Bilis 200 g 2.00 2.05
Cooking Oil 100 g 0.25 0.35
III
Miscellaneous:
Fried Groundnuts 200 g 0.50 0.60
Fried Crispy Ikan Bilis 150 g 1.50 1.60
Cucumber 200 g 0.20 0.30
5 Eggs 300 g 1.50 1.60
Banana leaves (1 bundle) 300 g 1.00 1.00
TABLE 2

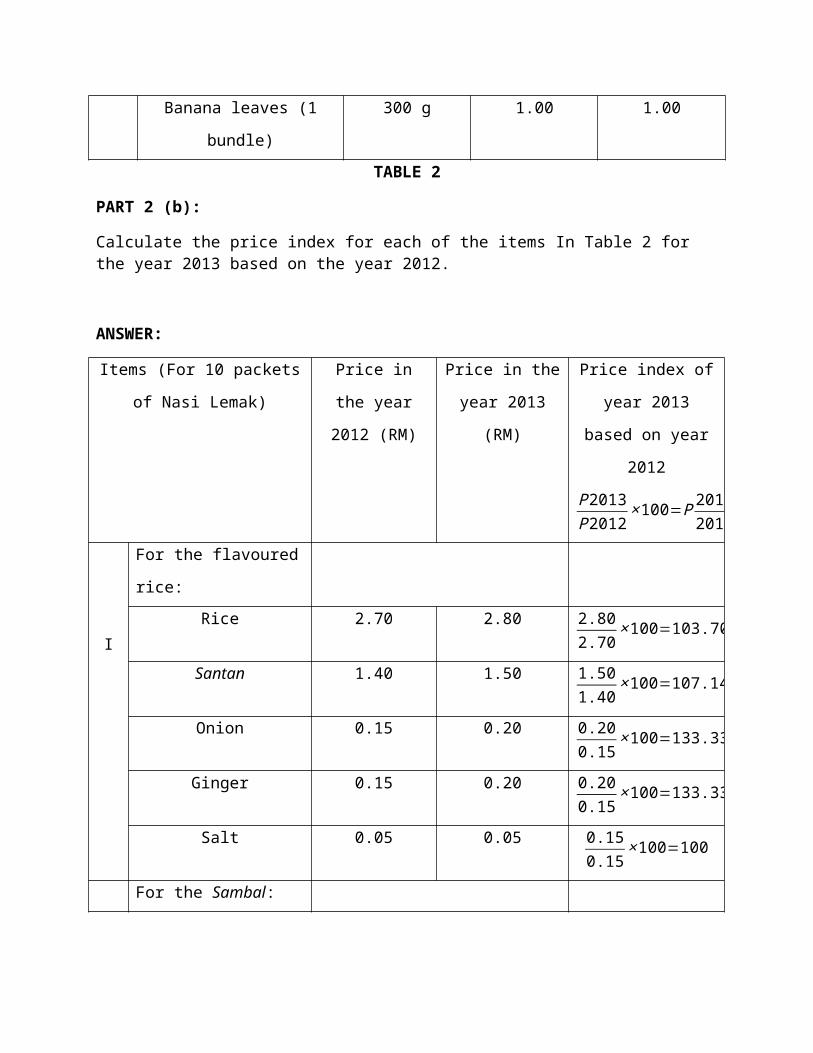
PART 2 (b):
Calculate the price index for each of the items In Table 2 for the year 2013 based on the year 2012.
ANSWER:
Items (For 10 packets of Nasi
Lemak)
Price in the year
2012 (RM)
Price in the year
2013 (RM)
Price index of year
2013 based on year
2012
P2013P2012
×100=P 20132012
I
For the flavoured rice:
Rice 2.70 2.80 2.802.70
×100=103.70
Santan 1.40 1.50 1.501.40
×100=107.14
Onion 0.15 0.20 0.200.15
×100=133.33
Ginger 0.15 0.20 0.200.15
×100=133.33
Salt 0.05 0.05 0.150.15
×100=100
II
For the Sambal:
Red Onion 0.05 0.06 0.060.05
×100=120
Garlic 0.04 0.05 0.050.04
×100=125
Dried Chillies 1.00 1.10 1.101.00
×100=110
Ikan Bilis 2.00 2.05 2.052.00
×100=102.50
Cooking Oil 0.25 0.35 0.350.25
×100=140
Miscellaneous:
III
Fried Groundnuts 0.50 0.60 0.600.50
×100=120
Fried Crispy Ikan Bilis 1.50 1.60 1.601.50
×100=106.67
Cucumber 0.20 0.30 0.300.20
×100=150
5 Eggs 1.50 1.60 1.601.50
×100=106.67
Banana leaves (1 bundle) 1.00 1.00 1.001.00
×100=100
PART 2 (c)
Calculate the composite index for the cost of a packet of nasi lemak in the year 2013 based on the year 2012. Discuss how you obtained your answers.
ANSWER :
Composite index=∑W i× I i∑W i
= (103.70×1000 )+(107.1 4×150 )+ (133.33×10 )+ (133.33×10 )+(100×2 )+(120×10 )+(125×5 )+(110×100 )+(102.5×200 )+ (140×100 )+(120×200 )+ (106.67×150 )
+ (150×200 )+(106.67×300 )+(100×300 )2737
Composite index = 110.3510
= 11.035
PART 2 (d)
In the year 2012, the nasi lemak was sold at RM 2.00 each. Suggest a suitable price for a packet of the nasi lemak in the year 2013. Give reasons for your answer.
ANSWER :
The suitable price for a packet of nasi lemak in the year 2013 is RM 2.10. In the year 2012, the cost of a packet of nasi lemak is RM 1.25, it is sold at the price RM 2.00. The profit made from a packet of nasi lemak in the year 2012 is RM 0.75. In the year 2013, cost of preparing a packet of nasi lemak increases. The cost of a packet of nasi lemak in year 2013 is RM 1.35. In order to make a profit of RM 0.75 as in the year 2012, a packet of nasi lemak must be sold at the price RM 2.10 in 2013.
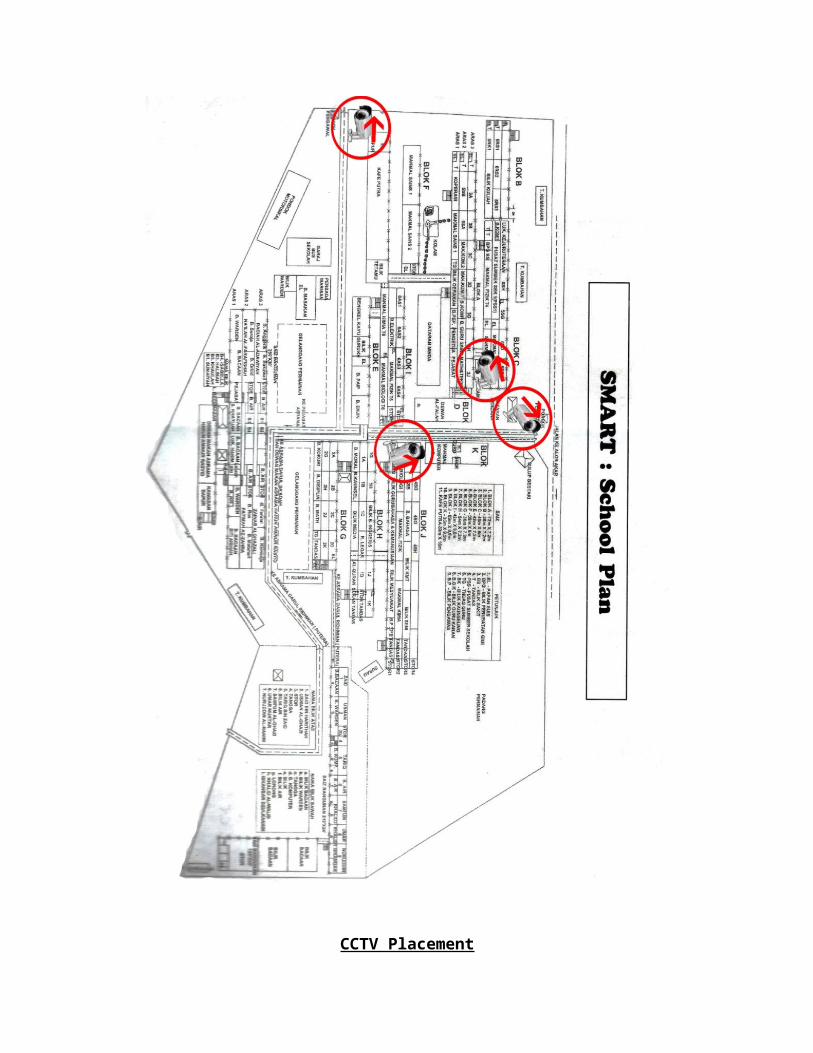
PART 3:In order to upgrade the security, your school has decided to install closed-circuit TV (CCTV).
Part 3 (a)
Suggest a suitable number of cameras to be installed and their placement. Give your reasons, illustrate with a plan.
ANSWER:
A number of 4 cameras should be added in the school to ensure the school’s security. The cameras should be placed to do everything possible to combine camera angles to cover as many areas at once. It is recommended to focus the camera at the all entrance of schools including the front gate and back gate. The cameras at the entrance should be angled to capture the faces of visitors and any person that enters and leaves the school. Cameras should also be angled to focus on the entrance of the office and also at the motorcycle parking are in order to capture anyone that is trying or attempting to steal or rob. It is very important that a person must be in charge to monitor the all movement capture by the camera.

CCTV Placement

PART 3 (b)
Find out the cost of installation of the CCTV.
ANSWER:
A package of CCTV is cost RM 1,500 at marketing price excluding installations and configuration. The package includes 4 units of outdoor IP66 Weatherproof Camera, one H.264 Network Standalone DVR System, one 500 GB Hard Disk Drive and 4 units of 12V 1Amp DC Power Adaptor. Installations and configuration is estimated to cost RM 1,000. A package of CCTV system including installations and configuration is cost RM 2,500.
PART 3 (c)
If your class intends to sponsor 10% of the cost, how many packets of nasi lemak must your class sell?
ANSWER:
The CCTV system package cost RM 2,500. 10% of the cost of CCTV is RM 250. A packet of nasi lemak cost RM 2.10. If my class is to sponsor 10% of the cost of CCTV which is RM 250, my class must at least sells 120 packets of nasi lemak.
PART 3(d)
Can your class achieve the 10% target? Do you think your class should carry out a different project instead?
ANSWER:
In the year 2012, my class had sold over 500 packets of nasi lemak during last year’s carnival. So, my class is confident to sell more than what we sold last year and we do not need to carry out a different project. My class really hope to get to sponsor the 10% to school for the CCTV and yet making a profit to be added into the class fund.
FURTHER EXPLORATIONIndex numbers are being used in many different daily situations, for example, air pollution index, stock market index, gold index and property index.
Obtain information from the Internet or other reliable sources on the importance of two different types of index numbers of your choice. Elaborate the use and the importance of these numbers in daily life situations.
ANSWER:
AIR POLLUTION INDEX (API)
The Air Pollution Index (API) is a simple and generalized way to describe the air quality in China, Hong Kong and Malaysia. It is calculated from several sets of air pollution data. In mainland China the API was replaced by an updated Air Quality Index in early 2012.
The air quality in Malaysia is reported as the API or Air Pollutant Index. Four of the index's pollutant components are carbon monoxide, ozone, nitrogen dioxide and sulphur dioxide are reported in ppmv but PM10 particulate matter is reported in μg/m3. This scale below shows the Health classifications used by the Malaysian government.
API Air PollutionLevel
0 - 50 Good51 - 100 Moderate101 - 200 Unhealthy201 - 300 Very unhealthy
301+ Hazardous
If the API exceeds 500, a state of emergency is declared in the reporting area. Usually, this means that non-essential government services are suspended, and all ports in the affected area are closed. There may also be a prohibition on private sector commercial and industrial activities in the reporting area excluding the food sector.
The highest API value ever recorded was 839 in Kuching on 23 September 1997 during the 1997 Southeast Asian haze.

GOLD INDEX
The NYSE Arca Gold BUGS (Basket of Unhedged Gold Stocks) Index (also known as the HUI Index) is a modified equal dollar weighted index of companies involved in gold mining. The Gold BUGS Index is listed on the NYSE Amex under the symbol "HUI". The HUI Index and Philadelphia Gold and Silver Index (PHLX: XAU) are the two most watched gold indices on the market. The main difference between them is that the HUI Index takes into account only gold mining stocks whereas the XAU Index includes both gold and silver producers.
The Gold BUGS Index was designed to provide significant exposure to near term movements in gold prices by including companies that do not hedge their gold production beyond 1.5 years. The HUI Index was developed with a base value of 200.00 as of March 15, 1996. The AMEX Gold BUGS Index currently consists of 15 of the largest and most widely held public gold production companies. Since bottoming in late 2000, HUI went on to be the top-performing US stock sector of the decade, rising by about 1600%.
NYSE Arca Gold BUGS Index 1996–2012
REFLECTION
After spending countless hours, days and nights to finish this project and also sacrificing my time, video games and movies in this whole two weeks, there are several things that I can say…
Additional math…
You are like a very bright star..
Showing me the way..
To success in this life..
You smile at me..
Every time teacher teaches me about you..
Additional math…
Who says you are difficult?
Who says you are a killer?
Who says you hurt people’s feeling?
To me..
You, one of the greatest creation of God..
You, open my eyes..
Telling me little by little about the world ahead of me..
Now, I feel so grateful..
That He has given me a chance to meet you..
Oh additional math..
I love you.

CONCLUSION
After doing this project work, I saw that the usage of index number is important in daily life. It is not just widely used in marketing but also interpreting the surrounding condition such as air quality in conducting the air pollution survey. In conclusion, statistics and indices number is important in daily life. Without it, stock marketing cannot be interpreted, air quality cannot de determined. So, we should be thankful of the people who contributed in the idea of statistics and index number. We should appreciate and study the beauty of it.