Addis Ababa University Addis Ababa institute of technology ...
Addis Ababa University
Addis Ababa Institute of Technology (AAiT)
School of Electrical and Computer Engineering
Addis Ababa Light Rail Transit Signaling
System Design Analysis
By
Tebebu Terefe
A thesis submitted to the School of Graduate Studies of Addis Ababa University in
partial fulfillment of the requirement for the Degree of Master of Science in
Electrical Engineering (Railway)
Advisor
Dr. Yalemzewd Negash
August 2014
Addis Ababa, Ethiopia
Addis Ababa University
Addis Ababa Institute of Technology (AAIT)
School of Electrical and Computer Engineering
Addis Ababa Light Rail Transit Signaling System Design Analysis
By
Tebebu Terefe
Electrical and Computer Engineering Department
Approval by Board Examiners
______________________________________ _______________________ _________________
Chairman, Department Graduate Signature Date Committee Dr. Yalemzewd Negash _______________________ _________________
Advisor Signature Date
___________________________________ _______________________ _________________ Internal Examiner Signature Date
_______________________________________ _______________________ _________________ External Examiner Signature Date
i Addis Ababa University, AAiT, Departement of ECE 2014
Table of Contents List of figures....................................................................................................................... iii
List of tables ........................................................................................................................ iv
Acronyms............................................................................................................................. iv
Abstract ................................................................................................................................ vi
Chapter One .......................................................................................................................... 1
1 Introduction ................................................................................................................... 1
1.1 Motivation and Background .................................................................................. 1
1.2 Literature review ................................................................................................... 3
1.3 Problem statement .................................................................................................. 4
1.4 Objective ................................................................................................................ 8
1.4.1 General Objective ........................................................................................... 8
1.4.2 Specific Objective ........................................................................................... 8
1.5 Organization of the Thesis ..................................................................................... 9
1.6 Methodology used in this thesis ........................................................................... 10
Chapter Two ....................................................................................................................... 11
2 New design of AA LRT signaling system .................................................................. 11
2.1 Design parameters ............................................................................................... 11
2.2 Level 0 CTCS ...................................................................................................... 12
2.3 LRT System Requirements .................................................................................. 12
2.3.1 System Design .............................................................................................. 12
2.3.2 System Safety Principles .............................................................................. 13
2.3.3 Braking Distance .......................................................................................... 14
2.3.4 Speed Restrictions ........................................................................................ 16
2.3.5 Automatic Fixed Block Signaling ................................................................ 17
2.3.6 Fixed block throughput for three aspect signaling system ........................... 19
2.3.7 Station Headway ........................................................................................... 26
2.4 Equipment Requirements ..................................................................................... 29
2.4.1 Numbering Schemes ..................................................................................... 29
2.4.2 Wayside Signals ........................................................................................... 29
2.4.3 Track Circuits ............................................................................................... 30
2.4.4 Axel Counters ............................................................................................... 33

ii Addis Ababa University, AAiT, Departement of ECE 2014
2.4.5 Central Traffic Control System .................................................................... 33
2.5 Provision of equipment ........................................................................................ 40
Chapter Three ..................................................................................................................... 42
3 Comparison of Existing and new signaling system .................................................... 42
3.1 Safety ................................................................................................................... 42
3.2 Operational efficiency .......................................................................................... 43
3.3 Cost ...................................................................................................................... 43
3.4 Energy consumption ............................................................................................ 44
3.5 Customers satisfaction ......................................................................................... 44
Chapter Four ....................................................................................................................... 45
4. Results and discussions ............................................................................................... 45
4.1 Braking distance of EW and NS line to the stations ............................................ 45
4.2 Speed Restrictions ................................................................................................ 47
4.3 Headway calculation ............................................................................................ 49
4.4 Speed Profile and Average operating Speed ........................................................ 50
Chapter Five ....................................................................................................................... 53
5. Conclusions and Recommendation ................................................................................ 53
5.1 Conclusions .......................................................................................................... 53
5.2 Recommendation ................................................................................................. 54
Bibliography ....................................................................................................................... 55
Appendix A: Braking Distance Calculations...................................................................... 57
Appendix B: provisions of equipment ................................................................................ 63
Appendix C: Speed profile of EW line ............................................................................... 67

iii Addis Ababa University, AAiT, Departement of ECE 2014
List of figures
Figure 1.1: NS and EW line of Addis Ababa LRT system .................................................. 5
Figure1.2 Vertical curve between EW4 and EW5 .............................................................. 7
Figure 2.1 A 3-Aspect Fixed Block layout ......................................................................... 18
Figure2.2 Distance-time plot of two consecutive trains (acceleration and braking curves
omitted for clarity) ............................................................................................. 23
Figure 2.3 Speed profile and wayside signals .................................................................... 40
Figure 2.4 Wayside equipment between stations EW3 and EW2 ...................................... 41
Figure 4.1 Speed profile of the track section between EW22 and EW21 .......................... 50
iv Addis Ababa University, AAiT, Departement of ECE 2014
List of tables
Table 1.1 Track lengths of the line constructed on overhead, underground and on the ground. ..... 5
Table 1.2 Horizontal curves existing on main line constructed on the ground . .............................. 6
Table 3.1 Comparison between the existing and new system ......................................................... 42
Table 4.1 Breaking distance to the stations of EW line .................................................................. 46
Table 4.2 Breaking distance to the stations of NS line ................................................................... 47
Table 4.3 Speed limits on curves of EW line .................................................................................. 48
Table 4.4 Speed limits on curves of NS line ................................................................................... 49
Table 4.5 Headway time for different speed operations ................................................................. 50
Table 4.6 The time taken for the train from Station EW22 to EW21 ............................................. 51
Table 4.7 Time taken for the train to travel between stations ......................................................... 51
Acronyms
AFBS: Automatic Fixed Blocking System

v Addis Ababa University, AAiT, Departement of ECE 2014
AFO: Audio Frequency Overlay
AIM: Advanced Information Management
ATP: Automatic Train Protection
ATS: Automatic Train Stop
CBI: Communication Based Interlocking
CTCS: China Train Control System
CTC: Central Traffic Control
EMI: Electro Magnetic Interference
ERTMS: European Rail Traffic Management System
ETCS: European Train Control System
ETS: Edmonton Transit System
EW: East–West line
FCU: Field Code Unit
ID: Identification
LAN: Local Area Network
LRT: Light Rail Transit
NS: North–South line
RAMS: Reliability, Availability, Maintainability and Safety
SIL: Safety Integrity Level
SOP: Safe Operating Procedure
STM: Specific Transmission Module
TCP: Transmission Control Protocol
UPS: Uninterruptable power supply
VLC: Vital Logic Controller
VMS: Voice Management System
WSC: Wayside Cabinets

vi Addis Ababa University, AAiT, Departement of ECE 2014
Abstract
The Signal System, which includes the functions of signal protection, grade crossing
protection, and traffic signal coordination, shall be designed to allow light rail transit
vehicles to meet the required line capacity, while providing a safe and operationally
flexible system. Light rail shall operate in dedicated right-of-way or share the street with
existing traffic. The dedicated portions of right-of-way shall use conventional fixed color
light signals for train separation and safe braking distance.
In view of that, in this thesis work the existing Addis Ababa LRT signaling system is
analyzed. Strong sides and limitation of the existing design are discussed. And it is found
that the signaling design on the line constructed ground has limitations according to
safety, operational efficiency and other factors which are discussed well. Afterwards
different design approaches will be presented and CTCS level 0 is chosen according to
parameters stated. Therefore, on this section the design will be made to implement
Automatic Block Signaling, wayside signals and cab signaling systems.
Then braking distance of each stations are calculated so as the wayside signals are
placed on safe locations. In order to calculate the operational efficiency the headway time
between trains calculated. The speed limit of all necessary curves, switches and turnout
are calculated and the average speed of the system is obtained.
Finally the new design versus the existing design is compared based on safety,
operational efficiency, cost, energy consumption and passenger satisfaction issues. And it
is found that the new design improve headway time by 63.84% and improves the average
speed by 63.97% that leads the system with new design is more efficient than the existing
design.
Keywords: CTCS, AFBS, Breaking distances, Headway time
Addis Ababa Light Rail Transit Signaling System Design
1 Addis Ababa University, AAiT, Departement of ECE 2014
CHAPTER ONE
1 Introduction
1.1 Motivation and Background Any rail transportation infrastructure, whether metros or mainline railways, represents a
tremendous capital investment in terms of the right-of-way and stations, with significant
on-going life-cycle costs to maintain the infrastructure in a state-of good repair. The actual
safe movement of passengers and freight on this infrastructure is however only possible
through the implementation of signaling and train control systems. Indeed, it is the
signaling or train control systems that enable the return on the infrastructure investment to
be realized. While signaling or train control systems are the enabler of rail/transit
operations, they can also impose a constraint on operations for example by constraining
the achievable line capacity or by limiting the flexibility of train movements while, in
addition, incurring substantial ongoing maintenance costs. The goal of future signaling or
train control systems therefore can be stated as to maximize (optimize) the utilization of
the rail transportation infrastructure and to remove the signaling system as a constraint on
rail system operations, while still providing for the high level of safety of train movements
expected by the passengers. This would be achieved by:
maximizing line capacity (limited only by the infrastructure and rolling stock
performance),
providing for high system availability (with degraded modes of operation in the
event of equipment failure), and
Permitting flexible train movements i.e. any train movement that is supported by
the infrastructure should be safely permitted by the signaling or train control
systems - all with a system design that minimizes life cycle costs.
Many rail transportation authorities have demonstrated the business case for re-signaling
with a modern signaling system on the basis that the only other alternative would be to
construct additional rail lines to accommodate the required capacity, which would be
orders-of magnitude more expensive.
So, looking to the future, we can expect the priority for signal and train control engineers
to be increasingly focused on optimizing the movement of passengers and freight, by
maximizing the utilization of the available rail infrastructure and by enhancing rail/transit
operations, in addition to ensuring the safety of train movements.
Addis Ababa Light Rail Transit Signaling System Design
2 Addis Ababa University, AAiT, Departement of ECE 2014
The key elements of any signaling and train control system will continue to be:
a) A method to safely and reliably locate the position of every train operating within the
network within an accuracy and precision to meet both the safety and operational
requirements.
b) A method to safely and reliable communicate status and command information between
central, wayside and train-borne equipment where the data communications
infrastructure has sufficient bandwidth and exhibits sufficiently low latency to support
both the safety and operational requirements with a protocol structure that supports
timely and secure delivery of train control messages.
c) A method to establish limits of movement authority for every train operating in the
network and a method to enforce compliance with these authorities.
d) A method to manage and regulate train movements utilizing optimization algorithms and
decision support systems to ensure stability of network operations even in cases of
operations at the capacity limit.
e) An ability to integrate seamlessly with other operating elements of a metro or railway
system to include traction power systems, tunnel and station ventilation systems,
passenger information systems, etc. in a manner that exploits the operation and safety
capabilities of the signaling and train control system, such as:
• Real-time availability of precise location, speed, and operational status of each
train.
• Ability to communicate train health status and other system alarms to a central
control location.
• Real-time ability to restrict train movements in response to detected hazardous or
other conditions.
• Inherent bidirectional capability and ability to reroute and reverse train
movements either automatically or in response to user inputs.
• Ability to predict train arrival times at downstream stations for schedule
regulation and other purposes.
• Ability to coordinate multiple train movements for junction management and/or
energy optimization purposes [5].
Addis Ababa Light Rail Transit Signaling System Design
3 Addis Ababa University, AAiT, Departement of ECE 2014
1.2 Literature review
The preliminary design of LRT signaling system [1] is designed by Chinese Corporate, China
Railway Group Limited. This document is prepared to determine the main design principle,
design scheme, function, composition, and other issues of the signaling system so as to allow
the detailed design to proceed and complete the technical document and engineering
document in the subsequent stages.
This thesis work analyzes the strong and weak side of this document, and will give the
solutions for limitations.
ETCS (European Train Control System) [15] is a subsystem of ERTMS (the European Rail
Traffic Management System). Sometimes, it is described as ERTMS/ETCS. ERTMS includes
ETCS (Euro-cab), GSM-R (Euro-radio), Euro-balise, Euro-interlocking and so on.
The background of ETCS is the requirements of the European railway network development.
With development of European high speed, railway network, apart from the different
languages, there exist the strong barrier to cross-European borders since there are at least 15
different ATP systems in operation in Europe. Moreover, the ATP systems are incompatible
and produced by their own suppliers. In order to make the systems be compatible and break
the monopolies, the idea of ETCS was put forward. Supported by the European Union, the
European researchers and the six main European railway-signaling suppliers called as
UNISIG began to work for ETCS ten years ago.
The applications of ETCS are divided into several levels. They are Level 0, level STM, level
1, level 2 and level 3. European Train Control System is the document in which Chinese
Train Control System is ultimately developed [12]. Through this thesis work for the sake of
comparison between different signaling levels it is widely used.
Like Europe, Chinese Railway is facing to remove the incompatible obstacle of the different
signaling systems on the network. The European Railway needs ETCS, and the Chinese
Railway needs CTCS [12]. It is needed that signaling systems for high speed lines and
conventional lines, passenger lines and freight lines are unified as standardization, i.e. CTCS.
The purpose of CTCS is to define the signaling systems for Chinese Railways. CTCS will
become the standard of the signaling systems in Chinese Railways. The existing signaling
systems will be interoperable with the new signaling systems. In the future, all signaling
Addis Ababa Light Rail Transit Signaling System Design
4 Addis Ababa University, AAiT, Departement of ECE 2014
systems, imported systems or home-made systems, wayside systems or onboard systems must
be in line with the CTCS standardization. Apart from interoperability, the interface standard
between the signaling systems, migration from existing signaling to CTCS, data transmission
format between the subsystems, safety and reliability, capacity increase, easy maintenance,
lower investment and open market etc. are considered during CTCS working.
Based on the present situation of signaling system on Chinese Railway Network, CTCS will
be divided into the several levels, referring to ETCS. CTCS is planned to be divided into the
following five levels. Since, the contractor and designer of AA LRT system is Chinese
companies, they have used their own Train Control System. So that, for the reason of
compatibility with the existing system this thesis work prefer to use Chinese Train Control
System and it is shortly explained as follows [12].
Edmonton LRT signaling design guidelines [3] provides the guidelines and general
requirements that are needed by the signals consultant for the design of the extensions to
Edmonton‘s LRT signal system and its related components. These guidelines are
supplemented by the engineering standards contained in the ETS Engineering Standards
Manual for LRT Signals. This thesis work is mainly adopted from this document because of
parameteric similarities between Edmonton LRT system and AA LRT system.
Edmonton LRT signal system provides all the necessary failsafe protection measures to ensure
safe train operation as described in the following subsections. It consists of one double tracked
line approximately 13.1km in length. The next phase to be implemented is a 2.3 km south
extension.
1.3 Problem statement
Railway signaling techniques shall be applied at various LRT locations to enhance safety
in the movement of trains and to improve the overall efficiency of train operations. These
functions include the protection and control of track switches; the protection for following
trains operating with the normal current of traffic; and highway grade crossing warning. The
need for signaling, and the type of signalization provided, shall be determined by the specific
requirements of each line segment. Designer shall review past signal systems designs in
order to understand and use past design principles in order to maintain commonality in
designs.
Addis Ababa Light Rail Transit Signaling System Design
5 Addis Ababa University, AAiT, Departement of ECE 2014
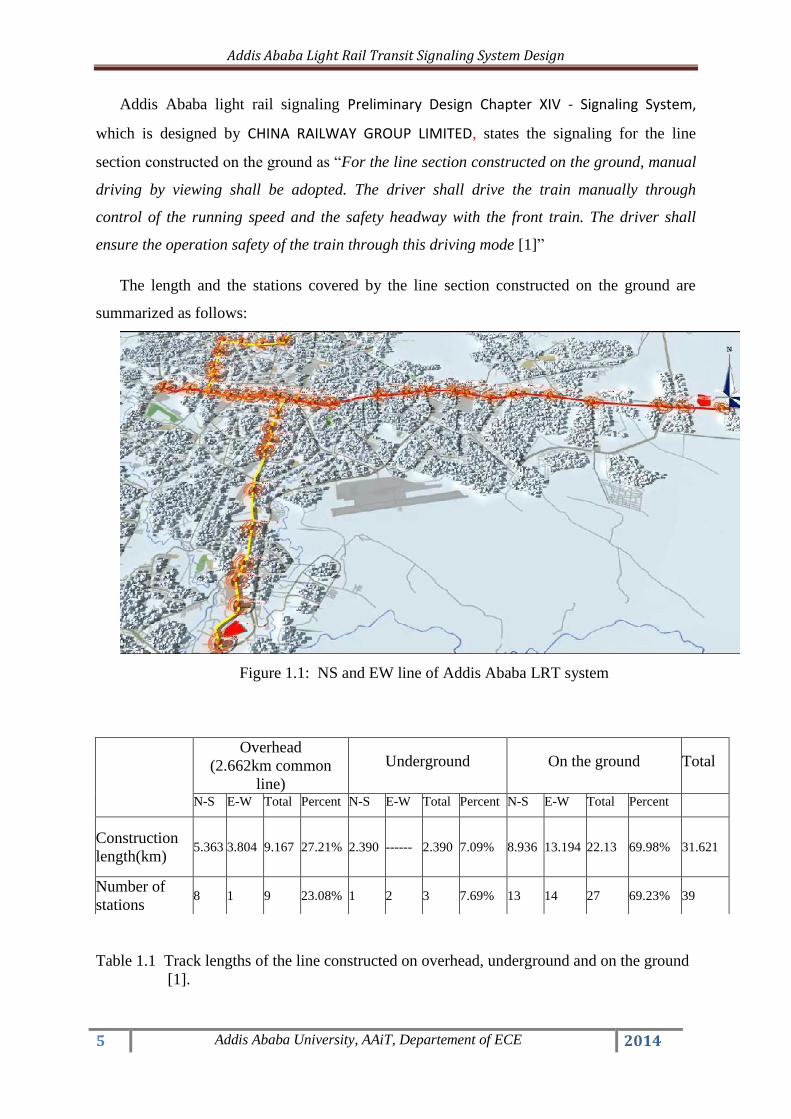
Addis Ababa light rail signaling Preliminary Design Chapter XIV - Signaling System,
which is designed by CHINA RAILWAY GROUP LIMITED, states the signaling for the line
section constructed on the ground as ―For the line section constructed on the ground, manual
driving by viewing shall be adopted. The driver shall drive the train manually through
control of the running speed and the safety headway with the front train. The driver shall
ensure the operation safety of the train through this driving mode [1]‖
The length and the stations covered by the line section constructed on the ground are
summarized as follows:
Figure 1.1: NS and EW line of Addis Ababa LRT system
Table 1.1 Track lengths of the line constructed on overhead, underground and on the ground
[1].
Overhead
(2.662km common
line)
Underground On the ground Total
N-S E-W Total Percent N-S E-W Total Percent N-S E-W Total Percent
Construction
length(km) 5.363 3.804 9.167 27.21% 2.390 ------ 2.390 7.09% 8.936 13.194 22.13 69.98% 31.621
Number of
stations 8 1 9 23.08% 1 2 3 7.69% 13 14 27 69.23% 39

Addis Ababa Light Rail Transit Signaling System Design
6 Addis Ababa University, AAiT, Departement of ECE 2014
The above table shows that, most of the track line constructed on ground, which 22.13km
out of the total 31.621km length. That covers 69.98% of the total construction. In addition to
that out of the total 39 stations, 27 of them are found on the part of the track line constructed
on ground. Even though most of the track line constructed on the ground, it will operated
manually without signaling system except the turnout and level crossing areas.
Is it safe and efficient to drive the train manually in Addis Ababa?
1. As a technology provides new and efficient signaling approaches, now a days most of
the railway services uses modern signaling system, since those systems are mainly
improves safety and operational efficiency.
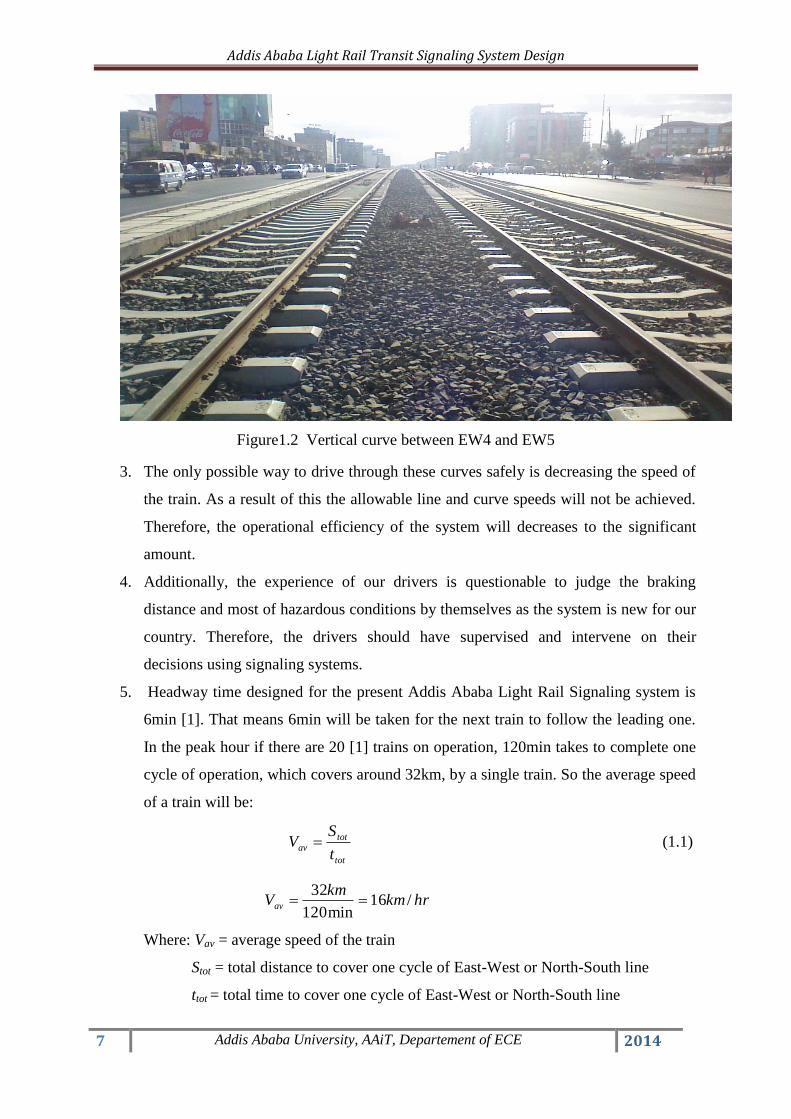
2. The topology of Addis Ababa is not suitable for manual driving by viewing because
of many vertical and horizontal curves exist which can cover the line of sight of the
driver from the status of the ahead track beyond the curves. This condition will be
worst during night time, rainy and fogy environment.
Table 1.2 Horizontal curves existing on main line constructed on the ground [1].
EW curve locations
(between stations)
Degree of curvature EW curve locations
(between stations)
Degree of curvature
EW5 – EW6 240 30‘ NS6 – NS7 79
0 11‘; 69
0 41‘
EW6 – EW7 320 52‘ NS7 – NS8 30
0 00‘
EW8 – EW9 200 09‘ NS9 – NS10 13
0 57‘
EW13 – EW14 280 23‘ NS11 – NS12 57
0 13‘
EW21 – EW22 630 10‘ NS12 – NS13 27
0 57‘; 31
0 21‘
NS13 – NS14 280 02‘
NS25 – NS26 230 41‘
Addis Ababa Light Rail Transit Signaling System Design
7 Addis Ababa University, AAiT, Departement of ECE 2014
Figure1.2 Vertical curve between EW4 and EW5
3. The only possible way to drive through these curves safely is decreasing the speed of
the train. As a result of this the allowable line and curve speeds will not be achieved.
Therefore, the operational efficiency of the system will decreases to the significant
amount.
4. Additionally, the experience of our drivers is questionable to judge the braking
distance and most of hazardous conditions by themselves as the system is new for our
country. Therefore, the drivers should have supervised and intervene on their
decisions using signaling systems.
5. Headway time designed for the present Addis Ababa Light Rail Signaling system is
6min [1]. That means 6min will be taken for the next train to follow the leading one.
In the peak hour if there are 20 [1] trains on operation, 120min takes to complete one
cycle of operation, which covers around 32km, by a single train. So the average speed
of a train will be:
tot
totav
t
SV (1.1)
hrkmkm
Vav /16min120
32
Where: Vav = average speed of the train
Stot = total distance to cover one cycle of East-West or North-South line
ttot = total time to cover one cycle of East-West or North-South line

Addis Ababa Light Rail Transit Signaling System Design
8 Addis Ababa University, AAiT, Departement of ECE 2014
The average speed (16km/hr) is so small which can be improved by using different
approaches of light rail transit signaling systems.
6. Future traffic:
If additional trains are added and the demand of this transport service increases, it is
difficult to manage the future traffic using existing signaling system.
1.4 Objective
1.4.1 General Objective
The signal system must be designed on the basis that a single failure by either a system
or by human error does not result in loss of life and or property damage. The design objective
is to provide safeguards in the signal system to prevent such a possibility, while still
facilitating an efficient LRT operating system.
1.4.2 Specific Objective
Safety Critical:
A fully automatic safety critical and failsafe system must be employed to prevent
hazardous conditions from occurring during normal system operations. Safety Critical
systems must be designed to activate in the event of system or human error and the
system must not hamper the normal safe conditions in train traffic operation. All systems
(safety critical or not) must be designed fail safe to prevent an unsafe condition from
occurring. No latent failure must result in an unsafe condition when combined with any
other failure. The system must ensure that safe operating procedures and methods are
maintained.
Installation of automatic systems is needed to;
Provide the level of safety required to prevent train on train and other types of
collision with fixed objects and conflicting vehicular or pedestrian traffic.
Provide service efficiency through automation in performing routine and repetitive
tasks and functions.
Enforce operating safety rules and equipment restrictions.
For a safety critical design the required level of safety must prevent the following
incidents from happening:
Head to tail collisions between trailing and leading trains.
Head to head collisions with opposing trains.
Head to side collisions with other trains.
Addis Ababa Light Rail Transit Signaling System Design
9 Addis Ababa University, AAiT, Departement of ECE 2014
Derailments caused by excessive speed, or improper equipment operation.
Collisions with vehicular and pedestrian traffic.
All conceivable modes must be employed to protect against possible conflict and collision
between trains, fixed objects and other traffic under normal operations. To meet this goal
automatic systems must be installed on the wayside and on the train that will prevent the
selection of conflicting routings, maintain adequate train separation and will bring about
the enforced and non-recoverable stopping of an encroaching train.
The system is divided into blocks and permission to enter the block will not be
given unless free and unrestricted travel at posted speed, free of conflicts, can be made to
the end of the block.
Wayside Equipment:
The signal wayside system must be a centralized design to minimize the number
of wayside boxes distributed across the system. This is done to allow ease of maintenance
and troubleshooting given the climatic conditions in Addis Ababa.
1.5 Organization of the Thesis
The thesis is organized into six chapters including this introduction. The rest of the thesis is
organized as follows:
Chapter 2 presents a review of different LRT system requirements such as calculation of safe
breaking distance, speed restrictions of available curves and switches, automatic fixed
blocking system in order to find some parameters for the design.
Chapter 3 focuses on the comparison of the existing and the newly proposed design in this
thesis.
In Chapter 4, all results of speed profiles and obtained parameters are discussed.
Finally, Chapter 5 draws the conclusions from the work done in this thesis and recommends
further research possible in the future.

Addis Ababa Light Rail Transit Signaling System Design
10 Addis Ababa University, AAiT, Departement of ECE 2014
1.6 Methodology used in this thesis
This research is based on the design of the existed AA LRT signaling system and
observations of constructions held on North-South and East-West line. Data gathered from
field and existing preliminary design controlled and synthesized based on variables such as
safety, operational efficiency, cost, energy efficient system and soon in order to come up with
different and more suitable signaling design for AA LRT system.
Based on the existing data the hypothesis is made which is Chinese or European signaling
level 0 should implemented on main line constructed on the ground. And I tried to prove my
hypothesis through getting enough facts about the headway time and the consequences by
improving the average speed of the operation such as operational efficiency and energy
consumption. Safety issues are also the main parameter that has to be improved on my new
design.

Addis Ababa Light Rail Transit Signaling System Design
11 Addis Ababa University, AAiT, Departement of ECE 2014
Chapter Two
2 New design of AA LRT signaling system
2.1 Design parameters
The following parameters are taken from AA LRT signaling design [1].
Type of track construction
Independent or isolated from rail vehicles except for level crossings
Composed of East-West line and North-South line
East–West line,
Full length of East-West line of phase one is about 16.998km
A total of 22 stations
North-South line,
Full length is around 16.689km
A total of 22 stations
Common track length is around 2.662km
Type of rail = Welded
Minimum Curve Radius: 50 meters in general,
The greatest vertical gradient of Mainline Interval is 5%
Type of train = Tramcar whose length is 28.400m
Rated Passengers: 6 persons/m2, 286 persons in one tram car in total.
Maximum speed = 70km/hr
Average Acceleration for Start-Up: 1m/s2
Average Deceleration for Braking:
1)The Average Deceleration of Normal Braking with Rated Load (including
control response time): ≥1.0m/s2
2)The Average Deceleration of Emergent Braking with Rated Load (including
control response time): ≥1.5m/s2

Addis Ababa Light Rail Transit Signaling System Design
12 Addis Ababa University, AAiT, Departement of ECE 2014
2.2 Level 0 CTCS
Based on the following conditions the appropriate selection is made.
- Maximum operation speed is 70km/hr.
- Already Chinese system is under construction.
- Cost of installation should be considered. Higher levels are safer and efficient but
needs high installation cost.
Therefore, Chinese Train Control System level 0 is an appropriate choice because of
compatibility issue with the existing system and speed criteria.
CTCS is classified by Level 0 and Level 1 while only ETCS Level 0 simplifies into line
which is not installed with ETCS facilities. In contrary to Europe, the train is operated with
most various on-board signal system, in the case of china, ground signal system and on-board
signal system are coexisted with traffic light according to the line and it is operated by them.
The ground signal system is classified with ETCS Level 0(the lowest level) on-board signal
system is classified with ETCS Level 1 in order to sort of both system [2].
CTCS level 0 consists of the existing track circuits, universal cab signaling (the digital,
microprocessors-based cab signaling that be compatible with the six kinds of track circuits)
and train operation supervision system. With level 0, wayside signals are the main signals and
cab signals are the auxiliary signals. It is the most basic mode for CTCS. It is no necessary to
upgrade the wayside systems for CTCS level 0. The only way to realize the level 0 is to equip
with the on-board system. CTCS level 0 is only for the trains with the speed less than
120km/h[12].
– Track circuit or axel counters (Train detection)
– Train signal (or wayside signal)
– Cab signaling
2.3 LRT System Requirements
2.3.1 System Design
The design and operation of the Addis Ababa LRT signal system must allow for a worst case
hazardous situation. The system operation must be designed to achieve the safest operation
possible consistent with the required operational efficiency. Fully automatic safety critical

Addis Ababa Light Rail Transit Signaling System Design
13 Addis Ababa University, AAiT, Departement of ECE 2014
failsafe systems must be employed to prevent the occurrence of a hazardous condition during
normal system operations.
For any future LRT extensions, the new LRT vital logic control system must allow train
movements in both directions on one track, i.e. each track is fully bi-directional. It must also
allow trains to automatically turn back at a station should that station be chosen to act like the
end-of-line station due to special circumstances [3].
2.3.2 System Safety Principles
As safety is of primary importance, the signals design must be based on safety critical.
Automatic Fixed Block System (AFBS) engineering design principles described later in this
chapter that is failsafe.
Automatic systems must be installed both on the wayside and the LRT train that will prevent
the selection of conflicting routings, maintain adequate train separation and will bring about the
enforced and non-recoverable stopping of an encroaching train.
The signal system for each LRT line is to be divided into fixed blocks. Permission for the train
entering the block must not be given unless free and unrestricted travel at posted speed, free of
conflicts can be made to the end of the block. A red block signal will not turn green unless all
the following conditions have been satisfied:
Tracks within the block and overlap block are not occupied,
The train is traveling in the correct direction,
The next block signal is operating properly, which means no signal lamp element is
burnt out,
No conflicting route into the block territory (including the overlap block),
Track switches are properly lined and locked (electrically and mechanically).
The design and layout of the signal system must consider:
Static and dynamic clearance envelopes
Safe braking standards for trains
Worst case stopping distance
Approach to signal blocks or grade crossings [3]

Addis Ababa Light Rail Transit Signaling System Design
14 Addis Ababa University, AAiT, Departement of ECE 2014
2.3.3 Braking Distance
Ref. [6] have discussed braking distance of train on “Calculating Train Braking Distance,”
study and this thesis work used it as follows.
Braking distance depends on:
• the speed of the train when the brakes are applied;
• the deceleration rate available with a full-service brake application, which varies
according to the coefficient of friction between wheel and rail;
• the delay from when the brakes are commanded by the train driver to when they are
actually become effective (brake delay time);
• the state of the wear of the brake pads and the air pressure available in the brake
cylinders;
• the geography of the track, in particular the track gradient the train travels over
from when the brakes are commanded to where the front of the train stops;
• the mass distribution of the train.
Stopping a train requires work. This work equals the change in the train‘s kinetic energy plus
the change in its potential energy (change in height due to the gradient of the track). The
‗work‘ is the energy in decelerating the train over the stopping distance, i.e. the product of the
train‘s mass (m), the train‘s acceleration rate (a) (deceleration is negative acceleration) and
the stopping distance (S).
The change in ‗kinetic‘ energy relates to the change in the train‘s speed i.e. the difference of
the speed at which deceleration began (U) and the ‗at stop‘ speed (0 km/hr). The change in
‗potential‘ energy relates to the change in height of the train‘s center of mass due to the
gradient of the track i.e. the difference in height at which deceleration began (h1) and the its
height at the stopping point (h2).
Mathematically this can be expressed as:
0)(2
112
2 hhmgmUmaS (2.1)
where ‗g‘ is the acceleration due to gravity and h2 ≥ h1
Mass is common in all the terms in the equation, and therefore can be cancelled out. This
suggests that mass has no direct effect on the stopping distance. However, mass has an effect
on the stopping distance as the location of the train‘s center of mass varies with the mass
distribution. Mass also affects the deceleration rate of a particular item of rolling stock. For

Addis Ababa Light Rail Transit Signaling System Design
15 Addis Ababa University, AAiT, Departement of ECE 2014
freight wagons, where the mass can vary from no load to full load, there are two levels of
brake force used i.e. ―empty‖ and ―loaded‖. The design of the brake system is such that as the
load increases, there is a point where the force changes from ―empty‖ to ―loaded‖. For
braking distance calculations the lowest deceleration rate is used to calculate the deceleration
rate for the complete train.
The change in height relates to the track gradient. The track gradient is the change of vertical
height over the corresponding change in horizontal distance. i.e. tan α, where α is the angle of
slope. For small α, which is the case for railways (mountain rack railways aside), tan α equals
sin α. Sin α is the change in height (h2 – h1) over the stopping distance(S):
)(tan)(sin12 SShh (2.2)
Substituting (2) into (1) and rearranging:
)tan(2
)( 2
ga
US
; for a < 0 (2.3)
The term ― tang ‖ is the gravitational acceleration. For uphill track gradients (h2 ≥ h1),
gravity assists deceleration.
It is impossible to calculate the precise stopping distance as this distance can vary
significantly due to the condition of the train and the environmental conditions at the time. To
take the conservative approach, allow for the worst case conditions would grossly impact on
track asset utilization. The industry approach is to assume that the train‘s brake system is
healthy and that the specified adhesion for that class of train is available when the brakes are
required to be applied.
To calculate braking distances it is therefore a matter of knowing the train braking parameters
for each type of train and the gradient of the track and apply Newtonian physics Equation 2.3.
However to compensate for these simplifications and the variable factors, an allowance of 15-
20% is usually added. This distance is the minimum distance that needs to be provided [6].
Brake delay time
Allowing 15-20% does not compensate for ignoring the brake delay time. For example,
consider a train that has a brake deceleration rate of 1ms-2
, and a brake delay time of 5s.
Assuming an initial speed of 100km/h and level track, the required braking distance is 524m.
Ignoring the brake delay time, the braking distance would be 385m. Adding 20%, increases
this to 462m, i.e. some 62m short. This is much worse for long trains where the brake delay
time is much longer [6].
Addis Ababa Light Rail Transit Signaling System Design
16 Addis Ababa University, AAiT, Departement of ECE 2014
For ―short‖ brake delay times the error is not that significant as there are other factors which
compensate:
• the train driver would normally initiate a brake application on sighting the first
warning to the Limit of Authority ahead, which is well before the calculated full-
service braking distance location (a full-service brake is a fairly severe brake
application and train driver‘s drive more conservatively);
• there is also retardation due to track curvature and viscous drag which is ignored in
the calculations.
If it can be demonstrated that each of the new train‘s parameters are on the ―safer‖ side when
compared to any other train for which the signaling was designed then the new train can be
introduced. ―Safer‖ in this case means:
• the maximum train speed is equal to or less;
• the full-service deceleration rate is equal to or greater;
• the brake delay time is equal to or shorter; and
• train length is equal. If any of the parameters are not ―safer‖ e.g. the maximum
speed is higher or the brake delay time is longer, then a re-calculation of all braking distances
is required. Depending on the intended operating routes, this could involve thousands of
calculations.
2.3.4 Speed Restrictions
The maximum allowable operating speed of the train on main line is based on a variety of
safety factors. It is therefore necessary to have speed enforcement devices installed to
minimize the potential for errors or operating procedure violations.
A speed check enforcement device must be installed along the main line to ensure that a posted
speed is not exceeded if it is determined that excessive speed at this location may pose a threat
to public or passenger safety. The speed check must trigger the trains automatic braking
system once the train exceeds the posted speed limit.
Note: The maximum allowable operating posted speed is 70 km/hr.
Maximum Speed The maximum train run speed is limited to approximately70km/hr.
Speed restrictions may be due to curves, special work, or speed controls approaching a
terminal station. If the speed limits are not known they can be approximated from the
following equation [17].
2
1
87 feRvsl (2.4)

Addis Ababa Light Rail Transit Signaling System Design
17 Addis Ababa University, AAiT, Departement of ECE 2014
Where; vsl = speed limit in km/h
R = radius of curvature in meters
e = super elevation ratio (height the outer rail is raised divided by track gauge) usually
not greater than 0.10
f = comfort factor (ratio of radial force to gravitational force—0.13 is the maximum
used in rail transit with some systems using as low as 0.05)
2.3.5 Automatic Fixed Block Signaling
Automatic Fixed Block Signal system (AFBS) shall be installed at certain locations along the
LRT right-of-way to permit higher operating speeds than would be possible by relying on
line- of-sight operation without signals. The AFBS system shall provide information to train
operators concerning the condition and occupancy of the track ahead, and provide sufficient
stopping distance, when required. Where operationally and technically feasible, Automatic
Train Stop (ATS) shall be provided if a train passes a stop signal. All signals will follow a
standard ―Green-Yellow-Red‖ configuration.
In all circumstances, except as detailed below, each signal shall be located at least Safe
Braking Distance in advance of the previous signal. Permitted train speed shall be a
determining factor when calculating Safe Brake Speed for a specific section of track.
Occasionally, the physical location of station platforms, power switches, line of sight
limitations, etc. will make it impossible to locate the signals at a Safe Braking Distance apart.
Overlap circuits greater than the ATS distance shall be used in advance of the AFBS signal.
The Overlap circuit may be a mainline track circuit or an Audio Frequency Overlay (AFO)
circuit [9].
Wherever an overlap is provided, a signal will not clear from Red to Yellow until the leading
train is clear of the next signal and the overlap track circuit in advance of that signal.
Functionally, this means that if a train overruns a Red signal, the signal system‘s Automatic
Train Stop (ATS) will be activated and the train will be brought to a stop. A leading train in
the area will be at least the length of the overlap beyond the Red signal just overrun. This
overlap, while not the calculated ―worst case‖ braking distance, will provide a measure of
safety to ensure that there is no leading train immediately beyond a Red signal [9].
Fixed block signaling is the most widely used form of signaling, both for urban and inter-city
railway operations. Consider a 3-aspect arrangement as shown in Figure 2.1

Addis Ababa Light Rail Transit Signaling System Design
18 Addis Ababa University, AAiT, Departement of ECE 2014
Station B Station A
Figure 2.1 A 3-Aspect Fixed Block layout
Each track is divided into discrete sections called blocks. Each block is equipped with
failsafe track circuit devices that sense and indicate the presence of a train within the block. A
train is not permitted to enter a block until a signal indicates that the train may proceed, a
dispatcher or signalman instructs the driver accordingly, or the driver takes possession of the
appropriate token. In most cases, a train cannot enter the block until not only the block itself
is clear of trains, but there is also an empty section beyond the end of the block for at least the
distance required to stop the train [3].
The condition of the block signal is a RED (stop) indication. The signal will not turn GREEN
(go) unless it is safe to enter the block and the signal light is operating properly. Trains
attempting to enter the block that has a red block signal will be stopped automatically by the
train stop magnet associated with the block signal. Vital Software must be designed using the
check-redundancy principles. These systems must be proved to be independently safe from
external influences such as, but not limited to, EMI, interfaced system or sub-systems, and
human operation from either the local control panel or central train control.
A two-aspect signaling system does not provide the capacity normally required on busy rail
transit lines—those with trains an hour or better. Increased capacity can be obtained from
multiple aspects where intermediate signals advise the driver of the condition of the signal
ahead, so allowing a speed reduction before approaching a stop signal. Block lengths can be
reduced relative to the lower speed, providing increased capacity.
The increased number of blocks, and their associated relay controls and color-light signals, is
expensive. There is a diminishing capacity return from increasing the number of blocks and
aspects.
Green Red Yellow Green Green Green Yellow

Addis Ababa Light Rail Transit Signaling System Design
19 Addis Ababa University, AAiT, Departement of ECE 2014
In signaling-based systems with closely spaced signals, this overlap could be as far as the
signal following the one at the end of the section, effectively enforcing a space between trains
of two blocks.
When calculating the size of the blocks, and therefore the spacing between the signals, the
following have to be taken into account:
Line speed (the maximum permitted speed over the line-section)
Train speed (the maximum speed of different types of traffic)
Gradient (to compensate for longer or shorter braking distances)
The braking characteristics of trains (different types of train, e.g. freight, High-Speed
passenger, have different inertial figures)
Sighting (how far ahead a driver can see a signal)
Reaction time (of the driver) [3]
2.3.6 Fixed Block Throughput for three aspect signaling system
Ref. [17] Determining the throughput of any rail transit train control system relies on the
repetitive nature of rail transit operation. In normal operation trains follow each other at
regular intervals traveling at the same speed over the same section of track.
All modern trains have very comparable performance. All low-performance equipment is
believed to have been retired. Should a line operate with equipment with different
performance and/or trains of different length, then the maximum throughput rates developed
in this section should be based on the longest train of the lowest performing rolling stock.
Trains operating on an open line with signaling protection but without station stops have a
high throughput. This throughput is defined as line or way capacity. This capacity will be
calculated later in this section although it has little relevance to achievable capacity except for
systems with off-line stations. Only Automated Guide way Transit, or some very high
capacity lines in Japan, can support off-line stations.
Stations are the principal limitation on the maximum train throughput—and hence maximum
capacity—although limitations may also be due to turn-back and junction constraints. The
project survey of operating agencies indicated that the station close-in plus dwell time was
the capacity limitation in 79% of cases, turn back constraints in 15%, and junctions in 5% of
cases. Further inquiry found that several turn back and junction constraints were self-imposed

Addis Ababa Light Rail Transit Signaling System Design
20 Addis Ababa University, AAiT, Departement of ECE 2014
due to operating practices and that stations were by far the dominant limitation on throughput
[17].
In a well-designed and operated system, junction or turn back constrictions or bottlenecks
should not occur. A flat junction can theoretically handle trains with a consolidated headway
approaching 2 min. However, delays may occur and systems designed for such close
headways will invariably incorporate grade-separated (flying) junctions. Moving-block
signaling systems provide even greater throughput at flat junctions.
A two-track terminal station with either a forward or rear scissors cross-over can also support
headways below 2 min unless the cross-overs are long, spaced away from the terminal
platform, or heavy passenger movements or operating practices when the train crew changes
ends (reverses the train) result in long dwells. The latter two problems can be resolved by
multiple-platform terminal stations by establishing set-back procedures for train crews.
In this chapter the limitations on headway will be calculated for all three possible bottlenecks:
station stops, junctions and turn backs.
All the reports deal with station stops as the principal limitations on capacity and use
Newton‘s equations of motion to calculate the minimum train separation, adding a variety of
nuances to accommodate safety distances, jerk limitations, braking system and drivers‘
reaction times plus any operating allowance or recovery margin.
Station Close-in time:
The time between a train pulling out of a station and the next train entering—referred to as
close-in—is the main constraining factor on rail transit lines. This time is primarily a function
of the train control system, train length, approach speed and vehicle performance. Close-in
time, when added to the dwell time and an operating margin, determines the minimum
possible headway achievable without regular schedule adherence impacts—referred to as the
noninterference headway. When interference occurs, trains may be held at approaches to
stations and interlocking. This requires the train to start from stop and so increases the close-
in time, or time to traverse and clear an interlocking, reducing the throughput. With
throughput decreased and headways becoming erratic, the number of passengers accumulated
at a specific station will increase and so increase the dwell time. This is a classic example of
the maxim that when things go wrong they get worse.
The minimum headway is composed of three components:

Addis Ababa Light Rail Transit Signaling System Design
21 Addis Ababa University, AAiT, Departement of ECE 2014
• the safe separation (close-in time),
• the dwell time in the station, and
• an operating margin.
The best method to determine the close-in time is from the specifications of the system being
considered, from existing experience of operating at or close to capacity or from a simulation.
The classical expression for the minimum headway of the typical rail transit three-aspect
block-signal system is [17]
M
a
LD
v
BL
tH
w
ap
1
22
)(
(2.5)
The block length must be greater than or equal to the service stopping distance.
d
VSDBL
ap
2
2
(2.6)
Where; H(t) = headway in seconds
BL = block length approaching station (m)
Dw = station dwell time in seconds
SD = service stopping distance for level track (m)
L = length of the longest train (m)
vap = maximum approach speed (m/s)
a = average acceleration rate through the station platform clear-out (m/s2)
d = braking rate (m/s2)
M = headway adjustment combining operational tolerance and dwell time variance
(constant)
Although the headway adjustment factor, M, can encompass a variety of items, it is difficult
to encompass all the variables that can affect headway. These include
• any distance between the front of the train and the start of the station exit block,
particularly if the train is not berthed at the end of the platform;
• control system reaction time;
• on manually driven trains, the train operator sighting and reaction time;
• the brake system reaction time;

Addis Ababa Light Rail Transit Signaling System Design
22 Addis Ababa University, AAiT, Departement of ECE 2014
• an allowance for jerk limitation;
• speed restrictions on station approaches and exits whether due to speed control for
special work or curves; and
• grades approaching and leaving a station.
In addition, the length of the approach block and the approach speed are not readily
obtainable quantities. Consequently this traditional method is not recommended and an
alternate approach will be developed. This uses more readily available data accommodating
many of the above variables. This approach encompasses both manually and automatically
driven trains, multiple command cab controls, and, by decreasing block length, a moving-
block system. Even so, it should be borne in mind that not all variables can be included, and
assumptions and approximations are still needed. This approach, while more comprehensive
than many in the literature, is not as good as using information from signaling engineers,
based on actual block positions, or from a comprehensive and well-calibrated simulation.
Calculating Line Headway
On a level, tangent (straight) section of track with no disturbances the line headway H(l) is
given by [17]:
lv
SLlH min)(
(2.7)
where H(l) = line headway in seconds
Smin = minimum train separation in meters
L = length of the longest train in meters
vl = line speed in m/s
The minimum train separation corresponds to the sum of the operating margin and safe
separation distance shown in Figure 3.2. It can therefore be further subdivided: (all in meters)
Smin = Ssbd + Std + Som (2.8)
Where; Smin = mininimum train separation distance
Ssbd = safe braking distance
Std = train detection uncertainty distance
Som = operating margin distance
The safe braking distance is based on the rail transit assumption of brick-wall stops using a
degraded service braking rate. The train detection uncertainty reflects either the block length

Addis Ababa Light Rail Transit Signaling System Design
23 Addis Ababa University, AAiT, Departement of ECE 2014
Station A
Station B
Rear of Leading
Train
Front of Following
Train
Minimum
Headway
Safe separation
Distance
Dis
tan
ce
Time
Dwell om sst
or the distance covered in the polling time increments of a moving block signaling system.
The operating margin distance is the distance covered in this time allowance. This will be
omitted from further consideration in this section.
Figure2.2 Distance-time plot of two consecutive trains (acceleration and braking curves
omitted for clarity) [17]
Substituting for Smin and removing Som produces
l
sbdtd
v
SSLlH
)(
(2.9)
There are several components in the safe braking time. The largest is the time to brake to a
stop, using the service brake. A constant K is added to assume less than full braking
efficiency or reduced adhesion—75% of the normal braking is an appropriate factor. There is
also the distance covered during driver sighting and reaction time on manually driven trains,
and on automatically driven trains brake equipment reaction time and a safety allowance for
control failure. This over speed allowance assumes a worst case situation whereby the failure
occurs as the braking command is issued with the train in full acceleration mode. This is
often termed runaway propulsion. The train continues to accelerate for a period of time tos
until a speed governor detects the over speed and applies the brakes [17].
osbrbdsbd SSSK
S 100
(2.10)
Addis Ababa Light Rail Transit Signaling System Design
24 Addis Ababa University, AAiT, Departement of ECE 2014
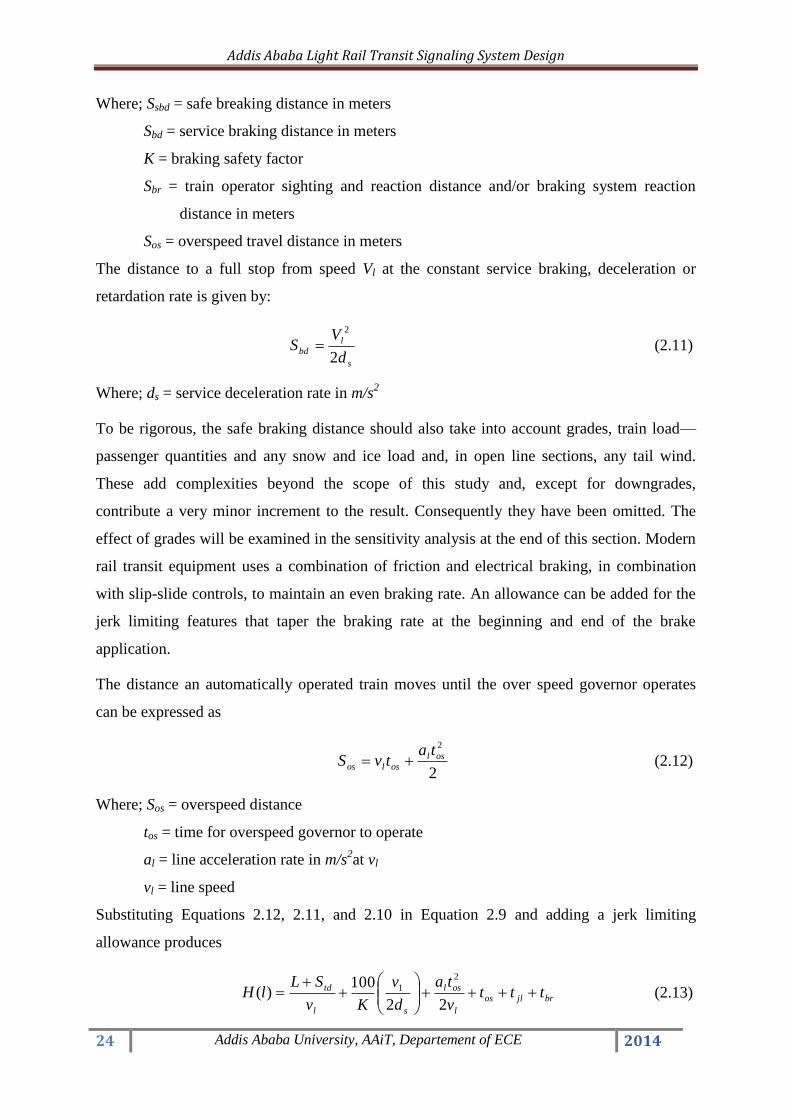
Where; Ssbd = safe breaking distance in meters
Sbd = service braking distance in meters
K = braking safety factor
Sbr = train operator sighting and reaction distance and/or braking system reaction
distance in meters
Sos = overspeed travel distance in meters
The distance to a full stop from speed Vl at the constant service braking, deceleration or
retardation rate is given by:
s
lbd
d
VS
2
2
(2.11)
Where; ds = service deceleration rate in m/s2
To be rigorous, the safe braking distance should also take into account grades, train load—
passenger quantities and any snow and ice load and, in open line sections, any tail wind.
These add complexities beyond the scope of this study and, except for downgrades,
contribute a very minor increment to the result. Consequently they have been omitted. The
effect of grades will be examined in the sensitivity analysis at the end of this section. Modern
rail transit equipment uses a combination of friction and electrical braking, in combination
with slip-slide controls, to maintain an even braking rate. An allowance can be added for the
jerk limiting features that taper the braking rate at the beginning and end of the brake
application.
The distance an automatically operated train moves until the over speed governor operates
can be expressed as
2
2
osloslos
tatvS
(2.12)
Where; Sos = overspeed distance
tos = time for overspeed governor to operate
al = line acceleration rate in m/s2at vl
vl = line speed
Substituting Equations 2.12, 2.11, and 2.10 in Equation 2.9 and adding a jerk limiting
allowance produces
brjlos
l
osl
sl
td tttv
ta
d
v
Kv
SLlH
22
100)(
2
1
(2.13)

Addis Ababa Light Rail Transit Signaling System Design
25 Addis Ababa University, AAiT, Departement of ECE 2014
Where; tbr = train operator sighting and reaction time and/or braking system reaction time
tjl = jerk limiting time allowance
Service acceleration is said to be following the motor curve as it reduces from the initial
controlled rate to zero at the top, maximum, or balancing speed of the equipment. The
acceleration rate at a specific speed may not be readily available and an approximation is
appropriate for this item—a small component of the total line headway time. On equipment
with a balancing speed of 70 km/h, the initial acceleration is maintained until speeds reach
10-20 km/h then tapers off, approximately linearly until speeds of 50-60 km/h, then
approximately exponentially until it is zero. At line speeds appropriate to this analysis the
line acceleration rate can be assumed to be approximate to the inverse of speed so that for
intermediate speeds [17]
max
1v
vaa l
sl
(2.14)
Where; vl = line speed in m/s
vmax = maximum train speed in m/s
al = line acceleration rate in m/s2
as = initial service acceleration rate in m/s2
The train detection uncertainty distance is not readily available but can be approximated as
either the block length(s)—again not easily obtained—or the braking distance plus some
leeway as a surrogate for block lengths on a system designed for maximum throughput. This
quantity is particularly useful as a simple method to adjust for the differences between the
traditional three-aspect signaling system, cab controls with multiple aspects (command
speeds) and moving-block signaling systems [17].
s
ltd
d
vBS
2
2
(2.15)
Where; B = a constant representing the increments or percentage of the braking distance—or
number of blocks—that must separate trains according to the type of train
control system.
A B-value of 1.2 is recommended for multiple command cab controls [17]. A value of 2.4 is
appropriate for three-aspect signaling systems where there is always a minimum of two clear
blocks between trains [17]. The value of B for moving-block signaling systems can be equal
Addis Ababa Light Rail Transit Signaling System Design
26 Addis Ababa University, AAiT, Departement of ECE 2014
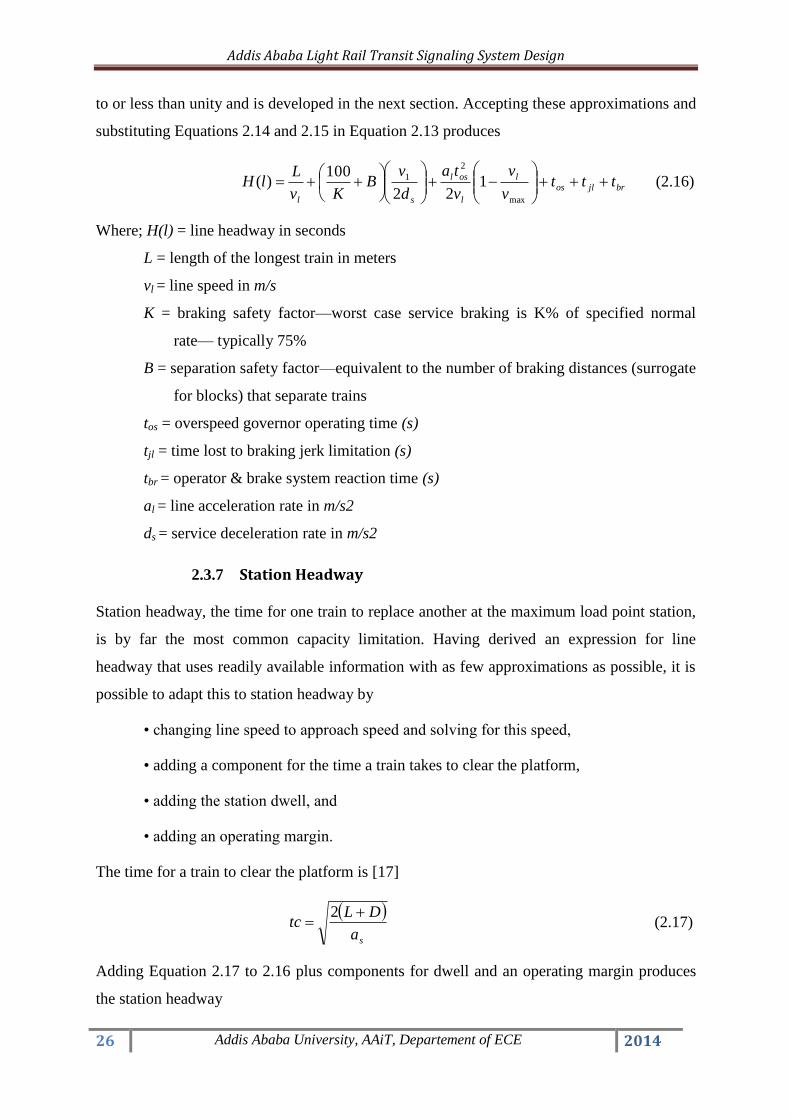
to or less than unity and is developed in the next section. Accepting these approximations and
substituting Equations 2.14 and 2.15 in Equation 2.13 produces
brjlosl
l
osl
sl
tttv
v
v
ta
d
vB
Kv
LlH
max
2
1 122
100)(
(2.16)
Where; H(l) = line headway in seconds
L = length of the longest train in meters
vl = line speed in m/s
K = braking safety factor—worst case service braking is K% of specified normal
rate— typically 75%
B = separation safety factor—equivalent to the number of braking distances (surrogate
for blocks) that separate trains
tos = overspeed governor operating time (s)
tjl = time lost to braking jerk limitation (s)
tbr = operator & brake system reaction time (s)
al = line acceleration rate in m/s2
ds = service deceleration rate in m/s2
2.3.7 Station Headway
Station headway, the time for one train to replace another at the maximum load point station,
is by far the most common capacity limitation. Having derived an expression for line
headway that uses readily available information with as few approximations as possible, it is
possible to adapt this to station headway by
• changing line speed to approach speed and solving for this speed,
• adding a component for the time a train takes to clear the platform,
• adding the station dwell, and
• adding an operating margin.
The time for a train to clear the platform is [17]
sa
DLtc
2 (2.17)
Adding Equation 2.17 to 2.16 plus components for dwell and an operating margin produces
the station headway

Addis Ababa Light Rail Transit Signaling System Design
27 Addis Ababa University, AAiT, Departement of ECE 2014
omdbrjlos
la
a
oss
s
a
as
tttttv
v
v
ta
d
vB
Kv
L
a
DLlH
max
2
122
1002)(
(2.18)
Where; H(l) = station headway in seconds
L = length of the longest train in meters
D = distance from front of stopped train to start of station exit block in meters
va = station approach speed in m/s
vmax = maximum line speed in m/s
K = braking safety factor—worst case service braking is K% of specified normal
rate— typically 75% [17].
B = separation safety factor—equivalent to number of braking distances plus a
margin, (surrogate for blocks) that separate trains
tos = time for overspeed governor to operate
tjl = time lost to braking jerk limitation— (seconds) typically 0.5 seconds
tbr = operator and brake system reaction time
td = dwell time (seconds)
tom = operating margin (seconds)
as = initial service acceleration rate in m/s2
ds = service deceleration rate in m/s2
Typical values will be used and this equation solved for the approach speed under two
circumstances:
1. three-aspect signaling system (B = 2.4)
2. multiple command speed cab controls (B = 1.2) [17].
A 45-sec dwell time is used—typical of the busiest stations on rail transit lines operating at
capacity—together with an operating margin time of 20 sec [17]. The brake system reaction
time will use a moderate level of 1.5 sec—this should be higher for old air brake equipment,
lower for modern electronic control, particularly with hydraulically actuated disk brakes.
Other factors remain at the levels used in the line headway analysis.
Two factors have not been taken into account in the determination of minimum headways in
the preceding section— grades and fluctuations in traction voltage.
Addis Ababa Light Rail Transit Signaling System Design
28 Addis Ababa University, AAiT, Departement of ECE 2014
Grades
The principal effect of grades is where downgrades into stations increase the braking distance
and the distance associated with the runaway propulsion factor. A simple method to
compensate for grades is to adjust the service braking and acceleration rates in Equation 2.18
while holding the component of the equation that relates to the time for a train to exit a
platform constant. The acceleration due to gravity is 9.807 m/s2. Thus each 1% in downgrade
reduces the braking rate by 0.098 m/s2. Note that most rail transit systems have design
standards that limit grades to 3 or 4%, a few extend to 6% and the occasional light rail grade
can extend to 10%. The impact of grades is greater into a station. The greatest impact is a
downgrade into a station which increases the braking and so the safe separation distance.
Block lengths must be longer to compensate for the longer braking distances.
Line Voltage
Rail transit in Addis Ababa is supplied by direct current power at a potential of 750 volts. As
more power is drawn through the substations, feeders or overhead catenary, the voltage
drops. Voltage is higher in the vicinity of substation feeders and drops off with distance.
Voltage is said to be regulated within a system specification that is typically +20% to -30%.
The lowest voltage occurs at locations most remote from sub-stations in the peak hour when
the maximum number of trains are in service. The lower voltage reduces train performance—
at a time when the heavy passenger load is doing likewise. Both acceleration and balancing
speed are reduced; braking is not affected.
The acceleration of a train is approximately proportional to the power applied to the motors,
which in turn is proportional to the square of the supply voltage. This is particularly true for
older equipment with switched resistor controls, less so with modern electronically controlled
equipment. Consequently, for older equipment without on-board motor voltage feedback and
control, the common 10% reduction in voltage will reduce acceleration to 81% of normal; the
very rare 30% drop will reduce acceleration to 49% of normal.
Reduced acceleration affects the platform clear out component of the headway calculation.
The resultant headway sensitivity to voltage is shown below. At a typical 15% drop in
voltage headway increases by 3.2 seconds, a 2.7% change. It is not possible to calculate line
voltage at any instance of time without a complete train performance and traction supply
system simulation. This will automatically occur if a simulation is used to determine the
minimum headway. Otherwise it is uncertain whether a manual adjustment should be made

Addis Ababa Light Rail Transit Signaling System Design
29 Addis Ababa University, AAiT, Departement of ECE 2014
based on the above chart—with certain designs of modern rolling stock the effect of voltage
drop can be less than shown.
2.4 Equipment Requirements
Due to the harsh weather conditions all new outdoor wayside equipment must be rated for
temperatures that exceed the summer and winter conditions normally expected in Addis Ababa.
In addition all outdoor equipment of AA LRT must meet the following requirements [3]:
Must be highly reliable i.e. the equipment has been used and is proven by other Transit
properties operating in an environment similar to the Addis Ababa LRT System.
Must be rustproof
From an equipment maintenance perspective it is desirable to keep the number of different
equipment suppliers to minimum for the following reasons:
To eliminate interfacing requirements (the black conversion box)
To minimize spatial requirements
To minimize the amount of additional staff training (required for new
systems)
To maintain consistency in operational functionality
To consolidate spares inventory and control
2.4.1 Numbering Schemes
All equipment, relay, contacts and terminals for all LRT extensions must be identified, located
and numbered with a numbering scheme. It is through the numbering system that a signal
maintenance technician is able to identify where a specific point or piece of equipment is
located within the system.
Most equipment on the main line of the existing LRT system is identified by the chainage
location of the equipment in reference to the Control Center. Signals (Block and call-on) and
speed checks have a unique identifier, indicating the track and the distance [3].
2.4.2 Wayside Signals
Based on failsafe signal design principles, all signal lights must be monitored by the current
flowing through the signal lamp element. A RED light or an AMBER light must have double
element incandescent lamp, the principal and the secondary element. A ―signal disturbed‖
alarm must be issued as soon as the principal element has burnt out.

Addis Ababa Light Rail Transit Signaling System Design
30 Addis Ababa University, AAiT, Departement of ECE 2014
For LED signal aspects, light-out detection must be provided with status information sent to the
CTC system. LED light-out alarm must be failsafe. LED light-out must be equivalent to a red
signal.
All signal lights must be lit and complete with proper lenses and filters. The power supply for
the LRT signal lights must come directly from the relay room controlling that particular signal.
The outgoing power must not be grounded (isolated power). Shields on signal lights must be
provided so that glare from the sun will not interfere with the Motorman‘s vision.
Label all new block signal and grade crossing protection call-on signal lights with white letters
and numbers on black background to match existing. Provide clear labeling for all new track
switches and speed checks so that it is easily identified by the Motorman.
Location of all wayside equipment must be clear from the dynamic movement of the trains [3].
2.4.3 Track Circuits
The track circuit is an electrical circuit which includes a length of running rails (or special
rails) and permits detection of the presence of a train. It may also be used to communicate
commands, instructions, or indications between the wayside and a train. They provide
information on the location of the trains, and this information is used to command train
speeds so that the trains operate safely. For instance, if a train attempts to approach too close
to the rear of another train, information on the locations of the two trains, provided by the
track circuits, is used to command slowdown or stop of the following train before there is
danger of a rear-end collision [18].
A. D.C. Track Circuits
In all track circuits an electrical signal of some kind is impressed between the running rails,
and the presence of a train is detected by the electrical connection that the wheels and axles
of the train make between the two running rails. In D.C. track circuits, the electrical signal is
direct current, usually supplied by batteries. The detector for the electrical signal is a relay.
The track circuit consists of a block or length of track which is defined at each end by
insulated joints in the running rails. The insulated joints provide electrical insulation between
a given track circuit and the adjoining tracks which comprise other track circuits. The signal
source, in this case a battery, is connected to the rails at one end of the track circuit while the
receiver (a relay) is connected to the other end, When no train is present, the track circuit is
said to be unoccupied, and the direct current supplied by the battery is transmitted by the

Addis Ababa Light Rail Transit Signaling System Design
31 Addis Ababa University, AAiT, Departement of ECE 2014
running rails to the relay and energizes it or ―picks it up‖. When the relay is energized, the
upper set of relay contacts is connected causing the green signal light to be turned on. When a
train enters the track circuit its wheels and axles connect the two running rails together,
shorting the battery and thereby reducing the current through the relay. This causes the relay
to ―drop‖. This action connects the bottom set of relay contacts, turning off the green signal
light and turning on the red light to indicate that the block is occupied by a train. The resistor
in series with the battery protects the battery by limiting the current the battery must provide
when a train is present.
The relay would have several sets of contacts connected in combination with the contacts
from other relays in nearby track circuits to form logic circuits for the control of the signaling
devices (the red and green lights).
The breaking of any conductor or the loss of power in the circuit will cause either a red signal
or no signal at all to be displayed. A red or ―dark‖ signal is always to be interpreted as a
command to stop. To put it another way, all signaling systems are designed so that a green
signal (meaning proceed) is presented only when the track circuits provide positive
information that it is safe to do so.
The double-rail D.C. track circuit is susceptible to interference when the running rails are also
used as the return for D.C. electric propulsion current. For this reason, D.C. circuits are not
used in rail rapid transit. Single-rail D.C. track circuits could be used, but in fact all modern
rail rapid transit systems use some form of A.C. track circuit.
B. Power-Frequency A.C. Track Circuits
The power-frequency A.C. track circuit is energized by an alternating electrical current with a
frequency in the range of 50 to 150 hertz. Except for the type of current and apparatus used,
the A.C. track circuit is similar in operation to the D.C. track circuit described above.
As with the D.C. circuit, the A.C. track circuit consists of a block or length of track which is
defined at each end by insulated joints in one or both of the running rails.
The A.C. signal source (usually a transformer) is connected to the rails at one end of the track
circuit while the receiver (a relay) is connected to the other end, In addition to the signal
source and the receiver, the A.C. track circuit contains a pair of impedance bonds at each pair
of insulated joints. An impedance bond is a center-tapped inductance which is connected
Addis Ababa Light Rail Transit Signaling System Design
32 Addis Ababa University, AAiT, Departement of ECE 2014
across the rails on both sides of the insulated joints. The purpose of the impedance bonds is to
provide continuity between the track circuits for the D.C. propulsion power and to distribute
the propulsion current between the two running rails. The impedance bonds do this while still
maintaining relatively high impedance at the signaling frequencies between the two rails and
between adjacent track circuits.
C. High-Frequency A.C. Track Circuits
Some A.C. track circuits use a current that alternates at a frequency in the range of hundreds
or thousands of hertz. Because this frequency range corresponds roughly to the spectrum of
audible sound, such circuits are sometimes called audio-frequency track circuits.
High-frequency A.C. track circuits eliminate the need for insulated joints in the running rails.
Because insulated joints are expensive to install and to maintain, eliminating them leads to a
significant cost reduction. Eliminating insulated joints also allows the track circuit to operate
with the continuous welded rails being used in some newer installations. Since no insulated
joints are used in the running rails, the ends of the block established by special transformers
are connected to the rails.
The transformer winding attached to the rails is usually a single turn of heavy copper bar
stock. The transformer core is often a toroid. The other transformer winding is tuned to
resonate at the operating frequency by a capacitor. The transmitter is the A.C. signal source
and provides electrical energy at the operating frequency in the audio-frequency range. The
receiver in this case is not simply a relay, as with the A.C. and power-frequency A.C. track
circuits, but an electronic circuit which responds to the electrical signal provided by the
transmitter. The receiver may be used to actuate a relay which performs functions like those
in the D.C. or power-frequency A.C. track circuits. Thus, when no train is present the high-
frequency A.C. potential supplied by the transmitter is connected to the running rails by the
transformer and transmitted along the running rails to the other transformer and its associated
receiver. When the receiver detects the high-frequency A.C. signal, the relay is energized and
the green signal light is turned on. When a train enters the block, the circuit behaves much as
it would with the A.C. or power-frequency A.C. track circuits, That is, the train wheels and
axles connect the two running rails together, and the current to the receiving transformer and
its associated receiver causes the track circuit relay to drop, turning off the green light and
turning on the red light.

Addis Ababa Light Rail Transit Signaling System Design
33 Addis Ababa University, AAiT, Departement of ECE 2014
In practice, it is necessary to accommodate the adjacent track circuits on either side, Rather
than install two separate transformers for each track circuit, a second resonant winding can be
included in each transformer or a heavy primary winding can be passed through more than
one transformer core. Thus, a single transformer assembly is used at the boundary between
adjacent track circuits and serves each. Although part of the same transformer assembly, the
resonant windings are effectively isolated from each other because they are tuned to and
operate on different frequency.
2.4.4 Axel Counters
An alternative method of determining the occupied status of a block is using devices located
at its beginning and end that count the number of axles entering and leaving. If the same
number of wheels leaves the block as enter it, the block is assumed to be clear. Although axle
counters can provide similar functionality to track circuits, they also exhibit a few other
characteristics. In a damp environment an axle counted section can be far longer than a track
circuited one. The low ballast resistance of very long track circuits reduces their sensitivity.
Track circuits can automatically detect some types of track defect such as:
A broken rail.
In the event of power restoration after a power failure, an axle counted section is left
in an undetermined state until a train has passed through the affected section. When a
block section has been left in an undetermined state, it may be worked under pilot
working. The first train to pass through the section would typically do so at a speed no
greater than 20 mph (32 km/h) or walking pace in areas of high transition, reverse
curvature and may have someone who has a good local knowledge of the area acting
as the pilot man. A track circuited section will detect the presence of a train in section
immediately.
If part of the train is left in the section, that part will continue to be detected by the
track circuit [3].
2.4.5 Central Traffic Control System
Addis Ababa LRT CTC system carries out data acquisition, processing, monitoring,
presentation, and archiving function for train system data received from field code units
(FCU's). It must include complete centralized traffic control, train routing, train tracking
functions, and processing of train and crew data. Functions also exist for information storage
Addis Ababa Light Rail Transit Signaling System Design
34 Addis Ababa University, AAiT, Departement of ECE 2014
and retrieval, playback of rail operations, and simulation of rail operations. The CTC system
must include report generation functions, extensive user interface displays of the LRT network,
interfaces to train control status boards, and a repository of online documentation [3].
System Software
The CTC software must be built on the ARINC Advanced Information Management (AIM) or
ETS approved platform. The CTC application software components must include the
following functions: Communication Processing (the extension of data acquisition and
control functions)
System Processing (data processing and calculations, control processing, centralized
traffic control, train tracking, train routing, train scheduling, event and alarm
processing, data recording archival playback)
Display Processing (console management)
Maintenance Processing (graphic editor, dialog editor, database and display linking,
database management, simulation, configuration tools)
Management Processing (forms and reports)
User processing (graphical user interface)
Network Infrastructure
The CTC system must be distributed over several LRT facilities consisting of the
following:
A real time redundant computer server system. Maintenance Facility server room
operating in a hot standby mode.
An Emergency Backup computer server facility serving in cold standby mode.
The equipment directly available to the LRT Control Centre personnel consists of
two (2) consoles, each with multiple monitor workstations.
Four (4) FCUs, one in each in relay rooms. This FCU is a Modicom 984 mini-PLC
system that receives status indications from the territorial wayside equipment and
conveys commands from the ETS Control Centre to the territorial vital logic control
system.
Four (4) Protocol Converters, one in each relay. The Protocol Converter is a Moxa
programmable network gateway device (Modbus TCP to Genysis protocols) that
provides a nonvital interface to the Signal System by receiving status indications
from and conveying commands from the ETS Control Centre to the territorial Vital
Logic Controller (VLC). Only the VLC interfaces with territorial wayside LRT
Addis Ababa Light Rail Transit Signaling System Design
35 Addis Ababa University, AAiT, Departement of ECE 2014
signaling equipment
A dual channel Ethernet fiber optic communication network. System servers, and
user workstations are connected in redundant fashion via the dual channel Ethernet
LAN.
UPS power for centralized servers, emergency backup server, communication
networks, station and Control Centre LAN‘s, FCUs, Protocol Converters, and the
LRT control stations.
Network Connections between facilities are via redundant Ethernet tributary
interfaces within SONET OC-3 ADMs in Station Communications Rooms and LRT
Signal Rooms. Tributaries must have a minimum of 6 X VT1.5 for bandwidth.
CTC Workstation Specifications
The workstations used for operation of the CTC system must be from the latest generation of
PC based equipment and software. The current generation of workstation equipment must
have the following minimum specifications [3]:
Intel Core 2 Duo Processor based workstation
3 GB RAM
High performance video board
200 GB Ultra SCSI hard drive
SCSI controller
Dual Network Interface Controllers
Windows XP Professional or the latest version compatible with the CTC client
software
CTC Server Specifications
The servers used for operation of the CTC system must be from the latest generation of PC
based equipment and software. The current generation of server equipment must have the
following minimum specifications [3]:
Intel Core 2 Duo Processor based workstation
8 GB RAM
1 TB SCSI hard drive
SCSI controller
Dual Network Interface Controllers
Windows Server 2008 or latest version compatible with the CTC server software
Addis Ababa Light Rail Transit Signaling System Design
36 Addis Ababa University, AAiT, Departement of ECE 2014
Field Code Units
The Field Code Units (FCU's) in the LRT CTC system are the Modicon 984-A 120 compact
PLC system. Redundant communications is established via the Optical Fiber Node
Multiplexers (SONET OC-3 ADMs) to the FCU using Moxa ModBus Serial to ModBus TCP
network conversion devices. For details on this equipment, refer to the ARINC user manual
for the PLC system. As the LRT system is expanded the Vital relay logic and FCU interface
will be phased out with the use of VLCs and gateway Protocol Converters or other compatible
systems approved by ETS.
Protocol Converters
The Protocol Converters currently utilized in the existing LRT CTC system to interface to
VLCs are the Moxa ModBus gateway M-Gate devices. These devices are configured in a
redundant pair for each VLC to CTC Interface. For details on this equipment, refer to the
Signal System Operations and Maintenance Manual for the CTC Interface. Gateway devices
must support real-time transmission of all required CTC indications and controls as well as
health status.
User Interface
The CTC User Interface must allow Controllers at the LRT Control Centre to:
Monitor all train movements on the system
Monitor train schedule adherence
Receive alarms from the LRT signal system
Observe wayside signal statuses
Observe track switch position, correspondence, and locking statuses
Observe grade crossing warning system statuses
Switch system control between the CTC system and the local control
panels in the relay rooms
Activate and de-activate automatic routing functions
Line or cancel routes
Throw track switches
Block and de-block track sections
Block and de-block wayside signals
Reset false occupancies on track circuits
Control Functions

Addis Ababa Light Rail Transit Signaling System Design
37 Addis Ababa University, AAiT, Departement of ECE 2014
The CTC control console will enable a control operator or technician located at the LRT
Control Centre to issue all operational commands accepted by the signal system, including:
Turn CTC on for a signaling territory
Turn CTC off for a signaling territory
Put the system in Automatic routing mode for a signaling territory
Put the system in Manual mode for a signaling territory
Line any available routes via entrance/exit selection
Cancel a route
Throw a switch to reverse
Throw a switch to normal
Clear a trailed switch (if available in that signaling territory)
Reset false occupancies on track circuits (if available in that signaling territory)
Block a track
De-block a track
Block a signal
De-block a signal
Acknowledge/reset an alarm
Monitoring Functions
The CTC control console must enable a control operator or technician located at the LRT
Control Centre to monitor field conditions of the signal system, including:
Communication status between CTC server and Signal Room control system (rotating
world for each Signal Room)
Occupancy on all track circuits
Route entrance selected
Route exit lined
Track switch normal position/correspondence for all track switches
Track switch reverse position/correspondence for all track switches
Track switch locking status for all track switches
Red aspect status for all block signals
Green aspect status for all block signals
Amber aspect status for all call-on signals
Green aspect status for all call-on signals
Blocked status for all block signals

Addis Ababa Light Rail Transit Signaling System Design
38 Addis Ababa University, AAiT, Departement of ECE 2014
Blocked status for all call-on signals
Blocked status for all track sections
CTC status (On or Off)
Routing status (Auto On or Off)
Alarm statuses (Loss of line power, Ground faults, Trailed switches. Burnt signal
filaments, Fiber network status)
Grade crossing warning system status for all grade crossings
Pedestrian crossing warning system status for all pedestrian crossings
Train Tracking
Train tracking functionality must be included in the CTC system to permit identification and
tracking of trains operating over the LRT including unscheduled trains, test cars, training cars,
work trains and maintenance equipment. The train tracking function includes the following
features:
Assigns, verifies, and modifies train ID's (6 digit alphanumeric characters)
Continually monitors the location and train ID of all trains and maintains correlation of
each track occupancy with the proper train ID and schedule
Reports train locations and train ID'S to the PA/VMS system which predicts the train
location to support the announcement of an imminent train arrival at a station
Displays the location of all trains, including train ID's, on control consoles and the
status board.
Updates the tracking database as new data is received.
Provides the Controller with the capability to correct problems in the locations and
identities of trains including assigning train ID's, changing train ID'S, moving train ID's
from one occupancy to another, deleting train ID'S, swapping train ID'S and entering
and changing train consists.
Provides a convenient initialization procedure to allow the Controller to establish the
train ID'S of all trains when the CTC system is initialized.
Schedule Adherence and Monitoring Functions
Schedule Adherence and Monitoring functionality must be included in the CTC system to
work with and interface to the PA/VMS system to permit schedule performance monitoring of
trains operating over the LRT as well as drive related automated visual and audible messaging
at the station platforms. The schedule adherence and monitoring function includes the

Addis Ababa Light Rail Transit Signaling System Design
39 Addis Ababa University, AAiT, Departement of ECE 2014
following features:
Report track occupancies and interlocking switch states in real-time required by the
PA/VMS system for the proper triggering of next train and estimated time of arrival
audible and visual train destination messages at passenger station platforms.
Report train ID sequences and changes there of required by the PA/VMS system for the
proper triggering of next train and estimated time of arrival audible and visual train
destination messages at passenger station platforms.
Receive PA/VMS health status messages and annunciate all alarm states.
Display Conventions
Alarms are sub-divided into categories that are defined by the priority and urgency. Alarm
categories must define what level of audible and visual indications are to be presented to the
system Controller. Alarms that are reported by the system are:
Red signal overruns
Non-commanded or unexpected changes of a train control system devices
Loss of an FCU
Application program errors
Data source communication errors
CTC system hardware or software errors
Detection of a Controllers attempt to log off before releasing control of the territory
Loss of normal power to a CTC system UI'S power unit
Field red signal filament open
Track switch failed
Track circuit reset fault
Ground fault on signal control circuit
Main control power off
Event Recorders
The CTC servers record the status of all wayside signal equipment and all control activities on
the CTC system. Administrators of the CTC system can retrieve all recorded data or play back
the event recorded in the system. Any proposed LRT extensions must be able to provide the
same information to the existing CTC system.
A data-logger must be installed in each relay room to prevent the loss of data between the relay
rooms to the CTC servers in the event of a communication line breakdown.
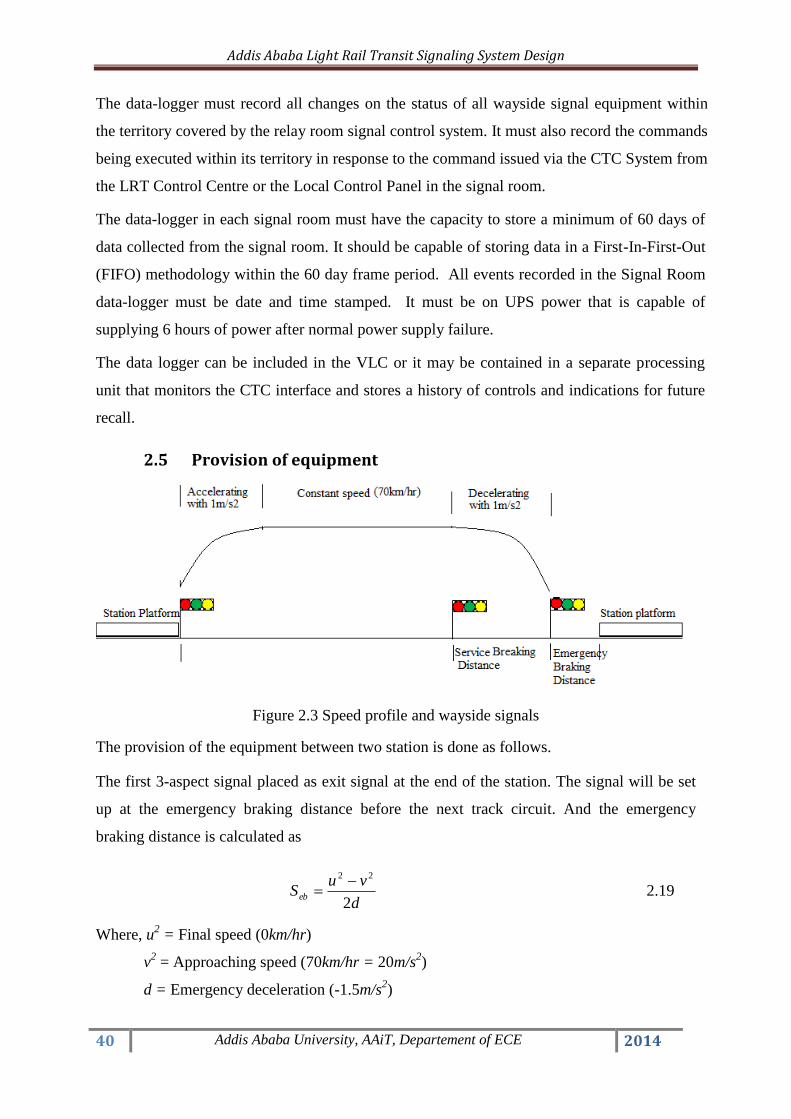
Addis Ababa Light Rail Transit Signaling System Design
40 Addis Ababa University, AAiT, Departement of ECE 2014
The data-logger must record all changes on the status of all wayside signal equipment within
the territory covered by the relay room signal control system. It must also record the commands
being executed within its territory in response to the command issued via the CTC System from
the LRT Control Centre or the Local Control Panel in the signal room.
The data-logger in each signal room must have the capacity to store a minimum of 60 days of
data collected from the signal room. It should be capable of storing data in a First-In-First-Out
(FIFO) methodology within the 60 day frame period. All events recorded in the Signal Room
data-logger must be date and time stamped. It must be on UPS power that is capable of
supplying 6 hours of power after normal power supply failure.
The data logger can be included in the VLC or it may be contained in a separate processing
unit that monitors the CTC interface and stores a history of controls and indications for future
recall.
2.5 Provision of equipment
Figure 2.3 Speed profile and wayside signals
The provision of the equipment between two station is done as follows.
The first 3-aspect signal placed as exit signal at the end of the station. The signal will be set
up at the emergency braking distance before the next track circuit. And the emergency
braking distance is calculated as
d
vuSeb
2
22 2.19
Where, u2 = Final speed (0km/hr)
v2 = Approaching speed (70km/hr = 20m/s
2)
d = Emergency deceleration (-1.5m/s2)

Addis Ababa Light Rail Transit Signaling System Design
41 Addis Ababa University, AAiT, Departement of ECE 2014
mSeb 133)5.1(2
200 22
The second 3-aspect signal will placed at any suitable point greater than service braking
distance before the third 3-aspect signal. All service braking distance to the station
calculations are shown in Appendix A and the result is available on Table 4.1 and Table 4.2.
The third 3-aspect signal is the home signal. It is placed at the distance of emergency braking
distance before the starting of the station.
All track circuits are starts emergency braking distance ahead of their through signals. If the
train will fail to stop at the Red (stop) signal, the emergency braking will prevent it from
getting in to the next track circuit.
Equipment provision between station EW2 and EW3 is shown below as example. The rest
between station equipment are shown in Appendix B.
Figure 2.4 Wayside equipment between stations EW3 and EW2
Service Breaking distance
Emergency Breaking distance

Addis Ababa Light Rail Transit Signaling System Design
42 Addis Ababa University, AAiT, Departement of ECE 2014
Chapter Three
3 Comparison of Existing and new signaling system
From the result obtained in Chapter 4, the comparison between two systems summarized as
follows.
Existing System New System
Station Dwell time 13sec 25sec 45sec
Average Speed 18km/hr 34.4km/hr 27.85km/hr
Operational
headway between
two trains
6min 2.962min 3.662min
The minimum line
headway capacity 45.1sec - 35.74sec
Time taken to
cover the total EW
line distance
60min 29.62min 36.62min
Table 3.1 Comparison between the existing and new system
In addition, from other studies the difference between using signaling systems and operate the
system without signaling systems based on the following parameters presented bellow.
3.1 Safety
All over the world Railway, transportation is increasingly used, because this mode of
transport is more energy efficient and environmentally friendly than road transportation.
Trains move on steel rail tracks and wheels of the railway vehicle are also flanged Steel
wheels. Hence, least friction occurs at the point of contact between the track & wheels.
Therefore, trains carry more loads resulting in higher traffic capacity since trains move on
specific tracks called rails, their path is to be fully guided and there is no arrangement of
steering. Clear of obstruction as available with road transportation, so there is a need to
provide control on the movement of trains in the form of Railway signals that indicate to the
drivers to stop or move and the speed at which they can pass a signal.
Since the load carried by the trains and the speed which the trains can attain are high, they
need more braking distance before coming to the stop from full speed. Without signal to be
Addis Ababa Light Rail Transit Signaling System Design
43 Addis Ababa University, AAiT, Departement of ECE 2014
available on the route to constantly guide the driver, accidents will take place due to
collisions.
Signaling systems have a direct impact on safety and quality of service. Any alteration or
evolution that is not carefully carried out has immediate consequences on the schedule for the
least, as well as on the passengers‘ integrity for the worst.
There are two purposes achieved by using railway signaling.
1. To safety receive and dispatch trains at a station.
2. To control the movements of trains from one station to another after ensuring that the track
on which this train will move to reach the next station is free from movement of another train
either in the same or opposite direction. This Control is called block working [18].
3.2 Operational efficiency
Railway signaling plays an important role in determining the capacity of a section [19]. The
capacity decides the number of trains that can run on a single day. From result 4.4 it can be
seen that by using 3-aspect signaling system the average speed increased from the previous
value 18km/hr [1] to 34.4km/hr. Increasing the speed of the train means increasing the line
capacity of the system. Thus, by using proper signaling, the capacity of AA LRT can
increased to a considerable extent without resorting to overpriced alternatives [19].
The simulation figures indicate that the line capacity can be increased by from 10% to 30%
after ETCS application in comparison with the existing line without ETCS [15]. Accordingly,
using any of the CTCS levels, such as CTCS level 0, can improve the line capacity and the
operational efficiency as well.
3.3 Cost
As far as reducing the cost of signaling systems and installations is being addressed, this may
lead to the statement that they are too expensive. It seems useful to understand why this
opinion is so largely widespread. First of all, signaling systems and installations must not be
considered only as a spending. Signaling Systems and Installations contribute significantly to
the reduction of the maintenance and operating costs [8].
The modern signaling systems or installations are without any doubt more expensive than in
the past. They are more complex. Their validation process is far more complicated and

Addis Ababa Light Rail Transit Signaling System Design
44 Addis Ababa University, AAiT, Departement of ECE 2014
formal. Their lifetime is shorter. But their performance in terms of functionalities RAMS and
flexibility is far ahead and has nothing to do with existing ones.
Nobody knew and perhaps up to now knows the exact development cost of existing signaling
systems and the exact construction cost of existing installations. The comparison with the
past is therefore quite subjective. Furthermore, there are unfortunately many examples of
projects, which did not respect their initial budget and this is well known and more or less
accepted. This point has a very negative effect on the perception of signaling field by top
management or financial decision-makers [8].
3.4 Energy consumption
The analysis of energy costs in relation to income has a weakness, given that the unit income
generated by each traffic unit (passenger-km) varies significantly according to each type of
traffic. In urban services (20 km/h) the energy consumption is approximately 30% more than
on intercity routes with average speeds of around 70 km/h [7]. Even though, the energy
consumption of the train increases, income per traffic unit rises sharply when the average
speed increases [7]. Even though this inducer (income per passenger-km) offers an example
of the passengers‘ willingness to pay for an increase in the average speed of the trains (even
if they had to pay more for an increase in energy consumption), it is true that from the
technical point of view, the amount of energy consumed per passenger-km seems more
important than energy costs as a percentage of total income.
3.5 Customers satisfaction
In the existing system the headway between two consecutive trains is 6min [1], which means
passengers should have wait for 6min in order to take the next train. But if the system uses 3-
apects signaling system the headway will decrease to 3.66min as calculated in result 4.4 and
the time in which the passengers will wait to take the next train decreased by 39%.
Not only that, but also the duration of time which takes to travel from one place to the other
decreased with significant amount. For example, to cover the total length of EW line, which
has 16.998km length, needs 1hr in existing system [1]. But with 3-aspects signaling system it
will reduce to 36.6min as calculated in result 4.4. Thus, the passengers can travel faster than
the existing system.
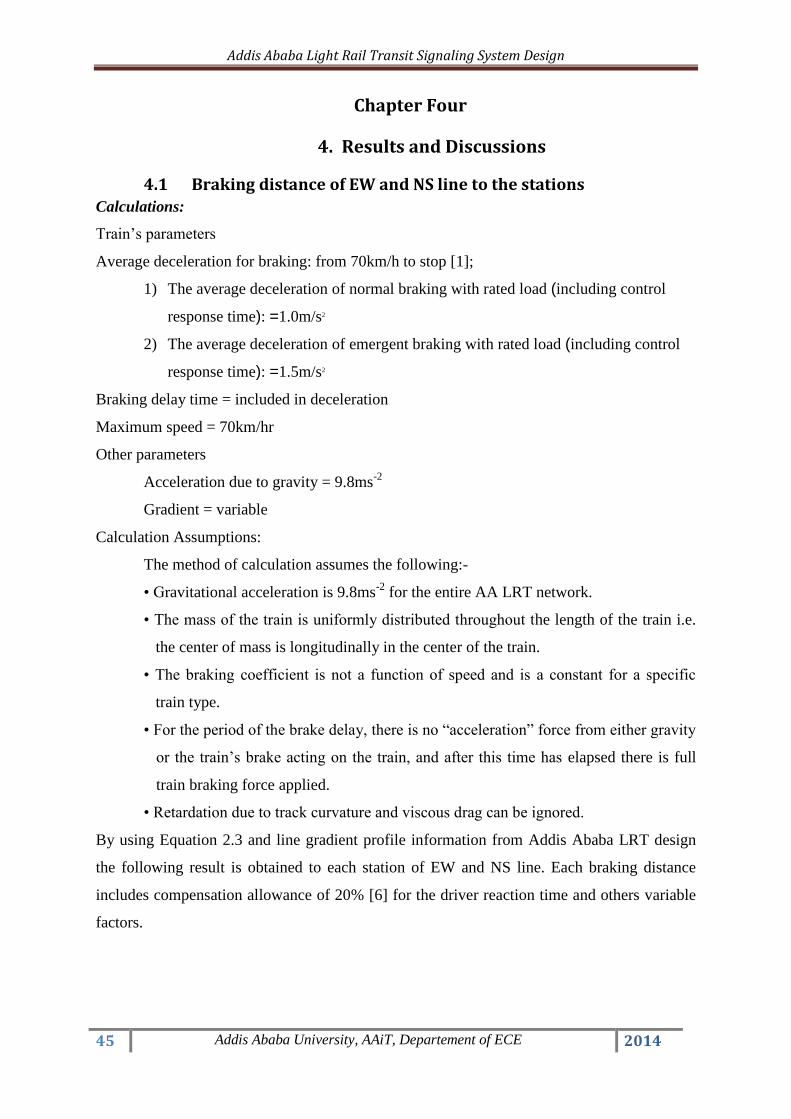
Addis Ababa Light Rail Transit Signaling System Design
45 Addis Ababa University, AAiT, Departement of ECE 2014
Chapter Four
4. Results and Discussions
4.1 Braking distance of EW and NS line to the stations
Calculations:
Train‘s parameters
Average deceleration for braking: from 70km/h to stop [1];
1) The average deceleration of normal braking with rated load (including control
response time): =1.0m/s2
2) The average deceleration of emergent braking with rated load (including control
response time): =1.5m/s2
Braking delay time = included in deceleration
Maximum speed = 70km/hr
Other parameters
Acceleration due to gravity = 9.8ms-2
Gradient = variable
Calculation Assumptions:
The method of calculation assumes the following:-
• Gravitational acceleration is 9.8ms-2
for the entire AA LRT network.
• The mass of the train is uniformly distributed throughout the length of the train i.e.
the center of mass is longitudinally in the center of the train.
• The braking coefficient is not a function of speed and is a constant for a specific
train type.
• For the period of the brake delay, there is no ―acceleration‖ force from either gravity
or the train‘s brake acting on the train, and after this time has elapsed there is full
train braking force applied.
• Retardation due to track curvature and viscous drag can be ignored.
By using Equation 2.3 and line gradient profile information from Addis Ababa LRT design
the following result is obtained to each station of EW and NS line. Each braking distance
includes compensation allowance of 20% [6] for the driver reaction time and others variable
factors.

Addis Ababa Light Rail Transit Signaling System Design
46 Addis Ababa University, AAiT, Departement of ECE 2014
East to West line-1 Breaking distances to the
stations in meters
West to East line-2 Breaking distances to the
stations in meters
To the station
With out
compensation
allowance
With
compensation
allowance To the station
With out
compensation
allowance
With
compensation
allowance
EW1 Starting Station 0 EW22 Starting Station 0
EW2 175.66 210.792 EW21 189 226.8
EW3 190.3 228.36 EW20 210.3 252.36
EW4 159.38 191.256 EW19 182.05 218.46
EW5 181.73 218.076 EW18 192.8 231.36
EW6 224.22 269.064 EW17 221.2 265.44
EW7 221 265.2 EW16 229 274.8
EW8 209.6 251.52 EW15 227.52 273.024
EW9 221.73 266.076 EW14 283.54 340.248
EW10 173.01 207.612 EW13 175.13 210.156
EW11 258.65 310.38 EW12 157.42 188.904
EW12 223.53 268.236 EW11 162.5 195
EW13 218.58 262.296 EW10 200.24 240.288
EW14 189.33 227.196 EW9 181.05 217.26
EW15 180 216 EW8 206.32 247.584
EW16 192 230.4 EW7 253.78 304.536
EW17 156.3 187.56 EW6 166.18 199.416
EW18 195.33 234.396 EW5 218.5 262.2
EW19 234.31 281.172 EW4 264.4 317.28
EW20 151.67 182.004 EW3 213.83 256.596
EW21 220.63 264.756 EW2 177.3 212.76
EW22 187.34 224.808 EW1 184.54 221.448
Table 4.1 Breaking distance to the stations of EW line
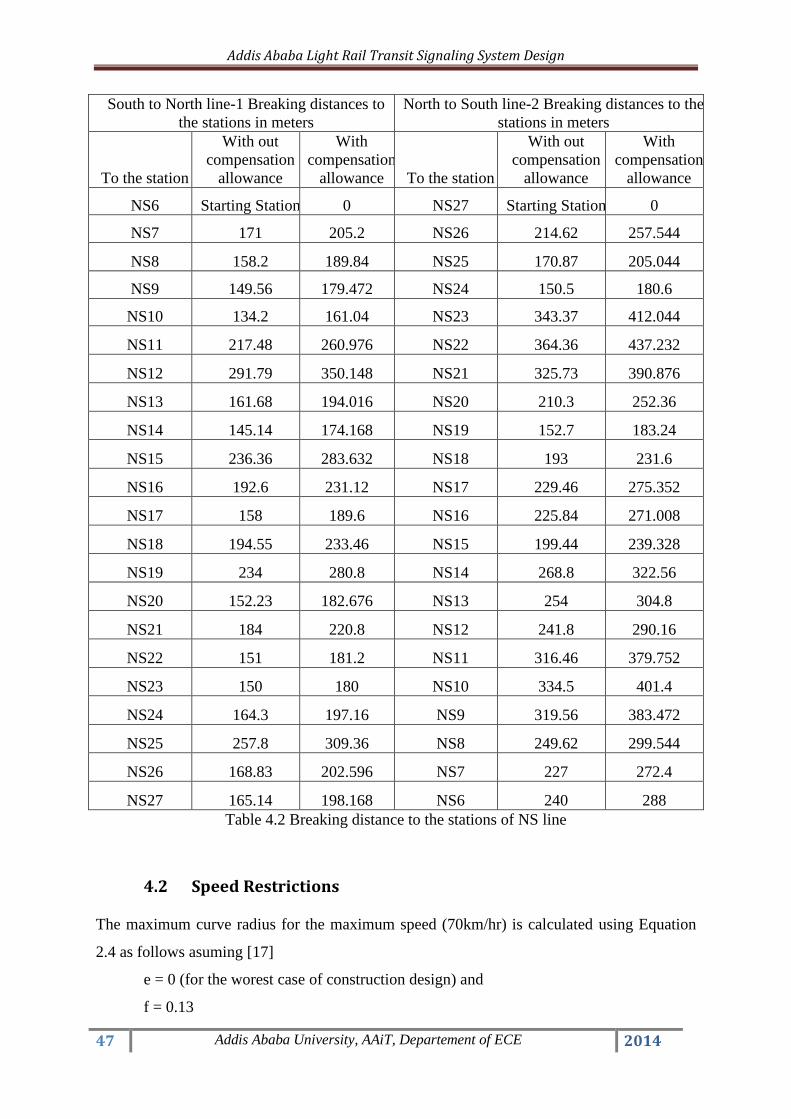
Addis Ababa Light Rail Transit Signaling System Design
47 Addis Ababa University, AAiT, Departement of ECE 2014
South to North line-1 Breaking distances to
the stations in meters
North to South line-2 Breaking distances to the
stations in meters
To the station
With out
compensation
allowance
With
compensation
allowance To the station
With out
compensation
allowance
With
compensation
allowance
NS6 Starting Station 0 NS27 Starting Station 0
NS7 171 205.2 NS26 214.62 257.544
NS8 158.2 189.84 NS25 170.87 205.044
NS9 149.56 179.472 NS24 150.5 180.6
NS10 134.2 161.04 NS23 343.37 412.044
NS11 217.48 260.976 NS22 364.36 437.232
NS12 291.79 350.148 NS21 325.73 390.876
NS13 161.68 194.016 NS20 210.3 252.36
NS14 145.14 174.168 NS19 152.7 183.24
NS15 236.36 283.632 NS18 193 231.6
NS16 192.6 231.12 NS17 229.46 275.352
NS17 158 189.6 NS16 225.84 271.008
NS18 194.55 233.46 NS15 199.44 239.328
NS19 234 280.8 NS14 268.8 322.56
NS20 152.23 182.676 NS13 254 304.8
NS21 184 220.8 NS12 241.8 290.16
NS22 151 181.2 NS11 316.46 379.752
NS23 150 180 NS10 334.5 401.4
NS24 164.3 197.16 NS9 319.56 383.472
NS25 257.8 309.36 NS8 249.62 299.544
NS26 168.83 202.596 NS7 227 272.4
NS27 165.14 198.168 NS6 240 288
Table 4.2 Breaking distance to the stations of NS line
4.2 Speed Restrictions
The maximum curve radius for the maximum speed (70km/hr) is calculated using Equation
2.4 as follows asuming [17]
e = 0 (for the worest case of construction design) and
f = 0.13
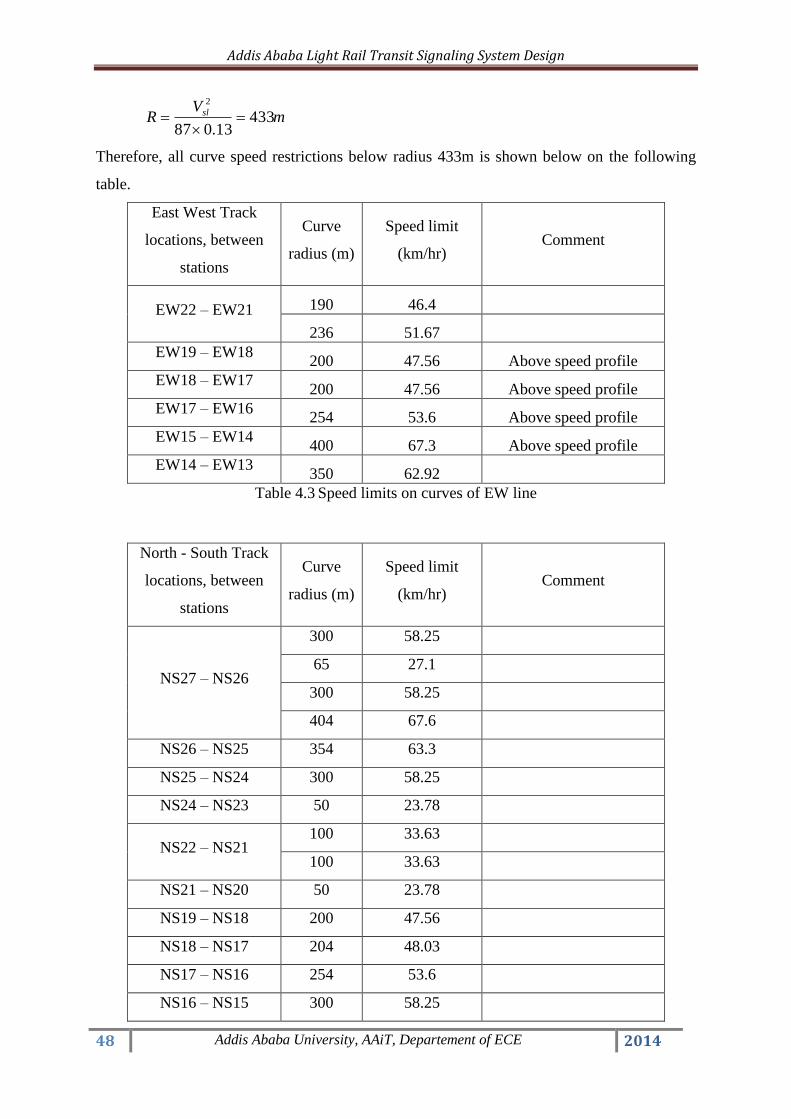
Addis Ababa Light Rail Transit Signaling System Design
48 Addis Ababa University, AAiT, Departement of ECE 2014
mV
R sl 43313.087
2
Therefore, all curve speed restrictions below radius 433m is shown below on the following
table.
East West Track
locations, between
stations
Curve
radius (m)
Speed limit
(km/hr) Comment
EW22 – EW21 190 46.4
236 51.67
EW19 – EW18 200 47.56 Above speed profile
EW18 – EW17 200 47.56 Above speed profile
EW17 – EW16 254 53.6 Above speed profile
EW15 – EW14 400 67.3 Above speed profile
EW14 – EW13 350 62.92
Table 4.3 Speed limits on curves of EW line
North - South Track
locations, between
stations
Curve
radius (m)
Speed limit
(km/hr) Comment
NS27 – NS26
300 58.25
65 27.1
300 58.25
404 67.6
NS26 – NS25 354 63.3
NS25 – NS24 300 58.25
NS24 – NS23 50 23.78
NS22 – NS21 100 33.63
100 33.63
NS21 – NS20 50 23.78
NS19 – NS18 200 47.56
NS18 – NS17 204 48.03
NS17 – NS16 254 53.6
NS16 – NS15 300 58.25

Addis Ababa Light Rail Transit Signaling System Design
49 Addis Ababa University, AAiT, Departement of ECE 2014
50 23.78
NS14 – NS13 286 56.87
350 62.92
NS13 – NS12 294 57.66
236 51.66
NS12 – NS11
200 47.56
350 62.92
350 62.92
300 28.25
NS11 – NS10 352 63.1
NS10 – NS9 375 65.12
NS8 – NS7 232 51.22
NS7 – NS6 146 40.64
146 40.64
Table 4.4 Speed limits on curves of NS line
4.3 Headway calculation
The following considerations are taken to calculate headway between two trains:
Train load effect on braking distance is ignored
Weather condition that affects the coefficient of friction between train wheel and track
is neglected.
In an open line sections wind effect is not considered.
On braking distance calculations deceleration from maximum speed to zero is taken
as constant but it changed as the initial acceleration, approximately linearly, then
approximately exponentially until it is zero.
Voltage fluctuations as the acceleration of a train is approximately proportional to the
power applied to the motors
By using Equation 2.18 and considering the above conditions the result of line headway with
different speed of the train is given below.
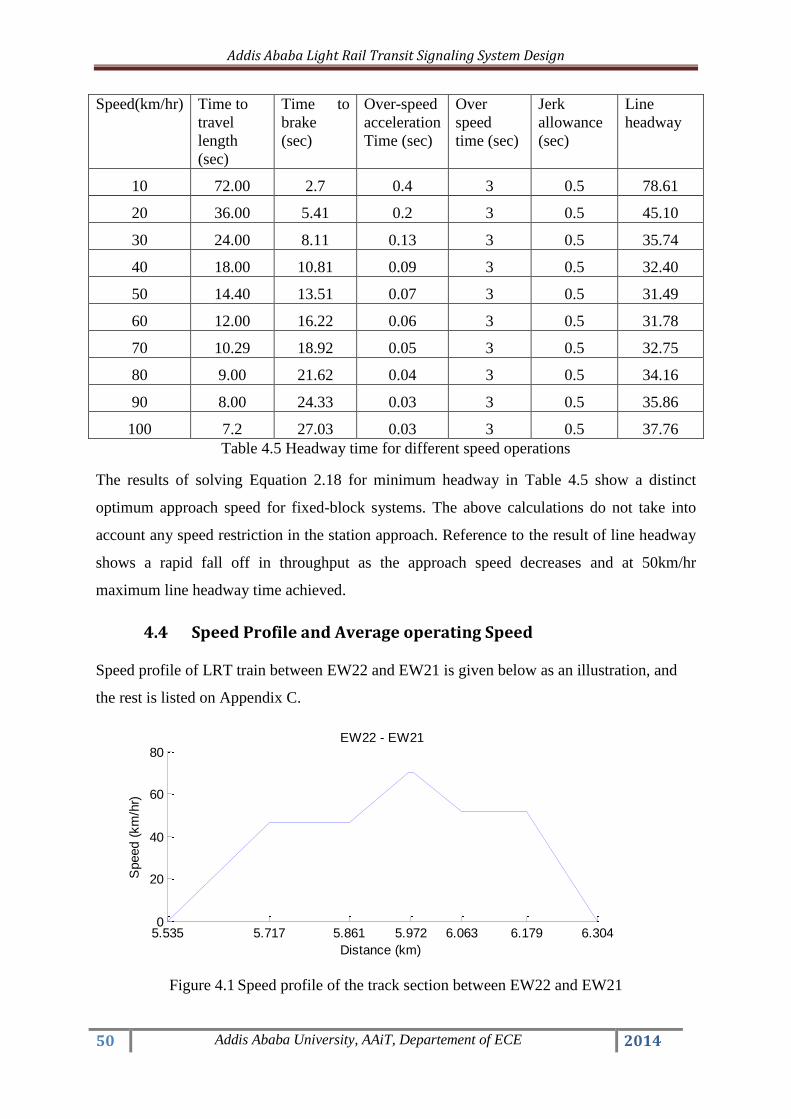
Addis Ababa Light Rail Transit Signaling System Design
50 Addis Ababa University, AAiT, Departement of ECE 2014
Speed(km/hr) Time to
travel
length
(sec)
Time to
brake
(sec)
Over-speed
acceleration
Time (sec)
Over
speed
time (sec)
Jerk
allowance
(sec)
Line
headway
10 72.00 2.7 0.4 3 0.5 78.61
20 36.00 5.41 0.2 3 0.5 45.10
30 24.00 8.11 0.13 3 0.5 35.74
40 18.00 10.81 0.09 3 0.5 32.40
50 14.40 13.51 0.07 3 0.5 31.49
60 12.00 16.22 0.06 3 0.5 31.78
70 10.29 18.92 0.05 3 0.5 32.75
80 9.00 21.62 0.04 3 0.5 34.16
90 8.00 24.33 0.03 3 0.5 35.86
100 7.2 27.03 0.03 3 0.5 37.76
Table 4.5 Headway time for different speed operations
The results of solving Equation 2.18 for minimum headway in Table 4.5 show a distinct
optimum approach speed for fixed-block systems. The above calculations do not take into
account any speed restriction in the station approach. Reference to the result of line headway
shows a rapid fall off in throughput as the approach speed decreases and at 50km/hr
maximum line headway time achieved.
4.4 Speed Profile and Average operating Speed
Speed profile of LRT train between EW22 and EW21 is given below as an illustration, and
the rest is listed on Appendix C.
Figure 4.1 Speed profile of the track section between EW22 and EW21
5.535 5.717 5.861 5.972 6.063 6.179 6.3040
20
40
60
80
Distance (km)
Speed (
km
/hr)
EW22 - EW21

Addis Ababa Light Rail Transit Signaling System Design
51 Addis Ababa University, AAiT, Departement of ECE 2014
The time taken between two positions considering track profile and speed limits is calculated
as follows.
Distance (km) Time(sec)
5.535 – 5.717 28.24
5.717 – 5.861 11.17
5.861 – 5.967 4.62
5.967 – 5.977 0.5
5.977 – 6.063 7.35
6.063 – 6.179 5.8
6.179 – 6.304 13.62
Station to Station 71.3
Dwell time 45
Total 116.3
Table 4.6 The time taken for the train from Station EW22 to EW21
Likewise all station to station time is calculated and the result is given below as follows
Station to Station distance Profile time duration + dwell
time
EW21 – EW20 60.22 + 45 = 105.22
EW20 – EW19 54.094 + 45 = 99.094
EW19 – EW18 55.4 + 45 = 100.4
EW18 – EW17 49.12 + 45 = 94.12
EW17 – EW16 40.97 + 45 = 85.97
EW16 – EW15 38.36 + 45 = 83.36
EW15 – EW14 40.75 + 45 = 85.75
EW14 – EW13 58.74 + 45 = 103.74
EW13 – EW12 67.09 + 45 = 112.09
EW12 – EW11 59.08 + 45 = 104.08
EW11 – EW10 58.92 + 45 = 103.92
EW10 – EW9 58.3 + 45 = 103.3
EW9 – EW8 66.57 + 45 = 111.57
EW8 – EW7 74.36 + 45 = 119.36
EW7 – EW6 62.2 + 45 = 107.2
EW6 – EW5 55.41 + 45 = 100.41
EW5 – EW4 64.09 + 45 = 109.09
EW4 – EW3 60.33 + 45 = 105.33
EW3 – EW2 73.54 + 45 = 118.54
EW2 – EW1 83.19 + 45 = 128.19
Table 4.7 Time taken for the train to travel between stations

Addis Ababa Light Rail Transit Signaling System Design
52 Addis Ababa University, AAiT, Departement of ECE 2014
Thus the total time taken by the train from station EW22 to station EW1 is 2197.04 seconds.
That is equal to 36.62 minutes.
Therefore, the average speed on this line can be stated as:
tot
totav
t
SV ;
Where, Vav = Average speed of the line
Stot = Total distance of the line
Ttot = Total time to travel the total distance
EW line has a total length of 16.998km and the total time taken to cover this distance is found
as 2197.04 sec.
Thus, the average speed of the line is
smm
Vav /77.7sec04.2197
16998 = 27.85 km/hr
For 25min dwell time, this result increased to
smm
Vav /57.9sec04.1777
16998 = 34.4km/hr
The peak hour operational headway between two consecutive trains will be calculated as
The number of trains on the line = 10 trains
The total time to cover the line distance = 36.62min (for 45sec dwell time)
= 29.62min (for 25sec dwell time)
Headway between trains = 36.62/10 = 3.662min (for 45sec dwell time)
= 29.62/10 = 2.962min (for 25sec dwell time)

Addis Ababa Light Rail Transit Signaling System Design
53 Addis Ababa University, AAiT, Departement of ECE 2014
Chapter Five
5. Conclusions and Recommendation
5.1 Conclusions
By implementing three aspects signaling system throughout Addis Ababa LRT system we
can get the following merits compared with the existing design
The minimum line headway capacity improved from 45.1 sec to 35.74 sec.
The average speed improved from 18km/hr to 27km/hr.
The peak hour headway between each 20 trains improved from 6min to 3.662min
based on preliminary design documents.
Each train took 36.62min x 2 = 73.24 min = 1hr and 13.24sec to complete one
cycle. If 20 trains share this duration, the time between two consecutive trains
becomes 73.24/20 = 3.662min. This result is much better than the existing
design whose headway time between trains is 6min.
If the dwell time of the station is taken as 25min, then the headway time
between the trains will be more improved to 2.97min.
Passengers from a given station in an hour
1hr/3.662min = 60min/3.662min = 16.38 = 16trains are available
Thus, in an hour 250 x 16 = 4000passengers will be served which higher than
the existing service given as 1hr/6min = 60min/6min = 10trains available and
250 x 10 = 2500 passengers will be served.
For 25min dwell time it is increased to 5000 passengers/hour

Addis Ababa Light Rail Transit Signaling System Design
54 Addis Ababa University, AAiT, Departement of ECE 2014
5.2 Recommendation
This thesis work is mainly considered speed profile of the operation and the other factors are
not included to get results.
The following areas are not covered in this thesis.
- To calculate speed profile the only constraint was gradient of the line, the other
factors such as wind drag force and other resistances are not considered.
- The impact of three aspects signaling system in central train control system and its
equipment compared with the existing signaling design.
- Reliability calculations such as MTBF (Mean Time Between Failures) of wayside
and onboard equipment.
- Cost analysis of the system due to installation, maintenance and operating costs
are not included.

Addis Ababa Light Rail Transit Signaling System Design
55 Addis Ababa University, AAiT, Departement of ECE 2014
Bibliography
[1] Z. Tao, D. Hong, L. Hongxu ―Addis Ababa E-W and N-S (Phase I) Light Rail
Transit Project Preliminary Design,‖ China Railway Group Limited, June 2013,
Vo1. 1, Chapter 15
[2] Y.K. Kim, Y.S. Song, S. Oh ―Study on the Plan of the KRTCS technology
development unrelated to Speed and Operational Environment,‖ Korea Railroad
Research Institute, pp. 218
[3] AECOM, ―LRT Design Guidelines for ETS Edmonton Transit System,” The City
of Edmonton, July 2011, pp. 7.1 - 7.31
[4] European Committee for Electro-technical Standardization, ―Railway application
– Communication, signaling and processing systems – Safety related electronic
systems for signaling (EN 50129),” European Standard, May 2010
[5] Dr. Alan F. Rumsey, ―What can signaling do to enhance rail operations?,‖ IRSE
International Technical Committee, September 20, 2009, p.p. 1-4
[6] David Barney, David Haley and George Nikandros; “Calculating Train Braking
Distance,” Signal and Operational Systems Queensland Rail, Queensland,
Australia
[7] Alberto Garcia, ―High speed, energy consumption and emissions,‖ International
Union of Railways , 21 December 2010, p.p. 15-18
[8] Christian Sevestre, ―Reduction in cost of signaling,‖ International Technical
Committee, p.p. 2-3
[9] “RTD Light Rail Design Criteria,” Regional transportation District, March 2013,
Chapter 8.
[10]“TRIMET Design Criteria Revision 10.0,” Tri-County Metropolitan
Transportation District of Oregon, Portland, Oregon, January 2010.
[11] “Utah Transit Authority Light Rail Design Criteria,” Utah Transit Authority,
Chapter 13, Signal System, November 2007
[12] B. Ning, “Advanced Train Control System,” WIT press publishes leading books
in Science and Technology, Southampton, 2010
[13] “ETCS System Description,” Railway Group Guidance Note, Issue One,
February 2010
[14] Sajed K. Abed, “European Rail Traffic Management System – An Overview,”
DeltaRail Group Limited, Iraq J. Electrical and Electronic Engineering, Vol. 6
No. 2, 2010
Addis Ababa Light Rail Transit Signaling System Design
56 Addis Ababa University, AAiT, Departement of ECE 2014
[15] W. Allison, G. Yarrow, “Engineering Standard Signals, Signaling Design
Principles,” NSW Transport Rail Corp. Version 1.32, Issued 7, June 2013
[16] “Railway Signal and Traffic Control Systems Standards,” Railway Association
of Canada, Revised June 4, 2007
[17] AUER, J.H., “Rail-Transit People-Mover Headway Comparison,” IEEE
Transactions on Vehicular Technology, Institute of Electrical and Electronics
Engineers, 1974
[18] “Automatic Train Control Technology,” Battele Columbus Laboratories in
support of the OTA study.
[19] T. Takashige, “Signaling Systems for Safe Railway Transport,” Railway
Technology Today 8
[20] “Principles of Train Working and Need for Signaling,” Handbook on basic
concepts of railway signaling.
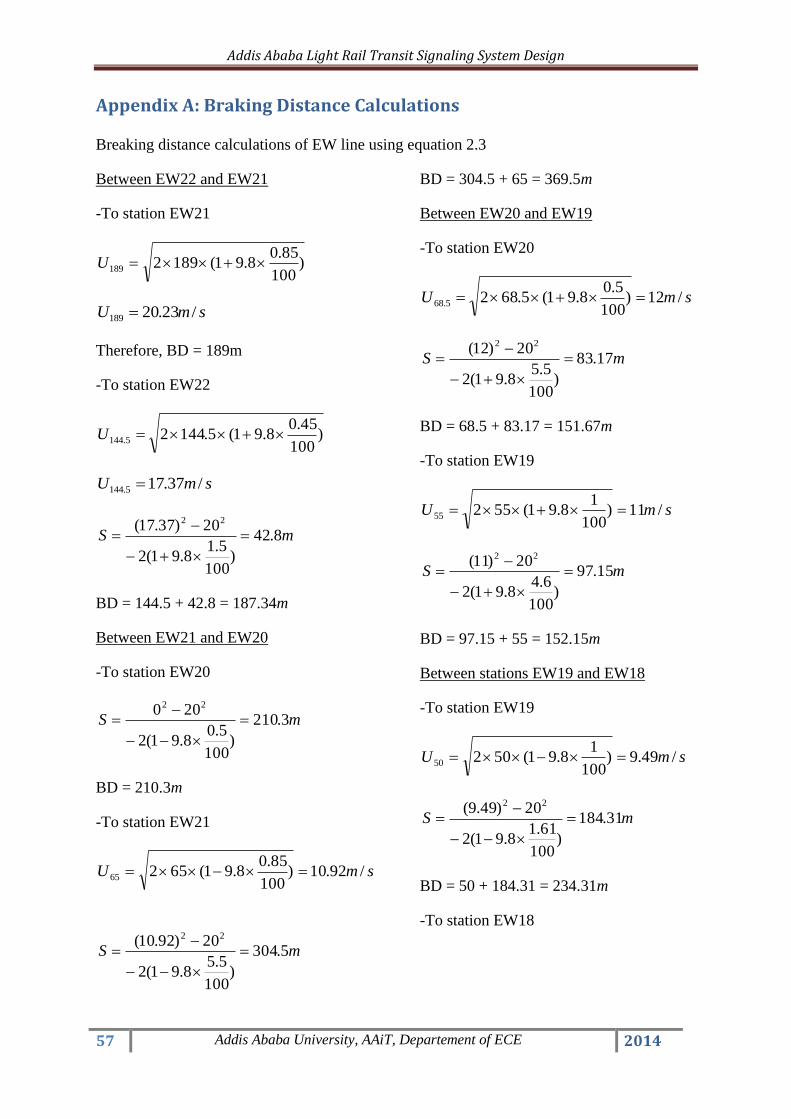
Addis Ababa Light Rail Transit Signaling System Design
57 Addis Ababa University, AAiT, Departement of ECE 2014
Appendix A: Braking Distance Calculations
Breaking distance calculations of EW line using equation 2.3
Between EW22 and EW21
-To station EW21
)100
85.08.91(1892189 U
smU /23.20189
Therefore, BD = 189m
-To station EW22
)100
45.08.91(5.14425.144 U
smU /37.175.144
mS 8.42
)100
5.18.91(2
20)37.17( 22
BD = 144.5 + 42.8 = 187.34m
Between EW21 and EW20
-To station EW20
mS 3.210
)100
5.08.91(2
200 22
BD = 210.3m
-To station EW21
smU /92.10)100
85.08.91(65265
mS 5.304
)100
5.58.91(2
20)92.10( 22
BD = 304.5 + 65 = 369.5m
Between EW20 and EW19
-To station EW20
smU /12)100
5.08.91(5.6825.68
mS 17.83
)100
5.58.91(2
20)12( 22
BD = 68.5 + 83.17 = 151.67m
-To station EW19
smU /11)100
18.91(55255
mS 15.97
)100
6.48.91(2
20)11( 22
BD = 97.15 + 55 = 152.15m
Between stations EW19 and EW18
-To station EW19
smU /49.9)100
18.91(50250
mS 31.184
)100
61.18.91(2
20)49.9( 22
BD = 50 + 184.31 = 234.31m
-To station EW18
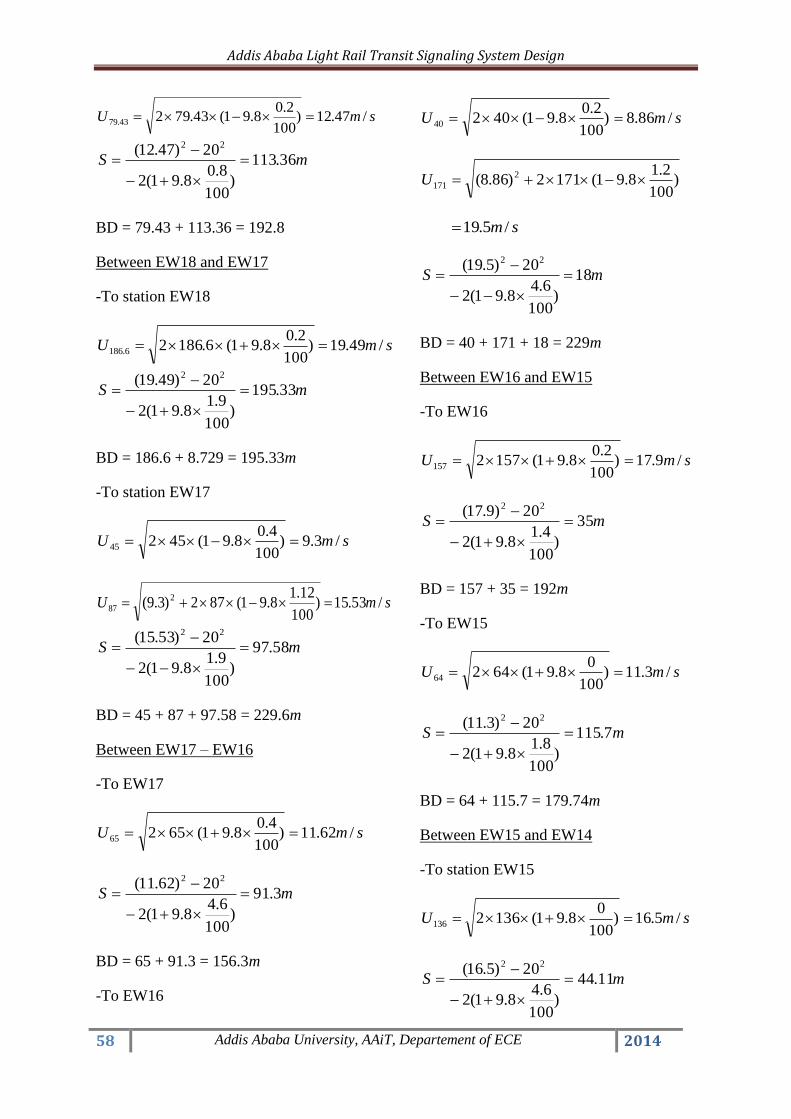
Addis Ababa Light Rail Transit Signaling System Design
58 Addis Ababa University, AAiT, Departement of ECE 2014
smU /47.12)100
2.08.91(43.79243.79
mS 36.113
)100
8.08.91(2
20)47.12( 22
BD = 79.43 + 113.36 = 192.8
Between EW18 and EW17
-To station EW18
smU /49.19)100
2.08.91(6.18626.186
mS 33.195
)100
9.18.91(2
20)49.19( 22
BD = 186.6 + 8.729 = 195.33m
-To station EW17
smU /3.9)100
4.08.91(45245
smU /53.15)100
12.18.91(872)3.9( 2
87
mS 58.97
)100
9.18.91(2
20)53.15( 22
BD = 45 + 87 + 97.58 = 229.6m
Between EW17 – EW16
-To EW17
smU /62.11)100
4.08.91(65265
mS 3.91
)100
6.48.91(2
20)62.11( 22
BD = 65 + 91.3 = 156.3m
-To EW16
smU /86.8)100
2.08.91(40240
)100
2.18.91(1712)86.8( 2
171 U
sm /5.19
mS 18
)100
6.48.91(2
20)5.19( 22
BD = 40 + 171 + 18 = 229m
Between EW16 and EW15
-To EW16
smU /9.17)100
2.08.91(1572157
mS 35
)100
4.18.91(2
20)9.17( 22
BD = 157 + 35 = 192m
-To EW15
smU /3.11)100
08.91(64264
mS 7.115
)100
8.18.91(2
20)3.11( 22
BD = 64 + 115.7 = 179.74m
Between EW15 and EW14
-To station EW15
smU /5.16)100
08.91(1362136
mS 11.44
)100
6.48.91(2
20)5.16( 22

Addis Ababa Light Rail Transit Signaling System Design
59 Addis Ababa University, AAiT, Departement of ECE 2014
BD = 136 + 44.11 = 180.11
-To station EW14
smU /14.14)100
18.91(91291
mS 54.192
)100
9.48.91(2
20)14.14( 22
BD = 91 + 192.54 = 283.54m
Between EW14 and EW13
-To EW14
smU /96.9)100
18.91(55255
mS 33.134
)100
22.18.91(2
20)96.9( 22
BD = 55 + 134.33 = 189.33m
-To EW13
smU /03.17)100
9.08.91(3.13323.133
mS 83.41
)100
2.38.91(2
20)03.17( 22
BD = 133.3 + 41.83 = 175.13m
Between EW13 and EW12
-To EW13
smU /95.18)100
9.08.91(8.19728.197
mS 78.20
)100
2.08.91(2
20)95.18( 22
BD = 197.8 + 20.78 = 218.58m
-To EW12
smU /6.9)100
18.91(42242
mS 42.115
)100
4.38.91(2
20)6.9( 22
BD = 42 + 115.42 = 157.42m
Between EW12 and EW11
-To EW12
smU /23.10)100
18.91(58258
mS 5.165
)100
1.18.91(2
20)23.10( 22
BD = 58 + 165.5 = 223.53m
-To EW11
smU /88.10)100
2.08.91(4.5624.56
mS 12.106
)100
34.38.91(2
20)88.10( 22
BD = 56.4 + 106.12 = 162.52
Between EW11and EW10
-To EW11
smU /5.10)100
2.08.91(25.56225.56
mS 39.202
)100
9.28.91(2
20)5.10( 22
BD = 56.25 + 202.39 = 258.65m
-To EW10

Addis Ababa Light Rail Transit Signaling System Design
60 Addis Ababa University, AAiT, Departement of ECE 2014
smU /6.8)100
7.08.91(40240
smU /67.17)100
4.08.91(1242)6.8( 2
124
mS 24.36
)100
15.28.91(2
20)67.17( 22
BD = 40 + 124 + 36.24 = 200.24m
Between EW10 and EW9
-To EW10
smU /84.10)100
7.08.91(55255
mS 1.118
)100
28.91(2
20)84.10( 22
BD = 55 + 118.1 = 173.01m
-To EW9
smU /07.12)100
18.91(3.6623.66
smU /5.18)100
6.18.91(852)07.12( 2
85
mS 75.29
)100
3.08.91(2
20)5.18( 22
BD = 66.3 + 85 + 29.75 = 181.05m
Between EW9 and EW8
-To EW9
smU /78.9)100
18.91(53253
smU /19.18)100
35.48.91(2052)78.9( 2
205
mS 51.37
)100
35.48.91(2
20)19.18( 22
BD = 53 + 205 + 37.51 = 295.51m
-To station EW8
smU /97.10)100
2.08.91(59259
)100
2.08.91(592)97.10( 2
63.95 U
= 17.34m/s
mS 69.51
)100
4.08.91(2
20)34.17( 22
BD = 51.69 + 95.63 + 59 = 206.32m
Between EW8 and EW7
-To EW8
smU /2.17)100
2.08.91(1512151
mS 62.58
)100
16.18.91(2
20)2.17( 22
BD = 151 + 58.62 = 209.62
-To EW7
smU /99.10)100
18.91(55255
)100
18.38.91(5.752)99.10( 2
5.75 U
sm /99.14

Addis Ababa Light Rail Transit Signaling System Design
61 Addis Ababa University, AAiT, Departement of ECE 2014
mS 28.123
)100
95.28.91(2
20)99.14( 22
BD = 55 + 75.5 + 123.28 = 253.78m
Between EW7 and EW6
-To EW7
smU /2.14)100
18.91(1122112
)100
7.18.91(902)2.14( 2
90 U
sm /7.18
mS 9.18
)100
38.38.91(2
20)7.18( 22
BD = 112 + 90 + 18.9 = 220.9m
-To EW6
smU /12.15)100
4.08.91(1102110
mS 18.56
)100
36.58.91(2
20)12.15( 22
BD = 110 + 56.18 = 166.18m
Between EW6 and EW5
-To EW6
smU /8.9)100
4.08.91(50250
)100
28.38.91(7.802)8.9( 2
7.80 U
sm /34.14
mS 52.93
)100
4.08.91(2
20)34.14( 22
BD = 50 + 80.7 + 93.52 = 224.22m
-To EW5
smU /5.9)100
18.91(50250
)100
18.91(752)5.9( 2
75 U
sm /34.14
mS 5.93
)100
4.08.91(2
20)34.14( 22
BD = 50 + 75 + 93.5 = 218.5m
Between EW5 and EW4
-To EW5
smU /05.10)100
18.91(46246
)100
7.08.91(602)05.10( 2
60 U
sm /14.15
mS 73.75
)100
3.18.91(2
20)14.15( 22
BD = 46 + 60 + 75.73 = 181.73m
-To EW4
smU /49.8)100
18.91(40240
mS 4.224
)100
75.28.91(2
20)49.8( 22
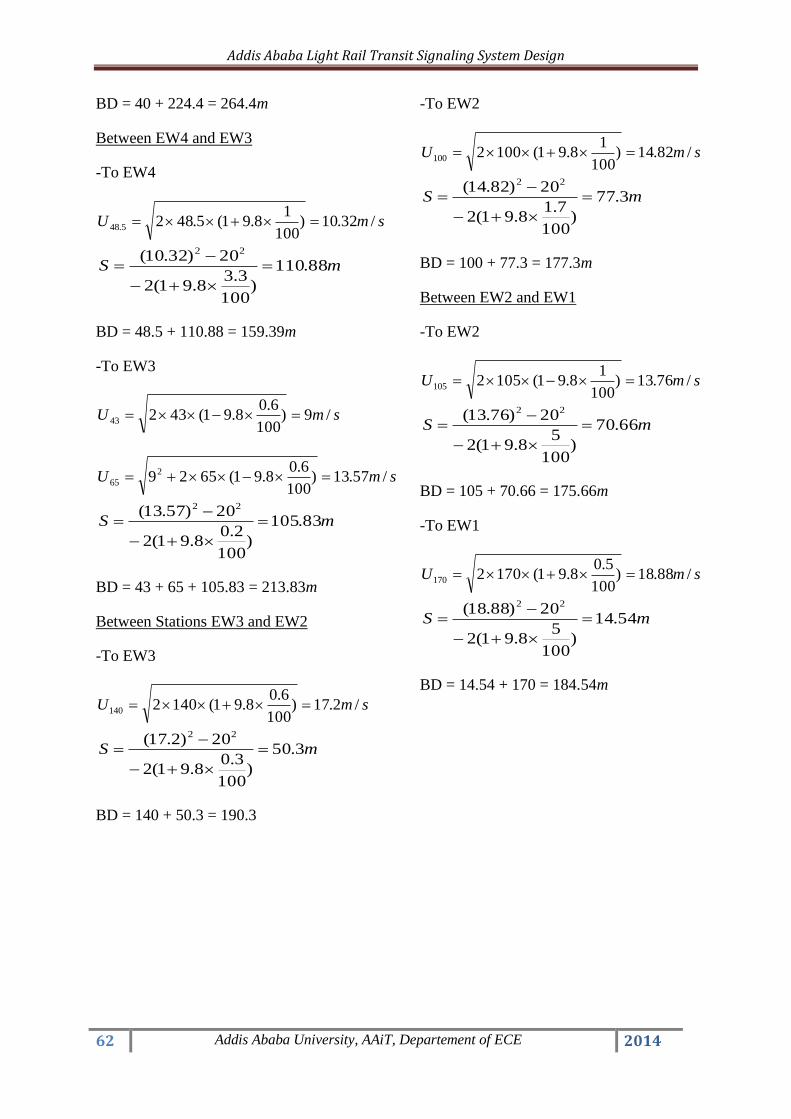
Addis Ababa Light Rail Transit Signaling System Design
62 Addis Ababa University, AAiT, Departement of ECE 2014
BD = 40 + 224.4 = 264.4m
Between EW4 and EW3
-To EW4
smU /32.10)100
18.91(5.4825.48
mS 88.110
)100
3.38.91(2
20)32.10( 22
BD = 48.5 + 110.88 = 159.39m
-To EW3
smU /9)100
6.08.91(43243
smU /57.13)100
6.08.91(65292
65
mS 83.105
)100
2.08.91(2
20)57.13( 22
BD = 43 + 65 + 105.83 = 213.83m
Between Stations EW3 and EW2
-To EW3
smU /2.17)100
6.08.91(1402140
mS 3.50
)100
3.08.91(2
20)2.17( 22
BD = 140 + 50.3 = 190.3
-To EW2
smU /82.14)100
18.91(1002100
mS 3.77
)100
7.18.91(2
20)82.14( 22
BD = 100 + 77.3 = 177.3m
Between EW2 and EW1
-To EW2
smU /76.13)100
18.91(1052105
mS 66.70
)100
58.91(2
20)76.13( 22
BD = 105 + 70.66 = 175.66m
-To EW1
smU /88.18)100
5.08.91(1702170
mS 54.14
)100
58.91(2
20)88.18( 22
BD = 14.54 + 170 = 184.54m

Addis Ababa Light Rail Transit Signaling System Design
63 Addis Ababa University, AAiT, Departement of ECE 2014
Appendix B: provisions of equipment

Addis Ababa Light Rail Transit Signaling System Design
64 Addis Ababa University, AAiT, Departement of ECE 2014

Addis Ababa Light Rail Transit Signaling System Design
65 Addis Ababa University, AAiT, Departement of ECE 2014

Addis Ababa Light Rail Transit Signaling System Design
66 Addis Ababa University, AAiT, Departement of ECE 2014
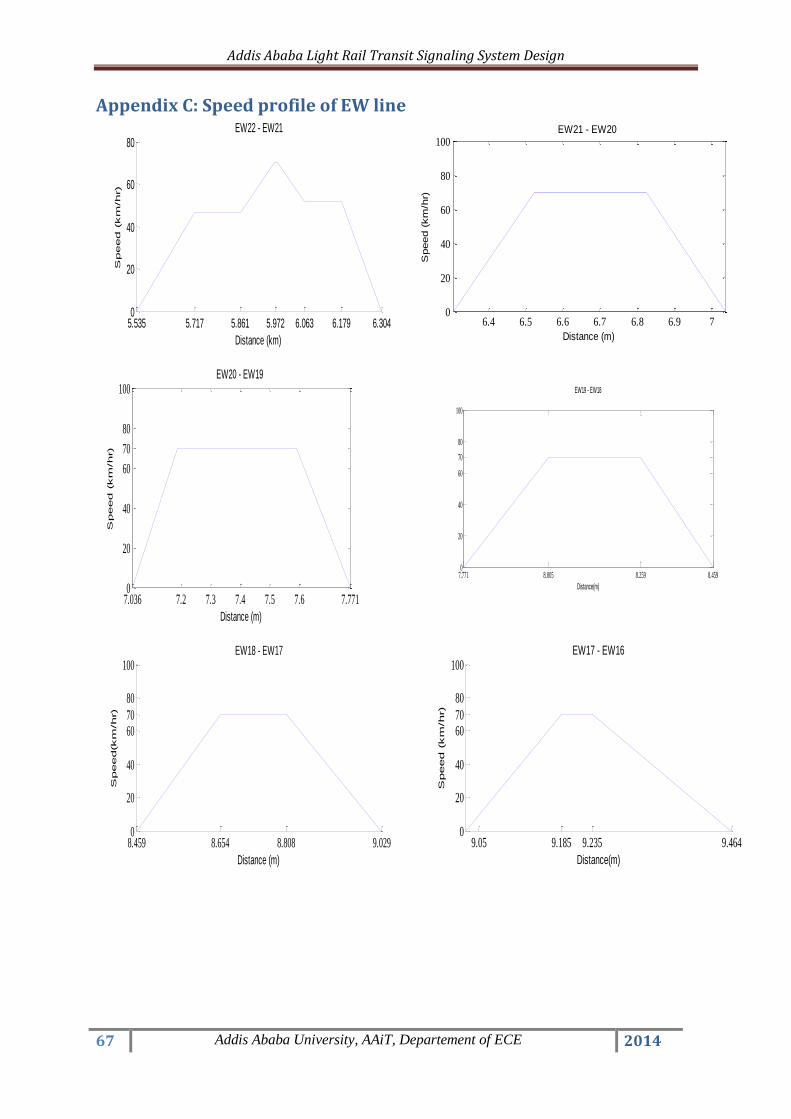
Addis Ababa Light Rail Transit Signaling System Design
67 Addis Ababa University, AAiT, Departement of ECE 2014
Appendix C: Speed profile of EW line
5.535 5.717 5.861 5.972 6.063 6.179 6.3040
20
40
60
80
Distance (km)
Speed (km
/hr)
EW22 - EW21
7.036 7.2 7.3 7.4 7.5 7.6 7.7710
20
40
60
70
80
100
Distance (m)
Speed (km
/hr)
EW20 - EW19
8.459 8.654 8.808 9.0290
20
40
6070
80
100
Distance (m)
Speed(km
/hr)
EW18 - EW17
6.4 6.5 6.6 6.7 6.8 6.9 70
20
40
60
80
100
Distance (m)
Speed (
km
/hr)
EW21 - EW20
7.771 8.005 8.259 8.4590
20
40
60
70
80
100
Distance(m)
EW19 - EW18
9.05 9.185 9.235 9.4640
20
40
6070
80
100
Distance(m)
Speed (km
/hr)
EW17 - EW16
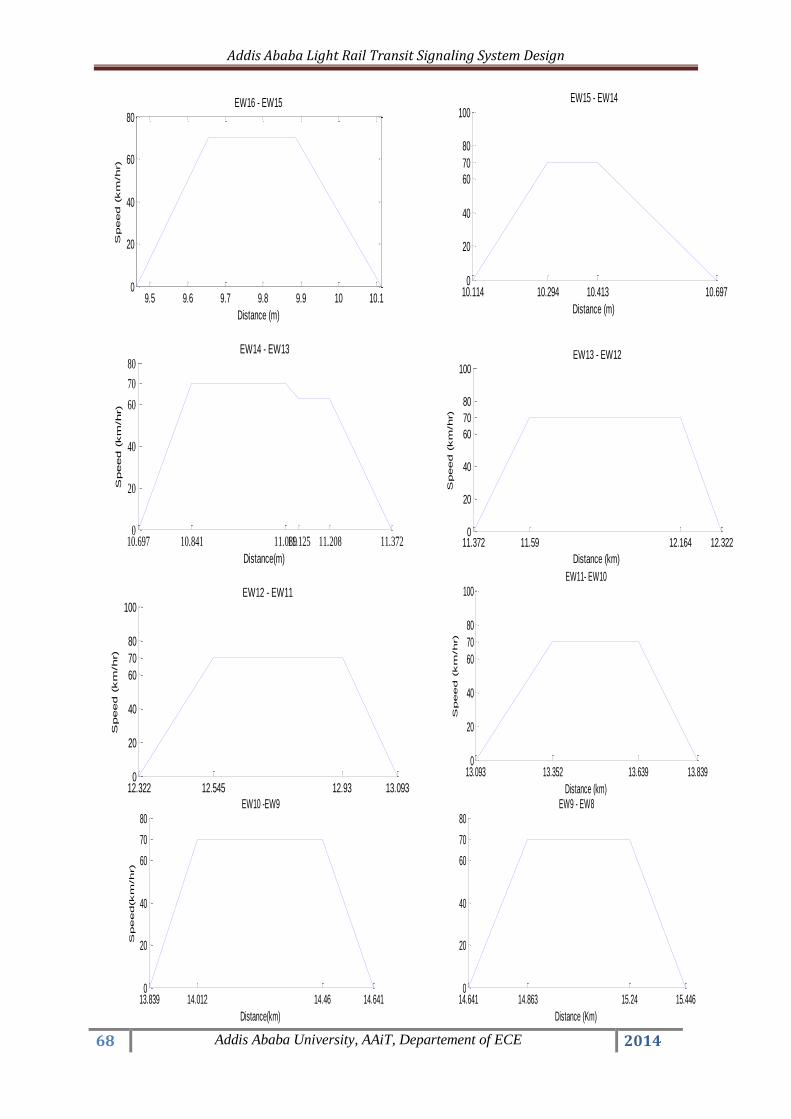
Addis Ababa Light Rail Transit Signaling System Design
68 Addis Ababa University, AAiT, Departement of ECE 2014
9.5 9.6 9.7 9.8 9.9 10 10.10
20
40
60
80
Distance (m)
Speed (km
/hr)
EW16 - EW15
10.697 10.841 11.08911.125 11.208 11.3720
20
40
60
70
80
Distance(m)
Speed (km
/hr)
EW14 - EW13
12.322 12.545 12.93 13.0930
20
40
60
70
80
100
Distance (Km)
Speed (km
/hr)
EW12 - EW11
10.114 10.294 10.413 10.6970
20
40
60
70
80
100
Distance (m)
EW15 - EW14
11.372 11.59 12.164 12.3220
20
40
60
70
80
100
Distance (km)
Speed (km
/hr)
EW13 - EW12
13.093 13.352 13.639 13.8390
20
40
60
70
80
100
Distance (km)
Speed (km
/hr)
EW11- EW10
13.839 14.012 14.46 14.6410
20
40
60
70
80
Distance(km)
Speed(km
/hr)
EW10 -EW9
14.641 14.863 15.24 15.4460
20
40
60
70
80
Distance (Km)
EW9 - EW8
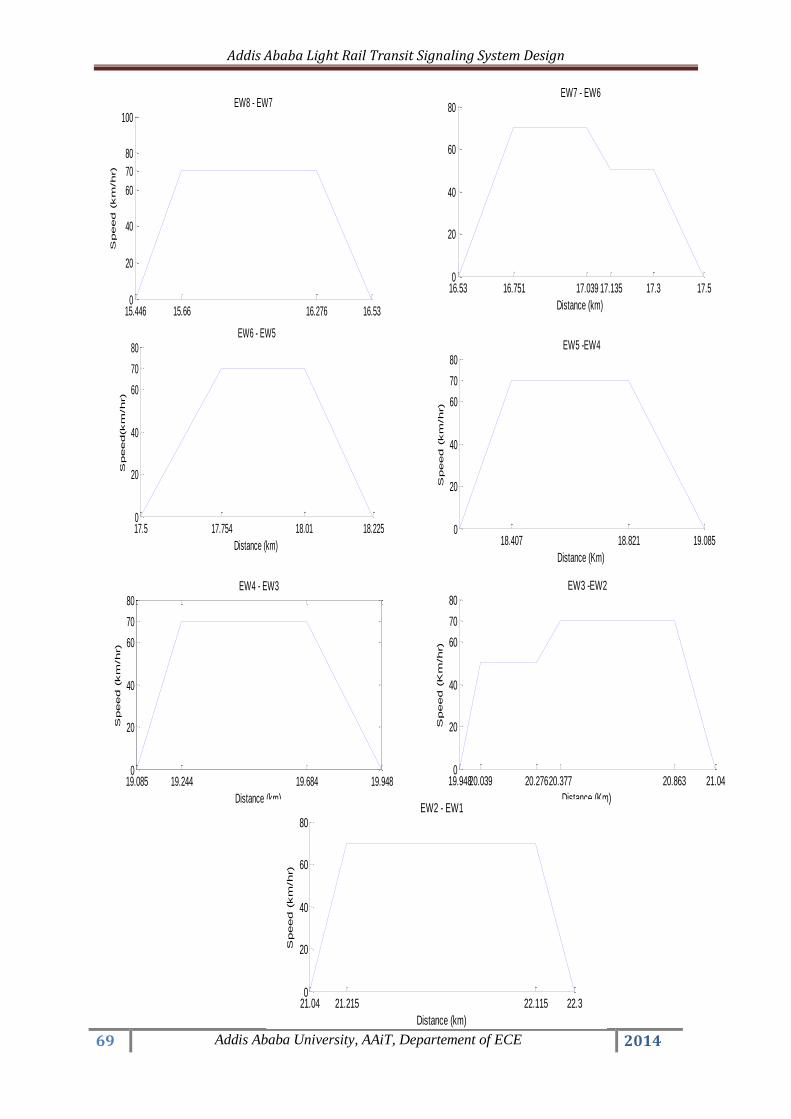
Addis Ababa Light Rail Transit Signaling System Design
69 Addis Ababa University, AAiT, Departement of ECE 2014
15.446 15.66 16.276 16.530
20
40
60
70
80
100S
peed (km
/hr)
EW8 - EW7
19.085 19.244 19.684 19.9480
20
40
60
70
80
Distance (km)
Speed (km
/hr)
EW4 - EW3
16.53 16.751 17.039 17.135 17.3 17.50
20
40
60
80
Distance (km)
EW7 - EW6
18.407 18.821 19.0850
20
40
60
70
80
Distance (Km)
Speed (km
/hr)
EW5 -EW4
19.94820.039 20.27620.377 20.863 21.040
20
40
60
70
80
Distance (Km)
Speed (K
m/hr)
EW3 -EW2
17.5 17.754 18.01 18.2250
20
40
60
70
80
Distance (km)
Speed(km
/hr)
EW6 - EW5
21.04 21.215 22.115 22.30
20
40
60
80
Distance (km)
Speed (km
/hr)
EW2 - EW1