Adding Clinical Data to Statewide Administrative … · Adding Clinical Data to Statewide...
34
Adding Clinical Data to Statewide Administrative Data AHRQ Contract #07-10042 Final Report Submitted to the Agency for Healthcare Research and Quality March 2010
Transcript of Adding Clinical Data to Statewide Administrative … · Adding Clinical Data to Statewide...

Adding Clinical Data to Statewide Administrative Data
AHRQ Contract #07-10042
Final Report
Submitted to the
Agency for Healthcare Research and Quality
March 2010

Executive Summary
This final report of the “Adding Clinical Data to Statewide Administrative Data Pilot Project” details the processes of recruiting hospitals for the project, extracting laboratory data and normalizing the laboratory terminology into the Logical Observation Identifiers Names and Codes (LOINC) standard, submitting the data, linking the clinical and administrative datasets and assessing the added value of using clinical data to better predict complications leading to mortality in the hospitals.
The Agency for Health Care Administration (AHCA), Florida Center for Health Information and Policy Analysis, was awarded a contract from the Agency for Healthcare Research and Quality (AHRQ) that ran from October 2007 through December 2009 for a pilot project to assess the resources required to standardize laboratory data and to study how to use the clinical laboratory data to better predict complications leading to mortality. The AHRQ pilot project’s goals were to demonstrate and evaluate the process required to
1) standardize laboratory data into a common LOINC nomenclature;
2) merge clinical data with hospital administrative data containing a Present on Admission indicator;
3) complete a statistical analysis of the merged dataset;
4) assess the added value of using clinical data to develop better predictors for complications leading to mortality; and
5) describe all findings in a Final Report to report on the resource requirements of standardizing laboratory results into LOINC, joining clinical and administrative datasets and conducting the appropriate analytical design on the resulting dataset to better predict complications.
The Agency recruited a total of twenty two hospitals and developed a Data Sharing Agreement with the participating hospitals to support acquisition of clinical data for linkage to existing Agency information.
The Agency worked with 3M Health Information Systems, Inc. and the participating hospitals to map their laboratory values to standardized LOINC terminology and to evaluate the extent to which the 3M HIS risk-adjustment model can be made more accurate with the availability of the clinical data.
The hospitals sent their laboratory data catalogues to 3M Terminology Consulting Services (TCS) to initiate the LOINC mapping. The data collected for the pilot project consisted of specific clinical laboratory data elements and a set of demographic indicators that were used to link the clinical data with the administrative data. 3M TCS worked with each hospital and provided technical assistance to each hospital’s quality and technical staff to standardize its laboratory data terminology and values and to verify accuracy of the final normalized map of laboratory values. 3M TCS validated the correct standardization of laboratory values to LOINC through an iterative process with each hospital.
The hospitals extracted three quarters of laboratory and blood culture data, based on admissions from April 1, 2007 to December 31, 2007 for all patients and for all laboratory tests conducted. They then applied the LOINC mapping to convert their unique laboratory values to LOINC standardized values and terminology. After conducting quality assurance to ensure that the data mapping was correct, they uploaded the standardized laboratory dataset as text files using Tab Separated Values to a secure File Transfer Protocol (FTP) site at AHCA.
The Agency loaded the demographic, blood culture, and clinical lab data received from hospitals and the existing administrative inpatient data onto a secure network server. The

Adding Clinical Data to Statewide Administrative Data Final Report Page ii
clinical and administrative datasets were validated; de-identified and all confidential data fields were deleted from the administrative files. The AHCA project team performed a quality assurance check by matching the records using inpatient ID’s and then with the newly created ID and compared the results of the matches. The Agency uploaded the files to 3M HIS using their secure FTP site.
3M HIS applied data screening criteria to create a linked administrative and clinical laboratory test analysis dataset. Utilizing the Present on Admission indicator for each diagnosis code, 3M HIS assigned both an admission and discharge APR DRG and risk of mortality subclass to each patient. 3M HIS next created test result ranges for each of the laboratory tests that could be evaluated for their ability to improve the APR DRG prediction of mortality. Using research literature and clinical input, 3M HIS identified meaningful results outside normal ranges of laboratory tests and then used statistical tests to identify the subset of clinical laboratory test result specifications that improved the performance of APR DRGs for predicting inpatient mortality. The final step in the analysis was to assess the overall incremental improvement due to the addition of the clinical laboratory test results on the accuracy of the risk adjustment models for predicting inpatient mortality.
The results of the analysis demonstrated that adding selected clinical laboratory data elements to administrative data can improve the accuracy of the risk adjustment models for predicting hospital mortality rates. This preliminary study identified laboratory tests that are relevant for the APR DRG risk of morality prediction, and therefore should constitute the minimum scope of laboratory test results that are included in any mandated collection of selected laboratory test results. The laboratory test results that were found to contribute to increased predictive power were consistent with clinical expectations and constitute a relatively small number of laboratory test results indicative of acute disease. The addition of eleven clinical laboratory test results to the assignment of the admission APR DRG risk of mortality increased the c-statistic and R2 by 0.574 percent and 4.53 percent, respectively. This finding demonstrates that the use of the Present on Admission indicator along with the incorporation of selected clinical data elements such as laboratory test results can lead to better assessments of risk of mortality at admission.
3M HIS developed mortality reports based on the admission APR DRG and the model adjusted with clinical laboratory data specific to each hospital. 3M HIS provided a summary of the project results and the hospital mortality reports to the participating hospitals. 3M HIS also submitted a final report of the findings to AHCA.
The findings of this pilot project demonstrate that clinical data, when combined with the Present on Admission indicator and administrative inpatient data, can be used to improved the risk adjustments models to better predict the risk of patient mortality.

Adding Clinical Data to Statewide Administrative Data Final Report Page iii
Table of Contents
Executive Summary .................................................................................................................... i
Table of Contents ....................................................................................................................... iii
Project Overview ........................................................................................................................ 1
The Agency’s Project Team Members and Subcontractors .................................................... 2
Key Stakeholders and Their Roles ......................................................................................... 3
Project Planning ......................................................................................................................... 4
Materials Prepared Prior to Contacting Hospitals for Participation .......................................... 4
Selection of Laboratory Data Elements Chosen to Add to Administrative Dataset .................. 5
Project Initiation and Implementation ......................................................................................... 5
Administrative Hurdles Encountered ....................................................................................... 5
Hospital Recruitment .............................................................................................................. 6
Products and Materials Developed ......................................................................................... 8
General Description of Participating Hospitals ........................................................................ 8
Incentives and Information Offered to Participating Hospitals ................................................. 8
Communication Tools ............................................................................................................. 9
Changes Made During the Initiation Phase of Hospital Outreach.......................................... 10
Project Implementation ............................................................................................................ 10
Hospital Resources Utilized During Participation in This Project ........................................... 11
LOINC Mapping ....................................................................................................................... 12
LOINC Mapping Process ...................................................................................................... 14
Issues Encountered in Standardizing Data Elements ........................................................... 16
3M Terminology Consulting Services LOINC Mapping Summary Notes ............................... 17
Process Steps Needed to Perform the Data Requirements of this Project ............................ 17
Problems Encountered and Resolved .................................................................................. 18
Data Transmission ................................................................................................................... 21
Adding Clinical Data to Statewide Administrative Data Final Report Page iv
3M Health Information Systems - Data Analysis Summary....................................................... 22
Step 1: Identify the Subset of Candidate Clinical Laboratory Tests to be Evaluated ............. 22
Step 2: Create a Database that Includes both Administrative and Clinical Laboratory Data .. 23
Step 3: Create Standardized Test Result Ranges for Each Clinical Laboratory Test ............ 23
Step 4: Identify the Subset of Clinical Laboratory Test Results that Improve the Performance of APR DRGs for Predicting Inpatient Mortality ..................................................................... 24
Step 5: Assess the Overall Incremental Improvement Due to the Addition of the Clinical Laboratory Test Results on the Performance of APR DRGs for Predicting Inpatient Mortality ............................................................................................................................................. 24
3M Health Information Systems - Results Summary ................................................................ 25
Discussion ............................................................................................................................... 26
Lessons Learned ..................................................................................................................... 26
Key Characteristics that Led to a Successful Participation. ...................................................... 27
Appendices .............................................................................................................................. 29

Project Overview
The Agency for Health Care Administration (AHCA), Florida Center for Health Information and Policy Analysis, was awarded a two year contract from the Agency for Healthcare Research and Quality (AHRQ) for a pilot project to study advanced methods of predicting hospital complications. The project involved standardizing laboratory values using Logical Observation Identifiers Names and Codes (LOINC) terminology joined to Present on Admission indicators and hospital administrative data collected by the Agency to better assess the added value of these combined indicators for analyzing hospital quality measures. The project ran from October 2007 through December 2009.
By adding clinical data to administrative data, the project team expected to fulfill the AHRQ pilot project’s goals to demonstrate and evaluate the processes required to:
1. Standardize laboratory data into a common nomenclature based on the Logical Observation Identifiers Names and Codes (LOINC);
2. Merge the standardized clinical laboratory data with the hospital administrative data collected by the Agency;
3. Use the Present on Admission (POA) indicator in the AHCA administrative dataset to risk-adjust patient records for better predictability of potential complications; and
4. Complete a statistical analysis of the merged dataset to test the improvement in predicting potential complications by adding the POA indicator and the clinical laboratory data to the administrative data.
Figure 1: Project Diagram
The Agency is authorized by statute to collect administrative data from every hospital in Florida. The Present on Admission (POA) indicator was added to the administrative dataset in 2007. Consequently, the Agency was ready to undertake the data collection and oversee the research part of the project,

Adding Clinical Data to Statewide Administrative Data Final Report Page 2
The Agency’s Project Team Members and Subcontractors
The Agency’s project team came from the Office of Health Information Exchange in the Florida Center for Health Information and Policy Analysis, directed by Christine Nye. The team consisted of a project director, project coordinator, project accountant and a project laboratory subject matter expert. Table 1 lists the names and the responsibilities of the Agency’s team involved in this pilot project.
Table 1: Florida Agency’s Team Members and their Responsibilities
AHCA Team Members Functional Area of Responsibility
Christopher Sullivan, Ph.D. Project Director
Bahia Diefenbach, Ph.D. Project Coordinator
Brenda Phinney Project Accountant
Nancy Carvallo Project Laboratory Subject Matter Expert
A total of twenty two hospitals took part in the pilot study. These participating hospitals included Broward Health, Memorial Healthcare System, BayCare Health System and two independent pediatric hospitals: Miami Children’s Hospital and All Children’s Hospital. The main team members of the participating hospital systems and hospitals are listed in Table 2.
Table 2: Participating Hospitals’ Team Members and their Responsibilities
Team Members in Participating Hospitals Functional Area of Responsibility
Broward Health
Lisa K. Rawlins Director of Quality and Performance Improvement
Peter Barnick Systems Analyst
Doris Crain VP/Chief Information Officer
Yvette Herrera Clinical Systems Integration Manager
Tony Ruiz Director/Project Management Office Information Systems
Connie Thornton Coordinator – Quality and Performance Improvement
Memorial Healthcare System
Forest Blanton Chief Information Officer
Gary Fuller Manager, Information Technology
Anita Wilson Director, Clinical Systems, Information Technology
Jeffrey Sturman Administrative Director, Business Systems, Information Technology
S. Friedman Manager, Decision Support

Adding Clinical Data to Statewide Administrative Data Final Report Page 3
Table 2: Participating Hospitals’ Team Members and their Responsibilities (Continued)
Team Members in Participating Hospitals Functional Area of Responsibility
BayCare Health System
Denise Remus, Ph.D Chief Quality Officer
Victor Hruszczyk Vice President of Laboratory Services
All Children’s Hospital
Cal Popovitch Chief Information Officer
Michael Epstein, M.D Senior Vice President Medical Affairs
Mike Isaacs Lab Systems Analyst
Miami Children's Hospital
Redmond Burke, M.D Chief, Division of Cardiovascular Surgery
John Madril Outcomes Research Manager
Raul.Herrera Chief Research Officer
3M Health Information Systems (HIS) was contracted to assist hospitals in the research project, to analyze the joined datasets and to translate the naming convention for their laboratory tests to LOINC. 3M worked with the hospital teams to introduce the LOINC vocabulary standard, to define the extract data necessary, to monitor the data mapping and to resolve problems where necessary. Another major task performed by 3M HIS was to analyze the resulting dataset created by joining the laboratory data and the inpatient administrative data, including POAs, and provide an in-depth analysis on predicting quality indicators in hospitals from the combined laboratory and administrative data.
Table 3: 3M HIS Team Members and their Responsibilities
3M Team Members Functional Area of Responsibility
Deborah S. Anderson, MBA, PMP 3M Federal Government Program Manager
Pam Banning MT(ASCP), PMP Medical Informatics Terminology Consulting Services - Lab Data Mapping Subject Matter Expert
Norbert Goldfield M.D. Clinical and Economic Research (Analysis)
Elizabeth C. McCullough Senior Research and Development Architect
Key Stakeholders and Their Roles
The Florida Center for Health Information and Policy Analysis (Florida Center) in the Agency for Health Care Administration (Agency) worked with the State Consumer Health Information and Policy Advisory Council (Council) in all stages of the project. The Council is a stakeholder advisory council for transparency in health care information, made up of members who are

Adding Clinical Data to Statewide Administrative Data Final Report Page 4
health care professionals committed to Florida’s goal of providing the most accurate and current data for consumer’s use in making health care decisions. Table 4 lists the members of the Council.
The statutory relevance of the State Consumer Health Information and Policy Advisory Council (SCHIPAC) and its role and interest in predicting potentially avoidable complications.
The transparency interest of the SCHIPAC and its involvement in the development of AHCA’s transparency website, www.FloridaHealthFinder.gov.
Table 4: Members of the State Consumer Health Information and Policy Advisory Council
Member Representation
Thomas W. Arnold Secretary of the Agency for Health Care Administration
Ana Viamonte Ros, M.D.,M.P.H. State Surgeon General of the Department of Health
Carolyn Timmann Employee of the Executive Office of the Governor
Charles Milsted Representative of consumers
Diane Godfrey Representative of professional healthcare related association
Harry V. Spring Representative of health care purchasers
James Bracher, M.B.A. Representative of Florida Association of Health Plans
Susan Douglas Employee of the Department of Education
Karen L. van Caulil, Ph.D. Representative of local health councils
Kim Streit, C.H.E.,M.B.A., M.H.S. Representative of professional health care related association
Michael L. Epstein, M.D., Chair Pediatric Representative of Health Care Coalition
Michael Wasylik, M.D. Representative of professional health care related association
Paul Duncan, Ph.D. Representative of a state university
Sally House Representative of Florida Association of Business/Health Coalitions
Mary Beth Senkewicz, J.D. Employee of the Office of Insurance Regulation
Aside from the contract with 3M Health Information Systems, the Agency employed no consultants for this project.
Project Planning
Materials Prepared Prior to Contacting Hospitals for Participation
Within a month of receiving the AHRQ award, the AHCA project team contacted several hospital systems to encourage the participation of as many hospitals as possible. The team also targeted hospital systems to take advantage of having the LOINC mapping and the extraction of data conducted in one central office. We followed up the first contact with face-to-face meetings in each of the hospitals that agreed to join the project, meeting with the hospital teams and

Adding Clinical Data to Statewide Administrative Data Final Report Page 5
introducing them to the AHRQ pilot project. In the package presented to the hospitals, we included:
A summary of the project (see Appendix 5).
The project process flowchart (see Appendix 4).
A laboratory values list that was developed by the Agency and 3M HIS to target most appropriate values for the study (see Appendix 3).
The Agency Hospital Inpatient Data document that included a list of fields with a description and the required format in the administrative dataset (see Appendix 6, also http://www.fhin.net/FHIN/HITinitiatives/AHRQaddingClinData.shtml).
The administrative dataset contained
o Present on Admission (POA)
o Admitting diagnosis ICD-9 code
o 29 more ICD-9 code fields
o 30 procedure code fields
o Key ID field to allow linking with LIS data.
A sample of the LOINC codes provided by 3M HIS (see Appendix 7),
Some research articles related to the AHRQ quality indicators (see Appendices 18a, 18b, 18c, 18d, and 18e),
Dr. Edward Hammond’s LOINC PowerPoint presentation provided by AHRQ (see Appendix 8).
Selection of Laboratory Data Elements Chosen to Add to Administrative Dataset
The laboratory data elements included in the project were developed in cooperation with 3M Health Information Systems in the original proposal for the project. The project team compared these data elements with those laboratory data elements selected by the other partners in this project, Minnesota and Virginia. We also consulted with Ms. Nancy Carvallo, Project Laboratory Subject Matter Expert at the Agency. In addition, we referred to research in the area of predicting complications using clinical data. One of the research papers we that referred to was a seminal work reported in the Journal of the American Medical Association, Enhancement of Claims Data to Improve Risk Adjustment of Hospital Mortality by Michael Pine, MD, et. al.1
Project Initiation and Implementation
Administrative Hurdles Encountered
The Agency required approval by the Legislative Budget Committee to amend its budget before the grant funding was initiated and the Agency could receive funds from the Agency for
1 Michael P., Jordan H., Elixhauser A., Fry D, Hoaglin D,, Jones B., Meimban R., Warner D., Gonzales J. (2007).
Enhancement of Claims Data to Improve Risk Adjustment of Hospital Mortality. Journal of the American Medical Association., 297, 71-76.
Adding Clinical Data to Statewide Administrative Data Final Report Page 6
Healthcare Research and Quality (AHRQ) or could enter into contracts with a vendor. The budget amendment establishes spending authority for the agency, and allows setting up of an electronic deposit account for payment of invoices. Budget authority was granted in March 2008, six months after the receipt of the AHRQ contract in September 2007.
Following the budget approval, the AHRQ project team submitted a contract initiation file with the Agency procurement office to begin work on a sole source contract with 3M HIS. However, the project encountered more unexpected delays because the legal office at 3M insisted on changes to the Agency’s contract. The full execution of the 3M HIS contract process took another six months to be completed, in September 2008. Consequent to these budgetary hold-ups, the AHRQ project was initiated with only one year to complete two year’s worth of work.
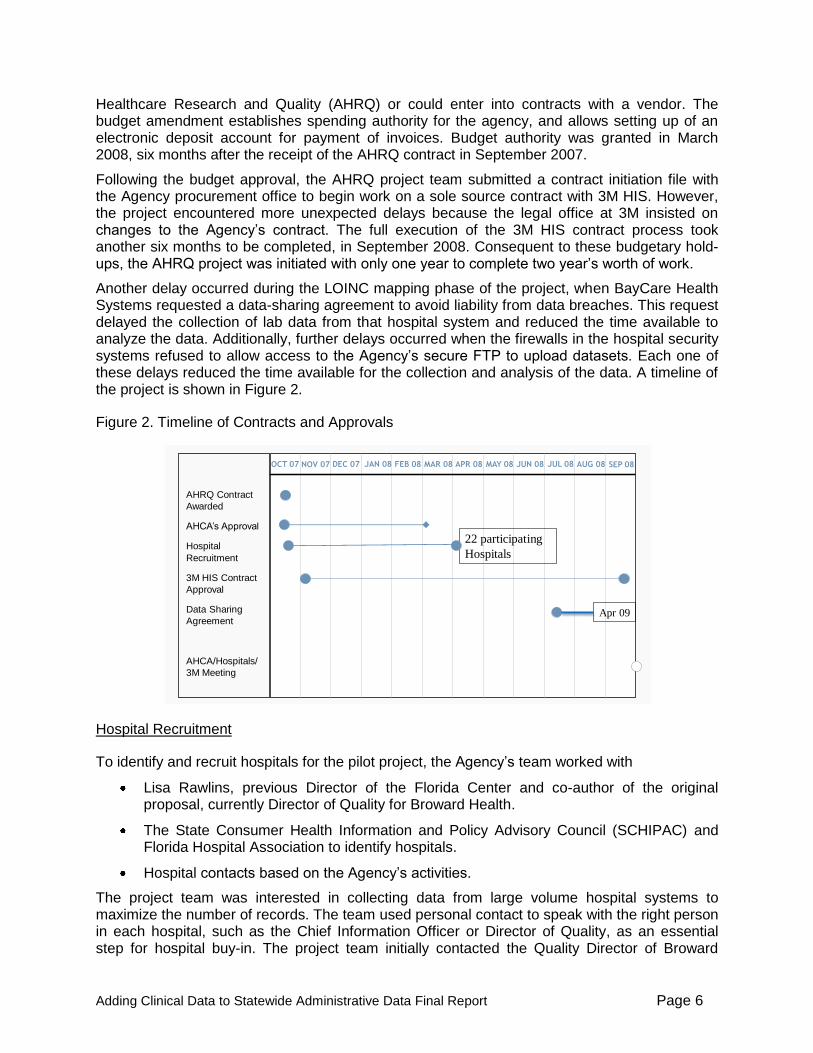
Another delay occurred during the LOINC mapping phase of the project, when BayCare Health Systems requested a data-sharing agreement to avoid liability from data breaches. This request delayed the collection of lab data from that hospital system and reduced the time available to analyze the data. Additionally, further delays occurred when the firewalls in the hospital security systems refused to allow access to the Agency’s secure FTP to upload datasets. Each one of these delays reduced the time available for the collection and analysis of the data. A timeline of the project is shown in Figure 2.
Figure 2. Timeline of Contracts and Approvals Figure 2: Timeline of Contracts and Approvals
AHRQ Contract
Awarded
AHCA’s Approval
Hospital
Recruitment
3M HIS Contract
Approval
Data Sharing
Agreement
AHCA/Hospitals/
3M Meeting
OCT 07 NOV 07 DEC 07 FEB 08 MAR 08 APR 08 MAY 08 JUN 08 JUL 08 AUG 08 SEP 08JAN 08
Apr 09
22 participating
Hospitals
Hospital Recruitment
To identify and recruit hospitals for the pilot project, the Agency’s team worked with
Lisa Rawlins, previous Director of the Florida Center and co-author of the original proposal, currently Director of Quality for Broward Health.
The State Consumer Health Information and Policy Advisory Council (SCHIPAC) and Florida Hospital Association to identify hospitals.
Hospital contacts based on the Agency’s activities.
The project team was interested in collecting data from large volume hospital systems to maximize the number of records. The team used personal contact to speak with the right person in each hospital, such as the Chief Information Officer or Director of Quality, as an essential step for hospital buy-in. The project team initially contacted the Quality Director of Broward

Adding Clinical Data to Statewide Administrative Data Final Report Page 7
Health System and the Chief Information Officer at Memorial Healthcare System, who welcomed the idea of participating in this pilot project. During our first meeting with the Chief Quality Officer at BayCare Health System, she suggested that instead of collecting data of just the large volume hospitals, we should, collect the data from all the hospitals in their system including the children’s hospital. As a result of that meeting, the project team decided to include several more pediatric hospitals and to conduct a separate analysis for these hospitals, so we sought the participation of two more pediatric hospitals in addition to the three children’s hospitals within the hospital systems.
Following the Legislative Budget Committee’s budget approval in March 2008, the project team contacted the hospitals to set up face to face meetings with each of the hospital systems teams and with the two additional children’s hospitals to introduce them to the program and to explain the requirements of the project (see Appendix 9). It was left to the hospital director’s discretion to invite members of their institution to that meeting. The narrative materials the project team brought with them explained the project, described the laboratory dataset, the LOINC mapping process and provided other details of the project and the responsibilities of the hospitals in working on the project.
The recruitment process varied among the participating hospitals. Some hospitals delayed participation until all higher administration levels approved the project. Other hospitals were on board immediately after the first meeting with them. As a result of our recruitment efforts, we were able to confirm that 22 hospitals would be part of the pilot study, five of which were pediatric hospitals. A map of the hospitals in the project is provided in Figure 3.
Figure 3. Map of Hospital Locations in Florida
Adding Clinical Data to Statewide Administrative Data Final Report Page 8
The participants included Broward Health System, Memorial Healthcare System, BayCare Health System and two independent pediatric hospitals: Miami Children’s Hospital and All Children’s Hospital. We were fortunate that the directors or the decision maker at the hospitals and hospital systems were familiar with the issues and the research related to the quality indicators, POA’s, and AHRQ’s efforts and projects in those areas.
During this project, the Florida Center continued to develop relationships with hospital representatives, researchers, clinicians, quality assessment organizations, regional health information organizations, and other key players in the exchange of health information and measurement of health care quality. During the two years of the project, we shared the monthly progress report that we submitted to AHRQ with all participating hospitals and the Florida Hospital Association.
Products and Materials Developed
The project team created several documents as part of this pilot project’s planning process:
A data specification spreadsheet that represents the clinical, blood culture and demographic data required (see Appendix 10).
A Data Sharing Agreement document that was to be signed by the participating hospitals and the Agency’s project director (see Appendix 2).
A project time line indicating the milestones and the various tasks to be performed by the hospitals, 3MHIS, and the Agency teams (see Appendix 11). That project timeline was eventually changed several times because of various unforeseen delays.
A website at: http://www.fhin.net/FHIN/HITinitiatives/AHRQaddingClinData.shtml that described the project and included the process flowchart and the participating hospitals.
General Description of Participating Hospitals
Three hospital systems and two pediatric hospitals participated in the project, for a total of 22 hospitals. The hospitals included 17 general hospitals and five pediatric hospitals. The two children’s hospitals are also teaching institutions. Half of the 22 hospitals have 200 or more beds. Table 5 provides a description of the hospitals including the type of the hospital and the number of beds.
Incentives and Information Offered to Participating Hospitals
We were privileged that the people we worked with in the participating hospitals appreciated the value of this project, were interested in the results of the analysis, and were already involved in measuring their own quality measures. Moreover, learning the LOINC mapping process experience was of great interest to the hospitals.
Initially, we offered to share the datasets we created with the participating hospitals in addition to the analysis of the data for all of the hospitals combined, and a hospital-specific analysis for each hospital. After 3M HIS joined the team, the 3M research team director offered to provide the hospitals with individual analyses and the result per hospital and/or hospital system. Moreover, the 3M HIS Medical Director, Dr. Norbert Goldfield, proposed conducting consultations with the hospitals to interpret the results from the data analysis and offer any other explanations needed. Also, throughout the project we shared the monthly progress reports with the hospitals and we sent them a draft of this final report for their feedback and comments.

Adding Clinical Data to Statewide Administrative Data Final Report Page 9
Table 5: Description of Participating Hospitals
Hospitals Type of Hospital Number of Beds
Admissions in Project Period
Broward Health
Broward General Medical Center Medical Center 716 21,896
Coral Springs Medical Center Medical Center 200 9,876
Imperial Point Medical Center Medical Center 204 5,318
North Broward Medical Center Medical Center 409 10,120
Chris Evert Children's Hospital Pediatric Medical Center 141
BayCare Health System
Mease Countryside Hospital Community 300 12,929
Mease Dunedin Hospital Community 143 4,793
Morton Plant Hospital Community 687 23,662
Morton Plant North Bay Hospital Community 122 4,838
St. Anthony's Hospital Community 365 8,158
St. Joseph's Hospital Community 527
37,213 St. Joseph's Children's Hospital Children’s 164
St. Joseph's Women's Hospital Women’s 192
South Florida Baptist Hospital Community 147 4,524
Memorial Healthcare System
Memorial Hospital Miramar Community 100 8,142
Memorial Hospital Pembroke Community 301 5,185
Memorial Hospital West Community 236 20,405
Memorial Regional Hospital Community 690
28,401 Memorial Regional Hospital South Community 100
http://www.jdch.com/Joe DiMaggio Children’s Hospital
Children’s 100
Pediatric Hospitals
Miami Children's Hospital Children’s 268 12,060
All Children’s Hospital Children’s 216 5,947
Communication Tools
The project managers maintained ongoing communication via emails, conference calls and face-to-face meetings throughout the duration of this pilot project. All hospital teams indicated that in general these communication processes were efficient and useful. In particular, the calls that included all of the hospitals were very useful to them. During these calls, hospital staff were able to compare issues that had come up during the LOINC mapping and trade techniques for overcoming problems. To provide more effective communication, one hospital recommended having a more structured conference call format; another hospital suggested that scheduling

Adding Clinical Data to Statewide Administrative Data Final Report Page 10
face-to-face meetings with the hospital teams, the Agency and 3M to address the LOINC mapping processes would have been beneficial.
Initial face-to-face meeting with hospital representatives. Then, 3M TCS LOINC training was conducted via conference call and e-mail. We had a kick-off meeting with all participating hospitals and then based on the hospitals request we conducted meetings with each hospital and 3M TCS LOINC consultant to address their specific questions.
Frequent e-mail communication and Sharing the e-mail contact list.
Regular conference calls with hospitals and conference calls with 3M and hospitals.
Ad hoc telephone calls to follow-up questions and resolve problems.
Website at http://www.fhin.net/FHIN/HITinitiatives/AHRQaddingClinData.shtml
We sent our Monthly Progress Report to all hospitals and Florida association.
Changes Made During the Initiation Phase of Hospital Outreach
Adjusting the project timeline was a continuous task. Although delays were anticipated, the project team encountered many unforeseen setbacks. Beginning with budget approval, then waiting for the contract approval with 3M HIS, the project ran into delays in having all participating hospitals working on the project, to completing the LOINC mapping process and to the final analysis of the data.
When the project started the plan was to use HL7 for the transmitting the datasets to the Agency. Hospitals typically use HL7 to send documents, so it was assumed that this method would be the best for submitting their data. However, in discussing this with the CIOs of several hospital systems, they recommended that it would be better to send the data using Excel or as text files rather than HL7. They noted that the dataset would be a retrospective file containing thousands of laboratory records and that coding the data into HL7 would consume more resources than just sending the entire file. So we reached an agreement that the hospitals would send their data in Tab Separated Value text format using a secure File Transfer Protocol (FTP) site set up by the Agency.
The original proposal had planned to recruit 15 hospitals for the project, and the budget for the project was predicated on 3M TCS having to do LOINC mapping of 15 different clinical lab extracts. Instead, since the participating hospitals consisted of three hospital systems and two hospitals; 3M TCS had to conduct LOINC mapping and standardization for five clinical lab extracts.
In its implementation plan the project team proposed contracting with an academic researcher to conduct an independent analysis of the laboratory data joined to the administrative data. The One of the participating hospitals did not agree on sharing the data with any subcontractor other than the one stated in the original contract, 3M HIS. Also, the FSU College of Medicine declined working with the project because of the lack of time required to complete the analysis. Therefore, the project team cancelled that task.
Project Implementation
Project implementation began once the AHCA project team had completed its face-to-face meetings with the hospital project staff, had distributed all of the background materials and the 3M Terminology Consulting Services consultant had held the initial introductory webinar on LOINC mapping. The AHCA project team distributed a survey after the LOINC mapping was

Adding Clinical Data to Statewide Administrative Data Final Report Page 11
completed to determine the resource requirements for standardizing the lab data. Results reported below come from that survey.
Hospital Resources Utilized During Participation in This Project
Most hospitals utilized their IT team for extracting the data and for using the Agency’s secure FTP site for uploading the data. The number of hours each participating hospital’s personnel spent on this pilot project varied from 33 hours to 132 hours. In general most of the time spent was by the IT or systems analyst team members as shown in Table 6. (For simplicity, the term hospital refers both to one hospital and to a hospital system.). These numbers are based on a LOINC mapping survey of the hospitals following successful submission of data.
Table 6: Personnel Involved in this project: Title, Tasks, and Number of Hours Spent
Hospitals Personnel Title Task performed Number of Hours
Miami Children's
VP of Information Technology Project Manager 30
VP of Medical Affairs Executive Sponsor 30
I/T Sr. Systems Analyst Program download 40
Broward Health
Consulting systems analyst Procedure mapping; create the data catalog, and data extraction
21
Administrative Support Attended Conference calls and meetings
12
BayCare Health System
Manager LIS Sample Data extract and LOINC mapping, point person for questions from other teams
20
CCL team Modified and ran scripts to extract data and create the data catalog
16
Database Security and FTP 5
Security team Opened ports for FTP 1
Cerner Corporate Support Helped with some database issues
3
Memorial Healthcare
Manager, IT Clinical Systems Data extract 100
All Children's Hospital
Manager, Revenue Cycle Applications.
FTP files 2
Lab System support analyst Data extraction 10
Outcomes Research Manager CV
Project Coordination 120

Adding Clinical Data to Statewide Administrative Data Final Report Page 12
The time required to complete the LOINC mapping varied across hospitals. BayCare Health System initially had its programming and operations teams working with the systems analyst but when they found out that this was essentially a one-time data submission, only a single programming resource was required. Additionally, BayCare Health System partnered with Broward Health, which had already written a LOINC mapping script to standardize the lab data, because both hospitals used the same Cerner Millennium Lab Information System (LIS). Baycare Health System was able to employ the mapping script for its LIS code values, thus decreasing the data translation time. The total number of hours required by each hospital to map and translate lab values into the LOINC dataset is shown in Figure 4.
Figure 4: Time Spent on Mapping Lab Values to LOINC per Hospital
The Agency’s project team developed an evaluation survey and sent it to the participating hospitals to gather feedback related on their experience with the project, the resources required for LOINC mapping and other information about the project (see Appendix 12). The survey consisted of 20 questions that addressed the hospital description, resources needed, data compilation, LOINC mapping, data transmission, communication tools, barriers encountered and their resolutions, and the lessons learned.
The following sections include the compilation of the hospitals’ responses and feedback. They are displayed in the same format of the evaluation survey. Each question is followed by the answers provided by the participating hospitals.
LOINC Mapping
The 3M Terminology Consulting Services consultant worked closely with each of the hospitals to develop coding dictionaries of the laboratory tests and to map the test results to LOINC (see Appendix 13). For more LOINC information, a detailed user’s guide, and future updates are available at www.loinc.org. The vocabulary standard is used internationally to specify laboratory results and clinical observations in a standard format. The use of LOINC allows the integration of laboratory data from different Laboratory Information Systems into a single dataset. It is used in the health care industry by hospitals, laboratories, public health departments, integrated delivery networks, health plans and health information exchanges. According to the American
0
20
40
60
80
100
120
140
Miami Children's Hospital
All Children's Hospital
Memorial Healthcare
BayCare Health System
Broward Health
132
100 100
45
33
Ho
urs
Time Spent on Mapping Lab Values to LOINC
Time Spent on Mapping Lab Values to LOINC

Adding Clinical Data to Statewide Administrative Data Final Report Page 13
Medical Informatics Association, there were 9,500 downloads of the LOINC standard from 86 different countries in 2008.
In order for 3M to provide the specific LOINC codes for this project, an orientation meeting was held between the 3M subject matter expert and the hospital teams to introduce the project and to explain the LOINC coding to them. This initial teleconference consisted of a PowerPoint presentation to introduce them to LOINC (see Appendix14). The six attributes encompassing a LOINC code are not recorded as such in a Laboratory Information System (LIS). Often, a translation needs to take place between information that is in the LIS, in order to obtain the appropriate LOINC code. An example of LOINC coding used in the initial training is shown in Figure 5.
Figure 5. The Anatomy of a LOINC Term
3M Terminology Consulting Services asked for the following information on the approved lab tests for this project:
Orderable test interface code – this code is the mnemonic used to order a single test or battery of tests. For example, CBC would order a Complete Blood Count, which could contain a variety of hemogram and differential results. Conversely, HCT would order only the single Hematocrit.
Orderable test name (long description) – this column contains a textual description of the test field.
Result interface code – this code is the mnemonic used in the hospital’s test directory to describe a single result field, either orderable or non-orderable. Examples include WBC for Leukocytes, or MPV for Mean Platelet Volume.
Analyte name (long description) – this column contains a textual description of the result field.
Analyte name (short description) – this optional column contains a shorter description of the result field.

Adding Clinical Data to Statewide Administrative Data Final Report Page 14
Specimen type – this is the type of specimen the assay is run on, such as plasma, serum, whole blood, urine, etc. It is not the collection type, such as a tube color (red, blue, yellow) or description (microtainer, cup, jug). Urine would be considered random collections, unless a timed duration such as 2-hour or 24-hour is specified.
Result type – an indicator of whether it is numeric (N) or alpha (A).
Units of measure – with which the result is reported.
Method – if available.
See Appendix 7 for an example extract along with a sample LOINC report. This was provided as part of the introduction for each of the sites, to envision their output for the LOINC mapping part of the project. More information related to LOINC is contained in Appendices 13, 17a, 17b, 19a, and 19b.
When the laboratory result nomenclature was compared among the participating hospitals, the need for LOINC standardization became clear. Each hospital used its own coding system to report the laboratory test, as is shown in Table 7.
Table 7. Comparison of Hospital Naming Conventions for Laboratory Tests
Lab Test Name All
Children’s Miami
Children’s BayCare
Broward Healthcare
Memorial Healthcare
SGPT ALT ALT (SGPT) ALT 55548699 ALT
Albumin ALB Albumin Albumin 55548695 ALB
Alkaline phosphatase
AP Alkaline Phos Alk Phos 55548696 ALKP
SGOT AST AST (SGOT) AST 55548697 AST
Blood/Lymph Culture-Positive
BCECMO Blood Culture C Blood C BLD CXBLD
Glucose GLU Glucose Glucose 55548690 GLUC
Hematocrit HCT1 HCT HCT 55542287 HCT
Total Hemoglobin
HGB1 HGB HGB 55542285 HGB
Potassium K1 Potassium Potassium 55548685 K
Sodium: NA Sodium Sodium 55548683 NA
LOINC Mapping Process
The hospitals each reported the process steps they used for the team to perform the LOINC mapping requirements of this project. These included developing a coding dictionary, submitting the data elements for mapping, then revising the LOINC mapping. The steps are presented in
Adding Clinical Data to Statewide Administrative Data Final Report Page 15
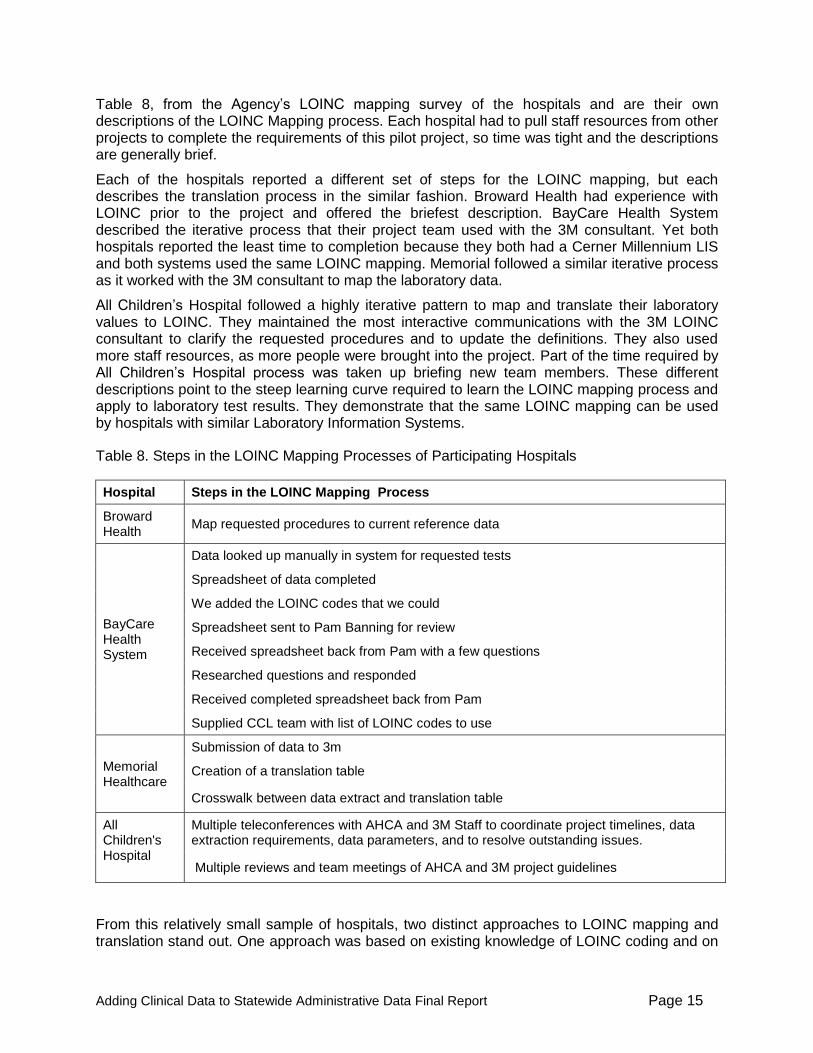
Table 8, from the Agency’s LOINC mapping survey of the hospitals and are their own descriptions of the LOINC Mapping process. Each hospital had to pull staff resources from other projects to complete the requirements of this pilot project, so time was tight and the descriptions are generally brief.
Each of the hospitals reported a different set of steps for the LOINC mapping, but each describes the translation process in the similar fashion. Broward Health had experience with LOINC prior to the project and offered the briefest description. BayCare Health System described the iterative process that their project team used with the 3M consultant. Yet both hospitals reported the least time to completion because they both had a Cerner Millennium LIS and both systems used the same LOINC mapping. Memorial followed a similar iterative process as it worked with the 3M consultant to map the laboratory data.
All Children’s Hospital followed a highly iterative pattern to map and translate their laboratory values to LOINC. They maintained the most interactive communications with the 3M LOINC consultant to clarify the requested procedures and to update the definitions. They also used more staff resources, as more people were brought into the project. Part of the time required by All Children’s Hospital process was taken up briefing new team members. These different descriptions point to the steep learning curve required to learn the LOINC mapping process and apply to laboratory test results. They demonstrate that the same LOINC mapping can be used by hospitals with similar Laboratory Information Systems.
Table 8. Steps in the LOINC Mapping Processes of Participating Hospitals
Hospital Steps in the LOINC Mapping Process
Broward Health
Map requested procedures to current reference data
BayCare Health System
Data looked up manually in system for requested tests
Spreadsheet of data completed
We added the LOINC codes that we could
Spreadsheet sent to Pam Banning for review
Received spreadsheet back from Pam with a few questions
Researched questions and responded
Received completed spreadsheet back from Pam
Supplied CCL team with list of LOINC codes to use
Memorial Healthcare
Submission of data to 3m
Creation of a translation table
Crosswalk between data extract and translation table
All Children's Hospital
Multiple teleconferences with AHCA and 3M Staff to coordinate project timelines, data extraction requirements, data parameters, and to resolve outstanding issues.
Multiple reviews and team meetings of AHCA and 3M project guidelines
From this relatively small sample of hospitals, two distinct approaches to LOINC mapping and translation stand out. One approach was based on existing knowledge of LOINC coding and on

Adding Clinical Data to Statewide Administrative Data Final Report Page 16
the capability to complete the LOINC mapping in-house without the help of the expert. The corollary use of expertise allowed LOINC mapping using the final mapping report of the expert hospital. The two hospitals in this group translated about 90% of the lab values into LOINC codes correctly and only 10% of the translations had to be by 3M’s consultant.
The second approach demonstrates the need for extensive training and communication as the hospitals learn the LOINC mapping process. In all cases, a strong LOINC mapping training component was essential. The hospitals that needed more training indicated that they could not have completed the LOINC mapping in-house on their own without the LOINC expert’s assistance. The LOINC training also worked in reverse, with one hospital updating three clinical procedures (blood culture, ionized calcium, and PO2) following 3M’s evaluation.
All participating hospitals indicated that they benefited from consultations with 3M LOINC mapping expert, who compiled the hospitals’ extract data and performed the actual mapping. They appreciated the explanations and clarifications of the LOINC coding and the meaning of the requested procedures. Mostly, they appreciated the professionalism displayed by 3M’s LOINC consultant, her flexibility, focus on the project completion and responsiveness in working with the hospital teams.
Issues Encountered in Standardizing Data Elements
Most of the sites had not implemented LOINC in their systems prior to this project. One site had access to LOINC via a third party vendor hosting their physician’s office portal. There was an initial phase to map each site’s laboratory definitions to the LOINC vocabulary standard. The test catalog or compendium resides in the laboratory information system, without attachment to patient data.
Eight weeks were initially projected to complete the LOINC mapping. Three sites were actually mapped within three weeks. The other two sites had issues preventing them from submitting in same time period. They differed in workload from auditing one site’s LOINC mapping in two days to the last site requiring two months to submit the data, as shown in Table 9. The site taking the longest time had the greatest number of time constraints on providing data to map. Information filtered in from the site over the course of six weeks. Questions and confirmations were not answered; 3M eventually closed the work.
Table 9. Timeline of Project by Hospital
Hospitals Date Site Submitted Date Initial Report Date Completed
Memorial Healthcare
10/1/08 with follow-ups on 10/10/08 (troponin) and 10/14/08 (O2 Sat)
10/10/08 10/15/08
Hospital One 10/6/08 10/13/08 10/15/08
Broward Health 10/10/08 10/13/08
Except for O2 Sat 10/17/08
All Children’s Hospital
12/2/08 (Chemistry only)
12/23/08 (more labs)
1/14/09 (further labs)
12/31/08 2/16/09
BayCare Health System
6/1/09 - Attempted their own mapping
6/2/09 6/3/09

Adding Clinical Data to Statewide Administrative Data Final Report Page 17
3M Terminology Consulting Services LOINC Mapping Summary Notes
The 3M Terminology Consulting Services consultant submitted notes to the project team on a regular basis to provide updates on the LOINC mapping process. A summary of the notes is presented below, to indicate the technical nature of the LOINC mapping process and how each hospital had challenges unique to its laboratory information system.
3M TCS checked to assure the submission is complete. Performed a backwards pass over data elements list to account for all analytes.
3M TCS added an additional confirmation check with sites that they didn’t use different interface codes for manual PLT or WBC, and specifically asked if Troponin T was reported at each facility.
3M TCS evaluated units of measure to rule out decimal position discrepancies. (none found)
The pO2 saturation element was commonly mistaken for the pO2 element; easily detected in the files by pressure units of measure (mm Hg) rather than %. Each site able to send correct row of data within 1 day.
One site to date gave more information than necessary for the blood gases. They provided venous and capillary blood interface codes as well for pH, base excess, bicarbonate and pO2. These are typically separate in an LIS, due to different reference ranges. 3M TCS provided LOINC mapping for every row the clients gave, explaining that patient value collection should probably be restricted to the arterial specimens only.
After all sites were mapped, 3M TCS provided a summary table of LOINC mappings, including units of measure (see Appendix 15).
Memorial Healthcare was the only site to report both Troponin I and Troponin T. All the other sites are reporting Troponin I
The ionized calciums were fractured amongst the sites by either unit of measure or specimen type. Four different LOINC codes were used across five sites.
Miami Children’s Hospital blood cultures have fractured specimen types – because the epidemiologist is looking for contaminated portals or indwelling lines. All are mapped to the same LOINC code.
All Children’s Hospital had neonatal elements for MCH, HCT, WBC and PLT. They are going to the same LOINC code. There may be different reference ranges, due to patient age.
The blood gas components had the most variability in LOINC mapping, because some sites break out the venous, arterial and capillary specimens, versus just an arterial specimen. Base excess and Bicarbonate seemed the most noticeable. 3M asked the sites to only include the arterial sources in their data.
Process Steps Needed to Perform the Data Requirements of this Project
All of the hospitals participated in the initial conference call with 3M and the Agency in which they were introduced to 3M’s team and they were provided with a list of the required data elements. From that date on, hospitals worked independently and at their own pace, from

Adding Clinical Data to Statewide Administrative Data Final Report Page 18
submitting their data catalog to 3M to uploading their data on the FTP site. Table 10 represents the hospitals’ description of the process steps performed.
Table 10. Steps Performed by Each Hospital in the Perform Data Requirements of the Project
Hospital Steps for Data Submission
Miami Children's
Identifying the data elements to be captured
Data Specifications were submitted for review
Conference Calls and follow-up e-mails to address any questions/ issues with Data Requirements
Specifications finalized and extracts were then created and submitted via FTP
Broward Health
Map requested procedures and other data elements to clinical data repository
BayCare Health System
Obtained script from Broward Health
Completed sample data extract and LOINC mapping
Modified script with our systems code values
Added confirmed LOINC codes to the scripts
Scripts were run against database and data stored
Security team opened ports
Database team sent the data via FTP
Memorial Healthcare
Linking of LOINC data and AHCA hosp data to existing system tables
Extract of patient data from SoftLab database
Extract of Result data from SoftLab database
Conversion to required format and export
Upload to FTP site
All Children's Hospital
Defining data parameters
Development of Access queries
Importing of Access table into Excel
Transmission of file
Problems Encountered and Resolved
The issues the hospitals encountered in complying with the data requests varied from none, to time constraints and to the impact of pulling the data while upgrading their LIS system. The following Table 11 contains the barriers that some hospitals indicated they faced and the ways they resolved them. Also this table contains the lessons learned and the suggestions based on overcoming barriers to data submission. Note that Miami Children’s Hospital replied “none” to all of the barriers.
Several of the problems encountered by the participating hospitals were due to time constraints. As mentioned previously, the project duration was two years, which would have allowed the hospitals enough time to complete the data extraction and LOINC mapping tasks at their own pace, without stressing their resources. But due to the budget and contracting hurdles, we held our first conference call with all participating hospitals and 3M on October 1, 2008, one year after the Agency was granted the award from AHRQ. Also, other administrative obstacles have contributed to more delays. Because of delays over the data sharing agreement, BayCare Health System did not start working on the projects until May 2009.

Adding Clinical Data to Statewide Administrative Data Final Report Page 19

Adding Clinical Data to Statewide Administrative Data Final Report Page 20
Table 11. Various Barriers Encountered by Hospitals and How they were Resolved B
row
ard
Healt
h Barriers
How was issue resolved?
Lessons learned
Technological Date range requested covered a different system than one in current use
Look up historical data catalog
Prefer to use current lab system data
Other commitments
Concurrent system upgrade project and move of servers off site
Extended time taken to complete
BayC
are
Healt
h S
yste
m
Staff Time, Every team is under time constraints right now
A couple of other projects were put on the back burner
Technological
1. Amount of data being pulled back in report put a significant increase on system resources
2. We had the scripts error out twice after running for 20 hours due to the amount of data being returned
Scripts were broken up into smaller time frames and the scripts were run during off hours when system resources aren’t as high.
Scripts can use some fine tuning to run more efficient
Other commitments
This occurred during our phase 2 scheduled build period of our EMR project so resources were extremely tight.
Resources were pulled from build to complete the report
Mem
ori
al H
ealt
hca
re
Staff Time availability, staffing shortage
Staff worked in off hours
Technological Database structure on lab system
Multiple extracts with links was required
Other issues Definitions of data fields were changed during the course of the project.
Additional programming time was required to accommodate the change in data
All C
hild
ren
's
Staff Coordination of multiple staff members and departments. Project approval by multiple departments
Interdepartmental coordination and cross collaboration used to secure project approval.
Coordinate early and often.
Technological Patient Data unavailable for year requested (2007) without significant increase in data extraction efforts
Patient data extraction for 2008 was approved by AHCA and 3M
Stay flexible in order to achieve your goals

Adding Clinical Data to Statewide Administrative Data Final Report Page 21
Data Transmission
For this pilot project the hospitals uploaded their data as tab separated value files. In general, the hospital CIOs agreed at the beginning of the project that sending the data as a text file would be much easier than sending it using HL7, because the dataset represented a one-time data pull that was ill-suited to an HL7 transfer. Formatting the dataset for HL7 would have required considerable effort and resources. They were satisfied with the secure File Transfer Protocol (FTP) transfer format because they could send submit the data to the Agency n a straightforward manner that required a minimum of resources.
Figure 6. LOINC Mapping and Data Transmission Timeline
All of the hospitals that agreed to participate in this project provided data, though not all were on target with the adjusted timeline. We received the data from all of the hospitals by June 15 2009, while it was originally anticipated that we would receive them in July of 2008.
There were issues surrounding the use of a secure FTP server both within the Agency and with the hospitals. The use of a secure FTP site for hospitals to submit data is routinely used by the Agency; however there were a number of issues with the Agency’s FTP site that could have been avoided with better communications:
The secure FTP site at the Agency did not allocate enough storage space for the laboratory datasets being submitted. After the additional space was added, the hospital teams were able to submit their files to the FTP server.
The secure FTP sites at the Agency were not properly mapped initially, so that some hospitals logged into another hospital’s FTP site.
The Agency’s FTP sites are set to time out after 90 days. Because of delays in uploading the lab data, when the hospitals were ready to upload, the secure FTP sites were closed. We had to re-open them, and go through the same problems listed above.

Adding Clinical Data to Statewide Administrative Data Final Report Page 22
For the participating hospitals, hospital firewalls and policies contributed to problems with the secure FTP site. On the one hand, hospital teams could not download the FTP software because of firewalls and hospital policies against loading unauthorized software on hospital computers. Hospital firewalls also prevented them from connecting to the Agency’s secure FTP server. These problems required assistance from the IT departments in the hospitals, and required IT staff to take care of uploading the data.
3M Health Information Systems - Data Analysis Summary
In order to test the degree to which clinical laboratory data can improve the accuracy of the risk adjustment methods for comparing hospital mortality rates, a risk adjustment method that uses only administrative data must be selected and then modified by adding clinical laboratory data. The performance of the risk adjustment method can then be assessed with and without the clinical laboratory data.
For the purposes of this project, the All Patient Refined Diagnosis Related Groups (APR DRGs) were selected as the risk adjustment method for the administrative data because of its widespread use and because it was developed by 3M HIS. APR DRGs are currently used by the Agency for Healthcare Research and Quality (AHRQ), the Agency for Health Care Administration (AHCA), the Joint Commission on Accreditation of Healthcare Organizations (JCAHO) and many other organizations as the risk adjustment method for reporting inpatient outcomes, including mortality. This project extended the use of risk adjustment through APR DRGs by adding clinical laboratory data to the risk adjusted dataset, and then comparing the risk adjusted datasets with and without laboratory data for their ability to predict inpatient mortality. The project involved five steps:
Using research literature and clinical input, the 3M and Agency research teams identified a subset of clinical laboratory tests to be evaluated with the administrative data.
The 3M research team used the data provided by the Agency research team to create a database that included both the administrative and clinical laboratory data.
The 3M research team developed standardized test result ranges for each clinical laboratory test.
Based on the research literature and clinical input, the 3M research team identified meaningful results outside the normal ranges of laboratory tests. They then employed statistical tests to identify the subset of clinical laboratory test results that improved the performance of the APR DRGs for predicting inpatient mortality.
The 3M research team finally assessed the overall incremental improvement due to the addition of the clinical laboratory test results on the performance of APR DRGs for predicting inpatient mortality.
The following research summary provides a brief overview of the methods employed by 3M HIS, and then describes the results and outcomes of the statistical analysis.
Step 1: Identify the Subset of Candidate Clinical Laboratory Tests to be Evaluated
Before the start of the pilot project, the Agency and 3M research teams used a review of the literature and the clinical expertise at 3M HIS to select a set of laboratory tests results that were:
Thought likely to contribute to better predict inpatient mortality.
Based on information routinely ordered by health care professionals.

Adding Clinical Data to Statewide Administrative Data Final Report Page 23
Derived, whenever possible, from standardized items already tested in the literature.
Step 2: Create a Database that Includes both Administrative and Clinical Laboratory Data
The selected laboratory tests were identified according to Logical Observation Identifiers Names and Codes (LOINC) standards, which allowed them to be identified by standardized codes in electronic reports. The data elements contained in the clinical laboratory dataset included the LOINC codes, test result, units of measure, date and time of the specimen, type of test performed, and reference range of the test. Each record in the clinical laboratory dataset included the unique patient discharge identification number that was included in the administrative dataset in order to link a patient’s clinical laboratory data with the associated administrative discharge data. Each LOINC code was associated with one of the selected clinical laboratory data elements, and some of the laboratory tests were associated with multiple LOINC codes. Over 11.7 million clinical laboratory test records were contained in the clinical laboratory dataset.
Administrative Data Exclusions
After compiling the linked administrative and clinical laboratory data sets, the 3M project team applied seven additional criteria to the administrative dataset. Applying the patient level data quality screening criteria to the administrative dataset, 34,913 discharges were excluded from the administrative dataset. The majority of the discharges excluded from the administrative dataset based on the data quality screening criteria were due to a hospital having a low percentage of linked lab data for a three month quarter of data.
For this project, 3M applied five specific criteria for evaluating the quality of the present on admission coding. This POA screening criteria was developed using administrative data from California, and applied to the Florida administrative data to ensure POA coding accuracy. All of the hospitals passed the POA data quality screen criteria.
The final administrative analysis dataset contained 188,555 discharges from the project hospitals for discharges from April 2007 through December 2007.
Clinical Laboratory Data Exclusions
Over 11.7 million clinical laboratory data records were provided from hospitals participating in the study. Clinical laboratory data records that did not link to the 188,555 administrative discharge records in the analysis file were excluded. The remaining clinical laboratory data records were reviewed for data quality.
Each of the laboratory test records in the clinical laboratory dataset was standardized to a LOINC code using the mapping file developed by 3M HIS specific to the hospitals within each health system and to the children’s hospitals. Inconsistent laboratory test results were then identified and excluded. The frequency of the laboratory test result values was also examined and extreme or error test results for each of the specific clinical laboratory data element were identified and excluded.
Step 3: Create Standardized Test Result Ranges for Each Clinical Laboratory Test
After creating the linked administrative and clinical laboratory test data set, the next step was to create test result ranges for each of the laboratory tests that could be evaluated for their ability to improve the APR DRG prediction of mortality.
The 3M research team reviewed the distribution of test results for each individual LOINC code across hospitals and determined that the variation in both the reference (normal) ranges and the overall distribution of results was not significant. Therefore, the normal ranges did not require

Adding Clinical Data to Statewide Administrative Data Final Report Page 24
modification in order to be comparable across hospitals, and the actual numeric laboratory test result values were used directly in the analysis.
For each of the clinical laboratory data elements retained in the study, the 3M project team categorized the test results into clinically determined test result range categories, based on clinical judgment and literature review. They hypothesized that the test ranges that deviated most from normal would tend to correlate with higher mortality rates. The 3M team tested this hypothesis by examining the ability of test result ranges for each laboratory test to predict mortality when combined with APR DRGs.
The 3M team agreed with the overall philosophical approach of prior research that used laboratory values for improved risk of mortality prediction based on diagnoses/procedures present on admission; the challenge was in operationalizing this approach. There are several possible methods for selecting an admission laboratory value. Based on the information provided in the dataset, the 3M project team selected the first test result available for patient discharges with multiple test results for the same clinical laboratory data element to be included in the clinical laboratory data analysis file.
Step 4: Identify the Subset of Clinical Laboratory Test Results that Improve the Performance of APR DRGs for Predicting Inpatient Mortality
The next step was to determine which of the laboratory tests and their test result ranges added predictive value to the existing APR DRGs, and to incorporate them into the APR DRG logic. Risk adjusted models were created and analyzed using the following hospital administrative and clinical laboratory dataset models:
Model A – the Discharge APR DRG and risk of mortality subclass assignment based on administrative data elements including principal and all secondary diagnosis, procedures, age, gender, and patient discharge status; but no clinical laboratory data.
Model B - the Admission APR DRG and risk of mortality subclass assignment based on the same administrative data elements for Model A plus the present on admission (POA) indicator for each secondary diagnosis and the number of days after admission each procedure is performed; but no clinical laboratory data.
Model C – the Admission APR DRG and risk of mortality subclass used in Model B data plus test results for each of the selected laboratory clinical data elements.
The 3M project team then examined the effect of individual laboratory tests and test result ranges within various patient groups, including individual APR DRGs, entire Major Diagnostic Categories (MDC), all surgical APR DRGs or all medical APR DRGs, or the entire patient population, in order to identify those laboratory tests associated with of higher risk of mortality. Indirect rate standardization was used to generate a set of reports that were used to evaluate the impact of clinical laboratory data on the four risk of morality subclasses. The clinical hypothesis tested was that for certain categories of patients the risk of mortality subclass could be increased based on the value of specific clinical laboratory results.
Step 5: Assess the Overall Incremental Improvement Due to the Addition of the Clinical Laboratory Test Results on the Performance of APR DRGs for Predicting Inpatient Mortality
The literature which assesses the ability of various models to predict mortality relies on two basic statistics: reduction of variance (R2) and the area under the receiver operating characteristics (ROC) curve. In order to be consistent with this literature, the same two statistics were used for evaluating the ability of the APR DRG system to predict inpatient mortality with Florida data.

Adding Clinical Data to Statewide Administrative Data Final Report Page 25
Case-level comparison of the baseline model A (using only administrative data) to model “B” (including the secondary diagnosis present on admission indicator) and model “C” (combining model B with laboratory test results) were performed using the c-statistic and R2. The c-statistic summarizes the ability of the Admission APR DRG and risk of mortality models to discriminate between patients who were discharged alive or dead. The R2 also summarizes the degree of error inherent in the Admission APR DRG and risk of the mortality models’ ability to predict individual deaths.
The 3M research team next incorporated the results of the analysis into an APR DRG research prototype grouper. Each model was run against the Florida analysis dataset. Case level c-statistics and R2 were computed for each model separately. These reports and statistics were reviewed by the clinical panel to determine which clinical laboratory attributes should be recommended for incorporation into the APR DRG risk of mortality model. Once the individual clinical laboratory data element models for inclusion into the APR DRG model were identified, the APR DRG research prototype was developed to include all the additional recommended clinical laboratory modifications for a final evaluation of Model “C”, and case level statistics were recomputed. See Appendix 21 for the final 3M HIS Analysis and Results Report.
3M Health Information Systems - Results Summary
The 3M HIS clinical panel reviewed the impact reports and determined potential modifications to the APR DRG risk of mortality subclass assignment algorithm. Based on a review of the mortality impact reports, the final clinical laboratory model (“Model C”) included adjustments based on eleven clinical laboratory data elements. The adjustments to the risk of mortality assignment were specific to selected abnormal test result ranges and applied overall to all cases, or cases that belonged to specific clinical subgroups, including medical DRGs, surgical DRGs, or a specific MDC. The presence of a specified abnormal test result range category increased the risk of mortality level by one subclass to a specified maximum risk of mortality subclass.
Specifications for thirty-two adjustments to the risk of mortality subclass algorithm were defined. Overall, 18,057 (9.58%) patients were impacted by the addition of clinical laboratory data elements in the Admission APR DRG risk of mortality assignment. Blood urea nitrogen, Albumin and pCO2 made up the vast majority of changes to the Admission APR DRG risk of mortality assignment representing 8,657, 6,655, and 1,989 patients, respectively.
The c-statistic and R2 for mortality were computed based on the APR DRG and risk of mortality classification as defined by the three clinical models A, B and C, as described in the methods section. The removal of post-admission complications from the APR DRG and ROM assignment in clinical model “A” to clinical model “B” results in a percent decrease of 1.23% and 12.66% in the c-statistic and R2, respectively. The addition of the clinical laboratory data to the assignment of the Admission APR DRG and ROM subclass in model “C” relative to model “B” resulted in a percent increase of 0.574% and 4.53% in the c-statistic and R2 respectively.
For each of the thirty-two clinical laboratory adjustment to the risk of mortality subclass algorithm, the c-statistic and R2 were independently calculated. The percent change in c-statistic and R2 from the Admission APR DRG ROM clinical model (“Model B”) were reviewed. Four clinical laboratory data element abnormal TRR category adjustment specifications had the largest impact on the overall increase in the results. pH < 7.1, Bicarbonate 10-15 and < 10, and Blood urea nitrogen had a percent increase in R2 of 4.41, 3.16, 2.86 and 1.07 respectively.

Adding Clinical Data to Statewide Administrative Data Final Report Page 26
Discussion
Because of the increasing importance and scrutiny of public reporting of inpatient outcomes and pay-for-performance initiatives, the risk adjustment method used in the comparison hospital outcome rates such as mortality must accurately describe a hospital’s case mix. Applications of risk adjusted mortality rates currently use the discharge APR DRG and risk of mortality subclass that includes all secondary diagnoses including those that develop during the hospital stay. However, the assessment of inpatient risk of mortality should ideally be based on a patient’s condition at the time of admission. The challenge is to give hospitals credit for diseases and conditions that represent a natural progression of the patient's underlying problem, but not to give credit for preventable complications.
In this study, which partially addresses this issue, the Admission APR DRG and risk of mortality subclass was computed using the present on admission indicator in order to remove any bias introduced by the inclusion of preventable complications in the risk assessment (partially in the sense that there may be some secondary diagnoses that occur after admission that should be included in the ROM assessment). While the statistical performance of the Admission APR DRG is lower than the Discharge APR DRG, the decrease in predictive power is relatively small and the APR DRG risk of mortality adjustment remained high even when the confounding effect of post admission complications was removed. In large measure this is due to the fact that the APR DRGs are a detailed clinical model and, for example, take into account the interaction between secondary diagnoses. The slight reduction in predictive power for the Admission APR DRG risk of mortality demonstrates that the models based on APR DRG risk of mortality derive their predictive power primarily from the diagnostic information present at admission and clinical stratification, and not from post admission complications. An important evaluation criteria for any risk of mortality system, is the extent to which the statistical performance of the system is dependent on the inclusion of post admission complications.
Since laboratory test results are not currently collected in administrative data, there will be considerable effort and cost associated with any mandate to report laboratory test results. To justify such costs the operational value of the laboratory test results must be demonstrated. This study demonstrated the value of selected laboratory results for enhancing the prediction of patient mortality. This preliminary study identified laboratory tests that are relevant for APR DRG Risk of Morality prediction and therefore should constitute the minimum scope of laboratory test results that are included in any mandated collection of selected laboratory test results.
In order to facilitate the collection of selected laboratory test results, this type of additional information could be collected in a manner more consistent with the existing ICD-9-CM diagnosis coding and reporting practices. A discrete set of “codes” could be defined for a select set of laboratory test results to provide a means for collecting additional patient characteristics in a way that does not require existing claims forms or claims processing systems to be modified.
Lessons Learned
The actual work on the first task involving the hospitals, such as data standardization and LOINC mapping, started a year after The Agency was granted the contract. This pilot project showed that after the recruitment process is completed, one year not sufficient to complete required tasks. The LOINC mapping of the selected clinical elements, the data extraction, the transfer of data, the merging of Administrative and clinical data were completed in nine months, but the data analysis required six months at a minimum. The list summarizes some of the lessons learned in the process of completing the various tasks of this pilot project.
Flexible Project timeline: Through this pilot project we gained an awareness of the time
Adding Clinical Data to Statewide Administrative Data Final Report Page 27
spent on each task. Some participating hospitals indicated that they put more hours than they intended do. Lesson learned: Allocate more time for several tasks, specifically for the tasks performed by the hospitals.
Meetings: When we started the recruitment process, we communicated with the hospitals independently. Then, during the project we conducted some conference calls where all hospitals participated and we feel that these meetings enhanced the communication among the hospitals. This was confirmed when one hospital was in the process of working on pulling the extract needed for the LOINC mapping and had a very short time to do so. To expedite the process, it contacted another hospital with the same laboratory information system to request the script they used for the extract. This resulted in an opportunity for both hospitals to discuss other related topics and the future development of an information exchange.
LOINC Mapping: 3M’s LOINC consultant suggested the following: “As a vendor/consultant who implements vocabulary standards with clients who instigated the project themselves, our usual presentation templates didn’t educate and motivate all five sites to the level we prefer to operate at. There were multiple introductions made to some of the same sites, with different staff coverage. Only 3/5 of the sites completed the vocabulary mapping stage in the expected timeframe. “
It is important to be sensitive to data security and the liability of hospitals in the case of data breach.
Data specifications must be clear: It is important to specify the format required for each of the requested fields. The AHCA Hospital Inpatient Data document provides all of the details and the answers to these issues (See Appendix 6). We included this document in the first recruitment meeting that was held almost a year or more before hospital teams started completing the tasks of this project. By that time, some hospitals had not yet identified the team members who would be working on this project. It would have been helpful if the project team had resent the document to all hospitals along with the data specification spreadsheet, where the content of each column was specified.
We experienced delays with one hospital, because the patient identifiers supplied with the laboratory data did not match those in the inpatient file. The billing number used by the hospital is modified when reporting the administrative data. The Patient ID did not match the hospital’s billing number used in the laboratory reporting because the first four digits needed to be removed, and the date of admission added at the end of a unique billing number.
Ensure that the data are available: One of the hospitals changed out its laboratory information system in 2008 and could not extract data from 2007. The inpatient data from this hospital did not match the laboratory data and was not used.
Transfer of data: Software applications (Excel, delimited test files, etc) and file sizes must be taken into consideration to avoid technical problems and delays.
Key Characteristics that Led to a Successful Participation.

Adding Clinical Data to Statewide Administrative Data Final Report Page 28
The success of this project was due to working with the right people and maintaining ongoing communications with all members of the project. We had tremendous commitment from the participating hospitals and support from AHCA and 3M HIS. The hospitals working with us found the project interesting and useful for their future laboratory reporting. Once all the legal issues were ironed out for contacts and data exchange, and we received the go-ahead with the project, all of the teams came together to complete the project in a timely fashion. One hospital system indicated that having a Master Patient Index for all of its hospitals in a single lab system, centralized support from the lab system and open data base connectivity with the lab system database were the key for its successful participation.
In summary, a major determinant of the success of this pilot project came from the flexibility, collaboration, cooperation, dedication, perseverance, and coordination of all parties involved in the project. We hope the project develops into an on-going data feed to help further assess how clinical data can be used to improve the quality of health care for all Floridians.

Adding Clinical Data to Statewide Administrative Data Final Report Page 29
Appendices