ADDENDUM TO THE HEALTH INSURANCE … · HEALTH INSURANCE MARKETPLACES 2016 OPEN ENROLLMENT PERIOD:...
81
Department of Health and Human Services Office of the Assistant Secretary for Planning and Evaluation http://aspe.hhs.gov ASPE ISSUE BRIEF ADDENDUM TO THE HEALTH INSURANCE MARKETPLACES 2016 OPEN ENROLLMENT PERIOD: FINAL ENROLLMENT REPORT For the period: November 1, 2015 – February 1, 2016 1 March 11, 2016. This Addendum contains detailed State-level tables highlighting cumulative enrollment-related information for the Health Insurance Marketplaces (Marketplaces) during the 2016 Open Enrollment period for all 50 states and the District of Columbia (based on data for the period 11- 1-15 to 2-1-16). 2 These tables include data for the 38 states that are using the HealthCare.gov enrollment and eligibility platform for the 2016 coverage year (HealthCare.gov states), as well as for the 13 State-Based Marketplaces (SBMs) that are using their own Marketplace platforms for the 2016 coverage year. LIST OF TABLES Appendix C: State-Level Tables – States Using the HealthCare.gov Eligibility and Enrollment Platform C1 – Marketplace Plan Selection by Enrollment Type in States Using the HealthCare.gov Eligibility and Enrollment Platform, By State Page 3 C2 – Plan Switching by Active Reenrollees Who Selected Plans Through the Marketplaces in States Using the HealthCare.gov Eligibility and Enrollment Platform, By State Page 6 C3 - Total Completed Applications and Individuals Who Completed Applications in States Using the HealthCare.gov Eligibility and Enrollment Platform, By State Page 9 C4 - Total Marketplace Eligibility Determinations, and Marketplace Plan Selections in States Using the HealthCare.gov Eligibility and Enrollment Platform, By State Page 12 1 For purposes of this Enrollment Report, an effort was made to align the reporting periods for the HealthCare.gov states and SBMs using their own Marketplace platforms with the reporting periods for the data that were included in the Week 13 CMS Marketplace Enrollment Snapshot (which can be accessed at https://www.cms.gov/Newsroom/MediaReleaseDatabase/Fact- sheets/2016-Fact-sheets-items/2016-02-04.html). Most of the data in this report are for the 11-1-15 to 2-1-16 with the following exception: the data for 9 SBMs that are using their own Marketplace platforms (California, District of Columbia, Idaho, Kentucky, Maryland, New York, Rhode Island, Vermont, and Washington) are for the 11-1-15 to 1-31-16 reporting period. 2 The full Final Marketplace Enrollment Report for the 2016 Open Enrollment Period can be accessed at https://aspe.hhs.gov/pdf-report/health-insurance-marketplaces-2016-open-enrollment-period-final-enrollment-report.
Transcript of ADDENDUM TO THE HEALTH INSURANCE … · HEALTH INSURANCE MARKETPLACES 2016 OPEN ENROLLMENT PERIOD:...

Department of Health and Human Services Office of the Assistant Secretary for Planning and Evaluation
http://aspe.hhs.gov
ASPE ISSUE BRIEF
ADDENDUM TO THE
HEALTH INSURANCE MARKETPLACES 2016 OPEN ENROLLMENT PERIOD:
FINAL ENROLLMENT REPORT
For the period: November 1, 2015 – February 1, 20161
March 11, 2016.
This Addendum contains detailed State-level tables highlighting cumulative enrollment-related
information for the Health Insurance Marketplaces (Marketplaces) during the 2016 Open
Enrollment period for all 50 states and the District of Columbia (based on data for the period 11-
1-15 to 2-1-16).2
These tables include data for the 38 states that are using the HealthCare.gov
enrollment and eligibility platform for the 2016 coverage year (HealthCare.gov states), as well as
for the 13 State-Based Marketplaces (SBMs) that are using their own Marketplace platforms for
the 2016 coverage year.
LIST OF TABLES
Appendix C: State-Level Tables – States Using the HealthCare.gov Eligibility and
Enrollment Platform
C1 – Marketplace Plan Selection by Enrollment Type in States
Using the HealthCare.gov Eligibility and Enrollment Platform, By
State
Page 3
C2 – Plan Switching by Active Reenrollees Who Selected Plans
Through the Marketplaces in States Using the HealthCare.gov
Eligibility and Enrollment Platform, By State
Page 6
C3 - Total Completed Applications and Individuals Who Completed
Applications in States Using the HealthCare.gov Eligibility and
Enrollment Platform, By State
Page 9
C4 - Total Marketplace Eligibility Determinations, and Marketplace
Plan Selections in States Using the HealthCare.gov Eligibility and
Enrollment Platform, By State
Page 12
1 For purposes of this Enrollment Report, an effort was made to align the reporting periods for the HealthCare.gov states and
SBMs using their own Marketplace platforms with the reporting periods for the data that were included in the Week 13 CMS
Marketplace Enrollment Snapshot (which can be accessed at https://www.cms.gov/Newsroom/MediaReleaseDatabase/Fact-
sheets/2016-Fact-sheets-items/2016-02-04.html). Most of the data in this report are for the 11-1-15 to 2-1-16 with the following
exception: the data for 9 SBMs that are using their own Marketplace platforms (California, District of Columbia, Idaho,
Kentucky, Maryland, New York, Rhode Island, Vermont, and Washington) are for the 11-1-15 to 1-31-16 reporting period. 2 The full Final Marketplace Enrollment Report for the 2016 Open Enrollment Period can be accessed at
https://aspe.hhs.gov/pdf-report/health-insurance-marketplaces-2016-open-enrollment-period-final-enrollment-report.
https://www.cms.gov/Newsroom/MediaReleaseDatabase/Fact-sheets/2016-Fact-sheets-items/2016-02-04.html

ASPE Issue Brief Page 2
ASPE Office of Health Policy March 2016
C5 - Total Marketplace Plan Selections by Financial Assistance
Status in States Using the HealthCare.gov Eligibility and Enrollment
Platform, By State
Page 16
C6 - Total Marketplace Plan Selections by Age in States Using the
HealthCare.gov Eligibility and Enrollment Platform, By State
Page 18
C7 - Total Marketplace Plan Selections by Gender in States Using
the HealthCare.gov Eligibility and Enrollment Platform, By State
Page 20
C8 - Total Marketplace Plan Selections by Metal Level in States
Using the HealthCare.gov Eligibility and Enrollment Platform, By
State
Page 22
C9 - Total Marketplace Plan Selections by Race/Ethnicity in States
Using the HealthCare.gov Eligibility and Enrollment Platform, By
State
Page 25
C10 - Total Marketplace Plan Selections by Rural Status in States
Using the HealthCare.gov Eligibility and Enrollment Platform, By
State
Page 28
C11 - Total Marketplace Plan Selections by Household Income in
States Using the HealthCare.gov Eligibility and Enrollment
Platform, By State
Page 30
C12 - Total Marketplace Plan Selections by Gender and Age in
States Using the HealthCare.gov Eligibility and Enrollment
Platform, By State
Page 33
C13 - Total Marketplace Plan Selections by Gender and Metal Level
in States Using the HealthCare.gov Eligibility and Enrollment
Platform, By State
Page 37
C14 - Total Marketplace Plan Selections by Financial Assistance
Status and Metal Level in States Using the HealthCare.gov
Eligibility and Enrollment Platform, By State
Page 41
C15 - Total Marketplace Plan Selections by Metal Level and Age in
States Using the HealthCare.gov Eligibility and Enrollment
Platform, By State
Page 45
Appendix D: State-Level Tables – States Using Their Own Marketplace Platforms
D1 – Marketplace Plan Selection by Enrollment Type in States
Using Their Own Marketplace Platforms, By State, By State
Page 57
D2 - Total Completed Applications and Individuals Who Completed
Applications in States Using Their Own Marketplace Platforms, By
State
Page 59
D3 - Total Marketplace Eligibility Determinations, and Marketplace
Plan Selections in States Using Their Own Marketplace Platforms,
By State
Page 61
D4 - Total Marketplace Plan Selections by Financial Assistance
Status in States Using Their Own Marketplace Platforms, By State
Page 64
D5 - Total Marketplace Plan Selections by Age in States Using Their
Own Marketplace Platforms, By State
Page 66
D6 - Total Marketplace Plan Selections by Gender in States Using
Their Own Marketplace Platforms, By State
Page 68
D7 - Total Marketplace Plan Selections by Metal Level in States
Using Their Own Marketplace Platforms, By State
Page 70
Appendix E: Technical Notes Page 72

ASPE Issue Brief Page 3
ASPE Office of Health Policy March 2016
APPENDIX TABLE C1
Marketplace Plan Selection by Enrollment Type in States Using the HealthCare.gov Eligibility and Enrollment Platform, by State, 2016 (1)
11-1-15 to 2-1-16
Description
Total Number of Individuals
With 2016 Plan
Selections Through the Marketplaces
(2)
Distribution By Enrollment Type (3)
New Consumers
(4)
Consumers Reenrolling in Marketplace Coverage (5)
Total Reenrollees
Active Reenrollees
(6)
Automatic Reenrollees
(7)
Number % of Total % of Total % of Total % of Total
States Using the HealthCare.gov Eligibility and Enrollment Platform (8)
State-Based Marketplaces (SBMs) Using the HealthCare.gov eligibility and enrollment platform (9)
Hawaii (10) 14,564 99% 1% 1% 0% Nevada 88,145 47% 53% 41% 12% New Mexico 54,865 45% 55% 39% 16% Oregon 147,109 45% 55% 43% 12% Subtotal - SBMs Using the HealthCare.gov Platform 304,683 48% 52% 40% 12%
Federally-Facilitated Marketplace (FFM) States
Alabama 195,055 43% 57% 40% 17% Alaska 23,029 35% 65% 42% 23% Arizona 203,066 46% 54% 46% 8% Arkansas 73,648 37% 63% 34% 29% Delaware 28,256 33% 67% 42% 25% Florida 1,742,819 42% 58% 43% 15% Georgia 587,845 45% 55% 37% 18% Illinois 388,179 42% 58% 40% 18% Indiana 196,242 34% 66% 41% 26% Iowa 55,089 41% 59% 39% 21% Kansas 101,555 40% 60% 50% 10% Louisiana 214,148 48% 52% 33% 18% Maine 84,059 30% 70% 46% 24% Michigan 345,813 33% 67% 42% 25% Mississippi 108,672 46% 54% 28% 26% Missouri 290,201 40% 60% 41% 19% Montana 58,114 34% 66% 41% 25% Nebraska 87,835 38% 62% 48% 15% New Hampshire 55,183 32% 68% 40% 28% New Jersey 288,573 41% 59% 41% 17% North Carolina 613,487 39% 61% 43% 18% North Dakota 21,604 35% 65% 41% 24% Ohio 243,715 39% 61% 40% 21%

ASPE Issue Brief Page 4
ASPE Office of Health Policy March 2016
Marketplace Plan Selection by Enrollment Type in
States Using the HealthCare.gov Eligibility and Enrollment Platform, by State, 2016 (1) 11-1-15 to 2-1-16
Description
Total Number of Individuals
With 2016 Plan
Selections Through the Marketplaces
(2)
Distribution By Enrollment Type (3)
New Consumers
(4)
Consumers Reenrolling in Marketplace Coverage (5)
Total Reenrollees
Active Reenrollees
(6)
Automatic Reenrollees
(7)
Number % of Total % of Total % of Total % of Total
Oklahoma 145,329 42% 58% 37% 22% Pennsylvania 439,238 37% 63% 46% 17% South Carolina 231,849 46% 54% 43% 11% South Dakota 25,999 42% 58% 46% 12% Tennessee 268,867 48% 52% 39% 13% Texas 1,306,208 48% 52% 35% 17% Utah 175,637 42% 58% 46% 12% Virginia 421,897 37% 63% 42% 21% West Virginia 37,284 34% 66% 40% 26% Wisconsin 239,034 38% 62% 43% 20% Wyoming 23,770 44% 56% 44% 12% TOTAL – States Using the HealthCare.gov Eligibility and Enrollment Platform 9,625,982 42% 58% 41% 17%
Notes:
General: “N/A” means that the data for the respective metric are not yet available for a given state. Some numbers may not add
to totals due to rounding.
(1) Unless otherwise noted, the data in these tables represent cumulative data on the number of unique individuals who have
selected or have been automatically reenrolled into a 2016 Marketplace medical plan (with or without the first premium payment
having been received directly by the issuer). This is also known as pre-effectuated enrollment, because enrollment is not
considered effectuated until the first premium payment is made, and this data includes plan selections for which enrollment has
not yet been effectuated. Individuals who have cancelled or terminated their Marketplace plans are not included in the total
number of plan selections. These data also do not include: stand-alone dental plan selections; or individuals who may have
selected a 2015 Marketplace plan during the reporting period, as a result of having been eligible for a Special Enrollment Period
(SEP). This table only reflects data for the individual market Marketplaces. For additional technical notes, please refer to
Appendix E of this Addendum.
(2) For each metric, the data represent the total number of Individuals Determined Eligible to Enroll in a plan Through the
Marketplace who have selected or been automatically reenrolled into a 2016 Marketplace medical plan (with or without the first
premium payment having been received directly by the Marketplace or the issuer) during the reference period, excluding plan
selections with unknown data for a given metric. This is also known as pre-effectuated enrollment, because enrollment is not
considered effectuated until the first premium payment is made, and this data includes plan selections for which enrollment has
not yet been effectuated.
(3) “Distribution by Enrollment Type” represents the percentage of plan selections with available data on enrollment type that are
new consumers vs. consumers reenrolling in coverage through the Marketplaces.
(4) “New Consumers” are those individuals who selected a 2016 Marketplace medical plan (with or without the first premium
payment having been received directly by the issuer) as of the reporting date, and did not have a Marketplace plan selection as of
November 2015. Individuals who have cancelled or terminated their Marketplace plans are not included in the total number of
plan selections. These data also do not include: stand-alone dental plan selections; or individuals who may have selected a 2015
Marketplace plan during the reporting period, as a result of having been eligible for a Special Enrollment Period (SEP).

ASPE Issue Brief Page 5
ASPE Office of Health Policy March 2016
(5) “Consumers reenrolling in coverage through the Marketplaces” are those individuals who had a Marketplace plan selection as
of November 2015, and have either actively submitted a 2016 application and selected a 2016 Marketplace medical plan or have
been automatically reenrolled in coverage through the Marketplaces – with or without the first premium payment having been
received directly by the issuer). Individuals who have cancelled or terminated their Marketplace plans are not included in the
total number of plan selections. These data also do not include: stand-alone dental plan selections; or individuals who may have
selected a 2015 Marketplace plan during the reporting period, as a result of having been eligible for a Special Enrollment Period
(SEP). It is important to note that the reenrollment data in this report may include some individuals who were reenrolled in
coverage through the Marketplaces as of 2-1-16, but who may ultimately decide not to retain Marketplace coverage for the
remainder of 2016 (for example, because they have obtained coverage through another source such as an employer or
Medicaid/CHIP). The plan selection data in future reports will exclude these individuals (e.g., due to the subsequent cancellation
or termination of their coverage).
(6) Active Reenrollees are individuals who had a Marketplace plan selection as of November 2015, and return to the Marketplace
to select a new plan or actively renew their existing plan.
(7) Automatic Reenrollees are individuals who had a Marketplace plan selection as of November 2015, and retain coverage
without returning to the Marketplace and selecting a plan. A consumer was automatically reenrolled into their 2015 plan or a
crosswalked plan if they were enrolled in a Marketplace plan in 2015 and did not select a plan ahead of the 12-17-15 deadline. If
the consumer realized after the deadline that there was a better plan for their family or needed to update their information, the
consumer could make that change, and would at that point be considered as having actively selected a plan.
(8) For the HealthCare.gov states, the data on 2016 Marketplace plan selections includes data for new consumers and consumers
who are reenrolling in Marketplace coverage (including data for consumers who actively reenrolled in coverage through the
Marketplaces, and data for automatic reenrollees).
(9) Hawaii, Nevada, New Mexico, and Oregon are using the HealthCare.gov eligibility and enrollment platform for 2016.
(10) Hawaii changed Marketplace eligibility and enrollment platforms in 2016. Therefore, its 2016 Marketplace plan selections
are generally being classified as new consumers for operational enrollment and reporting purposes. However, a small number of
2016 plan selections in Hawaii may be classified as consumers reenrolling in coverage through the Marketplaces in cases where
an individual who had an active 2015 Marketplace plan selection in a HealthCare.gov state signs up for 2016 coverage in Hawaii.
Source: Centers for Medicare & Medicaid Services, as of 3-8-16.

ASPE Issue Brief Page 6
ASPE Office of Health Policy March 2016
APPENDIX TABLE C2
Plan Switching by Active Reenrollees Who Selected Plans Through the Marketplaces in States Using the HealthCare.gov Eligibility and Enrollment Platform, By State (1)
11-1-15 to 2-1-16
Description
Total Number of Individuals
With 2016 Plan
Selections Through the Marketplaces
(1)
Total Consumers
Reenrolling in Coverage
Through the Marketplaces
(2)
Total Active Reenrollees
(3)
Active Reenrollees
Who Switched
Plans (4)
Proportion Who Switched Plans:
Switchers as a % of Total Plan Selections
Switchers as a % of
Total Reenrollees
Switchers as a % of
Active Reenrollees
Number Number Number Number % % %
States Using the HealthCare.gov Eligibility and Enrollment Platform
State-Based Marketplaces (SBMs) Using the HealthCare.gov Eligibility and Enrollment Platform (5)
Hawaii (6) 14,564 85 85 85 1% 100% 100% Nevada 88,145 46,934 35,921 24,435 28% 52% 68% New Mexico 54,865 30,201 21,344 17,411 32% 58% 82% Oregon 147,109 80,992 63,500 38,056 26% 47% 60% Subtotal - SBMs Using the HealthCare.gov Platform 304,683 158,212 120,850 79,987 26% 51% 66%
Federally-Facilitated Marketplace (FFM) States
Alabama 195,055 111,028 77,214 48,290 25% 43% 63% Alaska 23,029 14,928 9,594 5,423 24% 36% 57% Arizona 203,066 109,605 93,218 80,434 40% 73% 86% Arkansas 73,648 46,186 25,161 10,285 14% 22% 41% Delaware 28,256 18,839 11,727 5,719 20% 30% 49% Florida 1,742,819 1,018,152 753,256 382,990 22% 38% 51% Georgia 587,845 321,373 216,944 141,010 24% 44% 65% Illinois 388,179 226,971 156,984 120,801 31% 53% 77% Indiana 196,242 130,315 80,156 54,593 28% 42% 68% Iowa 55,089 32,738 21,242 10,183 18% 31% 48% Kansas 101,555 60,661 50,743 38,412 38% 63% 76% Louisiana 214,148 111,083 71,490 43,613 20% 39% 61% Maine 84,059 59,214 38,808 11,295 13% 19% 29% Michigan 345,813 232,381 146,241 83,573 24% 36% 57% Mississippi 108,672 58,148 30,305 20,392 19% 35% 67% Missouri 290,201 173,941 118,875 70,882 24% 41% 60% Montana 58,114 38,342 23,696 12,063 21% 31% 51% Nebraska 87,835 54,746 41,784 20,383 23% 37% 49% New Hampshire 55,183 37,618 21,975 11,054 20% 29% 50% New Jersey 288,573 169,571 119,118 70,733 25% 42% 59% North Carolina 613,487 373,871 265,928 162,490 26% 43% 61% North Dakota 21,604 14,004 8,820 3,349 16% 24% 38% Ohio 243,715 148,833 97,462 53,696 22% 36% 55% Oklahoma 145,329 84,971 53,371 27,520 19% 32% 52%

ASPE Issue Brief Page 7
ASPE Office of Health Policy March 2016
Plan Switching by Active Reenrollees Who Selected Plans Through the Marketplaces in States Using the
HealthCare.gov Eligibility and Enrollment Platform, By State (1) 11-1-15 to 2-1-16
Description
Total Number of Individuals
With 2016 Plan
Selections Through the Marketplaces
(1)
Total Consumers
Reenrolling in Coverage
Through the Marketplaces
(2)
Total Active Reenrollees
(3)
Active Reenrollees
Who Switched
Plans (4)
Proportion Who Switched Plans:
Switchers as a % of Total Plan Selections
Switchers as a % of
Total Reenrollees
Switchers as a % of
Active Reenrollees
Number Number Number Number % % %
Pennsylvania 439,238 277,031 200,831 143,148 33% 52% 71% South Carolina 231,849 125,443 100,633 78,091 34% 62% 78% South Dakota 25,999 15,031 11,871 7,689 30% 51% 65% Tennessee 268,867 139,097 103,550 60,325 22% 43% 58% Texas 1,306,208 685,042 461,024 328,228 25% 48% 71% Utah 175,637 101,621 80,599 57,049 32% 56% 71% Virginia 421,897 264,565 177,779 74,602 18% 28% 42% West Virginia 37,284 24,793 15,002 6,469 17% 26% 43% Wisconsin 239,034 148,615 101,789 57,968 24% 39% 57% Wyoming 23,770 13,376 10,412 6,529 27% 49% 63% TOTAL – States Using the HealthCare.gov Eligibility and Enrollment Platform 9,625,982 5,600,345 3,918,452 2,389,268 25% 43% 61%
Notes:
General: “N/A” means that the data for the respective metric are not yet available for a given state. Some numbers may not add
to totals due to rounding.
(1) Unless otherwise noted, the data in these tables represent cumulative data on the number of unique individuals who have
selected or have been automatically reenrolled into a 2016 Marketplace medical plan (with or without the first premium payment
having been received directly by the issuer). This is also known as pre-effectuated enrollment, because enrollment is not
considered effectuated until the first premium payment is made, and this data includes plan selections for which enrollment has
not yet been effectuated. Individuals who have cancelled or terminated their Marketplace plans are not included in the total
number of plan selections. These data also do not include: stand-alone dental plan selections; or individuals who may have
selected a 2015 Marketplace plan during the reporting period, as a result of having been eligible for a Special Enrollment Period
(SEP). This table only reflects data for the individual market Marketplaces. For additional technical notes, please refer to
Appendix E of this Addendum.
(2) “Consumers reenrolling in coverage through the Marketplaces” are those individuals who had a Marketplace plan selection as
of November 2015, and have either actively submitted a 2016 application and selected a 2016 Marketplace medical plan or have
been automatically reenrolled in coverage through the Marketplaces – with or without the first premium payment having been
received directly by the issuer). Individuals who have cancelled or terminated their Marketplace plans are not included in the
total number of plan selections. These data also do not include: stand-alone dental plan selections; or individuals who may have
selected a 2016 Marketplace plan during the reporting period, as a result of having been eligible for a Special Enrollment Period
(SEP). It is important to note that the reenrollment data in this report may include some individuals who were reenrolled in
coverage through the Marketplaces as of 2-1-16, but who may ultimately decide not to retain Marketplace coverage for the
remainder of 2016 (for example, because they have obtained coverage through another source such as an employer or
Medicaid/CHIP). The plan selection data in future reports will exclude these individuals (e.g., due to the subsequent cancellation
or termination of their coverage).
(3) “Active reenrollees” are indviduals who had a Marketplace plan selection as of November 2015, and return to the
Marketplace to select a new plan or actively renew their existing plan.
(4) “Active reenrollees who switched plans” are active reenrollees who have not selected the same 2016 Marketplace plan as for
the 2015 coverage year, or a “crosswalked” plan that is offered by the same issuer as their 2015 plan.

ASPE Issue Brief Page 8
ASPE Office of Health Policy March 2016
(5) Hawaii, Nevada, New Mexico, and Oregon are using the HealthCare.gov eligibility and enrollment platform for 2016.
(6) Hawaii changed Marketplace eligibility and enrollment platforms in 2016. Therefore, its 2016 Marketplace plan selections
are generally being classified as new consumers for operational enrollment and reporting purposes. However, a small number of
2016 plan selections in Hawaii may be classified as consumers reenrolling in coverage through the Marketplaces in cases where
an individual who had an active 2015 Marketplace plan selection in a HealthCare.gov state signs up for 2016 coverage in Hawaii.
Source: Centers for Medicare & Medicaid Services, as of 3-8-16.

ASPE Issue Brief Page 9
ASPE Office of Health Policy March 2016
APPENDIX TABLE C3
Total Completed Applications and Individuals Who Completed Applications in States Using the HealthCare.gov Eligibility and Enrollment Platform, By State, 2016 (1)
11-1-15 to 2-1-16
Description
Total Number of Completed Applications for 2016 Coverage
(2)
Total Individuals Applying for 2016 Coverage in Completed Applications
(3)
Number Number
States Using the HealthCare.gov Eligibility and Enrollment Platform
State-Based Marketplaces (SBMs) Using the HealthCare.gov Eligibility and Enrollment Platform (4)
Hawaii 19,170 25,300
Nevada 93,255 134,454
New Mexico 58,918 78,489
Oregon 165,342 229,205
Subtotal - SBMs Using the HealthCare.gov eligibility and enrollment platform 336,685 467,448
Federally-Facilitated Marketplace (FFM) States
Alabama 211,341 272,034
Alaska 26,089 35,127
Arizona 182,029 287,984
Arkansas 91,956 126,959
Delaware 28,366 39,361
Florida 1,713,988 2,181,930
Georgia 585,212 784,389
Illinois 407,306 553,060
Indiana 199,252 275,979
Iowa 61,545 81,846
Kansas 98,116 140,812
Louisiana 243,919 285,618
Maine 73,472 102,757
Michigan 341,924 468,629

ASPE Issue Brief Page 10
ASPE Office of Health Policy March 2016
Total Completed Applications and Individuals Who Completed Applications in States Using the HealthCare.gov Eligibility and Enrollment Platform, By State, 2016 (1)
11-1-15 to 2-1-16
Description
Total Number of Completed Applications for 2016 Coverage
(2)
Total Individuals Applying for 2016 Coverage in Completed Applications
(3)
Number Number
Mississippi 126,683 150,497
Missouri 284,325 381,358
Montana 60,656 83,817
Nebraska 76,178 113,665
New Hampshire 51,164 70,058
New Jersey 310,964 426,976
North Carolina 591,373 769,370
North Dakota 17,890 28,956
Ohio 266,667 367,291
Oklahoma 134,986 191,356
Pennsylvania 465,041 616,498
South Carolina 240,072 303,914
South Dakota 23,230 34,633
Tennessee 310,761 415,964
Texas 1,237,869 1,818,689
Utah 126,623 230,390
Virginia 380,421 540,999
West Virginia 40,132 53,051
Wisconsin 233,844 303,545
Wyoming 21,113 31,559
TOTAL – States Using the HealthCare.gov Eligibility and Enrollment Platform 9,601,192 13,036,519
Notes:
General: “N/A” means that the data for the respective metric are not yet available for a given state. Some numbers may not add
to totals due to rounding.

ASPE Issue Brief Page 11
ASPE Office of Health Policy March 2016
(1) Unless otherwise noted, the data in this table represent cumulative Marketplace enrollment-related activity for 11-1-15 to 2-1-
16. These data also do not include any enrollment-related activity relating to individuals who may have applied for and/or
selected a 2015 Marketplace plan during the reporting period, as a result of having been eligible for a Special Enrollment Period
(SEP). This table only reflects data for the individual market Marketplaces. For additional technical notes, please refer to
Appendix E of this Addendum.
(2) “Completed Applications for 2016 Coverage” represents the total number of electronic and paper applications that were
submitted to the Marketplace during the reference period with sufficient information to begin performing eligibility
determinations for enrollment in a plan through the Marketplace and, if appropriate, sufficient information to begin performing
eligibility determinations for advance payments of the premium tax credit and cost-sharing reductions, and eligibility assessments
or determinations for Medicaid and CHIP.
(3) “Individuals Applying for 2016 Coverage in Completed Applications” represents the total number of individuals included in
Completed Applications that were submitted to the individual market Marketplaces during the applicable reference period. This
number does not include individuals applying through the SHOP.
(4) Hawaii, Nevada, New Mexico, and Oregon are using the HealthCare.gov eligibility and enrollment platform for 2016.
Source: Centers for Medicare & Medicaid Services, as of 3-8-16.

ASPE Issue Brief Page 12
ASPE Office of Health Policy March 2016
APPENDIX TABLE C4
Total Marketplace Eligibility Determinations, and Marketplace Plan Selections in States Using the HealthCare.gov Eligibility and Enrollment Platform, By State, 2016 (1)
11-1-15 to 2-1-16
State Name
Number of Individuals Determined Eligible to Enroll through the
Marketplace for 2016 Coverage
Number of Individuals
Determined or Assessed Eligible
for Medicaid / CHIP by the Marketplace
(4)
Number of Individuals With
2016 Plan Selections Through
the Marketplaces
(5)
Total Eligible to Enroll in a
Marketplace Plan (2)
Eligible to Enroll in a Marketplace Plan
with Financial Assistance
(3)
Number Number Number Number
States Using the HealthCare.gov Eligibility and Enrollment Platform
State-Based Marketplaces (SBMs) Using the HealthCare.gov Eligibility and Enrollment Platform (6)
Hawaii 17,517 13,885 7,119 14,564
Nevada 107,525 89,716 21,007 88,145
New Mexico 64,725 47,180 12,933 54,865
Oregon 170,075 124,080 58,055 147,109
Subtotal - SBMs Using the HealthCare.gov Platform 359,842 274,861 99,114 304,683
Federally-Facilitated Marketplace (FFM) States
Alabama 251,875 192,623 8,542 195,055
Alaska 26,682 21,820 4,249 23,029
Arizona 245,739 184,377 40,644 203,066
Arkansas 88,605 72,700 19,352 73,648
Delaware 33,017 25,694 6,045 28,256
Florida 2,068,686 1,755,063 103,869 1,742,819
Georgia 724,847 563,430 56,128 587,845
Illinois 458,832 346,850 91,368 388,179
Indiana 227,850 180,460 46,953 196,242
Iowa 66,088 53,682 13,756 55,089
Kansas 129,220 95,410 10,978 101,555
Louisiana 270,608 211,291 12,862 214,148
ASPE Issue Brief Page 13
ASPE Office of Health Policy March 2016
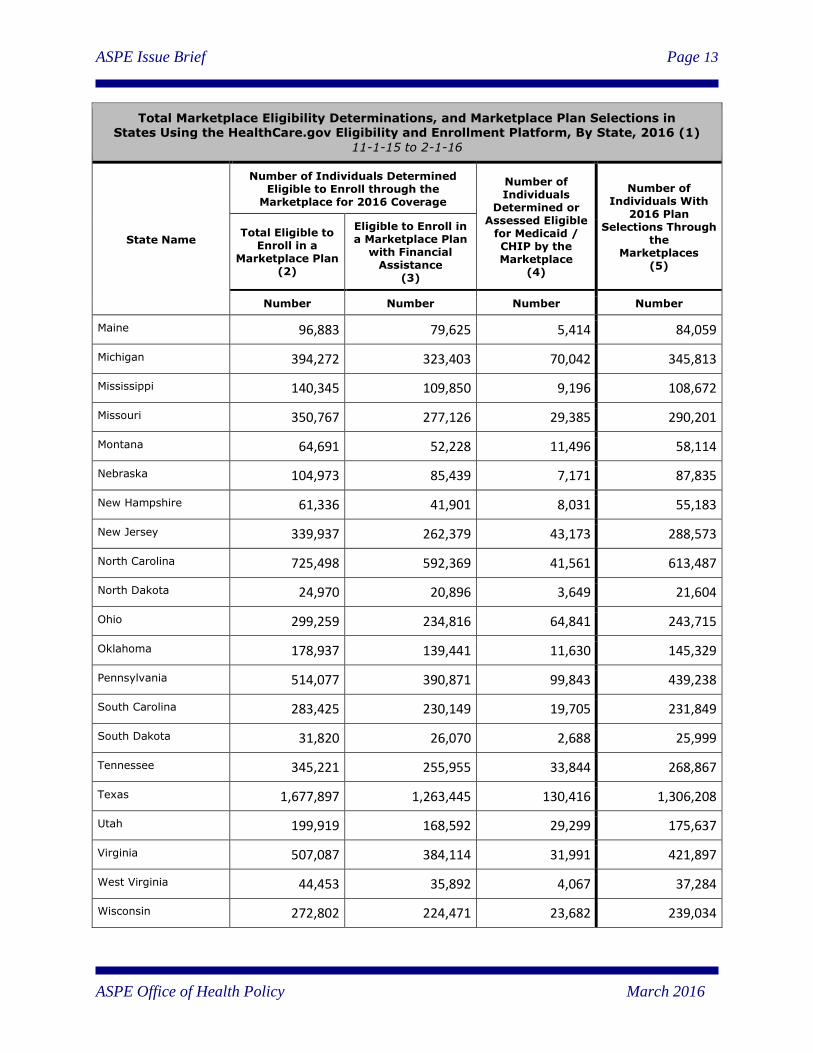
Total Marketplace Eligibility Determinations, and Marketplace Plan Selections in States Using the HealthCare.gov Eligibility and Enrollment Platform, By State, 2016 (1)
11-1-15 to 2-1-16
State Name
Number of Individuals Determined Eligible to Enroll through the
Marketplace for 2016 Coverage
Number of Individuals
Determined or Assessed Eligible
for Medicaid / CHIP by the Marketplace
(4)
Number of Individuals With
2016 Plan Selections Through
the Marketplaces
(5)
Total Eligible to Enroll in a
Marketplace Plan (2)
Eligible to Enroll in a Marketplace Plan
with Financial Assistance
(3)
Number Number Number Number
Maine 96,883 79,625 5,414 84,059
Michigan 394,272 323,403 70,042 345,813
Mississippi 140,345 109,850 9,196 108,672
Missouri 350,767 277,126 29,385 290,201
Montana 64,691 52,228 11,496 58,114
Nebraska 104,973 85,439 7,171 87,835
New Hampshire 61,336 41,901 8,031 55,183
New Jersey 339,937 262,379 43,173 288,573
North Carolina 725,498 592,369 41,561 613,487
North Dakota 24,970 20,896 3,649 21,604
Ohio 299,259 234,816 64,841 243,715
Oklahoma 178,937 139,441 11,630 145,329
Pennsylvania 514,077 390,871 99,843 439,238
South Carolina 283,425 230,149 19,705 231,849
South Dakota 31,820 26,070 2,688 25,999
Tennessee 345,221 255,955 33,844 268,867
Texas 1,677,897 1,263,445 130,416 1,306,208
Utah 199,919 168,592 29,299 175,637
Virginia 507,087 384,114 31,991 421,897
West Virginia 44,453 35,892 4,067 37,284
Wisconsin 272,802 224,471 23,682 239,034

ASPE Issue Brief Page 14
ASPE Office of Health Policy March 2016
Total Marketplace Eligibility Determinations, and Marketplace Plan Selections in States Using the HealthCare.gov Eligibility and Enrollment Platform, By State, 2016 (1)
11-1-15 to 2-1-16
State Name
Number of Individuals Determined Eligible to Enroll through the
Marketplace for 2016 Coverage
Number of Individuals
Determined or Assessed Eligible
for Medicaid / CHIP by the Marketplace
(4)
Number of Individuals With
2016 Plan Selections Through
the Marketplaces
(5)
Total Eligible to Enroll in a
Marketplace Plan (2)
Eligible to Enroll in a Marketplace Plan
with Financial Assistance
(3)
Number Number Number Number
Wyoming 29,241 23,806 779 23,770
TOTAL – States Using the HealthCare.gov Eligibility and Enrollment Platform 11,639,701 9,201,099 1,195,763 9,625,982
Notes:
General: “N/A” means that the data for the respective metric are not yet available for a given state. Some numbers may not add
to totals due to rounding.
(1) Unless otherwise noted, the data in this table represent cumulative Marketplace enrollment-related activity for 11-1-15 to 2-1-
16. These data also do not include any enrollment-related activity relating to individuals who may have applied for and/or
selected a 2015 Marketplace plan during the reporting period, as a result of having been eligible for a Special Enrollment Period
(SEP). This table only reflects data for the individual market Marketplaces. For additional technical notes, please refer to
Appendix E of this Addendum.
(2) “Individuals Determined Eligible to Enroll in a Plan Through the Marketplace” (i.e., enrollment through the Marketplaces for
a 2016 Marketplace plan) represents the total number of individuals for whom a Completed Application has been received for the
2016 plan year (including any individuals with active 2015 Marketplace enrollments who returned to the Marketplaces and
updated their information), and who are determined to be eligible for plan enrollment through the Marketplaces during the
reference period, regardless of whether they qualify for advance payments of the premium tax credit or cost-sharing reductions.
These individuals may or may not have enrolled in coverage by the end of the reference period. Individuals who have been
determined or assessed eligible for Medicaid or CHIP are not included. Note: This number only includes data for individuals
who applied for 2016 Marketplace coverage in completed applications. It does not include individuals who were automatically
reenrolled. Thus, the number determined eligible for 2016 Coverage may be lower than the total number of 2015 plan selections
(which includes reenrollees).
(3) “Individuals Determined Eligible to Enroll in a Plan Through the Marketplace with Financial Assistance” (i.e., enrollment
through the Marketplace for a 2016 Marketplace plan with Financial Assistance) represents the total number of individuals
determined eligible to enroll through the Marketplace in a Marketplace plan who qualify for an advance premium tax credit
(APTC), with or without a cost-sharing reduction (CSR) for the 2016 plan year (including any individuals with active 2015
Marketplace enrollments who returned to the Marketplace and updated their information). These individuals may or may not
have enrolled in coverage by the end of the reference period. Note: This number only includes data for individuals who applied
for 2016 Marketplace coverage in completed applications. It does not include individuals who were automatically reenrolled.
Thus, the number determined eligible for 2016 Coverage may be lower than the total number of 2015 plan selections with
financial assistance (which includes automatic reenrollees).
(4) “Individuals Determined or Assessed Eligible for Medicaid / CHIP by the Marketplace” represents the number of individuals
who have been determined or assessed by the Marketplace as eligible for Medicaid or CHIP based on their modified adjusted
gross income (MAGI). In some states, completed applications for individuals, whom the Marketplace has assessed as potentially
eligible for Medicaid or CHIP, based on MAGI, are transferred to the relevant state agency for a final eligibility determination.
In these “assessment states” the data include those accounts where a final decision is pending. In other states, the Marketplace
has been delegated the final Medicaid/CHIP eligibility determination responsibility for these individuals. Thus, this data element
includes FFM determinations and assessments, regardless of the state Medicaid/CHIP agency’s final eligibility determination, if
applicable. These data may vary from accounts transferred via “flat file” to states by the FFM. Quality assurance continues on
Medicaid assessments and determinations. Note: Marketplace Medicaid/CHIP eligibility determination and assessment data in

ASPE Issue Brief Page 15
ASPE Office of Health Policy March 2016
this report cannot be added to eligibility determination data in the most recent monthly Medicaid and CHIP Applications,
Eligibility Determinations, and Enrollment report (available on Medicaid.gov) which covers data through October 2015. In the
Marketplaces, some of the individuals assessed or determined eligible for Medicaid or CHIP by the Marketplace and reported in
this report may also be reported in the monthly Medicaid and CHIP Applications, Eligibility Determinations, and Enrollment
Report when the state has made an eligibility determination based on the information provided by the Marketplace. Total
Medicaid/CHIP enrollment is reported in the monthly Medicaid and CHIP Applications, Eligibility Determinations, and
Enrollment Report, and is a point-in-time count of total enrollment in the Medicaid and CHIP programs at the end of the monthly
reporting period.
(5) “Individuals With 2016 Marketplace Plan Selections” represents the total number of individuals determined eligible to enroll
in a plan through the Marketplace” who have selected or have been automatically reenrolled into a 2016 Marketplace medical
plan (with or without the first premium payment having been received directly by the issuer) during the reference period. This is
also known as pre-effectuated enrollment, because enrollment is not considered effectuated until the first premium payment is
made, and this data includes plan selections for which enrollment has not yet been effectuated. Individuals who have cancelled
or terminated their Marketplace plans are not included in the total number of plan selections. These data also do not include:
stand-alone dental plan selections; or individuals who may have selected a 2015 Marketplace plan during the reporting period, as
a result of having been eligible for a Special Enrollment Period (SEP).
(6) Hawaii, Nevada, New Mexico, and Oregon are using the HealthCare.gov eligibility and enrollment platform for 2016.
Source: Centers for Medicare & Medicaid Services, as of 3-8-16.

ASPE Issue Brief Page 16
ASPE Office of Health Policy March 2016
APPENDIX TABLE C5
Marketplace Plan Selections by Financial Assistance Status in States Using the HealthCare.gov Eligibility and Enrollment Platform, By State (1)
11-1-15 to 2-1-16
Description
Total Number of Individuals With
2016 Plan Selections
Through the Marketplaces
(2)
Plan Selections With Available
Data on Financial Assistance Status (3)
By Financial Assistance Status (4) (% of Available Data, Excluding Unknown)
With Financial
Assistance
Without Financial
Assistance
With APTC
(non-add)
With CSR
(non-add)
Number Number % % % %
States Using the HealthCare.gov Eligibility and Enrollment Platform (5)
State-Based Marketplaces (SBMs) Using the HealthCare.gov Eligibility and Enrollment Platform (6)
Hawaii 14,564 14,564 82% 18% 81% 61% Nevada 88,145 88,145 88% 12% 87% 58% New Mexico 54,865 54,865 70% 30% 68% 44% Oregon 147,109 147,109 72% 28% 71% 39% Subtotal - SBMs Using the HealthCare.gov Platform 304,683 304,683 77% 23% 76% 46%
Federally-Facilitated Marketplace (FFM) States
Alabama 195,055 195,055 89% 11% 89% 73% Alaska 23,029 23,029 87% 13% 86% 42% Arizona 203,066 203,066 75% 25% 74% 51% Arkansas 73,648 73,648 88% 12% 87% 55% Delaware 28,256 28,256 82% 18% 82% 43% Florida 1,742,819 1,742,819 91% 9% 91% 71% Georgia 587,845 587,845 87% 13% 86% 65% Illinois 388,179 388,179 76% 24% 75% 45% Indiana 196,242 196,242 81% 19% 81% 45% Iowa 55,089 55,089 85% 15% 85% 51% Kansas 101,555 101,555 83% 17% 82% 57% Louisiana 214,148 214,148 89% 11% 89% 61% Maine 84,059 84,059 87% 13% 87% 56% Michigan 345,813 345,813 84% 16% 83% 51% Mississippi 108,672 108,672 90% 10% 90% 74% Missouri 290,201 290,201 87% 13% 87% 57% Montana 58,114 58,114 83% 17% 83% 45% Nebraska 87,835 87,835 88% 12% 88% 51% New Hampshire 55,183 55,183 67% 33% 66% 35% New Jersey 288,573 288,573 80% 20% 80% 50% North Carolina 613,487 613,487 89% 11% 89% 64% North Dakota 21,604 21,604 86% 14% 85% 45% Ohio 243,715 243,715 81% 19% 80% 44% Oklahoma 145,329 145,329 85% 15% 84% 60% Pennsylvania 439,238 439,238 77% 23% 76% 51%

ASPE Issue Brief Page 17
ASPE Office of Health Policy March 2016
Marketplace Plan Selections by Financial Assistance Status in States Using the HealthCare.gov Eligibility and Enrollment Platform, By State (1)
11-1-15 to 2-1-16
Description
Total Number of Individuals With
2016 Plan Selections
Through the Marketplaces
(2)
Plan Selections With Available
Data on Financial Assistance Status (3)
By Financial Assistance Status (4) (% of Available Data, Excluding Unknown)
With Financial
Assistance
Without Financial
Assistance
With APTC
(non-add)
With CSR
(non-add)
Number Number % % % %
South Carolina 231,849 231,849 89% 11% 89% 71% South Dakota 25,999 25,999 89% 11% 88% 60% Tennessee 268,867 268,867 85% 15% 85% 58% Texas 1,306,208 1,306,208 84% 16% 84% 57% Utah 175,637 175,637 87% 13% 86% 63% Virginia 421,897 421,897 82% 18% 82% 56% West Virginia 37,284 37,284 86% 14% 85% 51% Wisconsin 239,034 239,034 84% 16% 84% 54% Wyoming 23,770 23,770 90% 10% 90% 54% TOTAL – States Using the HealthCare.gov Eligibility and Enrollment Platform 9,625,982 9,625,982 85% 15% 85% 59%
Notes:
General: “N/A” means that the data for the respective metric are not yet available for a given state. Some numbers may not add
to totals due to rounding.
(1) Unless otherwise noted, the data in these tables represent cumulative data on the number of unique individuals who have
selected or have been automatically reenrolled into a 2016 Marketplace medical plan (with or without the first premium payment
having been received directly by the issuer). This is also known as pre-effectuated enrollment, because enrollment is not
considered effectuated until the first premium payment is made, and this data includes plan selections for which enrollment has
not yet been effectuated. Individuals who have cancelled or terminated their Marketplace plans are not included in the total
number of plan selections. These data also do not include: stand-alone dental plan selections; or individuals who may have
selected a 2015 Marketplace plan during the reporting period, as a result of having been eligible for a Special Enrollment Period
(SEP). This table only reflects data for the individual market Marketplaces. For additional technical notes, please refer to
Appendix E of this Addendum.
(2) For each metric, the data represent the total number of Individuals Determined Eligible to Enroll in a plan Through the
Marketplace who have selected or been automatically reenrolled into a 2016 Marketplace medical plan (with or without the first
premium payment having been received directly by the Marketplace or the issuer) during the reference period, excluding plan
selections with unknown data for a given metric. This is also known as pre-effectuated enrollment, because enrollment is not
considered effectuated until the first premium payment is made, and this data includes plan selections for which enrollment has
not yet been effectuated.
(3) In some cases, the data for certain characteristics of Marketplace plan selections are not yet available. For this reason, for
each metric, we have calculated the comparable percentages based on the number of plan selections with known data for that
metric.
(4) Data on Marketplace plan selections with financial assistance includes plan selections for individuals who are receiving a
premium tax credit and/or cost-sharing subsidy.
(5) For the HealthCare.gov states, the data on 2016 Marketplace plan selections includes data for new consumers and consumers
who are actively reenrolling in Marketplace coverage (including data for consumers who actively reenrolled in coverage through
the Marketplaces, and data for automatic reenrollees).
(6) Hawaii, Nevada, New Mexico, and Oregon are using the HealthCare.gov eligibility and enrollment platform for 2016.
Source: Centers for Medicare & Medicaid Services, as of 3-8-16.
ASPE Issue Brief Page 18
ASPE Office of Health Policy March 2016
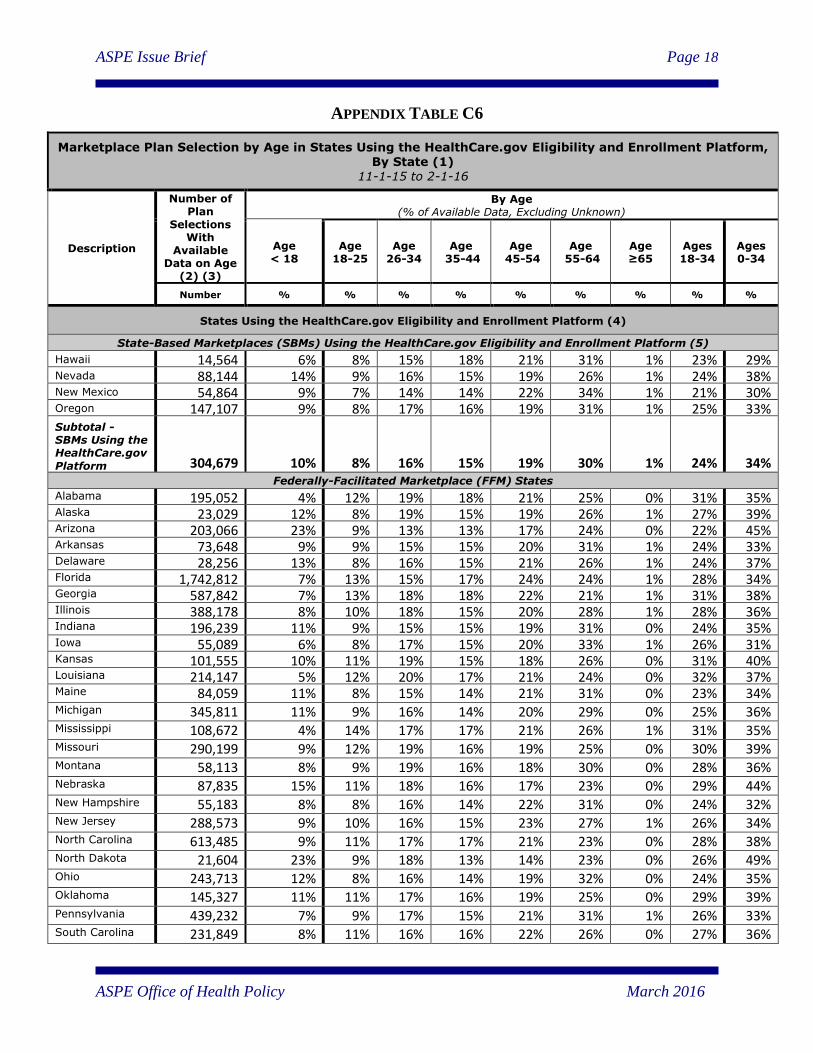
APPENDIX TABLE C6
Marketplace Plan Selection by Age in States Using the HealthCare.gov Eligibility and Enrollment Platform, By State (1)
11-1-15 to 2-1-16
Description
Number of Plan
Selections With
Available Data on Age
(2) (3)
By Age (% of Available Data, Excluding Unknown)
Age < 18
Age 18-25
Age 26-34
Age 35-44
Age 45-54
Age 55-64
Age ≥65
Ages 18-34
Ages 0-34
Number % % % % % % % % %
States Using the HealthCare.gov Eligibility and Enrollment Platform (4)
State-Based Marketplaces (SBMs) Using the HealthCare.gov Eligibility and Enrollment Platform (5)
Hawaii 14,564 6% 8% 15% 18% 21% 31% 1% 23% 29% Nevada 88,144 14% 9% 16% 15% 19% 26% 1% 24% 38% New Mexico 54,864 9% 7% 14% 14% 22% 34% 1% 21% 30% Oregon 147,107 9% 8% 17% 16% 19% 31% 1% 25% 33% Subtotal - SBMs Using the HealthCare.gov
Platform 304,679 10% 8% 16% 15% 19% 30% 1% 24% 34% Federally-Facilitated Marketplace (FFM) States
Alabama 195,052 4% 12% 19% 18% 21% 25% 0% 31% 35% Alaska 23,029 12% 8% 19% 15% 19% 26% 1% 27% 39% Arizona 203,066 23% 9% 13% 13% 17% 24% 0% 22% 45% Arkansas 73,648 9% 9% 15% 15% 20% 31% 1% 24% 33% Delaware 28,256 13% 8% 16% 15% 21% 26% 1% 24% 37% Florida 1,742,812 7% 13% 15% 17% 24% 24% 1% 28% 34% Georgia 587,842 7% 13% 18% 18% 22% 21% 1% 31% 38% Illinois 388,178 8% 10% 18% 15% 20% 28% 1% 28% 36% Indiana 196,239 11% 9% 15% 15% 19% 31% 0% 24% 35% Iowa 55,089 6% 8% 17% 15% 20% 33% 1% 26% 31% Kansas 101,555 10% 11% 19% 15% 18% 26% 0% 31% 40% Louisiana 214,147 5% 12% 20% 17% 21% 24% 0% 32% 37% Maine 84,059 11% 8% 15% 14% 21% 31% 0% 23% 34% Michigan 345,811 11% 9% 16% 14% 20% 29% 0% 25% 36% Mississippi 108,672 4% 14% 17% 17% 21% 26% 1% 31% 35% Missouri 290,199 9% 12% 19% 16% 19% 25% 0% 30% 39% Montana 58,113 8% 9% 19% 16% 18% 30% 0% 28% 36% Nebraska 87,835 15% 11% 18% 16% 17% 23% 0% 29% 44% New Hampshire 55,183 8% 8% 16% 14% 22% 31% 0% 24% 32% New Jersey 288,573 9% 10% 16% 15% 23% 27% 1% 26% 34% North Carolina 613,485 9% 11% 17% 17% 21% 23% 0% 28% 38% North Dakota 21,604 23% 9% 18% 13% 14% 23% 0% 26% 49% Ohio 243,713 12% 8% 16% 14% 19% 32% 0% 24% 35% Oklahoma 145,327 11% 11% 17% 16% 19% 25% 0% 29% 39% Pennsylvania 439,232 7% 9% 17% 15% 21% 31% 1% 26% 33% South Carolina 231,849 8% 11% 16% 16% 22% 26% 0% 27% 36%
ASPE Issue Brief Page 19
ASPE Office of Health Policy March 2016
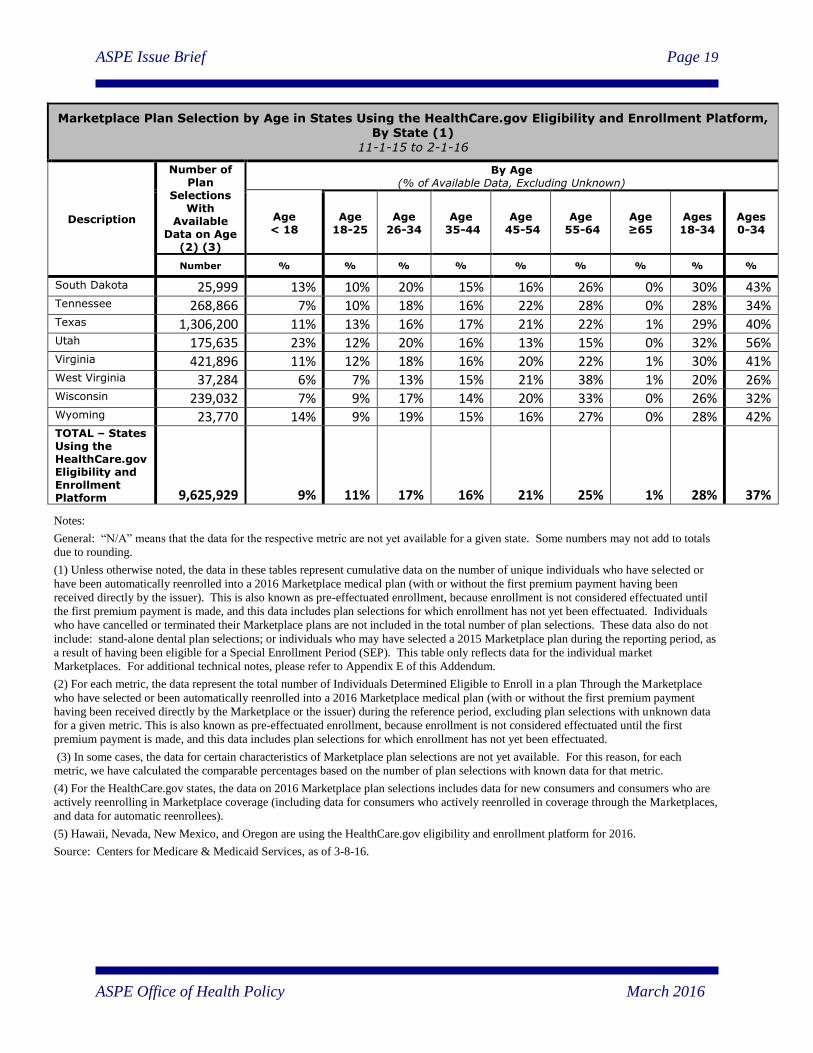
Marketplace Plan Selection by Age in States Using the HealthCare.gov Eligibility and Enrollment Platform, By State (1)
11-1-15 to 2-1-16
Description
Number of Plan
Selections With
Available Data on Age
(2) (3)
By Age (% of Available Data, Excluding Unknown)
Age < 18
Age 18-25
Age 26-34
Age 35-44
Age 45-54
Age 55-64
Age ≥65
Ages 18-34
Ages 0-34
Number % % % % % % % % %
South Dakota 25,999 13% 10% 20% 15% 16% 26% 0% 30% 43% Tennessee 268,866 7% 10% 18% 16% 22% 28% 0% 28% 34% Texas 1,306,200 11% 13% 16% 17% 21% 22% 1% 29% 40% Utah 175,635 23% 12% 20% 16% 13% 15% 0% 32% 56% Virginia 421,896 11% 12% 18% 16% 20% 22% 1% 30% 41% West Virginia 37,284 6% 7% 13% 15% 21% 38% 1% 20% 26% Wisconsin 239,032 7% 9% 17% 14% 20% 33% 0% 26% 32% Wyoming 23,770 14% 9% 19% 15% 16% 27% 0% 28% 42% TOTAL – States Using the HealthCare.gov Eligibility and Enrollment Platform 9,625,929 9% 11% 17% 16% 21% 25% 1% 28% 37%
Notes:
General: “N/A” means that the data for the respective metric are not yet available for a given state. Some numbers may not add to totals
due to rounding.
(1) Unless otherwise noted, the data in these tables represent cumulative data on the number of unique individuals who have selected or
have been automatically reenrolled into a 2016 Marketplace medical plan (with or without the first premium payment having been
received directly by the issuer). This is also known as pre-effectuated enrollment, because enrollment is not considered effectuated until
the first premium payment is made, and this data includes plan selections for which enrollment has not yet been effectuated. Individuals
who have cancelled or terminated their Marketplace plans are not included in the total number of plan selections. These data also do not
include: stand-alone dental plan selections; or individuals who may have selected a 2015 Marketplace plan during the reporting period, as
a result of having been eligible for a Special Enrollment Period (SEP). This table only reflects data for the individual market
Marketplaces. For additional technical notes, please refer to Appendix E of this Addendum.
(2) For each metric, the data represent the total number of Individuals Determined Eligible to Enroll in a plan Through the Marketplace
who have selected or been automatically reenrolled into a 2016 Marketplace medical plan (with or without the first premium payment
having been received directly by the Marketplace or the issuer) during the reference period, excluding plan selections with unknown data
for a given metric. This is also known as pre-effectuated enrollment, because enrollment is not considered effectuated until the first
premium payment is made, and this data includes plan selections for which enrollment has not yet been effectuated.
(3) In some cases, the data for certain characteristics of Marketplace plan selections are not yet available. For this reason, for each
metric, we have calculated the comparable percentages based on the number of plan selections with known data for that metric.
(4) For the HealthCare.gov states, the data on 2016 Marketplace plan selections includes data for new consumers and consumers who are
actively reenrolling in Marketplace coverage (including data for consumers who actively reenrolled in coverage through the Marketplaces,
and data for automatic reenrollees).
(5) Hawaii, Nevada, New Mexico, and Oregon are using the HealthCare.gov eligibility and enrollment platform for 2016.
Source: Centers for Medicare & Medicaid Services, as of 3-8-16.

ASPE Issue Brief Page 20
ASPE Office of Health Policy March 2016
APPENDIX TABLE C7
Marketplace Plan Selection by Gender in States Using the HealthCare.gov Eligibility and Enrollment Platform, By State (1)
11-1-15 to 2-1-16
Description
Total Number of Individuals With
2016 Plan Selections
Through the Marketplaces (2)
Plan Selections With Available Data on Gender
(3)
By Gender (% of Available Data, Excluding Unknown)
Females Males
Number Number % %
States Using the HealthCare.gov Eligibility and Enrollment Platform (4)
State-Based Marketplaces (SBMs) Using the HealthCare.gov Eligibility and Enrollment Platform (5)
Hawaii 14,564 14,564 57% 43%
Nevada 88,145 88,145 54% 46%
New Mexico 54,865 54,865 54% 46%
Oregon 147,109 147,109 55% 45% Subtotal - SBMs Using the HealthCare.gov Platform 304,683 304,683 54% 46%
Federally-Facilitated Marketplace (FFM) States
Alabama 195,055 195,055 57% 43% Alaska 23,029 23,029 52% 48% Arizona 203,066 203,066 53% 47% Arkansas 73,648 73,648 54% 46% Delaware 28,256 28,256 54% 46% Florida 1,742,819 1,742,819 54% 46% Georgia 587,845 587,845 56% 44% Illinois 388,179 388,179 52% 48% Indiana 196,242 196,242 54% 46% Iowa 55,089 55,089 53% 47% Kansas 101,555 101,555 54% 46% Louisiana 214,148 214,148 57% 43% Maine 84,059 84,059 53% 47% Michigan 345,813 345,813 52% 48% Mississippi 108,672 108,672 58% 42% Missouri 290,201 290,201 54% 46% Montana 58,114 58,114 53% 47% Nebraska 87,835 87,835 53% 47% New Hampshire 55,183 55,183 53% 47% New Jersey 288,573 288,573 53% 47% North Carolina 613,487 613,487 55% 45% North Dakota 21,604 21,604 52% 48% Ohio 243,715 243,715 53% 47% Oklahoma 145,329 145,329 55% 45%

ASPE Issue Brief Page 21
ASPE Office of Health Policy March 2016
Marketplace Plan Selection by Gender in States Using the HealthCare.gov Eligibility and Enrollment Platform, By State (1)
11-1-15 to 2-1-16
Description
Total Number of Individuals With
2016 Plan Selections
Through the Marketplaces (2)
Plan Selections With Available Data on Gender
(3)
By Gender (% of Available Data, Excluding Unknown)
Females Males
Number Number % %
Pennsylvania 439,238 439,238 53% 47% South Carolina 231,849 231,849 56% 44% South Dakota 25,999 25,999 53% 47% Tennessee 268,867 268,867 53% 47% Texas 1,306,208 1,306,208 55% 45% Utah 175,637 175,637 51% 49% Virginia 421,897 421,897 54% 46% West Virginia 37,284 37,284 55% 45% Wisconsin 239,034 239,034 53% 47% Wyoming 23,770 23,770 54% 46% TOTAL – States Using the HealthCare.gov Eligibility
and Enrollment Platform 9,625,982 9,625,982 54% 46%
Notes:
General: “N/A” means that the data for the respective metric are not yet available for a given state. Some numbers may not add
to totals due to rounding.
(1) Unless otherwise noted, the data in these tables represent cumulative data on the number of unique individuals who have
selected or have been automatically reenrolled into a 2016 Marketplace medical plan (with or without the first premium payment
having been received directly by the issuer). This is also known as pre-effectuated enrollment, because enrollment is not
considered effectuated until the first premium payment is made, and this data includes plan selections for which enrollment has
not yet been effectuated. Individuals who have cancelled or terminated their Marketplace plans are not included in the total
number of plan selections. These data also do not include: stand-alone dental plan selections; or individuals who may have
selected a 2015 Marketplace plan during the reporting period, as a result of having been eligible for a Special Enrollment Period
(SEP). This table only reflects data for the individual market Marketplaces. For additional technical notes, please refer to
Appendix E of this Addendum.
(2) For each metric, the data represent the total number of Individuals Determined Eligible to Enroll in a plan Through the
Marketplace who have selected or been automatically reenrolled into a 2016 Marketplace medical plan (with or without the first
premium payment having been received directly by the Marketplace or the issuer) during the reference period, excluding plan
selections with unknown data for a given metric. This is also known as pre-effectuated enrollment, because enrollment is not
considered effectuated until the first premium payment is made, and this data includes plan selections for which enrollment has
not yet been effectuated.
(3) In some cases, the data for certain characteristics of Marketplace plan selections are not yet available. For this reason, for
each metric, we have calculated the comparable percentages based on the number of plan selections with known data for that
metric.
(4) For the HealthCare.gov states, the data on 2016 Marketplace plan selections includes data for new consumers and consumers
who are actively reenrolling in Marketplace coverage (including data for consumers who actively reenrolled in coverage through
the Marketplaces, and data for automatic reenrollees).
(5) Hawaii, Nevada, New Mexico, and Oregon are using the HealthCare.gov eligibility and enrollment platform for 2016.
Source: Centers for Medicare & Medicaid Services, as of 3-8-16.

ASPE Issue Brief Page 22
ASPE Office of Health Policy March 2016
APPENDIX TABLE C8
Marketplace Plan Selection by Metal Level in States Using the HealthCare.gov Eligibility and Enrollment Platform, By State (1)
11-1-15 to 2-1-16
Description
Total Number of Individuals
With 2016 Plan Selections
Through the Marketplaces
(2)
Plan Selections
With Available Data on Metal
Level (3)
By Metal Level (4) (% of Available Data, Excluding Unknown)
Bronze Plan
Silver Plan
Gold Plan
Platinum Plan
Catastrophic Plan
Number Number % % % % %
States Using the HealthCare.gov Eligibility and Enrollment Platform (5)
State-Based Marketplaces (SBMs) Using the HealthCare.gov Eligibility and Enrollment Platform (6)
Hawaii 14,564 14,564 16% 71% 7% 6% 0%
Nevada 88,145 88,145 23% 69% 5% 2% 1%
New Mexico 54,865 54,865 22% 61% 15% 1% 1%
Oregon 147,109 147,109 29% 61% 10% 0% 1% Subtotal - SBMs
Using the HealthCare.gov Platform 304,683 304,683 25% 64% 9% 1% 1%
Federally-Facilitated Marketplace (FFM) States
Alabama 195,055 195,055 8% 85% 4% 0% 2% Alaska 23,029 23,029 45% 51% 3% 0% 1% Arizona 203,066 203,066 23% 63% 11% 1% 2% Arkansas 73,648 73,648 21% 70% 9% 0% 1% Delaware 28,256 28,256 22% 61% 13% 3% 0% Florida 1,742,819 1,742,819 15% 78% 4% 2% 1% Georgia 587,845 587,845 17% 76% 5% 0% 2% Illinois 388,179 388,179 30% 60% 10% 0% 0% Indiana 196,242 196,242 35% 60% 5% 0% 0% Iowa 55,089 55,089 29% 65% 6% 0% 0% Kansas 101,555 101,555 22% 69% 8% 1% 0% Louisiana 214,148 214,148 21% 71% 6% 1% 1% Maine 84,059 84,059 23% 71% 5% 0% 1% Michigan 345,813 345,813 25% 67% 6% 1% 1% Mississippi 108,672 108,672 14% 82% 3% 1% 1% Missouri 290,201 290,201 27% 67% 5% 0% 1% Montana 58,114 58,114 38% 55% 6% 0% 1% Nebraska 87,835 87,835 33% 61% 4% 0% 2% New Hampshire 55,183 55,183 35% 52% 10% 1% 2% New Jersey 288,573 288,573 16% 73% 8% 2% 1% North Carolina 613,487 613,487 18% 77% 3% 1% 2% North Dakota 21,604 21,604 26% 51% 21% 0% 2% Ohio 243,715 243,715 34% 57% 8% 0% 1%

ASPE Issue Brief Page 23
ASPE Office of Health Policy March 2016
Marketplace Plan Selection by Metal Level in States Using the HealthCare.gov Eligibility and Enrollment Platform, By State (1)
11-1-15 to 2-1-16
Description
Total Number of Individuals
With 2016 Plan Selections
Through the Marketplaces
(2)
Plan Selections
With Available Data on Metal
Level (3)
By Metal Level (4) (% of Available Data, Excluding Unknown)
Bronze Plan
Silver Plan
Gold Plan
Platinum Plan
Catastrophic Plan
Number Number % % % % %
Oklahoma 145,329 145,329 29% 66% 5% 0% 0% Pennsylvania 439,238 439,238 15% 72% 11% 2% 1% South Carolina 231,849 231,849 9% 86% 4% 0% 1% South Dakota 25,999 25,999 20% 75% 4% 0% 1% Tennessee 268,867 268,867 26% 69% 3% 1% 1% Texas 1,306,208 1,306,208 26% 67% 6% 0% 1% Utah 175,637 175,637 15% 74% 11% 0% 0% Virginia 421,897 421,897 23% 69% 7% 0% 2% West Virginia 37,284 37,284 20% 69% 11% 0% 0% Wisconsin 239,034 239,034 23% 70% 5% 1% 1% Wyoming 23,770 23,770 28% 68% 4% 0% 1% TOTAL – States Using the HealthCare.gov Eligibility and Enrollment Platform 9,625,982 9,625,982 21% 71% 6% 1% 1%
Notes:
General: “N/A” means that the data for the respective metric are not yet available for a given state. Some numbers may not add to totals due to
rounding.
(1) Unless otherwise noted, the data in these tables represent cumulative data on the number of unique individuals who have selected or have been
automatically reenrolled into a 2016 Marketplace medical plan (with or without the first premium payment having been received directly by the
issuer). This is also known as pre-effectuated enrollment, because enrollment is not considered effectuated until the first premium payment is
made, and this data includes plan selections for which enrollment has not yet been effectuated. Individuals who have cancelled or terminated their
Marketplace plans are not included in the total number of plan selections. These data also do not include: stand-alone dental plan selections; or
individuals who may have selected a 2015 Marketplace plan during the reporting period, as a result of having been eligible for a Special
Enrollment Period (SEP). This table only reflects data for the individual market Marketplaces. For additional technical notes, please refer to
Appendix E of this Addendum.
(2) For each metric, the data represent the total number of Individuals Determined Eligible to Enroll in a plan Through the Marketplace who have
selected or been automatically reenrolled into a 2016 Marketplace medical plan (with or without the first premium payment having been received
directly by the Marketplace or the issuer) during the reference period, excluding plan selections with unknown data for a given metric. This is also
known as pre-effectuated enrollment, because enrollment is not considered effectuated until the first premium payment is made, and this data
includes plan selections for which enrollment has not yet been effectuated.
(3) In some cases, the data for certain characteristics of Marketplace plan selections are not yet available. For this reason, for each metric, we have
calculated the comparable percentages based on the number of plan selections with known data for that metric.
(4) In instances where consumers selected more than one Marketplace medical plan metal level type in their state, an algorithm was used to
identify the “best” plan in order to prevent duplication.
(5) For the HealthCare.gov states, the data on 2016 Marketplace plan selections includes data for new consumers and consumers who are actively
reenrolling in Marketplace coverage (including data for consumers who actively reenrolled in coverage through the Marketplaces, and data for
automatic reenrollees).
(6) Hawaii, Nevada, New Mexico, and Oregon are using the HealthCare.gov eligibility and enrollment platform for 2016.

ASPE Issue Brief Page 24
ASPE Office of Health Policy March 2016
Source: Centers for Medicare & Medicaid Services, as of 3-8-16.
ASPE Issue Brief Page 25
ASPE Office of Health Policy March 2016
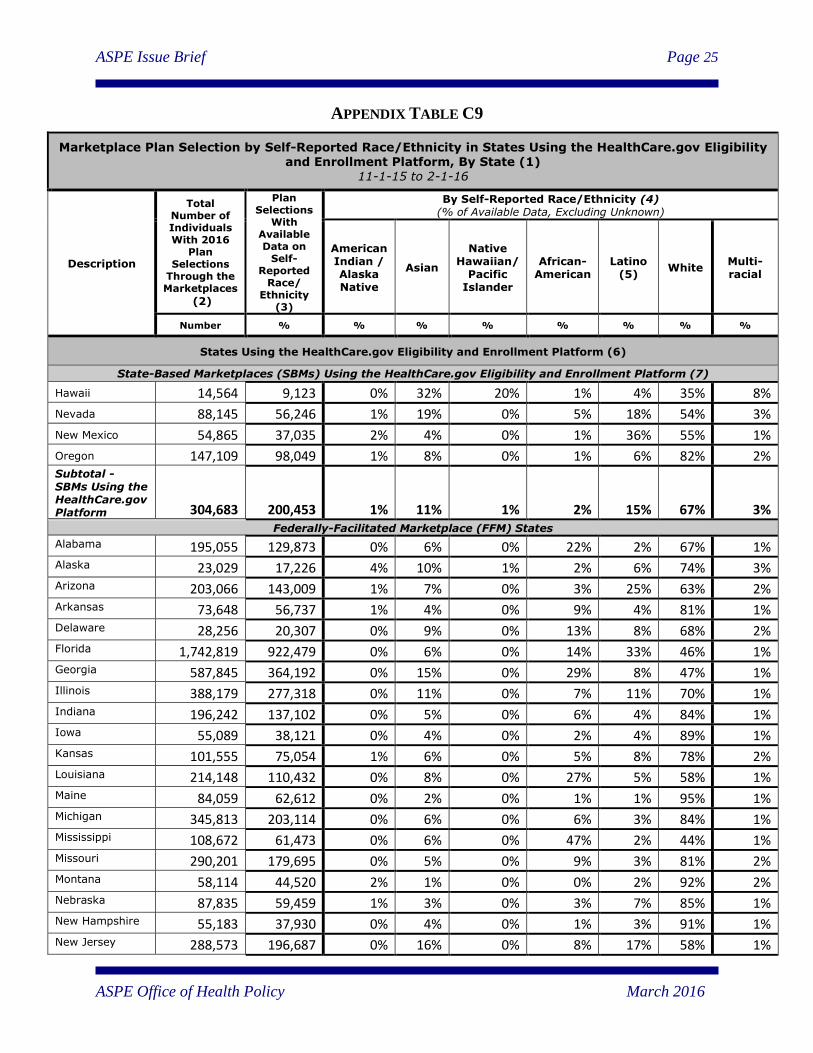
APPENDIX TABLE C9
Marketplace Plan Selection by Self-Reported Race/Ethnicity in States Using the HealthCare.gov Eligibility and Enrollment Platform, By State (1)
11-1-15 to 2-1-16
Description
Total Number of Individuals With 2016
Plan Selections
Through the Marketplaces
(2)
Plan Selections
With Available Data on
Self-Reported
Race/ Ethnicity
(3)
By Self-Reported Race/Ethnicity (4) (% of Available Data, Excluding Unknown)
American Indian / Alaska Native
Asian
Native Hawaiian/
Pacific Islander
African-American
Latino (5)
White Multi-racial
Number % % % % % % % %
States Using the HealthCare.gov Eligibility and Enrollment Platform (6)
State-Based Marketplaces (SBMs) Using the HealthCare.gov Eligibility and Enrollment Platform (7)
Hawaii 14,564 9,123 0% 32% 20% 1% 4% 35% 8%
Nevada 88,145 56,246 1% 19% 0% 5% 18% 54% 3%
New Mexico 54,865 37,035 2% 4% 0% 1% 36% 55% 1%
Oregon 147,109 98,049 1% 8% 0% 1% 6% 82% 2% Subtotal - SBMs Using the HealthCare.gov Platform 304,683 200,453 1% 11% 1% 2% 15% 67% 3%
Federally-Facilitated Marketplace (FFM) States
Alabama 195,055 129,873 0% 6% 0% 22% 2% 67% 1% Alaska 23,029 17,226 4% 10% 1% 2% 6% 74% 3% Arizona 203,066 143,009 1% 7% 0% 3% 25% 63% 2% Arkansas 73,648 56,737 1% 4% 0% 9% 4% 81% 1% Delaware 28,256 20,307 0% 9% 0% 13% 8% 68% 2% Florida 1,742,819 922,479 0% 6% 0% 14% 33% 46% 1% Georgia 587,845 364,192 0% 15% 0% 29% 8% 47% 1% Illinois 388,179 277,318 0% 11% 0% 7% 11% 70% 1% Indiana 196,242 137,102 0% 5% 0% 6% 4% 84% 1% Iowa 55,089 38,121 0% 4% 0% 2% 4% 89% 1% Kansas 101,555 75,054 1% 6% 0% 5% 8% 78% 2% Louisiana 214,148 110,432 0% 8% 0% 27% 5% 58% 1% Maine 84,059 62,612 0% 2% 0% 1% 1% 95% 1% Michigan 345,813 203,114 0% 6% 0% 6% 3% 84% 1% Mississippi 108,672 61,473 0% 6% 0% 47% 2% 44% 1% Missouri 290,201 179,695 0% 5% 0% 9% 3% 81% 2% Montana 58,114 44,520 2% 1% 0% 0% 2% 92% 2% Nebraska 87,835 59,459 1% 3% 0% 3% 7% 85% 1% New Hampshire 55,183 37,930 0% 4% 0% 1% 3% 91% 1% New Jersey 288,573 196,687 0% 16% 0% 8% 17% 58% 1%

ASPE Issue Brief Page 26
ASPE Office of Health Policy March 2016
Marketplace Plan Selection by Self-Reported Race/Ethnicity in States Using the HealthCare.gov Eligibility and Enrollment Platform, By State (1)
11-1-15 to 2-1-16
Description
Total Number of Individuals With 2016
Plan Selections
Through the Marketplaces
(2)
Plan Selections
With Available Data on
Self-Reported
Race/ Ethnicity
(3)
By Self-Reported Race/Ethnicity (4) (% of Available Data, Excluding Unknown)
American Indian /
Alaska Native
Asian
Native Hawaiian/
Pacific Islander
African-
American
Latino
(5) White
Multi-
racial
Number % % % % % % % %
North Carolina 613,487 384,031 1% 6% 0% 17% 6% 69% 1% North Dakota 21,604 17,099 6% 2% 0% 2% 3% 86% 2% Ohio 243,715 165,517 0% 5% 0% 7% 2% 84% 1% Oklahoma 145,329 96,393 8% 7% 0% 6% 8% 68% 4% Pennsylvania 439,238 297,307 0% 8% 0% 6% 4% 80% 1% South Carolina 231,849 136,015 0% 5% 0% 22% 4% 68% 1% South Dakota 25,999 20,907 3% 2% 0% 1% 2% 90% 2% Tennessee 268,867 175,666 0% 5% 0% 13% 3% 78% 1% Texas 1,306,208 835,072 0% 15% 0% 9% 37% 38% 1% Utah 175,637 117,483 1% 4% 0% 1% 10% 83% 2% Virginia 421,897 290,270 0% 17% 0% 15% 10% 56% 2% West Virginia 37,284 26,879 0% 2% 0% 2% 1% 93% 1% Wisconsin 239,034 166,662 1% 3% 0% 4% 4% 87% 1% Wyoming 23,770 15,645 1% 2% 0% 0% 6% 89% 2% TOTAL – States Using the HealthCare.gov Eligibility and Enrollment Platform 9,625,982 6,082,739 0% 9% 0% 12% 15% 63% 1%
Notes:
General: “N/A” means that the data for the respective metric are not yet available for a given state. Some numbers may not add to totals due to
rounding.
(1) Unless otherwise noted, the data in these tables represent cumulative data on the number of unique individuals who have selected or have been
automatically reenrolled into a 2016 Marketplace medical plan (with or without the first premium payment having been received directly by the
issuer). This is also known as pre-effectuated enrollment, because enrollment is not considered effectuated until the first premium payment is
made, and this data includes plan selections for which enrollment has not yet been effectuated. Individuals who have cancelled or terminated their
Marketplace plans are not included in the total number of plan selections. These data also do not include: stand-alone dental plan selections; or
individuals who may have selected a 2015 Marketplace plan during the reporting period, as a result of having been eligible for a Special
Enrollment Period (SEP). This table only reflects data for the individual market Marketplaces. For additional technical notes, please refer to
Appendix E of this Addendum.
(2) For each metric, the data represent the total number of Individuals Determined Eligible to Enroll in a plan Through the Marketplace who have
selected or been automatically reenrolled into a 2016 Marketplace medical plan (with or without the first premium payment having been received
directly by the Marketplace or the issuer) during the reference period, excluding plan selections with unknown data for a given metric. This is also
known as pre-effectuated enrollment, because enrollment is not considered effectuated until the first premium payment is made, and this data
includes plan selections for which enrollment has not yet been effectuated.
(3) In some cases, the data for certain characteristics of Marketplace plan selections are not yet available. For this reason, for each metric, we have
calculated the comparable percentages based on the number of plan selections with known data for that metric.

ASPE Issue Brief Page 27
ASPE Office of Health Policy March 2016
(4) The data on race/ethnicity of individuals who selected or were automatically reenrolled in 2016 Marketplace plans are self-reported, and should
be interpreted with great caution, since more than one-third of Marketplace enrollees do not provide these data. (5) CMS has updated the methodology for identifying Latinos applying for 2016 coverage by incorporating the selection of “Other” ethnicity as
Latino. Specifically, all consumers who selected “Other ethnicity” on their application are now counted as Latino. Latino ethnicity is indicated
when Mexican, Mexican American, Chicano/a, Puerto Rican, Cuban, and/or Other is selected. This has led to an increase in the number of reported
Latinos compared to previous years. Please see the Addendum for additional information..
(6) For the HealthCare.gov states, the data on 2016 Marketplace plan selections includes data for new consumers and consumers who are actively
reenrolling in Marketplace coverage (including data for consumers who actively reenrolled in coverage through the Marketplaces, and data for
automatic reenrollees).
(7) Hawaii, Nevada, New Mexico, and Oregon are using the HealthCare.gov eligibility and enrollment platform for 2016.
Source: Centers for Medicare & Medicaid Services, as of 3-8-16.
ASPE Issue Brief Page 28
ASPE Office of Health Policy March 2016
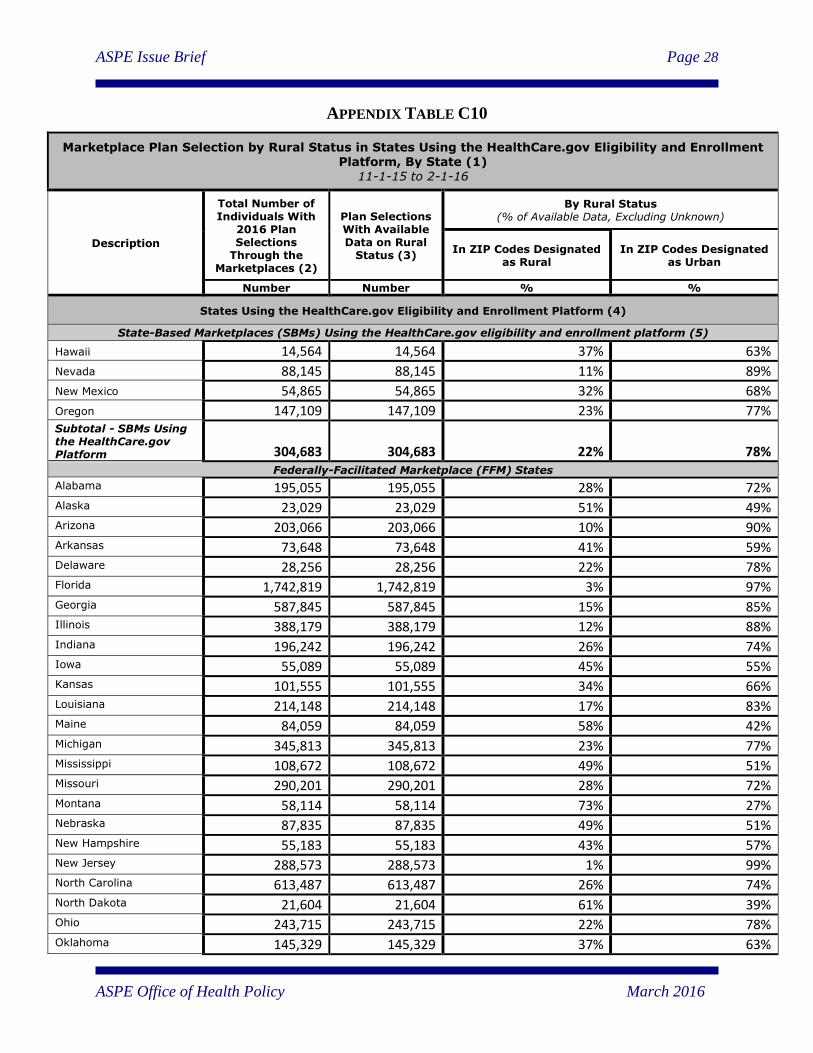
APPENDIX TABLE C10
Marketplace Plan Selection by Rural Status in States Using the HealthCare.gov Eligibility and Enrollment Platform, By State (1)
11-1-15 to 2-1-16
Description
Total Number of Individuals With
2016 Plan Selections
Through the Marketplaces (2)
Plan Selections With Available Data on Rural
Status (3)
By Rural Status (% of Available Data, Excluding Unknown)
In ZIP Codes Designated as Rural
In ZIP Codes Designated as Urban
Number Number % %
States Using the HealthCare.gov Eligibility and Enrollment Platform (4)
State-Based Marketplaces (SBMs) Using the HealthCare.gov eligibility and enrollment platform (5)
Hawaii 14,564 14,564 37% 63%
Nevada 88,145 88,145 11% 89%
New Mexico 54,865 54,865 32% 68%
Oregon 147,109 147,109 23% 77% Subtotal - SBMs Using the HealthCare.gov Platform 304,683 304,683 22% 78%
Federally-Facilitated Marketplace (FFM) States
Alabama 195,055 195,055 28% 72% Alaska 23,029 23,029 51% 49% Arizona 203,066 203,066 10% 90% Arkansas 73,648 73,648 41% 59% Delaware 28,256 28,256 22% 78% Florida 1,742,819 1,742,819 3% 97% Georgia 587,845 587,845 15% 85% Illinois 388,179 388,179 12% 88% Indiana 196,242 196,242 26% 74% Iowa 55,089 55,089 45% 55% Kansas 101,555 101,555 34% 66% Louisiana 214,148 214,148 17% 83% Maine 84,059 84,059 58% 42% Michigan 345,813 345,813 23% 77% Mississippi 108,672 108,672 49% 51% Missouri 290,201 290,201 28% 72% Montana 58,114 58,114 73% 27% Nebraska 87,835 87,835 49% 51% New Hampshire 55,183 55,183 43% 57% New Jersey 288,573 288,573 1% 99% North Carolina 613,487 613,487 26% 74% North Dakota 21,604 21,604 61% 39% Ohio 243,715 243,715 22% 78% Oklahoma 145,329 145,329 37% 63%

ASPE Issue Brief Page 29
ASPE Office of Health Policy March 2016
Marketplace Plan Selection by Rural Status in States Using the HealthCare.gov Eligibility and Enrollment Platform, By State (1)
11-1-15 to 2-1-16
Description
Total Number of Individuals With
2016 Plan Selections
Through the Marketplaces (2)
Plan Selections With Available Data on Rural
Status (3)
By Rural Status (% of Available Data, Excluding Unknown)
In ZIP Codes Designated as Rural
In ZIP Codes Designated as Urban
Number Number % %
Pennsylvania 439,238 439,238 12% 88% South Carolina 231,849 231,849 20% 80% South Dakota 25,999 25,999 63% 37% Tennessee 268,867 268,867 26% 74% Texas 1,306,208 1,306,208 11% 89% Utah 175,637 175,637 15% 85% Virginia 421,897 421,897 14% 86% West Virginia 37,284 37,284 41% 59% Wisconsin 239,034 239,034 37% 63% Wyoming 23,770 23,770 78% 22% TOTAL – States Using the HealthCare.gov
Eligibility and Enrollment Platform 9,625,982 9,625,982 18% 82%
Notes:
General: “N/A” means that the data for the respective metric are not yet available for a given state. Some numbers may not add
to totals due to rounding.
(1) Unless otherwise noted, the data in these tables represent cumulative data on the number of unique individuals who have
selected or have been automatically reenrolled into a 2016 Marketplace medical plan (with or without the first premium payment
having been received directly by the issuer). This is also known as pre-effectuated enrollment, because enrollment is not
considered effectuated until the first premium payment is made, and this data includes plan selections for which enrollment has
not yet been effectuated. Individuals who have cancelled or terminated their Marketplace plans are not included in the total
number of plan selections. These data also do not include: stand-alone dental plan selections; or individuals who may have
selected a 2015 Marketplace plan during the reporting period, as a result of having been eligible for a Special Enrollment Period
(SEP). This table only reflects data for the individual market Marketplaces. For additional technical notes, please refer to
Appendix E of this Addendum.
(2) For each metric, the data represent the total number of Individuals Determined Eligible to Enroll in a plan Through the
Marketplace who have selected or been automatically reenrolled into a 2016 Marketplace medical plan (with or without the first
premium payment having been received directly by the Marketplace or the issuer) during the reference period, excluding plan
selections with unknown data for a given metric. This is also known as pre-effectuated enrollment, because enrollment is not
considered effectuated until the first premium payment is made, and this data includes plan selections for which enrollment has
not yet been effectuated.
(3) In some cases, the data for certain characteristics of Marketplace plan selections are not yet available. For this reason, for
each metric, we have calculated the comparable percentages based on the number of plan selections with known data for that
metric.
(4) For the HealthCare.gov states, the data on 2016 Marketplace plan selections includes data for new consumers and consumers
who are actively reenrolling in Marketplace coverage (including data for consumers who actively reenrolled in coverage through
the Marketplaces, and data for automatic reenrollees).
(5) Hawaii, Nevada, New Mexico, and Oregon are using the HealthCare.gov eligibility and enrollment platform for 2016.
Source: Centers for Medicare & Medicaid Services, as of 3-8-16.
ASPE Issue Brief Page 30
ASPE Office of Health Policy March 2016
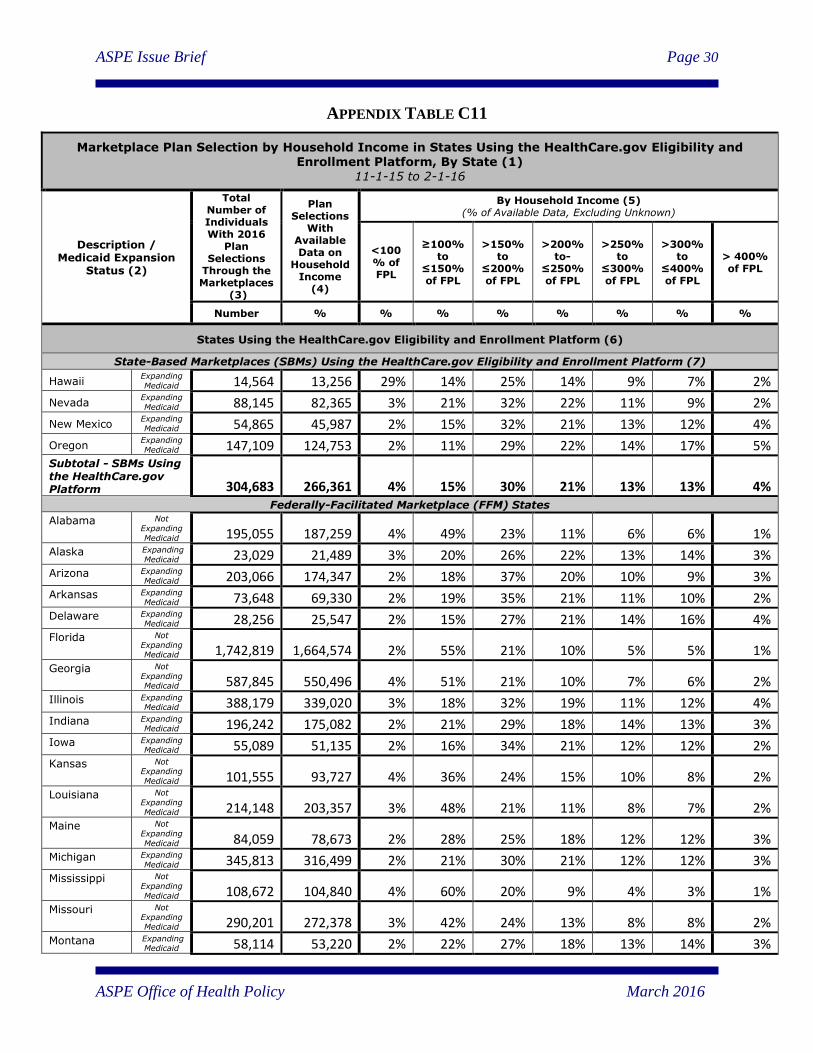
APPENDIX TABLE C11
Marketplace Plan Selection by Household Income in States Using the HealthCare.gov Eligibility and Enrollment Platform, By State (1)
11-1-15 to 2-1-16
Description / Medicaid Expansion
Status (2)
Total Number of Individuals With 2016
Plan Selections
Through the Marketplaces
(3)
Plan Selections
With Available Data on
Household Income
(4)
By Household Income (5) (% of Available Data, Excluding Unknown)
<100% of FPL
≥100% to
≤150% of FPL
>150% to
≤200% of FPL
>200% to-
≤250% of FPL
>250% to
≤300% of FPL
>300% to
≤400% of FPL
> 400% of FPL
Number % % % % % % % %
States Using the HealthCare.gov Eligibility and Enrollment Platform (6)
State-Based Marketplaces (SBMs) Using the HealthCare.gov Eligibility and Enrollment Platform (7)
Hawaii Expanding
Medicaid 14,564 13,256 29% 14% 25% 14% 9% 7% 2%
Nevada Expanding
Medicaid 88,145 82,365 3% 21% 32% 22% 11% 9% 2%
New Mexico Expanding
Medicaid 54,865 45,987 2% 15% 32% 21% 13% 12% 4%
Oregon Expanding
Medicaid 147,109 124,753 2% 11% 29% 22% 14% 17% 5% Subtotal - SBMs Using the HealthCare.gov Platform 304,683 266,361 4% 15% 30% 21% 13% 13% 4%
Federally-Facilitated Marketplace (FFM) States
Alabama Not
Expanding
Medicaid 195,055 187,259 4% 49% 23% 11% 6% 6% 1% Alaska Expanding
Medicaid 23,029 21,489 3% 20% 26% 22% 13% 14% 3% Arizona Expanding
Medicaid 203,066 174,347 2% 18% 37% 20% 10% 9% 3% Arkansas Expanding
Medicaid 73,648 69,330 2% 19% 35% 21% 11% 10% 2% Delaware Expanding
Medicaid 28,256 25,547 2% 15% 27% 21% 14% 16% 4% Florida Not
Expanding Medicaid 1,742,819 1,664,574 2% 55% 21% 10% 5% 5% 1%
Georgia Not
Expanding Medicaid 587,845 550,496 4% 51% 21% 10% 7% 6% 2%
Illinois Expanding Medicaid 388,179 339,020 3% 18% 32% 19% 11% 12% 4%
Indiana Expanding Medicaid 196,242 175,082 2% 21% 29% 18% 14% 13% 3%
Iowa Expanding Medicaid 55,089 51,135 2% 16% 34% 21% 12% 12% 2%
Kansas Not Expanding
Medicaid 101,555 93,727 4% 36% 24% 15% 10% 8% 2% Louisiana Not
Expanding
Medicaid 214,148 203,357 3% 48% 21% 11% 8% 7% 2% Maine Not
Expanding
Medicaid 84,059 78,673 2% 28% 25% 18% 12% 12% 3% Michigan Expanding
Medicaid 345,813 316,499 2% 21% 30% 21% 12% 12% 3% Mississippi Not
Expanding
Medicaid 108,672 104,840 4% 60% 20% 9% 4% 3% 1% Missouri Not
Expanding Medicaid 290,201 272,378 3% 42% 24% 13% 8% 8% 2%
Montana Expanding Medicaid 58,114 53,220 2% 22% 27% 18% 13% 14% 3%

ASPE Issue Brief Page 31
ASPE Office of Health Policy March 2016
Marketplace Plan Selection by Household Income in States Using the HealthCare.gov Eligibility and Enrollment Platform, By State (1)
11-1-15 to 2-1-16
Description / Medicaid Expansion
Status (2)
Total Number of Individuals With 2016
Plan Selections
Through the Marketplaces
(3)
Plan Selections
With Available Data on
Household Income
(4)
By Household Income (5) (% of Available Data, Excluding Unknown)
<100% of FPL
≥100% to
≤150% of FPL
>150% to
≤200% of FPL
>200% to-
≤250% of FPL
>250% to
≤300% of FPL
>300% to
≤400% of FPL
> 400% of FPL
Number % % % % % % % %
Eff. 1-1-16
Nebraska Not
Expanding
Medicaid 87,835 82,852 3% 31% 23% 19% 11% 11% 2% New Hampshire
Expanding
Medicaid 55,183 43,205 2% 16% 27% 19% 13% 17% 6% New Jersey Expanding
Medicaid 288,573 257,997 4% 17% 30% 19% 12% 14% 5% North Carolina
Not
Expanding
Medicaid 613,487 581,050 3% 44% 21% 14% 8% 8% 2% North Dakota Expanding
Medicaid 21,604 20,134 1% 13% 30% 23% 14% 15% 3% Ohio Expanding
Medicaid 243,715 219,061 2% 16% 31% 23% 13% 12% 3% Oklahoma Not
Expanding
Medicaid 145,329 134,266 4% 38% 23% 16% 9% 8% 2% Pennsylvania Expanding
Medicaid 439,238 381,615 2% 22% 31% 18% 11% 12% 4% South Carolina
Not
Expanding
Medicaid 231,849 218,699 2% 46% 22% 14% 8% 7% 2% South Dakota Not
Expanding
Medicaid 25,999 24,844 3% 30% 23% 20% 13% 10% 2% Tennessee Not
Expanding Medicaid 268,867 249,147 4% 40% 24% 13% 9% 8% 2%
Texas Not Expanding
Medicaid 1,306,208 1,206,984 4% 44% 23% 14% 7% 6% 2% Utah Not
Expanding
Medicaid 175,637 162,777 2% 34% 25% 21% 9% 7% 2% Virginia Not
Expanding
Medicaid 421,897 383,327 4% 36% 23% 16% 9% 9% 3% West Virginia Expanding
Medicaid 37,284 34,273 1% 15% 34% 20% 12% 15% 3% Wisconsin Not
Expanding
Medicaid 239,034 215,915 1% 29% 25% 16% 11% 14% 3% Wyoming Not
Expanding Medicaid 23,770 22,350 2% 27% 22% 19% 12% 15% 2%
TOTAL – States Using the HealthCare.gov Eligibility and Enrollment Platform 9,625,982 8,885,830 3% 38% 25% 15% 9% 8% 2%
Notes:
General: “N/A” means that the data for the respective metric are not yet available for a given state. Some numbers may not add
to totals due to rounding.
(1) Unless otherwise noted, the data in these tables represent cumulative data on the number of unique individuals who have
selected or have been automatically reenrolled into a 2016 Marketplace medical plan (with or without the first premium payment
having been received directly by the issuer). This is also known as pre-effectuated enrollment, because enrollment is not

ASPE Issue Brief Page 32
ASPE Office of Health Policy March 2016
considered effectuated until the first premium payment is made, and this data includes plan selections for which enrollment has
not yet been effectuated. Individuals who have cancelled or terminated their Marketplace plans are not included in the total
number of plan selections. These data also do not include: stand-alone dental plan selections; or individuals who may have
selected a 2015 Marketplace plan during the reporting period, as a result of having been eligible for a Special Enrollment Period
(SEP). This table only reflects data for the individual market Marketplaces. For additional technical notes, please refer to
Appendix E of this Addendum.
(2) Identifies HealthCare.gov states that have and have not implemented the expansion of Medicaid under the Affordable Care
Act to cover adults under age 65 with incomes up to 133 percent of the Federal Poverty Level.
(3) For each metric, the data represent the total number of Individuals Determined Eligible to Enroll in a plan Through the
Marketplace who have selected or been automatically reenrolled into a 2016 Marketplace medical plan (with or without the first
premium payment having been received directly by the Marketplace or the issuer) during the reference period, excluding plan
selections with unknown data for a given metric. This is also known as pre-effectuated enrollment, because enrollment is not
considered effectuated until the first premium payment is made, and this data includes plan selections for which enrollment has
not yet been effectuated.
(4) In some cases, the data for certain characteristics of Marketplace plan selections are not yet available. For this reason, for
each metric, we have calculated the comparable percentages based on the number of plan selections with known data for that
metric.
(5) The observed household income distributions differ between HealthCare.gov states that have and have not implemented the
expansion of Medicaid under the Affordable Care Act to cover adults under age 65 with incomes up to 133 percent of the Federal
Poverty Level.
(5) For the HealthCare.gov states, the data on 2016 Marketplace plan selections includes data for new consumers and consumers
who are actively reenrolling in Marketplace coverage (including data for consumers who actively reenrolled in coverage through
the Marketplaces, and data for automatic reenrollees).
(6) Hawaii, Nevada, New Mexico, and Oregon are using the HealthCare.gov eligibility and enrollment platform for 2016.
Source: Centers for Medicare & Medicaid Services, as of 3-8-16.

ASPE Issue Brief Page 33
ASPE Office of Health Policy March 2016
APPENDIX TABLE C12
Total Marketplace Plan Selections by Gender and Age in States Using the HealthCare.gov Eligibility and Enrollment Platform, By State (1)
11-1-15 to 2-1-16
Description
Number of Female Plan Selections
With Available
Data on Age (2) (3)
Females By Age (% of Available Data, Excluding Unknown)
Age < 18
Age 18-25
Age 26-34
Age 35-44
Age 45-54
Age 55-64
Age ≥65
Ages 0-20
Ages 18-34
Ages 0-34
Number % % % % % % % % % %
States Using the HealthCare.gov Eligibility and Enrollment Platform (4)
State-Based Marketplaces (SBMs) Using the HealthCare.gov Eligibility and Enrollment Platform (5)
Hawaii 8,353 5% 8% 17% 18% 20% 31% 1% 7% 25% 29%
Nevada 47,436 13% 9% 16% 15% 19% 27% 1% 15% 25% 37%
New Mexico 29,673 8% 7% 13% 14% 22% 35% 1% 10% 20% 28%
Oregon 80,373 8% 7% 17% 15% 19% 34% 1% 10% 24% 31%
Subtotal - SBMs Using the HealthCare.gov Platform 165,835 9% 8% 16% 15% 20% 32% 1% 11% 23% 32%
Federally-Facilitated Marketplace (FFM) States
Alabama 111,786 3% 12% 19% 18% 21% 26% 0% 7% 31% 34%
Alaska 11,914 11% 8% 19% 15% 19% 26% 1% 13% 27% 38%
Arizona 107,332 22% 8% 13% 13% 17% 26% 1% 25% 21% 43%
Arkansas 39,713 8% 9% 15% 15% 20% 33% 1% 11% 24% 32%
Delaware 15,277 12% 8% 15% 15% 21% 28% 1% 15% 23% 35%
Florida 937,847 6% 12% 15% 17% 24% 25% 1% 10% 27% 33%
Georgia 329,290 6% 13% 18% 19% 22% 22% 1% 10% 31% 37%
Illinois 202,230 8% 9% 17% 15% 21% 29% 1% 10% 27% 34%
Indiana 105,745 10% 8% 15% 14% 20% 33% 0% 13% 23% 33%
Iowa 29,303 5% 8% 16% 14% 21% 35% 0% 8% 24% 30%
Kansas 54,874 9% 11% 19% 15% 19% 27% 0% 13% 30% 39%
Louisiana 123,121 4% 12% 20% 17% 21% 25% 0% 8% 32% 36%
Maine 44,636 10% 8% 14% 14% 21% 33% 0% 12% 22% 32%
Michigan 181,389 10% 9% 15% 14% 21% 31% 0% 13% 24% 34%
Mississippi 63,548 3% 14% 17% 17% 22% 27% 1% 7% 31% 34%
Missouri 156,772 8% 12% 18% 16% 20% 27% 0% 11% 30% 38%
Montana 30,598 7% 9% 18% 15% 19% 32% 0% 10% 27% 34%
Nebraska 46,368 14% 11% 18% 16% 17% 24% 0% 18% 29% 43%
New Hampshire 29,039 8% 8% 15% 14% 22% 33% 0% 11% 23% 31%
New Jersey 152,733 8% 10% 15% 15% 23% 28% 1% 11% 25% 33%
North Carolina 339,685 8% 11% 17% 17% 21% 25% 0% 11% 28% 36%
North Dakota 11,173 22% 9% 17% 12% 15% 24% 0% 25% 27% 49%
Ohio 130,351 11% 8% 15% 13% 19% 34% 0% 13% 23% 33%
Oklahoma 79,454 10% 11% 17% 16% 19% 26% 0% 13% 29% 38%

ASPE Issue Brief Page 34
ASPE Office of Health Policy March 2016
Total Marketplace Plan Selections by Gender and Age in States Using the HealthCare.gov Eligibility and
Enrollment Platform, By State (1) 11-1-15 to 2-1-16
Description
Number of Female Plan Selections
With Available
Data on Age (2) (3)
Females By Age (% of Available Data, Excluding Unknown)
Age < 18
Age 18-25
Age 26-34
Age 35-44
Age 45-54
Age 55-64
Age ≥65
Ages 0-20
Ages 18-34
Ages 0-34
Number % % % % % % % % % %
Pennsylvania 232,085 7% 8% 16% 14% 21% 33% 1% 9% 25% 31%
South Carolina 129,309 7% 11% 16% 16% 22% 28% 0% 10% 27% 34%
South Dakota 13,687 12% 11% 19% 15% 16% 27% 0% 15% 30% 42%
Tennessee 142,805 6% 10% 16% 15% 22% 30% 0% 9% 26% 32%
Texas 716,324 9% 13% 16% 17% 21% 22% 1% 14% 29% 39%
Utah 90,414 22% 12% 20% 16% 13% 16% 0% 26% 32% 54%
Virginia 227,825 10% 11% 18% 16% 20% 24% 1% 14% 29% 39%
West Virginia 20,531 6% 6% 12% 13% 21% 41% 1% 8% 19% 24%
Wisconsin 127,827 6% 9% 16% 14% 20% 34% 0% 9% 25% 31%
Wyoming 12,860 13% 9% 18% 15% 17% 28% 0% 16% 28% 40%
TOTAL – States Using the HealthCare.gov Eligibility and Enrollment
Platform 5,213,680 8% 11% 16% 16% 21% 27% 1% 12% 27% 36%

ASPE Issue Brief Page 35
ASPE Office of Health Policy March 2016
Description
Number of Male Plan Selections
With Available
Data on Age (2) (3)
Males By Age (% of Available Data, Excluding Unknown)
Age < 18
Age 18-25
Age 26-34
Age 35-44
Age 45-54
Age 55-64
Age ≥65
Ages 0-20
Ages 18-34
Ages 0-34
Number % % % % % % % % % %
States Using the HealthCare.gov Eligibility and Enrollment Platform (4)
State-Based Marketplaces (SBMs) Using the HealthCare.gov Eligibility and Enrollment Platform (5)
Hawaii 6,211 7% 8% 14% 18% 21% 31% 1% 10% 22% 28%
Nevada 40,708 15% 9% 15% 15% 19% 25% 1% 18% 24% 39%
New Mexico 25,191 9% 7% 15% 15% 21% 31% 1% 12% 23% 32%
Oregon 66,734 10% 8% 18% 17% 18% 29% 1% 12% 26% 36%
Subtotal - SBMs Using the HealthCare.gov Platform 138,844 11% 8% 17% 16% 19% 28% 1% 14% 25% 36%
Federally-Facilitated Marketplace (FFM) States
Alabama 83,266 5% 13% 19% 18% 21% 24% 0% 9% 32% 37%
Alaska 11,115 13% 7% 19% 16% 18% 25% 1% 15% 27% 40%
Arizona 95,734 25% 9% 13% 13% 17% 22% 0% 29% 22% 47%
Arkansas 33,935 10% 9% 15% 16% 21% 29% 1% 13% 25% 34%
Delaware 12,979 15% 8% 16% 15% 21% 24% 1% 18% 24% 39%
Florida 804,965 7% 13% 15% 17% 23% 23% 1% 11% 28% 36%
Georgia 258,552 9% 13% 18% 18% 21% 20% 1% 13% 31% 40%
Illinois 185,948 9% 10% 19% 16% 20% 26% 1% 12% 29% 38%
Indiana 90,494 12% 9% 16% 15% 19% 28% 0% 16% 25% 37%
Iowa 25,786 6% 9% 19% 16% 20% 31% 1% 9% 27% 33%
Kansas 46,681 11% 12% 20% 16% 17% 24% 0% 15% 32% 42%
Louisiana 91,026 6% 12% 20% 17% 20% 23% 0% 10% 33% 39%
Maine 39,423 11% 8% 16% 15% 20% 29% 0% 14% 24% 36%
Michigan 164,422 12% 9% 17% 15% 20% 27% 0% 15% 26% 38%
Mississippi 45,124 5% 15% 17% 17% 21% 25% 1% 10% 32% 37%
Missouri 133,427 10% 11% 19% 17% 19% 23% 0% 13% 31% 41%
Montana 27,515 9% 9% 20% 17% 18% 28% 0% 11% 29% 37%
Nebraska 41,467 16% 11% 19% 16% 17% 22% 0% 20% 29% 45%
New Hampshire 26,144 9% 8% 16% 14% 22% 30% 0% 12% 25% 34%
New Jersey 135,840 9% 10% 17% 15% 22% 25% 1% 13% 27% 36%
North Carolina 273,800 11% 11% 17% 18% 21% 22% 0% 14% 29% 39%
North Dakota 10,431 24% 8% 18% 14% 14% 23% 0% 27% 26% 50%
Ohio 113,362 13% 8% 17% 15% 19% 29% 0% 15% 25% 38%
Oklahoma 65,873 12% 11% 17% 16% 19% 24% 0% 16% 29% 41%
Pennsylvania 207,147 8% 9% 18% 15% 21% 29% 0% 10% 27% 34%
South Carolina 102,540 9% 11% 17% 17% 21% 24% 0% 13% 28% 37%
South Dakota 12,312 14% 10% 20% 15% 16% 25% 0% 17% 30% 44%
Tennessee 126,061 7% 10% 20% 17% 21% 25% 0% 10% 30% 37%

ASPE Issue Brief Page 36
ASPE Office of Health Policy March 2016
Description
Number of Male Plan Selections
With Available
Data on Age (2) (3)
Males By Age (% of Available Data, Excluding Unknown)
Age < 18
Age 18-25
Age 26-34
Age 35-44
Age 45-54
Age 55-64
Age ≥65
Ages 0-20
Ages 18-34
Ages 0-34
Number % % % % % % % % % %
Texas 589,876 12% 13% 16% 16% 20% 21% 1% 17% 29% 41%
Utah 85,221 25% 12% 21% 16% 13% 14% 0% 29% 33% 57%
Virginia 194,071 13% 12% 18% 16% 19% 21% 1% 17% 30% 43%
West Virginia 16,753 7% 7% 15% 16% 21% 34% 1% 9% 21% 29%
Wisconsin 111,205 7% 9% 17% 15% 20% 31% 0% 10% 26% 33%
Wyoming 10,910 15% 9% 19% 15% 15% 26% 0% 18% 28% 43%
TOTAL – States Using the HealthCare.gov Eligibility and Enrollment Platform 4,412,249 10% 11% 17% 16% 21% 24% 1% 14% 28% 39%
Notes:
General: “N/A” means that the data for the respective metric are not yet available for a given state. Some numbers may not add to totals
due to rounding.
(1) Unless otherwise noted, the data in these tables represent cumulative data on the number of unique individuals who have selected or
have been automatically reenrolled into a 2016 Marketplace medical plan (with or without the first premium payment having been
received directly by the issuer). This is also known as pre-effectuated enrollment, because enrollment is not considered effectuated until
the first premium payment is made, and this data includes plan selections for which enrollment has not yet been effectuated. Individuals
who have cancelled or terminated their Marketplace plans are not included in the total number of plan selections. These data also do not
include: stand-alone dental plan selections; or individuals who may have selected a 2015 Marketplace plan during the reporting period, as
a result of having been eligible for a Special Enrollment Period (SEP). This table only reflects data for the individual market
Marketplaces. For additional technical notes, please refer to Appendix E of this Addendum.
(2) For each metric, the data represent the total number of Individuals Determined Eligible to Enroll in a plan Through the Marketplace
who have selected or been automatically reenrolled into a 2016 Marketplace medical plan (with or without the first premium payment
having been received directly by the Marketplace or the issuer) during the reference period, excluding plan selections with unknown data
for a given metric. This is also known as pre-effectuated enrollment, because enrollment is not considered effectuated until the first
premium payment is made, and this data includes plan selections for which enrollment has not yet been effectuated.
(3) In some cases, the data for certain characteristics of Marketplace plan selections are not yet available. For this reason, for each metric,
we have calculated the comparable percentages based on the number of plan selections with known data for that metric.
(4) For the HealthCare.gov states, the data on 2016 Marketplace plan selections includes data for new consumers and consumers who are
actively reenrolling in Marketplace coverage (including data for consumers who actively reenrolled in coverage through the Marketplaces,
and data for automatic reenrollees).
(5) Hawaii, Nevada, New Mexico, and Oregon are using the HealthCare.gov eligibility and enrollment platform for 2016.
Source: Centers for Medicare & Medicaid Services, as of 3-8-16.

ASPE Issue Brief Page 37
ASPE Office of Health Policy March 2016
APPENDIX TABLE C13
Total Marketplace Plan Selections by Gender and Metal Level in States Using the HealthCare.gov Eligibility and Enrollment Platform, By State (1)
11-1-15 to 2-1-16
Description
Total Number of Females
With 2016 Plan Selections
Through the Marketplaces
(2)
Female Plan Selections
With Available Data on Metal
Level (3)
Females By Metal Level (4) (% of Available Data, Excluding Unknown)
Bronze Plan
Silver Plan
Gold Plan
Platinum Plan
Catastrophic Plan
Number Number % % % % %
States Using the HealthCare.gov Eligibility and Enrollment Platform (5)
State-Based Marketplaces (SBMs) Using the HealthCare.gov Eligibility and Enrollment Platform (6)
Hawaii 8,353 8,353 14% 74% 6% 5% 0%
Nevada 47,436 47,436 22% 71% 5% 2% 1%
New Mexico 29,674 29,674 21% 63% 15% 1% 1%
Oregon 80,374 80,374 27% 63% 10% 0% 1% Subtotal - SBMs Using the HealthCare.gov Platform 165,837 165,837 24% 66% 9% 1% 1%
Federally-Facilitated Marketplace (FFM) States
Alabama 111,786 111,786 7% 86% 4% 0% 2% Alaska 11,914 11,914 44% 52% 3% 0% 0% Arizona 107,332 107,332 22% 65% 11% 1% 2% Arkansas 39,713 39,713 19% 71% 9% 0% 1% Delaware 15,277 15,277 21% 63% 13% 3% 0% Florida 937,851 937,851 14% 80% 4% 2% 1% Georgia 329,293 329,293 16% 78% 5% 0% 2% Illinois 202,230 202,230 28% 61% 10% 0% 0% Indiana 105,747 105,747 34% 62% 4% 0% 0% Iowa 29,303 29,303 27% 67% 6% 0% 0% Kansas 54,874 54,874 21% 71% 7% 1% 0% Louisiana 123,121 123,121 20% 73% 5% 1% 1% Maine 44,636 44,636 22% 73% 5% 0% 1% Michigan 181,389 181,389 24% 68% 6% 1% 1% Mississippi 63,548 63,548 13% 83% 3% 1% 1% Missouri 156,774 156,774 25% 69% 5% 0% 1% Montana 30,599 30,599 37% 57% 5% 0% 1% Nebraska 46,368 46,368 31% 63% 4% 0% 1% New Hampshire 29,039 29,039 34% 54% 9% 1% 1% New Jersey 152,733 152,733 15% 75% 8% 2% 1% North Carolina 339,685 339,685 16% 78% 3% 1% 2% North Dakota 11,173 11,173 25% 53% 21% 0% 2% Ohio 130,353 130,353 33% 58% 8% 0% 1%

ASPE Issue Brief Page 38
ASPE Office of Health Policy March 2016
Total Marketplace Plan Selections by Gender and Metal Level in States Using the HealthCare.gov
Eligibility and Enrollment Platform, By State (1) 11-1-15 to 2-1-16
Description
Total Number of Females
With 2016 Plan Selections
Through the Marketplaces
(2)
Female Plan Selections
With Available Data on Metal
Level (3)
Females By Metal Level (4) (% of Available Data, Excluding Unknown)
Bronze Plan
Silver Plan
Gold Plan
Platinum Plan
Catastrophic Plan
Number Number % % % % %
Oklahoma 79,454 79,454 28% 68% 4% 0% 0% Pennsylvania 232,087 232,087 14% 73% 11% 2% 1% South Carolina 129,309 129,309 8% 87% 4% 0% 1% South Dakota 13,687 13,687 19% 76% 4% 0% 1% Tennessee 142,805 142,805 24% 71% 3% 1% 1% Texas 716,330 716,330 25% 68% 6% 0% 1% Utah 90,415 90,415 14% 75% 10% 0% 0% Virginia 227,825 227,825 21% 71% 6% 0% 2% West Virginia 20,531 20,531 18% 71% 10% 0% 0% Wisconsin 127,828 127,828 22% 72% 4% 1% 1% Wyoming 12,860 12,860 26% 70% 4% 0% 1% TOTAL – States Using the HealthCare.gov Eligibility and Enrollment Platform 5,213,706 5,213,706 20% 73% 6% 1% 1%

ASPE Issue Brief Page 39
ASPE Office of Health Policy March 2016
Description
Total Number of Males With
2016 Plan Selections
Through the Marketplaces
(2)
Male Plan Selections
With Available Data on Metal
Level (3)
Males By Metal Level (4) (% of Available Data, Excluding Unknown)
Bronze Plan
Silver Plan
Gold Plan
Platinum Plan
Catastrophic Plan
Number Number % % % % %
States Using the HealthCare.gov Eligibility and Enrollment Platform (5)
State-Based Marketplaces (SBMs) Using the HealthCare.gov Eligibility and Enrollment Platform (6)
Hawaii 6,211 6,353 18% 66% 8% 7% 0%
Nevada 40,709 40,930 24% 67% 5% 2% 1%
New Mexico 25,191 25,690 23% 58% 17% 1% 1%
Oregon 66,735 67,879 31% 57% 12% 0% 1% Subtotal - SBMs Using the HealthCare.gov Platform 138,846 140,852 27% 61% 11% 1% 1%
Federally-Facilitated Marketplace (FFM) States
Alabama 83,269 84,503 9% 82% 5% 0% 2% Alaska 11,115 11,118 47% 49% 4% 0% 0% Arizona 95,734 96,184 23% 62% 12% 1% 2% Arkansas 33,935 34,384 22% 67% 10% 0% 1% Delaware 12,979 13,161 23% 59% 15% 3% 1% Florida 804,968 807,557 17% 76% 4% 2% 1% Georgia 258,552 260,458 18% 74% 6% 0% 2% Illinois 185,949 187,137 31% 58% 11% 0% 0% Indiana 90,495 90,615 37% 58% 5% 0% 0% Iowa 25,786 25,851 31% 62% 7% 0% 0% Kansas 46,681 46,681 24% 66% 9% 1% 0% Louisiana 91,027 91,493 23% 67% 7% 2% 1% Maine 39,423 39,440 24% 70% 5% 0% 1% Michigan 164,424 163,972 26% 65% 6% 1% 1% Mississippi 45,124 45,537 15% 79% 4% 1% 2% Missouri 133,427 133,658 29% 65% 6% 0% 1% Montana 27,515 27,426 40% 54% 6% 0% 1% Nebraska 41,467 41,398 35% 59% 4% 0% 1% New Hampshire 26,144 25,935 36% 51% 10% 1% 2% New Jersey 135,840 135,887 17% 71% 8% 2% 1% North Carolina 273,802 275,717 19% 74% 4% 1% 2% North Dakota 10,431 10,483 26% 50% 22% 0% 2% Ohio 113,362 113,609 35% 55% 9% 0% 1% Oklahoma 65,875 66,022 31% 63% 5% 0% 0% Pennsylvania 207,151 208,913 16% 70% 12% 2% 1%

ASPE Issue Brief Page 40
ASPE Office of Health Policy March 2016
Description
Total Number of Males With
2016 Plan Selections
Through the Marketplaces
(2)
Male Plan Selections
With Available Data on Metal
Level (3)
Males By Metal Level (4) (% of Available Data, Excluding Unknown)
Bronze Plan
Silver Plan
Gold Plan
Platinum Plan
Catastrophic Plan
Number Number % % % % %
South Carolina 102,540 103,085 10% 84% 5% 0% 1% South Dakota 12,312 12,260 21% 73% 5% 0% 1% Tennessee 126,062 126,199 28% 67% 4% 1% 1% Texas 589,878 593,903 28% 64% 7% 0% 1% Utah 85,222 85,344 16% 73% 11% 0% 0% Virginia 194,072 195,128 24% 66% 7% 0% 2% West Virginia 16,753 17,026 21% 66% 13% 0% 0% Wisconsin 111,206 111,414 25% 68% 5% 1% 1% Wyoming 10,910 10,986 30% 65% 4% 0% 1% TOTAL – States Using the HealthCare.gov Eligibility and Enrollment Platform 4,412,276 4,433,336 23% 68% 7% 1% 1%
Notes:
General: “N/A” means that the data for the respective metric are not yet available for a given state. Some numbers may not add
to totals due to rounding.
(1) Unless otherwise noted, the data in these tables represent cumulative data on the number of unique individuals who have
selected or have been automatically reenrolled into a 2016 Marketplace medical plan (with or without the first premium payment
having been received directly by the issuer). This is also known as pre-effectuated enrollment, because enrollment is not
considered effectuated until the first premium payment is made, and this data includes plan selections for which enrollment has
not yet been effectuated. Individuals who have cancelled or terminated their Marketplace plans are not included in the total
number of plan selections. These data also do not include: stand-alone dental plan selections; or individuals who may have
selected a 2015 Marketplace plan during the reporting period, as a result of having been eligible for a Special Enrollment Period
(SEP). This table only reflects data for the individual market Marketplaces. For additional technical notes, please refer to
Appendix E of this Addendum.
(2) For each metric, the data represent the total number of Individuals Determined Eligible to Enroll in a plan Through the
Marketplace who have selected or been automatically reenrolled into a 2016 Marketplace medical plan (with or without the first
premium payment having been received directly by the Marketplace or the issuer) during the reference period, excluding plan
selections with unknown data for a given metric. This is also known as pre-effectuated enrollment, because enrollment is not
considered effectuated until the first premium payment is made, and this data includes plan selections for which enrollment has
not yet been effectuated.
(3) In some cases, the data for certain characteristics of Marketplace plan selections are not yet available. For this reason, for
each metric, we have calculated the comparable percentages based on the number of plan selections with known data for that
metric.
(4) In instances where consumers selected more than one Marketplace medical plan metal level type in their state, an algorithm
was used to identify the “best” plan in order to prevent duplication.
(5) For the HealthCare.gov states, the data on 2016 Marketplace plan selections includes data for new consumers and consumers
who are actively reenrolling in Marketplace coverage (including data for consumers who actively reenrolled in coverage through
the Marketplaces, and data for automatic reenrollees).
(6) Hawaii, Nevada, New Mexico, and Oregon are using the HealthCare.gov eligibility and enrollment platform for 2016.Source:
Centers for Medicare & Medicaid Services, as of 3-8-16.
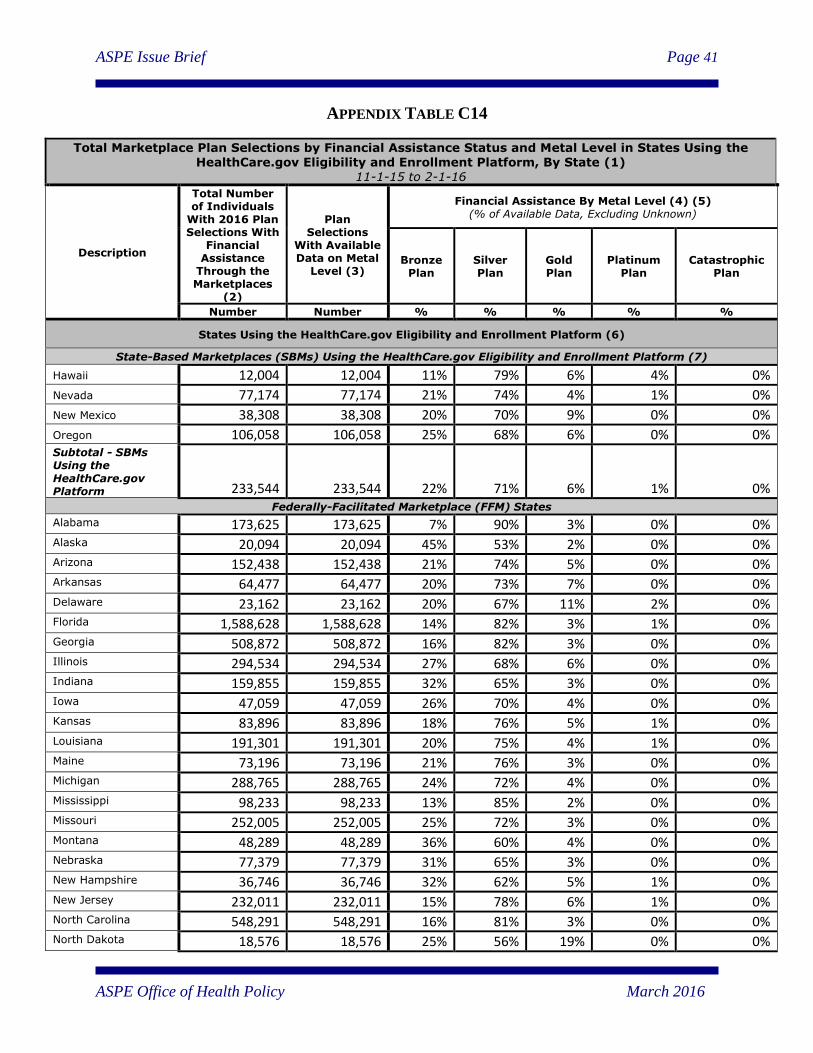
ASPE Issue Brief Page 41
ASPE Office of Health Policy March 2016
APPENDIX TABLE C14
Total Marketplace Plan Selections by Financial Assistance Status and Metal Level in States Using the HealthCare.gov Eligibility and Enrollment Platform, By State (1)
11-1-15 to 2-1-16
Description
Total Number of Individuals
With 2016 Plan Selections With
Financial Assistance
Through the Marketplaces
(2)
Plan Selections
With Available Data on Metal
Level (3)
Financial Assistance By Metal Level (4) (5) (% of Available Data, Excluding Unknown)
Bronze Plan
Silver Plan
Gold Plan
Platinum Plan
Catastrophic Plan
Number Number % % % % %
States Using the HealthCare.gov Eligibility and Enrollment Platform (6)
State-Based Marketplaces (SBMs) Using the HealthCare.gov Eligibility and Enrollment Platform (7)
Hawaii 12,004 12,004 11% 79% 6% 4% 0%
Nevada 77,174 77,174 21% 74% 4% 1% 0%
New Mexico 38,308 38,308 20% 70% 9% 0% 0%
Oregon 106,058 106,058 25% 68% 6% 0% 0% Subtotal - SBMs Using the
HealthCare.gov Platform 233,544 233,544 22% 71% 6% 1% 0%
Federally-Facilitated Marketplace (FFM) States
Alabama 173,625 173,625 7% 90% 3% 0% 0% Alaska 20,094 20,094 45% 53% 2% 0% 0% Arizona 152,438 152,438 21% 74% 5% 0% 0% Arkansas 64,477 64,477 20% 73% 7% 0% 0% Delaware 23,162 23,162 20% 67% 11% 2% 0% Florida 1,588,628 1,588,628 14% 82% 3% 1% 0% Georgia 508,872 508,872 16% 82% 3% 0% 0% Illinois 294,534 294,534 27% 68% 6% 0% 0% Indiana 159,855 159,855 32% 65% 3% 0% 0% Iowa 47,059 47,059 26% 70% 4% 0% 0% Kansas 83,896 83,896 18% 76% 5% 1% 0% Louisiana 191,301 191,301 20% 75% 4% 1% 0% Maine 73,196 73,196 21% 76% 3% 0% 0% Michigan 288,765 288,765 24% 72% 4% 0% 0% Mississippi 98,233 98,233 13% 85% 2% 0% 0% Missouri 252,005 252,005 25% 72% 3% 0% 0% Montana 48,289 48,289 36% 60% 4% 0% 0% Nebraska 77,379 77,379 31% 65% 3% 0% 0% New Hampshire 36,746 36,746 32% 62% 5% 1% 0% New Jersey 232,011 232,011 15% 78% 6% 1% 0% North Carolina 548,291 548,291 16% 81% 3% 0% 0% North Dakota 18,576 18,576 25% 56% 19% 0% 0%

ASPE Issue Brief Page 42
ASPE Office of Health Policy March 2016
Total Marketplace Plan Selections by Financial Assistance Status and Metal Level in States Using the
HealthCare.gov Eligibility and Enrollment Platform, By State (1) 11-1-15 to 2-1-16
Description
Total Number of Individuals
With 2016 Plan Selections With
Financial Assistance
Through the Marketplaces
(2)
Plan Selections
With Available Data on Metal
Level (3)
Financial Assistance By Metal Level (4) (5) (% of Available Data, Excluding Unknown)
Bronze Plan
Silver Plan
Gold Plan
Platinum Plan
Catastrophic Plan
Number Number % % % % %
Ohio 197,141 197,141 32% 63% 5% 0% 0% Oklahoma 123,653 123,653 26% 71% 3% 0% 0% Pennsylvania 337,813 337,813 12% 79% 7% 1% 0% South Carolina 206,208 206,208 8% 90% 2% 0% 0% South Dakota 23,116 23,116 18% 78% 3% 0% 0% Tennessee 228,267 228,267 23% 75% 2% 0% 0% Texas 1,098,944 1,098,944 25% 72% 3% 0% 0% Utah 152,502 152,502 13% 79% 8% 0% 0% Virginia 345,728 345,728 19% 76% 4% 0% 0% West Virginia 31,912 31,912 18% 74% 9% 0% 0% Wisconsin 201,323 201,323 21% 76% 3% 0% 0% Wyoming 21,476 21,476 26% 72% 3% 0% 0% TOTAL – States Using the HealthCare.gov Eligibility and Enrollment Platform 8,183,059 8,183,059 19% 77% 4% 0% 0%

ASPE Issue Brief Page 43
ASPE Office of Health Policy March 2016
Description
Total Number of Individuals
With 2016 Plan Selections Without Financial
Assistance Through the Marketplaces
(2)
Plan Selections
With Available Data on Metal
Level (3)
Without Financial Assistance By Metal Level (5) (% of Available Data, Excluding Unknown)
Bronze Plan
Silver Plan
Gold Plan
Platinum Plan
Catastrophic Plan
Number Number % % % % %
States Using the HealthCare.gov Eligibility and Enrollment Platform (6)
State-Based Marketplaces (SBMs) Using the HealthCare.gov Eligibility and Enrollment Platform (7)
Hawaii 2,560 2,560 38% 34% 14% 12% 2%
Nevada 10,971 10,971 38% 36% 13% 7% 6%
New Mexico 16,557 16,557 27% 40% 29% 2% 2%
Oregon 41,051 41,051 37% 41% 18% 0% 3% Subtotal - SBMs Using the HealthCare.gov Platform 71,139 71,139 35% 40% 20% 2% 4%
Federally-Facilitated Marketplace (FFM) States
Alabama 21,430 21,430 18% 50% 14% 2% 17% Alaska 2,935 2,935 49% 38% 8% 0% 4% Arizona 50,628 50,628 29% 32% 28% 2% 9% Arkansas 9,171 9,171 27% 43% 24% 0% 7% Delaware 5,094 5,094 31% 35% 25% 6% 3% Florida 154,191 154,191 28% 37% 18% 9% 8% Georgia 78,973 78,973 25% 39% 22% 0% 14% Illinois 93,645 93,645 39% 35% 24% 0% 2% Indiana 36,387 36,387 48% 37% 13% 0% 3% Iowa 8,030 8,030 46% 35% 16% 0% 2% Kansas 17,659 17,659 40% 35% 20% 5% 0% Louisiana 22,847 22,847 32% 34% 20% 5% 9% Maine 10,863 10,863 36% 44% 13% 0% 7% Michigan 57,048 57,048 33% 41% 17% 3% 7% Mississippi 10,439 10,439 22% 48% 13% 3% 14% Missouri 38,196 38,196 40% 37% 18% 1% 4% Montana 9,825 9,825 50% 30% 13% 0% 6% Nebraska 10,456 10,456 47% 29% 10% 0% 13% New Hampshire 18,437 18,437 42% 32% 18% 2% 5% New Jersey 56,562 56,562 22% 52% 16% 5% 5% North Carolina 65,196 65,196 31% 41% 10% 3% 16% North Dakota 3,028 3,028 31% 23% 28% 0% 17% Ohio 46,574 46,574 38% 33% 21% 1% 7%

ASPE Issue Brief Page 44
ASPE Office of Health Policy March 2016
Description
Total Number of Individuals
With 2016 Plan Selections Without Financial
Assistance Through the Marketplaces
(2)
Plan Selections
With Available Data on Metal
Level (3)
Without Financial Assistance By Metal Level (5) (% of Available Data, Excluding Unknown)
Bronze Plan
Silver Plan
Gold Plan
Platinum Plan
Catastrophic Plan
Number Number % % % % %
Oklahoma 21,676 21,676 48% 36% 14% 0% 2% Pennsylvania 101,425 101,425 24% 48% 22% 4% 3% South Carolina 25,641 25,641 19% 56% 15% 0% 10% South Dakota 2,883 2,883 31% 45% 11% 0% 13% Tennessee 40,600 40,600 43% 37% 10% 2% 8% Texas 207,264 207,264 36% 37% 20% 2% 5% Utah 23,135 23,135 28% 40% 28% 2% 3% Virginia 76,169 76,169 38% 33% 17% 1% 10% West Virginia 5,372 5,372 29% 45% 23% 0% 3% Wisconsin 37,711 37,711 38% 42% 13% 3% 5% Wyoming 2,294 2,294 48% 33% 12% 0% 7% TOTAL – States Using the HealthCare.gov Eligibility and Enrollment Platform 1,442,923 1,442,923 33% 39% 19% 3% 7%
Notes:
General: “N/A” means that the data for the respective metric are not yet available for a given state. Some numbers may not add to totals
due to rounding.
(1) Unless otherwise noted, the data in these tables represent cumulative data on the number of unique individuals who have selected or
have been automatically reenrolled into a 2016 Marketplace medical plan (with or without the first premium payment having been received
directly by the issuer). This is also known as pre-effectuated enrollment, because enrollment is not considered effectuated until the first
premium payment is made, and this data includes plan selections for which enrollment has not yet been effectuated. Individuals who have
cancelled or terminated their Marketplace plans are not included in the total number of plan selections. These data also do not include:
stand-alone dental plan selections; or individuals who may have selected a 2015 Marketplace plan during the reporting period, as a result of
having been eligible for a Special Enrollment Period (SEP). This table only reflects data for the individual market Marketplaces. For
additional technical notes, please refer to Appendix E of this Addendum.
(2) For each metric, the data represent the total number of Individuals Determined Eligible to Enroll in a plan Through the Marketplace
who have selected or been automatically reenrolled into a 2016 Marketplace medical plan (with or without the first premium payment
having been received directly by the Marketplace or the issuer) during the reference period, excluding plan selections with unknown data
for a given metric. This is also known as pre-effectuated enrollment, because enrollment is not considered effectuated until the first
premium payment is made, and this data includes plan selections for which enrollment has not yet been effectuated.
(3) In some cases, the data for certain characteristics of Marketplace plan selections are not yet available. For this reason, for each metric,
we have calculated the comparable percentages based on the number of plan selections with known data for that metric.
(4) Data on Marketplace plan selections with financial assistance includes plan selections for individuals who are receiving a premium tax
credit and/or cost-sharing subsidy.
(5) In instances where consumers selected more than one Marketplace medical plan metal level type in their state, an algorithm was used to
identify the “best” plan in order to prevent duplication.
(6) For the HealthCare.gov states, the data on 2016 Marketplace plan selections includes data for new consumers and consumers who are
actively reenrolling in Marketplace coverage (including data for consumers who actively reenrolled in coverage through the Marketplaces,
and data for automatic reenrollees).
(7) Hawaii, Nevada, New Mexico, and Oregon are using the HealthCare.gov eligibility and enrollment platform for 2016.
Source: Centers for Medicare & Medicaid Services, as of 3-8-16.
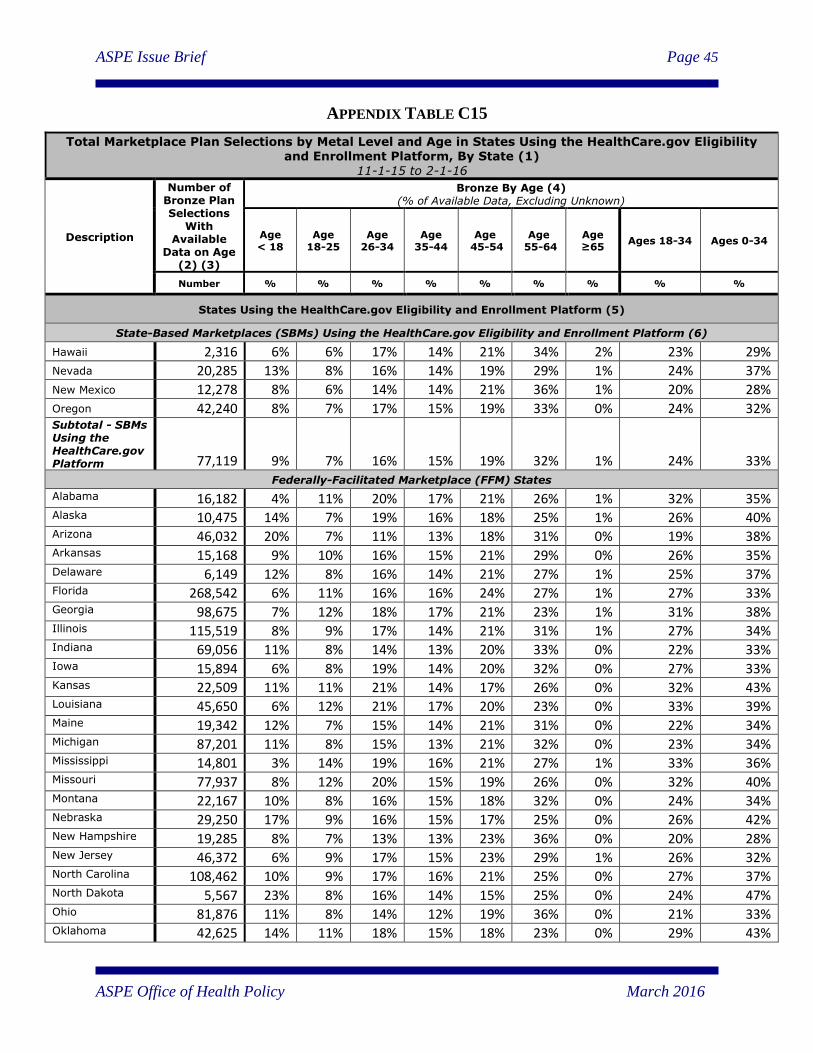
ASPE Issue Brief Page 45
ASPE Office of Health Policy March 2016
APPENDIX TABLE C15
Total Marketplace Plan Selections by Metal Level and Age in States Using the HealthCare.gov Eligibility and Enrollment Platform, By State (1)
11-1-15 to 2-1-16
Description
Number of Bronze Plan Selections
With Available
Data on Age (2) (3)
Bronze By Age (4) (% of Available Data, Excluding Unknown)
Age < 18
Age 18-25
Age 26-34
Age 35-44
Age 45-54
Age 55-64
Age ≥65
Ages 18-34 Ages 0-34
Number % % % % % % % % %
States Using the HealthCare.gov Eligibility and Enrollment Platform (5)
State-Based Marketplaces (SBMs) Using the HealthCare.gov Eligibility and Enrollment Platform (6)
Hawaii 2,316 6% 6% 17% 14% 21% 34% 2% 23% 29%
Nevada 20,285 13% 8% 16% 14% 19% 29% 1% 24% 37%
New Mexico 12,278 8% 6% 14% 14% 21% 36% 1% 20% 28%
Oregon 42,240 8% 7% 17% 15% 19% 33% 0% 24% 32%
Subtotal - SBMs Using the HealthCare.gov Platform 77,119 9% 7% 16% 15% 19% 32% 1% 24% 33%
Federally-Facilitated Marketplace (FFM) States
Alabama 16,182 4% 11% 20% 17% 21% 26% 1% 32% 35%
Alaska 10,475 14% 7% 19% 16% 18% 25% 1% 26% 40%
Arizona 46,032 20% 7% 11% 13% 18% 31% 0% 19% 38%
Arkansas 15,168 9% 10% 16% 15% 21% 29% 0% 26% 35%
Delaware 6,149 12% 8% 16% 14% 21% 27% 1% 25% 37%
Florida 268,542 6% 11% 16% 16% 24% 27% 1% 27% 33%
Georgia 98,675 7% 12% 18% 17% 21% 23% 1% 31% 38%
Illinois 115,519 8% 9% 17% 14% 21% 31% 1% 27% 34%
Indiana 69,056 11% 8% 14% 13% 20% 33% 0% 22% 33%
Iowa 15,894 6% 8% 19% 14% 20% 32% 0% 27% 33%
Kansas 22,509 11% 11% 21% 14% 17% 26% 0% 32% 43%
Louisiana 45,650 6% 12% 21% 17% 20% 23% 0% 33% 39%
Maine 19,342 12% 7% 15% 14% 21% 31% 0% 22% 34%
Michigan 87,201 11% 8% 15% 13% 21% 32% 0% 23% 34%
Mississippi 14,801 3% 14% 19% 16% 21% 27% 1% 33% 36%
Missouri 77,937 8% 12% 20% 15% 19% 26% 0% 32% 40%
Montana 22,167 10% 8% 16% 15% 18% 32% 0% 24% 34%
Nebraska 29,250 17% 9% 16% 15% 17% 25% 0% 26% 42%
New Hampshire 19,285 8% 7% 13% 13% 23% 36% 0% 20% 28%
New Jersey 46,372 6% 9% 17% 15% 23% 29% 1% 26% 32%
North Carolina 108,462 10% 9% 17% 16% 21% 25% 0% 27% 37%
North Dakota 5,567 23% 8% 16% 14% 15% 25% 0% 24% 47%
Ohio 81,876 11% 8% 14% 12% 19% 36% 0% 21% 33%
Oklahoma 42,625 14% 11% 18% 15% 18% 23% 0% 29% 43%

ASPE Issue Brief Page 46
ASPE Office of Health Policy March 2016
Total Marketplace Plan Selections by Metal Level and Age in States Using the HealthCare.gov Eligibility
and Enrollment Platform, By State (1) 11-1-15 to 2-1-16
Description
Number of Bronze Plan Selections
With Available
Data on Age (2) (3)
Bronze By Age (4) (% of Available Data, Excluding Unknown)
Age < 18
Age 18-25
Age 26-34
Age 35-44
Age 45-54
Age 55-64
Age ≥65
Ages 18-34 Ages 0-34
Number % % % % % % % % %
Pennsylvania 66,127 6% 8% 19% 14% 21% 31% 0% 27% 34%
South Carolina 21,403 9% 9% 17% 15% 22% 28% 0% 26% 35%
South Dakota 5,101 13% 9% 20% 15% 17% 26% 0% 29% 42%
Tennessee 69,688 8% 10% 19% 16% 20% 26% 0% 29% 37%
Texas 345,309 11% 13% 16% 16% 21% 22% 1% 29% 40%
Utah 26,089 25% 11% 20% 15% 13% 17% 0% 30% 55%
Virginia 95,215 13% 10% 17% 15% 20% 23% 1% 27% 40%
West Virginia 7,280 6% 6% 14% 14% 21% 38% 1% 20% 26%
Wisconsin 55,772 7% 8% 16% 13% 20% 36% 0% 23% 31%
Wyoming 6,595 15% 7% 17% 13% 17% 30% 0% 24% 39%
TOTAL – States Using the HealthCare.gov Eligibility and Enrollment
Platform 2,060,434 10% 10% 17% 15% 21% 27% 1% 27% 37%

ASPE Issue Brief Page 47
ASPE Office of Health Policy March 2016
Description
Number of Silver Plan Selections
With Available
Data on Age (2) (3)
Silver By Age (4) (% of Available Data, Excluding Unknown)
Age < 18
Age 18-25
Age 26-34
Age 35-44
Age 45-54
Age 55-64
Age ≥65
Ages 18-34 Ages 0-34
Number % % % % % % % % %
States Using the HealthCare.gov Eligibility and Enrollment Platform (5)
State-Based Marketplaces (SBMs) Using the HealthCare.gov Eligibility and Enrollment Platform (6)
Hawaii 10,346 4% 8% 16% 19% 21% 30% 1% 24% 29%
Nevada 61,144 14% 9% 15% 15% 20% 26% 1% 23% 37%
New Mexico 33,613 7% 7% 14% 14% 22% 35% 1% 21% 28%
Oregon 89,169 8% 7% 17% 16% 19% 32% 1% 24% 32%
Subtotal - SBMs Using the HealthCare.gov Platform 194,272 9% 8% 15% 16% 20% 31% 1% 23% 33%
Federally-Facilitated Marketplace (FFM) States
Alabama 166,224 4% 12% 18% 18% 22% 26% 0% 30% 34%
Alaska 11,681 9% 8% 19% 15% 20% 28% 1% 27% 37%
Arizona 128,482 25% 8% 12% 13% 17% 24% 1% 21% 46%
Arkansas 51,187 8% 9% 15% 16% 21% 32% 1% 23% 31%
Delaware 17,353 12% 8% 15% 15% 21% 27% 1% 23% 36%
Florida 1,365,449 6% 13% 15% 17% 24% 24% 1% 28% 34%
Georgia 447,617 7% 13% 17% 19% 22% 21% 1% 30% 37%
Illinois 231,997 7% 10% 18% 16% 21% 28% 1% 28% 35%
Indiana 117,307 10% 9% 15% 16% 20% 30% 0% 24% 34%
Iowa 35,604 5% 9% 16% 15% 21% 34% 1% 25% 30%
Kansas 69,758 9% 12% 19% 16% 19% 26% 0% 31% 39%
Louisiana 151,155 4% 12% 19% 17% 22% 25% 0% 32% 36%
Maine 60,088 10% 8% 15% 14% 21% 32% 0% 23% 33%
Michigan 231,154 10% 9% 16% 15% 21% 29% 1% 25% 35%
Mississippi 88,674 4% 14% 16% 18% 22% 26% 1% 30% 34%
Missouri 195,155 9% 11% 18% 16% 20% 25% 0% 29% 38%
Montana 32,101 6% 10% 20% 16% 18% 30% 0% 29% 35%
Nebraska 53,636 14% 11% 19% 17% 17% 22% 0% 30% 44%
New Hampshire 28,923 7% 9% 16% 15% 22% 31% 0% 24% 31%
New Jersey 210,994 8% 10% 15% 15% 23% 27% 1% 25% 33%
North Carolina 470,342 9% 11% 17% 18% 22% 24% 0% 28% 36%
North Dakota 11,085 22% 9% 18% 14% 15% 23% 0% 26% 49%
Ohio 138,716 11% 8% 16% 14% 19% 31% 1% 24% 34%
Oklahoma 95,395 9% 11% 17% 16% 20% 26% 1% 28% 37%
Pennsylvania 315,987 6% 9% 16% 15% 21% 31% 1% 25% 31%
South Carolina 199,169 8% 11% 16% 16% 22% 26% 0% 27% 35%
South Dakota 19,408 12% 10% 19% 16% 16% 27% 0% 29% 42%
Tennessee 185,803 6% 10% 17% 16% 22% 29% 0% 26% 32%

ASPE Issue Brief Page 48
ASPE Office of Health Policy March 2016
Description
Number of Silver Plan Selections
With Available
Data on Age (2) (3)
Silver By Age (4) (% of Available Data, Excluding Unknown)
Age < 18
Age 18-25
Age 26-34
Age 35-44
Age 45-54
Age 55-64
Age ≥65
Ages 18-34 Ages 0-34
Number % % % % % % % % %
Texas 869,040 9% 13% 16% 17% 22% 22% 1% 29% 38%
Utah 129,554 22% 13% 21% 16% 13% 15% 0% 33% 55%
Virginia 289,628 10% 12% 17% 17% 20% 23% 1% 29% 39%
West Virginia 25,893 5% 7% 13% 15% 21% 39% 1% 19% 25%
Wisconsin 168,470 6% 9% 17% 15% 20% 33% 0% 26% 31%
Wyoming 16,141 13% 10% 19% 16% 16% 26% 0% 29% 42%
TOTAL – States Using the HealthCare.gov Eligibility and Enrollment Platform 6,823,442 8% 11% 16% 17% 21% 25% 1% 28% 36%

ASPE Issue Brief Page 49
ASPE Office of Health Policy March 2016
Description
Number of Gold Plan Selections
With Available
Data on Age (2) (3)
Gold By Age (4) (% of Available Data, Excluding Unknown)
Age < 18
Age 18-25
Age 26-34
Age 35-44
Age 45-54
Age 55-64
Age ≥65
Ages 18-34 Ages 0-34
Number % % % % % % % % %
States Using the HealthCare.gov Eligibility and Enrollment Platform (5)
State-Based Marketplaces (SBMs) Using the HealthCare.gov Eligibility and Enrollment Platform (6)
Hawaii 1,023 11% 6% 10% 16% 21% 35% 1% 16% 27%
Nevada 4,190 19% 7% 18% 16% 17% 22% 1% 25% 44%
New Mexico 8,257 14% 7% 15% 16% 20% 27% 0% 22% 36%
Oregon 14,298 16% 7% 17% 17% 17% 26% 0% 24% 40%
Subtotal - SBMs Using the HealthCare.gov Platform 27,768 16% 7% 16% 17% 18% 26% 0% 23% 39%
Federally-Facilitated Marketplace (FFM) States
Alabama 8,313 10% 10% 19% 18% 19% 24% 0% 29% 38%
Alaska 740 20% 7% 21% 19% 15% 17% 0% 28% 48%
Arizona 22,724 23% 7% 15% 16% 17% 20% 0% 22% 46%
Arkansas 6,644 15% 7% 13% 14% 20% 30% 0% 21% 36%
Delaware 3,803 19% 6% 15% 15% 20% 25% 0% 21% 40%
Florida 68,016 18% 8% 15% 16% 20% 22% 1% 22% 40%
Georgia 30,193 19% 8% 16% 19% 20% 18% 0% 24% 43%
Illinois 38,724 16% 8% 18% 17% 19% 21% 0% 26% 42%
Indiana 8,927 20% 8% 15% 18% 18% 20% 0% 23% 44%
Iowa 3,441 12% 7% 17% 15% 18% 31% 0% 24% 36%
Kansas 7,805 18% 9% 18% 15% 16% 25% 0% 27% 45%
Louisiana 12,544 14% 8% 20% 18% 19% 20% 0% 28% 42%
Maine 3,889 18% 7% 13% 16% 19% 27% 0% 20% 38%
Michigan 20,617 19% 8% 15% 16% 19% 22% 0% 24% 43%
Mississippi 3,057 12% 10% 17% 16% 20% 23% 0% 27% 40%
Missouri 14,601 16% 8% 18% 16% 18% 23% 0% 27% 43%
Montana 3,229 15% 7% 18% 18% 19% 23% 0% 25% 40%
Nebraska 3,553 22% 9% 18% 16% 16% 19% 0% 27% 49%
New Hampshire 5,280 18% 7% 15% 17% 21% 22% 0% 23% 41%
New Jersey 22,707 17% 8% 16% 17% 21% 21% 0% 24% 41%
North Carolina 20,391 21% 8% 16% 18% 19% 19% 0% 23% 44%
North Dakota 4,435 26% 6% 16% 13% 14% 24% 0% 22% 48%
Ohio 19,360 20% 7% 16% 17% 18% 22% 0% 23% 43%
Oklahoma 6,929 17% 9% 20% 18% 18% 18% 0% 29% 46%
Pennsylvania 47,015 13% 7% 15% 15% 20% 30% 0% 23% 35%
South Carolina 8,841 17% 8% 15% 17% 20% 23% 0% 24% 41%
South Dakota 1,110 20% 10% 20% 15% 16% 20% 0% 30% 50%
Tennessee 8,750 14% 8% 19% 18% 19% 22% 0% 27% 41%

ASPE Issue Brief Page 50
ASPE Office of Health Policy March 2016
Description
Number of Gold Plan Selections
With Available
Data on Age (2) (3)
Gold By Age (4) (% of Available Data, Excluding Unknown)
Age < 18
Age 18-25
Age 26-34
Age 35-44
Age 45-54
Age 55-64
Age ≥65
Ages 18-34 Ages 0-34
Number % % % % % % % % %
Texas 75,684 22% 9% 20% 18% 16% 15% 0% 28% 50%
Utah 18,587 30% 10% 17% 15% 12% 16% 0% 27% 57%
Virginia 27,772 20% 8% 18% 17% 18% 18% 1% 26% 46%
West Virginia 3,976 13% 7% 13% 16% 21% 30% 0% 20% 33%
Wisconsin 11,029 15% 7% 16% 16% 19% 27% 0% 23% 38%
Wyoming 872 21% 8% 18% 16% 17% 20% 0% 27% 48%
TOTAL – States Using the HealthCare.gov Eligibility and Enrollment Platform 571,326 18% 8% 17% 17% 18% 21% 0% 25% 43%

ASPE Issue Brief Page 51
ASPE Office of Health Policy March 2016
Description
Number of Platinum
Plan Selections
With Available
Data on Age (2) (3)
Platinum By Age (4) (% of Available Data, Excluding Unknown)
Age < 18
Age 18-25
Age 26-34
Age 35-44
Age 45-54
Age 55-64
Age ≥65
Ages 18-34 Ages 0-34
Number % % % % % % % % %
States Using the HealthCare.gov Eligibility and Enrollment Platform (5)
State-Based Marketplaces (SBMs) Using the HealthCare.gov Eligibility and Enrollment Platform (6)
Hawaii 828 14% 4% 13% 17% 22% 30% 0% 17% 31%
Nevada 1,844 19% 8% 23% 20% 16% 14% 0% 31% 50%
New Mexico 324 19% 6% 17% 20% 18% 19% 1% 23% 41%
Oregon 0 N/A N/A N/A N/A N/A N/A N/A N/A N/A
Subtotal - SBMs Using the HealthCare.gov Platform 2,996 17% 6% 20% 19% 18% 19% 1% 26% 44%
Federally-Facilitated Marketplace (FFM) States
Alabama 777 9% 11% 25% 19% 18% 18% 0% 36% 45%
Alaska N/A N/A N/A N/A N/A N/A N/A N/A N/A N/A
Arizona 1,404 18% 10% 20% 20% 17% 14% 1% 31% 49%
Arkansas 0 N/A N/A N/A N/A N/A N/A N/A N/A N/A
Delaware 810 20% 7% 15% 18% 21% 18% 0% 23% 42%
Florida 28,024 16% 8% 18% 19% 20% 18% 1% 26% 43%
Georgia 0 N/A N/A N/A N/A N/A N/A N/A N/A N/A
Illinois 0 N/A N/A N/A N/A N/A N/A N/A N/A N/A
Indiana 0 N/A N/A N/A N/A N/A N/A N/A N/A N/A
Iowa 17 29% 6% 6% 41% 12% 6% 0% 12% 41%
Kansas 1,483 12% 9% 22% 18% 21% 18% 0% 31% 43%
Louisiana 2,678 13% 11% 25% 20% 17% 13% 0% 36% 49%
Maine 0 N/A N/A N/A N/A N/A N/A N/A N/A N/A
Michigan 3,041 17% 9% 22% 18% 18% 15% 0% 31% 48%
Mississippi 708 15% 11% 18% 22% 17% 18% 1% 29% 43%
Missouri 836 17% 8% 28% 20% 14% 13% 0% 36% 53%
Montana 0 N/A N/A N/A N/A N/A N/A N/A N/A N/A
Nebraska 0 N/A N/A N/A N/A N/A N/A N/A N/A N/A
New Hampshire 687 14% 10% 23% 23% 21% 9% 0% 33% 47%
New Jersey 5,913 19% 8% 18% 21% 19% 14% 0% 27% 45%
North Carolina 3,941 18% 8% 20% 22% 18% 15% 0% 27% 45%
North Dakota 0 N/A N/A N/A N/A N/A N/A N/A N/A N/A
Ohio 635 23% 8% 16% 19% 19% 16% 0% 23% 46%
Oklahoma 0 N/A N/A N/A N/A N/A N/A N/A N/A N/A
Pennsylvania 7,147 15% 8% 19% 19% 19% 20% 1% 27% 42%
South Carolina 0 N/A N/A N/A N/A N/A N/A N/A N/A N/A
South Dakota 0 N/A N/A N/A N/A N/A N/A N/A N/A N/A

ASPE Issue Brief Page 52
ASPE Office of Health Policy March 2016
Description
Number of Platinum
Plan Selections
With Available
Data on Age (2) (3)
Platinum By Age (4) (% of Available Data, Excluding Unknown)
Age < 18
Age 18-25
Age 26-34
Age 35-44
Age 45-54
Age 55-64
Age ≥65
Ages 18-34 Ages 0-34
Number % % % % % % % % %
Tennessee 1,470 13% 10% 24% 22% 18% 12% 0% 34% 47%
Texas 4,936 20% 8% 24% 22% 16% 10% 0% 32% 52%
Utah 768 25% 11% 22% 20% 11% 10% 0% 34% 59%
Virginia 1,647 18% 12% 27% 21% 14% 7% 0% 38% 57%
West Virginia 0 N/A N/A N/A N/A N/A N/A N/A N/A N/A
Wisconsin 1,782 18% 7% 20% 20% 17% 18% 0% 26% 45%
Wyoming 0 N/A N/A N/A N/A N/A N/A N/A N/A N/A
TOTAL – States
Using the HealthCare.gov Eligibility and Enrollment Platform 71,701 17% 8% 20% 20% 18% 16% 1% 28% 45%

ASPE Issue Brief Page 53
ASPE Office of Health Policy March 2016
Description
Number of Catastrophic
Plan Selections
With Available
Data on Age (2) (3)
Catastrophic By Age (4) (% of Available Data, Excluding Unknown)
Age < 18
Age 18-25
Age 26-34
Age 35-44
Age 45-54
Age 55-64
Age ≥65
Ages 18-34 Ages 0-34
Number % % % % % % % % %
States Using the HealthCare.gov Eligibility and Enrollment Platform (5)
State-Based Marketplaces (SBMs) Using the HealthCare.gov Eligibility and Enrollment Platform (6)
Hawaii 51 6% 45% 43% 2% 0% 0% 4% 88% 94%
Nevada 681 13% 33% 54% 0% 0% 0% 0% 87% 100%
New Mexico 392 8% 39% 52% 1% 0% 0% 0% 92% 99%
Oregon 1,400 5% 33% 61% 0% 0% 0% 0% 94% 100%
Subtotal - SBMs Using the HealthCare.gov Platform 2,524 8% 34% 58% 0% 0% 0% 0% 92% 100%
Federally-Facilitated Marketplace (FFM) States
Alabama 3,556 1% 35% 43% 11% 7% 3% 0% 78% 79%
Alaska 132 11% 28% 61% 0% 0% 0% 0% 89% 100%
Arizona 4,424 20% 34% 46% 0% 0% 0% 0% 79% 100%
Arkansas 649 6% 41% 51% 2% 1% 0% 0% 91% 97%
Delaware 141 11% 26% 62% 0% 0% 0% 1% 89% 99%
Florida 12,781 5% 33% 45% 7% 6% 4% 0% 78% 84%
Georgia 11,357 4% 32% 47% 9% 5% 3% 0% 79% 83%
Illinois 1,938 6% 32% 62% 0% 0% 0% 0% 94% 100%
Indiana 949 11% 29% 60% 1% 0% 0% 0% 89% 99%
Iowa 133 3% 33% 60% 3% 1% 0% 0% 93% 96%
Kansas 0 N/A N/A N/A N/A N/A N/A N/A N/A N/A
Louisiana 2,120 2% 32% 47% 10% 5% 3% 0% 79% 81%
Maine 740 5% 28% 57% 3% 3% 4% 0% 86% 90%
Michigan 3,798 6% 30% 64% 0% 0% 0% 0% 93% 99%
Mississippi 1,432 4% 39% 38% 10% 6% 3% 0% 77% 81%
Missouri 1,670 5% 33% 46% 8% 6% 3% 0% 79% 84%
Montana 616 7% 32% 60% 1% 0% 0% 0% 91% 99%
Nebraska 1,396 6% 32% 48% 6% 4% 4% 0% 80% 86%
New Hampshire 1,008 4% 32% 64% 0% 0% 0% 0% 96% 100%
New Jersey 2,587 4% 29% 67% 0% 0% 0% 0% 96% 99%
North Carolina 10,349 6% 29% 50% 7% 5% 3% 0% 79% 85%
North Dakota 517 13% 35% 52% 0% 0% 0% 0% 87% 100%
Ohio 3,126 8% 28% 64% 0% 0% 0% 0% 92% 100%
Oklahoma 378 9% 35% 37% 9% 6% 4% 0% 72% 81%
Pennsylvania 2,956 3% 34% 62% 1% 0% 0% 0% 96% 99%
South Carolina 2,436 4% 31% 49% 8% 5% 3% 0% 80% 84%
South Dakota 380 11% 31% 45% 7% 4% 3% 0% 76% 87%

ASPE Issue Brief Page 54
ASPE Office of Health Policy March 2016
Description
Number of Catastrophic
Plan Selections
With Available
Data on Age (2) (3)
Catastrophic By Age (4) (% of Available Data, Excluding Unknown)
Age < 18
Age 18-25
Age 26-34
Age 35-44
Age 45-54
Age 55-64
Age ≥65
Ages 18-34 Ages 0-34
Number % % % % % % % % %
Tennessee 3,155 4% 32% 45% 7% 7% 4% 0% 77% 81%
Texas 11,231 9% 32% 44% 7% 5% 3% 0% 76% 85%
Utah 637 12% 37% 51% 0% 0% 0% 0% 88% 100%
Virginia 7,634 3% 31% 53% 6% 4% 3% 0% 84% 87%
West Virginia 135 1% 29% 68% 1% 0% 0% 1% 97% 99%
Wisconsin 1,979 5% 34% 61% 0% 0% 0% 0% 95% 100%
Wyoming 162 7% 27% 43% 10% 7% 5% 0% 70% 78%
TOTAL – States
Using the HealthCare.gov Eligibility and Enrollment Platform 99,026 6% 32% 50% 5% 4% 2% 0% 82% 88%

ASPE Issue Brief Page 55
ASPE Office of Health Policy March 2016
Description
Number of Stand-alone Dental Plan Selections
With Available
Data on Age (2) (3)
Stand-alone Dental By Age (% of Available Data, Excluding Unknown)
Age < 18
Age 18-25
Age 26-34
Age 35-44
Age 45-54
Age 55-64
Age ≥65
Ages 18-34 Ages 0-34
Number % % % % % % % % %
States Using the HealthCare.gov Eligibility and Enrollment Platform (5)
State-Based Marketplaces (SBMs) Using the HealthCare.gov Eligibility and Enrollment Platform (6)
Hawaii 4,183 8% 6% 15% 19% 21% 29% 1% 21% 29%
Nevada 15,685 14% 9% 20% 18% 18% 19% 1% 30% 44%
New Mexico 10,887 10% 7% 19% 17% 20% 27% 1% 26% 36%
Oregon 26,039 6% 8% 25% 19% 18% 25% 1% 32% 38%
Subtotal - SBMs Using the HealthCare.gov Platform 56,794 9% 8% 22% 18% 19% 24% 1% 29% 39%
Federally-Facilitated Marketplace (FFM) States
Alabama 42,394 2% 12% 23% 21% 20% 21% 0% 36% 37%
Alaska 3,416 4% 8% 26% 19% 19% 24% 1% 34% 38%
Arizona 21,555 11% 10% 22% 17% 18% 21% 1% 32% 43%
Arkansas 11,612 11% 9% 19% 18% 18% 24% 1% 28% 39%
Delaware 4,137 6% 9% 21% 19% 21% 23% 1% 31% 36%
Florida 223,524 7% 13% 20% 19% 21% 20% 1% 32% 39%
Georgia 83,027 7% 13% 23% 21% 20% 16% 0% 36% 43%
Illinois 76,893 8% 9% 23% 17% 19% 23% 1% 32% 40%
Indiana 22,985 11% 8% 21% 19% 18% 22% 0% 29% 40%
Iowa 7,983 5% 8% 24% 18% 19% 26% 1% 32% 36%
Kansas 20,888 7% 11% 24% 18% 17% 23% 0% 35% 42%
Louisiana 25,575 2% 12% 27% 20% 19% 19% 0% 40% 42%
Maine 8,520 11% 8% 20% 16% 20% 25% 0% 27% 39%
Michigan 57,094 11% 9% 23% 17% 19% 20% 0% 32% 44%
Mississippi 9,181 5% 14% 20% 19% 20% 21% 0% 35% 40%
Missouri 29,504 6% 12% 26% 18% 18% 20% 0% 37% 44%
Montana 8,862 12% 8% 21% 17% 16% 26% 0% 28% 40%
Nebraska 8,427 9% 12% 27% 20% 15% 16% 1% 39% 49%
New Hampshire 6,071 10% 8% 20% 17% 21% 22% 0% 29% 39%
New Jersey 50,335 10% 10% 20% 18% 21% 20% 1% 30% 40%
North Carolina 66,760 3% 10% 26% 22% 21% 18% 0% 36% 39%
North Dakota 1,989 9% 12% 28% 17% 17% 17% 1% 40% 49%
Ohio 29,000 13% 8% 21% 17% 18% 23% 0% 29% 41%
Oklahoma 29,837 11% 11% 22% 18% 17% 21% 0% 32% 43%
Pennsylvania 75,568 4% 9% 24% 18% 21% 24% 0% 33% 37%
South Carolina 20,377 7% 10% 26% 20% 18% 17% 0% 37% 44%
South Dakota 2,633 3% 11% 27% 20% 16% 22% 1% 38% 41%

ASPE Issue Brief Page 56
ASPE Office of Health Policy March 2016
Description
Number of Stand-alone Dental Plan Selections
With Available
Data on Age (2) (3)
Stand-alone Dental By Age (% of Available Data, Excluding Unknown)
Age < 18
Age 18-25
Age 26-34
Age 35-44
Age 45-54
Age 55-64
Age ≥65
Ages 18-34 Ages 0-34
Number % % % % % % % % %
Tennessee 36,697 3% 11% 27% 19% 19% 19% 1% 38% 41%
Texas 263,118 12% 13% 21% 18% 19% 17% 1% 34% 45%
Utah 26,326 19% 13% 27% 18% 13% 10% 1% 39% 58%
Virginia 60,603 6% 12% 24% 19% 19% 20% 1% 36% 42%
West Virginia 5,471 3% 7% 19% 19% 20% 32% 0% 26% 29%
Wisconsin 25,448 6% 9% 25% 18% 19% 22% 0% 34% 40%
Wyoming 2,857 3% 9% 30% 22% 17% 19% 0% 39% 42%
TOTAL – States
Using the HealthCare.gov Eligibility and Enrollment Platform 1,425,461 8% 11% 23% 19% 19% 20% 1% 34% 42%
Notes:
General: “N/A” means that the data for the respective metric are not yet available for a given state. Some numbers may not add to totals
due to rounding.
(1) Unless otherwise noted, the data in these tables represent cumulative data on the number of unique individuals who have selected or
have been automatically reenrolled into a 2016 Marketplace medical plan (with or without the first premium payment having been
received directly by the issuer). This is also known as pre-effectuated enrollment, because enrollment is not considered effectuated until
the first premium payment is made, and this data includes plan selections for which enrollment has not yet been effectuated. Individuals
who have cancelled or terminated their Marketplace plans are not included in the total number of plan selections. These data also do not
include: stand-alone dental plan selections; or individuals who may have selected a 2015 Marketplace plan during the reporting period, as
a result of having been eligible for a Special Enrollment Period (SEP). This table only reflects data for the individual market
Marketplaces. For additional technical notes, please refer to Appendix E of this Addendum.
(2) For each metric, the data represent the total number of Individuals Determined Eligible to Enroll in a plan Through the Marketplace
who have selected or been automatically reenrolled into a 2016 Marketplace medical plan (with or without the first premium payment
having been received directly by the Marketplace or the issuer) during the reference period, excluding plan selections with unknown data
for a given metric. This is also known as pre-effectuated enrollment, because enrollment is not considered effectuated until the first
premium payment is made, and this data includes plan selections for which enrollment has not yet been effectuated.
(3) In some cases, the data for certain characteristics of Marketplace plan selections are not yet available. For this reason, for each metric,
we have calculated the comparable percentages based on the number of plan selections with known data for that metric.
(4) In instances where consumers selected more than one Marketplace medical plan metal level type in their state, an algorithm was used
to identify the “best” plan in order to prevent duplication.
(5) For the HealthCare.gov states, the data on 2016 Marketplace plan selections includes data for new consumers and consumers who are
actively reenrolling in Marketplace coverage (including data for consumers who actively reenrolled in coverage through the Marketplaces,
and data for automatic reenrollees).
(6) Hawaii, Nevada, New Mexico, and Oregon are using the HealthCare.gov eligibility and enrollment platform for 2016.
Source: Centers for Medicare & Medicaid Services, as of 3-8-16.

ASPE Issue Brief Page 57
ASPE Office of Health Policy March 2016
APPENDIX TABLE D1
Marketplace Plan Selection by Enrollment Type in State-Based Marketplaces Using Their Own Marketplace Platforms, By State, 2016 (1) (2)
11-1-15 to 2-1-16
Description
Total Number of Individuals
With 2016 Plan
Selections Through the Marketplaces
(3)
Plan Selections
With Available Data on
Enrollment Type(4)
Distribution By Enrollment Type (4)
New Consumers
(5)
Consumers Reenrolling in Marketplace Coverage (6)
Total Reenrollees
Active Reenrollees
(7)
Automatic Reenrollees
(8)
Unknown Reenrollment
Type
Number Number % of Total % of Total % of Total % of Total % of Total
State-Based Marketplaces (SBMs) Using Their Own Marketplace Platforms (9)
California 1,575,340 1,575,340 27% 73% 27% 46% 0% Colorado 150,769 150,769 48% 52% 40% 13% 0% Connecticut 116,019 116,019 32% 68% 13% 55% 0% District of
Columbia (10) 22,693 22,693 26% 74% 13% 61% 0% Idaho 101,073 101,073 33% 67% 21% 46% 0% Kentucky 93,666 93,666 20% 80% 59% 22% 0% Maryland 162,177 162,177 30% 70% 10% 60% 0% Massachusetts 12 213,883 213,883 22% 78% N/A N/A N/A Minnesota (10) (11) (12) 83,507 83,507 45% 55% N/A N/A N/A New York (11) (12) 271,964 271,964 19% 81% N/A N/A N/A Rhode Island 34,670 34,670 22% 78% 16% 62% 0% Vermont 29,440 29,440 6% 94% 9% 84% 0% Washington (13) 200,691 200,691 37% 63% 24% 39% 0% State-Based Marketplaces (SBMs) Using Their Own Marketplace Platforms 3,055,892 3,055,892 28% 72% 21% 36% 0%
Notes:
General: “N/A” means that the data for the respective metric are not yet available for a given state. Some numbers may not add
to totals due to rounding.
(1) Unless otherwise noted, the data in these tables represent cumulative data on the number of individuals who have selected or
have been automatically reenrolled into a 2016 Marketplace medical plan (with or without the first premium payment having
been received directly by the issuer). This is also known as pre-effectuated enrollment, because enrollment is not considered
effectuated until the first premium payment is made, and this data includes plan selections for which enrollment has not yet been
effectuated. Individuals who have cancelled or terminated their Marketplace plans are not included in the total number of plan
selections. These data also do not include: standalone dental plan selections; or individuals who may have selected a 2015
Marketplace plan during the reporting period, as a result of having been eligible for a Special Enrollment Period (SEP). This
table only reflects data for the individual market Marketplaces. For additional technical notes, please refer to Appendix E of this
Addendum.
(2) Most of the data in this report are for the 11-1-15 to 2-1-16 reporting period with the following exception: the data for 9
SBMs that are using their own Marketplace platforms (California, District of Columbia, Idaho, Kentucky, Maryland, New York,
Rhode Island, Vermont, and Washington) are for the 11-1-15 to 1-31-16 reporting period.

ASPE Issue Brief Page 58
ASPE Office of Health Policy March 2016
(3) For each metric, the data represent the total number of Individuals Determined Eligible to Enroll in a plan Through the
Marketplace who have selected or been automatically reenrolled into a 2016 Marketplace medical plan (with or without the first
premium payment having been received directly by the Marketplace or the issuer) during the reference period, excluding plan
selections with unknown data for a given metric. This is also known as pre-effectuated enrollment, because enrollment is not
considered effectuated until the first premium payment is made, and this data includes plan selections for which enrollment has
not yet been effectuated.
(4) “Distribution by Enrollment Type” represents the percentage of plan selections with available data on enrollment type that are
new consumers vs. consumers reenrolling in coverage through the Marketplaces.
(5) “New Consumers” are those individuals who selected a 2016 Marketplace medical plan (with or without the first premium
payment having been received directly by the issuer) as of the reporting date, and did not have a Marketplace plan selection as of
November 2015. Individuals who have cancelled or terminated their Marketplace plans are not included in the total number of
plan selections. These data also do not include: standalone dental plan selections; or individuals who may have selected a 2015
Marketplace plan during the reporting period, as a result of having been eligible for a Special Enrollment Period (SEP).
(6) “Consumers reenrolling in coverage through the Marketplaces” are those individuals who were enrolled in a Marketplace plan
as of October 31 2015 for 2015 coverage, and have either actively submitted a 2016 application and selected a 2016 Marketplace
medical plan or have been automatically reenrolled in coverage through the Marketplaces – with or without the first premium
payment having been received directly by the issuer). Individuals who have cancelled or terminated their Marketplace plans are
not included in the total number of plan selections, except for DC and Minnesota. These data also do not include: standalone
dental plan selections; or individuals who may have selected a 2015 Marketplace plan during the reporting period, as a result of
having been eligible for a Special Enrollment Period (SEP). It is important to note that the reenrollment data in this report may
include some individuals who were reenrolled in coverage through the Marketplaces as of 2-1-16, but who may ultimately decide
not to retain Marketplace coverage for the remainder of 2016 (for example, because they have obtained coverage through another
source such as an employer or Medicaid/CHIP). The plan selection data in future reports will exclude these individuals (e.g., due
to the subsequent cancellation or termination of their coverage).
(7) Active Reenrollees are individuals who had a Marketplace plan selection as of October 31, 2015, and return to the
Marketplace to select a new plan or actively renew their existing plan.
(8) Automatic Reenrollees are individuals who had a Marketplace plan selection as of October 31, 2015, and retain coverage
without returning to the Marketplace and selecting a plan. A consumer was automatically reenrolled into their 2015 plan or a
crosswalked plan if they were enrolled in a Marketplace plan in 2015 and did not select a plan ahead of a SBM’s deadline for
enrollment for January 1, 2016 coverage.
(9) All of the SBMs using their own Marketplace platforms have processed automatic re-enrollments, including these individuals
in plan selection reports. Additionally, most of the SBMs using their own Marketplace platforms removed cancellations and
terminations from their data reports for new enrollees, active re-enrollees, and automatic re-enrollees.
(10) DC does not remove cancellations and terminations from any of its plan selection data and Minnesota only removes
cancellations for individuals that self-report a cancellation to Minnesota. Since Minnesota does not perform effectuations itself,
Minnesota is not able to accurately determine the number of terminations and cancellations, as consumers can terminate their
coverage directly with an issuer.
(11) Minnesota and New York have begun enrolling individuals in a Basic Health Plan. These individuals are not included in
reports of total QHP plan selections for these states. New York has begun enrolling eligible Marketplace enrollees in its Basic
Health Program (BHP), known as the "Essential Plan" in New York, including individuals with incomes less than or equal to
200% of FPL, who would have otherwise been eligible for QHP enrollment. BHP enrollees are not included in QHP eligibility
and enrollment totals. BHP data include all new enrollees to NYSOH Marketplace after November 1, QHP enrollees who were
redetermined eligible for the Essential Plan on or after 11/1/2015, and some of the lawfully residing non-citizens below 138
percent of FPL that were determined eligible for BHP since 4/1/2015. This figure includes the majority of lawfully residing non-
citizens below 138 percent of FPL that were determined eligible for BHP since 4/1/2015. The remaining individuals will be
transitioned to the NYSOH Marketplace at their renewal beginning January 2016.
(12) Massachusetts, Minnesota, and New York is not able to provide active versus automatic reenrollment breakouts due to
system limitations.
(13) Washington reports all automatically-renewed enrollees as automatic re-enrollments, regardless of whether they returned to
the Marketplace and made an active plan selection different from the plan into which they were automatically renewed.
Source: Centers for Medicare & Medicaid Services, as of 3-8-16.

ASPE Issue Brief Page 59
ASPE Office of Health Policy March 2016
APPENDIX TABLE D2
Total Completed Applications and Individuals Who Completed Applications in State-Based Marketplaces Using Their Own Marketplace Platforms, By State, 2016 (1)
11-1-15 to 2-1-16
Description
Total Number of Completed Applications for 2016 Coverage
(2)
Total Individuals Applying for 2016 Coverage in Completed Applications
(3)
Number Number
State-Based Marketplaces (SBMs) Using Their Own Marketplace Platforms (4)
California 3,002,275 5,895,505
Colorado 151,088 304,735
Connecticut (5) 52,080 71,226
District of Columbia (6) 14,361 23,030
Idaho 85,967 194,233
Kentucky 60,031 97,843
Maryland 362,899 756,104
Massachusetts (8) 477,410 855,760
Minnesota 142,573 232,447
New York (9) N/A 454,051
Rhode Island 64,987 117,122
Vermont (10) 32,880 56,322
Washington 676,718 1,140,717
TOTAL - SBMs Using Their Own Marketplace Platforms 5,123,269 10,199,095
Notes:
General: “N/A” means that the data for the respective metric are not yet available for a given state. Some numbers may not add
to totals due to rounding.
(1) Unless otherwise noted, the data in this table represent cumulative Marketplace enrollment-related activity for 11-1-15 to 2-1-
16. These data also do not include any enrollment-related activity relating to individuals who may have applied for and/or
selected a 2015 Marketplace plan during the reporting period, as a result of having been eligible for a Special Enrollment Period
(SEP). This table only reflects data for the individual market Marketplaces. For additional technical notes, please refer to
Appendix E of this Addendum.
(2) Most of the data in this report are for the 11-1-15 to 2-1-16 reporting period with the following exception: the data for 9
SBMs that are using their own Marketplace platforms (California, District of Columbia, Idaho, Kentucky, Maryland, New York,
Rhode Island, Vermont, and Washington) are for the 11-1-15 to 1-31-16 reporting period.

ASPE Issue Brief Page 60
ASPE Office of Health Policy March 2016
(3) “Completed Applications for 2016 Coverage” represents the total number of electronic and paper applications that were
submitted to the Marketplace during the reference period with sufficient information to begin performing eligibility
determinations for enrollment in a plan through the Marketplace and, if appropriate, sufficient information to begin performing
eligibility determinations for advance payments of the premium tax credit and cost-sharing reductions, and eligibility assessments
or determinations for Medicaid and CHIP.
(4) “Individuals Applying for 2016 Coverage in Completed Applications” represents the total number of individuals included in
Completed Applications that were submitted to the individual market Marketplaces during the applicable reference period. This
number does not include individuals applying through the SHOP.
(5) In general, for the SBMs using their own Marketplace platforms, reports for the number of applications submitted and
consumers on applications submitted for coverage through the Marketplace include all individuals applying for a QHP and
Medicaid/CHIP. For states where the total number of individuals applied is less than individuals assessed eligible, automatic re-
enrollees and/or re-enrollees with applications prior to 11/1/15 are not included in application reports but are included in
eligibility and plan selection reports. The SBMs using their own Marketplace platforms commonly do not include individuals
applying only for Medicaid/CHIP in the eligibility determination metrics.
(6) Connecticut does not include individuals reenrolling for 2016 coverage in their count of applications.
(7) DC's current report of applications only includes a subset of enrollees applying for a QHP (those with financial assistance and
a small number of those without financial assistance) and individuals applying to Medicaid/CHIP.
(8) Kentucky’s data for completed applications includes applications occurring during November 1, 2015-December 31, 2015 for
2015 coverage in accordance with special enrollment provisions, as well as applications for 2016 coverage and SADP
enrollments because of system limitations that do not differentiate the special enrollments at the application level. Additionally,
Kentucky does not include automatic re-enrollees in their reports of total individuals applying.
(9) Massachusetts’ application and QHP eligibility data contains duplicates. Massachusetts believes as much as 5% of its reported
application data is duplicate records. Massachusetts is working to develop a process to systematically remove these duplicates.
(10) New York is not able to report the number of applications completed. New York’s number of individuals applying for
coverage includes individuals applying for all Marketplace programs (QHP, Medicaid/CHIP, and BHP) on or after 11/1/2015, but
does not includes individuals who renewed their coverage.
(11) Application data for Vermont includes individuals applying for a separate dental plan, as Vermont does not have a separate
dental application. Additionally, Vermont includes re-enrollees in reports of application and eligibility data reports. Due to the
processes required to renew individuals, Vermont began processing renewals prior to November 1, thereby the cumulative data
reported here is for the period 10/20/2015 – 12/26/2015.
Source: Centers for Medicare & Medicaid Services, as of 3-8-16.

ASPE Issue Brief Page 61
ASPE Office of Health Policy March 2016
APPENDIX TABLE D3
Total Marketplace Eligibility Determinations, and Marketplace Plan Selections in State-Based Marketplaces Using Their Own Marketplace Platforms, By State, 2016 (1)
11-1-15 to 2-1-16
State Name
Number of Individuals Determined Eligible to Enroll through the
Marketplace for 2016 Coverage
Number of Individuals
Determined or Assessed Eligible
for Medicaid / CHIP by the Marketplace
(4)
Number of Individuals With
2015 Plan Selections
Through the Marketplaces
(5)
Total Eligible to Enroll in a
Marketplace Plan (2)
Eligible to Enroll in a Marketplace Plan
with Financial Assistance
(3)
Number Number Number Number
State-Based Marketplaces (SBMs) Using Their Own Marketplace Platforms
California (6) (7) 1,974,209 1,639,675 843,919 1,575,340
Colorado (8) (9) 264,272 104,394 58,026 150,769
Connecticut (10) 154,237 115,225 304,558 116,019
District of Columbia (7) (11) 2,426 1,023 19,991 22,693
Idaho (8) (12) 191,528 157,050 389,040 101,073
Kentucky (8) (9) 260,490 129,275 516,743 93,666
Maryland (8) 261,272 151,425 283,220 162,177
Massachusetts (7) (13) 507,699 324,021 330,498 213,883
Minnesota (7) (14) 87,877 53,735 109,351 83,507
New York (9) (15) (16) 470,646 182,948 264,091 271,964
Rhode Island (15) 49,180 39,724 57,876 34,670
Vermont (7) (17) 46,863 23,250 10,869 29,440
Washington (18) 253,861 184,102 826,646 200,691
TOTAL - SBMs Using Their Own Marketplace Platforms 4,524,560 3,105,847 4,014,828 3,055,892
Notes:
General: “N/A” means that the data for the respective metric are not yet available for a given state. Some numbers may not add
to totals due to rounding.
(1) Unless otherwise noted, the data in this table represent cumulative Marketplace enrollment-related activity for 11-1-15 to 2-1-
16. These data also do not include any enrollment-related activity relating to individuals who may have applied for and/or
selected a 2015 Marketplace plan during the reporting period, as a result of having been eligible for a Special Enrollment Period
(SEP). This table only reflects data for the individual market Marketplaces. For additional technical notes, please refer to
Appendix E of this Addendum.

ASPE Issue Brief Page 62
ASPE Office of Health Policy March 2016
(2) Most of the data in this report are for the 11-1-15 to 2-1-16 reporting period with the following exception: the data for 9
SBMs that are using their own Marketplace platforms (California, District of Columbia, Idaho, Kentucky, Maryland, New York,
Rhode Island, Vermont, and Washington) are for the 11-1-15 to 1-31-16 reporting period.
(3) “Individuals Determined Eligible to Enroll in a Plan Through the Marketplace” (i.e., enrollment through the Marketplaces for
a 2016 Marketplace plan) represents the total number of individuals for whom a Completed Application has been received for the
2016 plan year (including any individuals with active 2015 Marketplace enrollments who returned to the Marketplaces and
updated their information), and who are determined to be eligible for plan enrollment through the Marketplaces during the
reference period, regardless of whether they qualify for advance payments of the premium tax credit or cost-sharing reductions.
These individuals may or may not have enrolled in coverage by the end of the reference period. Individuals who have been
determined or assessed eligible for Medicaid or CHIP are not included. Note: This number only includes data for individuals
who applied for 2016 Marketplace coverage in completed applications. It does not include individuals who were automatically
reenrolled. Thus, the number determined eligible for 2016 Coverage may be lower than the total number of 2015 plan selections
(which includes reenrollees).
(4) “Individuals Determined Eligible to Enroll in a Plan Through the Marketplace with Financial Assistance” (i.e., enrollment
through the Marketplace for a 2016 Marketplace plan with Financial Assistance) represents the total number of individuals
determined eligible to enroll through the Marketplace in a Marketplace plan who qualify for an advance premium tax credit
(APTC), with or without a cost-sharing reduction (CSR) for the 2016 plan year (including any individuals with active 2015
Marketplace enrollments who returned to the Marketplace and updated their information). These individuals may or may not
have enrolled in coverage by the end of the reference period. Note: This number only includes data for individuals who applied
for 2016 Marketplace coverage in completed applications. It does not include individuals who were automatically reenrolled.
Thus, the number determined eligible for 2016 Coverage may be lower than the total number of 2015 plan selections with
financial assistance (which includes automatic reenrollees).
(5) “Individuals Determined or Assessed Eligible for Medicaid / CHIP by the Marketplace” represents the number of individuals
who have been determined or assessed by the Marketplace as eligible for Medicaid or CHIP based on their modified adjusted
gross income (MAGI). In some states, completed applications for individuals, whom the Marketplace has assessed as potentially
eligible for Medicaid or CHIP, based on MAGI, are transferred to the relevant state agency for a final eligibility determination.
In these “assessment states” the data include those accounts where a final decision is pending. In other states, the Marketplace
has been delegated the final Medicaid/CHIP eligibility determination responsibility for these individuals. Thus, this data element
includes FFM determinations and assessments, regardless of the state Medicaid/CHIP agency’s final eligibility determination, if
applicable. These data may vary from accounts transferred via “flat file” to states by the FFM. Quality assurance continues on
Medicaid assessments and determinations. Note: Marketplace Medicaid/CHIP eligibility determination and assessment data in
this report cannot be added to eligibility determination data in the most recent monthly Medicaid and CHIP Applications,
Eligibility Determinations, and Enrollment report (available on Medicaid.gov) which covers data through October 2015. In the
Marketplaces, some of the individuals assessed or determined eligible for Medicaid or CHIP by the Marketplace and reported in
this report may also be reported in the monthly Medicaid and CHIP Applications, Eligibility Determinations, and Enrollment
Report when the state has made an eligibility determination based on the information provided by the Marketplace. Total
Medicaid/CHIP enrollment is reported in the monthly Medicaid and CHIP Applications, Eligibility Determinations, and
Enrollment Report, and is a point-in-time count of total enrollment in the Medicaid and CHIP programs at the end of the monthly
reporting period.
(6) “Individuals With 2016 Marketplace Plan Selections” represents the total number of individuals determined eligible to enroll
in a plan through the Marketplace” who have selected or have been automatically reenrolled into a 2016 Marketplace medical
plan (with or without the first premium payment having been received directly by the issuer) during the reference period. This is
also known as pre-effectuated enrollment, because enrollment is not considered effectuated until the first premium payment is
made, and this data includes plan selections for which enrollment has not yet been effectuated. Individuals who have cancelled
or terminated their Marketplace plans are not included in the total number of plan selections. These data also do not include:
standalone dental plan selections; or individuals who may have selected a 2015 Marketplace plan during the reporting period, as a
result of having been eligible for a Special Enrollment Period (SEP). All states except DC and Minnesota removed cancellations
and terminations from their data reports for new enrollees, active re-enrollees, and automatic re-enrollees. DC does not remove
cancellations and terminations from plan selection data and Minnesota only removes cancellations for individuals that self-report
a cancellation to Minnesota. Since Minnesota does not perform effectuations itself, Minnesota is not able to accurately determine
the number of terminations and cancellations, as consumers can terminate their coverage directly with an issuer. Plan selection
data for all states includes automatic re-enrollees.
(7) California, DC, Massachusetts, Minnesota, and Vermont do not remove cancellations and terminations from their reports of
eligibility data.
(8) Colorado, Idaho, Kentucky, and Maryland remove cancellations and terminations from their reports of eligibility data.
(9) Connecticut only includes individuals with active eligibility determinations, removing individuals with expired coverage and
individuals who fail to verify their eligibility.
(10) For this report, DC is only reporting a subset of new enrollees assessed eligible for a QHP (those with financial assistance
and a small number of those eligible without financial assistance) for total eligible for a QHP.
ASPE Issue Brief Page 63
ASPE Office of Health Policy March 2016
(11) Idaho only reports a weekly total of individuals assessed eligible for Medicaid/CHIP instead of a cumulative total from
11/1/15, as the Department of Health and Welfare's system tracks each assessment instead of each individual with an assessment.
Therefore, Idaho's data would potentially include duplicates.
(12) Massachusetts' eligibility data includes members re-determined eligible for 2016 coverage as part of their
redetermination/renewal process. An active process is in place to remove those duplicates, which includes member outreach and
active termination of duplicate coverage spans.
(13) Minnesota and New York have begun enrolling individuals in a Basic Health Plan. These individuals are not included in
reports of total QHP plan selections for these states. New York has begun enrolling eligible Marketplace enrollees in its Basic
Health Program (BHP), known as the "Essential Plan" in New York, including individuals with incomes less than or equal to
200% of FPL, who would have otherwise been eligible for QHP enrollment. BHP enrollees are not included in QHP eligibility
and enrollment totals. BHP data include all new enrollees to NYSOH Marketplace after November 1, QHP enrollees who were
re-determined eligible for the Essential Plan on or after 11/1/2015, and some of the lawfully residing non-citizens below 138
percent of FPL that were determined eligible for BHP since 4/1/2015. This figure includes the majority of lawfully residing non-
citizens below 138 percent of FPL that were determined eligible for BHP since 4/1/2015. The remaining individuals will be
transitioned to the NYSOH Marketplace at their renewal beginning January 2016.
(14) New York and Rhode Island only remove individuals no longer determined eligible after redetermination processes from
their eligibility data.
(15) New York’s reports of total eligible to enroll in a Marketplace plan for NY data represents only the number of individuals
eligible for a QHP, not for all Marketplace programs. New York eligibility data for Medicaid/CHIP represents individuals
receiving the first eligibility determination on or after 11/1/2015. Reported totals do not include renewals or other eligibility
determinations before 11/1/2015. New York’s total QHP plan selection data represents new and re-enrollee plan selections
submitted on or after 11/1/2015.
(16) Vermont includes reenrollees in reports of eligibility data reports. Due to the processes required to renew individuals,
Vermont began processing renewals prior to November 1, thereby the cumulative data reported here is for the period 10/20/2015
– 12/26/2015.
(17) Washington does not remove terminations from its reports of eligibility data, but removes cancellations. Washington’s
relatively high number of Medicaid/CHIP assessments is due to the processing of redeterminations and renewals prior to the first
data report of open enrollment (renewals/redeterminations occurred 11/1/15). This data is processed the first of each month, and
Washington typically has higher Medicaid/CHIP eligibility determinations than most other states.
Source: Centers for Medicare & Medicaid Services, as of 3-8-16.

ASPE Issue Brief Page 64
ASPE Office of Health Policy March 2016
APPENDIX TABLE D4
Marketplace Plan Selections by Financial Assistance Status in State-Based Marketplaces Using Their Own Marketplace Platforms, By State, 2016 (1)
11-1-15 to 2-1-16
Description
Total Number of Individuals With
2016 Plan Selections
Through the Marketplaces
(2)
Plan Selections With Available
Data on Financial Assistance Status (3)
By Financial Assistance Status (4) (% of Available Data, Excluding Unknown)
With Financial
Assistance
Without Financial
Assistance
With APTC (non-add)
Number Number % % %
State-Based Marketplaces (SBMs) Using Their Own Marketplace Platforms (5)
California 1,575,340 1,575,340 87% 13% 87% Colorado (7) (8) 150,769 150,769 61% 39% 61% Connecticut 116,019 116,019 78% 22% 78% District of Columbia (6) 22,693 22,693 6% 94% N/A Idaho 101,073 101,073 83% 17% 83% Kentucky (8) (9) 93,666 93,657 67% 33% 67% Maryland 162,177 162,177 70% 30% 70% Massachusetts (10) 213,883 213,883 78% 22% 78% Minnesota (11) (12) 83,507 N/A N/A N/A N/A New York (8) (12) 271,964 271,964 54% 46% 54% Rhode Island 34,670 34,670 87% 13% 87% Vermont 29,440 29,440 69% 31% 69% Washington (13) 200,691 200,691 70% 30% N/A TOTAL – SBMs Using Their Own Marketplace Platforms 3,055,892 2,972,376 78% 22% 73%
Notes:
General: “N/A” means that the data for the respective metric are not yet available for a given state. Some numbers may not add
to totals due to rounding.
(1) Unless otherwise noted, the data in these tables represent cumulative data on the number of individuals who have selected or
have been automatically reenrolled into a 2016 Marketplace medical plan (with or without the first premium payment having
been received directly by the issuer). This is also known as pre-effectuated enrollment, because enrollment is not considered
effectuated until the first premium payment is made, and this data includes plan selections for which enrollment has not yet been
effectuated. Individuals who have cancelled or terminated their Marketplace plans are not included in the total number of plan
selections. These data also do not include: standalone dental plan selections; or individuals who may have selected a 2015
Marketplace plan during the reporting period, as a result of having been eligible for a Special Enrollment Period (SEP). This
table only reflects data for the individual market Marketplaces. For additional technical notes, please refer to Appendix E of this
Addendum.
(2) Most of the data in this report are for the 11-1-15 to 2-1-16 reporting period with the following exception: the data for 9
SBMs that are using their own Marketplace platforms (California, District of Columbia, Idaho, Kentucky, Maryland, New York,
Rhode Island, Vermont, and Washington) are for the 11-1-15 to 1-31-16 reporting period.
(3) For each metric, the data represent the total number of Individuals Determined Eligible to Enroll in a plan Through the
Marketplace who have selected or been automatically reenrolled into a 2016 Marketplace medical plan (with or without the first
premium payment having been received directly by the Marketplace or the issuer) during the reference period, excluding plan
selections with unknown data for a given metric. This is also known as pre-effectuated enrollment, because enrollment is not

ASPE Issue Brief Page 65
ASPE Office of Health Policy March 2016
considered effectuated until the first premium payment is made, and this data includes plan selections for which enrollment has
not yet been effectuated.
(4) In some cases, the data for certain characteristics of Marketplace plan selections are not yet available. For this reason, for
each metric, we have calculated the comparable percentages based on the number of plan selections with known data for that
metric.
(5) Data on Marketplace plan selections with financial assistance includes plan selections for individuals who are receiving a
premium tax credit and/or cost-sharing subsidy.
(6) All states except DC and Minnesota removed cancellations and terminations from their data reports for new enrollees, active
re-enrollees and automatic re-enrollees. DC does not remove cancellations and terminations from any of its plan selection data
and Minnesota only removes cancellations for individuals that self-report a cancellation to Minnesota. Since Minnesota does not
perform effectuations itself, Minnesota is not able to accurately determine the number of terminations and cancellations, as
consumers can terminate their coverage directly with an issuer. All states have processed automatic reenrollments, including
these individuals in plan selection reports. The SBMs are unable to report data on CSR Only.
(7) DC reported only "Total enrolled (plan selection) with financial assistance: APTC+CSR's," and Washington reported only
"Total enrolled (plan selection) with financial assistance: APTC Only." These states are not able to differentiate the type of
financial assistance an individual receives and so report all individuals in one total.
(8) Colorado continues to perform query updates and data reconciliations. Therefore, values reported in subcategories may not
sum to their respective reported totals. This may also be due to data lags or data items missing on applications.
(9) Kentucky is working to reconcile its reported breakouts with its reported total plan selections. Therefore, values reported in
subcategories do not sum to their respective reported totals.
(10) Minnesota reports plan selection by financial assistance data at a household level and is not able to differentiate APTCs from
CSRs. Through February 1, 2016, Minnesota reported 39,425 households had plan selections with financial assistance.
(11) Minnesota and New York have begun enrolling individuals in a Basic Health Plan. These individuals are not included in
reports of total QHP plan selections for these states. New York has begun enrolling eligible Marketplace enrollees in its Basic
Health Program (BHP), known as the "Essential Plan" in New York, including individuals with incomes less than or equal to
200% of FPL, who would have otherwise been eligible for QHP enrollment. BHP enrollees are not included in QHP eligibility
and enrollment totals. BHP data include all new enrollees to NYSOH Marketplace after November 1, QHP enrollees who were
re-determined eligible for the Essential Plan on or after 11/1/2015, and some of the lawfully residing non-citizens below 138
percent of FPL that were determined eligible for BHP since 4/1/2015. This figure includes the majority of lawfully residing non-
citizens below 138 percent of FPL that were determined eligible for BHP since 4/1/2015. The remaining individuals will be
transitioned to the NYSOH Marketplace at their renewal beginning January 2016.
(12) During open enrollment, enrollees can edit their application, potentially changing their financial assistance eligibility. In
Washington, when enrollees make a change after the 23rd of the month, the change takes effect the next month of coverage,
leaving the enrollee with two different selections during the reporting period. This results in the breakouts summing to a total
slightly more than total plan selection for Washington. These records are gradually reconciled during ongoing data cleaning
processes.
.Source: Centers for Medicare & Medicaid Services, as of 3-8-16.
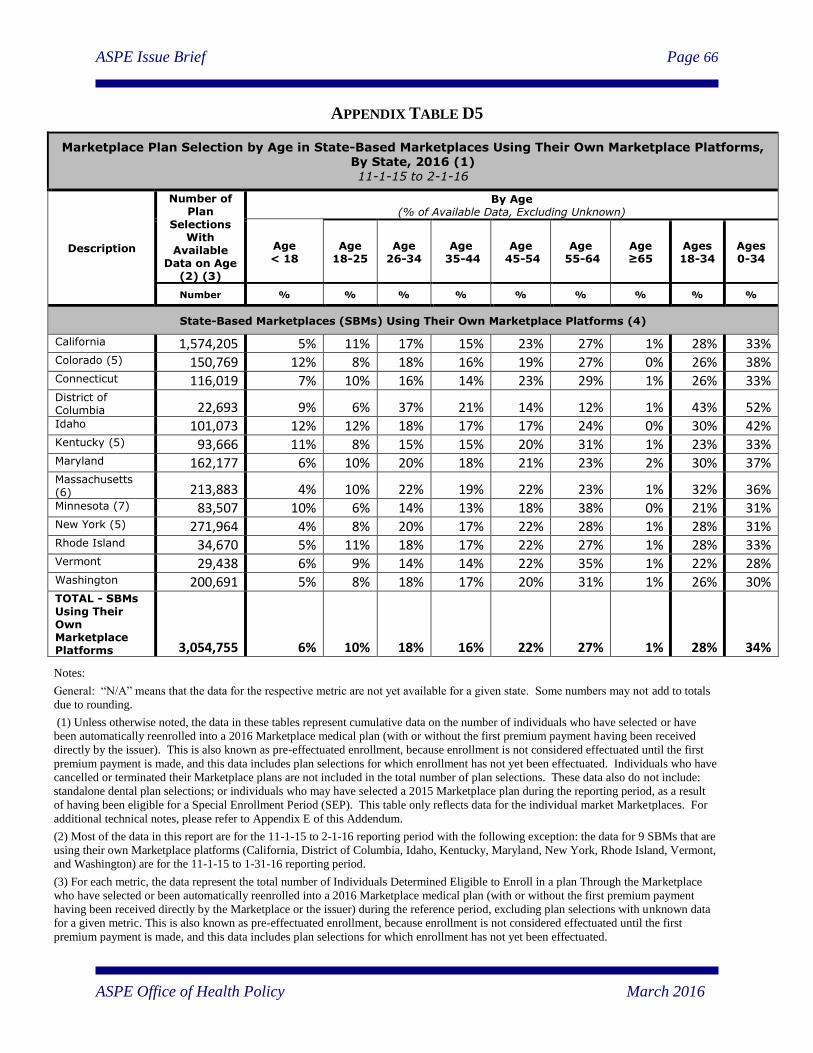
ASPE Issue Brief Page 66
ASPE Office of Health Policy March 2016
APPENDIX TABLE D5
Marketplace Plan Selection by Age in State-Based Marketplaces Using Their Own Marketplace Platforms, By State, 2016 (1) 11-1-15 to 2-1-16
Description
Number of Plan
Selections With
Available Data on Age
(2) (3)
By Age (% of Available Data, Excluding Unknown)
Age < 18
Age 18-25
Age 26-34
Age 35-44
Age 45-54
Age 55-64
Age ≥65
Ages 18-34
Ages 0-34
Number % % % % % % % % %
State-Based Marketplaces (SBMs) Using Their Own Marketplace Platforms (4)
California 1,574,205 5% 11% 17% 15% 23% 27% 1% 28% 33% Colorado (5) 150,769 12% 8% 18% 16% 19% 27% 0% 26% 38% Connecticut 116,019 7% 10% 16% 14% 23% 29% 1% 26% 33% District of Columbia 22,693 9% 6% 37% 21% 14% 12% 1% 43% 52% Idaho 101,073 12% 12% 18% 17% 17% 24% 0% 30% 42% Kentucky (5) 93,666 11% 8% 15% 15% 20% 31% 1% 23% 33% Maryland 162,177 6% 10% 20% 18% 21% 23% 2% 30% 37% Massachusetts (6) 213,883 4% 10% 22% 19% 22% 23% 1% 32% 36% Minnesota (7) 83,507 10% 6% 14% 13% 18% 38% 0% 21% 31% New York (5) 271,964 4% 8% 20% 17% 22% 28% 1% 28% 31% Rhode Island 34,670 5% 11% 18% 17% 22% 27% 1% 28% 33% Vermont 29,438 6% 9% 14% 14% 22% 35% 1% 22% 28% Washington 200,691 5% 8% 18% 17% 20% 31% 1% 26% 30% TOTAL - SBMs
Using Their Own Marketplace Platforms 3,054,755 6% 10% 18% 16% 22% 27% 1% 28% 34%
Notes:
General: “N/A” means that the data for the respective metric are not yet available for a given state. Some numbers may not add to totals
due to rounding.
(1) Unless otherwise noted, the data in these tables represent cumulative data on the number of individuals who have selected or have
been automatically reenrolled into a 2016 Marketplace medical plan (with or without the first premium payment having been received
directly by the issuer). This is also known as pre-effectuated enrollment, because enrollment is not considered effectuated until the first
premium payment is made, and this data includes plan selections for which enrollment has not yet been effectuated. Individuals who have
cancelled or terminated their Marketplace plans are not included in the total number of plan selections. These data also do not include:
standalone dental plan selections; or individuals who may have selected a 2015 Marketplace plan during the reporting period, as a result
of having been eligible for a Special Enrollment Period (SEP). This table only reflects data for the individual market Marketplaces. For
additional technical notes, please refer to Appendix E of this Addendum.
(2) Most of the data in this report are for the 11-1-15 to 2-1-16 reporting period with the following exception: the data for 9 SBMs that are
using their own Marketplace platforms (California, District of Columbia, Idaho, Kentucky, Maryland, New York, Rhode Island, Vermont,
and Washington) are for the 11-1-15 to 1-31-16 reporting period.
(3) For each metric, the data represent the total number of Individuals Determined Eligible to Enroll in a plan Through the Marketplace
who have selected or been automatically reenrolled into a 2016 Marketplace medical plan (with or without the first premium payment
having been received directly by the Marketplace or the issuer) during the reference period, excluding plan selections with unknown data
for a given metric. This is also known as pre-effectuated enrollment, because enrollment is not considered effectuated until the first
premium payment is made, and this data includes plan selections for which enrollment has not yet been effectuated.

ASPE Issue Brief Page 67
ASPE Office of Health Policy March 2016
(4) In some cases, the data for certain characteristics of Marketplace plan selections are not yet available. For this reason, for each
metric, we have calculated the comparable percentages based on the number of plan selections with known data for that metric.
(5) All states except DC and Minnesota removed cancellations and terminations from their data reports for new enrollees, active re-
enrollees and automatic re-enrollees. DC does not remove cancellations and terminations from any of its plan selection data and
Minnesota only removes cancellations for individuals that self-report a cancellation to Minnesota. Since Minnesota does not perform
effectuations itself, Minnesota is not able to accurately determine the number of terminations and cancellations, as consumers can
terminate their coverage directly with an issuer. All states have processed automatic re-enrollments, including these individuals in plan
selection reports.
(6) California’s data source contains unknown age plan selections that California is working to manually process. Therefore, reported plan
selection breakouts do not sum to reports of total plan selections.* Colorado continues to perform query updates and data reconciliations.
Therefore, values reported in subcategories may not sum to their respective reported totals. This may also be due to data lags or data items
missing on applications.
(7) Minnesota and New York have begun enrolling individuals in a Basic Health Plan. These individuals are not included in reports of
total QHP plan selections for these states. New York has begun enrolling eligible Marketplace enrollees in its Basic Health Program
(BHP), known as the "Essential Plan" in New York, including individuals with incomes less than or equal to 200% of FPL, who would
have otherwise been eligible for QHP enrollment. BHP enrollees are not included in QHP eligibility and enrollment totals. BHP data
include all new enrollees to NYSOH Marketplace after November 1, QHP enrollees who were re-determined eligible for the Essential
Plan on or after 11/1/2015, and some of the lawfully residing non-citizens below 138 percent of FPL that were determined eligible for
BHP since 4/1/2015. This figure includes the majority of lawfully residing non-citizens below 138 percent of FPL that were determined
eligible for BHP since 4/1/2015. The remaining individuals will be transitioned to the NYSOH Marketplace at their renewal beginning
January 2016.
(8) Vermont is working to reconcile its reported breakouts with the total reported for plan selections.
Source: Centers for Medicare & Medicaid Services, as of 3-8-16.

ASPE Issue Brief Page 68
ASPE Office of Health Policy March 2016
APPENDIX TABLE D6
Marketplace Plan Selection by Gender in State-Based Marketplaces Using Their Own Marketplace Platforms, By State, 2016 (1)
11-1-15 to 2-1-16
Description
Total Number of Individuals With
2016 Plan Selections
Through the Marketplaces (2)
Plan Selections With Available Data on Gender
(3)
By Gender (% of Available Data, Excluding Unknown)
Females Males
Number Number % %
State-Based Marketplaces (SBMs) Using Their Own Marketplace Platforms (4)
California (4) 1,575,340 1,574,078 51% 49% Colorado 150,769 150,762 51% 49% Connecticut 116,019 116,019 53% 47% District of Columbia (5) 22,693 22,693 52% 48% Idaho (8) 101,073 101,073 54% 46% Kentucky 93,666 93,666 54% 46% Maryland (8) 162,177 162,177 54% 46% Massachusetts (8) 213,883 213,883 54% 46% Minnesota (5) 83,507 83,507 52% 48% New York (5) 271,964 271,964 50% 50% Rhode Island 34,670 34,670 54% 46% Vermont 29,440 29,440 52% 48% Washington (5) 200,691 200,691 54% 46% TOTAL - SBMs Using Their Own Marketplace Platforms 3,055,892 3,054,623 52% 48%
Notes:
General: “N/A” means that the data for the respective metric are not yet available for a given state. Some numbers may not add
to totals due to rounding.
(1) Unless otherwise noted, the data in these tables represent cumulative data on the number of individuals who have selected or
have been automatically reenrolled into a 2016 Marketplace medical plan (with or without the first premium payment having
been received directly by the issuer). This is also known as pre-effectuated enrollment, because enrollment is not considered
effectuated until the first premium payment is made, and this data includes plan selections for which enrollment has not yet been
effectuated. Individuals who have cancelled or terminated their Marketplace plans are not included in the total number of plan
selections. These data also do not include: standalone dental plan selections; or individuals who may have selected a 2015
Marketplace plan during the reporting period, as a result of having been eligible for a Special Enrollment Period (SEP). This
table only reflects data for the individual market Marketplaces. For additional technical notes, please refer to Appendix E of this
Addendum.
(2) Most of the data in this report are for the 11-1-15 to 2-1-16 reporting period with the following exception: the data for 9
SBMs that are using their own Marketplace platforms (California, District of Columbia, Idaho, Kentucky, Maryland, New York,
Rhode Island, Vermont, and Washington) are for the 11-1-15 to 1-31-16 reporting period.
(3) For each metric, the data represent the total number of Individuals Determined Eligible to Enroll in a plan Through the
Marketplace who have selected or been automatically reenrolled into a 2016 Marketplace medical plan (with or without the first
premium payment having been received directly by the Marketplace or the issuer) during the reference period, excluding plan
selections with unknown data for a given metric. This is also known as pre-effectuated enrollment, because enrollment is not
considered effectuated until the first premium payment is made, and this data includes plan selections for which enrollment has
not yet been effectuated.

ASPE Issue Brief Page 69
ASPE Office of Health Policy March 2016
(4) In some cases, the data for certain characteristics of Marketplace plan selections are not yet available. For this reason, for
each metric, we have calculated the comparable percentages based on the number of plan selections with known data for that
metric.
(5) All states except DC and Minnesota removed cancellations and terminations from their data reports for new enrollees, active
re-enrollees, and automatic re--enrollees. DC does not remove cancellations and terminations from any of its plan selection data
and Minnesota only removes cancellations for individuals that self-report a cancellation to Minnesota. Since Minnesota does not
perform effectuations itself, Minnesota is not able to accurately determine the number of terminations and cancellations, as
consumers can terminate their coverage directly with an issuer. All states have processed automatic re-enrollments, including
these individuals in plan selection reports.
(6) California’s data source contains unknown gender plan selections that California is working to manually process. Therefore,
reported plan selection breakouts do not sum to reports of total plan selections.
(7) Colorado continues to perform query updates and data reconciliations. Therefore, values reported in subcategories may not
sum to their respective reported totals. This may also be due to data lags or data items missing on applications.
(8) Minnesota and New York have begun enrolling individuals in a Basic Health Plan. These individuals are not included in
reports of total QHP plan selections for these states. New York has begun enrolling eligible Marketplace enrollees in its Basic
Health Program (BHP), known as the "Essential Plan" in New York, including individuals with incomes less than or equal to
200% of FPL, who would have otherwise been eligible for QHP enrollment. BHP enrollees are not included in QHP eligibility
and enrollment totals. BHP data include all new enrollees to NYSOH Marketplace after November 1, QHP enrollees who were
re-determined eligible for the Essential Plan on or after 11/1/2015, and some of the lawfully residing non-citizens below 138
percent of FPL that were determined eligible for BHP since 4/1/2015. This figure includes the majority of lawfully residing non-
citizens below 138 percent of FPL that were determined eligible for BHP since 4/1/2015. The remaining individuals will be
transitioned to the NYSOH Marketplace at their renewal beginning January 2016.
Source: Centers for Medicare & Medicaid Services, as of 3-8-16.

ASPE Issue Brief Page 70
ASPE Office of Health Policy March 2016
APPENDIX TABLE D7
Marketplace Plan Selection by Metal Level in State-Based Marketplaces Using Their Own Marketplace Platforms, By State, 2016 (1)
11-1-15 to 2-1-16
Description
Total Number of Individuals
With 2016 Plan Selections
Through the Marketplaces
(2)
Plan Selections
With Available Data on Metal
Level (3)
By Metal Level (4) (% of Available Data, Excluding Unknown)
Bronze Plan
Silver Plan
Gold Plan
Platinum Plan
Catastrophic Plan
Number Number % % % % %
State-Based Marketplaces (SBMs) Using Their Own Marketplace Platforms
California 1,575,340 1,574,332 27% 63% 5% 4% 1% Colorado (6) (7) 150,769 150,769 45% 44% 7% 1% 3% Connecticut 116,019 116,019 23% 61% 12% 1% 2% District of Columbia 22,693 22,693 28% 31% 20% 15% 6% Idaho 101,073 101,073 23% 68% 8% 0% 1% Kentucky (7) 93,666 93,666 27% 60% 11% 1% 1% Maryland 162,177 162,177 23% 64% 10% 1% 2% Massachusetts (8) 213,883 55,371 14% 55% 18% 11% 1% Minnesota (9) 83,507 83,507 46% 36% 17% 0% 1% New York (7) (9) 271,964 271,964 26% 42% 14% 16% 2% Rhode Island 34,670 34,670 19% 70% 11% 0% 0% Vermont (10) 29,440 29,440 20% 59% 10% 10% 1% Washington (11) 200,691 200,691 35% 56% 8% 0% 1% TOTAL - SBMs Using Their Own Marketplace Platforms 3,055,892 2,896,372 28% 59% 8% 4% 1%
Notes:
General: “N/A” means that the data for the respective metric are not yet available for a given state. Some numbers may not add to totals due to
rounding.
(1) Unless otherwise noted, the data in these tables represent cumulative data on the number of individuals who have selected or have been
automatically reenrolled into a 2016 Marketplace medical plan (with or without the first premium payment having been received directly by the
issuer). This is also known as pre-effectuated enrollment, because enrollment is not considered effectuated until the first premium payment is
made, and this data includes plan selections for which enrollment has not yet been effectuated. Individuals who have cancelled or terminated their
Marketplace plans are not included in the total number of plan selections. These data also do not include: standalone dental plan selections; or
individuals who may have selected a 2015 Marketplace plan during the reporting period, as a result of having been eligible for a Special
Enrollment Period (SEP). This table only reflects data for the individual market Marketplaces. For additional technical notes, please refer to
Appendix E of this Addendum.
(2) Most of the data in this report are for the 11-1-15 to 2-1-16 reporting period with the following exception: the data for 9 SBMs that are using
their own Marketplace platforms (California, District of Columbia, Idaho, Kentucky, Maryland, New York, Rhode Island, Vermont, and
Washington) are for the 11-1-15 to 1-31-16 reporting period.
(3) For each metric, the data represent the total number of Individuals Determined Eligible to Enroll in a plan Through the Marketplace who have
selected or been automatically reenrolled into a 2016 Marketplace medical plan (with or without the first premium payment having been received
directly by the Marketplace or the issuer) during the reference period, excluding plan selections with unknown data for a given metric. This is also
known as pre-effectuated enrollment, because enrollment is not considered effectuated until the first premium payment is made, and this data
includes plan selections for which enrollment has not yet been effectuated.

ASPE Issue Brief Page 71
ASPE Office of Health Policy March 2016
(4) In some cases, the data for certain characteristics of Marketplace plan selections are not yet available. For this reason, for each metric, we have
calculated the comparable percentages based on the number of plan selections with known data for that metric.
(5) The subtotals for each metal tier type may not sum to the total number of Plan Selections with Available Data on Metal Level due to instances
where consumers selected more than one plan type in their state. As a result, the corresponding percentages also may not sum to 100 percent.
(6) All states except DC and Minnesota removed cancellations and terminations from their data reports for new enrollees, active re-enrollees and
automatic re-enrollees. DC does not remove cancellations and terminations from any of its plan selection data and Minnesota only removes
cancellations for individuals that self-report a cancellation to Minnesota. Since Minnesota does not perform effectuations itself, Minnesota is not
able to accurately determine the number of terminations and cancellations, as consumers can terminate their coverage directly with an issuer. All
states have processed automatic re-enrollments, including these individuals in plan selection reports.
(7) California’s data source contains unknown metal level plan selections that California is working to manually process. Therefore, reported plan
selection breakouts do not sum to reports of total plan selections.
(8) Colorado is actively developing queries to provide SADP data. As of January 31, 2016, Colorado has enrolled 25,402 individuals in dental
plans. Colorado continues to perform query updates and data reconciliations. Therefore, values reported in subcategories may not sum to their
respective reported totals. This may also be due to data lags or data items missing on applications.
(9) Massachusetts’ 158,512 members reported as unknowns are enrolled in their Connector Care program. Connector Care plans are closest to
silver tier plans but their “value” is greater than that of a silver tier plan (the standardized benefits provided by Connector Care plans are richer
than the benefits available in a standard silver plan). Members do not elect this tier of plan but are determined Connector Care eligible and offered
this tier of plan if/when they are determined income eligible. Since the result is not determined by member behavior but by program determination
placing enrollees into plans not entirely comparable to the metal level breakouts, Massachusetts reports these individuals as unknown.
(10) Minnesota and New York have begun enrolling individuals in a Basic Health Plan. These individuals are not included in reports of total QHP
plan selections for these states. New York has begun enrolling eligible Marketplace enrollees in its Basic Health Program (BHP), known as the
"Essential Plan" in New York, including individuals with incomes less than or equal to 200% of FPL, who would have otherwise been eligible for
QHP enrollment. BHP enrollees are not included in QHP eligibility and enrollment totals. BHP data include all new enrollees to NYSOH
Marketplace after November 1, QHP enrollees who were re-determined eligible for the Essential Plan on or after 11/1/2015, and some of the
lawfully residing non-citizens below 138 percent of FPL that were determined eligible for BHP since 4/1/2015. This figure includes the majority of
lawfully residing non-citizens below 138 percent of FPL that were determined eligible for BHP since 4/1/2015. The remaining individuals will be
transitioned to the NYSOH Marketplace at their renewal beginning January 2016.
(11) Vermont is working to reconcile its reported breakouts with its reported total plan selections. Therefore, values reported in subcategories do
not sum to their respective reported totals.
(12) During open enrollment, enrollees can change their plan (and subsequently metal level). In Washington, when enrollees make a change after
the 23rd of the month, the change takes effect the next month of coverage, leaving the enrollee with two different selections during the reporting
period. This results in the breakouts summing to a total slightly more than total plan selection for Washington. These records are gradually
reconciled during ongoing data cleaning processes.
Source: Centers for Medicare & Medicaid Services, as of 3-8-16.

ASPE Issue Brief Page 72
ASPE Office of Health Policy March 2016
APPENDIX E: TECHNICAL NOTES
We believe that the information contained in this issue brief provides the most systematic
summary of enrollment-related activity in the Marketplaces during the 2016 Open Enrollment
period because the data for the various metrics are counted using comparable definitions for data
elements across states, and Marketplace platforms. However, data for certain metrics may not be
available due to information system issues.
The following section provides additional information about the metrics used in this enrollment
report, in addition to the information that is included elsewhere in the footnotes of the tables in
this report.
Additional Information About the Metrics Used in this Marketplace Enrollment Report
Reporting of Data on Activity Relating to the 2016 Marketplace Coverage Year – Except where
otherwise noted, this report includes enrollment-related data on activity related to the 2016
Marketplace coverage year. The data that are being reported for 11-1-15 to 2-1-16 do not
include activity associated with individuals who may have applied for and/or qualified for a
Special Enrollment Period for 2015 Marketplace coverage.
Reporting Period – This report includes data that are currently available on enrollment-related
activity during the 2016 Open Enrollment period – which generally corresponds with data from
11-1-15 to 2-1-16, except in the cases of California, District of Columbia, Idaho, Kentucky,
Maryland, New York, Rhode Island, Vermont, and Washington. The following table shows how
the reporting periods for the data in this report compare with those for the most recent Weekly
Enrollment Snapshot.
Appendix Table E1
Marketplace Type Reporting Period (1)
States Using the HealthCare.gov Marketplace Platform (38 states) 11-1-15 to 2-1-16
State Based Marketplaces (SBMs) Using Their Own Marketplace Platform (13 states)
9 States: California, District of Columbia, Idaho, Kentucky,
Maryland, New York, Rhode Island, Vermont, Washington 11-1-15 to 1-31-16
4 States: Colorado, Connecticut, Massachusetts, Minnesota 11-1-15 to 2-1-16
Note: (1) For purposes of the Final Enrollment Report, an effort was made to align the reporting periods for the HealthCare.gov
states and SBMs using their own Marketplace platforms with the reporting periods for the data that were included in the Week 13
CMS Marketplace Enrollment Snapshot (which can be accessed at
https://www.cms.gov/Newsroom/MediaReleaseDatabase/Fact-sheets/2016-Fact-sheets-items/2016-02-04.html).
2016 Plan Selections Through the Marketplaces (also known as Marketplace Plan Selections) – Represents cumulative data on the number of unique individuals who have selected or been
automatically enrolled in a 2016 plan through the Marketplaces (with or without the first
premium payment having been received directly by the issuer) during the reference period. This
is also known as pre-effectuated enrollment, because enrollment is not considered effectuated
until the first premium payment is made, and this figure includes plan selections for which
enrollment has not yet been effectuated. These data represent the number of individuals with
active plan selections for a Marketplace medical plan as of the reporting date. These data do not
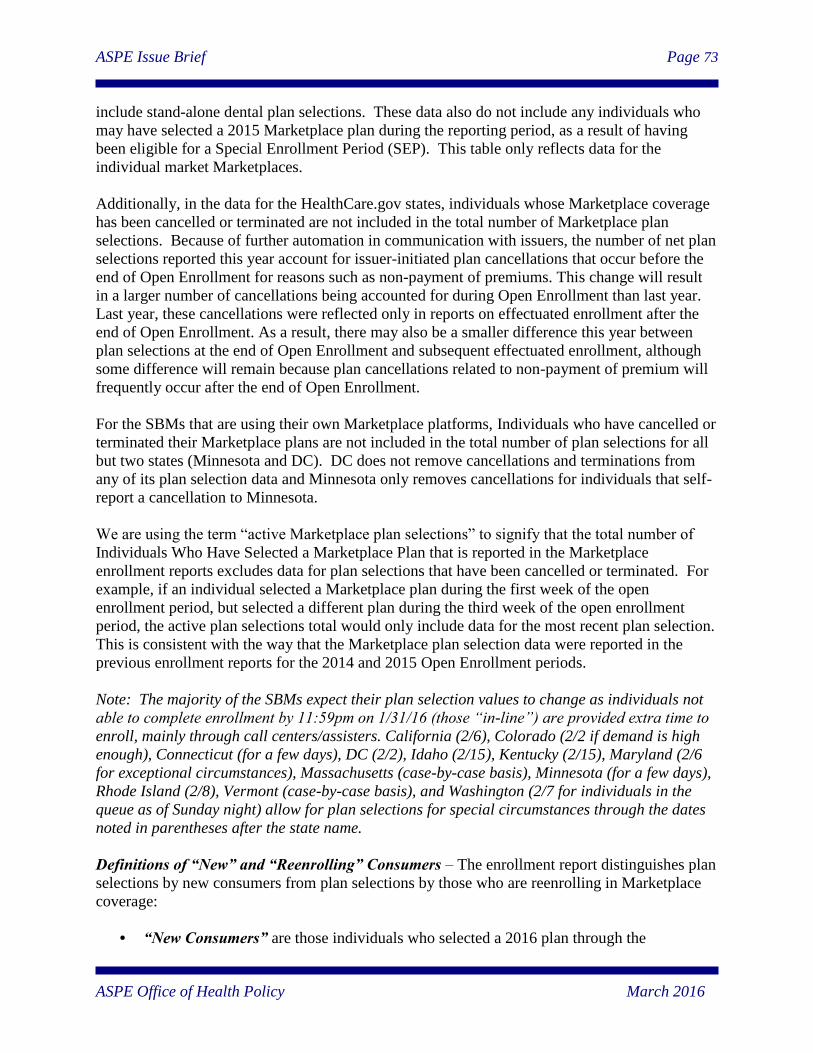
ASPE Issue Brief Page 73
ASPE Office of Health Policy March 2016
include stand-alone dental plan selections. These data also do not include any individuals who
may have selected a 2015 Marketplace plan during the reporting period, as a result of having
been eligible for a Special Enrollment Period (SEP). This table only reflects data for the
individual market Marketplaces.
Additionally, in the data for the HealthCare.gov states, individuals whose Marketplace coverage
has been cancelled or terminated are not included in the total number of Marketplace plan
selections. Because of further automation in communication with issuers, the number of net plan
selections reported this year account for issuer-initiated plan cancellations that occur before the
end of Open Enrollment for reasons such as non-payment of premiums. This change will result
in a larger number of cancellations being accounted for during Open Enrollment than last year.
Last year, these cancellations were reflected only in reports on effectuated enrollment after the
end of Open Enrollment. As a result, there may also be a smaller difference this year between
plan selections at the end of Open Enrollment and subsequent effectuated enrollment, although
some difference will remain because plan cancellations related to non-payment of premium will
frequently occur after the end of Open Enrollment.
For the SBMs that are using their own Marketplace platforms, Individuals who have cancelled or
terminated their Marketplace plans are not included in the total number of plan selections for all
but two states (Minnesota and DC). DC does not remove cancellations and terminations from
any of its plan selection data and Minnesota only removes cancellations for individuals that self-
report a cancellation to Minnesota.
We are using the term “active Marketplace plan selections” to signify that the total number of
Individuals Who Have Selected a Marketplace Plan that is reported in the Marketplace
enrollment reports excludes data for plan selections that have been cancelled or terminated. For
example, if an individual selected a Marketplace plan during the first week of the open
enrollment period, but selected a different plan during the third week of the open enrollment
period, the active plan selections total would only include data for the most recent plan selection.
This is consistent with the way that the Marketplace plan selection data were reported in the
previous enrollment reports for the 2014 and 2015 Open Enrollment periods.
Note: The majority of the SBMs expect their plan selection values to change as individuals not
able to complete enrollment by 11:59pm on 1/31/16 (those “in-line”) are provided extra time to
enroll, mainly through call centers/assisters. California (2/6), Colorado (2/2 if demand is high
enough), Connecticut (for a few days), DC (2/2), Idaho (2/15), Kentucky (2/15), Maryland (2/6
for exceptional circumstances), Massachusetts (case-by-case basis), Minnesota (for a few days),
Rhode Island (2/8), Vermont (case-by-case basis), and Washington (2/7 for individuals in the
queue as of Sunday night) allow for plan selections for special circumstances through the dates
noted in parentheses after the state name.
Definitions of “New” and “Reenrolling” Consumers – The enrollment report distinguishes plan
selections by new consumers from plan selections by those who are reenrolling in Marketplace
coverage:
• “New Consumers” are those individuals who selected a 2016 plan through the

ASPE Issue Brief Page 74
ASPE Office of Health Policy March 2016
Marketplaces (with or without the first premium payment having been received directly
by the issuer) and did not have an active 2015 Marketplace plan selection as of
November 1, 2015. These data do not include stand-alone dental plan selections. These
data also generally do not include any individuals who may have selected a 2015
Marketplace plan during the reporting period, as a result of having been eligible for a
Special Enrollment Period (SEP). Additionally, in the data for the HealthCare.gov states
and most states using their own platforms, individuals who have cancelled or terminated
their Marketplace plans are not included in the total number of Marketplace plan
selections.
Hawaii changed Marketplace eligibility and enrollment platforms in 2016. Therefore,
their 2015 Marketplace plan selections are generally being classified as new consumers
for operational enrollment and reporting purposes. However, a small number of 2016
plan selections in Hawaii may be classified as consumers reenrolling in coverage through
the Marketplaces in cases where an individual who had an active 2015 Marketplace plan
selection in a HealthCare.gov state signs up for 2016 coverage in Hawaii.
• “Consumers reenrolling in coverage through the Marketplaces” are those individuals
who had Marketplace plan selection as of November 2015 (or as of 10-31-15 for SBMs
using their own Marketplace platforms), and have either actively submitted a 2016
application and selected a 2016 Marketplace medical plan, or have been automatically
reenrolled in coverage through the Marketplaces – with or without the first premium
payment having been received directly by the issuer. Individuals who have cancelled or
terminated their Marketplace plans are not included in the total number of plan selections.
These data also do not include: stand-alone dental plan selections; or individuals who
may have selected a 2015 Marketplace plan during the reporting period, as a result of
having been eligible for a Special Enrollment Period (SEP). This category is consistent
with the “consumers renewing coverage” category that is included in the CMS Weekly
Enrollment Snapshots. Consumers reenrolling in coverage through the Marketplaces
includes the following two categories:
o Consumers who are Actively Reenrolling in Marketplace Coverage – People who
had a Marketplace plan selection as of November 2015, and return to the Marketplace
to select a new plan or actively renew their existing plan. A consumer is considered
to have actively selected a plan, if they are a consumer with coverage in 2015 who
came back, updated their application and selected a plan. The consumer could have
actively selected their 2016 plan, decided to choose a new plan from their existing
insurer or selected a new plan from a different insurer. A consumer could have
actively selected a plan prior to the 12-17-15 deadline or could have come back after
being automatically reenrolled and decided to update their information and select a
plan; and
o Consumers who have been Automatically Reenrolled into Marketplace Coverage
(also known as “Automatic Reenrollees”) – People who had a Marketplace plan
selection as of November 2015 (or as of 10-31-15 for SBMs using their own
Marketplace platforms), and retain coverage without returning to the Marketplace and
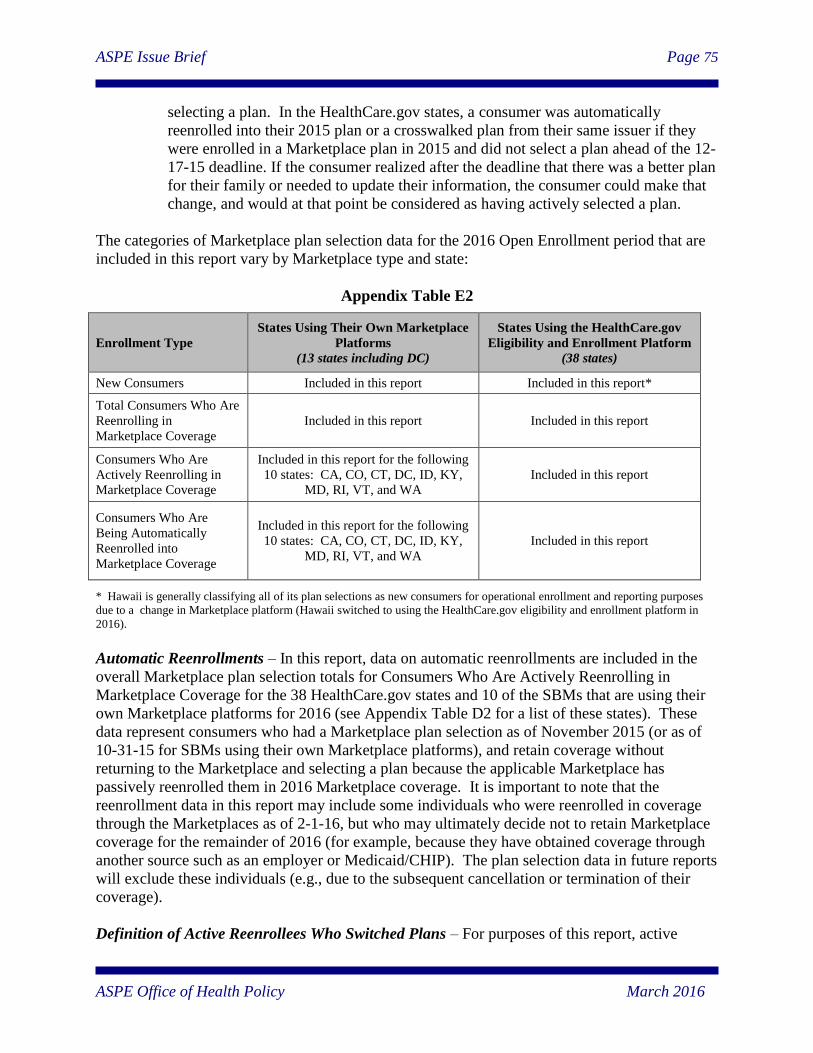
ASPE Issue Brief Page 75
ASPE Office of Health Policy March 2016
selecting a plan. In the HealthCare.gov states, a consumer was automatically
reenrolled into their 2015 plan or a crosswalked plan from their same issuer if they
were enrolled in a Marketplace plan in 2015 and did not select a plan ahead of the 12-
17-15 deadline. If the consumer realized after the deadline that there was a better plan
for their family or needed to update their information, the consumer could make that
change, and would at that point be considered as having actively selected a plan.
The categories of Marketplace plan selection data for the 2016 Open Enrollment period that are
included in this report vary by Marketplace type and state:
Appendix Table E2
Enrollment Type
States Using Their Own Marketplace
Platforms
(13 states including DC)
States Using the HealthCare.gov
Eligibility and Enrollment Platform
(38 states)
New Consumers Included in this report Included in this report*
Total Consumers Who Are
Reenrolling in
Marketplace Coverage
Included in this report Included in this report
Consumers Who Are
Actively Reenrolling in
Marketplace Coverage
Included in this report for the following
10 states: CA, CO, CT, DC, ID, KY,
MD, RI, VT, and WA
Included in this report
Consumers Who Are
Being Automatically
Reenrolled into
Marketplace Coverage
Included in this report for the following
10 states: CA, CO, CT, DC, ID, KY,
MD, RI, VT, and WA
Included in this report
* Hawaii is generally classifying all of its plan selections as new consumers for operational enrollment and reporting purposes
due to a change in Marketplace platform (Hawaii switched to using the HealthCare.gov eligibility and enrollment platform in
2016).
Automatic Reenrollments – In this report, data on automatic reenrollments are included in the
overall Marketplace plan selection totals for Consumers Who Are Actively Reenrolling in
Marketplace Coverage for the 38 HealthCare.gov states and 10 of the SBMs that are using their
own Marketplace platforms for 2016 (see Appendix Table D2 for a list of these states). These
data represent consumers who had a Marketplace plan selection as of November 2015 (or as of
10-31-15 for SBMs using their own Marketplace platforms), and retain coverage without
returning to the Marketplace and selecting a plan because the applicable Marketplace has
passively reenrolled them in 2016 Marketplace coverage. It is important to note that the
reenrollment data in this report may include some individuals who were reenrolled in coverage
through the Marketplaces as of 2-1-16, but who may ultimately decide not to retain Marketplace
coverage for the remainder of 2016 (for example, because they have obtained coverage through
another source such as an employer or Medicaid/CHIP). The plan selection data in future reports
will exclude these individuals (e.g., due to the subsequent cancellation or termination of their
coverage).
Definition of Active Reenrollees Who Switched Plans – For purposes of this report, active

ASPE Issue Brief Page 76
ASPE Office of Health Policy March 2016
reenrollees who switched plans are active reenrollees who have not selected the same plan as for
the 2016 coverage year, or a “crosswalked” plan that is offered by the same issuer as their 2015
plan.
Categories for Reporting State-Level Marketplace Data – The Health Insurance Marketplace
includes the Marketplaces established in each of the states (and the District of Columbia) and run
by the state or the federal government. This report addresses the individual market Marketplaces
that are using their own Marketplace platforms for the 2016 coverage year, as well as the
individual market Marketplaces that are using the HealthCare.gov Marketplace eligibility and
enrollment platform for eligibility and enrollment for the 2016 coverage year (data for the small
group Marketplace, also known as SHOP, are not included in this report).
Marketplace enrollment-for the 2016 Open Enrollment period, will be reported based on the
following two major categories:
• State-Based Marketplaces (SBMs) Using Their Own Marketplace Platform – 13
states (including DC):
California, Colorado, Connecticut, District of Columbia, Idaho, Kentucky, Maryland,
Massachusetts, Minnesota, New York, Rhode Island, Vermont, and Washington.
• States Using the HealthCare.gov Eligibility and Enrollment Platform – 38 states,
including:
o State-Based Marketplaces Using the HealthCare.gov eligibility and enrollment
platform – 4 states
Hawaii, Nevada, New Mexico, and Oregon (Note: one of these states (New Mexico) also
used the HealthCare.Gov eligibility and enrollment platform during the 2014 Open
Enrollment period; however, Nevada and Oregon switched to using the HealthCare.gov
eligibility and enrollment platform for the 2015 Open Enrollment period, and Hawaii
switched to using the HealthCare.gov eligibility and enrollment platform for the 2015
Open Enrollment period,).
o Federally-Facilitated Marketplaces – 34 states
Alabama, Alaska, Arizona, Arkansas, Delaware, Florida, Georgia, Illinois, Indiana, Iowa,
Kansas, Louisiana, Maine, Michigan, Mississippi, Missouri, Montana, Nebraska, New
Hampshire, New Jersey, North Carolina, North Dakota, Ohio, Oklahoma, Pennsylvania,
South Carolina, South Dakota, Tennessee, Texas, Utah, Virginia, West Virginia,
Wisconsin, and Wyoming. (Note: all of these states also used the HealthCare.gov
eligibility and enrollment platform during the 2014 and Open Enrollment periods).
Notes on Changes in Marketplace Platforms – Hawaii switched from using its own
Marketplace eligibility and enrollment platform in 2015 to using the HealthCare.gov eligibility
and enrollment platform for eligibility and enrollment for 2016 (as a consequence, people who

ASPE Issue Brief Page 77
ASPE Office of Health Policy March 2016
select 2016 Marketplace plans in Hawaii are generally treated as new consumers for operational
enrollment and reporting purposes because the system cannot identify or automatically reenroll
individuals who previously had 2015 Marketplace coverage in this state).
Data on Total Number of Completed Applications and Total Individuals Applying for
Coverage in Completed Applications – We are showing data on the number of completed
applications and the total number of individuals applying for coverage in the completed
applications in this report.
This includes a consumer who is on a completed and submitted application or who, through the
automatic re-enrollment process (which occurs at the end of December in the states using the
HealthCare.gov eligibility and enrollment platform), had an application submitted to a
Marketplace using the HealthCare.gov eligibility and enrollment platform. If determined eligible
for Marketplace coverage, a new consumer still needs to pick a health plan (i.e., plan selection)
and pay their premium to get covered (i.e., effectuated enrollment). Because families can submit
a single application, “Total Individuals Applying for Coverage” represents the total number of
people on a submitted application (rather than the total number of submitted applications).
Data on Marketplace Plan Selections with Financial Assistance – Marketplace plan selections
with financial assistance includes plan selections for individuals who are receiving a premium
tax credit and/or cost-sharing reduction.
Colorado and Washington’s plan selection breakouts for plan selections with financial assistance
slightly differ from the breakouts that were originally submitted by the States. The sum of the
original breakouts by financial assistance status exceeded total plan selections due to a lag in
timing of running the data for total plan selections and the plan selection breakouts by financial
assistance status. As a result, slight adjustments were made to Colorado and Washington’s
breakouts of plan selections by financial assistance in order to ensure that they sum to the total
plan selection numbers for Colorado and Washington.
Data on Premium Tax Credits – The Affordable Care Act specifies that an individual or family
who is eligible for premium tax credits will be required to pay no more than a fixed percentage of
their income based on the second-lowest cost silver plan available in the Marketplace in their
coverage area. This applicable percentage varies only by household income as a percentage of the
Federal Poverty Level (FPL) and does not depend on household members’ ages, the number of
people within the household covered through the Marketplace, or Marketplace premiums. The
applicable percentage is converted into a maximum dollar amount the household is required to pay
annually for the benchmark plan, and the premium tax credit is applied to make up the difference
between the maximum dollar amount and the actual premium, if any. The exact dollar amount of the
premium tax credit depends on the premium of the second-lowest cost silver plan available to the
household and the cost of covering the family members who are seeking Marketplace coverage.
For purposes of this report, an individual qualifying for an advance premium tax credit was
defined as any individual with an APTC amount >$0. Averages in this report refer to plan-
selection-weighted averages across individuals with plan selections with advance premium tax

ASPE Issue Brief Page 78
ASPE Office of Health Policy March 2016
credits in the 38 HealthCare.gov states.3
Data on Characteristics of Marketplace Plan Selections by Metal Level – For the SBMs using
their own Marketplace platforms, the subtotals for each metal tier type may not sum to the total
number of Plan Selections with Available Data on Metal Level due to a small number of
individuals who have multiple 2016 Marketplace plan selections in the system that will be
resolved through data cleanup processes. For the HealthCare.gov states, in instances where
consumers selected more than one Marketplace medical plan metal level type in their state, an
algorithm was used to identify the “best” plan in order to prevent duplication. Data for stand-
alone dental plan selections are shown separately.
Stand-alone Dental Plan Selections – Individuals who are shopping for health insurance
coverage in the Marketplace have the choice of selecting:
• A medical Marketplace plan with integrated dental coverage,
• A medical Marketplace plan without integrated dental coverage, or
• A medical Marketplace plan and a separate stand-alone dental plan (it is not possible to
select a stand-alone dental plan without also selecting a medical plan).
Individuals who have selected both a medical Marketplace plan and a stand-alone dental plan are
only counted once in the total Marketplace plan selections metric. However, we report data on
total stand-alone dental plan selections separately including combined data for both the “High”
and “Low” stand-alone dental plan types (see Appendix Tables A1, A2 and A3).
Data on Additional Characteristics of Marketplace Plan Selections – This report also includes
data on the characteristics of individuals who have selected a Marketplace plan in the 38 states
that are using the HealthCare.gov eligibility and enrollment platform by Race/Ethnicity, Rural
Status and Household Income. In some cases, the data for certain characteristics of Marketplace
plan selections are not yet available. For this reason, for each metric, we have calculated the
comparable percentages based on the number of plan selections with known data for that metric.
Race/Ethnicity – The application for Marketplace coverage in the states using the
HealthCare.gov eligibility and enrollment platform contains questions on race and on
ethnicity, which are both marked as optional. The share of unknown race/ethnicity in
Marketplace plan selection data for HealthCare.gov states is higher than in federal survey
data,4 but lower than that reported in administrative data sources in the healthcare
industry.5 Thus, while this information is provided for transparency purposes, its quality
3 For additional methodological information, see the ASPE Issue Brief “Health Insurance Marketplace 2015: Average Premiums
After Advance Premium Tax Credits Through January 30 in 37 States Using the HealthCare.gov Platform,” accessed at
http://www.aspe.hhs.gov/health/reports/2015/MarketPlaceEnrollment/APTC/ib_APTC.pdf. 4 The main Census surveys have missing data on 3 to 5 percent of respondents, and the National Health Interview Survey has
missing information for about 5 percent of respondents. (Source: ASPE correspondence with U.S. Census and the National
Center for Health Statistics regarding the American Community Survey, the Current Population Survey, and the National Health
Interview Survey; February 2014.) 5 For example, a study of administrative data from the Department of Veterans Affairs found that race/ethnicity information was
missing from files for 36 percent of patients. Additionally, as of 2008, commercial plans that collected race and ethnicity data
only had information for about 40 percent of their members. The health insurance company Aetna, which began collecting data
on race and ethnicity for all its members in 2002 via enrollment forms, currently has information on race/ethnicity for about 35

ASPE Issue Brief Page 79
ASPE Office of Health Policy March 2016
is low and its use should be limited. For example, it is also important to note that the
racial/ethnic makeup of the individuals with unknown race and ethnicity who selected a
Marketplace plan in the HealthCare.gov states may differ substantially from that among
those who reported race and ethnicity. For example, if racial and ethnic minorities are
more likely to skip the optional questions, they would be disproportionately under-
reported in the overall totals.6 CMS has updated the methodology for identifying Latinos
applying for 2016 coverage by incorporating the selection of “Other” ethnicity as Latino.
Specifically, all consumers who selected “Other ethnicity” on their application are now
counted as Latino. Latino ethnicity is indicated when Mexican, Mexican American,
Chicano/a, Puerto Rican, Cuban, and/or Other is selected. This has led to an increase in
the number of reported Latinos compared to previous years.
Rural Status – The proportion of Marketplace plan selections in rural areas was derived
by aggregating data for Marketplace plan selections with valid ZIP Code information
based on the HHS Office of Rural Health Policy’s (ORHP) most current list of Rural
Designated ZIPs, which has been updated using the 2010 Census data.
Household Income – Household Income represents the individual’s household income as
a percentage of the Federal Poverty Level. The 2015 Federal Poverty Guidelines, which
are used in determining premium tax credits for 2016 coverage, can be accessed at
http://aspe.hhs.gov/poverty/15poverty.cfm.
Number of Individuals Determined or Assessed Eligible for Medicaid / CHIP by the
Marketplace – Marketplace Medicaid & CHIP eligibility determination and assessment data in
this report cannot be added to eligibility determination data in the most recent monthly Medicaid
and CHIP Applications, Eligibility Determinations, and Enrollment report (available on
www.Medicaid.gov). Some of the individuals assessed or determined eligible for Medicaid or
CHIP by the Marketplace and reported in this report may also be reported in the monthly
Medicaid and CHIP Applications, Eligibility Determinations, and Enrollment Report when the
state has made an eligibility determination based on the information provided by the
Marketplace. Total Medicaid & CHIP enrollment is reported in the monthly Medicaid and CHIP
Applications, Eligibility Determinations, and Enrollment Report, and is a point-in-time count of
total enrollment in the Medicaid and CHIP programs at the end of the monthly reporting period.
Appendix Table E3
Metric Number of States Reporting Data for this Metric
percent of its membership. (Sources: Nancy R. Kressin, Bei-Hung Chang, Ann Hendricks, and Lewis E. Kazis, “Agreement
between administrative data and patients’ self-reports of race/ethnicity,” American Journal of Public Health, vol. 93, no. 10
(2003), p. 1734-1739); José J. Escarce, Rita Carreón, German Veselovskiy, and Elisa H. Lawson, “Collection of race and
ethnicity data by health plans has grown substantially, but opportunities remain to expand efforts,” Health Affairs, vol. 30, no. 10
(2011); and Aetna, “Aetna’s Commitment,” accessed April 25, 2014. Available at: http://www.aetna.com/about-aetna-
insurance/initiatives/racial-ethnic-equality/index.html. 6 For additional information on the methodology that was used to analyze the characteristics of individuals who selected a
Marketplace plan in the HealthCare.gov states by race/ethnicity, please refer to Appendix C in the 2014 Marketplace Summary
Enrollment Report, which can be accessed at
http://www.aspe.hhs.gov/health/reports/2014/MarketPlaceEnrollment/Apr2014/ib_2014Apr_enrollment.pdf.
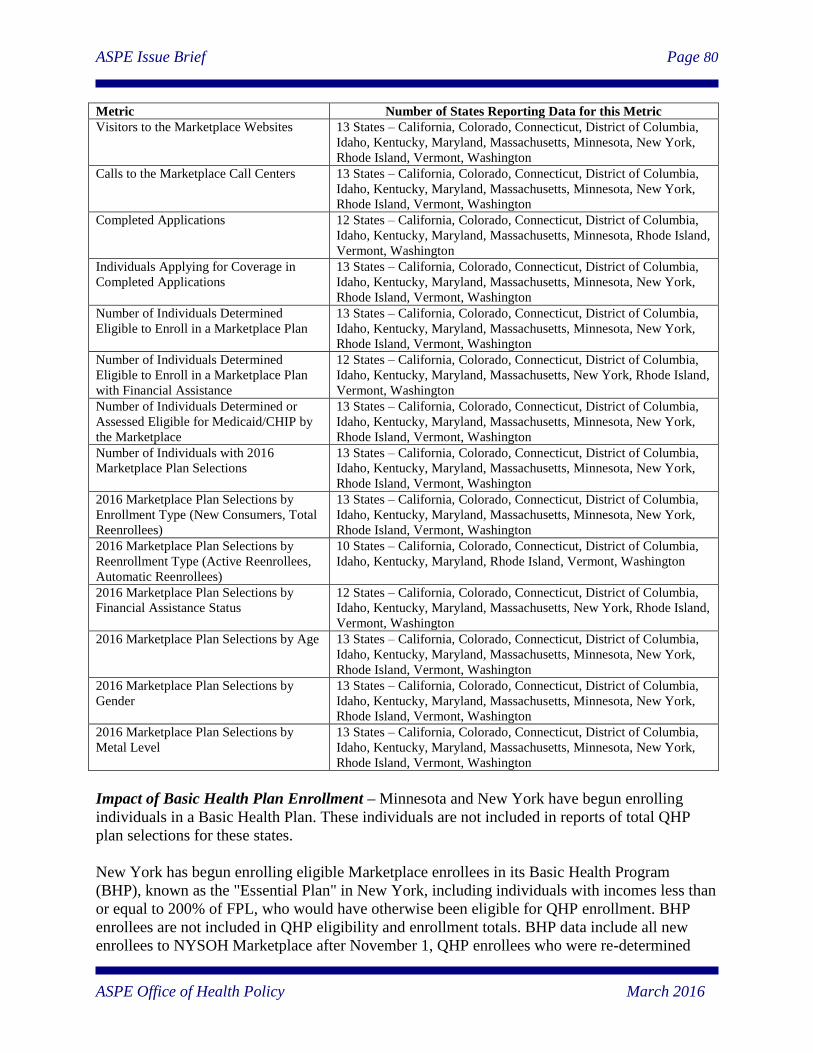
ASPE Issue Brief Page 80
ASPE Office of Health Policy March 2016
Metric Number of States Reporting Data for this Metric
Visitors to the Marketplace Websites 13 States – California, Colorado, Connecticut, District of Columbia,
Idaho, Kentucky, Maryland, Massachusetts, Minnesota, New York,
Rhode Island, Vermont, Washington
Calls to the Marketplace Call Centers 13 States – California, Colorado, Connecticut, District of Columbia,
Idaho, Kentucky, Maryland, Massachusetts, Minnesota, New York,
Rhode Island, Vermont, Washington
Completed Applications 12 States – California, Colorado, Connecticut, District of Columbia,
Idaho, Kentucky, Maryland, Massachusetts, Minnesota, Rhode Island,
Vermont, Washington
Individuals Applying for Coverage in
Completed Applications
13 States – California, Colorado, Connecticut, District of Columbia,
Idaho, Kentucky, Maryland, Massachusetts, Minnesota, New York,
Rhode Island, Vermont, Washington
Number of Individuals Determined
Eligible to Enroll in a Marketplace Plan
13 States – California, Colorado, Connecticut, District of Columbia,
Idaho, Kentucky, Maryland, Massachusetts, Minnesota, New York,
Rhode Island, Vermont, Washington
Number of Individuals Determined
Eligible to Enroll in a Marketplace Plan
with Financial Assistance
12 States – California, Colorado, Connecticut, District of Columbia,
Idaho, Kentucky, Maryland, Massachusetts, New York, Rhode Island,
Vermont, Washington
Number of Individuals Determined or
Assessed Eligible for Medicaid/CHIP by
the Marketplace
13 States – California, Colorado, Connecticut, District of Columbia,
Idaho, Kentucky, Maryland, Massachusetts, Minnesota, New York,
Rhode Island, Vermont, Washington
Number of Individuals with 2016
Marketplace Plan Selections
13 States – California, Colorado, Connecticut, District of Columbia,
Idaho, Kentucky, Maryland, Massachusetts, Minnesota, New York,
Rhode Island, Vermont, Washington
2016 Marketplace Plan Selections by
Enrollment Type (New Consumers, Total
Reenrollees)
13 States – California, Colorado, Connecticut, District of Columbia,
Idaho, Kentucky, Maryland, Massachusetts, Minnesota, New York,
Rhode Island, Vermont, Washington
2016 Marketplace Plan Selections by
Reenrollment Type (Active Reenrollees,
Automatic Reenrollees)
10 States – California, Colorado, Connecticut, District of Columbia,
Idaho, Kentucky, Maryland, Rhode Island, Vermont, Washington
2016 Marketplace Plan Selections by
Financial Assistance Status
12 States – California, Colorado, Connecticut, District of Columbia,
Idaho, Kentucky, Maryland, Massachusetts, New York, Rhode Island,
Vermont, Washington
2016 Marketplace Plan Selections by Age 13 States – California, Colorado, Connecticut, District of Columbia,
Idaho, Kentucky, Maryland, Massachusetts, Minnesota, New York,
Rhode Island, Vermont, Washington
2016 Marketplace Plan Selections by
Gender
13 States – California, Colorado, Connecticut, District of Columbia,
Idaho, Kentucky, Maryland, Massachusetts, Minnesota, New York,
Rhode Island, Vermont, Washington
2016 Marketplace Plan Selections by
Metal Level
13 States – California, Colorado, Connecticut, District of Columbia,
Idaho, Kentucky, Maryland, Massachusetts, Minnesota, New York,
Rhode Island, Vermont, Washington
Impact of Basic Health Plan Enrollment – Minnesota and New York have begun enrolling
individuals in a Basic Health Plan. These individuals are not included in reports of total QHP
plan selections for these states.
New York has begun enrolling eligible Marketplace enrollees in its Basic Health Program
(BHP), known as the "Essential Plan" in New York, including individuals with incomes less than
or equal to 200% of FPL, who would have otherwise been eligible for QHP enrollment. BHP
enrollees are not included in QHP eligibility and enrollment totals. BHP data include all new
enrollees to NYSOH Marketplace after November 1, QHP enrollees who were re-determined

ASPE Issue Brief Page 81
ASPE Office of Health Policy March 2016
eligible for the Essential Plan on or after 11/1/2015, and some of the lawfully residing non-
citizens below 138 percent of FPL that were determined eligible for BHP since 4/1/2015. This
figure includes the majority of lawfully residing non-citizens below 138 percent of FPL that were
determined eligible for BHP since 4/1/2015. The remaining individuals will be transitioned to the
NYSOH Marketplace at their renewal beginning January 2016.
The following is a summary of enrollment data for New York’s Essential Plan.
Appendix Table E4
Enrollment Data for New York’s Essential Plan
Number 11-1-15 to 1-31-16
Total Enrollees 379,559
Female 204,777
Male 174,782
Age < 18 0
Age 18-25 53,644
Age 26-34 89,197
Age 35-44 79,054
Age 45-54 83,165
Age 55-64 74,499
Age ≥65 0
Effectuated Enrollment – Data on effectuated enrollment for the 2016 Open Enrollment period
are not yet available. Therefore, the enrollment data in this report are generally based on pre-
effectuated enrollment (plan selections). However, one state, Washington, has reported data on
effectuated enrollment.