ADB–OECD Study on Enhancing Financial Accessibility for · PDF fileADB–OECD Study...
209
ADB–OECD Study on Enhancing Financial Accessibility for SMEs Lessons from Recent Crises
Transcript of ADB–OECD Study on Enhancing Financial Accessibility for · PDF fileADB–OECD Study...
Printed in the Philippines
Asian Development Bank6 ADB Avenue, Mandaluyong City1550 Metro Manila, Philippineswww.adb.org
ADB–OECD Study on Enhancing Financial Accessibility for SMEs
ADB–OECD Study on Enhancing Financial Accessibility for SMEsLessons from Recent Crises
The report takes a comparative look at ADB and OECD experiences, and aims to identify promising policy solutions for creating an SME base that is resilient to crisis, from a viewpoint of access to finance, and which can help drive growth and development.
About the Asian Development Bank
ADB’s vision is an Asia and Pacific region free of poverty. Its mission is to help its developing member countries reduce poverty and improve the quality of life of their people. Despite the region’s many successes, it remains home to approximately two-thirds of the world’s poor: 1.6 billion people who live on less than $2 a day, with 733 million struggling on less than $1.25 a day. ADB is committed to reducing poverty through inclusive economic growth, environmentally sustainable growth, and regional integration.
Based in Manila, ADB is owned by 67 members, including 48 from the region. Its main instruments for helping its developing member countries are policy dialogue, loans, equity investments, guarantees, grants, and technical assistance.
Lessons from Recent Crises
ADB–OECD Study on Enhancing Financial Accessibility for SMEs
Lessons from Recent Crises

Printed on recycled paper
© 2014 Asian Development Bank
All rights reserved. Published in 2014.Printed in the Philippines.
ISBN 978-92-9092-488-1 (Print), 978-92-9092-489-8 (PDF)Publication Stock No. RPT146403-2
Cataloging-in-Publication Data
Asian Development Bank. ADB–OECD study on enhancing financial accessibility for SMEs: Lessons from recent crises.Mandaluyong City, Philippines: Asian Development Bank, 2013.
1. Small and medium-sized enterprises. 2. SME finance. 3. Business financing. I. Asian Development Bank.
The views expressed in this publication are those of the authors and do not necessarily reflect the views and policies of the Asian Development Bank (ADB) or its Board of Governors or the governments they represent.
ADB does not guarantee the accuracy of the data included in this publication and accepts no responsibility for any consequence of their use.
By making any designation of or reference to a particular territory or geographic area, or by using the term “country” in this document, ADB does not intend to make any judgments as to the legal or other status of any territory or area.
ADB encourages printing or copying information exclusively for personal and noncommercial use with proper acknowledgment of ADB. Users are restricted from reselling, redistributing, or creating derivative works for commercial purposes without the express, written consent of ADB.
6 ADB Avenue, Mandaluyong City1550 Metro Manila, PhilippinesTel +63 2 632 4444Fax +63 2 636 2444www.adb.org
For orders, please contact:Public Information CenterFax +63 2 636 [email protected]
iii
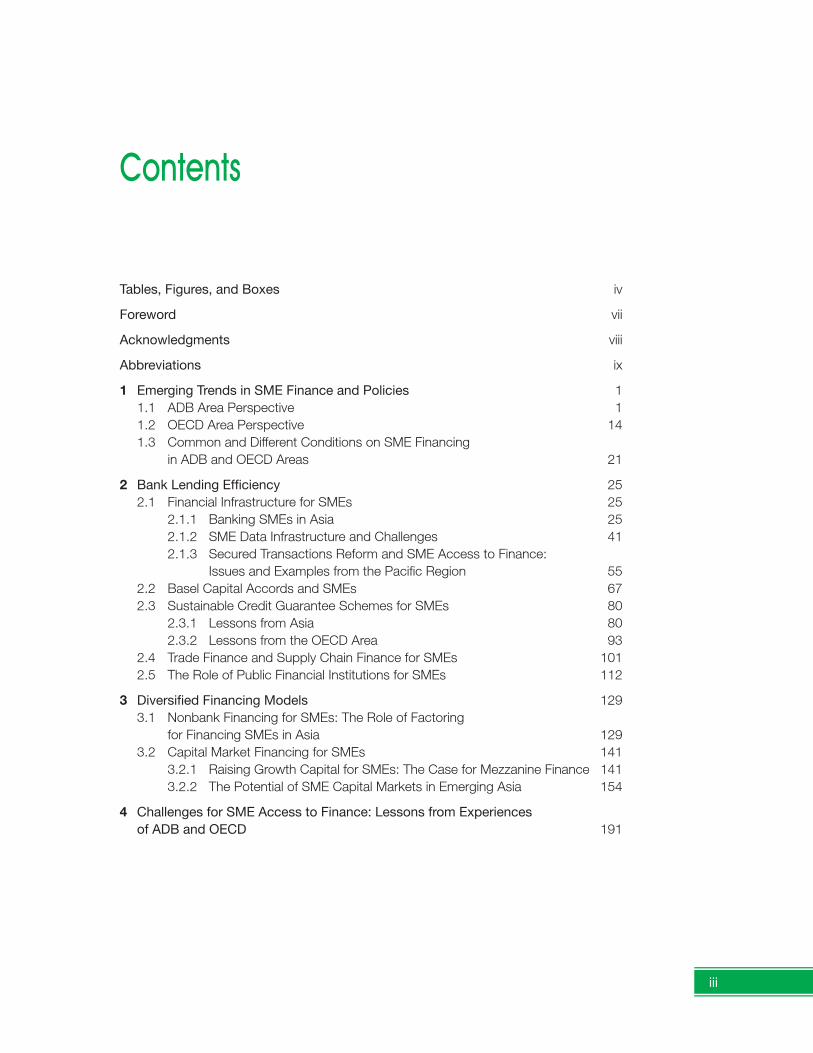
Contents
Tables, Figures, and Boxes iv
Foreword vii
Acknowledgments viii
Abbreviations ix
1 Emerging Trends in SME Finance and Policies 11.1 ADB Area Perspective 11.2 OECD Area Perspective 141.3 Common and Different Conditions on SME Financing
in ADB and OECD Areas 21
2 BankLendingEfficiency 252.1 Financial Infrastructure for SMEs 25
2.1.1 Banking SMEs in Asia 25 2.1.2 SME Data Infrastructure and Challenges 41 2.1.3 Secured Transactions Reform and SME Access to Finance:
Issues and Examples from the Pacific Region 552.2 Basel Capital Accords and SMEs 672.3 Sustainable Credit Guarantee Schemes for SMEs 80
2.3.1 Lessons from Asia 80 2.3.2 Lessons from the OECD Area 93
2.4 Trade Finance and Supply Chain Finance for SMEs 1012.5 The Role of Public Financial Institutions for SMEs 112
3 DiversifiedFinancingModels 1293.1 Nonbank Financing for SMEs: The Role of Factoring
for Financing SMEs in Asia 1293.2 Capital Market Financing for SMEs 141
3.2.1 Raising Growth Capital for SMEs: The Case for Mezzanine Finance 141 3.2.2 The Potential of SME Capital Markets in Emerging Asia 154
4 Challenges for SME Access to Finance: Lessons from Experiences of ADB and OECD 191
iv
Tables, Figures, and Boxes
Tables1 SME Definitions in Asia SME Finance Monitor Countries 22 SME Equity Markets in Selected Asian Countries 103 National SME Policies in Selected Asian Countries 134 Venture and Growth Capital Invested, 2007–2011 185 Bankruptcy Trends, 2007–2011 196 Government Policy Responses to Improve SME Access to Finance,
2007–2011 207 Distribution of Enterprise Sizes across Regions (%) 298 Enterprise Characteristics and Access to Financial Services (%) 319 Financial Services—Pooled Data 3610 Savings and Checking Account Ownership 3711 Access to Overdraft Facility 3812 Line of Credit or Loan 3913 Core Indicators in the OECD Scoreboard on Financing SMEs
and Entrepreneurs 4514 Difference between National Statistical and Financial Definitions of SMEs 4915 Preferred Definitions for Core Indicators 5316 Minimum Capital Adequacy Ratios (%) 6817 Basel III Phase-In Arrangements for Capital Standards (%) 6918A Credit Guarantee Landscape in Selected Asian Economies 8218B Credit Guarantee Landscape in Selected Asian Economies 8319 Government-Guaranteed Loans in Selected OECD Countries, 2007–2011 9720 Comparison between Trade Finance and Supply Chain Finance Programs 11021 Alternative Financing Techniques for SMEs and Entrepreneurs 14322 Comparison of Mezzanine Finance and Other Financing Techniques 14623 Public Schemes to Provide Mezzanine Finance to SMEs 15024 Regulatory Structure for SME Capital Markets in Asia 16125 Type of SME Capital Markets (%) 17226 Average Funding Amounts per Firm 17827 Cost Structure of SME Market 187
Figures1 Number of SMEs 42 Employment by SMEs 43 SME Contribution to Gross Domestic Product 44 SME Exports 45 Impact of Bank Lending on National Economies in ADB Area 66 SME Loans to Gross Domestic Product 7
vTables, Figures, and Boxes
7 SME Loans to Total Loans 78 SME Nonperforming Loans to SME Loans 79 SME Nonperforming Loans to Total Loans 710 Trends in SME Loans, 2007–2011 1711 Trends in SME Finance and Policies in ADB and Organization
for Economic Co-operation and Development Countries 2212 Differential Rates of Fixed Asset Investment in Asia and non-Asia 2813 Differential Access of Banking Services in Asia and non-Asia 3014 Access to Finance and Loan Applications 3215 Source of Financing of Most Recent Loan 3316 Gender and Financial Inclusion 3417 Cumulative Security Interest Filings and Searches
in Five Pacific Island Economies 6418 Bank Adjustments Implemented to Meet Basel III, 2011
(net percentage of responding banks) 7519 SME Access to Guarantee in Selected Asian Economies 8420 Net Profit and Loss of Credit Guarantee Institutions 8521 SME Bank Lending—Indonesia 8622 SME Bank Lending—Thailand 8823 The Way Forward 9024 Growth of Supported Transactions, 2004–2013 10525 Transactions Supporting SMEs in Trade 10626 Good Practices for PFIs Fostering Access to Finance for SMEs 12427 Trade Finance and Supply Chain Finance 13128 Trade Finance and Factoring 13229 Total Factoring Value 13330 Domestic and International Factoring 13331 Factoring in Selected Asian Economies 13432 Domestic Factoring 13533 International Factoring 13734 Potential for Factoring in Asia 13835 Factoring Industry and Trade in Asia 13936 Growth Capital Investment in OECD Countries 15637 SME Equity Markets in Emerging Asia 15938 SME Bond Markets in Emerging Asia 16039 Is Developing Capital Markets for SMEs a Policy Priority? 16740 Actions Necessary to Develop SME Capital Markets 16841 Existing SME Capital Markets Growing? 16942 What Type of Product is Appropriate for SMEs? 17143 Critical Factors Needed to Create an SME Market 17444 Funding Instruments: Present and Future 17645 Loan Term: Present and Future 17746 Purpose of Funds Desired 17947 Barriers to Accessing Financial Institutions 18048 Willingness to Access an SME Capital Market 18149 Growth Capital Funding and Risk Capital Providers 18450 Core Elements to Developing an SME Market 188
vi Tables, Figures, and Boxes
Boxes1 What is an SME? 482 Credit Risk Mitigation 743 Typologies of Public Financial Institutions 1174 Challenges to Developing SME Capital Markets in Thailand 1575 Composition of Supply-Side Organizations Surveyed 1636 Profile of SMEs Surveyed 164
Foreword
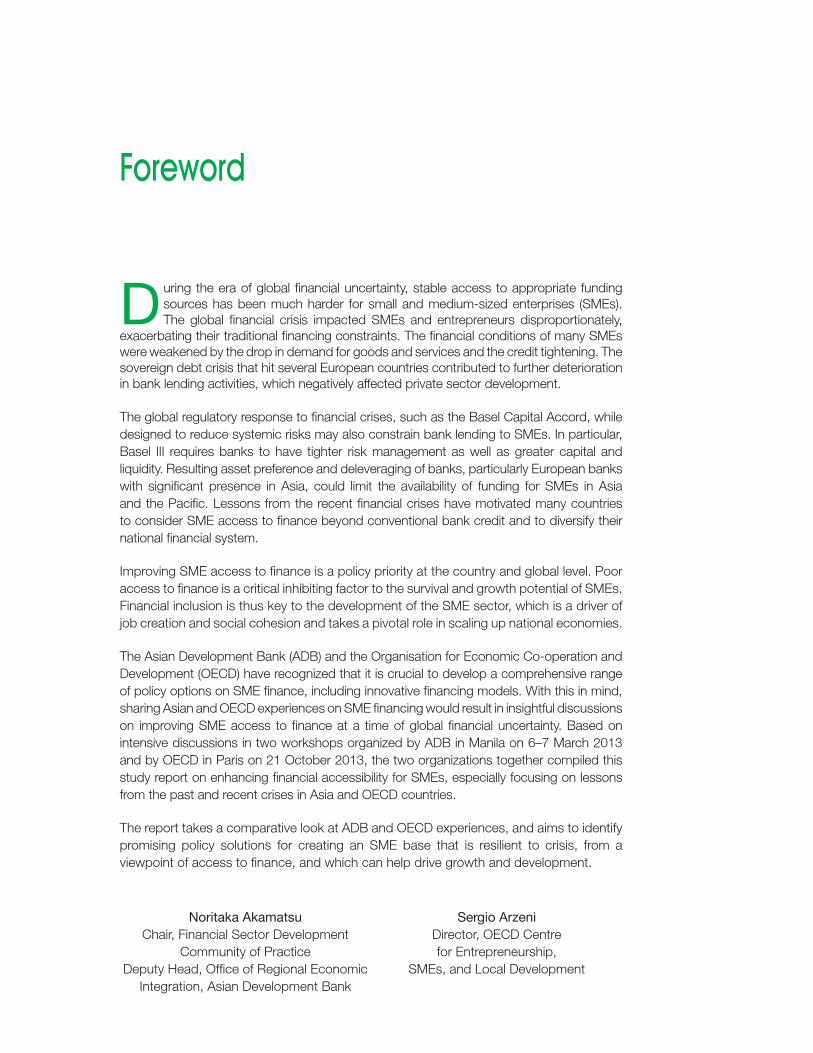
D uring the era of global financial uncertainty, stable access to appropriate funding sources has been much harder for small and medium-sized enterprises (SMEs). The global financial crisis impacted SMEs and entrepreneurs disproportionately,
exacerbating their traditional financing constraints. The financial conditions of many SMEs were weakened by the drop in demand for goods and services and the credit tightening. The sovereign debt crisis that hit several European countries contributed to further deterioration in bank lending activities, which negatively affected private sector development.
The global regulatory response to financial crises, such as the Basel Capital Accord, while designed to reduce systemic risks may also constrain bank lending to SMEs. In particular, Basel III requires banks to have tighter risk management as well as greater capital and liquidity. Resulting asset preference and deleveraging of banks, particularly European banks with significant presence in Asia, could limit the availability of funding for SMEs in Asia and the Pacific. Lessons from the recent financial crises have motivated many countries to consider SME access to finance beyond conventional bank credit and to diversify their national financial system.
Improving SME access to finance is a policy priority at the country and global level. Poor access to finance is a critical inhibiting factor to the survival and growth potential of SMEs. Financial inclusion is thus key to the development of the SME sector, which is a driver ofjob creation and social cohesion and takes a pivotal role in scaling up national economies.
The Asian Development Bank (ADB) and the Organisation for Economic Co-operation and Development (OECD) have recognized that it is crucial to develop a comprehensive range of policy options on SME finance, including innovative financing models. With this in mind, sharing Asian and OECD experiences on SME financing would result in insightful discussions on improving SME access to finance at a time of global financial uncertainty. Based on intensive discussions in two workshops organized by ADB in Manila on 6–7 March 2013 and by OECD in Paris on 21 October 2013, the two organizations together compiled this study report on enhancing financial accessibility for SMEs, especially focusing on lessons from the past and recent crises in Asia and OECD countries.
The report takes a comparative look at ADB and OECD experiences, and aims to identify promising policy solutions for creating an SME base that is resilient to crisis, from a viewpoint of access to finance, and which can help drive growth and development.
Noritaka AkamatsuChair, Financial Sector Development
Community of PracticeDeputy Head, Office of Regional Economic
Integration, Asian Development Bank
Sergio ArzeniDirector, OECD Centre for Entrepreneurship,
SMEs, and Local Development
viii
Acknowledgments
T he study report was jointly prepared by Shigehiro Shinozaki, financial sector specialist of the Office of Regional Economic Integration of the Asian Development Bank (ADB); Lucia Cusmano, senior economist of the SME and Entrepreneurship
Division; and Virginia Robano, consultant for the SME and Entrepreneurship Division of the Organisation for Economic Co-operation and Development (OECD). It was prepared under the supervision of Noritaka Akamatsu, chair of the ADB Financial Sector Development Community of Practice; and Sergio Arzeni, director of the OECD Centre for Entrepreneurship, SMEs, and Local Development. They worked together with an ADB team comprising Niny Khor, economist at the People’s Republic of China Resident Mission; Paul Holden, lead economist of the Pacific Private Sector Development Initiative; Steven Beck, head of trade finance; and Sunniya Durrani-Jamal, senior economist of the Private Sector Operations Department. The OECD team comprised Iota Kaousar Nassr, policy analyst at the OECD Centre for Entrepreneurship, SMEs, and Local Development. The discussion in this report was also elaborated based on policy implications raised in the first workshop held at ADB headquarters in Manila on 6–7 March 2013, and the second workshop held at OECD headquarters in Paris on 21 October 2013.
Alphabetical List of AuthorsSteven Beck Co-author of Section 2.4.
Head of Trade Finance, Private Sector Operations Department, Asian Development Bank (ADB)
Lucia Cusmano Co-author of Sections 1.2, 2.1.2, 2.2, 2.3.2, and 3.2.1.Senior Economist, SME Entrepreneurship Division, Organisation for Economic Co-operation and Development (OECD)
SunniyaDurrani-Jamal Co-author of Section 2.4.Senior Economist, Private Sector Operations Department, ADB
Paul Holden Author of Section 2.1.3.Lead Economist, Pacific Private Sector Development Initiative, ADB
Niny Khor Author of Section 2.1.1.Economist, People’s Republic of China Resident Mission, ADB
IotaKaousarNassr Co-author of Sections 1.2, 2.1.2, 2.2, 2.3.2, and 3.2.1.Policy Analyst, OECD
Virginia Robano Author of Section 2.5; co-author of Sections 1.2, 2.1.2, 2.2, 2.3.2, 3.2.1, and Chapter 4.Consultant, OECD Centre for Entrepreneurship, SMEs, and Local Development
Shigehiro Shinozaki Author of Sections 1.1, 1.3, 2.3.1, 3.1, and 3.2.2; co-author of Chapter 4. Financial Sector Specialist, Office of Regional Economic Integration, ADB
ix
Abbreviations
ACSIC – Asian Credit Supplementation Institution ConfederationADB – Asian Development Bank AIM – alternative investment marketASM – Asia SME Finance MonitorCGC – credit guarantee corporationCGS – credit guarantee schemeCRD IV – Capital Requirements Directive IVDMC – developing member countryEU – European UnionFCI – Factors Chain InternationalGDP – gross domestic productGFC – global financial crisisICC – International Chamber of CommerceIDB – Inter-American Development BankIFC – International Finance CorporationIFG – International Factors GroupKODIT – Korea Credit Guarantee FundKOFIA – Korea Financial Investment AssociationKOTEC – Korea Technology Finance CorporationKUR – Kredit Usaha Rakyat (People’s Business Credit)mai – Market for Alternative Investment (Thailand)MFI – microfinance institutionMGS – mutual guarantee schemeMSE – micro and small enterpriseMSME – micro, small, and medium-sized enterpriseNBFI – nonbank financial institutionNPL – nonperforming loanOECD – Organisation for Economic Co-operation and DevelopmentOJK – Otoritas Jasa Keuangan (Financial Services Authority)OTC – over the counterPFI – public financial institutionPGS – portfolio guarantee schemePRC – People’s Republic of ChinaQIB – qualified institutional buyerSBA – Small Business Administration (United States)SBIC – Small Business Investment Company (United States)SME – small and medium-sized enterpriseSRO – self-regulatory organizationTCG – Thai Credit Guarantee CorporationUS – United States

1
1 Emerging Trends in SME Finance and Policies
1.1. Emerging Trends in SME Finance and Policies: ADB Area Perspective
This section presents recent trends in small and medium-sized enterprise (SME) finance covering banking, nonbanking, and capital markets in Asia and the Pacific. It also reviews government policy responses to financing SMEs, illustrating the SME landscape and the impact of bank lending on national economies in Asian Development Bank (ADB) developing member countries (DMCs). The discussion is based on the data collected for 14 countries through the ADB Asia SME Finance Monitor 2013 (ASM).1 Various types of SMEs, differing by size and sector, exist across the world, which makes thehomogeneous classification difficult for SMEs. According to the degree of economic development, different policy focus and strategies and different financing models for SMEs have been developed in individual countries to establish a resilient national economy and promote sustainable economic growth and social welfare enhancement in that country. The section stresses the importance of broadening financing instruments and building necessary financial infrastructure that serves SME financing needs, and explores possible policy directions for improving SME access to finance.
A. Introduction
The rapid growth of Asia has positioned the region as a growth driver in the global economy. The recent crises—the 2008/09 global financial crisis (GFC) and the eurozone debt crisis—have increased capital flows within Asia. The depressed demand from developed countries caused by the crises is increasingly promoting the dependence on intraregional trade in Asia. Intra-Asia foreign direct investment has also been increasing since the crises. Against this backdrop, it is considered that SMEs involved in global supply chains, e.g., supporting industries or parts industries, play a critical role in further encouraging intraregional trade and intra-Asia foreign direct investment, which willcontribute to mobilizing domestic demand in Asia and rebalancing Asian economies.
The rise in globalization has drastically changed the role of SMEs in the global economy.Accordingly, the focus of national policies related to SME development tends have shifted from being solely domestic to one that is more regional, where the internationalization of
1 The ASM covered 14 countries from the five ADB regions: (i) Kazakhstan (Central Asia); (ii) the People’s Republic of China and the Republic of Korea (East Asia); (iii) Bangladesh, India, and Sri Lanka (South Asia); (iv) Cambodia, Indonesia, Malaysia, the Philippines, Thailand, and Viet Nam (Southeast Asia); and (v) Papua New Guinea and Solomon Islands (the Pacific).
2 ADB–OECD Study on Enhancing Financial Accessibility for SMEs
SMEs and the development of the supporting industries are key for promoting inclusive economic growth and escaping the middle-income trap in Asia and the Pacific.
Adequate access to finance is crucial if SMEs are to survive and grow. Most SMEs have encountered poor access to finance in Asia and the Pacific, and this is one of the underlying factors that hamper their development. The lack of an authorized mechanism for local currency financing is also another barrier to boosting the internationalization of SMEs aiming to develop new business models and cultivate overseas markets. The diversified nature of SMEs has made “one size fits all” financing solutions difficult across the region. Continuing supply–demand gaps in SME finance suggest the need to broaden financing models for SMEs beyond traditional bank lending and ensuring they are tailored to the context of individual countries. Lessons from the GFC have accelerated this movement in many countries.
This section presents recent trends in SME finance covering banking, nonbanking, andcapital markets in Asia and the Pacific, and reviews government policy responses to financing SMEs, together with illustrating the SME landscape and the impact of bank lending on national economies in ADB DMCs.
B. SME Landscape in Asia and the Pacific
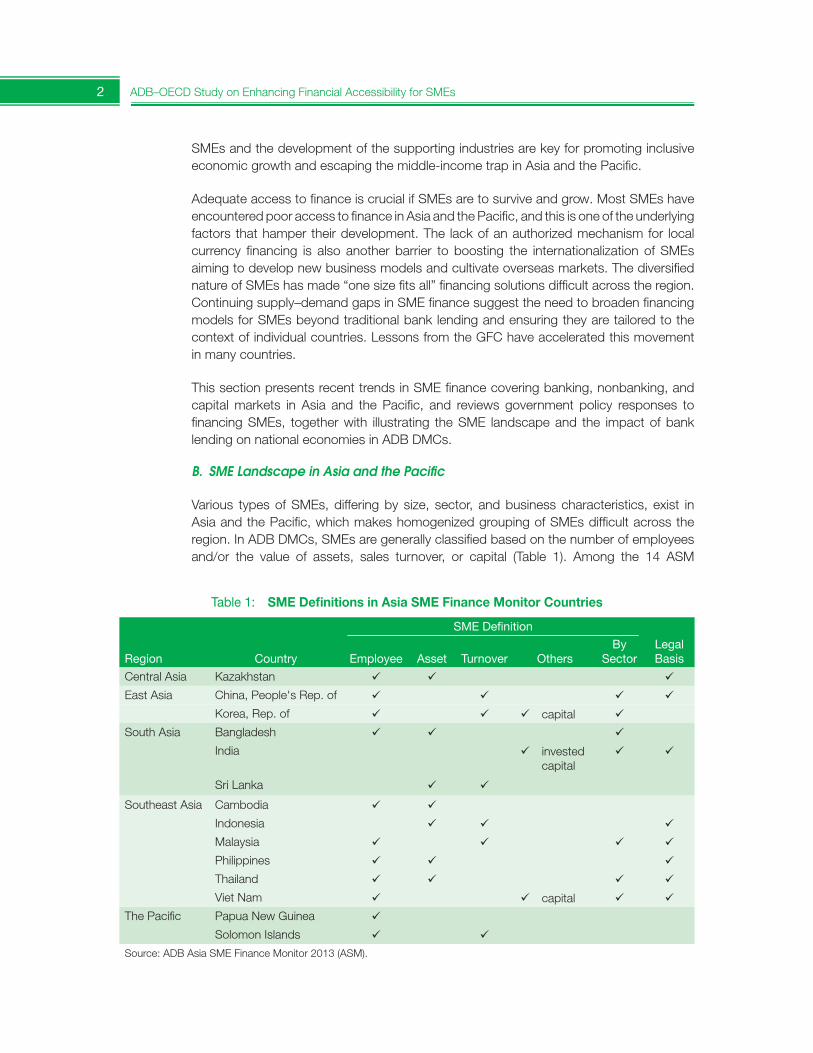
Various types of SMEs, differing by size, sector, and business characteristics, exist inAsia and the Pacific, which makes homogenized grouping of SMEs difficult across the region. In ADB DMCs, SMEs are generally classified based on the number of employees and/or the value of assets, sales turnover, or capital (Table 1). Among the 14 ASM
Table 1: SME Definitions in Asia SME Finance Monitor Countries
Region Country
SMEDefinition
Legal BasisEmployee Asset Turnover Others
BySector
Central Asia Kazakhstan
East Asia China, People's Rep. of
Korea, Rep. of capital
South Asia Bangladesh
India invested capital
Sri Lanka
Southeast Asia Cambodia
Indonesia
Malaysia
Philippines
Thailand
Viet Nam capital
The Pacific Papua New Guinea
Solomon Islands
Source: ADB Asia SME Finance Monitor 2013 (ASM).
Emerging Trends in SME Finance and Policies 3
countries, Bangladesh, the People’s Republic of China (PRC), India, the Republic of Korea, Malaysia, Thailand, and Viet Nam define SMEs by sector (e.g., service, trade, and manufacturing), while other economies adopt a single SME category. Kazakhstan, the PRC, India, Indonesia, Malaysia, the Philippines, Thailand, and Viet Nam define SMEs bylaw, while others practically classify them for the purpose of implementing government and/or ministerial policies and strategies. Cambodia plans to set up a legal definition of SMEs. The SME segment that national policy focuses on also differs by country because of the different level of economic and social development and political concerns. Some policies focus on micro enterprises or micro and small enterprises (MSEs), while others address micro, small, and medium-sized enterprises (MSMEs) or SMEs. Despite this, this chapter uses the term “SME” uniformly.
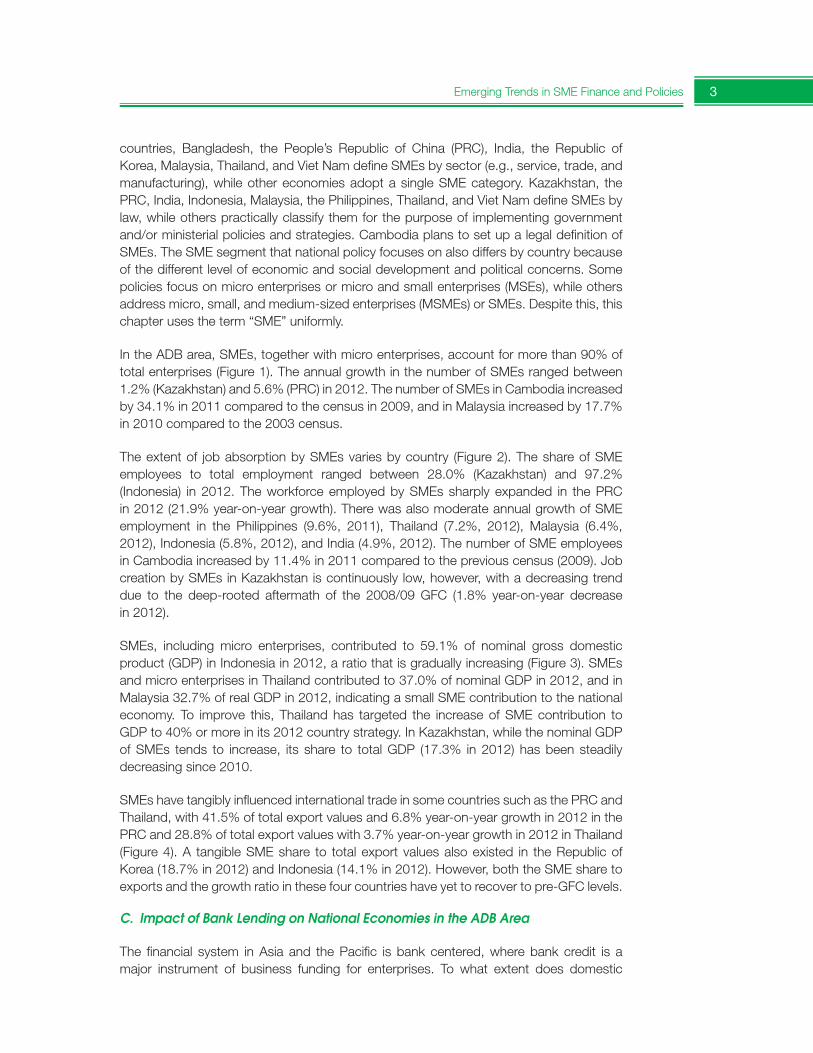
In the ADB area, SMEs, together with micro enterprises, account for more than 90% of total enterprises (Figure 1). The annual growth in the number of SMEs ranged between 1.2% (Kazakhstan) and 5.6% (PRC) in 2012. The number of SMEs in Cambodia increased by 34.1% in 2011 compared to the census in 2009, and in Malaysia increased by 17.7% in 2010 compared to the 2003 census.
The extent of job absorption by SMEs varies by country (Figure 2). The share of SME employees to total employment ranged between 28.0% (Kazakhstan) and 97.2% (Indonesia) in 2012. The workforce employed by SMEs sharply expanded in the PRC in 2012 (21.9% year-on-year growth). There was also moderate annual growth of SME employment in the Philippines (9.6%, 2011), Thailand (7.2%, 2012), Malaysia (6.4%, 2012), Indonesia (5.8%, 2012), and India (4.9%, 2012). The number of SME employees in Cambodia increased by 11.4% in 2011 compared to the previous census (2009). Job creation by SMEs in Kazakhstan is continuously low, however, with a decreasing trend due to the deep-rooted aftermath of the 2008/09 GFC (1.8% year-on-year decrease in 2012).
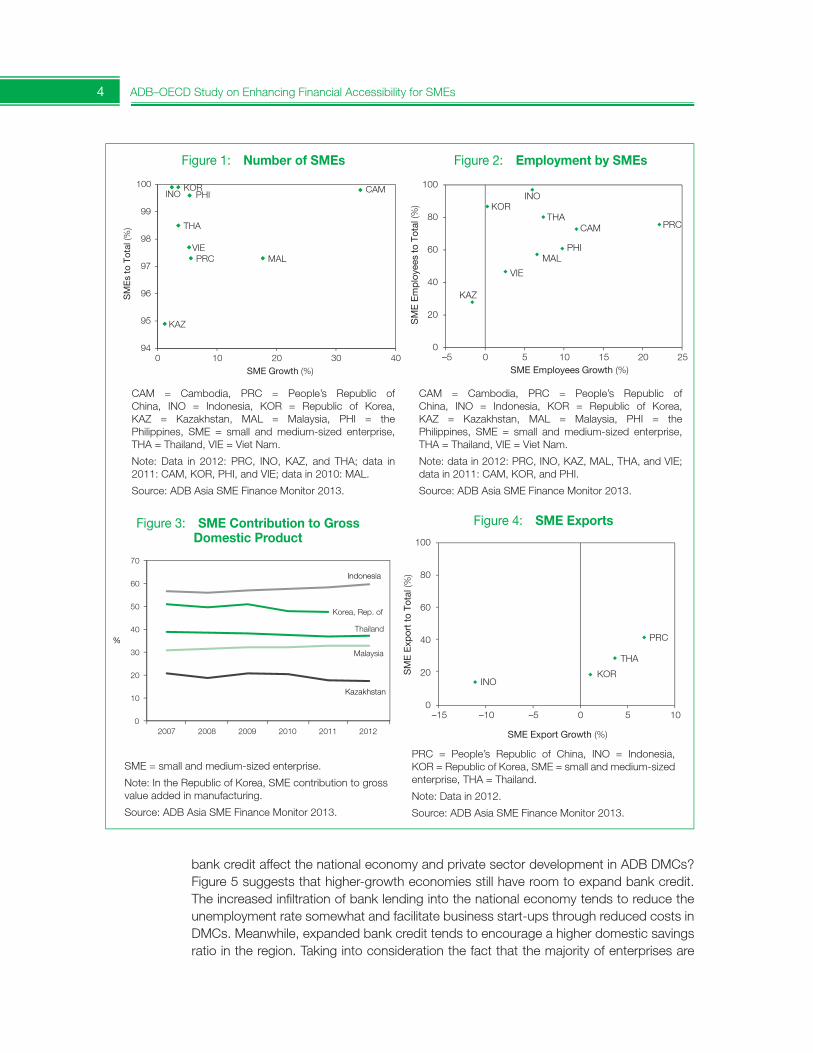
SMEs, including micro enterprises, contributed to 59.1% of nominal gross domestic product (GDP) in Indonesia in 2012, a ratio that is gradually increasing (Figure 3). SMEs and micro enterprises in Thailand contributed to 37.0% of nominal GDP in 2012, and in Malaysia 32.7% of real GDP in 2012, indicating a small SME contribution to the nationaleconomy. To improve this, Thailand has targeted the increase of SME contribution to GDP to 40% or more in its 2012 country strategy. In Kazakhstan, while the nominal GDP of SMEs tends to increase, its share to total GDP (17.3% in 2012) has been steadily decreasing since 2010.
SMEs have tangibly influenced international trade in some countries such as the PRC and Thailand, with 41.5% of total export values and 6.8% year-on-year growth in 2012 in the PRC and 28.8% of total export values with 3.7% year-on-year growth in 2012 in Thailand (Figure 4). A tangible SME share to total export values also existed in the Republic of Korea (18.7% in 2012) and Indonesia (14.1% in 2012). However, both the SME share to exports and the growth ratio in these four countries have yet to recover to pre-GFC levels.
C. Impact of Bank Lending on National Economies in the ADB Area
The financial system in Asia and the Pacific is bank centered, where bank credit is a major instrument of business funding for enterprises. To what extent does domestic
4 ADB–OECD Study on Enhancing Financial Accessibility for SMEs
Figure 1: Number of SMEs
KAZ
PRC
KOR CAMINO
MAL
PHI
THA
VIE
94
95
96
97
98
99
100
0 10 20 30 40
SM
Es
to T
otal
(%)
SME Growth (%)
CAM = Cambodia, PRC = People’s Republic of China, INO = Indonesia, KOR = Republic of Korea, KAZ = Kazakhstan, MAL = Malaysia, PHI = the Philippines, SME = small and medium-sized enterprise, THA = Thailand, VIE = Viet Nam.
Note: Data in 2012: PRC, INO, KAZ, and THA; data in 2011: CAM, KOR, PHI, and VIE; data in 2010: MAL.
Source: ADB Asia SME Finance Monitor 2013.
SM
E E
mp
loye
es to
Tot
al (%
)
–5 0 5 10 15 20 25SME Employees Growth (%)
KAZ
PRC
KOR
MAL
VIE
CAM
INO
PHI
THA
0
20
40
60
80
100
CAM = Cambodia, PRC = People’s Republic of China, INO = Indonesia, KOR = Republic of Korea, KAZ = Kazakhstan, MAL = Malaysia, PHI = the Philippines, SME = small and medium-sized enterprise, THA = Thailand, VIE = Viet Nam.
Note: data in 2012: PRC, INO, KAZ, MAL, THA, and VIE; data in 2011: CAM, KOR, and PHI.
Source: ADB Asia SME Finance Monitor 2013.
Figure 2: Employment by SMEs
Figure 3: SME Contribution to Gross Domestic Product
0
10
20
30
40
50
60
70
2007 2008 2009 2010 2011 2012
%
Indonesia
Korea, Rep. of
Kazakhstan
Malaysia
Thailand
SME = small and medium-sized enterprise.
Note: In the Republic of Korea, SME contribution to gross value added in manufacturing.
Source: ADB Asia SME Finance Monitor 2013.
Figure 4: SME Exports
SM
E E
xpor
t to
Tot
al (%
)
–15 –10 –5 0 5 10
SME Export Growth (%)
0
20
40
60
80
100
PRC
KORINO
THA
PRC = People’s Republic of China, INO = Indonesia, KOR = Republic of Korea, SME = small and medium-sized enterprise, THA = Thailand.
Note: Data in 2012.
Source: ADB Asia SME Finance Monitor 2013.
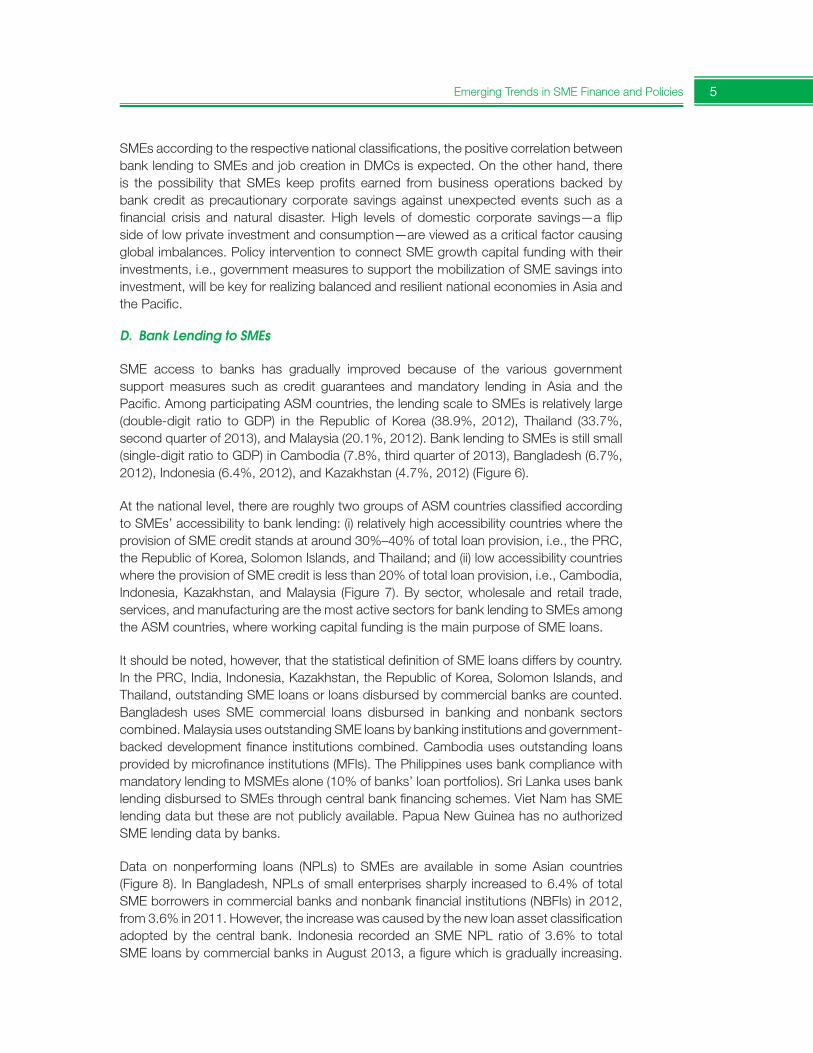
bank credit affect the national economy and private sector development in ADB DMCs?Figure 5 suggests that higher-growth economies still have room to expand bank credit. The increased infiltration of bank lending into the national economy tends to reduce the unemployment rate somewhat and facilitate business start-ups through reduced costs in DMCs. Meanwhile, expanded bank credit tends to encourage a higher domestic savings ratio in the region. Taking into consideration the fact that the majority of enterprises are
Emerging Trends in SME Finance and Policies 5
SMEs according to the respective national classifications, the positive correlation between bank lending to SMEs and job creation in DMCs is expected. On the other hand, there is the possibility that SMEs keep profits earned from business operations backed by bank credit as precautionary corporate savings against unexpected events such as a financial crisis and natural disaster. High levels of domestic corporate savings—a flip side of low private investment and consumption—are viewed as a critical factor causing global imbalances. Policy intervention to connect SME growth capital funding with their investments, i.e., government measures to support the mobilization of SME savings into investment, will be key for realizing balanced and resilient national economies in Asia and the Pacific.
D. Bank Lending to SMEs
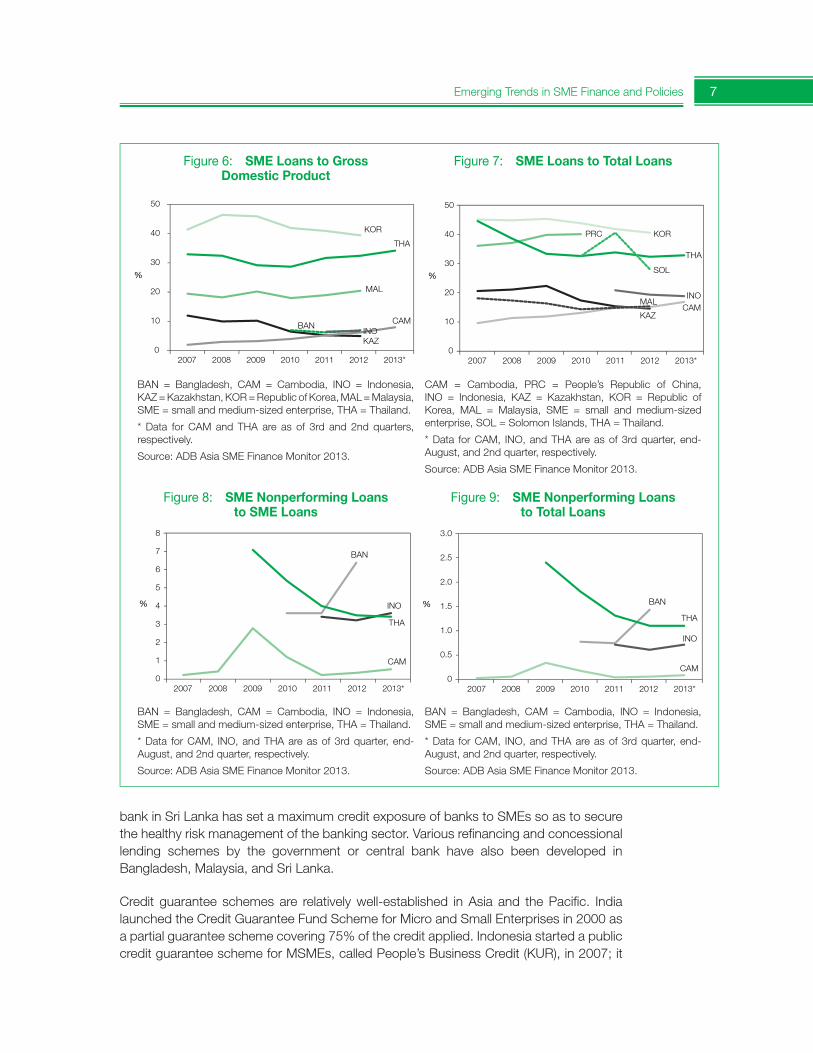
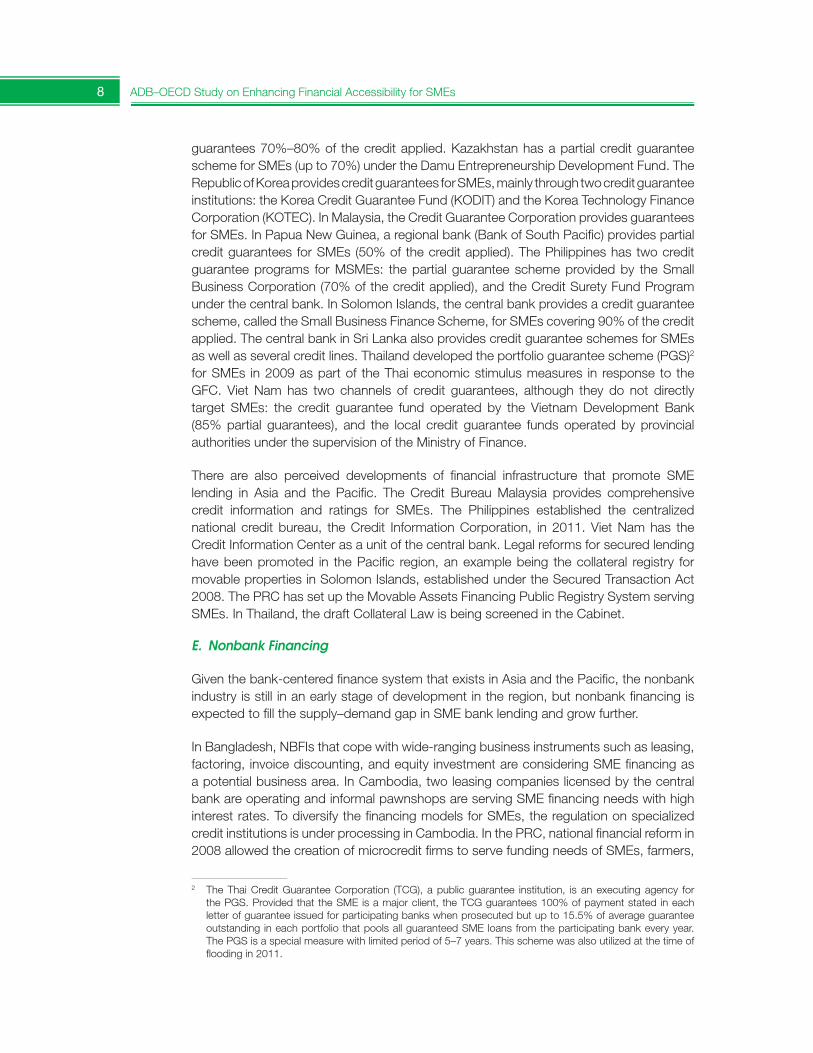
SME access to banks has gradually improved because of the various government support measures such as credit guarantees and mandatory lending in Asia and the Pacific. Among participating ASM countries, the lending scale to SMEs is relatively large (double-digit ratio to GDP) in the Republic of Korea (38.9%, 2012), Thailand (33.7%, second quarter of 2013), and Malaysia (20.1%, 2012). Bank lending to SMEs is still small (single-digit ratio to GDP) in Cambodia (7.8%, third quarter of 2013), Bangladesh (6.7%, 2012), Indonesia (6.4%, 2012), and Kazakhstan (4.7%, 2012) (Figure 6).
At the national level, there are roughly two groups of ASM countries classified according to SMEs’ accessibility to bank lending: (i) relatively high accessibility countries where the provision of SME credit stands at around 30%–40% of total loan provision, i.e., the PRC, the Republic of Korea, Solomon Islands, and Thailand; and (ii) low accessibility countries where the provision of SME credit is less than 20% of total loan provision, i.e., Cambodia, Indonesia, Kazakhstan, and Malaysia (Figure 7). By sector, wholesale and retail trade, services, and manufacturing are the most active sectors for bank lending to SMEs among the ASM countries, where working capital funding is the main purpose of SME loans.
It should be noted, however, that the statistical definition of SME loans differs by country. In the PRC, India, Indonesia, Kazakhstan, the Republic of Korea, Solomon Islands, and Thailand, outstanding SME loans or loans disbursed by commercial banks are counted. Bangladesh uses SME commercial loans disbursed in banking and nonbank sectors combined. Malaysia uses outstanding SME loans by banking institutions and government-backed development finance institutions combined. Cambodia uses outstanding loans provided by microfinance institutions (MFIs). The Philippines uses bank compliance with mandatory lending to MSMEs alone (10% of banks’ loan portfolios). Sri Lanka uses bank lending disbursed to SMEs through central bank financing schemes. Viet Nam has SME lending data but these are not publicly available. Papua New Guinea has no authorized SME lending data by banks.
Data on nonperforming loans (NPLs) to SMEs are available in some Asian countries (Figure 8). In Bangladesh, NPLs of small enterprises sharply increased to 6.4% of totalSME borrowers in commercial banks and nonbank financial institutions (NBFIs) in 2012, from 3.6% in 2011. However, the increase was caused by the new loan asset classification adopted by the central bank. Indonesia recorded an SME NPL ratio of 3.6% to total SME loans by commercial banks in August 2013, a figure which is gradually increasing.
6 ADB–OECD Study on Enhancing Financial Accessibility for SMEs
In Thailand, the NPL ratio of SME lending by commercial banks has been decreasing,down to 3.4% in the second quarter of 2013 from 3.5% in 2012. However, it remainshigh compared to the gross NPL ratio of 2.2% in the same period. In Cambodia, the NPLratio in MFIs is low (0.5%), while that in the banking sector was 2.5% in September 2013.Although the actual situation differs, by comparing SME NPLs to total SME loans withthose to total loans, it can be concluded that SMEs are the main contributor to generatingNPLs (Figures 8–9).
To improve bankability for SMEs, the central banks in Bangladesh and India have setannual credit volume targets for lending to SMEs. For instance, banks have been advisedto achieve a 20% year-on-year growth of credit provision to MSEs in India. The centralbank in the Philippines has set up mandatory lending to MSMEs, where banks allocate8% of their net loan portfolio to MSEs and 2% to medium-sized enterprises. The central
Rea
l GD
P G
row
th (%
)
0 50 100 150 200
2
4
6
8
10
12
0
14
Domestic Credit by Bank (% of GDP)
Une
mp
loym
ent R
ate
(%)
0 50 100 150 200
2
4
6
8
10
12
14
16
18
0
20
Domestic Credit by Bank (% of GDP)
Gro
ss D
omes
tic S
avin
gs (%
of G
DP
)
0 50 100 150 200
10
20
30
40
50
60
0
70
Domestic Credit by Bank (% of GDP)
Bus
ines
s S
tart
-Up
Cos
t (%
of G
NI p
er c
apita
)
0 50 100 150 200
20
40
60
80
100
0
120
Domestic Credit by Bank (% of GDP)
GDP = gross domestic product, GNI = gross national income.
* ADB area refers to ADB’s developing member countries (DMCs). Valid samples: 35 DMCs (A), 34 DMCs (B), 27 DMCs (C), and 33 DMCs (D).
The data refer to the latest statistical year in respective countries (mostly as of the end of 2012).
Source: Asian Development Bank Key Indicators 2013.
Figure 5: Impact of Bank Lending on National Economies in ADB Area*
A. Bank Credit and Gross Domestic Product Growth
C. Bank Credit and Savings
B. Bank Credit and Unemployment
D. Bank Credit and Business Start-up Cost
Emerging Trends in SME Finance and Policies 7
bank in Sri Lanka has set a maximum credit exposure of banks to SMEs so as to secure the healthy risk management of the banking sector. Various refinancing and concessional lending schemes by the government or central bank have also been developed in Bangladesh, Malaysia, and Sri Lanka.
Credit guarantee schemes are relatively well-established in Asia and the Pacific. India launched the Credit Guarantee Fund Scheme for Micro and Small Enterprises in 2000 as a partial guarantee scheme covering 75% of the credit applied. Indonesia started a public credit guarantee scheme for MSMEs, called People’s Business Credit (KUR), in 2007; it
Figure 6: SME Loans to Gross Domestic Product
Figure 7: SME Loans to Total Loans
BAN = Bangladesh, CAM = Cambodia, INO = Indonesia, KAZ = Kazakhstan, KOR = Republic of Korea, MAL = Malaysia, SME = small and medium-sized enterprise, THA = Thailand.
* Data for CAM and THA are as of 3rd and 2nd quarters, respectively.
Source: ADB Asia SME Finance Monitor 2013.
CAM = Cambodia, PRC = People’s Republic of China, INO = Indonesia, KAZ = Kazakhstan, KOR = Republic of Korea, MAL = Malaysia, SME = small and medium-sized enterprise, SOL = Solomon Islands, THA = Thailand.
* Data for CAM, INO, and THA are as of 3rd quarter, end-August, and 2nd quarter, respectively.
Source: ADB Asia SME Finance Monitor 2013.
Figure 8: SME Nonperforming Loans to SME Loans
Figure 9: SME Nonperforming Loans to Total Loans
BAN = Bangladesh, CAM = Cambodia, INO = Indonesia, SME = small and medium-sized enterprise, THA = Thailand.
* Data for CAM, INO, and THA are as of 3rd quarter, end-August, and 2nd quarter, respectively.
Source: ADB Asia SME Finance Monitor 2013.
BAN = Bangladesh, CAM = Cambodia, INO = Indonesia, SME = small and medium-sized enterprise, THA = Thailand.
* Data for CAM, INO, and THA are as of 3rd quarter, end-August, and 2nd quarter, respectively.
Source: ADB Asia SME Finance Monitor 2013.
0
10
20
30
40
50
2007 2008 2009 2010 2011 2012 2013*
%
KOR
THA
MAL
CAMBANINOKAZ
0
10
20
30
40
50
2007 2008 2009 2010 2011 2012 2013*
%
CAMINO
THA
SOL
KORPRC
KAZ
MAL
0
1
2
3
5
4
6
7
8
2007 2008 2009 2010 2011 2012 2013*
%
BAN
INO
THA
CAM
0
0.5
1.5
1.0
2.0
2.5
3.0
2007 2008 2009 2010 2011 2012 2013*
% BAN
CAM
INO
THA
8 ADB–OECD Study on Enhancing Financial Accessibility for SMEs
guarantees 70%–80% of the credit applied. Kazakhstan has a partial credit guarantee scheme for SMEs (up to 70%) under the Damu Entrepreneurship Development Fund. The Republic of Korea provides credit guarantees for SMEs, mainly through two credit guarantee institutions: the Korea Credit Guarantee Fund (KODIT) and the Korea Technology Finance Corporation (KOTEC). In Malaysia, the Credit Guarantee Corporation provides guarantees for SMEs. In Papua New Guinea, a regional bank (Bank of South Pacific) provides partial credit guarantees for SMEs (50% of the credit applied). The Philippines has two credit guarantee programs for MSMEs: the partial guarantee scheme provided by the Small Business Corporation (70% of the credit applied), and the Credit Surety Fund Program under the central bank. In Solomon Islands, the central bank provides a credit guarantee scheme, called the Small Business Finance Scheme, for SMEs covering 90% of the credit applied. The central bank in Sri Lanka also provides credit guarantee schemes for SMEs as well as several credit lines. Thailand developed the portfolio guarantee scheme (PGS)2
for SMEs in 2009 as part of the Thai economic stimulus measures in response to the GFC. Viet Nam has two channels of credit guarantees, although they do not directly target SMEs: the credit guarantee fund operated by the Vietnam Development Bank (85% partial guarantees), and the local credit guarantee funds operated by provincial authorities under the supervision of the Ministry of Finance.
There are also perceived developments of financial infrastructure that promote SME lending in Asia and the Pacific. The Credit Bureau Malaysia provides comprehensivecredit information and ratings for SMEs. The Philippines established the centralized national credit bureau, the Credit Information Corporation, in 2011. Viet Nam has the Credit Information Center as a unit of the central bank. Legal reforms for secured lending have been promoted in the Pacific region, an example being the collateral registry for movable properties in Solomon Islands, established under the Secured Transaction Act 2008. The PRC has set up the Movable Assets Financing Public Registry System serving SMEs. In Thailand, the draft Collateral Law is being screened in the Cabinet.
E. Nonbank Financing
Given the bank-centered finance system that exists in Asia and the Pacific, the nonbank industry is still in an early stage of development in the region, but nonbank financing isexpected to fill the supply–demand gap in SME bank lending and grow further.
In Bangladesh, NBFIs that cope with wide-ranging business instruments such as leasing, factoring, invoice discounting, and equity investment are considering SME financing as a potential business area. In Cambodia, two leasing companies licensed by the central bank are operating and informal pawnshops are serving SME financing needs with highinterest rates. To diversify the financing models for SMEs, the regulation on specialized credit institutions is under processing in Cambodia. In the PRC, national financial reform in 2008 allowed the creation of microcredit firms to serve funding needs of SMEs, farmers,
2 The Thai Credit Guarantee Corporation (TCG), a public guarantee institution, is an executing agency forthe PGS. Provided that the SME is a major client, the TCG guarantees 100% of payment stated in each letter of guarantee issued for participating banks when prosecuted but up to 15.5% of average guarantee outstanding in each portfolio that pools all guaranteed SME loans from the participating bank every year. The PGS is a special measure with limited period of 5–7 years. This scheme was also utilized at the time of flooding in 2011.
Emerging Trends in SME Finance and Policies 9
and households. In India, registered nonbank financial companies are engaged in lending, leasing, insurance, and equity investment with limited activities, and focusing on the SME sector is a new business area.
Various types of NBFIs operate in Indonesia. The nonbank sector is still small in scale but is a growing segment suitable for filling the unmet financing demand of MSMEs. As of September 2013, 202 financing companies licensed by the Financial Services Authority (OJK) are active; their main business instruments comprise leasing, factoring, credit card financing, and consumer financing. Leasing plays an active part in the electricity, gas, and water supply sectors in Indonesia, while factoring is not popular. Venture capital companies are also categorized as NBFIs because their main business is profit-share financing. A large number of savings and loan cooperatives and a variety of MFIs are alsoactive in Indonesia.
Several NBFIs, including MFIs, pawnshops, factoring firms, and leasing firms, operate in Kazakhstan but they do not adequately serve SME financing demands. In the Republic of Korea, the large number of registered venture capital companies and funds are active but typically target the information technology sector for their investments. In Malaysia, NBFIs such as venture capital, factoring, and leasing companies also cater to SME financing needs. At present, the Malaysian Venture Capital Association serves the small number of SMEs or early stage firms through agriculture funds. In the Philippines, the central bankregulates NBFIs including savings and loan associations and pawnshops. The Securities and Exchange Commission also regulates NBFIs such as finance companies. The pawn business has been gradually growing in the Philippines.
Papua New Guinea has experienced sharp growth of nonbank sector business, especially in finance companies with vehicle and machinery financing. However, their business mainly focuses on large firms in the mining sector. Although small in scale, the nonbank industry is active in Solomon Islands. The Credit Corporation, a finance company, recorded sharp business growth, making full use of the collateral registry for SME lending.
Sri Lanka has two types of NBFIs: licensed finance companies and specialized leasing companies. They have shown strong annual business growth (22% in 2012), catering to both large enterprises and SMEs. In Thailand, there are only two financing and investment firms licensed by the central bank; NBFIs have yet to adequately serve the financing needs of Thai SMEs. As of the end of 2012, 18 finance companies and 12 financial leasing companies were operating in Viet Nam under the central bank’s supervision. They were mostly affiliated firms of large enterprises or banks’ subsidiary firms.
F. Capital Market Financing
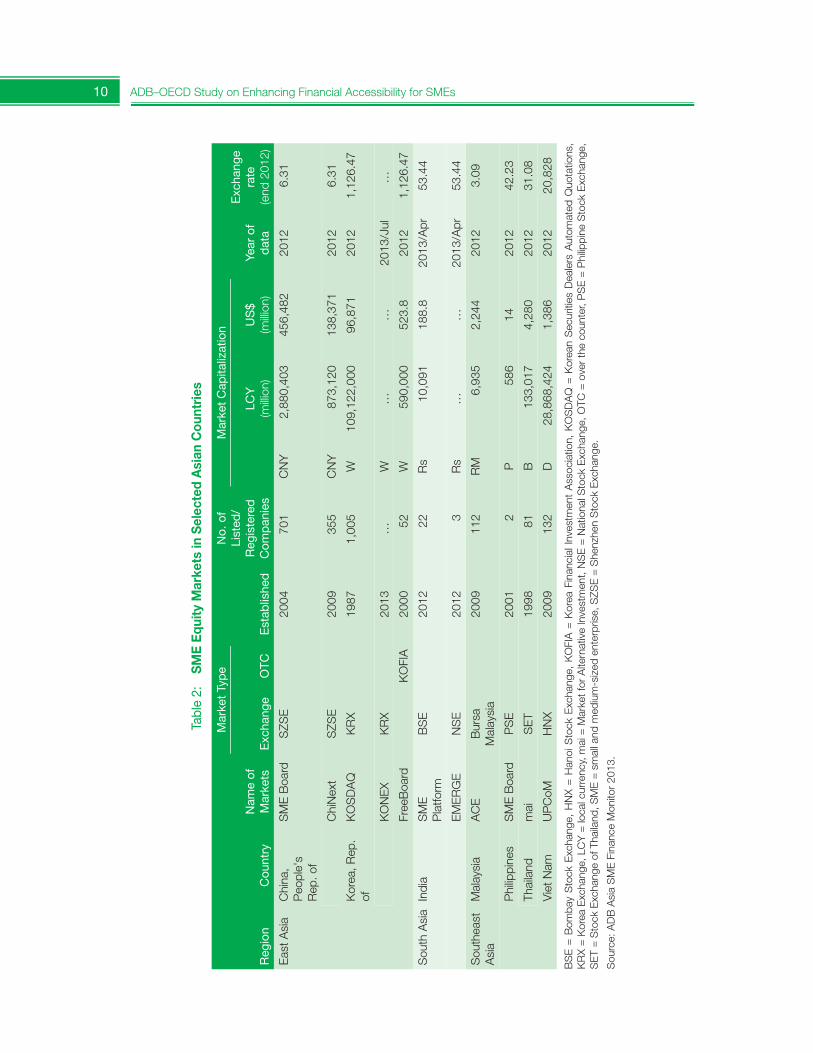
Asia’s rapid economic growth requires the development of diversified SME financing models that are beyond traditional bank lending, while such growth generates the need for long-term financing among growth-oriented SMEs. Capital market financing, e.g.,equity finance, corporate bond issuance, and mezzanine finance, is one such diversified financing model to be developed in Asia. At present, a few Asian countries provide capital market financing opportunities for high-end SMEs (Table 2).
10 ADB–OECD Study on Enhancing Financial Accessibility for SMEs
Tabl
e 2:
S
ME
Equ
ity M
arke
ts in
Sel
ecte
d A
sian
Cou
ntri
es
Reg
ion
Cou
ntry
Nam
e of
M
arke
ts
MarketType
Est
ablis
hed
No.
of
List
ed/
Reg
iste
red
C
omp
anie
s
Mar
ket
Cap
italiz
atio
n
Year
of
dat
a
Exc
hang
e ra
te
(end
201
2)E
xcha
nge
OTC
LCY
(m
illion
)U
S$
(m
illion
)
Eas
t Asi
aC
hina
, P
eopl
e's
Rep. of
SME Board
SZS
E20
0470
1C
NY
2,88
0,40
345
6,48
220
12 6
.31
Chi
Nex
tS
ZSE
2009
355
CN
Y87
3,12
013
8,37
120
12 6
.31
Kor
ea, R
ep.
ofK
OS
DA
QK
RX
1987
1,00
5W
109,
122,
000
96,8
7120
12 1
,126
.47
KO
NE
XK
RX
2013
…W
……
2013/Jul
…
Free
Boa
rdK
OFI
A20
0052
W59
0,00
052
3.8
2012
1,1
26.4
7
Sou
th A
sia
Indi
aSME
Platform
BS
E20
1222
Rs
10,0
9118
8.8
2013
/Apr
53.
44
EMERGE
NS
E20
123
Rs
……
2013
/Apr
53.
44
Sou
thea
st
Asi
aMalaysia
AC
EB
ursa
Malaysia
2009
112
RM
6,93
52,
244
2012
3.0
9
Phi
lippi
nes
SME Board
PS
E20
012
P58
614
2012
42.
23
Thai
land
mai
SE
T19
9881
B13
3,01
74,
280
2012
31.
08
Vie
t Nam
UPCoM
HN
X20
0913
2D
28,8
68,4
241,
386
2012
20,
828
BSE = Bom
bay Stock Exchange, HNX = Hanoi Stock Exchange, KOFIA = Korea Financial Investment Association, KOSDAQ = Korean Securities Dealers Autom
ated Quotations,
KRX = Korea Exchange, LCY = local currency, mai = Market for Alternative Investment, NSE = National Stock Exchange, OTC
= over the counter, PSE = Philippine Stock Exchange,
SET = Stock Exchange of Thailand, SME = small and medium-sized enterprise, SZS
E = Shenzhen Stock Exchange.
Source: ADB Asia SME Finance Monitor 2013.
Emerging Trends in SME Finance and Policies 11
In the PRC, the Shenzhen Stock Exchange launched the SME Board in 2004 and the Venture Board, called ChiNext, in 2009 as equity financing venues for high-growth SMEsand/or start-ups. As of the end of 2012, more than 1,000 firms were listed with a market capitalization of $594 billion in both markets. In addition to equity finance, the PRC haslaunched three types of bond instruments for SMEs: (i) the SME Joint Bond, traded in the interbank and exchange markets; (ii) the SME Collective Note, traded in the interbank market;3 and (iii) the SME Private Placement Bond.
In the Republic of Korea, KOSDAQ is the largest exchange market that SMEs can tap; it holds more than 1,000 listed firms with market capitalization of $96 billion as of the end of 2012. As the KOSDAQ market has become an equity financing venue for larger firms, the Korea Exchange launched a new market for start-ups and SMEs, called the KONEX,in July 2013. In addition to exchange markets, the over-the-counter (OTC) market called FreeBoard has been launched by the Korea Financial Investment Association (KOFIA). As a trading system for SME bonds, the qualified institutional buyers (QIB) system operated by KOFIA was launched in May 2012.
In India, responding to the recommendation of the Prime Minister’s Task Force, two dedicated SME exchanges have been launched since 2012: (i) the SME Platform under the Bombay Stock Exchange, and (ii) Emerge under the National Stock Exchange. The Philippines launched the SME Board under the Philippine Stock Exchange in 2001, but so far only two firms have been listed there. No preferential treatment is available for firms applying for listing in this board.
In Malaysia and Thailand, there are no dedicated SME capital markets, but there are markets that SMEs can tap. The ACE market under Bursa Malaysia and the Marketfor Alternative Investment (mai) under the Securities Exchange of Thailand are a typeof sponsor-driven alternative market for emerging corporations. The ACE market holds 112 listed firms and the mai 81 as of the end of 2012. The Securities Commission Malaysia also plans to launch an OTC market for unlisted stocks, called MyULM. The Securities and Exchange Commission in Thailand has brainstormed the development of an SME bond market, together with the Thai Credit Guarantee Corporation (TCG), addressing the potential for developing guaranteed SME bond products.
In Viet Nam, the Hanoi Stock Exchange has a trading venue for unlisted public companies named UPCoM, which was established in 2009. This market is also not a dedicated SME market but an equity finance venue that SMEs can access. The UPCoM requires no listing fees. Indonesia has no SME capital market but so far 10 enterprises that are regarded as SMEs under the capital market rule have conducted initial public offerings in the Indonesia Stock Exchange. SMEs are given preferential treatment to tap the Indonesia Stock Exchange, such as simplified disclosure documents as compared to the case of non-SMEs.
3 An SME collective note is issued on behalf of between two and 10 SMEs and is generally guaranteed by a government guarantee institution.
12 ADB–OECD Study on Enhancing Financial Accessibility for SMEs
G. Government Policy Responses to Ease SMEs’ Access to Finance
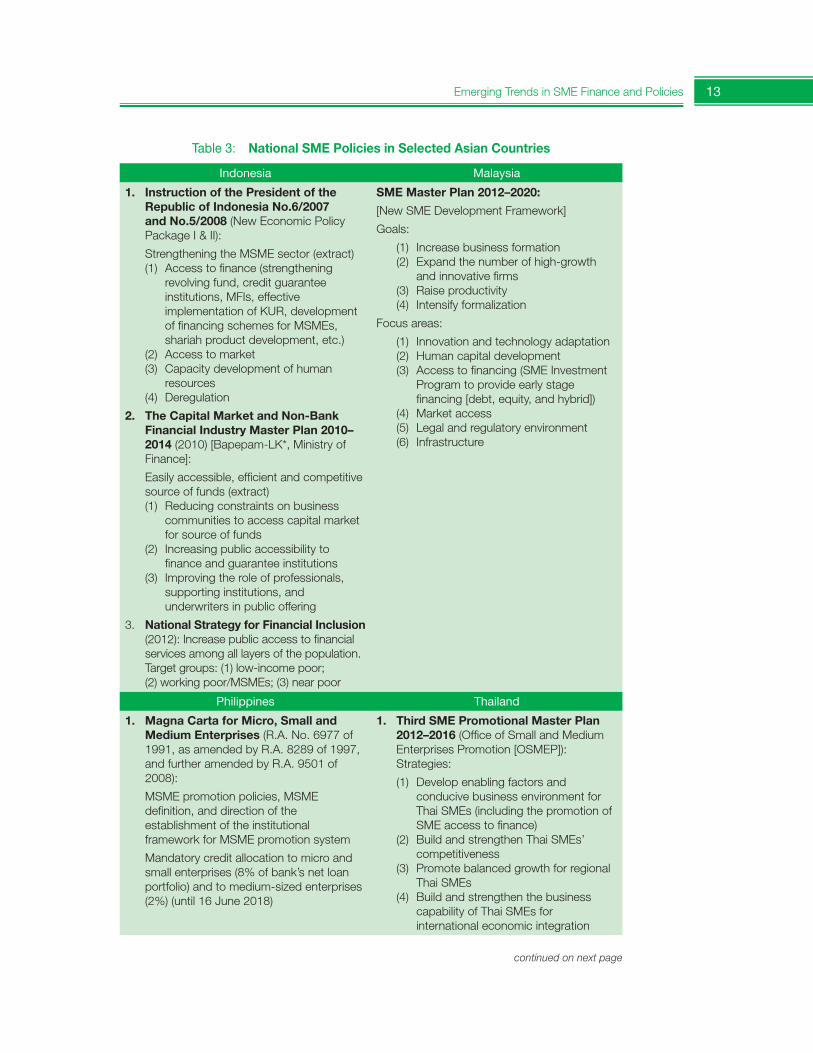
SMEs are the backbone of the national economy in any country. Development of theSME sector brings to the country inclusive economic growth through job creation. Thus, many countries in Asia and the Pacific have attached importance to encouraging the SME sector through midterm or annual SME development plans, and regard SMEs as a growth area that can help achieve a resilient national economy. To promote the healthy growth of domestic SMEs, national SME development plans generally cover a wide range of topics, such as encouraging market access, productivity enhancement, sound competitive environment, formalization of informal SMEs, capacity development, concessional business regulatory environment, and technology adaptation to innovative SMEs. Access to finance is a crucial part of such comprehensive national SME policies, which are administered and implemented by a government’s special unit, a specialized SME agency, or line ministries responsible for SME promotion, generally with strong cooperation from the central bank. Table 3 presents the outlines of national SME policies in selected Asian countries.
Under the policy pillar of access to finance, various government and central bank support measures have been developed at the national level, e.g., public credit guarantee schemes in Indonesia (KUR) and Thailand (PGS), mandatory lending in the Philippines, secured transaction reforms to establish collateral registries and promote movable asset financing in the Pacific region, refinancing schemes by the government or central bank inBangladesh and Malaysia, and establishment of a centralized credit bureau in Viet Nam.
The findings from ADB’s ASM indicated that, on average during 2007–2012 in Asia, SMEs accounted for 98% of all enterprises and 66% of national labor forces, with moderate absorption of labor at 6% year-on-year average growth in the same period. The averageSME contribution to national productivity remained at 38% of GDP or manufacturing value added in Asia during the same period, suggesting it can be expanded further. Finance is critical for SME sector development. As a whole, policies on SME access to finance focus mainly on enhancing bankability in Asia and the Pacific. Policies on nonbank financing avenues and capital market financing for high-end SMEs have yet to be widely developed in most ADB DMCs. Government measures to support SME bankability—typically public credit guarantees—are contributing to solving the supply–demand gap in SME lending at the national level. However, these have yet to sufficiently fill the unmet financing demand of SMEs. SME loans to total bank loans are still in the 20%–30% range, with 10% year-on-year lending growth on average in Asia and the Pacific, but it is a decreasing trend.
Given that no single solution for financing SMEs exists, national policy makers are required to develop comprehensive policy frameworks for supporting innovative and diversifiedfinancing models that better serve the financing needs of SMEs at different business stages. The globalized economy will further encourage SME internationalization, especially in supporting industries, which may bring new financing demand from SMEs, e.g., local currency financing for SMEs that operate in overseas markets. In particular, SMEs in Southeast Asian countries will be exposed to further liberalized trade and investment after the establishment of the Association of Southeast Asian Nations Economic Community in 2015. Policies for expanding SME finance should be addressed in a holistic manner that goes beyond what has been done traditionally for SME bankability.
Emerging Trends in SME Finance and Policies 13
Table 3: National SME Policies in Selected Asian Countries
Indonesia Malaysia
1. Instruction of the President of the Republic of Indonesia No.6/2007 and No.5/2008 (New Economic Policy Package I & II):
Strengthening the MSME sector (extract)(1) Access to finance (strengthening
revolving fund, credit guarantee institutions, MFIs, effective implementation of KUR, development of financing schemes for MSMEs, shariah product development, etc.)
(2) Access to market(3) Capacity development of human
resources(4) Deregulation
2. The Capital Market and Non-Bank Financial Industry Master Plan 2010–2014 (2010) [Bapepam-LK*, Ministry of Finance]:
Easily accessible, efficient and competitive source of funds (extract)(1) Reducing constraints on business
communities to access capital market for source of funds
(2) Increasing public accessibility to finance and guarantee institutions
(3) Improving the role of professionals, supporting institutions, and underwriters in public offering
3. National Strategy for Financial Inclusion (2012): Increase public access to financial services among all layers of the population. Target groups: (1) low-income poor; (2) working poor/MSMEs; (3) near poor
SME Master Plan 2012–2020:
[New SME Development Framework]
Goals:
(1) Increase business formation(2) Expand the number of high-growth
and innovative firms(3) Raise productivity(4) Intensify formalization
Focus areas:
(1) Innovation and technology adaptation(2) Human capital development(3) Access to financing (SME Investment
Program to provide early stage financing [debt, equity, and hybrid])
(4) Market access(5) Legal and regulatory environment(6) Infrastructure
Philippines Thailand
1. Magna Carta for Micro, Small and Medium Enterprises (R.A. No. 6977 of 1991, as amended by R.A. 8289 of 1997, and further amended by R.A. 9501 of 2008):
MSME promotion policies, MSME definition, and direction of the establishment of the institutional framework for MSME promotion system
Mandatory credit allocation to micro and small enterprises (8% of bank’s net loan portfolio) and to medium-sized enterprises (2%) (until 16 June 2018)
1. Third SME Promotional Master Plan 2012–2016 (Office of Small and Medium Enterprises Promotion [OSMEP]): Strategies:
(1) Develop enabling factors and conducive business environment for Thai SMEs (including the promotion of SME access to finance)
(2) Build and strengthen Thai SMEs’ competitiveness
(3) Promote balanced growth for regional Thai SMEs
(4) Build and strengthen the business capability of Thai SMEs for international economic integration
continued on next page
14 ADB–OECD Study on Enhancing Financial Accessibility for SMEs
1.2. Emerging Trends in SME Finance and Policies: OECD Area Perspective
This section analyzes trends in SME and entrepreneurship finance over 2007–2012, basedon data collected for 25 countries through the Organisation for Economic Co-operation and Development (OECD) Scoreboard on Financing SMEs and Entrepreneurs. A short overview of the global business environment sets the framework for the analysis of SME financing trends and conditions, focusing in particular on the changes which occurred in participating countries during 2011–2012. These recent developments are compared with trends over the crisis and early recovery stages. The precrisis year serves as a benchmark. The section concludes with an overview of government policy responses already taken to improve SME access to finance in light of recent developments.4
A. Introduction
Access to finance represents one of the most significant challenges for entrepreneurs andfor the creation, survival, and growth of small businesses, especially innovative ones. This is a long-standing hurdle that limits SME growth in many OECD countries and in most emerging economies, where SMEs and micro firms often have limited access to both debt financing and equity capital.
The 2008/09 global financial and economic crisis has severely exacerbated the SME financing gap in many countries. In OECD countries, SMEs suffered from a double shock: a drastic drop in demand for their goods and services, and a credit crunch. As a result, SMEs cash flows and liquidity were affected, forcing many into bankruptcy and contributing to record levels of unemployment in many OECD countries.
4 Section based on OECD (2013) Chapter 2.
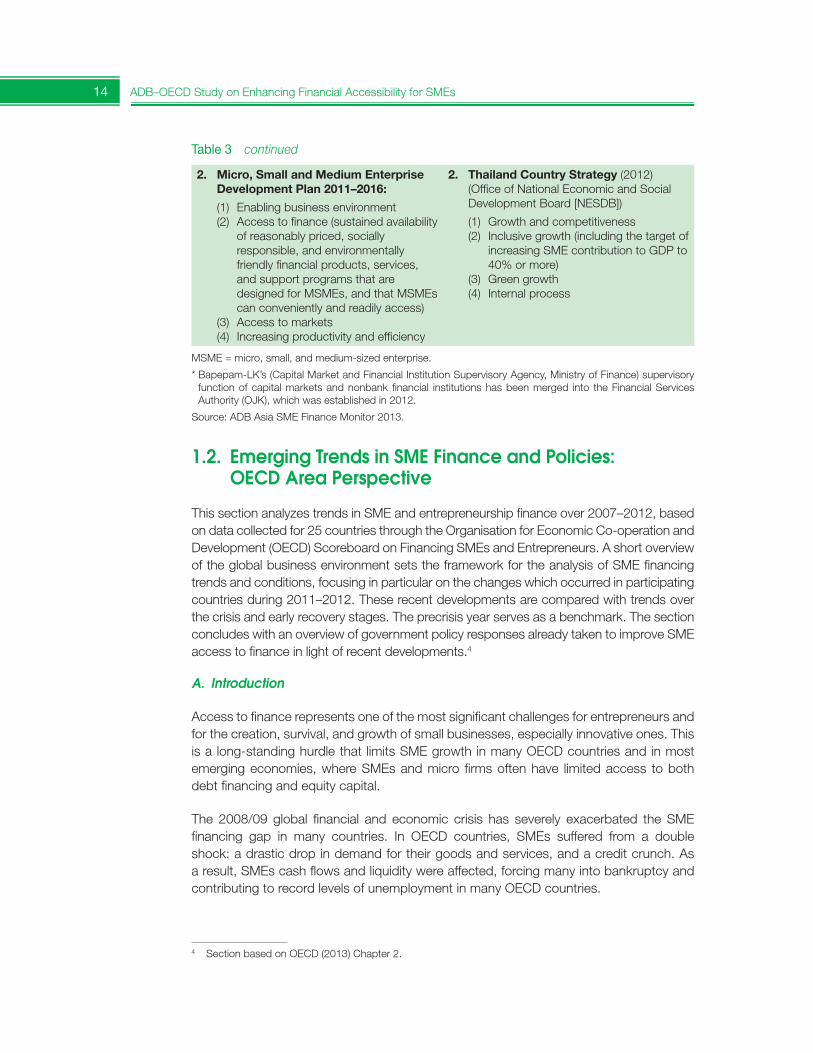
2. Micro, Small and Medium Enterprise Development Plan 2011–2016:
(1) Enabling business environment(2) Access to finance (sustained availability
of reasonably priced, socially responsible, and environmentally friendly financial products, services, and support programs that are designed for MSMEs, and that MSMEs can conveniently and readily access)
(3) Access to markets(4) Increasing productivity and efficiency
2. Thailand Country Strategy (2012) (Office of National Economic and Social Development Board [NESDB])
(1) Growth and competitiveness(2) Inclusive growth (including the target of
increasing SME contribution to GDP to 40% or more)
(3) Green growth(4) Internal process
MSME = micro, small, and medium-sized enterprise.
* Bapepam-LK’s (Capital Market and Financial Institution Supervisory Agency, Ministry of Finance) supervisory function of capital markets and nonbank financial institutions has been merged into the Financial Services Authority (OJK), which was established in 2012.
Source: ADB Asia SME Finance Monitor 2013.
Table 3 continued
Emerging Trends in SME Finance and Policies 15
The crisis has also placed a spotlight on a weak link in policy making for SMEs that has existed for some time: the lack of timely, comparable data and the absence of a sound monitoring framework for SME finance. In response to this limitation, in 2012 the OECD launched its Scoreboard on SME and entrepreneurship finance, which provides a unique framework for monitoring the access of SMEs and entrepreneurs to finance at the national and international level. The Scoreboard examines 13 core indicators related to SME debt and equity financing, framework conditions, and government policies. Most of the indicators are derived from supply-side data provided by financial institutions. This is supplemented by national and regional demand-side surveys to provide a more comprehensive view of the evolution in financing trends and needs.
The 2013 edition of the Scoreboard includes information on 25 countries (OECD and non-OECD economies) for 2007–2011. The evidence over this period suggests that, in the wake of the crisis, the financial situation of SMEs broadly deteriorated in most countries. Following the major crisis of 2008/09 and an uneven recovery in 2010, the conditionsfor accessing finance remained difficult for SMEs and entrepreneurs in 2011 and early2012 in most countries. The sovereign debt crisis that hit many European countries also contributed to deterioration in bank lending, which was expected to continue in 2012–2013. The implementation of Basel III is also expected to have a significant impact on SME lending and credit conditions. On the other hand, credit to SMEs has shown impressive growth in fast-growing economies such as Chile, Russia, and Turkey.
This section describes these main trends and provides an illustration of key policy measures implemented across countries to address the SME financing constraints.
B. Business Environment and Macroeconomic Context
The 2008/09 financial and economic crisis was the most severe in decades and deeply affected the business and financing environment in many OECD countries (OECD 2012a). Gross domestic product (GDP) contracted by 3.6% in the OECD area as a whole in 2009 and by 4.3% in the euro area. The 2010 recovery was uneven and, in many instances, came to a halt in the second quarter of 2011. GDP growth slowed in the United States, from 2.4% in 2010 to 1.8% in 2011. Similarly, in the euro area, where the 2010 recovery had been less pronounced, the growth rate decreased from 1.9% to 1.5%. In Europe, however, growth performance varied significantly across countries. While some countries, such as Sweden (3.9%), Finland (2.7%), and the Slovak Republic (3.2%) experienced sustained growth rates, southern European countries such as Italy (0.6%) and Spain (0.4%) grew at a much slower pace, or even experienced negative GDP growth, as in Portugal (–1.7%). On the other hand, stronger growth continued to be observed in other countries, including Turkey (8.5%), Chile (5.9%), and the Russian Federation (4.3%).
Along the path to recovery, in 2010–2011, the overall evolution of financial conditions varied greatly from one country to another. In some countries, concerns about the sustainability of public debt resulted in an increase in government bond yields during 2011. Countries that have used the assistance of the European Union and the International Monetary Fund, such as Ireland and Portugal, saw their sovereign spreads widen in 2011, despite financial support and a significant fiscal consolidation. In many other European countries,
16 ADB–OECD Study on Enhancing Financial Accessibility for SMEs
including Italy and Spain, the increase in yields on government bonds contributed to a further tightening of credit conditions for the private sector as a whole. On the other hand, other OECD countries, such as the United States or northern European countries, have seen the pressure on government bonds loosen, with some improvement in credit conditions (OECD 2011, 2012b-c).
In response to the financial and economic crisis and the turmoil in financial markets, the Federal Reserve of the United States and the European Central Bank introduced an expansionary monetary policy which remained largely unchanged in 2011–2012. To support the banking sector, an additional $700 billion have been made available in the United States. In Europe, in December 2011 the European Central Bank introduced a 3-year refinancing operation, which allowed the injection of liquidity (€489 billion) ata low interest rate, with sovereign debt as collateral on loans. A second operation of €530 billion was made in February 2012. Despite continuous monetary easing, however,financial institutions had difficulties in translating the increased flow of funds into credit to the private sector.
C. Lending to SMEs in 2007–2011
In the wake of the crisis, in most countries business loans and SME loans declined markedly and, while they recovered in 2010, they did not reach their precrisis level. Indeed, lending to SMEs continued to decline during the recovery in some countries, although, similarly to what was observed for the macroeconomic developments, performance varied significantly across countries.
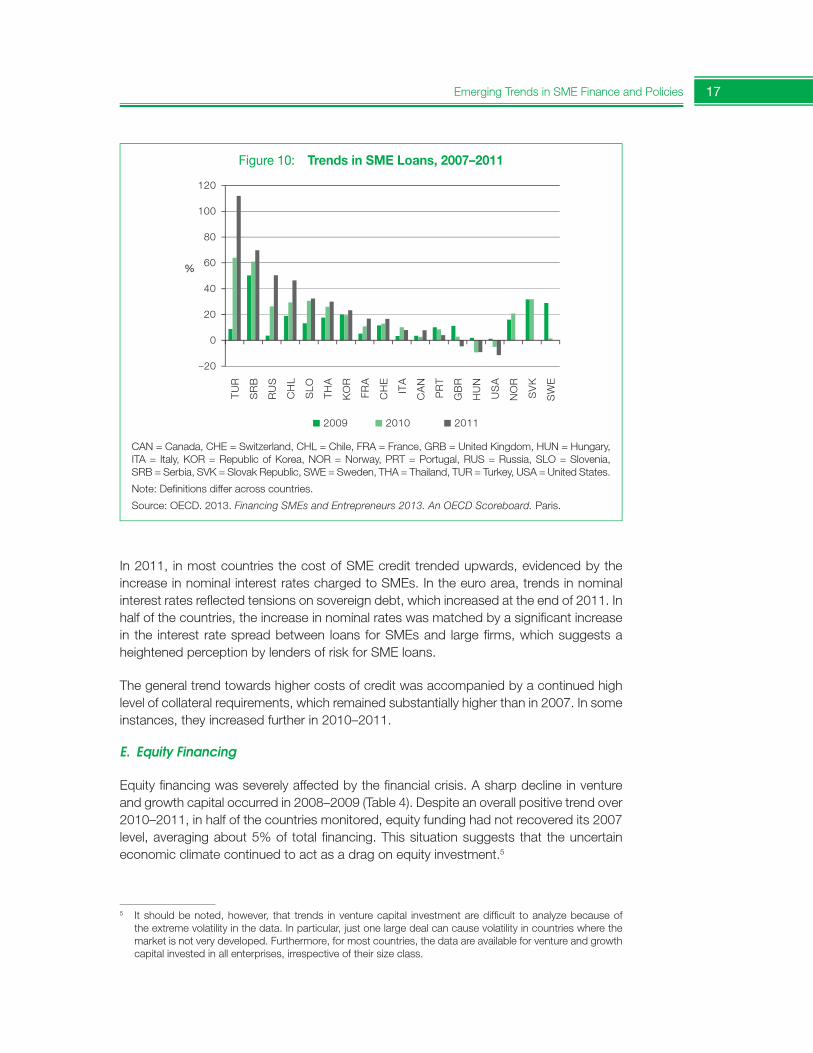
As the recovery strengthened in 2011, outstanding SME loans (i.e., stocks) grew in the majority of the countries in the Scoreboard, but declined in four countries—Italy, Portugal, the United Kingdom, and the United States. In the United Kingdom and the United States, this decline continued a negative trend, so that the stock of SME loans was still lower in 2011 than in the precrisis period. On the other hand, SME loans in Italy recorded negative growth for the first time in 2011, following a substantial increase in the previous two years. In Portugal, despite the negative trend since 2010, the stock of SME loans remained above the precrisis level (Figure 10).
The evidence on outstanding SME loan shares, defined as the shares of SME loans over total business loans, helps to set the above indicators on SME lending into the context of general business lending conditions in the Scoreboard countries. During 2007–2011, SME loan shares increased in only four countries and declined in nine countries. This even occurred where SME loan growth was positive, as in the case of the Republic ofKorea, Russia, and Turkey, underscoring that total business loans were growing faster.
D. Credit Conditions for SMEs
During 2007–2010, in most countries SMEs faced credit terms less favorable than those applied to large companies, resulting in higher interest rates, shorter maturities, and heightened collateral requirements (OECD 2012a). After a slight improvement in 2010, credit conditions tightened in most countries in 2011, in part because of the increased awareness of credit risk associated with loans.
Emerging Trends in SME Finance and Policies 17
In 2011, in most countries the cost of SME credit trended upwards, evidenced by the increase in nominal interest rates charged to SMEs. In the euro area, trends in nominal interest rates reflected tensions on sovereign debt, which increased at the end of 2011. In half of the countries, the increase in nominal rates was matched by a significant increase in the interest rate spread between loans for SMEs and large firms, which suggests a heightened perception by lenders of risk for SME loans.
The general trend towards higher costs of credit was accompanied by a continued high level of collateral requirements, which remained substantially higher than in 2007. In some instances, they increased further in 2010–2011.
E. Equity Financing
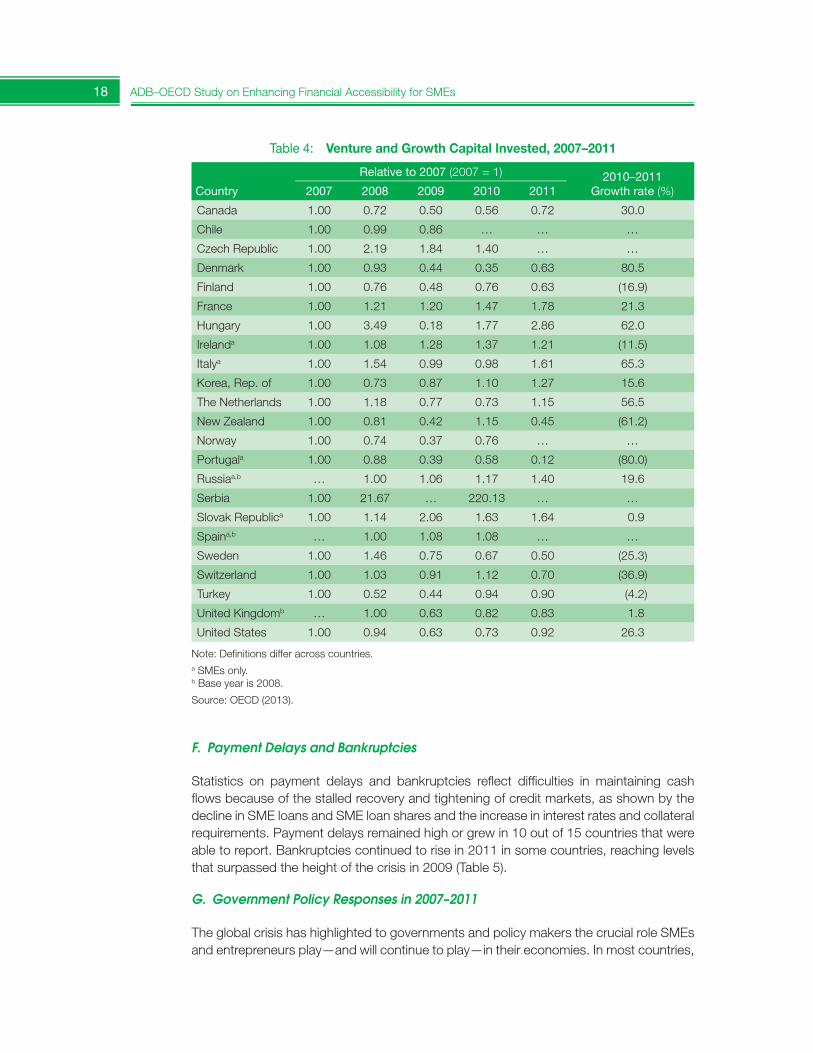
Equity financing was severely affected by the financial crisis. A sharp decline in venture and growth capital occurred in 2008–2009 (Table 4). Despite an overall positive trend over 2010–2011, in half of the countries monitored, equity funding had not recovered its 2007 level, averaging about 5% of total financing. This situation suggests that the uncertain economic climate continued to act as a drag on equity investment.5
5 It should be noted, however, that trends in venture capital investment are difficult to analyze because of the extreme volatility in the data. In particular, just one large deal can cause volatility in countries where the market is not very developed. Furthermore, for most countries, the data are available for venture and growth capital invested in all enterprises, irrespective of their size class.
0
20
40
60
80
100
–20
120
TU
R
SR
B
RU
S
CH
L
SLO
TH
A
KO
R
FRA
CH
E
ITA
CA
N
PR
T
GB
R
HU
N
US
A
NO
R
SV
K
SW
E
2009 2010 2011
%
CAN = Canada, CHE = Switzerland, CHL = Chile, FRA = France, GRB = United Kingdom, HUN = Hungary, ITA = Italy, KOR = Republic of Korea, NOR = Norway, PRT = Portugal, RUS = Russia, SLO = Slovenia, SRB = Serbia, SVK = Slovak Republic, SWE = Sweden, THA = Thailand, TUR = Turkey, USA = United States.
Note: Definitions differ across countries.
Source: OECD. 2013. Financing SMEs and Entrepreneurs 2013. An OECD Scoreboard. Paris.
Figure 10: Trends in SME Loans, 2007–2011
18 ADB–OECD Study on Enhancing Financial Accessibility for SMEs
F. Payment Delays and Bankruptcies
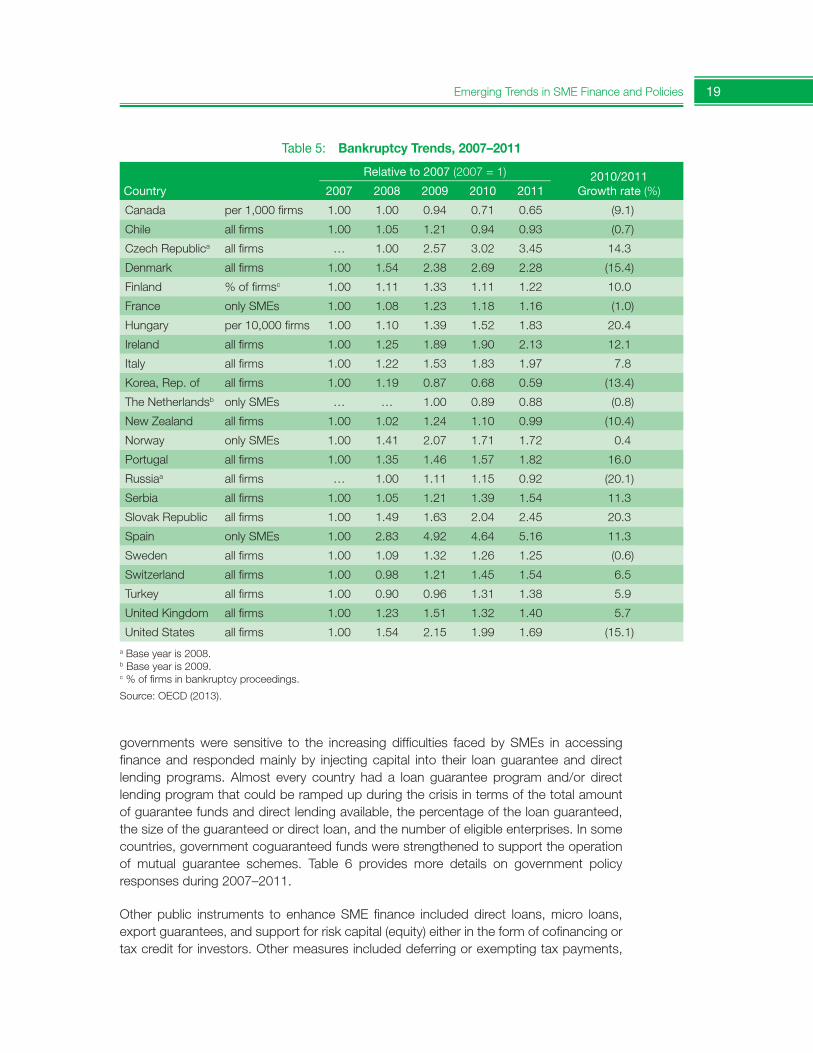
Statistics on payment delays and bankruptcies reflect difficulties in maintaining cash flows because of the stalled recovery and tightening of credit markets, as shown by thedecline in SME loans and SME loan shares and the increase in interest rates and collateral requirements. Payment delays remained high or grew in 10 out of 15 countries that were able to report. Bankruptcies continued to rise in 2011 in some countries, reaching levels that surpassed the height of the crisis in 2009 (Table 5).
G. Government Policy Responses in 2007–2011
The global crisis has highlighted to governments and policy makers the crucial role SMEs and entrepreneurs play—and will continue to play—in their economies. In most countries,
Table 4: Venture and Growth Capital Invested, 2007–2011
Country
Relative to 2007 (2007 = 1) 2010–2011 Growth rate (%)2007 2008 2009 2010 2011
Canada 1.00 0.72 0.50 0.56 0.72 30.0
Chile 1.00 0.99 0.86 … … …
Czech Republic 1.00 2.19 1.84 1.40 … …
Denmark 1.00 0.93 0.44 0.35 0.63 80.5
Finland 1.00 0.76 0.48 0.76 0.63 (16.9)
France 1.00 1.21 1.20 1.47 1.78 21.3
Hungary 1.00 3.49 0.18 1.77 2.86 62.0
Irelanda 1.00 1.08 1.28 1.37 1.21 (11.5)
Italya 1.00 1.54 0.99 0.98 1.61 65.3
Korea, Rep. of 1.00 0.73 0.87 1.10 1.27 15.6
The Netherlands 1.00 1.18 0.77 0.73 1.15 56.5
New Zealand 1.00 0.81 0.42 1.15 0.45 (61.2)
Norway 1.00 0.74 0.37 0.76 … …
Portugala 1.00 0.88 0.39 0.58 0.12 (80.0)
Russiaa,b … 1.00 1.06 1.17 1.40 19.6
Serbia 1.00 21.67 … 220.13 … …
Slovak Republica 1.00 1.14 2.06 1.63 1.64 0.9
Spaina,b … 1.00 1.08 1.08 … …
Sweden 1.00 1.46 0.75 0.67 0.50 (25.3)
Switzerland 1.00 1.03 0.91 1.12 0.70 (36.9)
Turkey 1.00 0.52 0.44 0.94 0.90 (4.2)
United Kingdomb … 1.00 0.63 0.82 0.83 1.8
United States 1.00 0.94 0.63 0.73 0.92 26.3
Note: Definitions differ across countries. a SMEs only. b Base year is 2008.
Source: OECD (2013).
Emerging Trends in SME Finance and Policies 19
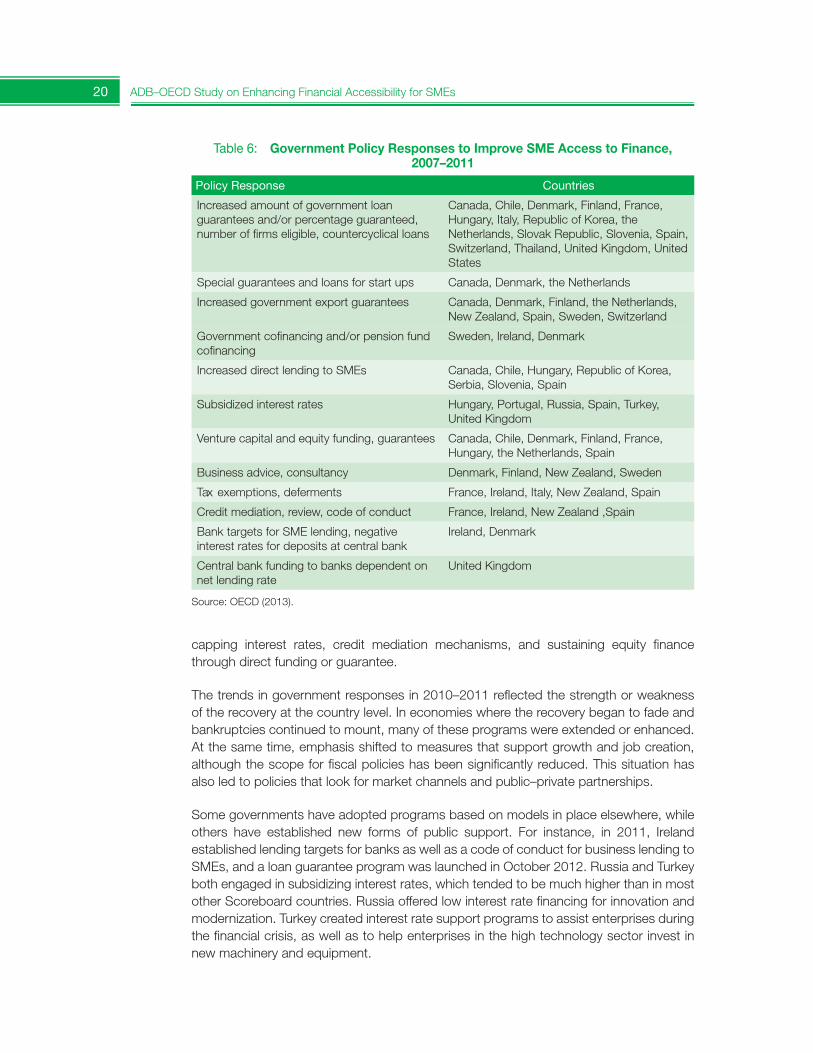
governments were sensitive to the increasing difficulties faced by SMEs in accessing finance and responded mainly by injecting capital into their loan guarantee and direct lending programs. Almost every country had a loan guarantee program and/or direct lending program that could be ramped up during the crisis in terms of the total amountof guarantee funds and direct lending available, the percentage of the loan guaranteed, the size of the guaranteed or direct loan, and the number of eligible enterprises. In some countries, government coguaranteed funds were strengthened to support the operationof mutual guarantee schemes. Table 6 provides more details on government policy responses during 2007–2011.
Other public instruments to enhance SME finance included direct loans, micro loans,export guarantees, and support for risk capital (equity) either in the form of cofinancing or tax credit for investors. Other measures included deferring or exempting tax payments,
Table 5: Bankruptcy Trends, 2007–2011
Country
Relative to 2007 (2007 = 1) 2010/2011 Growth rate (%)2007 2008 2009 2010 2011
Canada per 1,000 firms 1.00 1.00 0.94 0.71 0.65 (9.1)
Chile all firms 1.00 1.05 1.21 0.94 0.93 (0.7)
Czech Republica all firms … 1.00 2.57 3.02 3.45 14.3
Denmark all firms 1.00 1.54 2.38 2.69 2.28 (15.4)
Finland % of firmsc 1.00 1.11 1.33 1.11 1.22 10.0
France only SMEs 1.00 1.08 1.23 1.18 1.16 (1.0)
Hungary per 10,000 firms 1.00 1.10 1.39 1.52 1.83 20.4
Ireland all firms 1.00 1.25 1.89 1.90 2.13 12.1
Italy all firms 1.00 1.22 1.53 1.83 1.97 7.8
Korea, Rep. of all firms 1.00 1.19 0.87 0.68 0.59 (13.4)
The Netherlandsb only SMEs … … 1.00 0.89 0.88 (0.8)
New Zealand all firms 1.00 1.02 1.24 1.10 0.99 (10.4)
Norway only SMEs 1.00 1.41 2.07 1.71 1.72 0.4
Portugal all firms 1.00 1.35 1.46 1.57 1.82 16.0
Russiaa all firms … 1.00 1.11 1.15 0.92 (20.1)
Serbia all firms 1.00 1.05 1.21 1.39 1.54 11.3
Slovak Republic all firms 1.00 1.49 1.63 2.04 2.45 20.3
Spain only SMEs 1.00 2.83 4.92 4.64 5.16 11.3
Sweden all firms 1.00 1.09 1.32 1.26 1.25 (0.6)
Switzerland all firms 1.00 0.98 1.21 1.45 1.54 6.5
Turkey all firms 1.00 0.90 0.96 1.31 1.38 5.9
United Kingdom all firms 1.00 1.23 1.51 1.32 1.40 5.7
United States all firms 1.00 1.54 2.15 1.99 1.69 (15.1)a Base year is 2008. b Base year is 2009. c % of firms in bankruptcy proceedings.
Source: OECD (2013).
20 ADB–OECD Study on Enhancing Financial Accessibility for SMEs
capping interest rates, credit mediation mechanisms, and sustaining equity finance through direct funding or guarantee.
The trends in government responses in 2010–2011 reflected the strength or weakness of the recovery at the country level. In economies where the recovery began to fade andbankruptcies continued to mount, many of these programs were extended or enhanced. At the same time, emphasis shifted to measures that support growth and job creation, although the scope for fiscal policies has been significantly reduced. This situation hasalso led to policies that look for market channels and public–private partnerships.
Some governments have adopted programs based on models in place elsewhere, while others have established new forms of public support. For instance, in 2011, Ireland established lending targets for banks as well as a code of conduct for business lending to SMEs, and a loan guarantee program was launched in October 2012. Russia and Turkey both engaged in subsidizing interest rates, which tended to be much higher than in most other Scoreboard countries. Russia offered low interest rate financing for innovation and modernization. Turkey created interest rate support programs to assist enterprises during the financial crisis, as well as to help enterprises in the high technology sector invest in new machinery and equipment.
Table 6: Government Policy Responses to Improve SME Access to Finance, 2007–2011
PolicyResponse Countries
Increased amount of government loan guarantees and/or percentage guaranteed, number of firms eligible, countercyclical loans
Canada, Chile, Denmark, Finland, France, Hungary, Italy, Republic of Korea, the Netherlands, Slovak Republic, Slovenia, Spain, Switzerland, Thailand, United Kingdom, United States
Special guarantees and loans for start ups Canada, Denmark, the Netherlands
Increased government export guarantees Canada, Denmark, Finland, the Netherlands, New Zealand, Spain, Sweden, Switzerland
Government cofinancing and/or pension fund cofinancing
Sweden, Ireland, Denmark
Increased direct lending to SMEs Canada, Chile, Hungary, Republic of Korea, Serbia, Slovenia, Spain
Subsidized interest rates Hungary, Portugal, Russia, Spain, Turkey, United Kingdom
Venture capital and equity funding, guarantees Canada, Chile, Denmark, Finland, France, Hungary, the Netherlands, Spain
Business advice, consultancy Denmark, Finland, New Zealand, Sweden
Tax exemptions, deferments France, Ireland, Italy, New Zealand, Spain
Credit mediation, review, code of conduct France, Ireland, New Zealand ,Spain
Bank targets for SME lending, negative interest rates for deposits at central bank
Ireland, Denmark
Central bank funding to banks dependent on net lending rate
United Kingdom
Source: OECD (2013).
Emerging Trends in SME Finance and Policies 21
Among new programs, Denmark introduced negative interest rates for excess funds on deposits at its central bank in order to encourage bank lending, an approach that earns public funds instead of costing money. The United Kingdom took another approach so as to encourage lending in its Funding for Lending Programme, i.e., a central bank scheme which provides banks with covered 4-year funding at below current market rates. However, the scale and price of funding is connected with the change in net lending over a reference period.
Strengthening SMEs and reviving entrepreneurial dynamics are crucial for sustained job recovery. However, as the fiscal consolidation reduces the room to manoeuver, new policy approaches are needed to address long-standing challenges and pursue the long-term objective of sustainable growth.
References
OECD. 2011. OECD Economic Outlook. Paris (May)
______. 2012a. Financing SMEs and Entrepreneurs 2012. An OECD Scoreboard. Paris.
______. 2012b. OECD Economic Outlook. Paris (May).
______. 2012c. OECD Economic Outlook. Paris (November).
______. 2013. Financing SMEs and Entrepreneurs 2013. An OECD Scoreboard. Paris.
1.3. Common and Different Conditions on SME Financing in ADB and OECD Areas
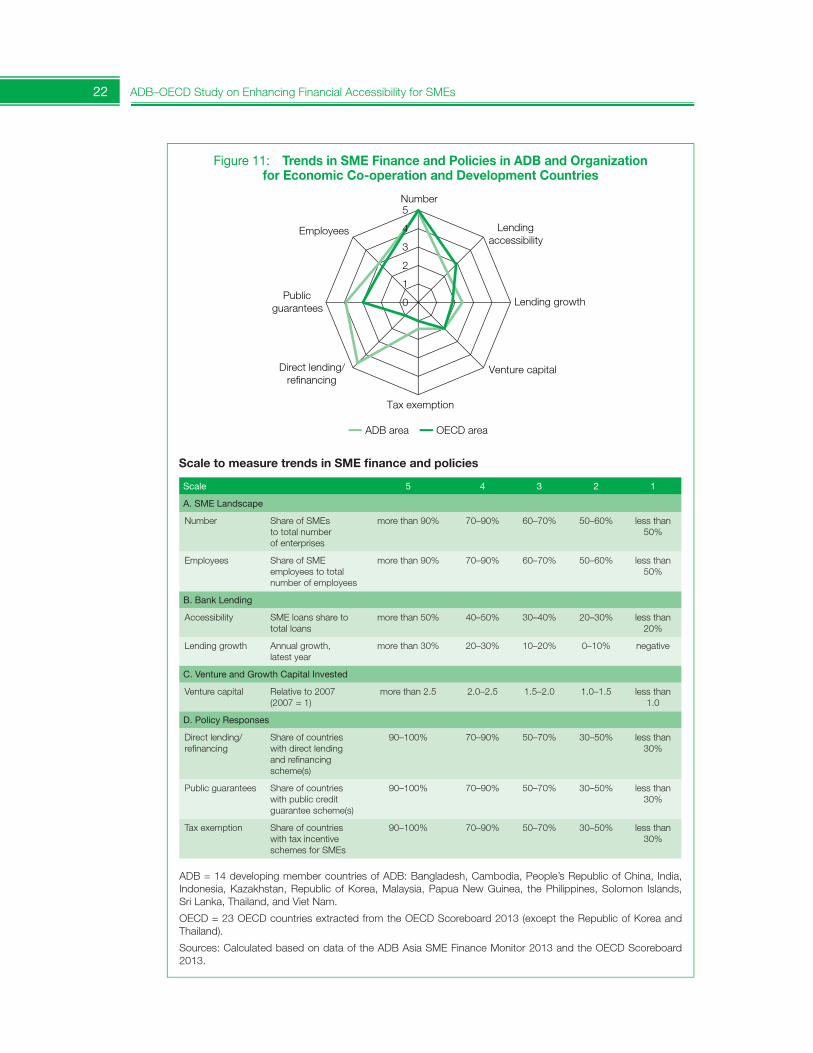
The recent crises—the 2008/09 GFC and the eurozone debt crisis—have had many implications when considering SME access to finance at the national level. Figure 11 shows the rough comparison of trends in SME finance and policies between ADB and OECD countries, based on the data in 14 DMCs from the five ADB regions and 23 OECD countries extracted from the OECD Scoreboard on Financing SMEs and Entrepreneurs 2013, which compares common and different conditions on financing SMEs between developing and developed countries.
SMEs account for more than 90% of total enterprises in number and employ more thanhalf of national labor forces on average in both ADB and OECD countries, thus forming a critical segment for building resilient national and global economies.
In ADB DMCs, sour experiences of the 1997/98 Asian financial crisis and the GFC sharply raised Asia’s risk consciousness against global economic uncertainty. As the large mass of SMEs drive the base of domestic economies, SME sector development has increasingly becoming a priority policy pillar in the aim of realizing pro-poor and sustainable economic growth in every country, where SME access to finance is a critical part of the national financial inclusion strategy. Given the largely bank-centered financial systems established in Asia and the Pacific, the issue of how to enhance the bankability for SMEs, raise more bank lending efficiency for them, and fill the supply–demand gap in SME finance has become the core of the SME access to finance agenda. Accordingly, governments have developed a variety of measures to support SME access to banks, popularly introducing
22 ADB–OECD Study on Enhancing Financial Accessibility for SMEs
Figure 11: Trends in SME Finance and Policies in ADB and Organization for Economic Co-operation and Development Countries
Scale to measure trends in SME finance and policies
0
1
2
3
4
5Number
Lendingaccessibility
Lending growth
Venture capital
Tax exemption
Direct lending/refinancing
Publicguarantees
Employees
ADB area OECD area
ADB = 14 developing member countries of ADB: Bangladesh, Cambodia, People’s Republic of China, India, Indonesia, Kazakhstan, Republic of Korea, Malaysia, Papua New Guinea, the Philippines, Solomon Islands, Sri Lanka, Thailand, and Viet Nam.
OECD = 23 OECD countries extracted from the OECD Scoreboard 2013 (except the Republic of Korea and Thailand).
Sources: Calculated based on data of the ADB Asia SME Finance Monitor 2013 and the OECD Scoreboard 2013.
Scale 5 4 3 2 1
A. SME Landscape
Number Share of SMEs to total number of enterprises
more than 90% 70–90% 60–70% 50–60% less than 50%
Employees Share of SME employees to total number of employees
more than 90% 70–90% 60–70% 50–60% less than 50%
B. Bank Lending
Accessibility SME loans share to total loans
more than 50% 40–50% 30–40% 20–30% less than 20%
Lending growth Annual growth, latest year
more than 30% 20–30% 10–20% 0–10% negative
C. Venture and Growth Capital Invested
Venture capital Relative to 2007 (2007 = 1)
more than 2.5 2.0–2.5 1.5–2.0 1.0–1.5 less than 1.0
D.PolicyResponses
Direct lending/refinancing
Share of countries with direct lending and refinancing scheme(s)
90–100% 70–90% 50–70% 30–50% less than 30%
Public guarantees Share of countries with public credit guarantee scheme(s)
90–100% 70–90% 50–70% 30–50% less than 30%
Tax exemption Share of countries with tax incentive schemes for SMEs
90–100% 70–90% 50–70% 30–50% less than 30%
Emerging Trends in SME Finance and Policies 23
public credit guarantee schemes. Also, supplementing the promotion of bank lending to SMEs are measures such as concessional direct lending to SMEs by policy banks and/or central or local government authorities, refinancing schemes for banks by thegovernment and/or bi- or multilateral development organizations to create additional credit lines for SMEs, and government interest rate subsidies for banks to reduce lending rates for SMEs.
While a variety of proactive government support measures contribute to improving SME access to finance, especially banking services, they have yet to sufficiently fill the unmet financing demand of SMEs or the supply–demand gap in SME finance. Although performance differs by country, the SME loan share averages less than 30% to total bank loans across ADB DMCs. When combined with the relatively slow pace of SME lending growth (showing 10% year-on-year growth but it is a decreasing trend), this suggests that SMEs accessibility to bank credit remains low and there is room for further expansion of bank lending to SMEs. The nonbank sector, including the venture capital industry and capital markets, is still in an early stage of development and has yet to develop feasible business models for SME financing. Scaling up SME finance in Asia and the Pacific requires a two-pronged approach: improved bank lending efficiency, and diversification of financing models that serve various financing needs of SMEs. Lessons from the financial crises have motivated many countries to consider SME access to finance beyond conventional bank credit and to diversify their domestic financial systems. Accordingly, national policy makers are required to develop a comprehensive policy framework thatsupports innovative instruments and services to promote SME access to finance from various angles, given the limitations of bank lending to SMEs.
In OECD countries, access to finance represents one of the most significant challenges for entrepreneurs and for the creation, survival, and growth of small businesses, especially innovative ones. This is a long-standing hurdle that limits SME growth in many OECD countries and in most emerging economies, where SMEs and micro firms often have limited access to both debt financing and equity capital.
The GFC has severely exacerbated the SME financing gap in many countries. In the OECD area, SMEs suffered from a double shock: a drastic drop in demand for their goods and services, and a credit crunch. As a result, SME cash flows and liquidity were greatly affected, forcing many into bankruptcy and contributing to record levels of unemployment in many OECD countries. Moreover, the eurozone debt crisis tightened the national fiscal policy in many eurozone OECD countries, which may limit the possibilities for government intervention to ease SME access to finance.
Basel capital accords, especially Basel III, require tighter risk management by banks, which has raised a debate on the potential negative impact on SME lending. Basel III is more influential in the banking sector in OECD countries than in ADB DMCs because many ADB DMCs have yet to introduce it. Having said that, to build a resilient national economy bank regulators in the two areas need to balance financial stability and financial inclusion with a high level of risk consciousness against unexpected events such as a financial crisis.
24 ADB–OECD Study on Enhancing Financial Accessibility for SMEs
The GFC has affected both ADB and OECD countries but the impact of the crisis is relatively more serious in the OECD area. In particular, eurozone countries are facing serious unemployment because of a deterioration in fiscal conditions as a result of the eurozone debt crisis. This will negatively affect developing Asian countries because of the depressed demand from developed countries or the OECD area and the deleveraging trend of European banks with significant presence in Asia. Taking this into consideration, a common policy direction of ADB and OECD countries is towards growth and job creation. To this end, new policy approaches are needed if countries are to move toward having resilient national economies with sustainable growth in the long-term, where SME sector development is a key policy focus and finance is a critical tool to realizing it. Broadening the financing models for SMEs and entrepreneurship, making the best use of information and technology, is a key action commonly shared by ADB and OECD countries, and one which can also be achieved via well-organized public–private initiatives.
The crisis has highlighted a weakness in policy making for SMEs that has existed for some time: the lack of timely, comparable data and the absence of a sound monitoring framework for SME finance. In response to this limitation, the OECD launched the Scoreboard on SME and entrepreneurship finance in 2012, and similarly ADB will launch the Asia SME Finance Monitor in 2014. Both provide a unique framework for monitoring SME access to finance at the national and the international level. The OECD Scoreboard examines 13 core indicators related to SME debt and equity financing, framework conditions, and government policies. Most of the indicators are derived from supply-side data provided by financial institutions. The ADB Asia SME Finance Monitor reviews various country aspects of SME finance covering the banking sector, nonbank sector, capital markets, and related policies and regulations, mainly to support evidence-based policy making and regulations on SME finance in Asia and the Pacific. The data used in the SME monitor was collected and elaborated through strategic partnerships with institutions in 14 ADB DMCs. Those initiatives are supplemented by national and regional demand-side surveys to provide a more comprehensive view of the evolution in financingtrends and needs in ADB and OECD countries. More importantly, such data sources will contribute to the design of new policy approaches to SME finance to address the long-standing challenges of sustainable and inclusive growth in the two areas, and the rebalancing of the global economy.
25
2 Bank Lending Efficiency
2.1. Financial Infrastructure for SMEs
2.1.1. Banking SMEs in Asia
Niny Khor6
This section documents the degree of financial inclusion, especially access to banking services, for small and medium-sized enterprises (SMEs). Using firm-level data across 125 countries, including 16 in Asia, the section finds that, overall, SMEs have less access to banking services than large firms. Out of the three types of banking access examined, ownership of a bank checking or savings accounts is the most common type of accountand is almost universal in Asian and non-Asian countries. For Asian firms, however, access to overdraft facilities and credit lines is approximately half that of non-Asian firms. SMEs in Asia were slightly more likely to report financial constraint than larger Asian firms, were least likely to have made recent investments, and were most reliant on retained earnings for both investment and working capital compared to firms elsewhere. SMEs in Asia were also more likely to be required to provide collaterals for loans. Improving financial accessto SMEs in Asia would be an important step towards inclusive growth, especially since women’s participation in ownership of Asian SMEs is double that of non-Asian SMEs. Enlisting the participation of the private sector is essential to improving financial inclusion in Asia, given that Asian SMEs are still mostly financed by state-owned banks.
A. Introduction
Access to finance is one of the fundamental necessities for growth of the private sector. Low-cost and readily accessible formal sector financing is crucial to the development of a robust private sector with dynamic enterprises. However, improving access to external sources of funding remains one of the main challenges of firm finance, especially in emerging and developing economies. Availability of funds determines a firm’s ability to maximize efficiency gains in almost all areas of its operations, including market research, product development, and production expansion. This in turn has implications on the economy’s ability to generate more jobs and to improve social welfare.
Removing barriers to finance is especially beneficial for small firms, which represent muchof an economy’s latent dynamism. Financial conditions of small businesses differ from those of large firms (Lucas 1978). It is relatively more difficult for smaller firms to signal
6 Economist, People’s Republic of China Resident Mission, Asian Development Bank. [email protected]
26 ADB–OECD Study on Enhancing Financial Accessibility for SMEs
their creditworthiness to banks and other financial institutions because they suffer from more severe informational asymmetries between lenders and borrowers and incentive asymmetries between owners and managers than large firms. Often this results in low access to finance for small firms, which may compromise profitable project ventures of even high-quality small firms. Without access to external finance, smaller firms often resort to internal resources, limiting their productivity potential, chance to innovate, and growth. This section documents the extent of access to finance for Asian firms, and provides empirical evidence on the variation of this access across firm size.
Firm size matters, since typically both productivity and wages are correlated with firm size (Oi and Idson 1999). The size of enterprises ultimately varies across industries, industrial organizations, and economies.7 Even within similar sectors, firms vary on the types of production technology they choose and wages they pay. Thus, constraints on the growth of enterprises will have adverse impacts on the growth of productivity and wages received by workers.8 In an earlier report on enterprises in Asia, the Asian Development Bank (ADB) (2009) found that most firms in the region’s developing economies are still very small. In most of the countries surveyed, the majority of firms are small and employ less than 50 people. In some countries, such as India, Indonesia, and the Philippines, small establishments accounted for more than 90% of all firms. The prevalence of small firmscan be attributed to two things: (i) in economies where structural change is just beginning to shift workers away from agriculture, firms in both manufacturing and services are naturally younger, and hence typically smaller; and (ii) endemic institutional features might favor large state-owned enterprises or other large domestic private interests, thereby constructing real constraints on the entry of new firms and the expansion of existingsmall firms, and keeping the average size of firms within the country small. This artificial smallness of firms may well be alleviated if the right policies are introduced to address the binding constraints.
B. Banks and Credit Access for SMEs in Asia
A large determinant of firm size is the availability of credit and access to finance, especially for smaller firms. In this regard, a large body of literature in recent years has emerged to study SME finance from a firm perspective (Beck and Demirgüç-Kunt 2006; Beck,Demirgüç-Kunt, and Martinez Peria 2008; Ayyagari, Demirgüç-Kunt, and Maksimovic 2008). Recent supply-side studies of SME financing show that investing in the SME market can be lucrative. Beck, Demirgüç-Kunt, and Martinez Peria (2008), examining how large banks perceive the SME market in 45 developed and developing countries, find that although banks are more exposed to larger firms, they consider the SMEs to be
7 While the terms “enterprise” (or “firm”) and “establishment” are two distinct concepts, in this section these areoften used interchangeably. The survey data used are based on establishment-level data. An establishmentis a single physical location at which business is conducted or where services or industrial operations are performed. An enterprise or firm is a business organization consisting of one or more establishments under common ownership or control.
8 Although most of the literature has focused on labor markets in developed countries, empirically this findingis also observed for the sample of developing Asian economies for which data is available. In countries such as Malaysia, the magnitude of wage differentials across firm size is less than 30%. However, in othercountries such as the Philippines, the average wages of workers in large firms could be more than three times the average wages of workers in small firms. This large wage differential suggests that the productivity of smaller firms in the Philippines is much lower than that of larger firms.
Bank Lending Efficiency 27
an attractive, profitable market. De la Torre, Martinez Peria, and Schmukler found similar results, relying on interviews conducted in 37 banks in Argentina, Chile, Colombia, and Serbia along with interviews gathered by the International Finance Corporation in eight developing and developed countries and FRS (Inmark Group) across seven countries.
Because barriers to accessing finance still exist for small firms in developing countries,regulations to improve access to finance for SMEs and in rural areas have become popular. About half of the regulators in developing countries say that promotion of SME finance is part of their agenda, compared with less than 20% in high-income countries (CGAP and World Bank 2010). Moreover, improvement of access to SME finance remains one of the top three areas of reform in financial inclusion, with 47% of the economies indicating reforms implemented in this area.9 Reform approaches included setting up or expanding guarantee schemes, encouraging lending to the SME sector, and requiring banks to designate a minimum amount of their portfolio to SMEs, which might introduce distortion away from the optimal resource allocation.10 Most of the financial inclusion reforms were implemented in South Asia and East Asia, with the Philippines and Malaysia reporting the highest number, each having 10 different areas of reform. Governments around the world have also used interest rate subsidies, directed lending, SME guarantees, and other approaches to finance SMEs.
1. Data DescriptionDespite these purported incentives for banks to lend to SMEs, how accessible has bank credit been for Asian SMEs? While most of the available studies provide estimates of the aggregate level, a more accurate picture of the accessibility of finance invariably requires a look at micro-level data on firms. This section uses the unique dataset compiled by the World Bank Enterprise Survey initiative, which aims to collect globally comparable detailed information at the firm level. Currently, the survey covers more than 100,000 firms around the world and is conducted independently for each participating country at certain selected year intervals. The section focuses on the most recent update of the dataset, containing 73,330 firms from 123 economies interviewed between 2006 and 2012.
To facilitate comparison across countries, a standardized definition of SMEs is followed in this section. Throughout this section, small firms are those with less than 20 workers,medium-sized firms employ 20–99 workers, and large firms employ more than 100 workers. Obviously, this effort in standardization for intercountry comparison means thatthe definition of an SME is likely to depart from official national guidelines that typically differ from country to country. Sixteen Asian economies are included in the sample: Afghanistan, Bangladesh, Bhutan, the People’s Republic of China (PRC), Indonesia, Kazakhstan, Kyrgyz Republic, the Lao People’s Democratic Republic, Nepal, Pakistan, the Philippines, Sri Lanka, Tajikistan, Timor-Leste, Uzbekistan, and Viet Nam. The stratified random sampling methodology for the survey provides weights based on the following
9 The other two reform areas are consumer protection and “know your customer” requirements.10 In the Philippines, the Magna Carta Law (per 2008 revision R.A. 9501) mandates all banks to allocate
8% of their loan portfolio to micro and small firms, and another 2% to medium-sized firms. After 2008, noncompliance with the law rose as some banks opted to pay the fines rather than fulfill their mandatedquota, while others actually increased their lending to MSMEs. Clearly, different lending technologies would affect the profitability of lending to SMEs, hence a blunt singular quota across all banks reduces the efficiency of resource allocation (see Tacneng, Jacildo, and Khor 2013).
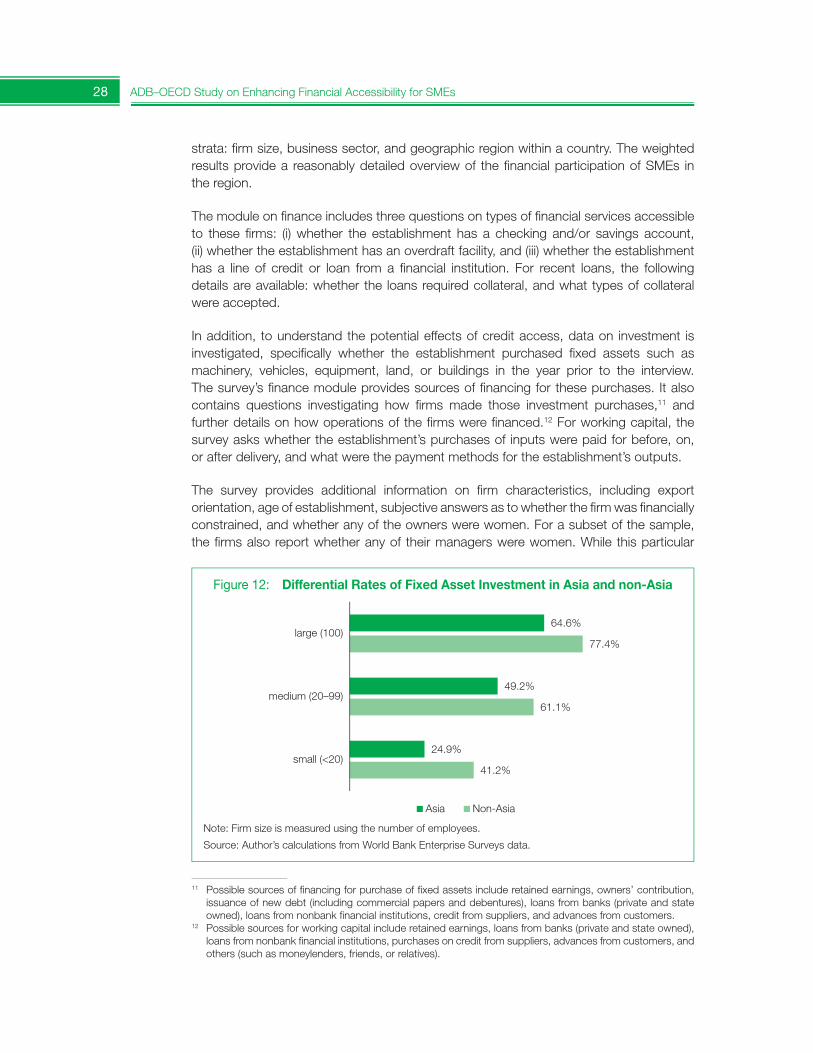
28 ADB–OECD Study on Enhancing Financial Accessibility for SMEs
strata: firm size, business sector, and geographic region within a country. The weighted results provide a reasonably detailed overview of the financial participation of SMEs in the region.
The module on finance includes three questions on types of financial services accessibleto these firms: (i) whether the establishment has a checking and/or savings account, (ii) whether the establishment has an overdraft facility, and (iii) whether the establishment has a line of credit or loan from a financial institution. For recent loans, the following details are available: whether the loans required collateral, and what types of collateral were accepted.
In addition, to understand the potential effects of credit access, data on investment is investigated, specifically whether the establishment purchased fixed assets such as machinery, vehicles, equipment, land, or buildings in the year prior to the interview. The survey’s finance module provides sources of financing for these purchases. It also contains questions investigating how firms made those investment purchases,11 and further details on how operations of the firms were financed.12 For working capital, the survey asks whether the establishment’s purchases of inputs were paid for before, on, or after delivery, and what were the payment methods for the establishment’s outputs.
The survey provides additional information on firm characteristics, including export orientation, age of establishment, subjective answers as to whether the firm was financially constrained, and whether any of the owners were women. For a subset of the sample, the firms also report whether any of their managers were women. While this particular
11 Possible sources of financing for purchase of fixed assets include retained earnings, owners’ contribution,issuance of new debt (including commercial papers and debentures), loans from banks (private and stateowned), loans from nonbank financial institutions, credit from suppliers, and advances from customers.
12 Possible sources for working capital include retained earnings, loans from banks (private and state owned), loans from nonbank financial institutions, purchases on credit from suppliers, advances from customers, andothers (such as moneylenders, friends, or relatives).
Note: Firm size is measured using the number of employees.
Source: Author’s calculations from World Bank Enterprise Surveys data.
Figure 12: Differential Rates of Fixed Asset Investment in Asia and non-Asia
41.2%
61.1%
77.4%
24.9%
49.2%
64.6%
small (<20)
medium (20–99)
large (100)
Asia Non-Asia
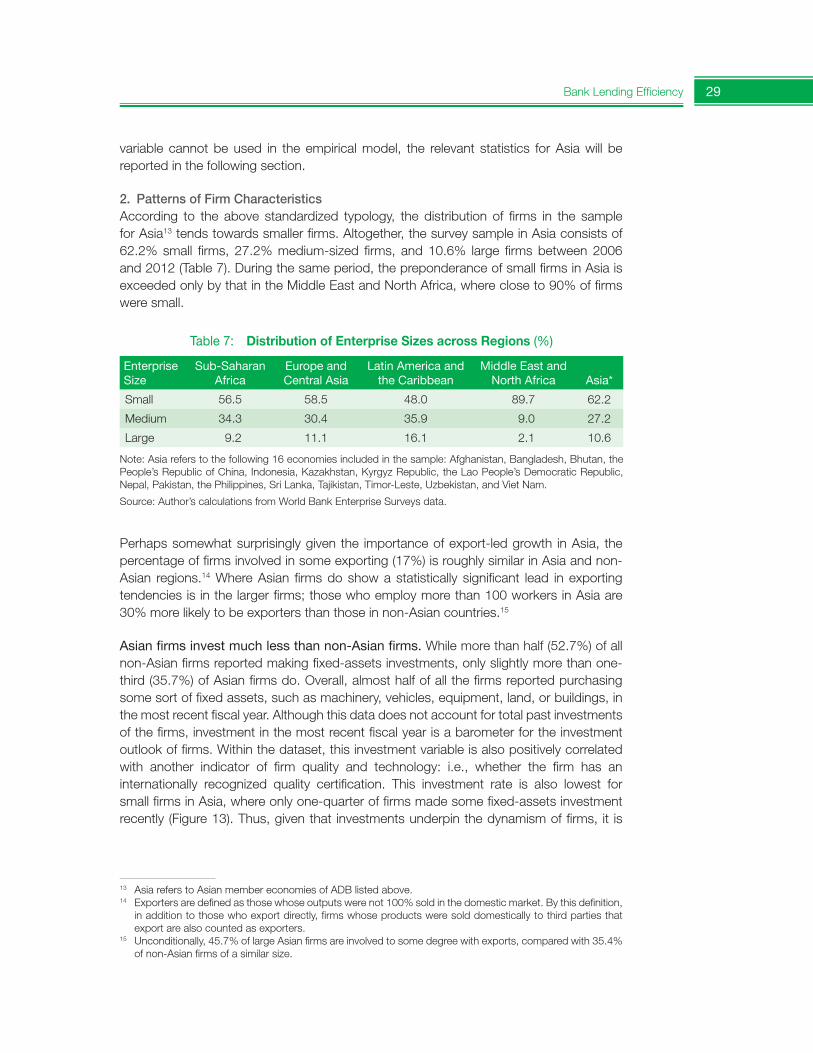
Bank Lending Efficiency 29
variable cannot be used in the empirical model, the relevant statistics for Asia will bereported in the following section.
2. Patterns of Firm CharacteristicsAccording to the above standardized typology, the distribution of firms in the sample for Asia13 tends towards smaller firms. Altogether, the survey sample in Asia consists of 62.2% small firms, 27.2% medium-sized firms, and 10.6% large firms between 2006 and 2012 (Table 7). During the same period, the preponderance of small firms in Asia is exceeded only by that in the Middle East and North Africa, where close to 90% of firmswere small.
Perhaps somewhat surprisingly given the importance of export-led growth in Asia, the percentage of firms involved in some exporting (17%) is roughly similar in Asia and non-Asian regions.14 Where Asian firms do show a statistically significant lead in exporting tendencies is in the larger firms; those who employ more than 100 workers in Asia are 30% more likely to be exporters than those in non-Asian countries.15
Asianfirmsinvestmuchlessthannon-Asianfirms. While more than half (52.7%) of all non-Asian firms reported making fixed-assets investments, only slightly more than one-third (35.7%) of Asian firms do. Overall, almost half of all the firms reported purchasing some sort of fixed assets, such as machinery, vehicles, equipment, land, or buildings, in the most recent fiscal year. Although this data does not account for total past investments of the firms, investment in the most recent fiscal year is a barometer for the investment outlook of firms. Within the dataset, this investment variable is also positively correlated with another indicator of firm quality and technology: i.e., whether the firm has an internationally recognized quality certification. This investment rate is also lowest for small firms in Asia, where only one-quarter of firms made some fixed-assets investment recently (Figure 13). Thus, given that investments underpin the dynamism of firms, it is
13 Asia refers to Asian member economies of ADB listed above.14 Exporters are defined as those whose outputs were not 100% sold in the domestic market. By this definition,
in addition to those who export directly, firms whose products were sold domestically to third parties that export are also counted as exporters.
15 Unconditionally, 45.7% of large Asian firms are involved to some degree with exports, compared with 35.4% of non-Asian firms of a similar size.
Table 7: Distribution of Enterprise Sizes across Regions (%)
Enterprise Size
Sub-SaharanAfrica
Europe and Central Asia
Latin America and the Caribbean
Middle East and North Africa Asia*
Small 56.5 58.5 48.0 89.7 62.2
Medium 34.3 30.4 35.9 9.0 27.2
Large 9.2 11.1 16.1 2.1 10.6
Note: Asia refers to the following 16 economies included in the sample: Afghanistan, Bangladesh, Bhutan, the People’s Republic of China, Indonesia, Kazakhstan, Kyrgyz Republic, the Lao People’s Democratic Republic, Nepal, Pakistan, the Philippines, Sri Lanka, Tajikistan, Timor-Leste, Uzbekistan, and Viet Nam.
Source: Author’s calculations from World Bank Enterprise Surveys data.
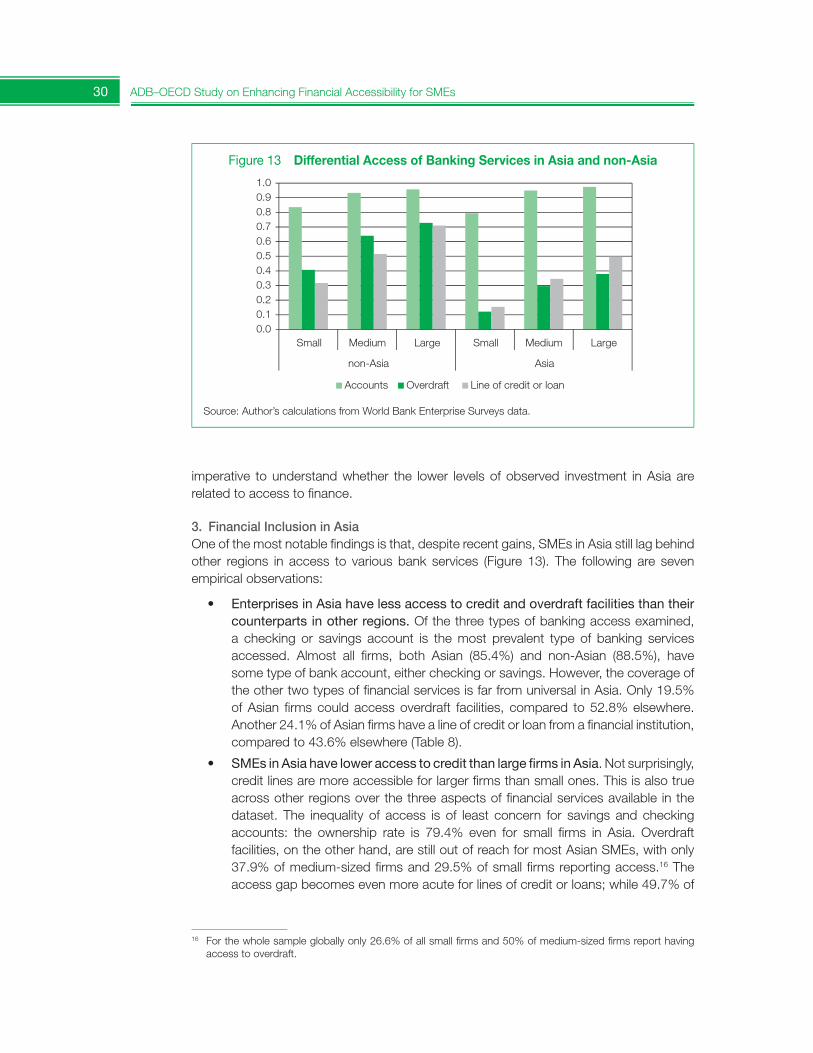
30 ADB–OECD Study on Enhancing Financial Accessibility for SMEs
imperative to understand whether the lower levels of observed investment in Asia are related to access to finance.
3. Financial Inclusion in AsiaOne of the most notable findings is that, despite recent gains, SMEs in Asia still lag behind other regions in access to various bank services (Figure 13). The following are seven empirical observations:
• Enterprises in Asia have less access to credit and overdraft facilities than their counterparts in other regions. Of the three types of banking access examined, a checking or savings account is the most prevalent type of banking services accessed. Almost all firms, both Asian (85.4%) and non-Asian (88.5%), have some type of bank account, either checking or savings. However, the coverage of the other two types of financial services is far from universal in Asia. Only 19.5%of Asian firms could access overdraft facilities, compared to 52.8% elsewhere. Another 24.1% of Asian firms have a line of credit or loan from a financial institution, compared to 43.6% elsewhere (Table 8).
• SMEsinAsiahaveloweraccesstocreditthanlargefirmsinAsia. Not surprisingly, credit lines are more accessible for larger firms than small ones. This is also true across other regions over the three aspects of financial services available in the dataset. The inequality of access is of least concern for savings and checking accounts: the ownership rate is 79.4% even for small firms in Asia. Overdraft facilities, on the other hand, are still out of reach for most Asian SMEs, with only 37.9% of medium-sized firms and 29.5% of small firms reporting access.16 The access gap becomes even more acute for lines of credit or loans; while 49.7% of
16 For the whole sample globally only 26.6% of all small firms and 50% of medium-sized firms report having access to overdraft.
Figure 13 Differential Access of Banking Services in Asia and non-Asia
Source: Author’s calculations from World Bank Enterprise Surveys data.
0.00.10.20.30.40.50.60.70.80.91.0
Small Medium Large Small Medium Large
non-Asia Asia
Accounts Overdraft Line of credit or loan
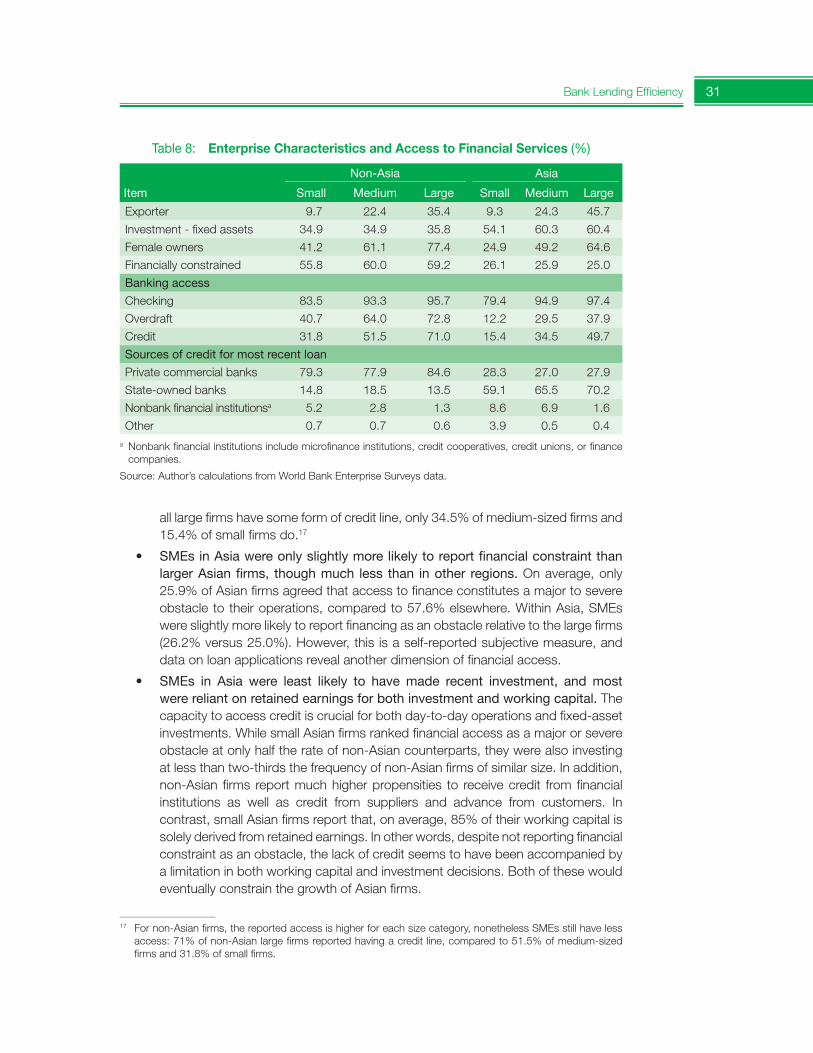
Bank Lending Efficiency 31
all large firms have some form of credit line, only 34.5% of medium-sized firms and 15.4% of small firms do.17
• SMEsinAsiawereonlyslightlymorelikelytoreportfinancialconstraintthanlargerAsianfirms, thoughmuch less than inother regions.On average, only 25.9% of Asian firms agreed that access to finance constitutes a major to severeobstacle to their operations, compared to 57.6% elsewhere. Within Asia, SMEs were slightly more likely to report financing as an obstacle relative to the large firms (26.2% versus 25.0%). However, this is a self-reported subjective measure, and data on loan applications reveal another dimension of financial access.
• SMEs in Asia were least likely to havemade recent investment, andmostwere reliant on retained earnings for both investment and working capital. The capacity to access credit is crucial for both day-to-day operations and fixed-asset investments. While small Asian firms ranked financial access as a major or severe obstacle at only half the rate of non-Asian counterparts, they were also investing at less than two-thirds the frequency of non-Asian firms of similar size. In addition, non-Asian firms report much higher propensities to receive credit from financial institutions as well as credit from suppliers and advance from customers. In contrast, small Asian firms report that, on average, 85% of their working capital is solely derived from retained earnings. In other words, despite not reporting financialconstraint as an obstacle, the lack of credit seems to have been accompanied by a limitation in both working capital and investment decisions. Both of these would eventually constrain the growth of Asian firms.
17 For non-Asian firms, the reported access is higher for each size category, nonetheless SMEs still have less access: 71% of non-Asian large firms reported having a credit line, compared to 51.5% of medium-sized firms and 31.8% of small firms.
Table 8: Enterprise Characteristics and Access to Financial Services (%)
Item Small
Non-Asia
Medium Large Small
Asia
Medium Large
Exporter 9.7 22.4 35.4 9.3 24.3 45.7
Investment - fixed assets 34.9 34.9 35.8 54.1 60.3 60.4
Female owners 41.2 61.1 77.4 24.9 49.2 64.6
Financially constrained 55.8 60.0 59.2 26.1 25.9 25.0
Banking access
Checking 83.5 93.3 95.7 79.4 94.9 97.4
Overdraft 40.7 64.0 72.8 12.2 29.5 37.9
Credit 31.8 51.5 71.0 15.4 34.5 49.7
Sources of credit for most recent loan
Private commercial banks 79.3 77.9 84.6 28.3 27.0 27.9
State-owned banks 14.8 18.5 13.5 59.1 65.5 70.2
Nonbank financial institutionsa 5.2 2.8 1.3 8.6 6.9 1.6
Other 0.7 0.7 0.6 3.9 0.5 0.4a Nonbank financial institutions include microfinance institutions, credit cooperatives, credit unions, or finance
companies.
Source: Author’s calculations from World Bank Enterprise Surveys data.
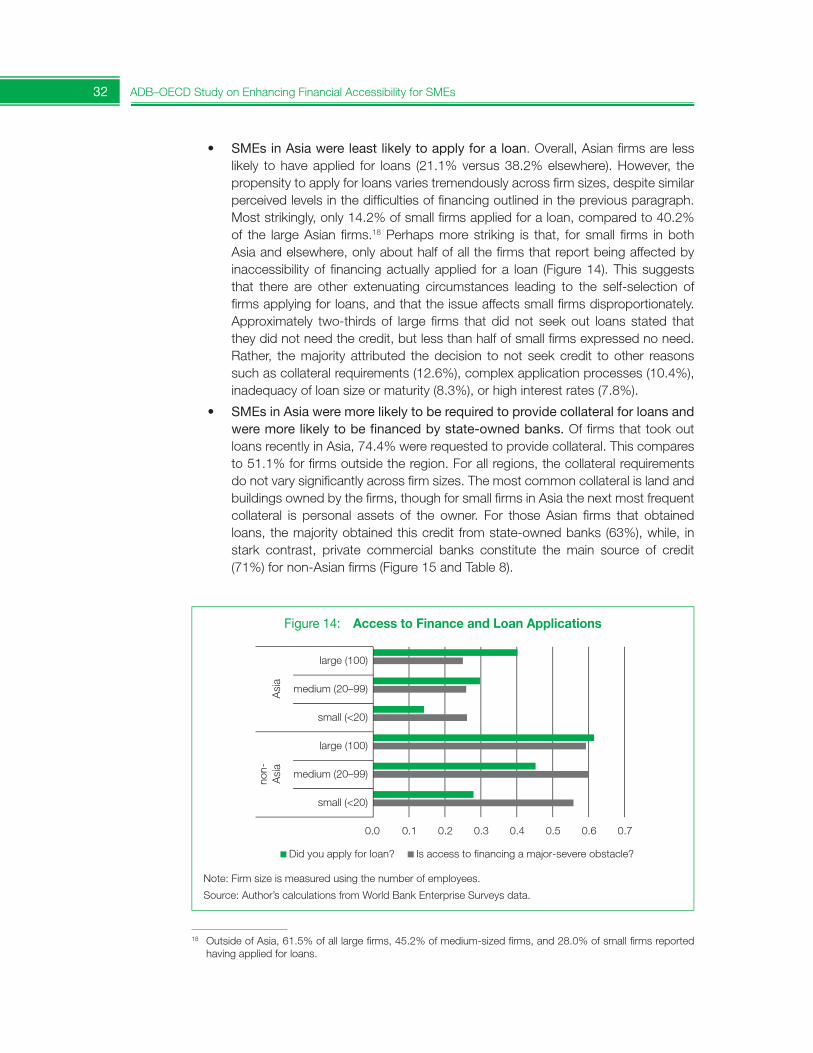
32 ADB–OECD Study on Enhancing Financial Accessibility for SMEs
• SMEsinAsiawereleastlikelytoapplyforaloan. Overall, Asian firms are less likely to have applied for loans (21.1% versus 38.2% elsewhere). However, the propensity to apply for loans varies tremendously across firm sizes, despite similarperceived levels in the difficulties of financing outlined in the previous paragraph. Most strikingly, only 14.2% of small firms applied for a loan, compared to 40.2% of the large Asian firms.18 Perhaps more striking is that, for small firms in both Asia and elsewhere, only about half of all the firms that report being affected by inaccessibility of financing actually applied for a loan (Figure 14). This suggests that there are other extenuating circumstances leading to the self-selection of firms applying for loans, and that the issue affects small firms disproportionately. Approximately two-thirds of large firms that did not seek out loans stated that they did not need the credit, but less than half of small firms expressed no need. Rather, the majority attributed the decision to not seek credit to other reasons such as collateral requirements (12.6%), complex application processes (10.4%), inadequacy of loan size or maturity (8.3%), or high interest rates (7.8%).
• SMEsinAsiaweremorelikelyto berequiredtoprovidecollateralforloansandweremorelikelytobefinancedbystate-ownedbanks.Of firms that took out loans recently in Asia, 74.4% were requested to provide collateral. This comparesto 51.1% for firms outside the region. For all regions, the collateral requirementsdo not vary significantly across firm sizes. The most common collateral is land and buildings owned by the firms, though for small firms in Asia the next most frequent collateral is personal assets of the owner. For those Asian firms that obtained loans, the majority obtained this credit from state-owned banks (63%), while, in stark contrast, private commercial banks constitute the main source of credit (71%) for non-Asian firms (Figure 15 and Table 8).
18 Outside of Asia, 61.5% of all large firms, 45.2% of medium-sized firms, and 28.0% of small firms reported having applied for loans.
Figure 14: Access to Finance and Loan Applications
Note: Firm size is measured using the number of employees.
Source: Author’s calculations from World Bank Enterprise Surveys data.
0.0 0.1 0.2 0.3 0.4 0.5 0.6 0.7
small (<20)
medium (20–99)
large (100)
small (<20)
medium (20–99)
large (100)
non-
Asi
aA
sia
Did you apply for loan? Is access to financing a major-severe obstacle?
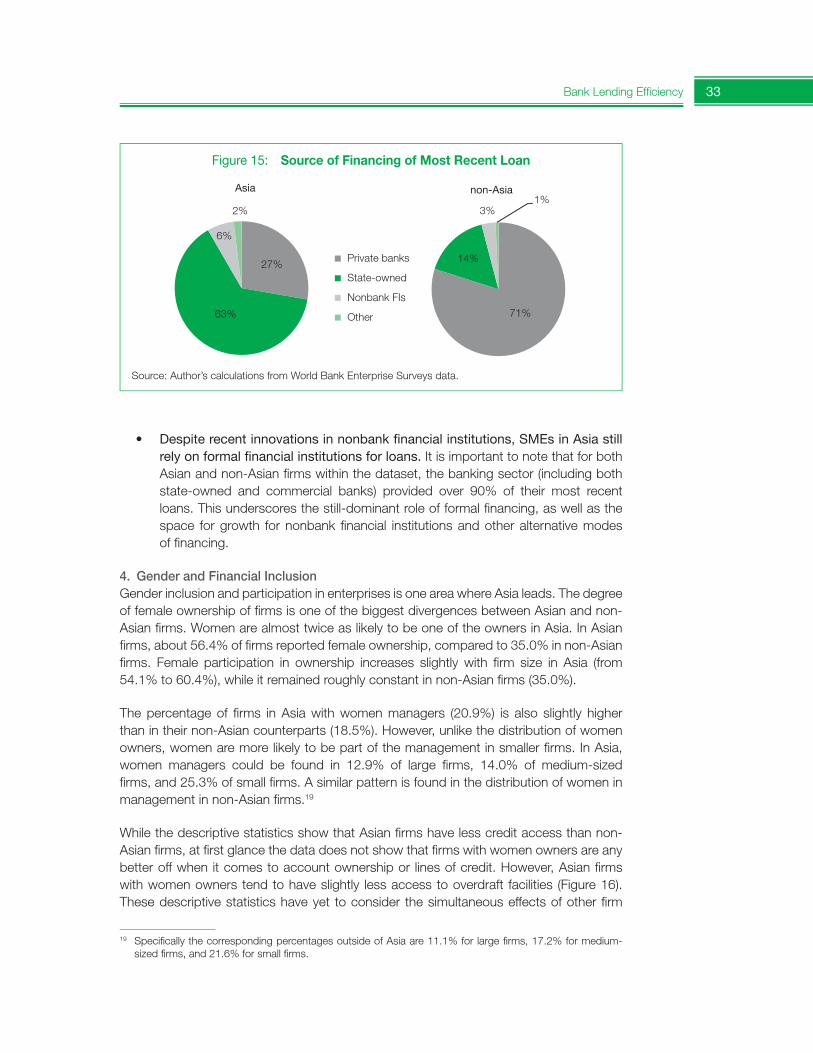
Bank Lending Efficiency 33
• Despiterecentinnovationsinnonbankfinancialinstitutions,SMEsinAsiastillrelyonformalfinancialinstitutionsforloans.It is important to note that for both Asian and non-Asian firms within the dataset, the banking sector (including both state-owned and commercial banks) provided over 90% of their most recent loans. This underscores the still-dominant role of formal financing, as well as the space for growth for nonbank financial institutions and other alternative modes of financing.
4. Gender and Financial InclusionGender inclusion and participation in enterprises is one area where Asia leads. The degreeof female ownership of firms is one of the biggest divergences between Asian and non-Asian firms. Women are almost twice as likely to be one of the owners in Asia. In Asian firms, about 56.4% of firms reported female ownership, compared to 35.0% in non-Asian firms. Female participation in ownership increases slightly with firm size in Asia (from 54.1% to 60.4%), while it remained roughly constant in non-Asian firms (35.0%).
The percentage of firms in Asia with women managers (20.9%) is also slightly higher than in their non-Asian counterparts (18.5%). However, unlike the distribution of women owners, women are more likely to be part of the management in smaller firms. In Asia, women managers could be found in 12.9% of large firms, 14.0% of medium-sizedfirms, and 25.3% of small firms. A similar pattern is found in the distribution of women in management in non-Asian firms.19
While the descriptive statistics show that Asian firms have less credit access than non-Asian firms, at first glance the data does not show that firms with women owners are any better off when it comes to account ownership or lines of credit. However, Asian firms with women owners tend to have slightly less access to overdraft facilities (Figure 16). These descriptive statistics have yet to consider the simultaneous effects of other firm
19 Specifically the corresponding percentages outside of Asia are 11.1% for large firms, 17.2% for medium-sized firms, and 21.6% for small firms.
Figure 15: Source of Financing of Most Recent Loan
Source: Author’s calculations from World Bank Enterprise Surveys data.
71%
14%
3% 1%
non-Asia
27%
63%
6%
2%
Asia
Private banks
State-owned
Nonbank FIs
Other
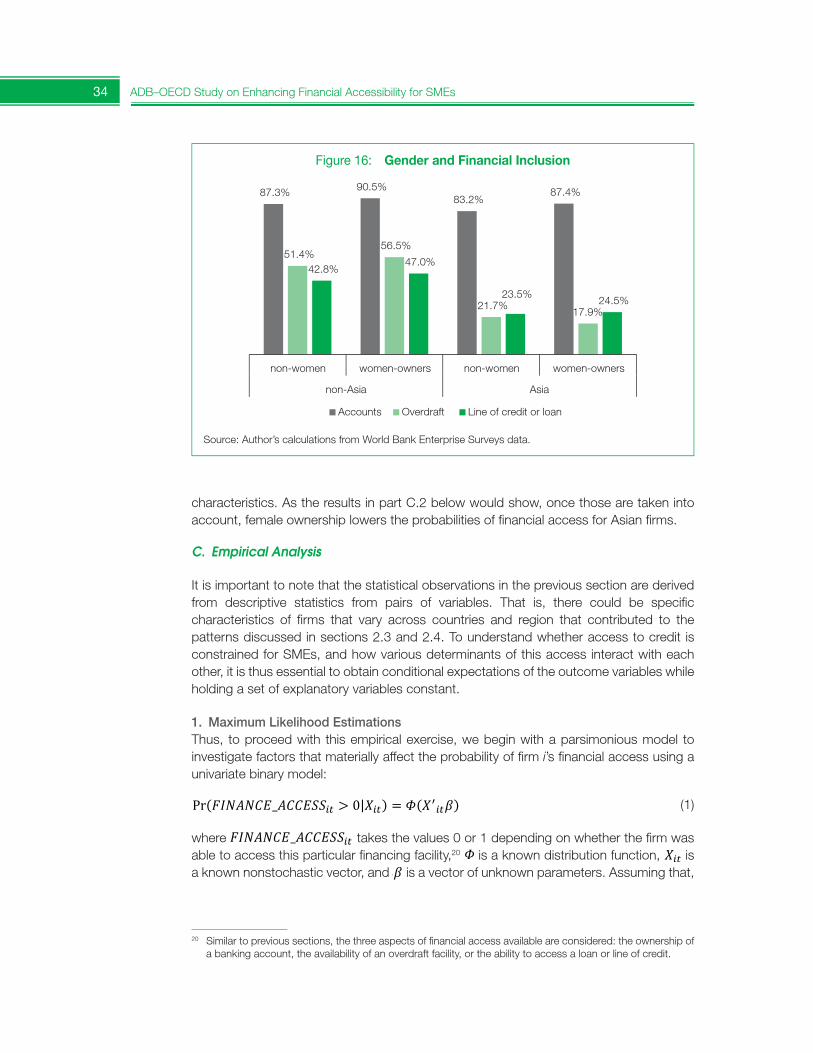
34 ADB–OECD Study on Enhancing Financial Accessibility for SMEs
characteristics. As the results in part C.2 below would show, once those are taken into account, female ownership lowers the probabilities of financial access for Asian firms.
C. Empirical Analysis
It is important to note that the statistical observations in the previous section are derived from descriptive statistics from pairs of variables. That is, there could be specific characteristics of firms that vary across countries and region that contributed to the patterns discussed in sections 2.3 and 2.4. To understand whether access to credit is constrained for SMEs, and how various determinants of this access interact with each other, it is thus essential to obtain conditional expectations of the outcome variables while holding a set of explanatory variables constant.
1. Maximum Likelihood EstimationsThus, to proceed with this empirical exercise, we begin with a parsimonious model to investigate factors that materially affect the probability of firm i’s financial access using a univariate binary model:
Chapter 2: Bank Lending Efficiency
32
when it comes to account ownership or lines of credit. However, Asian firms with women owners tend to have slightly less access to overdraft facilities (Figure 4). These descriptive statistics have yet to consider the simultaneous effects of other firm characteristics. As the results in part C.2 below would show, once those are taken into account, female ownership lowers the probabilities of financial access for Asian firms. C. Empirical Analysis
It is important to note that the statistical observations in the previous section are derived from descriptive statistics from pairs of variables. That is, there could be specific characteristics of firms that vary across countries and region that contributed to the patterns discussed in sections 2.3 and 2.4. To understand whether access to credit is constrained for SMEs, and how various determinants of this access interact with each other, it is thus essential to obtain conditional expectations of the outcome variables while holding a set of explanatory variables constant.
1. Maximum Likelihood Estimations
Thus, to proceed with this empirical exercise, we begin with a parsimonious model to investigate factors that materially affect the probability of firm i's financial access using a univariate binary model: ( | ) ( ) (1) where takes the values 0 or 1 depending on whether the firm was able to access this particular financing facility,15 is a known distribution function, is a known nonstochastic vector, and is a vector of unknown parameters. Assuming that, is the standard normal distribution function, then the likelihood function of the model is given by: ( ) ∑ ( ( ) ( ) ( ( ( )))
(2) It is useful to note that the choice of a normal distribution would not affect the implications of the results. Although the estimated coefficients would differ, the important vector is that of the partial derivatives (Amemiya 1994). Equation (2) is estimated using the maximum likelihood estimation method. For these estimations, contains firm-specific characteristics, including firm age, female participation in ownership, firm size, year, and geographical location.
To explore this, we fit various regression models onto the firm data. In the first set of estimations, maximum likelihood method is used to estimate the likelihood function first using the following parsimonious reduced form: ( ) ∑ ( )
(3)
where is a set of variables pertaining to credit access for firms, including availability; ASIA is a dummy variable for geography and refers to countries within Asia. In addition, firm-level characteristics (Z) include the age of firm, whether the firm exports or ha externally audited financial statements or internationally recognized certification, and whether
15 Similar to previous sections, the three aspects of financial access available are considered: the ownership of a
banking account, the availability of an overdraft facility, or the ability to access a loan or line of credit.
(1)
where
Chapter 2: Bank Lending Efficiency
32
when it comes to account ownership or lines of credit. However, Asian firms with women owners tend to have slightly less access to overdraft facilities (Figure 4). These descriptive statistics have yet to consider the simultaneous effects of other firm characteristics. As the results in part C.2 below would show, once those are taken into account, female ownership lowers the probabilities of financial access for Asian firms. C. Empirical Analysis
It is important to note that the statistical observations in the previous section are derived from descriptive statistics from pairs of variables. That is, there could be specific characteristics of firms that vary across countries and region that contributed to the patterns discussed in sections 2.3 and 2.4. To understand whether access to credit is constrained for SMEs, and how various determinants of this access interact with each other, it is thus essential to obtain conditional expectations of the outcome variables while holding a set of explanatory variables constant.
1. Maximum Likelihood Estimations
Thus, to proceed with this empirical exercise, we begin with a parsimonious model to investigate factors that materially affect the probability of firm i's financial access using a univariate binary model: ( | ) ( ) (1) where takes the values 0 or 1 depending on whether the firm was able to access this particular financing facility,15 is a known distribution function, is a known nonstochastic vector, and is a vector of unknown parameters. Assuming that, is the standard normal distribution function, then the likelihood function of the model is given by: ( ) ∑ ( ( ) ( ) ( ( ( )))
(2) It is useful to note that the choice of a normal distribution would not affect the implications of the results. Although the estimated coefficients would differ, the important vector is that of the partial derivatives (Amemiya 1994). Equation (2) is estimated using the maximum likelihood estimation method. For these estimations, contains firm-specific characteristics, including firm age, female participation in ownership, firm size, year, and geographical location.
To explore this, we fit various regression models onto the firm data. In the first set of estimations, maximum likelihood method is used to estimate the likelihood function first using the following parsimonious reduced form: ( ) ∑ ( )
(3)
where is a set of variables pertaining to credit access for firms, including availability; ASIA is a dummy variable for geography and refers to countries within Asia. In addition, firm-level characteristics (Z) include the age of firm, whether the firm exports or ha externally audited financial statements or internationally recognized certification, and whether
15 Similar to previous sections, the three aspects of financial access available are considered: the ownership of a
banking account, the availability of an overdraft facility, or the ability to access a loan or line of credit.
takes the values 0 or 1 depending on whether the firm was able to access this particular financing facility,20
Chapter 2: Bank Lending Efficiency
32
when it comes to account ownership or lines of credit. However, Asian firms with women owners tend to have slightly less access to overdraft facilities (Figure 4). These descriptive statistics have yet to consider the simultaneous effects of other firm characteristics. As the results in part C.2 below would show, once those are taken into account, female ownership lowers the probabilities of financial access for Asian firms. C. Empirical Analysis
It is important to note that the statistical observations in the previous section are derived from descriptive statistics from pairs of variables. That is, there could be specific characteristics of firms that vary across countries and region that contributed to the patterns discussed in sections 2.3 and 2.4. To understand whether access to credit is constrained for SMEs, and how various determinants of this access interact with each other, it is thus essential to obtain conditional expectations of the outcome variables while holding a set of explanatory variables constant.
1. Maximum Likelihood Estimations
Thus, to proceed with this empirical exercise, we begin with a parsimonious model to investigate factors that materially affect the probability of firm i's financial access using a univariate binary model: ( | ) ( ) (1) where takes the values 0 or 1 depending on whether the firm was able to access this particular financing facility,15 is a known distribution function, is a known nonstochastic vector, and is a vector of unknown parameters. Assuming that, is the standard normal distribution function, then the likelihood function of the model is given by: ( ) ∑ ( ( ) ( ) ( ( ( )))
(2) It is useful to note that the choice of a normal distribution would not affect the implications of the results. Although the estimated coefficients would differ, the important vector is that of the partial derivatives (Amemiya 1994). Equation (2) is estimated using the maximum likelihood estimation method. For these estimations, contains firm-specific characteristics, including firm age, female participation in ownership, firm size, year, and geographical location.
To explore this, we fit various regression models onto the firm data. In the first set of estimations, maximum likelihood method is used to estimate the likelihood function first using the following parsimonious reduced form: ( ) ∑ ( )
(3)
where is a set of variables pertaining to credit access for firms, including availability; ASIA is a dummy variable for geography and refers to countries within Asia. In addition, firm-level characteristics (Z) include the age of firm, whether the firm exports or ha externally audited financial statements or internationally recognized certification, and whether
15 Similar to previous sections, the three aspects of financial access available are considered: the ownership of a
banking account, the availability of an overdraft facility, or the ability to access a loan or line of credit.
is a known distribution function,
Chapter 2: Bank Lending Efficiency
32
when it comes to account ownership or lines of credit. However, Asian firms with women owners tend to have slightly less access to overdraft facilities (Figure 4). These descriptive statistics have yet to consider the simultaneous effects of other firm characteristics. As the results in part C.2 below would show, once those are taken into account, female ownership lowers the probabilities of financial access for Asian firms. C. Empirical Analysis
It is important to note that the statistical observations in the previous section are derived from descriptive statistics from pairs of variables. That is, there could be specific characteristics of firms that vary across countries and region that contributed to the patterns discussed in sections 2.3 and 2.4. To understand whether access to credit is constrained for SMEs, and how various determinants of this access interact with each other, it is thus essential to obtain conditional expectations of the outcome variables while holding a set of explanatory variables constant.
1. Maximum Likelihood Estimations
Thus, to proceed with this empirical exercise, we begin with a parsimonious model to investigate factors that materially affect the probability of firm i's financial access using a univariate binary model: ( | ) ( ) (1) where takes the values 0 or 1 depending on whether the firm was able to access this particular financing facility,15 is a known distribution function, is a known nonstochastic vector, and is a vector of unknown parameters. Assuming that, is the standard normal distribution function, then the likelihood function of the model is given by: ( ) ∑ ( ( ) ( ) ( ( ( )))
(2) It is useful to note that the choice of a normal distribution would not affect the implications of the results. Although the estimated coefficients would differ, the important vector is that of the partial derivatives (Amemiya 1994). Equation (2) is estimated using the maximum likelihood estimation method. For these estimations, contains firm-specific characteristics, including firm age, female participation in ownership, firm size, year, and geographical location.
To explore this, we fit various regression models onto the firm data. In the first set of estimations, maximum likelihood method is used to estimate the likelihood function first using the following parsimonious reduced form: ( ) ∑ ( )
(3)
where is a set of variables pertaining to credit access for firms, including availability; ASIA is a dummy variable for geography and refers to countries within Asia. In addition, firm-level characteristics (Z) include the age of firm, whether the firm exports or ha externally audited financial statements or internationally recognized certification, and whether
15 Similar to previous sections, the three aspects of financial access available are considered: the ownership of a
banking account, the availability of an overdraft facility, or the ability to access a loan or line of credit.
is a known nonstochastic vector, and
Chapter 2: Bank Lending Efficiency
32
when it comes to account ownership or lines of credit. However, Asian firms with women owners tend to have slightly less access to overdraft facilities (Figure 4). These descriptive statistics have yet to consider the simultaneous effects of other firm characteristics. As the results in part C.2 below would show, once those are taken into account, female ownership lowers the probabilities of financial access for Asian firms. C. Empirical Analysis
It is important to note that the statistical observations in the previous section are derived from descriptive statistics from pairs of variables. That is, there could be specific characteristics of firms that vary across countries and region that contributed to the patterns discussed in sections 2.3 and 2.4. To understand whether access to credit is constrained for SMEs, and how various determinants of this access interact with each other, it is thus essential to obtain conditional expectations of the outcome variables while holding a set of explanatory variables constant.
1. Maximum Likelihood Estimations
Thus, to proceed with this empirical exercise, we begin with a parsimonious model to investigate factors that materially affect the probability of firm i's financial access using a univariate binary model: ( | ) ( ) (1) where takes the values 0 or 1 depending on whether the firm was able to access this particular financing facility,15 is a known distribution function, is a known nonstochastic vector, and is a vector of unknown parameters. Assuming that, is the standard normal distribution function, then the likelihood function of the model is given by: ( ) ∑ ( ( ) ( ) ( ( ( )))
(2) It is useful to note that the choice of a normal distribution would not affect the implications of the results. Although the estimated coefficients would differ, the important vector is that of the partial derivatives (Amemiya 1994). Equation (2) is estimated using the maximum likelihood estimation method. For these estimations, contains firm-specific characteristics, including firm age, female participation in ownership, firm size, year, and geographical location.
To explore this, we fit various regression models onto the firm data. In the first set of estimations, maximum likelihood method is used to estimate the likelihood function first using the following parsimonious reduced form: ( ) ∑ ( )
(3)
where is a set of variables pertaining to credit access for firms, including availability; ASIA is a dummy variable for geography and refers to countries within Asia. In addition, firm-level characteristics (Z) include the age of firm, whether the firm exports or ha externally audited financial statements or internationally recognized certification, and whether
15 Similar to previous sections, the three aspects of financial access available are considered: the ownership of a
banking account, the availability of an overdraft facility, or the ability to access a loan or line of credit.
is a vector of unknown parameters. Assuming that,
20 Similar to previous sections, the three aspects of financial access available are considered: the ownership of a banking account, the availability of an overdraft facility, or the ability to access a loan or line of credit.
Figure 16: Gender and Financial Inclusion
Source: Author’s calculations from World Bank Enterprise Surveys data.
87.3% 90.5% 83.2%
87.4%
51.4% 56.5%
21.7% 17.9%
42.8% 47.0%
23.5% 24.5%
non-women women-owners non-women women-owners
non-Asia Asia
Accounts Overdraft Line of credit or loan
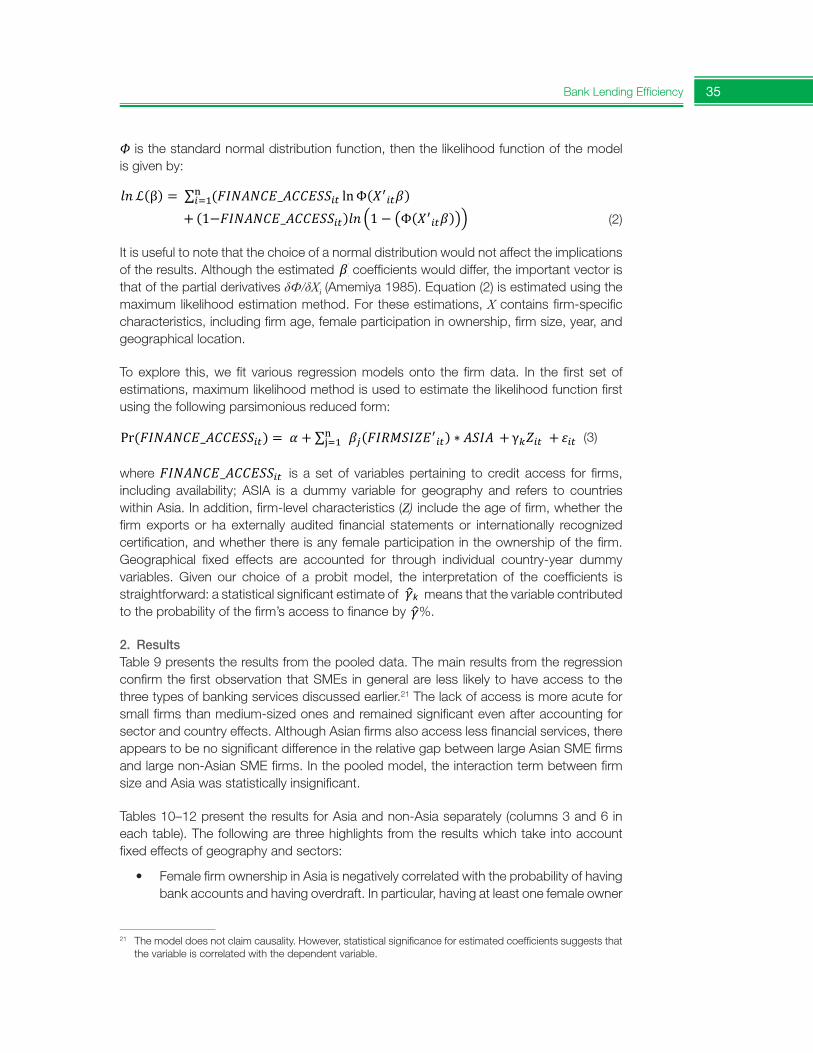
Bank Lending Efficiency 35
Chapter 2: Bank Lending Efficiency
32
when it comes to account ownership or lines of credit. However, Asian firms with women owners tend to have slightly less access to overdraft facilities (Figure 4). These descriptive statistics have yet to consider the simultaneous effects of other firm characteristics. As the results in part C.2 below would show, once those are taken into account, female ownership lowers the probabilities of financial access for Asian firms. C. Empirical Analysis
It is important to note that the statistical observations in the previous section are derived from descriptive statistics from pairs of variables. That is, there could be specific characteristics of firms that vary across countries and region that contributed to the patterns discussed in sections 2.3 and 2.4. To understand whether access to credit is constrained for SMEs, and how various determinants of this access interact with each other, it is thus essential to obtain conditional expectations of the outcome variables while holding a set of explanatory variables constant.
1. Maximum Likelihood Estimations
Thus, to proceed with this empirical exercise, we begin with a parsimonious model to investigate factors that materially affect the probability of firm i's financial access using a univariate binary model: ( | ) ( ) (1) where takes the values 0 or 1 depending on whether the firm was able to access this particular financing facility,15 is a known distribution function, is a known nonstochastic vector, and is a vector of unknown parameters. Assuming that, is the standard normal distribution function, then the likelihood function of the model is given by: ( ) ∑ ( ( ) ( ) ( ( ( )))
(2) It is useful to note that the choice of a normal distribution would not affect the implications of the results. Although the estimated coefficients would differ, the important vector is that of the partial derivatives (Amemiya 1994). Equation (2) is estimated using the maximum likelihood estimation method. For these estimations, contains firm-specific characteristics, including firm age, female participation in ownership, firm size, year, and geographical location.
To explore this, we fit various regression models onto the firm data. In the first set of estimations, maximum likelihood method is used to estimate the likelihood function first using the following parsimonious reduced form: ( ) ∑ ( )
(3)
where is a set of variables pertaining to credit access for firms, including availability; ASIA is a dummy variable for geography and refers to countries within Asia. In addition, firm-level characteristics (Z) include the age of firm, whether the firm exports or ha externally audited financial statements or internationally recognized certification, and whether
15 Similar to previous sections, the three aspects of financial access available are considered: the ownership of a
banking account, the availability of an overdraft facility, or the ability to access a loan or line of credit.
is the standard normal distribution function, then the likelihood function of the model is given by:
Chapter 2: Bank Lending Efficiency
32
when it comes to account ownership or lines of credit. However, Asian firms with women owners tend to have slightly less access to overdraft facilities (Figure 4). These descriptive statistics have yet to consider the simultaneous effects of other firm characteristics. As the results in part C.2 below would show, once those are taken into account, female ownership lowers the probabilities of financial access for Asian firms. C. Empirical Analysis
It is important to note that the statistical observations in the previous section are derived from descriptive statistics from pairs of variables. That is, there could be specific characteristics of firms that vary across countries and region that contributed to the patterns discussed in sections 2.3 and 2.4. To understand whether access to credit is constrained for SMEs, and how various determinants of this access interact with each other, it is thus essential to obtain conditional expectations of the outcome variables while holding a set of explanatory variables constant.
1. Maximum Likelihood Estimations
Thus, to proceed with this empirical exercise, we begin with a parsimonious model to investigate factors that materially affect the probability of firm i's financial access using a univariate binary model: ( | ) ( ) (1) where takes the values 0 or 1 depending on whether the firm was able to access this particular financing facility,15 is a known distribution function, is a known nonstochastic vector, and is a vector of unknown parameters. Assuming that, is the standard normal distribution function, then the likelihood function of the model is given by: ( ) ∑ ( ( ) ( ) ( ( ( )))
(2) It is useful to note that the choice of a normal distribution would not affect the implications of the results. Although the estimated coefficients would differ, the important vector is that of the partial derivatives (Amemiya 1994). Equation (2) is estimated using the maximum likelihood estimation method. For these estimations, contains firm-specific characteristics, including firm age, female participation in ownership, firm size, year, and geographical location.
To explore this, we fit various regression models onto the firm data. In the first set of estimations, maximum likelihood method is used to estimate the likelihood function first using the following parsimonious reduced form: ( ) ∑ ( )
(3)
where is a set of variables pertaining to credit access for firms, including availability; ASIA is a dummy variable for geography and refers to countries within Asia. In addition, firm-level characteristics (Z) include the age of firm, whether the firm exports or ha externally audited financial statements or internationally recognized certification, and whether
15 Similar to previous sections, the three aspects of financial access available are considered: the ownership of a
banking account, the availability of an overdraft facility, or the ability to access a loan or line of credit.
(2)
It is useful to note that the choice of a normal distribution would not affect the implications of the results. Although the estimated
Chapter 2: Bank Lending Efficiency
32
when it comes to account ownership or lines of credit. However, Asian firms with women owners tend to have slightly less access to overdraft facilities (Figure 4). These descriptive statistics have yet to consider the simultaneous effects of other firm characteristics. As the results in part C.2 below would show, once those are taken into account, female ownership lowers the probabilities of financial access for Asian firms. C. Empirical Analysis
It is important to note that the statistical observations in the previous section are derived from descriptive statistics from pairs of variables. That is, there could be specific characteristics of firms that vary across countries and region that contributed to the patterns discussed in sections 2.3 and 2.4. To understand whether access to credit is constrained for SMEs, and how various determinants of this access interact with each other, it is thus essential to obtain conditional expectations of the outcome variables while holding a set of explanatory variables constant.
1. Maximum Likelihood Estimations
Thus, to proceed with this empirical exercise, we begin with a parsimonious model to investigate factors that materially affect the probability of firm i's financial access using a univariate binary model: ( | ) ( ) (1) where takes the values 0 or 1 depending on whether the firm was able to access this particular financing facility,15 is a known distribution function, is a known nonstochastic vector, and is a vector of unknown parameters. Assuming that, is the standard normal distribution function, then the likelihood function of the model is given by: ( ) ∑ ( ( ) ( ) ( ( ( )))
(2) It is useful to note that the choice of a normal distribution would not affect the implications of the results. Although the estimated coefficients would differ, the important vector is that of the partial derivatives (Amemiya 1994). Equation (2) is estimated using the maximum likelihood estimation method. For these estimations, contains firm-specific characteristics, including firm age, female participation in ownership, firm size, year, and geographical location.
To explore this, we fit various regression models onto the firm data. In the first set of estimations, maximum likelihood method is used to estimate the likelihood function first using the following parsimonious reduced form: ( ) ∑ ( )
(3)
where is a set of variables pertaining to credit access for firms, including availability; ASIA is a dummy variable for geography and refers to countries within Asia. In addition, firm-level characteristics (Z) include the age of firm, whether the firm exports or ha externally audited financial statements or internationally recognized certification, and whether
15 Similar to previous sections, the three aspects of financial access available are considered: the ownership of a
banking account, the availability of an overdraft facility, or the ability to access a loan or line of credit.
coefficients would differ, the important vector is that of the partial derivatives δФ/δXi (Amemiya 1985). Equation (2) is estimated using the maximum likelihood estimation method. For these estimations, X contains firm-specific characteristics, including firm age, female participation in ownership, firm size, year, and geographical location.
To explore this, we fit various regression models onto the firm data. In the first set of estimations, maximum likelihood method is used to estimate the likelihood function first using the following parsimonious reduced form:
Chapter 2: Bank Lending Efficiency
32
when it comes to account ownership or lines of credit. However, Asian firms with women owners tend to have slightly less access to overdraft facilities (Figure 4). These descriptive statistics have yet to consider the simultaneous effects of other firm characteristics. As the results in part C.2 below would show, once those are taken into account, female ownership lowers the probabilities of financial access for Asian firms. C. Empirical Analysis
It is important to note that the statistical observations in the previous section are derived from descriptive statistics from pairs of variables. That is, there could be specific characteristics of firms that vary across countries and region that contributed to the patterns discussed in sections 2.3 and 2.4. To understand whether access to credit is constrained for SMEs, and how various determinants of this access interact with each other, it is thus essential to obtain conditional expectations of the outcome variables while holding a set of explanatory variables constant.
1. Maximum Likelihood Estimations
Thus, to proceed with this empirical exercise, we begin with a parsimonious model to investigate factors that materially affect the probability of firm i's financial access using a univariate binary model: ( | ) ( ) (1) where takes the values 0 or 1 depending on whether the firm was able to access this particular financing facility,15 is a known distribution function, is a known nonstochastic vector, and is a vector of unknown parameters. Assuming that, is the standard normal distribution function, then the likelihood function of the model is given by: ( ) ∑ ( ( ) ( ) ( ( ( )))
(2) It is useful to note that the choice of a normal distribution would not affect the implications of the results. Although the estimated coefficients would differ, the important vector is that of the partial derivatives (Amemiya 1994). Equation (2) is estimated using the maximum likelihood estimation method. For these estimations, contains firm-specific characteristics, including firm age, female participation in ownership, firm size, year, and geographical location.
To explore this, we fit various regression models onto the firm data. In the first set of estimations, maximum likelihood method is used to estimate the likelihood function first using the following parsimonious reduced form: ( ) ∑ ( )
(3)
where is a set of variables pertaining to credit access for firms, including availability; ASIA is a dummy variable for geography and refers to countries within Asia. In addition, firm-level characteristics (Z) include the age of firm, whether the firm exports or ha externally audited financial statements or internationally recognized certification, and whether
15 Similar to previous sections, the three aspects of financial access available are considered: the ownership of a
banking account, the availability of an overdraft facility, or the ability to access a loan or line of credit.
(3)
where
Chapter 2: Bank Lending Efficiency
32
when it comes to account ownership or lines of credit. However, Asian firms with women owners tend to have slightly less access to overdraft facilities (Figure 4). These descriptive statistics have yet to consider the simultaneous effects of other firm characteristics. As the results in part C.2 below would show, once those are taken into account, female ownership lowers the probabilities of financial access for Asian firms. C. Empirical Analysis
It is important to note that the statistical observations in the previous section are derived from descriptive statistics from pairs of variables. That is, there could be specific characteristics of firms that vary across countries and region that contributed to the patterns discussed in sections 2.3 and 2.4. To understand whether access to credit is constrained for SMEs, and how various determinants of this access interact with each other, it is thus essential to obtain conditional expectations of the outcome variables while holding a set of explanatory variables constant.
1. Maximum Likelihood Estimations
Thus, to proceed with this empirical exercise, we begin with a parsimonious model to investigate factors that materially affect the probability of firm i's financial access using a univariate binary model: ( | ) ( ) (1) where takes the values 0 or 1 depending on whether the firm was able to access this particular financing facility,15 is a known distribution function, is a known nonstochastic vector, and is a vector of unknown parameters. Assuming that, is the standard normal distribution function, then the likelihood function of the model is given by: ( ) ∑ ( ( ) ( ) ( ( ( )))
(2) It is useful to note that the choice of a normal distribution would not affect the implications of the results. Although the estimated coefficients would differ, the important vector is that of the partial derivatives (Amemiya 1994). Equation (2) is estimated using the maximum likelihood estimation method. For these estimations, contains firm-specific characteristics, including firm age, female participation in ownership, firm size, year, and geographical location.
To explore this, we fit various regression models onto the firm data. In the first set of estimations, maximum likelihood method is used to estimate the likelihood function first using the following parsimonious reduced form: ( ) ∑ ( )
(3)
where is a set of variables pertaining to credit access for firms, including availability; ASIA is a dummy variable for geography and refers to countries within Asia. In addition, firm-level characteristics (Z) include the age of firm, whether the firm exports or ha externally audited financial statements or internationally recognized certification, and whether
15 Similar to previous sections, the three aspects of financial access available are considered: the ownership of a
banking account, the availability of an overdraft facility, or the ability to access a loan or line of credit.
is a set of variables pertaining to credit access for firms, including availability; ASIA is a dummy variable for geography and refers to countries within Asia. In addition, firm-level characteristics (Z) include the age of firm, whether the firm exports or ha externally audited financial statements or internationally recognized certification, and whether there is any female participation in the ownership of the firm. Geographical fixed effects are accounted for through individual country-year dummy variables. Given our choice of a probit model, the interpretation of the coefficients is straightforward: a statistical significant estimate of
Chapter 2: Bank Lending Efficiency
33
there is any female participation in the ownership of the firm. Geographical fixed effects are accounted for through individual country-year dummy variables. Given our choice of a probit model, the interpretation of the coefficients is straightforward: a statistical significant estimate of ̂k means that the variable contributed to the probability of the firm’s access to finance by ̂%.
2. Results
Table 3 presents the results from the pooled data. The main results from the regression confirm the first observation that SMEs in general are less likely to have access to the three types of banking services discussed earlier.16 The lack of access is more acute for small firms than medium-sized ones and remained significant even after accounting for sector and country effects. Although Asian firms also access less financial services, there appears to be no significant difference in the relative gap between large Asian SME Asian firms and large non-Asian SME firms. In the pooled model, the interaction term between firm size and Asia was statistically insignificant. Tables 4–6 present the results for Asia and non-Asia separately (columns 3 and 6 in each table). The following are three highlights from the results which take into account fixed effects of geography and sectors:
Female firm ownership in Asia is negatively correlated with the probability of having bank accounts and having overdraft. In particular, having at least one female owner is associated with a 3.0% reduction in probability of having bank accounts, and a 8.5% reduction in probability of having an overdraft facility.
Engaging in exporting activities is associated with an increase of up to 10% in the probability of accessing bank services. The effect of exporting is roughly similar for firms in Asian and non-Asian economies.
Having an externally audited financial statement is correlated with up to a 14% increase in probability of accessing bank services. The effect is more pronounced for SMEs in Asia, in line with the unconditional observation that these are the firms that receive the least banking services and that external auditing would attenuate the issue of asymmetric information that has been the issue for banking access for small firms.
D. Conclusions and Policy Implications
SMEs in Asia receive less credit than other non-Asian SMEs. While they do raise the issue of financing access less than non-Asian counterparts, they also invest at about half the rate of non-Asian SMEs. Results from multivariate models suggest that credit access is correlated strongly with firm size, with small firms enjoying the least access. The results also suggest that exporting and having an externally audited financial statement are positively correlated with increased credit access, while having a women owner is associated with a reduction in the probability of financial access. Thus, addressing credit needs for Asian SMEs achieves several facets of financial inclusion goals. It would help Asian SMEs access credit, and that in turn would likely increase the rate of investment of these Asian SMEs. In addition, given the high rate of female participation in the ownership of Asian SMEs, increasing access to these firms would also support gender equality in the region. Given the prominent role of state-owned banks in SME lending in Asia, increasing 16 The model does not claim causality. However, statistical significance for estimated coefficients suggests that the
variable is correlated with the dependent variable.
means that the variable contributed to the probability of the firm’s access to finance by
Chapter 2: Bank Lending Efficiency
33
there is any female participation in the ownership of the firm. Geographical fixed effects are accounted for through individual country-year dummy variables. Given our choice of a probit model, the interpretation of the coefficients is straightforward: a statistical significant estimate of ̂k means that the variable contributed to the probability of the firm’s access to finance by ̂%.
2. Results
Table 3 presents the results from the pooled data. The main results from the regression confirm the first observation that SMEs in general are less likely to have access to the three types of banking services discussed earlier.16 The lack of access is more acute for small firms than medium-sized ones and remained significant even after accounting for sector and country effects. Although Asian firms also access less financial services, there appears to be no significant difference in the relative gap between large Asian SME Asian firms and large non-Asian SME firms. In the pooled model, the interaction term between firm size and Asia was statistically insignificant. Tables 4–6 present the results for Asia and non-Asia separately (columns 3 and 6 in each table). The following are three highlights from the results which take into account fixed effects of geography and sectors:
Female firm ownership in Asia is negatively correlated with the probability of having bank accounts and having overdraft. In particular, having at least one female owner is associated with a 3.0% reduction in probability of having bank accounts, and a 8.5% reduction in probability of having an overdraft facility.
Engaging in exporting activities is associated with an increase of up to 10% in the probability of accessing bank services. The effect of exporting is roughly similar for firms in Asian and non-Asian economies.
Having an externally audited financial statement is correlated with up to a 14% increase in probability of accessing bank services. The effect is more pronounced for SMEs in Asia, in line with the unconditional observation that these are the firms that receive the least banking services and that external auditing would attenuate the issue of asymmetric information that has been the issue for banking access for small firms.
D. Conclusions and Policy Implications
SMEs in Asia receive less credit than other non-Asian SMEs. While they do raise the issue of financing access less than non-Asian counterparts, they also invest at about half the rate of non-Asian SMEs. Results from multivariate models suggest that credit access is correlated strongly with firm size, with small firms enjoying the least access. The results also suggest that exporting and having an externally audited financial statement are positively correlated with increased credit access, while having a women owner is associated with a reduction in the probability of financial access. Thus, addressing credit needs for Asian SMEs achieves several facets of financial inclusion goals. It would help Asian SMEs access credit, and that in turn would likely increase the rate of investment of these Asian SMEs. In addition, given the high rate of female participation in the ownership of Asian SMEs, increasing access to these firms would also support gender equality in the region. Given the prominent role of state-owned banks in SME lending in Asia, increasing 16 The model does not claim causality. However, statistical significance for estimated coefficients suggests that the
variable is correlated with the dependent variable.
%.
2. ResultsTable 9 presents the results from the pooled data. The main results from the regression confirm the first observation that SMEs in general are less likely to have access to the three types of banking services discussed earlier.21 The lack of access is more acute for small firms than medium-sized ones and remained significant even after accounting for sector and country effects. Although Asian firms also access less financial services, there appears to be no significant difference in the relative gap between large Asian SME firms and large non-Asian SME firms. In the pooled model, the interaction term between firm size and Asia was statistically insignificant.
Tables 10–12 present the results for Asia and non-Asia separately (columns 3 and 6 in each table). The following are three highlights from the results which take into account fixed effects of geography and sectors:
• Female firm ownership in Asia is negatively correlated with the probability of having bank accounts and having overdraft. In particular, having at least one female owner
21 The model does not claim causality. However, statistical significance for estimated coefficients suggests that the variable is correlated with the dependent variable.
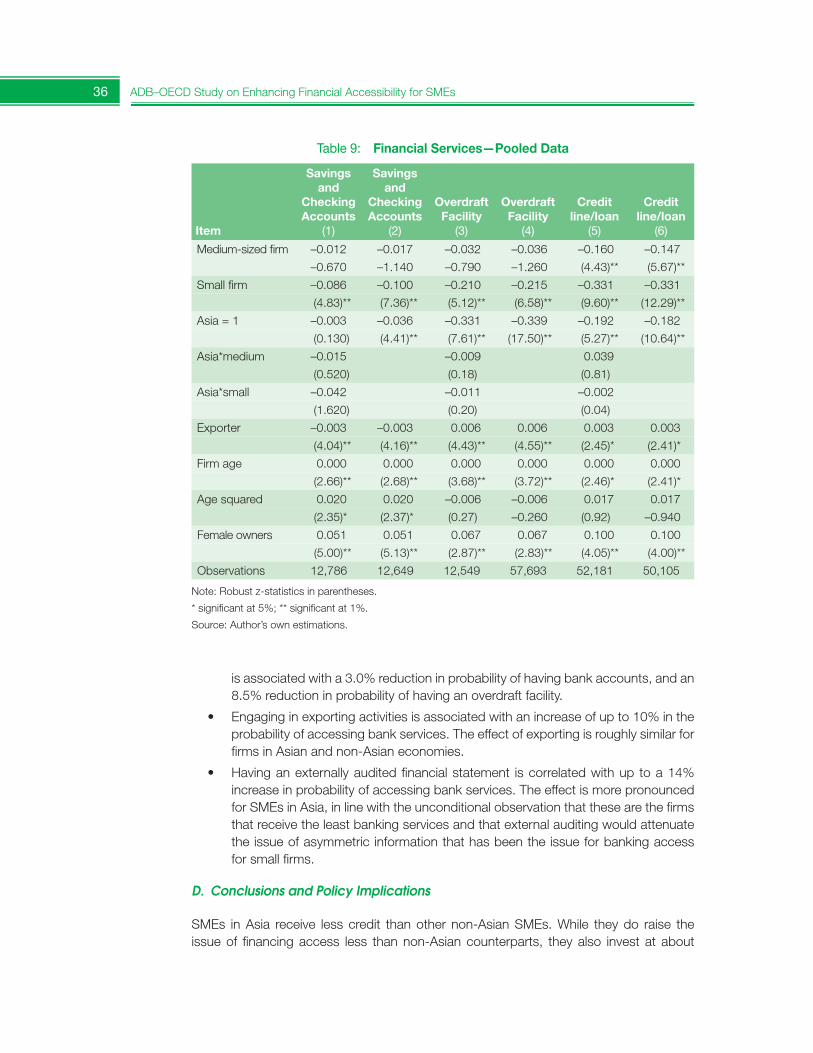
36 ADB–OECD Study on Enhancing Financial Accessibility for SMEs
Table 9: Financial Services—Pooled Data
Item
Savings and
Checking Accounts
(1)
Savings and
Checking Accounts
(2)
Overdraft Facility
(3)
Overdraft Facility
(4)
Credit line/loan
(5)
Credit line/loan
(6)
Medium-sized firm –0.012 –0.017 –0.032 –0.036 –0.160 –0.147
–0.670 –1.140 –0.790 –1.260 (4.43)** (5.67)**
Small firm –0.086 –0.100 –0.210 –0.215 –0.331 –0.331
(4.83)** (7.36)** (5.12)** (6.58)** (9.60)** (12.29)**
Asia = 1 –0.003 –0.036 –0.331 –0.339 –0.192 –0.182
(0.130) (4.41)** (7.61)** (17.50)** (5.27)** (10.64)**
Asia*medium –0.015 –0.009 0.039
(0.520) (0.18) (0.81)
Asia*small –0.042 –0.011 –0.002
(1.620) (0.20) (0.04)
Exporter –0.003 –0.003 0.006 0.006 0.003 0.003
(4.04)** (4.16)** (4.43)** (4.55)** (2.45)* (2.41)*
Firm age 0.000 0.000 0.000 0.000 0.000 0.000
(2.66)** (2.68)** (3.68)** (3.72)** (2.46)* (2.41)*
Age squared 0.020 0.020 –0.006 –0.006 0.017 0.017
(2.35)* (2.37)* (0.27) –0.260 (0.92) –0.940
Female owners 0.051 0.051 0.067 0.067 0.100 0.100
(5.00)** (5.13)** (2.87)** (2.83)** (4.05)** (4.00)**
Observations 12,786 12,649 12,549 57,693 52,181 50,105
Note: Robust z-statistics in parentheses.
* significant at 5%; ** significant at 1%.
Source: Author’s own estimations.
is associated with a 3.0% reduction in probability of having bank accounts, and an 8.5% reduction in probability of having an overdraft facility.
• Engaging in exporting activities is associated with an increase of up to 10% in the probability of accessing bank services. The effect of exporting is roughly similar for firms in Asian and non-Asian economies.
• Having an externally audited financial statement is correlated with up to a 14% increase in probability of accessing bank services. The effect is more pronounced for SMEs in Asia, in line with the unconditional observation that these are the firms that receive the least banking services and that external auditing would attenuate the issue of asymmetric information that has been the issue for banking accessfor small firms.
D. Conclusions and Policy Implications
SMEs in Asia receive less credit than other non-Asian SMEs. While they do raise the issue of financing access less than non-Asian counterparts, they also invest at about
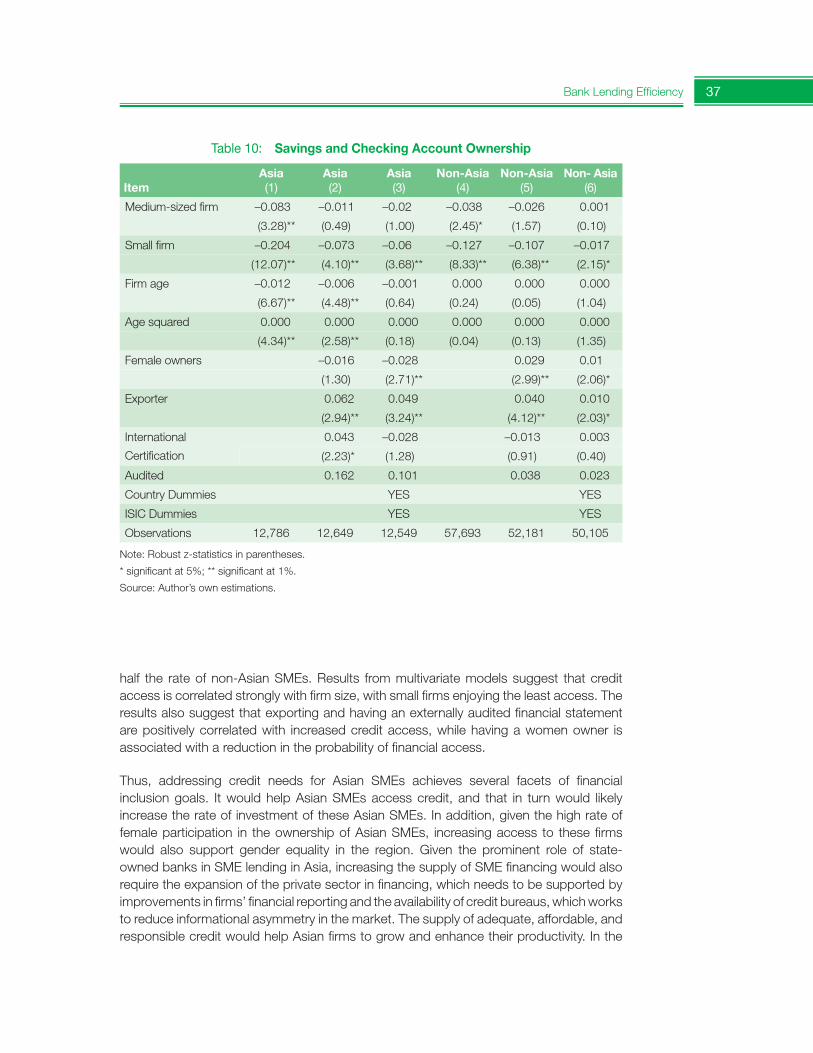
Bank Lending Efficiency 37
Table 10: Savings and Checking Account Ownership
ItemAsia(1)
Asia(2)
Asia(3)
Non-Asia(4)
Non-Asia(5)
Non- Asia(6)
Medium-sized firm –0.083 –0.011 –0.02 –0.038 –0.026 0.001
(3.28)** (0.49) (1.00) (2.45)* (1.57) (0.10)
Small firm –0.204 –0.073 –0.06 –0.127 –0.107 –0.017
(12.07)** (4.10)** (3.68)** (8.33)** (6.38)** (2.15)*
Firm age –0.012 –0.006 –0.001 0.000 0.000 0.000
(6.67)** (4.48)** (0.64) (0.24) (0.05) (1.04)
Age squared 0.000 0.000 0.000 0.000 0.000 0.000
(4.34)** (2.58)** (0.18) (0.04) (0.13) (1.35)
Female owners –0.016 –0.028 0.029 0.01
(1.30) (2.71)** (2.99)** (2.06)*
Exporter 0.062 0.049 0.040 0.010
(2.94)** (3.24)** (4.12)** (2.03)*
International
Certification
0.043 –0.028 –0.013 0.003
(2.23)* (1.28) (0.91) (0.40)
Audited 0.162 0.101 0.038 0.023
Country Dummies YES YES
ISIC Dummies YES YES
Observations 12,786 12,649 12,549 57,693 52,181 50,105
Note: Robust z-statistics in parentheses.
* significant at 5%; ** significant at 1%.
Source: Author’s own estimations.
half the rate of non-Asian SMEs. Results from multivariate models suggest that credit access is correlated strongly with firm size, with small firms enjoying the least access. The results also suggest that exporting and having an externally audited financial statement are positively correlated with increased credit access, while having a women owner is associated with a reduction in the probability of financial access.
Thus, addressing credit needs for Asian SMEs achieves several facets of financial inclusion goals. It would help Asian SMEs access credit, and that in turn would likely increase the rate of investment of these Asian SMEs. In addition, given the high rate of female participation in the ownership of Asian SMEs, increasing access to these firms would also support gender equality in the region. Given the prominent role of state-owned banks in SME lending in Asia, increasing the supply of SME financing would also require the expansion of the private sector in financing, which needs to be supported by improvements in firms’ financial reporting and the availability of credit bureaus, which works to reduce informational asymmetry in the market. The supply of adequate, affordable, and responsible credit would help Asian firms to grow and enhance their productivity. In the
38 ADB–OECD Study on Enhancing Financial Accessibility for SMEs
Table 11: Access to Overdraft Facility
ItemAsia(1)
Asia(2)
Asia(3)
Non-Asia(4)
Non-Asia(5)
Non-Asia(6)
Medium-sized firm –0.058 –0.023 –0.031 –0.074 –0.05 –0.05
(2.51)* (0.96) (1.37) (1.87) (1.27) (1.21)
Small firm –0.247 –0.139 –0.189 –0.28 –0.24 –0.218
(8.25)** (3.96)** (5.94)** (7.44)** (6.16)** (5.11)**
Firm age –0.004 0.000 0.001 0.010 0.009 0.003
(1.20) (0.10) (0.60) (6.69)** (6.18)** (1.86)
Age squared 0.000 0.000 0.000 0.000 0.000 0.000
(1.30) (0.43) (0.48) (5.28)** (5.05)** (1.79)
Female owners –0.086 –0.085 0.047 0.028
(2.93)** (3.16)** (2.08)* (1.39)
Exporter 0.034 0.060 0.090 0.062
(1.20) (2.11)* (3.55)** (2.27)*
International
Certification
0.061 0.048 0.048 0.033
(1.74) (1.54) (1.56) (1.06)
Audited 0.168 0.132 0.017 0.046
(5.36)** (4.39)** (0.81) (1.77)
Country Dummies YES YES
ISIC Dummies YES YES
Observations 12,786 12,649 12,549 57,693 52,181 50,105
Note: Robust z-statistics in parentheses.
* significant at 5%; ** significant at 1%.
Source: Author’s own estimations.
long run, this would translate into higher wages for workers and contribute to inclusive growth in the region.
References
Amemiya, T. 1985. Advanced Econometrics. Cambridge: Harvard University Press.
Asian Development Bank (ADB). 2009. Enterprises in Asia: Fostering Dynamism in SMEs. Special Chapter of Key Indicators for Asia and the Pacific 2009. Manila.
Ayyagari, M., A. Demirgüç-Kunt, and V. Maksimovic. 2008. How Important Are Financing Constraints? The Role of Finance in The Business Environment. World Bank Economic Review, Vol. 22 (3), pp. 483–516.
Beck, T. and A. Demirgüç-Kunt. 2006. Small and Medium-size Enterprises: Access to Finance as Growth Constraint. Journal of Banking and Finance, 30:2, 931–43.
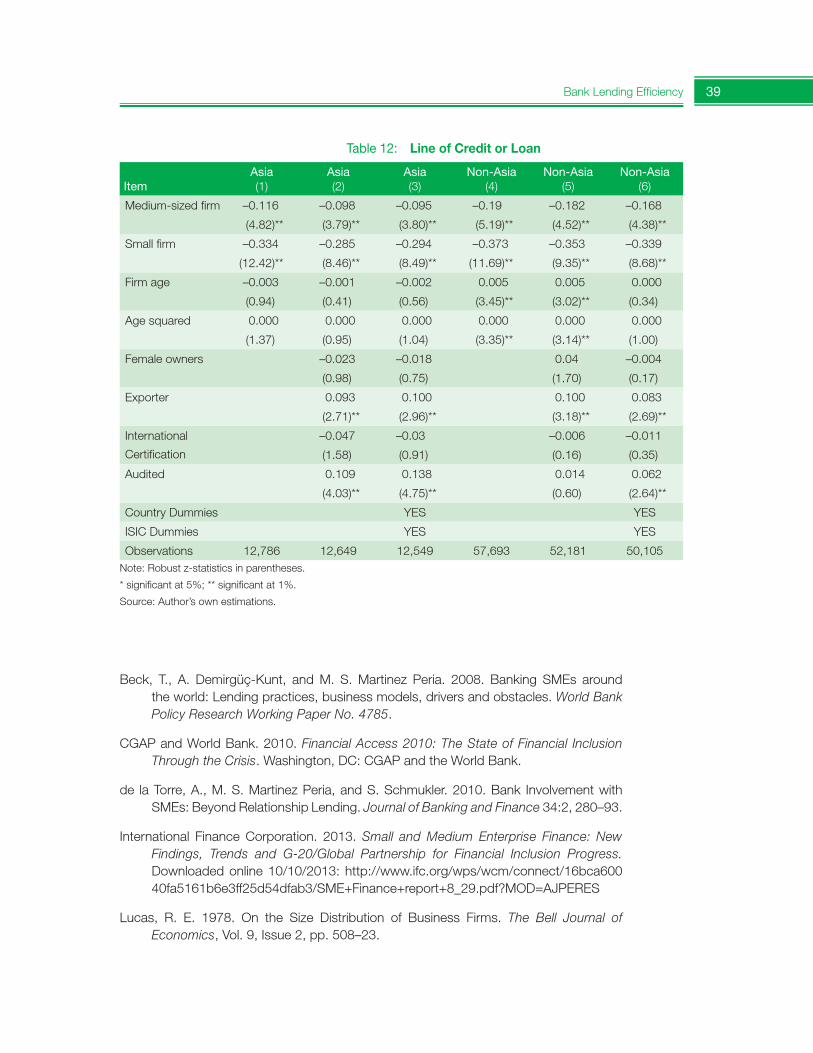
Bank Lending Efficiency 39
Table 12: Line of Credit or Loan
ItemAsia(1)
Asia(2)
Asia(3)
Non-Asia(4)
Non-Asia(5)
Non-Asia(6)
Medium-sized firm –0.116 –0.098 –0.095 –0.19 –0.182 –0.168
(4.82)** (3.79)** (3.80)** (5.19)** (4.52)** (4.38)**
Small firm –0.334 –0.285 –0.294 –0.373 –0.353 –0.339
(12.42)** (8.46)** (8.49)** (11.69)** (9.35)** (8.68)**
Firm age –0.003 –0.001 –0.002 0.005 0.005 0.000
(0.94) (0.41) (0.56) (3.45)** (3.02)** (0.34)
Age squared 0.000 0.000 0.000 0.000 0.000 0.000
(1.37) (0.95) (1.04) (3.35)** (3.14)** (1.00)
Female owners –0.023 –0.018 0.04 –0.004
(0.98) (0.75) (1.70) (0.17)
Exporter 0.093 0.100 0.100 0.083
(2.71)** (2.96)** (3.18)** (2.69)**
International
Certification
–0.047 –0.03 –0.006 –0.011
(1.58) (0.91) (0.16) (0.35)
Audited 0.109 0.138 0.014 0.062
(4.03)** (4.75)** (0.60) (2.64)**
Country Dummies YES YES
ISIC Dummies YES YES
Observations 12,786 12,649 12,549 57,693 52,181 50,105Note: Robust z-statistics in parentheses.
* significant at 5%; ** significant at 1%.
Source: Author’s own estimations.
Beck, T., A. Demirgüç-Kunt, and M. S. Martinez Peria. 2008. Banking SMEs around the world: Lending practices, business models, drivers and obstacles. World Bank Policy Research Working Paper No. 4785.
CGAP and World Bank. 2010. Financial Access 2010: The State of Financial Inclusion Through the Crisis. Washington, DC: CGAP and the World Bank.
de la Torre, A., M. S. Martinez Peria, and S. Schmukler. 2010. Bank Involvement withSMEs: Beyond Relationship Lending. Journal of Banking and Finance 34:2, 280–93.
International Finance Corporation. 2013. Small and Medium Enterprise Finance: New Findings, Trends and G-20/Global Partnership for Financial Inclusion Progress. Downloaded online 10/10/2013: http://www.ifc.org/wps/wcm/connect/16bca60040fa5161b6e3ff25d54dfab3/SME+Finance+report+8_29.pdf?MOD=AJPERES
Lucas, R. E. 1978. On the Size Distribution of Business Firms. The Bell Journal of Economics, Vol. 9, Issue 2, pp. 508–23.
40 ADB–OECD Study on Enhancing Financial Accessibility for SMEs
Oi, W.Y. and T. L. Idson. 1999. Firm Size and Wages. In Handbook of Labour Economics, 3, edited by O. Ashenfelter and D. Card. North Holland, Amsterdam, pp. 2, 166–244.
Tacneng, R., R. Jacildo, and N. Khor. 2013. Banking the SMEs in the Philippines. ADB Economics Research Department Working Paper.
World Bank. World Bank Enterprise Surveys. (http://www.enterprisesurveys.org, last accessed 10 September 2013).
Bank Lending Efficiency 41
2.1.2. SME Data Infrastructure and Challenges
This section outlines the methodology of the OECD’s Scoreboard on Financing SMEs and Entrepreneurs, detailing the methodology used for its build-up and the challenges faced in the process. It interprets the data on SME financing, their limitations, and the impact of definitions. The section also presents the core indicators used in the OECD Scoreboard to monitor debt and equity financing, SME solvency, and government policy measures to support SME access to finance. Limitations to cross-country comparability and recommendations for the improvement of data collection are highlighted.22
A. Background
The OECD Bologna Charter on SME Policies, adopted by about 50 countries at the 1st OECD Ministerial Conference on SMEs, recognizes that
SME competitiveness would benefit from…effective access to financial services, particularly to seed, working and development capital, including innovative financial instruments to reduce the risks and transaction costs of lending to SMEs. (Bologna 2000)
Access to finance for SMEs and entrepreneurs has since built up into a key area ofwork for the OECD Working Party on SMEs and Entrepreneurship, a high-level international forum for SME policy makers who work to promote entrepreneurship and advance the performance of small businesses by reviewing issues and diffusing best practice policies.
At the OECD Global Conference on Better Financing for Entrepreneurship and SME Growth held in Brasilia in March 2006, participants recognized in the OECD Brasilia Action Statement for SMEs and Entrepreneurship Financing that a “lackof data impedes a complete analysis of the financial situation of SMEs in OECDcountries.” It urged the OECD to take the lead in developing better data and statistical information, thereby allowing the establishment of international benchmarks tofacilitate comparisons of the relative performance of markets in providing financing to SMEs and entrepreneurs; and to shed light on outstanding financing gaps and issues (OECD 2006e).
Likewise, in the OECD report (2009), it was emphasized that “…policy makers need more timely and SME specific data on the supply and demand for financing so that they can determine if their measures are working.”
In the wake of the global crisis, the OECD working party has addressed the urgent challenge of developing a framework for monitoring SME financing trends and needs and for assessing the effectiveness of policies supporting the access of SMEs and entrepreneurs to finance. In fact, the global financial crisis has once more seriously highlighted that the lack of appropriate data is a critical obstacle for policy makers and
22 Section based on Chapter 1 and Annex 1 of: OECD (2013).
42 ADB–OECD Study on Enhancing Financial Accessibility for SMEs
stakeholders in designing adequate policy responses in this area. This was in line with the recommendations of the OECD Brasilia Action Statement and, in order to respond to the urgency, the OECD launched a pilot project, the OECD Scoreboard on Financing SMEs and Entrepreneurs, in 2010 to present the situation with regard to the access of SMEs and entrepreneurs to financing during the crisis.
The OECD efforts to develop data and statistical information on the access of SMEs and entrepreneurs to finance also addresses the G-2023 call for more and better data, and international benchmarks on the financial situation of SMEs. The importance of SME finance was recognized at the Pittsburgh summit in 2009, where G-20 leadersacknowledged that such finance provides growth opportunities for businesses and the economy as a whole. Financial inclusion is a pillar of the G-20 Multi-Year Action Plan on Development, and the G-20 Global Platform for Financial Inclusion was launched in the Republic of Korea in December 2010. The need to address the financing hurdles to SME growth was also underlined by G-824 leaders at the 2011 Deauville summit, where the OECD was invited, in cooperation with other international institutions, to identify impediments to SME growth.
Better data can improve understanding of business financing needs and provide a sound basis for informed policy discussions, as well as give the suppliers of finance a more comprehensive assessment of their clients’ needs that enables them to design better products and services.
B. The OECD Scoreboard on Financing SMEs and Entrepreneurs
1. The Importance of Data Collection Data are required on SME and entrepreneurship financing for a number of reasons. First, better data can improve the understanding of business financing needs and therefore provide a basis for a better informed public discussion. Second, better data can give the suppliers of finance a more comprehensive understanding of their clients’ needs, enabling them to design better products and services. Third, better data can facilitate policy makers’ assessments of whether firms’ financing needs are being met and help with evaluating the effectiveness of government policies and programs.
During the recent financial crisis, the information gap on SME access to finance became readily apparent in that actual financial flows to SMEs and entrepreneurs could not be adequately measured and therefore monitored. One of the reasons is that credit flow statistics are generally compiled on the basis of loan size rather than firm size. The OECDScoreboard intends to fill this gap and provide a systematic framework for analyzingnot only the financial situation of SMEs but also the policy responses and their ultimate impact on SME survival and national employment. Rather than taking a snapshot in time,
23 The Group of Twenty (G-20) is a group of finance ministers and central bank governors from 20 major economies: 19 countries plus the European Union, which is represented by the President of the European Council and by the European Central Bank.
24 The Group of Eight (G-8) is a forum for the governments of a group of eight leading industrialized countries: Canada, France, Germany, Italy, Japan, Russia, United Kingdom, and United States.
Bank Lending Efficiency 43
the OECD Scoreboard focuses on the changing conditions over time and on analyzing government reactions. The OECD Scoreboard was undertaken with one principal objective in mind, i.e., to provide policy makers with the information they need about SME access to finance in the long-term so that they could formulate better policy responses. The initiative was not undertaken to have better data for its own sake. Nevertheless, itbecame apparent that better and timelier data could lead to better policy responses both now and in the future.
2. Building the Scoreboard—ObjectivesThe first stage of the OECD Scoreboard on Financing SMEs and Entrepreneurs was the Pilot OECD Scoreboard (OECD 2010), built with the aim of presenting a number of comparable indicators for the group of countries that agreed to participate in this initial stage of work—Canada, Finland, France, Italy, the Republic of Korea, the Netherlands, New Zealand, Sweden, Switzerland, Thailand, and the United States. The pilot Scoreboard was developed over an 18-month period which included the conceptualization and testing of the most readily available and meaningful indicators on SME access to finance as well as actual data collection for these indicators for 3 years: 2007 (precrisis) and 2008 and 2009 (the crisis years); 2007 served as the benchmark year from which changes in SME access to finance could be measured in 2008 and 2009. The purpose of the OECDScoreboard is threefold:
(i) To develop a tool for policy makers, consisting of a select number of core indicators which reveal the real situation of SMEs in terms of access to finance, and allow them to judge the effectiveness of their policies.
(ii) To assist OECD member and nonmember countries to monitor, report on, and discuss the indicators of SME financing trends on a regular basis across countries, identifying good policies and practices.
(iii) To serve as a framework and guide for governments on how to assemble meaningful indicators of SME access to finance.
In addition, the development of the OECD Scoreboard and its indicators are instrumental in improving the comparability of SME data, and increase cooperative efforts across countries and institutions to harmonize definitions, data collection methods, and time frames.
C. Core Indicators on SME Financing
1. Criteria for the Selection of Core Indicators The greatest challenge at the early stages of the OECD Scoreboard was to find the data for SME lending and to define a limited set of meaningful indicators to allow quick monitoring of financing conditions over time. A number of criteria were defined and used to select the indicators and a process of data collection was set out early in the process. The purpose of the creation of the OECD Scoreboard was to introduce a framework that can monitor SME access to finance over time. To that end, the indicators assembled should not only be the most easily obtainable indicators but also the most useful ones which give a coherent view of the situation regarding SME access to finance and policy responses.
44 ADB–OECD Study on Enhancing Financial Accessibility for SMEs
Several criteria were used to select the core indicators for the OECD Scoreboard in order to achieve the three main objectives discussed earlier. The criteria were usefulness, availability, feasibility, timeliness, and comparability.
(i) The usefulness of SME financing indicators is critical because the indicators must be able to measure how easy or difficult it is for SMEs to access finance and to help policy makers formulate or adjust their policies and programs.
(ii) The data for constructing the indicators should be readily available in order not to impose new burdens on governments.
(iii) Often the information for constructing the indicator is not publicly available but it is feasible to make it available at a modest cost. In other cases the information could be collected during routine data exercises or surveys.
(iv) The information should also be collected in a timely manner so that the situation of SMEs can be monitored. This means that annual or quarterly data are needed. In many cases, turning points can be better captured by quarterly data and so they are more useful than annual data which might not show when a trend has changed and intervention is necessary. Some countries are downsizing their periodic surveys so that they can be administered on a quarterly basis.
(v) For the purposes of the OECD Scoreboard, the indicators should be comparable. This is probably the greatest challenge. The indicators and variables must be relatively uniform across countries in terms of the population surveyed, content,method of data collection, and periodicity or timeliness.
Using the above criteria, 13 indicators were identified (Table 13).
One of the criteria for selection was that the indicator should be useful to policy makers. Each of the core indicators tells policy makers something useful in terms of measuring and gauging the impact of the SME financing gap and in answering specific questions, such as the following:
• What is the allocation of credit in the country by size of firm?
• How much credit goes to investment (growth) versus operational expenses (survival)?
• Does the supply of credit match the SME demand for credit?
• How large is the unmet demand for credit and does this constitute a serious financing gap?
• Do SMEs face tighter credit conditions than larger firms? Are credit conditions becoming more onerous for them?
• What percentage of SMEs loans are government guaranteed?
• What is the uptake of government guarantee programs by banks? What is theleverage ratio of such programs?
• What role does venture capital play in SME financing?
• What do payment delays and bankruptcies indicate in terms of the ability of SMEs to survive economic downturns and credit crunches?
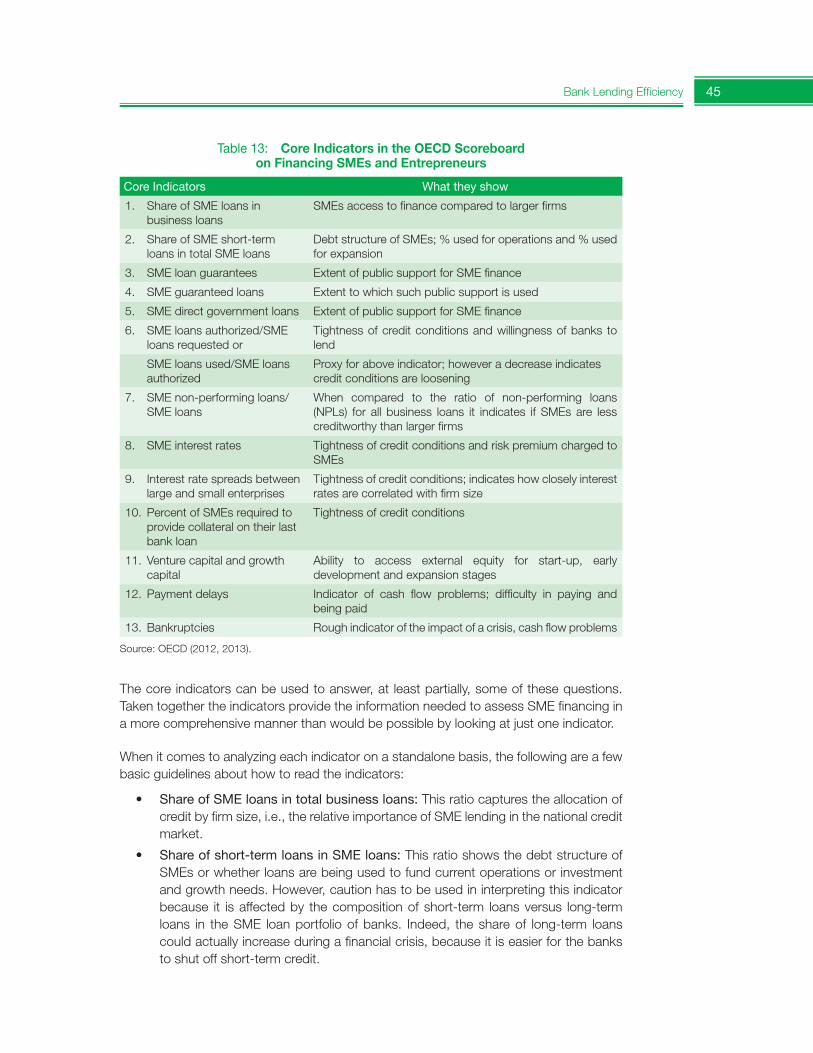
Bank Lending Efficiency 45
The core indicators can be used to answer, at least partially, some of these questions. Taken together the indicators provide the information needed to assess SME financing in a more comprehensive manner than would be possible by looking at just one indicator.
When it comes to analyzing each indicator on a standalone basis, the following are a few basic guidelines about how to read the indicators:
• Share of SME loans in total business loans: This ratio captures the allocation of credit by firm size, i.e., the relative importance of SME lending in the national credit market.
• Shareofshort-termloansinSMEloans: This ratio shows the debt structure of SMEs or whether loans are being used to fund current operations or investment and growth needs. However, caution has to be used in interpreting this indicator because it is affected by the composition of short-term loans versus long-term loans in the SME loan portfolio of banks. Indeed, the share of long-term loans could actually increase during a financial crisis, because it is easier for the banks to shut off short-term credit.
Table 13: Core Indicators in the OECD Scoreboard on Financing SMEs and Entrepreneurs
Core Indicators Whattheyshow
1. Share of SME loans in business loans
SMEs access to finance compared to larger firms
2. Share of SME short-term loans in total SME loans
Debt structure of SMEs; % used for operations and % used for expansion
3. SME loan guarantees Extent of public support for SME finance
4. SME guaranteed loans Extent to which such public support is used
5. SME direct government loans Extent of public support for SME finance
6. SME loans authorized/SME loans requested or
Tightness of credit conditions and willingness of banks to lend
SME loans used/SME loans authorized
Proxy for above indicator; however a decrease indicates credit conditions are loosening
7. SME non-performing loans/SME loans
When compared to the ratio of non-performing loans (NPLs) for all business loans it indicates if SMEs are less creditworthy than larger firms
8. SME interest rates Tightness of credit conditions and risk premium charged to SMEs
9. Interest rate spreads between large and small enterprises
Tightness of credit conditions; indicates how closely interest rates are correlated with firm size
10. Percent of SMEs required to provide collateral on their last bank loan
Tightness of credit conditions
11. Venture capital and growth capital
Ability to access external equity for start-up, early development and expansion stages
12. Payment delays Indicator of cash flow problems; difficulty in paying and being paid
13. Bankruptcies Rough indicator of the impact of a crisis, cash flow problems
Source: OECD (2012, 2013).
46 ADB–OECD Study on Enhancing Financial Accessibility for SMEs
• SMEgovernmentloanguarantees,SMEgovernment-guaranteedloans,SMEdirect government loans: These indicators show the extent of public support for the financing of SMEs in the form of direct funding or credit guarantees. By comparing government loan guarantees with guaranteed loans, information can be drawn on the take up of government programs and on their leverage effect.
• SMEauthorizedloanstoSMErequestedloans: This indicator shows the degree to which SME credit demand is met. A decrease in the ratio indicates a tightening in the credit market. It also provides information about the rejection rate for SMEloans. A limitation in this indicator is that it omits the impact of discouraged borrowers. However, discouragement and rejection are closely correlated. During economic downturns, as SME turnover declines and loans become riskier, loan authorizations decrease. At the same time, SME loan requests could also decrease because of the discouraged borrower effect. However, surveys seem to suggest that discouraged borrowers are only a small share of the SME population, so that in difficult times the ratio would still decline.
• SME loans used to SME loans authorized: This ratio is used as a proxy by some countries for the previous indicator. It shows the willingness of the banks to provide credit. However, in contrast with the previous ratio, a decrease in this ratio indicates that credit conditions are loosening because not all credit authorized is being used.
• SME nonperforming loans to SME loans: This indicator provides information about the relative performance of SME loans in banks’ portfolios, i.e., the riskiness implied by exposure to SME loans. It can be compared with the overall ratio of nonperforming loans to all business loans to determine whether SMEs are less creditworthy.
• SME interest rates and interest rate spreads: These indicators describe the tightness of the market and the (positive or negative) correlation of interest rates with firm size.
• Collateralrequired: This indicator shows tightness of credit conditions. It is based on demand-side surveys where SMEs report if they have been required to provide collateral for their last loan. It is not available from supply-side sources, as banksdo not generally divulge this information.
• Venture capital and growth capital: This indicator shows the ability to access external equity in the form of seed, start-up, or early stage venture capital as well as expansion capital. It excludes buyouts, turnarounds, and replacement capital, as these are directed at restructuring and generally concern larger enterprises.
• Paymentdelays: This indicator contributes to assess SME cash flow problems. If the delay is business-to-customer, it reveals difficulties in SMEs being paid by their clients; if it is business-to-business, it shows supplier credit delays and how SMEs are coping with cash flow problems by delaying their payments. The higher the business-to-business delay compared to business-to-customer, the more relief to cash flow problems. At present, the countries report one or the other indicator, but in the future both indicators will be collected to allow this comparison.
• SME bankruptcies or bankruptcies per 1,000 or 10,000 SMEs: This indicator is a proxy for SME survival prospects. Abrupt changes in bankruptcy rates demonstrate
Bank Lending Efficiency 47
how severely SMEs are affected by economic crises. However, the indicator likely underestimates the number of SME exits, as some SMEs close their business before being in financial difficulties. Bankruptcies per 1,000 or 10,000 SMEs is the preferred measure, because the indicator is not affected by the increase or decrease in the number of enterprises in the economy.
The true value of the OECD Scoreboard is that it allows indicators to be examined as a set and this is more effective than looking at the indicators one by one. Having them side by side allows a more coherent picture of SME access to financing to be formed and it allows governments to formulate appropriate responses. The OECD Scoreboard also provides significant insights into patterns of SME financing across time for participating countries, allowing participants to observe trends over time on access to finance for SMEs and entrepreneurs. This is particularly useful also as a means of evaluating policy responses undertaken in previous years and the decision, among other things, on the appropriate timing for the phasing out of measures already in place or the retaining of those that are still deemed as necessary.
D. Process of Data Collection
Data on SME financing are collected in two ways:
(i) Administrative data or records of actual transactions collected by government agencies from the suppliers of SME finance. There are some cases, however, where quantitative surveys are undertaken and the information is distinct fromthe administrative data. Quantitative data are more consistent, verifiable, and generally classified as supply-side data.
(ii) Surveys of SMEs (demand-side surveys) and bank loan officers and equity fund members (supply-side surveys) undertaken by government agencies, business associations, and investors’ associations. This information is usually qualitative and is based on estimates or opinions and so is hard to verify. Some governments and regional banks do undertake quantitative demand-side surveys. If every country had quantitative demand-side surveys much uncertainty could be avoided.
Experience shows that qualitative information based on opinion survey responses must be used cautiously as it often appears to be contradictory. For example, supply-side surveys of senior loan officers sometimes show demand for credit decreasing while at the same time demand-side surveys show SMEs’ need for credit increasing. The size of the sample population also affects how representative the survey results are. It is preferable to collect transaction-based data and use opinion survey responses as supplementary, until the time that such surveys are standardized and their reliability is tested across the board.
1. Use of Country Experts Each country participating in the Scoreboard assigns a country expert who has access to the information needed from a variety of supply-side and demand-side sources to build the indicators for the Scoreboard. On the pilot OECD Scoreboard, the country experts undertook to test a long list of 25 proposed indicators. With the limitations of availability
48 ADB–OECD Study on Enhancing Financial Accessibility for SMEs
and feasibility in mind, the country experts of the 11 participating countries specified which indicators they had information for, and its source (supply or demand side). One of the countries (Canada) volunteered to be a test case and provided quantitative andqualitative information for as many of the indicators as possible. Based on the Canadiantest case and the other country indications of availability, it was possible to reduce the list of indicators to a set of core indicators which met the five criteria (Table 13).
The country experts indicated from the beginning that they would be able to access only information which was already available or could be made available easily. They explained that it was unlikely that governments would undertake any new surveys for the purpose of building the pilot OECD Scoreboard. However, over the course of the following editions of the OECD Scoreboard, existing surveys have been modified to feed the OECD Scoreboard and new studies have been undertaken by a number of countries.
E. Data Issues
1. Differences in the Statistical and Financial Definitions of an SMEThe biggest challenge in building the Scoreboard is the lack of comparability across countries. First, there is the problem of the different statistical definitions of an SME itself. While ideally it might be preferable to harmonize all statistical definitions across countries, it is very difficult given their different economic, social, and political concerns. It took the European Commission many years to arrive at a so-called recommendation for applying a European Union (EU) SME definition (Box 1).
Box 1: What is an SME?
There is no single definition of an SME, and employee numbers need not be the sole defining criterion. However, SMEs are generally considered to be nonsubsidiary firms which employ less than a given number of employees. This number varies across countries. The most frequent upper limit designation of an SME is 250 employees, as in the European Union (EU). However, some countries set the limit at 200, while the United States considers SMEs to include firms with fewer than 500 employees. Small firms are mostly considered to be firms with fewer than 50 employees while micro enterprises have at most 10, or in some cases five, employees. Financial assets are also used to define SMEs: in the EU, the turnover of medium-sized firms (50–249 employees) should not exceed €50 million, that of small enterprises (10–49 employees) should not exceed €10 million, and that of micro firms (<10 employees) should not exceed €2 million.
Source: OECD. 2006. The SME Financing Gap (Vol I): Theory and Evidence. Paris.
The indicators of the Scoreboard have been developed using a target SME population which consists of employer firms, i.e., firms with at least one employee other than the owner and/or manager.
Another issue linked to the preferred definition of SMEs is the fact that the national statistical SME definitions differ from that used by banks and financial institutions to collect data on SME financing. Table 14 illustrates some of the differences between national statistical SME definitions and those used by financial institutions in the same country.
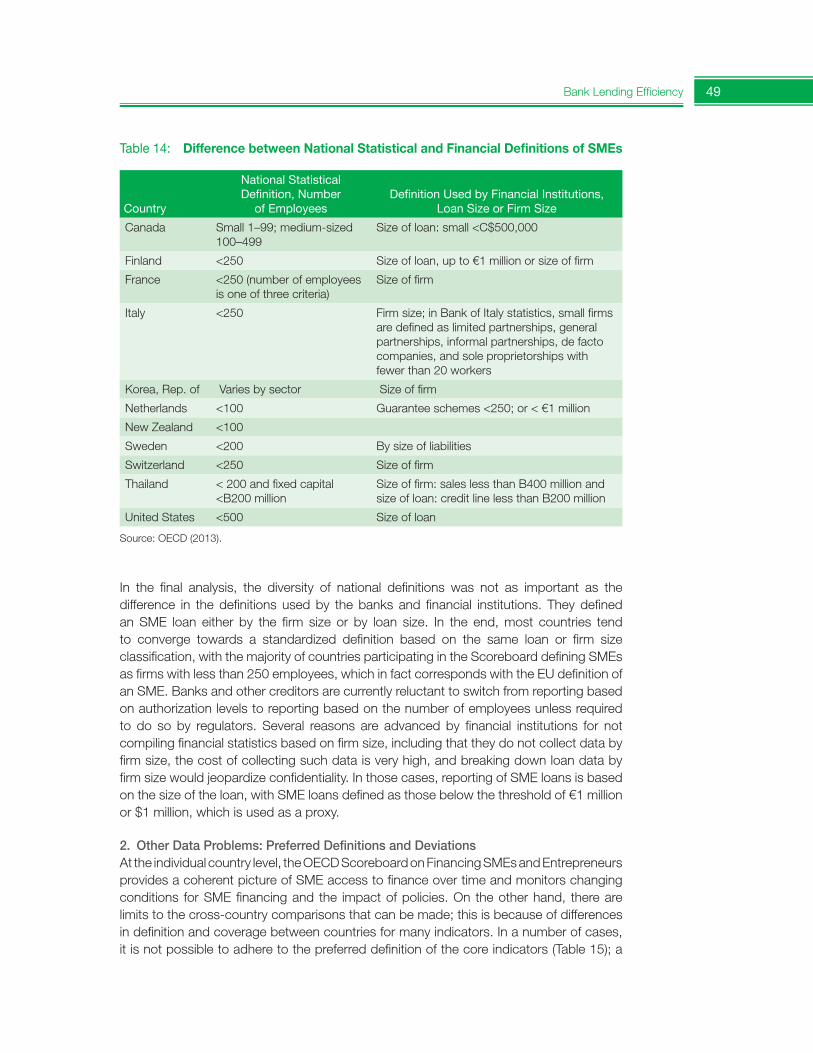
Bank Lending Efficiency 49
In the final analysis, the diversity of national definitions was not as important as the difference in the definitions used by the banks and financial institutions. They defined an SME loan either by the firm size or by loan size. In the end, most countries tend to converge towards a standardized definition based on the same loan or firm size classification, with the majority of countries participating in the Scoreboard defining SMEs as firms with less than 250 employees, which in fact corresponds with the EU definition of an SME. Banks and other creditors are currently reluctant to switch from reporting based on authorization levels to reporting based on the number of employees unless required to do so by regulators. Several reasons are advanced by financial institutions for not compiling financial statistics based on firm size, including that they do not collect data by firm size, the cost of collecting such data is very high, and breaking down loan data by firm size would jeopardize confidentiality. In those cases, reporting of SME loans is based on the size of the loan, with SME loans defined as those below the threshold of €1 million or $1 million, which is used as a proxy.
2. Other Data Problems: Preferred Definitions and DeviationsAt the individual country level, the OECD Scoreboard on Financing SMEs and Entrepreneurs provides a coherent picture of SME access to finance over time and monitors changing conditions for SME financing and the impact of policies. On the other hand, there arelimits to the cross-country comparisons that can be made; this is because of differences in definition and coverage between countries for many indicators. In a number of cases, it is not possible to adhere to the preferred definition of the core indicators (Table 15); a
Table 14: Difference between National Statistical and Financial Definitions of SMEs
Country
National Statistical Definition,Number
ofEmployeesDefinitionUsedbyFinancialInstitutions,
Loan Size or Firm Size
Canada Small 1–99; medium-sized 100–499
Size of loan: small <C$500,000
Finland <250 Size of loan, up to €1 million or size of firm
France <250 (number of employees is one of three criteria)
Size of firm
Italy <250 Firm size; in Bank of Italy statistics, small firms are defined as limited partnerships, general partnerships, informal partnerships, de facto companies, and sole proprietorships with fewer than 20 workers
Korea, Rep. of Varies by sector Size of firm
Netherlands <100 Guarantee schemes <250; or < €1 million
New Zealand <100
Sweden <200 By size of liabilities
Switzerland <250 Size of firm
Thailand < 200 and fixed capital <B200 million
Size of firm: sales less than B400 million and size of loan: credit line less than B200 million
United States <500 Size of loan
Source: OECD (2013).
50 ADB–OECD Study on Enhancing Financial Accessibility for SMEs
proxy has been adopted in these instances. For this reason, the Scoreboard data of each country are necessarily complemented with a table of definitions, which provides the definition adopted for each indicator and the reference to the data source.
A key indicator in this exercise, the SME loans, requires bank data collected by firm size, or the availability of SME financial statements from tax authorities. Some central banks do not require any reporting on SME lending so SME loans are estimated from SME balance sheets. In other cases, credit card debt or personal mortgages are included in SME loans and it cannot be determined which part is consumer debt and which is business debt. When these conditions are not met, business loans below a given threshold (€1 million or $1 million) serve as a proxy for SME loans. There is also a great deal of variation in how banks define nonperforming loans. Some use a cut-off of 90 days, and others a longer period. However, if the changes in this ratio are analyzed, the indicator can be used for cross-country comparisons.
Government loan guarantees is another indicator where deviations are observed. Supply-side data is the best source of information on loan guarantees, and sourcesfor such guarantees can be local, regional, or central governments. In some countries, an important volume of guarantees is also provided by mutual guarantee schemes. However, the various loan guarantees schemes, public, private, and mixed, are not always consolidated to obtain national figures. Therefore, the OECD Scoreboard reports mostly on government loan guarantees which are readily available. In some cases, lack of awareness and reporting make it difficult to collect data on guaranteed SME loans. In fact, SMEs are not always aware that their loan is backed by a government guarantee andbanks do not usually report this information.
The indicators on SME loans authorized and SME loans requested are obtained from demand-side surveys. However, not all countries undertake such a survey, or, if they do, the results are not comparable. Several countries have information on SME loans used rather than SME loans requested. In these cases, a proxy is used, which consists of SME loans used divided by SME loans authorized. While this does not provide information identical to the preferred definition, a decline in the ratio suggests that the credit market is easing, or that banks have been providing more credit than is being used.
Significant differences exist across countries in the calculation for SME interest rates. While there is agreement that fees should be included in the cost of the SME loans, it appears to be particularly difficult to determine which fees, among the various chargesapplied to firms, to include in the interest rates.
Central banks usually do not collect key pieces of information on SME access to finance, such as the collateral required for SME loans. Banks consider this to be confidential information. A rough approximation can be obtained from demand-side information, i.e., the percentage of SMEs required to provide collateral on new loans. This measure is currently used in the OECD Scoreboard, and more transparent reporting by banks on the terms of their SME lending is recommended to improve information on SME credit conditions.
External equity, i.e., venture and growth capital, is usually reported by stage of development: seed, start-up, and early expansion capital. Later-stage expansion capital, referred to
Bank Lending Efficiency 51
as growth capital, is also reported. Buyouts, turnarounds, and replacement capital are excluded from venture and growth capital. Country classification systems do not always break down private equity data into these categories. Most do not break it down by firm size. Venture capital data are collected by private venture capital associations, which rely on voluntary reporting and whose membership may be incomplete. There is also no standard method to value venture capital. There is a need for greater standardization of venture capital data reporting, in terms of both the definition used for the different stages of investment, and the methodology employed to collect data.
Payment delays and bankruptcy data are usually collected for all enterprises and not broken down by firm size. Since SMEs account for more than 97% of the enterprises in the participating countries, the national figures for payment delays and bankruptcy rates are used. However, bankruptcies are hard to compare across countries because of different bankruptcy costs, legislation, and behavior in the face of bankruptcy. In some cases, bankruptcy procedures take a long time and so bankruptcies only show up in later periods rather than during the crisis period.
A much wider and longer-term challenge is the further standardization of SME definitions and data in order to obtain indicators that are as comparable as possible both within and across countries. It has to be said that a lot of progress has been made on that front since the launch of the pilot OECD Scoreboard. However, international harmonization is an ongoing task and full harmonization will require time and collective effort from all stakeholders. This is in line with the OECD Scoreboard’s objective of contributing to improving the comparability of the indicators and to an increase in cooperative efforts among agencies and countries to harmonize their definitions, data collection methods,survey questions, and time frames.
F. Relevance of the Diversity in Definitions
Despite the diversity in definitions and missing data, the country experts in most cases were able to identify sufficient data which would allow core indicators or reasonable proxies to be constructed. The differences in the exact composition of the indicators were muted by the fact that changes in the indicators, rather than the absolute values, are being examined across periods. Cross-country comparisons are more difficult and only a few of the indicators can be validly compared. The chief value of the Scoreboard is its usefulness as a framework to gather and display a number of important indicators. Having the indicators examined as a set has proved more effective than looking at the indicators one by one. Having them side by side allow a coherent story to be told in terms of SMEs access to finance, government responses, and the impact of those responses on SME survival during the crisis in each country. Moreover, when the indicators are assembled as a group on the national Scoreboard, they give a clear picture of the SME situation in terms of their treatment by the financial system. While considerable work has already been done to harmonize the indicators of the OECD Scoreboard, more workneeds to be done in the harmonization of data collection. What is needed is not more data collection but better data collection. For example, some governments, in order to have more precise and timely information, are reducing the size of their surveys so that they can be conducted more frequently and they are harmonizing the questions asked with other national surveys.
52 ADB–OECD Study on Enhancing Financial Accessibility for SMEs
Given the role banks played in the financial crisis, more transparency on their part would increase the information needed to evaluate SME access to finance. In particular, banksneed to report regularly on their SME lending by firm size and lending which is supported by government guarantees, their interest rate spreads, their collateral requirements, and their nonperforming loans. They have this information; it is a matter of making it public. Financial regulators, principally central banks, need to sit together in the appropriate forum with policy makers to agree on what information should be collected on SME financing and how this is to be achieved and made available to the wider community interested in SME and entrepreneurship promotion.
1. Improving Data When it comes to improving SME data, it is necessary to fill the gaps in available data and work towards more comprehensive information in key areas. To improve the usefulness of SME data on financing, a number of actions could be undertaken at the national and international level, such as the following:
• Analysis of SME financing should be based on timely, quantitative supply-side data and demand-side data. Qualitative information coming from demand- and supply-side opinion surveys should be used only to supplement the analysis. Where supply-side data are not available (as in the case of collateral), demand-side survey information can be used.
• To improve quantitative supply-side data, banks and other credit institutions should be required by their regulatory authorities to extract and publicly report existing information on their SME lending by firm size broken down into the appropriate size categories.
• To improve transparency in bank lending to SMEs, banks should report those SME loans which are publicly supported, their SME interest rates, their fees charged, their SME collateral requirements, and nonperforming SME loans.
• Those international, regional, and national financial authorities as well as business associations carrying out demand-side surveys should work together to develop core questions which could simplify and standardize the questionnaires. Where possible, these surveys should be undertaken jointly to increase the response rate and decrease the cost. There is a role for increased international cooperation and capacity building in this area.
• Financial institutions should be required to use the national statistical definitions based on firm size when reporting their SME lending. This can be most easily done by having the financial institutions use the national statistical definition based on number of employees or turnover when reporting their SME loans. Breaking the raw data down into various firm size categories resolves, in large part, the problemof different definitions of an SME.
• To assess the health of the SME sector, national authorities should monitor payment delays and firm failures by firm size.
In the medium to long term, it is necessary to make progress on the harmonization of definitions and to improve transparency and accounting practices by financial institutions. The OECD Scoreboard provides a framework for what can be collected at the present
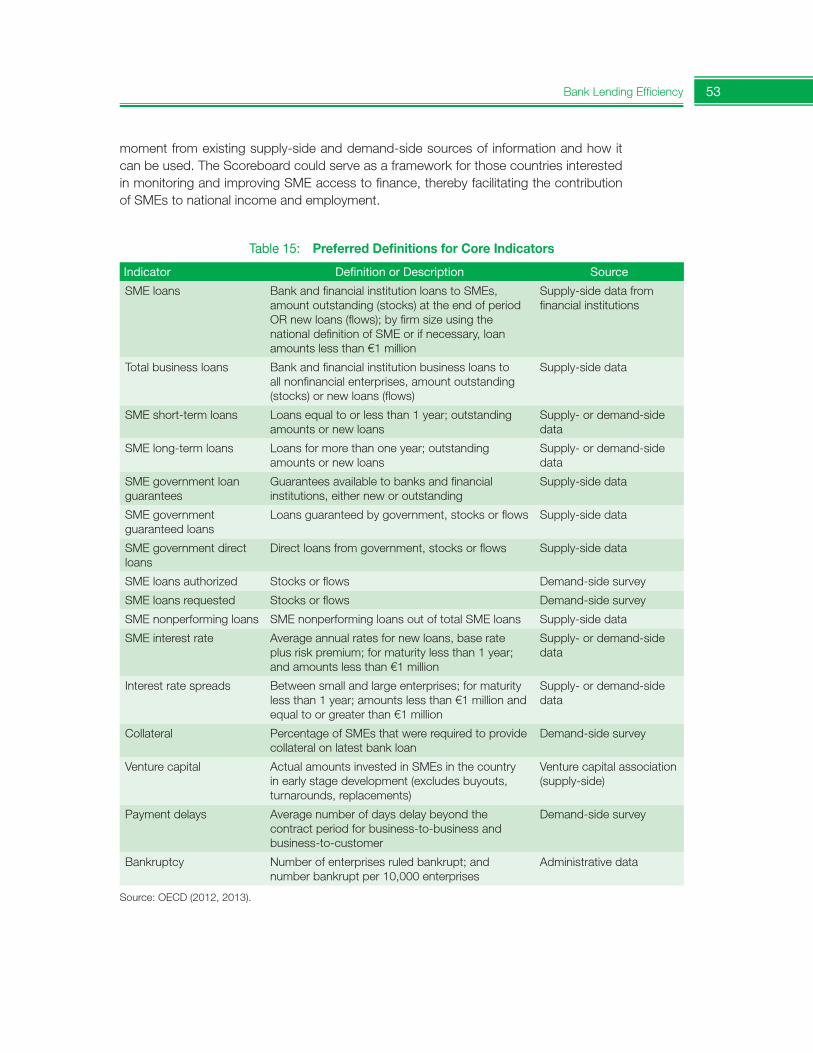
Bank Lending Efficiency 53
Table 15: Preferred Definitions for Core Indicators
Indicator DefinitionorDescription Source
SME loans Bank and financial institution loans to SMEs, amount outstanding (stocks) at the end of period OR new loans (flows); by firm size using the national definition of SME or if necessary, loan amounts less than €1 million
Supply-side data from financial institutions
Total business loans Bank and financial institution business loans to all nonfinancial enterprises, amount outstanding (stocks) or new loans (flows)
Supply-side data
SME short-term loans Loans equal to or less than 1 year; outstanding amounts or new loans
Supply- or demand-side data
SME long-term loans Loans for more than one year; outstanding amounts or new loans
Supply- or demand-side data
SME government loan guarantees
Guarantees available to banks and financial institutions, either new or outstanding
Supply-side data
SME government guaranteed loans
Loans guaranteed by government, stocks or flows Supply-side data
SME government direct loans
Direct loans from government, stocks or flows Supply-side data
SME loans authorized Stocks or flows Demand-side survey
SME loans requested Stocks or flows Demand-side survey
SME nonperforming loans SME nonperforming loans out of total SME loans Supply-side data
SME interest rate Average annual rates for new loans, base rate plus risk premium; for maturity less than 1 year; and amounts less than €1 million
Supply- or demand-side data
Interest rate spreads Between small and large enterprises; for maturity less than 1 year; amounts less than €1 million and equal to or greater than €1 million
Supply- or demand-side data
Collateral Percentage of SMEs that were required to provide collateral on latest bank loan
Demand-side survey
Venture capital Actual amounts invested in SMEs in the country in early stage development (excludes buyouts, turnarounds, replacements)
Venture capital association (supply-side)
Payment delays Average number of days delay beyond the contract period for business-to-business and business-to-customer
Demand-side survey
Bankruptcy Number of enterprises ruled bankrupt; and number bankrupt per 10,000 enterprises
Administrative data
Source: OECD (2012, 2013).
moment from existing supply-side and demand-side sources of information and how it can be used. The Scoreboard could serve as a framework for those countries interested in monitoring and improving SME access to finance, thereby facilitating the contribution of SMEs to national income and employment.
54 ADB–OECD Study on Enhancing Financial Accessibility for SMEs
References
OECD. 2006a. The SME Financing Gap: Volume I: Theory and Evidence. Paris.
______. 2006b. The SME Financing Gap: Volume II: Proceedings of the Brasilia Conference 27–30 March 2006. Paris.
______. 2006c. The OECD Brasilia Action Statement for SME and Entrepreneurship Financing, OECD Global Conference on Better Financing for Entrepreneurship and SME Growth, Brasilia, 27–30 March.
______. 2009. The Impact of the Global Crisis on SME and Entrepreneurship Financing and Policy Responses. Paris.
______. 2010. Pilot OECD Scoreboard on SMEs and Entrepreneurship Financing Data and Policies. Paris.
______. 2012. Financing SMEs and Entrepreneurs 2012: An OECD Scoreboard. Paris.
______. 2013. Financing SMEs and Entrepreneurs 2013: An OECD Scoreboard. Paris.
Bank Lending Efficiency 55
2.1.3. Secured Transactions Reform and SME Access to Finance: Issues and Examples from the Pacific Region
Paul Holden25
The Pacific region has undergone some of the most extensive secured transactionsreforms anywhere. Although the reforms are relatively recent, initial results of the reforms indicate that they will allow more borrowing on better terms than under the previous legacy systems. The reforms have especially benefitted smaller businesses.
A. Introduction
Substantial analytical work has documented the association between financial market development and growth.26 Without access to finance, investment is limited and growth potential wasted. Credit is required for many business transactions and consumer purchases. For thousands of years, when people have looked to borrow money for business purposes, they have found that lenders want security as a condition for loans. Lenders want collateral. Under the law, collateral comes in two types: land (real estate)and personal property.27
Typical of most developing countries are those in the Pacific region, where analysis undertaken by ADB on access to finance concluded that one of the most important causes of financial underdevelopment is the outdated legal systems and institutions that seriously inhibit lending, raise the costs of borrowing, and reduce access to credit, especially for SMEs.28
Problems with the legal framework for lending explain a large part of the limited access to finance in most developing countries, where legislation governing lending and the enforcement framework seriously impede the use of collateral, in particular using personal property, as security for the granting of credit. The result is reduced access to credit except for large companies or wealthy individuals with substantial land holdings. Smaller borrowers are essentially excluded from the system. A secondary effect is that the credit chain is shortened. This means that, unlike in countries that have highly developed financial markets, few businesses extend credit terms to their customers, borrowing against inventories or warehouse receipts rarely occurs, purchase of equipment through leasing is unusual, and specialized financial institutions do not exist. As a result, there is underinvestment in capital equipment and inventories are less than optimal, which imposes high costs, especially in remote countries where resupply is difficult because of distances from suppliers. Businesses in these countries need to hold higher inventory than do those in countries where suppliers are nearby. Since these have to be financed, access to credit at reasonable cost is especially important for productivity improvements and growth.
25 Lead Economist, Pacific Private Sector Development Initiative, ADB. 26 For an overview of this work, see P. Holden and V. Prokopenko 2001. Ayyagari, Demirgüç-Kunt, and
Maksimovic (2005) analyze firm surveys to ascertain the impact of the business environment on growth and find that access to finance is one of the most important determinants of the growth rate of firms (together with crime and political instability).
27 Personal property consists of such assets as plant and equipment, inventory, accounts receivable, crops, royalty income, and future income.
28 These conclusions find more general support in Beck, Demirgüç-Kunt, and Levine 2001. Legal factors are one of the most important determinants of financial development.
56 ADB–OECD Study on Enhancing Financial Accessibility for SMEs
If the framework for pledging personal property as security for loans is weak, creditors have no certainty that if a borrower defaults on a loan, the personal property that was pledged as collateral can be repossessed within a reasonable period of time. Lending to all but the wealthiest of borrowers is therefore fraught with risk. As a result, lenders tend to ask for personal guarantees on bank loans that are backed by real estate. Furthermore, since the process of repossessing and selling real estate assets is costly, the value of the collateral is usually several times the value of the loan, which raises the risk for borrowers. Potential borrowers without titled, registered real estate and other substantial assets cannot find financing.
Countries that have effectively modernized29 their secured transactions laws have experienced significant increases in credit access for the private sector.30 Modern secured lending systems are a feature of virtually all countries where access to credit is available for businesses, especially SMEs.
This section first discusses the essential features of a well-functioning secured transactions framework and then describes a series of reforms in Pacific region countries that are among the most innovative in the world.
B. Some Features of a Well-Functioning Secured Transactions Framework
1. Secured Transactions Under Legacy SystemsThe description of secured transactions reform outlined in the previous section does not provide any details of what a well-functioning collateral system involves. Essentially, a secured transactions framework allows borrowers to pledge personal property as security for a loan in a manner that removes ambiguity regarding exactly what property has been pledged and to whom the property has been pledged, and gives the lender the right to repossess these assets speedily in the event of payment default. To function effectively, the costs involved in utilizing the system should be low, the rights and obligations of all parties to the transaction should be clear, and the procedures to be followed in the event of default should occur rapidly, with a minimum recourse to the courts. Successful secured transactions reform requires that each stage be unambiguous in the law and that transactions costs of using the system are low. Unfortunately, there have been many unsuccessful secured transactions reforms around the world because of the failure to observe each phase.
Traditional legal support for secured lending had roots in legal forms established in some cases by statute and in other cases by common law. To help clarify the discussion, the following are some commonly used legal terms for the ways in which security interests are created:
29 The key is effective modernization. There have been a number of instances of secured transactions reformthat have not led to increased lending, primarily because the reforms were incomplete or failed to repeal existing laws governing lending.
30 For example, after New Zealand introduced its Personal Property Securities Act, there was a sharp rise in lending, with large numbers of new security interests being registered. In Eastern Europe, particularly Albania and Romania, the number of security interests registered rose substantially after the reform.
Bank Lending Efficiency 57
• Security interest. Security interest is a property right that secures an obligation and is central to the pledge, mortgage, and other transactions secured by personal property.
• Attachment. A security interest attaches to collateral when it becomes enforceable against the debtor (the person who gives the security interest).
• Perfected. A security interest is perfected when the secured lender (the person who takes the security interest) may enforce it against third parties such as other creditors who take a security interest in the same property, people who obtain liens on the property, or people who buy the collateral from the debtor.
There are a number of instruments that can be used to create security interests. The most important of these are as follows:
• Pledge: A pledge is the delivery of an asset for the purpose of security. The asset may be goods, documents of title, negotiable instruments, or other type of tangibleproperty. The security interest attaches to the goods and the security interest is perfected when the creditor takes possession of the asset.
• Lien: A lien is a right to hold property until an obligation is discharged. A lien may arise by agreement of the debtor or by operation of law. Unlike the pledge, the property is not transferred for the purpose of security. For example, if a TV is delivered to a shop for repair, the repair shop may have a lien on the TV until payment is made. Also unlike the pledge, there is no power to dispose of the property at common law, though a statute may provide such a power.
• Mortgage: A mortgage on personal property is a transfer of a property right to the creditor entitling the creditor to foreclose on the right upon default, taking possession of the property with a right to convey title. Upon performance by thedebtor, the mortgage right is discharged.
• Charge: A charge is a property right entitling a creditor to seize an asset upon a condition (e.g., failure to pay an obligation). A fixed charge attaches when an agreement has been made, the creditor gives value to the debtor, and the debtor acquires rights in the charged property, whichever occurs last. Under a fixed charge, the debtor may not dispose of the charged asset. Fixed charges, therefore, facilitate equipment finance but are not useful for inventory finance, because inventories are constantly changing. A floating charge therefore may attach to a changing pool of assets rather than in any particular asset.
The form determines the lender’s rights to the property upon default. The most important point about traditional approaches to secured lending is that the system focuses on the legal form selected by the borrower and lender. The form determines the following:
• The cost of creating security to be borne by the borrower.
• The lender’s rights against third parties.
• What, if any, information will be available to the public when someone wants to buy collateral or when someone is asked to accept movable property as collateral under another loan agreement. Without reliable information, a potential lender cannot determine if collateral offered by a potential borrower has already been pledged to someone else.
58 ADB–OECD Study on Enhancing Financial Accessibility for SMEs
2. Essential Elements of a Well-Functioning System of Secured TransactionsWhile every lender will state that the last thing that they want to do is repossess pledged collateral, the very threat that they can do so provides strong incentives for borrowers to adhere to the terms of loan contracts and to make every effort to repay. The ability of borrowers to pledge property at low cost and for lenders to take collateral and, in the event of default, repossess it requires a legal framework that provides for the following four essential elements.
(i) Creation. The law must define the assets that are being secured, so that a property right is created. It must permit clear and low-cost methods for creating this security interest on the part of the lender. Secured transactions reform will reduce the uncertainty that lenders have in determining whether assets have already been pledged. In general, people should be free to secure obligations with personal property as they wish, without undue expense and without undue legal restrictions and burdens. A simple agreement should be all that is necessary to secure an obligation with nearly any form of personal property—tangible and intangible property, and present and future-acquired property. The parties may agree that the debtor will remain in possession of the collateral and that the debtor may (or may not) sell, deal in, or otherwise dispose of the collateral with, or without, the knowledge or consent of the creditor. This is important when, say, inventory is used as collateral. Typically the debtor will need to sell the inventory and purchase new stock, i.e., rotate his or her stock, during the life of the loan. The agreement needs to allow inventory to be sold and newly purchased goods that move into inventory to become collateral, without the necessity of drawing up a new agreement. This procedure is known as creating a “floating charge” and applies to any assets that are constantly changing, including debtors or accounts receivable.
(ii) Priority. The law must set logical and clear priorities among the different claims on pledged assets. It must set a time of registration of security interests, from which a right will prevail against other claimants to the same property. Secured lending is less than secure when previous creditors already have rights in the collateral and future creditors could also acquire rights in it. The value of collateral is diminished when others may assert claims against it, including judgment holders who obtain writs of execution, tax authorities that can seize collateral based on a tax lien that is unknown to the lender, and bankruptcy trustees.
Further, since the collateral may be sold by the debtor, or otherwise disposed of, there must be rules that determine what rights the buyers and other transferees acquire in the collateral. The rules should specify whose rights have priority over the rights of others, and under what circumstances. Secured transactions law clarifies these issues in the form of priority rules that specify the rights of borrowers, lenders, and third parties under a variety of commercial situations.
(iii) Publicity. The law must provide a practical, effective, and sustainable system for publicizing rights so that other potential lenders can determine whether an asset has already been pledged to somebody else. Therefore, a system is needed that publicizes such pledges. It allows the creditor to file a notice that specifies the parties to the loan agreement and describes the collateral that has been pledged. In well-functioning modern systems, the publicity merely indicates, in
Bank Lending Efficiency 59
an easily searchable database, that a security interest exists. Filing, therefore, need not take on any burdensome formalities and need not be subject to the scrutiny of a state agency. The notice establishes a priority right to collateral in the event of a dispute among creditors and other third parties, but the actual status of property rights to collateral are to be found only in the security agreement itself.
The notice serves only two purposes. First, it warns prospective creditors and buyers of possible prior security interests in the debtor’s property. Second, the date of the filing of the notice indicates the date by which competing claims to collateral are measured. The first filer has first priority in the event of default. The description of collateral in the notice may be general in nature but must be sufficient to apprise prospective lenders and buyers of collateral of the possible status of the debtor’s property. With modern technology, notice-filing offices are often operated electronically, which gives speedy internet access to information regarding the filing of security interests and provides fast, efficient, and accurate service to borrowers and lenders. As a result, ambiguities arising from conflictingclaims are substantially reduced.
(iv) Enforcement. The law must set out a workable system for enforcing lenders’ rights, including the repossession and sale of the property in the event of default. The success of secured transactions law depends upon the creditor’s ability to speedily enforce its rights. The creditor must have the right, upon default, to takepossession or control of the collateral and to sell or otherwise dispose of the collateral in an economically efficient manner. A sale may be through public or private facilities. Collateral may be disposed of in whole or in part. In appropriate circumstances, the collateral may be leased or licensed. Regulation of the creditor’s efforts to obtain value from collateral must be sensitive to the type of collateral and the commercial circumstances in which the creditor must act.
In many circumstances, it should not be necessary to go to court to repossess and sell property in the event of loan default. There is no need for judicial intervention when a secured creditor disposes of collateral that is in the creditor’s possession or control. Creditors often maintain possession of documents of title, warehouse receipts, and negotiable instruments. Upon default, the secured creditor should have statutory authority to sell or lease the collateral. Similarly, upon default, a secured creditor should have statutory authority to collect on accounts receivable that have been pledged as collateral, without judicial permission. Perhaps only in the case of a noncooperative debtor in possession of tangible collateral is judicial intervention necessary, and then for the purpose of repossessing the property and giving it to the creditor.
If the secured transactions framework does not account for these requirements, then both bank and nonbank lenders will be reluctant to lend and financial market development is hindered. For private lending to serve borrowers’ needs, the legal and institutional framework needs to assure private lenders about one thing: that the borrower will pay. A country’s legal framework for debt collection provides that assurance. When the law permits effective use of collateral, the risk from lending falls. Lenders react by offering more credit at the same or better terms. More credit at lower interest
60 ADB–OECD Study on Enhancing Financial Accessibility for SMEs
rates permits higher rates of investment and more capital per worker, leading to much higher incomes.
3. Typical Problems with the Framework for Secured LendingIn unreformed systems for taking collateral against security for loans, procedures frequently involve substantial legal costs and furthermore, it is difficult to determine if collateral has already been pledged. The main issues are as follow:
• Secured lending is organized around a variety of costly legal forms. Some forms are subject to registration and others are not, but registries are cumbersome and offer limited useful information, even though much information is typically collected.
• The secured lender’s priority against third parties is not established by registration but rather by legal formality and technicality that does not take into account all potential competing claims.
• The ability of individuals and groups to borrow is limited unless they owned formal registered companies.
The result is that the system is costly for the borrower, enforcement is expensive, and the system is risky for both lenders and borrowers and has an adverse effect on access to finance.
In common law countries, the most commonly used lending mechanisms by creditors are as follows:
• The company charge. These are created upon the registration of a security interest at the companies registry.
• The registered bill of sale. This is the main instrument available to individuals to borrower under a secured lending framework. Individuals can give fixed charges under the bills of sale statutes but floating charges were not possible under thatlegal form or any other legal form available to an individual borrower.
• Thefunctionalequivalentofsecurity. Because of the defects in the fixed charge and the registered bill of sale, creative lawyers use a range of other devices. For instance, title retention devices avoid the formality, technicality, and cost of the fixed charge and registered bill of sale. Under a title retention scheme, the lender holds title to the goods (sometimes posing as a lessor). Upon payment of the purchase price, the title-retaining seller or creditor transfers title to the buyer or borrower. Upon default, the owner of the goods reclaims them. Typical forms of title retention are conditional sale, hire purchase agreements, and the finance leases.
C. Secured Transactions Reform in the Pacific Region
Since 2006, six Pacific countries have enacted secured lending reform.31 The results of the reform are that creating security interests is simpler, less expensive, and more flexible for all borrowers, whether individuals or companies.
31 The countries with fully functioning secured transactions reform frameworks are the Federated States of Micronesia, Marshall Islands, Palau, Solomon Islands, Tonga, and Vanuatu. Papua New Guinea and Samoa have enacted legislation but the registries are not yet operational.
Bank Lending Efficiency 61
Simplified notice-filing registries are established which operate electronically and withoutintervention by a government registrar. They are characterized by the following:
• Secured party name and address is required.
• Debtor name and address is required.
• Collateral is described (can be general or specific) with asset serial numbers where required.
• Priority rules governing competing claims to collateral are established in a manner that responds to commercial needs rather than legal formality and technicality.
• Enforcement rules are simplified and in some cases made less expensive.
SMEs have been major beneficiaries of these reforms, which in the case of Vanuatu andSolomon Islands have been combined with reforms of the Companies Act, which makesit far easier for single or a small number of persons to incorporate under a corporate umbrella. Special provisions have been included in this legislation which will allow women to incorporate easily without the need for expensive legal advice.32 This will allow them to also use the new secured transactions framework because they will be able to pledge assets as a group rather than as a number of individuals.
1. Creating Security InterestsUnder reformed secured lending law in Pacific island economies, a security interest attaches to collateral by the same simple rules,33 no matter what the form of transaction.34
In a single agreement, any borrower (individual or corporate) may give any lender a security interest in any personal property, whether owned at the time or acquired after the time of the security agreement. No special form or terminology is required.
Collateral may be personal property of any nature, whether the debtor owns the property at the time of the security agreement or acquires the property thereafter. Collateral may be personal property that becomes fixed by attachment to or installation on real property. Collateral may be minerals or timber or other real property that is severable to become personal property. A debtor need not be a corporation to give a floating charge in collateral. Collateral may be described generally or in specific terms. General classifications of collateral are permitted, such as equipment, inventory, accounts, crops, livestock, documents of title, negotiable instruments, or consumer goods.
Rather than providing an all-inclusive list of registerable charges, as in the old Companies Act and the Bills of Sale Act, the new laws apply to all transactions that create security, no matter what terminology is used. The laws also apply to transactions not traditionally
32 The new Companies Acts for Solomon Islands and Vanuatu also introduce for the first time in the Pacific the concept of a “community company.” This will allow community groups, including women’s groups, to incorporate for the purposes of promoting a community interest or objective. The use of these community companies should assist women in participating in the economy to a much greater extent than in the past.
33 A security interest attaches by (i) agreement of the parties, (ii) when the debtor has rights in collateral, and (iii) when secured party gives value to the debtor, whichever occurs last (Vanuatu Personal Property Securities Act, S 26; Solomon Islands Secured Transaction Act, S 8).
34 The parties may call the agreement a pledge, charge, hire purchase, financial lease, or use any other terminology, but the effect is the same in each case. An agreement by which the debtor grants a security interest in collateral to the secured party has the same effect (Vanuatu Personal Property Securities Act, S 3; Solomon Islands Secured Transaction Act, S 3[1][(a]).
62 ADB–OECD Study on Enhancing Financial Accessibility for SMEs
considered as transactions creating security, such as title retention and consignment. In other words, the law applies whether the owner of the collateral is the debtor or the secured lender.35 For the purposes of notice (registration) and priority, even leasing is subject to the new law.36
Registration is not required for some types of collateral (goods, documents of title, negotiable instruments) if the secured lender takes possession of the collateral. Possession by the secured lender is considered a means of perfection, like registration.37 Thus, if a secured lender takes and maintains possession of collateral, a later-secured party who registers a notice will have an interest that is junior to the secured lender who has taken and maintained possession.
Stamp duty does not apply to transactions subject to the Personal Property Securities Act in Vanuatu. Stamp duty remains in effect in Solomon Islands, although payment of stamp duty is not required for registration.
2. Registry ReformThe reformed secured lending laws of Vanuatu and Solomon Islands change the registration process in both form and substance. As in New Zealand, registration and public searches of registry records are only offered by electronic means, available via the internet.38 There are no fees and no need to create an account with the registry to undertakes searches. All that is required are the name of the debtor, the registration filing number, or the asset serial number.
The registration process is paperless. Registrations take place online instantaneously, which eliminates uncertainty regarding the exact date and time of recording of security interests. Also, no registrar examines information submitted for registration and therefore no certificates are issued that may be used as evidence of the existence or validity of a security interest. The registry can, therefore, be operated efficiently and at low cost.
Unlike traditional registries, the new registries operate on principles of notice filing. This means that registration does not create a security interest or any other property right. Registration serves only two purposes: (i) to provide notice to the public to inquire further before buying or taking a security interest in property of the same nature described in the notice, and (ii) to establish a priority date (the registration date) by which competing claims to collateral may be measured. With the example of major hardware in Vanuatu, this notice function is operating perfectly where two financial institutions have registered a notice filing over the company’s assets but have different priority because of the dates of registration.
By limiting the purposes of registration, simplification of the registration process is easily accomplished. Rather than completing lengthy forms, submitting copies of charge documents, and disclosing financial information on the public record, notices are kept very simple. A notice must contain only the identification of the borrower and lender and
35 See Vanuatu Personal Property Securities Act, S 10; Solomon Islands Secured Transaction Act, S 3(1)(a).36 See Vanuatu Personal Property Securities Act, S 3; Solomon Islands Secured Transaction Act, S 3.37 See Vanuatu Personal Property Securities Act, S 43; Solomon Islands Secured Transaction Act, S 13(b).38 Vanuatu registry: http://www.ppsr.vu; Solomon Islands registry: http://www.stfosi.com
Bank Lending Efficiency 63
a description of the collateral. Simplification of the registration process also makes it efficient to include a wider range of transactions within the registration scheme, such as title retention, consignments, leasing, factoring, and the sale of accounts.
Registration is permitted before the parties sign a security agreement. This facilitates two types of transactions. In a complicated transaction where a large pool of collateral may be at stake, the prospective lender may file a notice before due diligence and negotiations with the debtor are undertaken. When a loan agreement is executed, a security interest and priority will already have been established in the collateral under the first-to-file rule. Furthermore, a notice is sufficient to perfect security interests in multiple security agreements. The financing needs of businesses, especially those that are growing rapidly, change over time. This could require multiple financing agreements, which are now permitted under the reformed laws of both countries. By permitting registration inadvance, it is unnecessary for the lender to return to the registry to file notice each time a new agreement is made with respect to the same collateral.39
3. Priority of Security InterestsUnder the reformed laws of the Pacific island economies, the first to register perfects a security interest that has priority over security interests that are not registered or that are registered at a later date.
The rights of secured lenders and buyers are clarified under the new laws. A buyer “in the ordinary course of business” purchasing goods from a seller takes these goodsfree of a security interest, even if the buyer knows of the security interest. The rule protects persons who, for example, buy goods from shops which may be subject to a security interest. It would be economically inefficient to require a person who buys an appliance from a dealer to check the registry to see if the dealer’s inventory is subject to a security interest.
The new laws of both jurisdictions contain a number of priority rules relating to special types of collateral and special types of transactions. The difference between the reformed law and traditional law, in each case, is that the priority rules under the new law relate to commercial necessity and are designed to promote lending and commerce, unlike the priority rules of traditional law which are rooted in antiquated statutes and common law technicality.
In some of the reformed countries, tax liens do not have super-priority. Tax liabilities must be registered by tax officials and have priority according to when they were registered. This eliminates a risk to lenders that unknown tax liabilities of the businesses that they lend to reduce the value of the security that they hold.
D. Results of the Reforms
1. Registration of Security InterestsFigure 17 shows security interests and searches in five of the countries where secured transactions reforms have been completed. Secured loans and searches are
39 See Vanuatu Personal Property Securities Act, S122; Solomon Islands Secured Transaction Act, S 30(3).
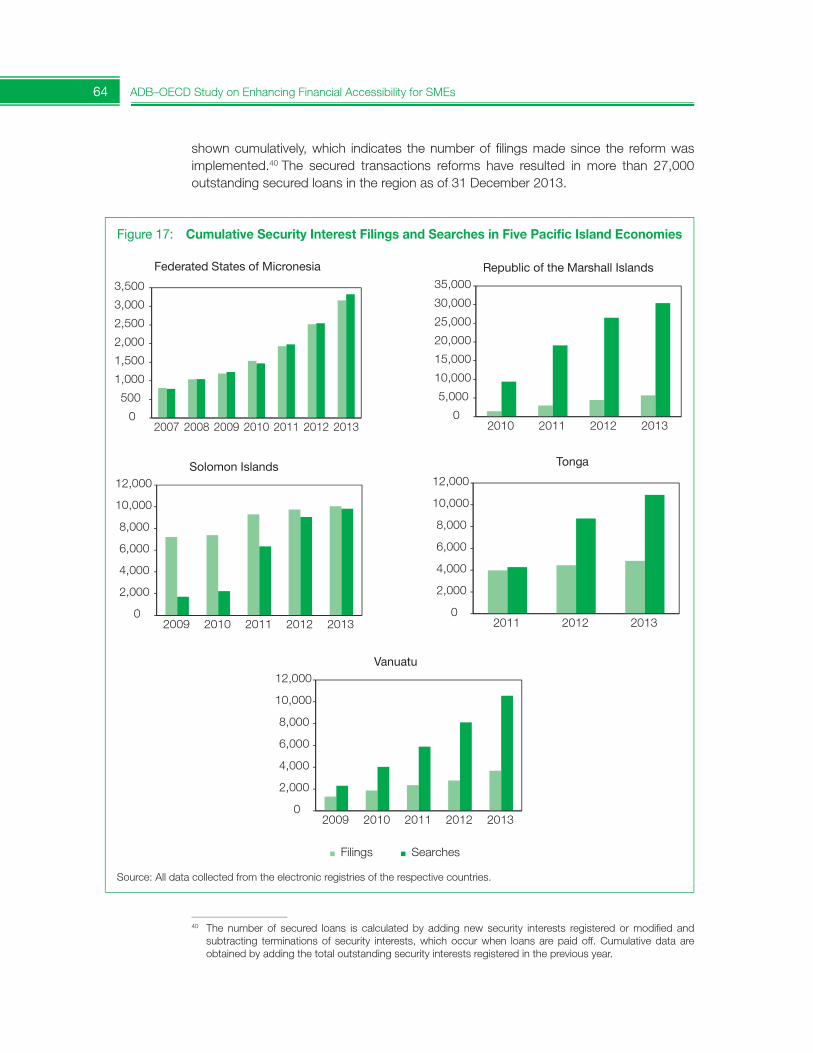
64 ADB–OECD Study on Enhancing Financial Accessibility for SMEs
shown cumulatively, which indicates the number of filings made since the reform was implemented.40 The secured transactions reforms have resulted in more than 27,000 outstanding secured loans in the region as of 31 December 2013.
40 The number of secured loans is calculated by adding new security interests registered or modified and subtracting terminations of security interests, which occur when loans are paid off. Cumulative data are obtained by adding the total outstanding security interests registered in the previous year.
Figure 17: Cumulative Security Interest Filings and Searches in Five Pacific Island Economies
Source: All data collected from the electronic registries of the respective countries.
0
500
1,000
1,500
2,000
2,500
3,000
3,500
2007 2008 2009 2010 2011 2012 2013
Federated States of Micronesia
0
5,000
10,000
15,000
20,000
25,000
30,000
35,000
2010 2011 2012 2013
Republic of the Marshall Islands
0
2,000
4,000
6,000
8,000
10,000
12,000
2009 2010 2011 2012 2013
Solomon Islands
Filings Searches
0
2,000
4,000
6,000
8,000
10,000
12,000
2011 2012 2013
Tonga
0
2,000
4,000
6,000
8,000
10,000
12,000
2009 2010 2011 2012 2013
Vanuatu
Bank Lending Efficiency 65
The registries are being actively searched. There have been over 65,000 searches so far, a remarkable number given the population size of the region. A very approximate idea of the ratio between the number of loan applications and the number of loans grantedcan be obtained by subtracting searches from loans, which would give the number of searches that did not result in a loan. For every 2.5 searches, there is one secured loan. However, it is very likely that a single loan application might have more than one search so in reality this ratio is probably smaller.
2. Benefits for Smaller BusinessesAlthough data on company size do not exist, sampling of the registration of security interests shows that by far the majority of company registrations have been by smaller companies. Furthermore, the secured transactions framework provides an upward path of the expansion of credit to small companies as they grow. This is of critical importance in enhancing productivity and growth more generally, since the greatest benefits to economies generally is less from the number of SMEs that are established and more from the expansion of the successful ones.
3. Lessons from the ReformsWhile a significant number of secured loans have been made, banks remain conservative in their lending practices. There is reluctance to lend to agricultural businesses for several reasons:
• identifying appropriate borrowers in rural areas;
• concern over the “disappearance” of collateral; and
• collection concerns more generally.
There are other problems in implementing fully the secured transactions reforms, the most important of which are as follows:
• Most of the banks in the Pacific region have head offices in either Australia or Papua New Guinea. Australia has only recently introduced a reform of its secured transactions framework and Papua New Guinea has yet to implement its newly passed law. As a result, the reforms in the Pacific island economies have outpaced those where the head offices are located. Those charged with approving loans in the head offices do not understand the new framework.
• Trade and equipment creditors have not yet begun to utilize the new framework to any great extent. They are as yet unfamiliar with the legal changes; pointing out its advantages is the next challenge of implementation.
More generally, the experience in the Pacific region points to the importance of implementation. It is not enough to simply pass the law and procure the registry. Rather, these are only the first steps to ensuring that the reforms are successful. Sustained and ongoing implementation for several years is necessary. Awareness campaigns are needed as are tailored and targeted programs to increase the knowledge of how these reformscan assist both lenders and borrowers.
A further issue is that reforms need to be tested in the courts, and if any deficiencies emerge, amendments to the legislation need to be passed. The importance of this cannot
66 ADB–OECD Study on Enhancing Financial Accessibility for SMEs
be overemphasized, since deficiencies in the law will lead to lenders being reluctant to use the framework to any great degree.
E. Conclusion
The reform of the secured transactions framework for seven countries in the Pacific region over a period of 6 years is the most extensive in any region in the world. It has resulted in a large number of new loans. Many of the beneficiaries have been SMEs. While much remains to be done, it is an example to other countries on just how much can be achieved in a relatively short space of time.
References
Ayyagari, M., A. Demirgüç-Kunt, and V. Maksimovic. 2005. How Important are Financing Constraints? The Role of Finance in the Business Environment. Washington, DC: World Bank.
Beck, T., A. Demirgüç-Kunt, and R. Levine. 2001. Law, Politics and Finance.. Washington, DC: World Bank.
Holden, P. and V. Prokopenko. 2001. Financial Development and Poverty Alleviation: Issues and Policy Implications for Developing and Transition Countries. IMF Working Paper 01/160. International Monetary Fund.
Bank Lending Efficiency 67
2.2. Basel Capital Accords and SMEs
This section describes the Basel III reforms to the global financial system and discusses the possible impacts on lending to SMEs and entrepreneurs. Particular attention is given to the impact that this new regulatory framework could have on lending to SMEs. Reference is also made to the Capital Requirements Directive IV package which transposes the framework into European Union (EU) law and addresses the issue of SME lending for Europe. The discussion on the possible impacts of Basel III mainly draws from early evaluations and forecasts developed by countries and international institutions. The section is based on the thematic chapter of the 2012 OECD Scoreboard on Financing SMEs and Entrepreneurs, which analyzed the newly introduced regulatory framework and its implications for SME and entrepreneurship financing.41
A. Introduction
The need to reform the global financial system to prevent another crisis of the same scope and scale of the recent one has been widely recognized. The implications of the Basel III reforms have been the object of discussion and analytical assessment in different countries and by different international institutions. The ongoing dialogue has resulted in various iterations and revisions of the framework of Basel III, which are also presented in this section. Specific mention is being made of the Capital Requirements Directive IV of the European Commission, transposing Basel III in European Union law, which brought some positive enhancements in the impact that the risk weighting system for assets would have on lending to SMEs. The section also discusses the main arguments proposed in these early evaluations and forecasts. The discussion also draws on the perspectives of experts from countries participating in the OECD Scoreboard on SME and entrepreneurship finance, as collected through a survey on the expected impacts of these reforms on access to finance for SMEs and entrepreneurs.
B. Background on Basel III Capital and Liquidity Standards
The main regulatory reforms developed in response to the recent financial crisis consist of revisions to the rules relating to minimum capital requirements, and the introduction of new ones relating to liquidity management, as defined by the Basel Committee of Bank Supervisors. The objective of the reforms and new standards, widely known as Basel III, is to improve the banking sector’s ability to absorb shocks arising from financial and economic stress, whatever the source, thus reducing the risk of spill-over from the finance sector to the real economy. Basel III extends and complements Basel II by strengthening capital adequacy rules and introducing a new regulatory framework which will apply to liquidity management.
The rationale for these rules stems from the financial crisis that began in 2007, when it became apparent that many banks, despite adequate capital levels, experienced difficulties because they did not manage their liquidity in a prudent manner. Prior to thecrisis, asset markets were buoyant and funding was readily available at low cost. The
41 Section based on OECD (2013).
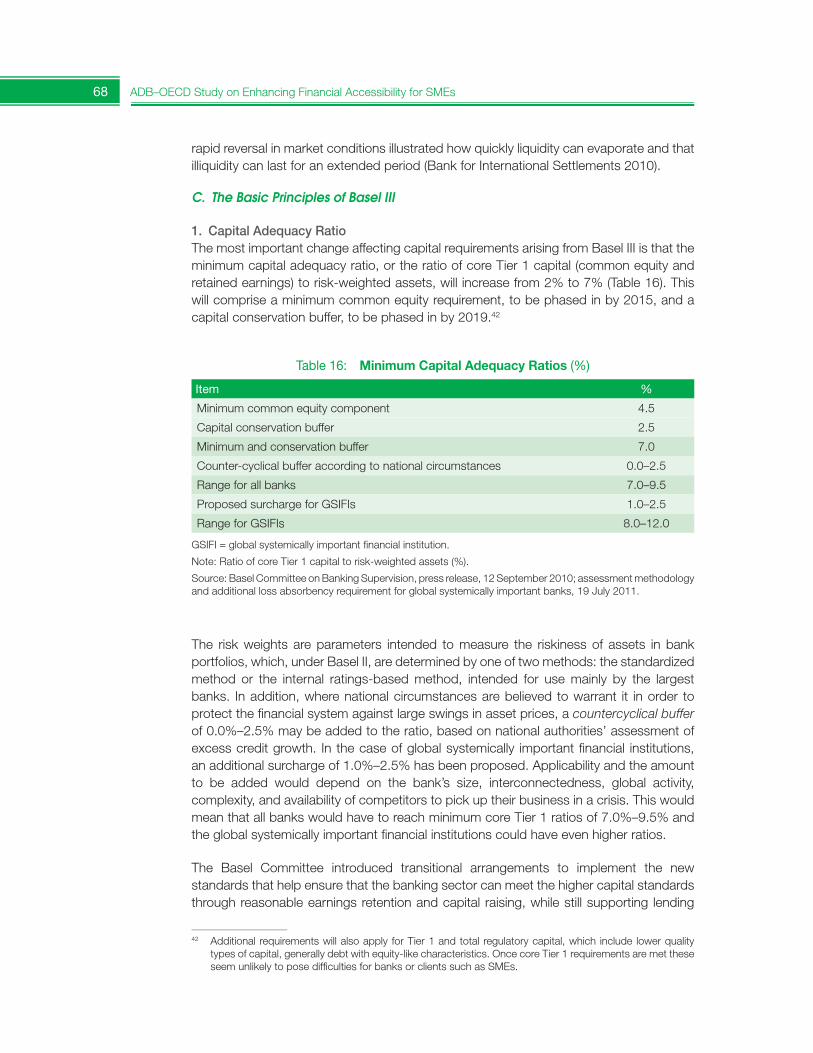
68 ADB–OECD Study on Enhancing Financial Accessibility for SMEs
rapid reversal in market conditions illustrated how quickly liquidity can evaporate and that illiquidity can last for an extended period (Bank for International Settlements 2010).
C. The Basic Principles of Basel III
1. Capital Adequacy RatioThe most important change affecting capital requirements arising from Basel III is that theminimum capital adequacy ratio, or the ratio of core Tier 1 capital (common equity and retained earnings) to risk-weighted assets, will increase from 2% to 7% (Table 16). Thiswill comprise a minimum common equity requirement, to be phased in by 2015, and a capital conservation buffer, to be phased in by 2019.42
The risk weights are parameters intended to measure the riskiness of assets in bank portfolios, which, under Basel II, are determined by one of two methods: the standardized method or the internal ratings-based method, intended for use mainly by the largest banks. In addition, where national circumstances are believed to warrant it in order to protect the financial system against large swings in asset prices, a countercyclical buffer of 0.0%–2.5% may be added to the ratio, based on national authorities’ assessment of excess credit growth. In the case of global systemically important financial institutions, an additional surcharge of 1.0%–2.5% has been proposed. Applicability and the amount to be added would depend on the bank’s size, interconnectedness, global activity, complexity, and availability of competitors to pick up their business in a crisis. This would mean that all banks would have to reach minimum core Tier 1 ratios of 7.0%–9.5% and the global systemically important financial institutions could have even higher ratios.
The Basel Committee introduced transitional arrangements to implement the new standards that help ensure that the banking sector can meet the higher capital standards through reasonable earnings retention and capital raising, while still supporting lending
42 Additional requirements will also apply for Tier 1 and total regulatory capital, which include lower quality types of capital, generally debt with equity-like characteristics. Once core Tier 1 requirements are met these seem unlikely to pose difficulties for banks or clients such as SMEs.
Table 16: Minimum Capital Adequacy Ratios (%)
Item %
Minimum common equity component 4.5
Capital conservation buffer 2.5
Minimum and conservation buffer 7.0
Counter-cyclical buffer according to national circumstances 0.0–2.5
Range for all banks 7.0–9.5
Proposed surcharge for GSIFIs 1.0–2.5
Range for GSIFIs 8.0–12.0
GSIFI = global systemically important financial institution.
Note: Ratio of core Tier 1 capital to risk-weighted assets (%).
Source: Basel Committee on Banking Supervision, press release, 12 September 2010; assessment methodology and additional loss absorbency requirement for global systemically important banks, 19 July 2011.
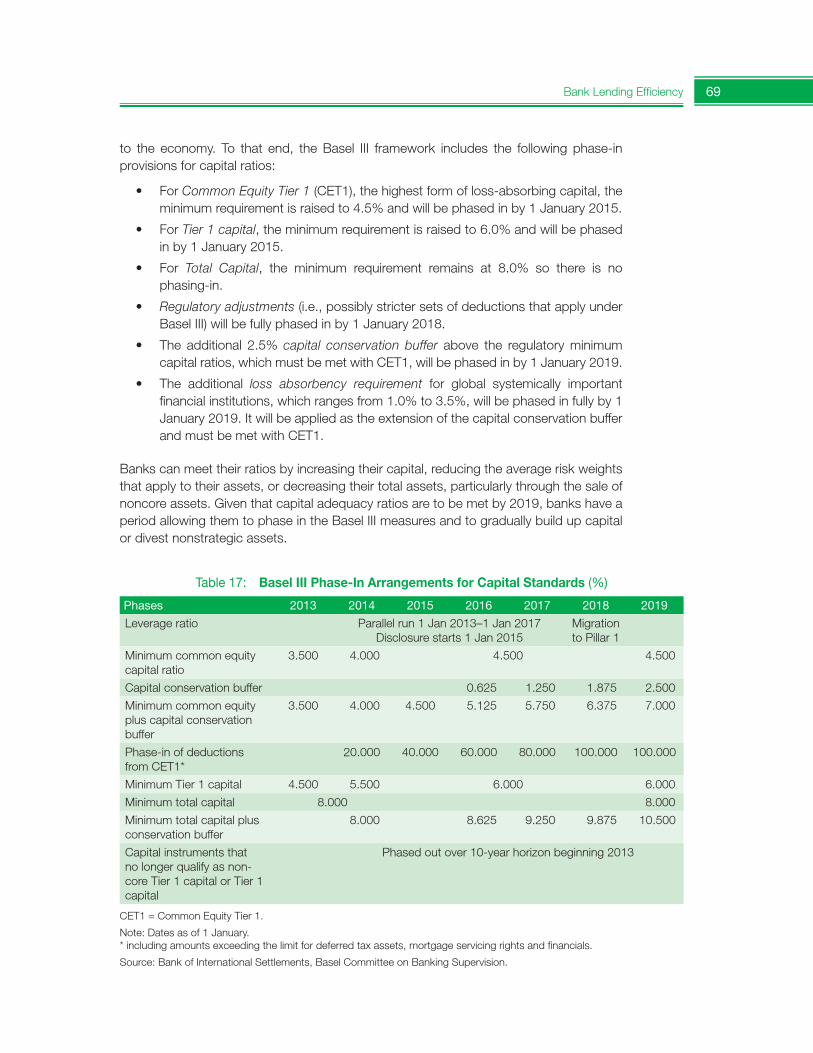
Bank Lending Efficiency 69
to the economy. To that end, the Basel III framework includes the following phase-in provisions for capital ratios:
• For Common Equity Tier 1 (CET1), the highest form of loss-absorbing capital, the minimum requirement is raised to 4.5% and will be phased in by 1 January 2015.
• For Tier 1 capital, the minimum requirement is raised to 6.0% and will be phased in by 1 January 2015.
• For Total Capital, the minimum requirement remains at 8.0% so there is no phasing-in.
• Regulatory adjustments (i.e., possibly stricter sets of deductions that apply under Basel III) will be fully phased in by 1 January 2018.
• The additional 2.5% capital conservation buffer above the regulatory minimum capital ratios, which must be met with CET1, will be phased in by 1 January 2019.
• The additional loss absorbency requirement for global systemically important financial institutions, which ranges from 1.0% to 3.5%, will be phased in fully by 1 January 2019. It will be applied as the extension of the capital conservation buffer and must be met with CET1.
Banks can meet their ratios by increasing their capital, reducing the average risk weights that apply to their assets, or decreasing their total assets, particularly through the sale of noncore assets. Given that capital adequacy ratios are to be met by 2019, banks have a period allowing them to phase in the Basel III measures and to gradually build up capital or divest nonstrategic assets.
Table 17: Basel III Phase-In Arrangements for Capital Standards (%)
Phases 2013 2014 2015 2016 2017 2018 2019
Leverage ratio Parallel run 1 Jan 2013–1 Jan 2017 Disclosure starts 1 Jan 2015
Migration to Pillar 1
Minimum common equity capital ratio
3.500 4.000 4.500 4.500
Capital conservation buffer 0.625 1.250 1.875 2.500
Minimum common equity plus capital conservation buffer
3.500 4.000 4.500 5.125 5.750 6.375 7.000
Phase-in of deductions from CET1*
20.000 40.000 60.000 80.000 100.000 100.000
Minimum Tier 1 capital 4.500 5.500 6.000 6.000
Minimum total capital 8.000 8.000
Minimum total capital plus conservation buffer
8.000 8.625 9.250 9.875 10.500
Capital instruments that no longer qualify as non-core Tier 1 capital or Tier 1 capital
Phased out over 10-year horizon beginning 2013
CET1 = Common Equity Tier 1.
Note: Dates as of 1 January. * including amounts exceeding the limit for deferred tax assets, mortgage servicing rights and financials.
Source: Bank of International Settlements, Basel Committee on Banking Supervision.
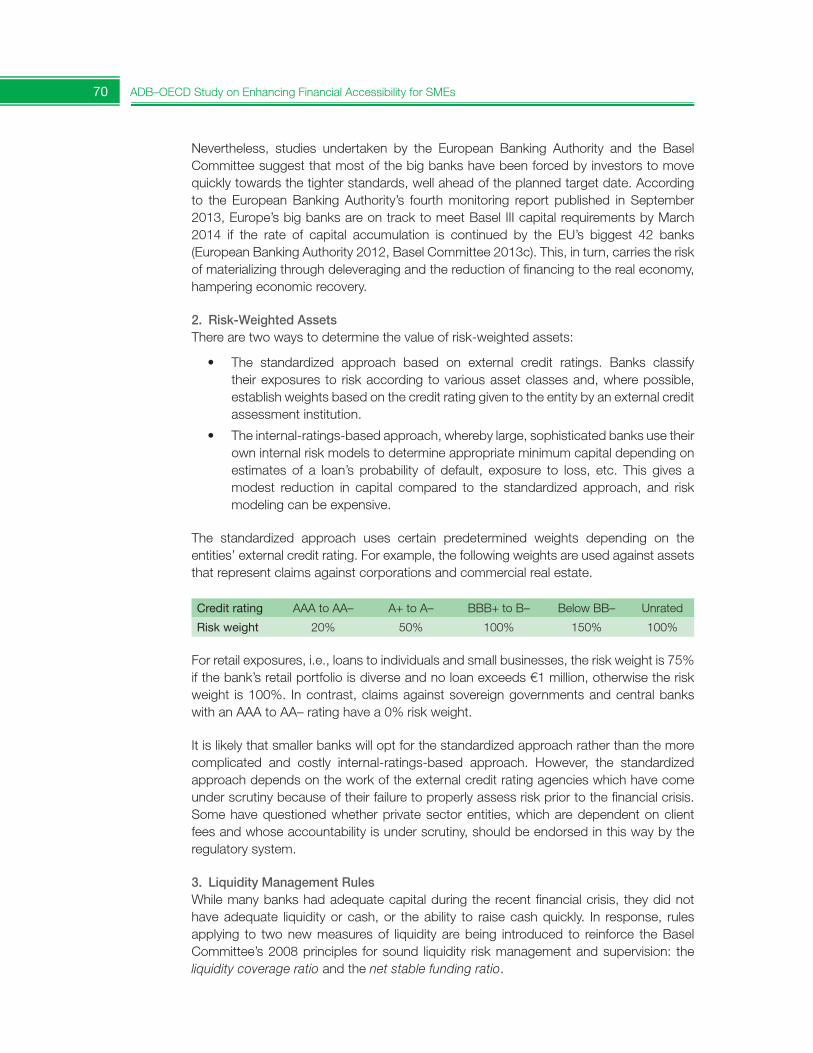
70 ADB–OECD Study on Enhancing Financial Accessibility for SMEs
Nevertheless, studies undertaken by the European Banking Authority and the Basel Committee suggest that most of the big banks have been forced by investors to move quickly towards the tighter standards, well ahead of the planned target date. According to the European Banking Authority’s fourth monitoring report published in September2013, Europe’s big banks are on track to meet Basel III capital requirements by March 2014 if the rate of capital accumulation is continued by the EU’s biggest 42 banks (European Banking Authority 2012, Basel Committee 2013c). This, in turn, carries the risk of materializing through deleveraging and the reduction of financing to the real economy, hampering economic recovery.
2. Risk-Weighted AssetsThere are two ways to determine the value of risk-weighted assets:
• The standardized approach based on external credit ratings. Banks classify their exposures to risk according to various asset classes and, where possible, establish weights based on the credit rating given to the entity by an external credit assessment institution.
• The internal-ratings-based approach, whereby large, sophisticated banks use their own internal risk models to determine appropriate minimum capital depending on estimates of a loan’s probability of default, exposure to loss, etc. This gives a modest reduction in capital compared to the standardized approach, and risk modeling can be expensive.
The standardized approach uses certain predetermined weights depending on the entities’ external credit rating. For example, the following weights are used against assets that represent claims against corporations and commercial real estate.
Credit rating AAA to AA– A+ to A– BBB+ to B– Below BB– Unrated
Risk weight 20% 50% 100% 150% 100%
For retail exposures, i.e., loans to individuals and small businesses, the risk weight is 75% if the bank’s retail portfolio is diverse and no loan exceeds €1 million, otherwise the risk weight is 100%. In contrast, claims against sovereign governments and central banks with an AAA to AA– rating have a 0% risk weight.
It is likely that smaller banks will opt for the standardized approach rather than the more complicated and costly internal-ratings-based approach. However, the standardized approach depends on the work of the external credit rating agencies which have come under scrutiny because of their failure to properly assess risk prior to the financial crisis. Some have questioned whether private sector entities, which are dependent on client fees and whose accountability is under scrutiny, should be endorsed in this way by the regulatory system.
3. Liquidity Management Rules While many banks had adequate capital during the recent financial crisis, they did not have adequate liquidity or cash, or the ability to raise cash quickly. In response, rules applying to two new measures of liquidity are being introduced to reinforce the Basel Committee’s 2008 principles for sound liquidity risk management and supervision: the liquidity coverage ratio and the net stable funding ratio.
Bank Lending Efficiency 71
a. Liquidity Coverage Ratio The liquidity coverage standard requires banks to maintain an adequate level of unencumbered, high-quality liquid assets that can be converted into cash to meet their liquidity needs for a 30-calendar-day time horizon under a significantly severe liquidity stress scenario specified by bank supervisors. Rules will apply to the liquidity coverage ratio, defined as the stock of high-quality liquid assets over total net cash outflows of 30 days. The initial proposal required that the value of the ratio be no lower than 100%, and the standard would come into effect by 2015.
If these liquidity management rules were implemented too quickly it could undermine the chances of economic growth should banks pull back on lending in order to reduce their liquidity needs. To that end, the Basel Committee on Banking Supervision softened the liquidity requirements on 6 January 2013, delaying their full implementation until 2019 and allowing banks an additional 4 years to comply with the new liquidity rules, taking off some of the pressure. The liquidity coverage ratio will be introduced as planned on 1 January2015 but the minimum requirement will begin at 60%, rising in equal annual steps of 10 percentage points to reach 100% on 1 January 2019. This graduated approach is designed to ensure that the ratio can be introduced without disruption to the orderly strengthening of banking systems or the ongoing financing of economic activity (Bank for International Settlements 2013a).
The Basel Committee has also widened the definition of liquidity to allow banks to use some higher-yielding assets (e.g., high-quality, mortgage-backed securities). Moreover, the committee changed the calculation of the liquidity requirements, known as run-off rates, for some corporate and retail business lines, to reduce the total requirement. Similarly, universal banks are only required to hold liquidity equal to 3% of their insured retail deposits, rather than 5% as initially expected. This, however, applies only to banksoperating in countries where deposit protection schemes are funded ahead of a crisis. The committee has also added guidance that a bank may run down its liquidity stockpile in a crisis, with the permission of its supervisor (Financial Times 2013a, 2013b).
b. Net Stable Funding RatioThe net stable funding ratio measures the amount of longer-term, stable sources of funding employed by banks, relative to the liquidity profiles of the assets funded and the potential for contingent calls on funding liquidity arising from off-balance-sheet commitments andobligations. Rules for the net stable funding ratio are designed to promote stable sources of funding. Although calibration of these rules is ongoing, the time horizon of 1 year is expected to provide a sustainable maturity structure of assets and liabilities. Rules will become effective in 2018.
4. The Leverage RatioThe leverage ratio of 3% is a non-risk-weighted supplementary measure to the risk-based capital adequacy ratios. The ratio of Tier 1 capital to total, i.e., unweighted assets, will be tested in parallel with the risk-based system with a view to making it binding in 2018, based on appropriate review and calibration. If fully implemented, it will provide a simple, easy to understand “sanity check” for the results produced by the risk-based framework. The leverage ratio is an additional test of capital adequacy to serve as a safety net to protect against problems with risk weightings. It requires a 100% risk-weight treatment of
72 ADB–OECD Study on Enhancing Financial Accessibility for SMEs
all balance sheet items43 and includes certain off-balance-sheet exposures. The leverage ratio effectively acts as a backstop for highly levered banks, as it is a non-risk-based measure that complements the risk-weighted capital requirements. The Basel Committee has decided to study the rule’s impact and potential consequences on the economy before making it mandatory.
D. Potential Impact on SME Lending
The purpose of Basel III is to mitigate and possibly avoid future financial crises. It should be noted that, at the time of the recent financial crisis, Basel II had only recently been implemented, and not in all countries. Therefore, its rules had never been tested on a broad scale in a noncrisis environment. If Basel III is implemented, it could have a positive effect on both growth and, as a result, on SME lending. Some argue that SMEs are more affected by financial instability than large firms or households. SMEs are less able to hedge against a financial crisis than large firms, and they cannot rely on public safety nets as households do. SMEs are highly dependent on external finance. Thus, their prosperity might be relatively more dependent on economic and financial stability.
Nevertheless, a number of critics are certain that Basel III will have an impact on enterprise lending. “It is beyond serious dispute that loans and other banking services will become more expensive and harder to obtain under Basel III. The real argument is about the degree, not the direction” (Elliott 2010). Others are not convinced that this would be so, because central banks could always mitigate the higher interest rates.
If the Basel III rules affect enterprise lending, they will affect eurozone enterprises more than United States enterprises, since eurozone enterprises rely on banks for 74% of their funding compared to 24% for United States enterprises (Associazione Bancaria Italiana 2011). Problems could arise from the manner in which banks achieve their capital adequacy ratios. Either they can increase capital or decrease their risk-weighted assets. It might be difficult for some banks to raise capital after the financial crisis, and so they might sell off or reduce high risk-weighted or nonstrategic assets in order to reduce their total risk-weighted assets. Thus, they would engage in arbitrage, swapping high risk-weighted assets, mainly lending to businesses, for lower ones such as sovereign debt, interbank claims, and residential mortgages. It should be noted that this scope for arbitraging the risk weights downward implies that there could be no floor for the minimum capital requirements (Atkinson 2011b).
1. Impact of the Risk-Weighting SystemAs Basel III carries over the risk-weighting system for assets from Basel II, it retains the capital requirements that are sensitive to risk, which, in the initial proposal of the Basel Committee, discourage bank lending to SMEs as the risk premium that banks charge for SMEs is high. As a result, it exacerbates the well-known financial difficulties of SMEs (Cardone-Riportella and Trujillo-Ponce 2007). According to Blundell-Wignall and Atkinson (2010a, 2010b), the initial proposals for capital reform—the new Basel III—did notaddress the fundamental problems with the risk-weighting approach. Since the particular
43 This is subject to the qualification that many derivative positions, mainly for banks using the International Financial Reporting Standards (IFRS) accounting, can be netted out in a way consistent with Basel II rules.
Bank Lending Efficiency 73
credit risk associated with individual borrowers in different businesses and regions is not well catered for in the analytical framework, it leaves Basel III with the same problem as Basel II: undue reliance on cumbersome supervisory override that has not worked wellin the past.
The Basel Committee on Banking Supervision has taken this issue into consideration and revised the formulas for calculating the regulatory capital associated with SME lending.44
The main modification is that the retail risk rating (75%) can be used to weight SME loans, provided the bank’s portfolio is diverse and the bank’s loan to an SME borrower is less than €1 million.
Basel III regulations also allow enterprises to make use of collateral and collateral substitutes such as government guarantees, which can reduce or mitigate the risk weights. Under the standardized approach, the credit rating of the collateral or the guarantor will be substituted for the rating of the borrower for the collateralized portion of the exposure if certain conditions are met. Specifically, the collateral must be marked-to-market and revalued every 6 months. Furthermore, there is a 20% floor on the risk weight that has been adjusted by using credit risk mitigation. For example, if the SME loan is secured by a residential property, the risk weight is 35%; if it is secured by commercial business property, the risk weight is 100%; if it is guaranteed by a government, the risk weight could be 0%.
Government guarantees or guarantees from mutual guarantee associations traditionally have helped SMEs access finance and obtain better conditions in terms of rate, credit amount, and term (Camino and Cardone 1999). The increase in guarantee funds has eased SMEs’ access to finance in some countries both during and after the crisis. The new banking regulation could increase the use of guarantees. Guaranteed loans canbe backed by reduced amounts of regulatory capital when compared with those loans collateralized by assets (financial or not). In fact, guarantees issued by entities with a lower risk weight than the SME can lead to reduced regulatory capital since the protected portion of the SME exposure is assigned the risk weight of the guarantor and the uncovered portion retains the risk weight of the SME. For example, where the guarantor is a sovereign government with a AAA rating, the risk weight for the guaranteed portion of the SME loan would be zero. However, a revision in these ratings to lower levels is under way in some countries which means that guaranteed SME loans would have to bebacked by increased amounts of capital.
The question remains to what degree banks will make increased use of government guarantees as a credit risk mitigation technique. In the past, government guarantees have been used as a substitute for collateral and as such partially improved SMEs’ access to credit. In countries such as the United States, banks have been reluctant to participate in the Small Business Administration’s loan guarantee program, leaving at times large amounts of guarantee funds unused. This could reflect their reluctance in general to service SMEs even when their risks are reduced by guarantees. Basel III could provide
44 Under the Basel Capital Accords, a company is identified as an SME when the reported sales for the consolidated group of which the firm is part are less than €50 million (Cardone-Riportella, Trujillo-Ponce, and Briozzo 2011).
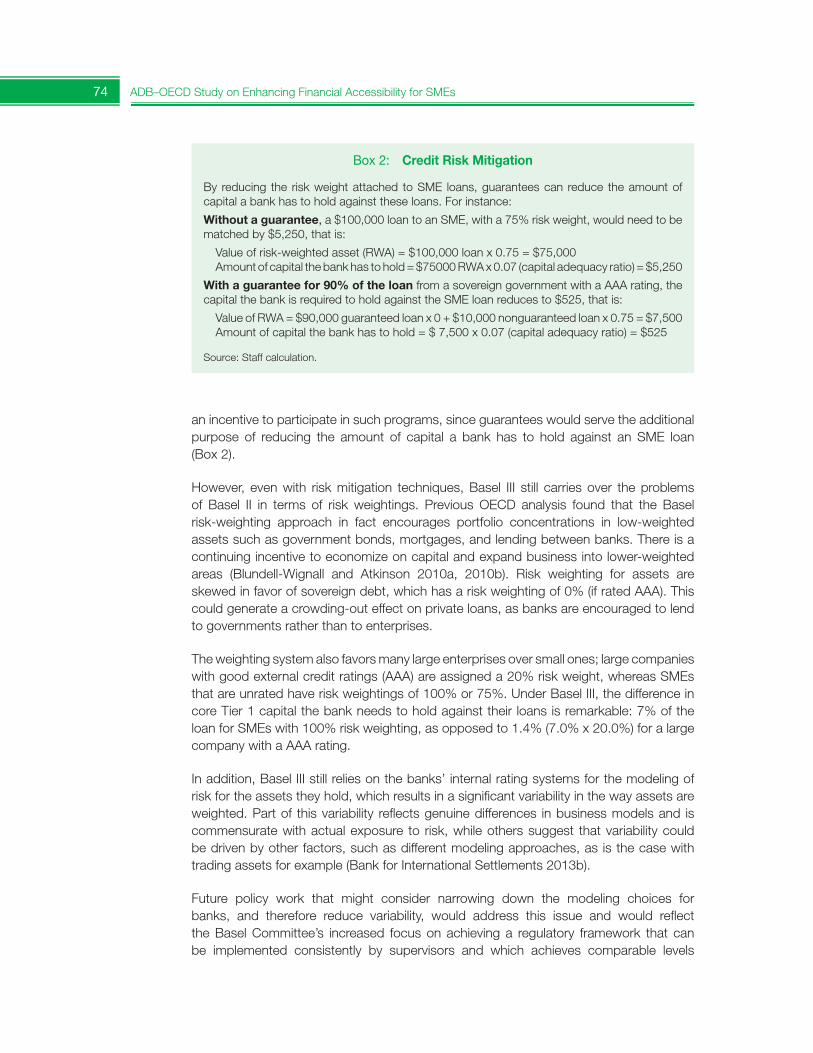
74 ADB–OECD Study on Enhancing Financial Accessibility for SMEs
an incentive to participate in such programs, since guarantees would serve the additional purpose of reducing the amount of capital a bank has to hold against an SME loan (Box 2).
However, even with risk mitigation techniques, Basel III still carries over the problems of Basel II in terms of risk weightings. Previous OECD analysis found that the Basel risk-weighting approach in fact encourages portfolio concentrations in low-weighted assets such as government bonds, mortgages, and lending between banks. There is a continuing incentive to economize on capital and expand business into lower-weighted areas (Blundell-Wignall and Atkinson 2010a, 2010b). Risk weighting for assets areskewed in favor of sovereign debt, which has a risk weighting of 0% (if rated AAA). This could generate a crowding-out effect on private loans, as banks are encouraged to lend to governments rather than to enterprises.
The weighting system also favors many large enterprises over small ones; large companies with good external credit ratings (AAA) are assigned a 20% risk weight, whereas SMEs that are unrated have risk weightings of 100% or 75%. Under Basel III, the difference in core Tier 1 capital the bank needs to hold against their loans is remarkable: 7% of the loan for SMEs with 100% risk weighting, as opposed to 1.4% (7.0% x 20.0%) for a large company with a AAA rating.
In addition, Basel III still relies on the banks’ internal rating systems for the modeling of risk for the assets they hold, which results in a significant variability in the way assets are weighted. Part of this variability reflects genuine differences in business models and is commensurate with actual exposure to risk, while others suggest that variability could be driven by other factors, such as different modeling approaches, as is the case with trading assets for example (Bank for International Settlements 2013b).
Future policy work that might consider narrowing down the modeling choices for banks, and therefore reduce variability, would address this issue and would reflectthe Basel Committee’s increased focus on achieving a regulatory framework that can be implemented consistently by supervisors and which achieves comparable levels
Box 2: Credit Risk Mitigation
By reducing the risk weight attached to SME loans, guarantees can reduce the amount of capital a bank has to hold against these loans. For instance:
Without a guarantee, a $100,000 loan to an SME, with a 75% risk weight, would need to be matched by $5,250, that is:
Value of risk-weighted asset (RWA) = $100,000 loan x 0.75 = $75,000 Amount of capital the bank has to hold = $75000 RWA x 0.07 (capital adequacy ratio) = $5,250
With a guarantee for 90% of the loan from a sovereign government with a AAA rating, the capital the bank is required to hold against the SME loan reduces to $525, that is:
Value of RWA = $90,000 guaranteed loan x 0 + $10,000 nonguaranteed loan x 0.75 = $7,500 Amount of capital the bank has to hold = $ 7,500 x 0.07 (capital adequacy ratio) = $525
Source: Staff calculation.
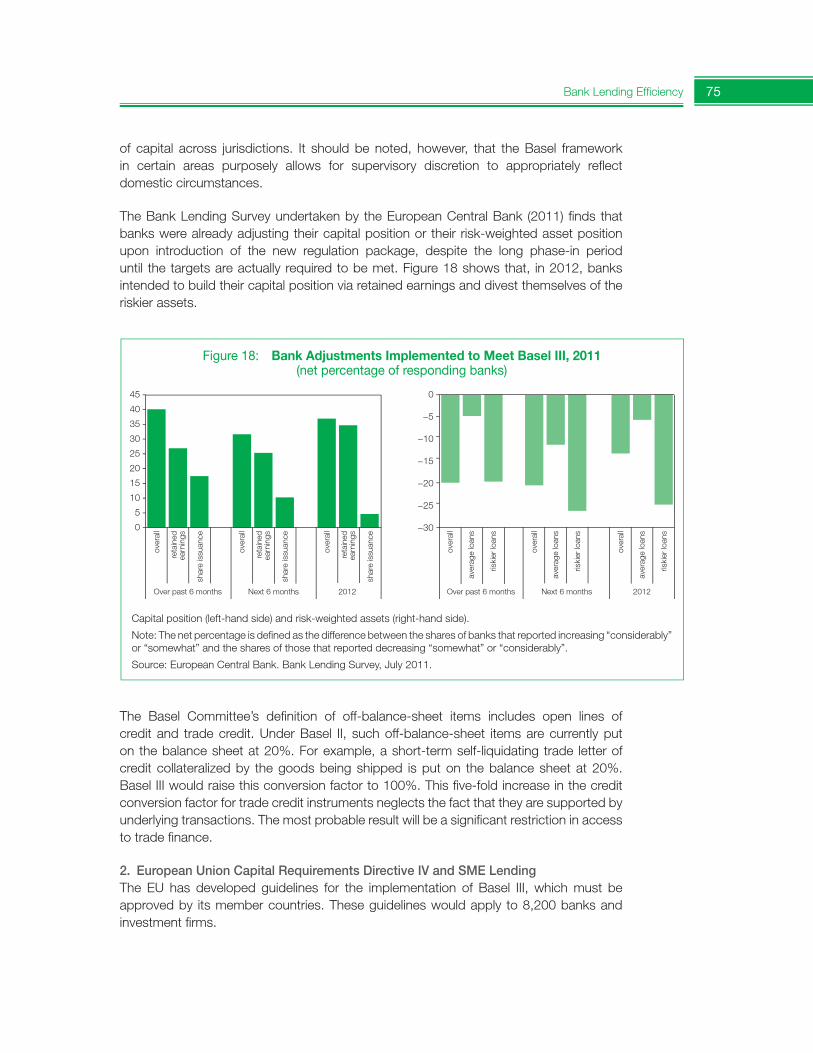
Bank Lending Efficiency 75
of capital across jurisdictions. It should be noted, however, that the Basel frameworkin certain areas purposely allows for supervisory discretion to appropriately reflect domestic circumstances.
The Bank Lending Survey undertaken by the European Central Bank (2011) finds that banks were already adjusting their capital position or their risk-weighted asset position upon introduction of the new regulation package, despite the long phase-in period until the targets are actually required to be met. Figure 18 shows that, in 2012, banks intended to build their capital position via retained earnings and divest themselves of theriskier assets.
The Basel Committee’s definition of off-balance-sheet items includes open lines of credit and trade credit. Under Basel II, such off-balance-sheet items are currently puton the balance sheet at 20%. For example, a short-term self-liquidating trade letter of credit collateralized by the goods being shipped is put on the balance sheet at 20%. Basel III would raise this conversion factor to 100%. This five-fold increase in the credit conversion factor for trade credit instruments neglects the fact that they are supported by underlying transactions. The most probable result will be a significant restriction in access to trade finance.
2. European Union Capital Requirements Directive IV and SME LendingThe EU has developed guidelines for the implementation of Basel III, which must be approved by its member countries. These guidelines would apply to 8,200 banks and investment firms.
Figure 18: Bank Adjustments Implemented to Meet Basel III, 2011 (net percentage of responding banks)
Capital position (left-hand side) and risk-weighted assets (right-hand side).
Note: The net percentage is defined as the difference between the shares of banks that reported increasing “considerably” or “somewhat” and the shares of those that reported decreasing “somewhat” or “considerably”.
Source: European Central Bank. Bank Lending Survey, July 2011.
45
40
35
30
25
20
15
10
5
0
0
−5
−10
−15
−20
−25
−30
over
all
reta
ined
earn
ings
shar
e is
suan
ce
over
all
reta
ined
earn
ings
shar
e is
suan
ce
over
all
reta
ined
earn
ings
shar
e is
suan
ce
over
all
aver
age
loan
s
riski
er lo
ans
over
all
aver
age
loan
s
riski
er lo
ans
over
all
aver
age
loan
s
riski
er lo
ans
Over past 6 months Next 6 months 2012 Over past 6 months Next 6 months 2012
76 ADB–OECD Study on Enhancing Financial Accessibility for SMEs
On 17 July 2013, the so-called Capital Requirements Directive IV (CRD IV) package which transposes—via a regulation and a directive—the Basel III agreement into EU law entered into force. The new rules, which apply from 1 January 2014, tackle some of the vulnerabilities shown by the banking institutions during the crisis, i.e., the insufficient level of capital, both in quantity and in quality, resulting in the need for unprecedented support from national authorities. They set stronger prudential requirements for banks, requiringthem to keep sufficient capital reserves and liquidity. This new framework is intended to make EU banks more solid and strengthen their capacity to adequately manage the risks linked to their activities and absorb any losses they may incur in doing business.
Impending restrictions in SME lending resulting from the implementation of Basel III have been addressed at the European level through the implementation of CRD IV, which could help to make SME lending more viable in the new regulatory environment. To that end, a specific amendment of CRD IV stipulates that capital charges for exposures to SMEs are reduced through the application of a supporting factor equal to 0.7619 to allow credit institutions to increase lending to SMEs (EU 2013). The supporting factor would imply an immediate reduction in capital for SMEs and will ultimately neutralize the future capital conservation buffer (0.7619 corresponds to the ratio between the current ratio, which is 8.0%, and the new one inclusive of the capital conservation buffer, whichis 10.5%) and will therefore ensure that an 8.0% capital requirement will be applied to SME retail exposures after 2019 once the new standards are fully phased in.
To achieve the objective of boosting lending to SMEs, credit institutions should effectively use the capital relief produced through the application of the supporting factor for the exclusive purpose of providing an adequate flow of credit to SMEs established in the EU. Competent authorities should monitor periodically the total amount of exposures to SMEs of credit institutions and the total amount of capital deduction (EU 2013).
Regulatory scrutiny is, however, likely to continue to have an impact on SME lending, particularly in light of the upcoming stress tests by the European Central Bank and the in-depth balance sheet reviews as it prepares to take on bank supervision as part of the single European supervisory mechanism.
3. Impact of the Liquidity Coverage RatioAccording to liquidity coverage rules, banks must hold sufficient easy-to-sell assets. This will increase the cost of business lines that tie up liquid assets, such as payment services and foreign trade finance which is low risk (Financial Times 2010b).
The liquidity coverage ratio could also push banks to hold more sovereign debt (Bank for International Settlements, 2010). According to Blundell-Wignall and Atkinson (2010a,2010b), like the risk-weighting system, the liquidity coverage ratio has a bias towards government bonds. While budget deficits are large and it may be handy from the viewpoint of interest rate risk to have captured buyers, this process will work against lending to the private sector and particularly to SMEs.
Furthermore, according to the liquidity coverage ratio standard, banks must hold liquid assets equal to 100% of undrawn lines of credit that are used for liquidity purposes; 100% liquidity coverage for revolving credit could make this facility more expensive (Financial
Bank Lending Efficiency 77
Times 2010a). Business representatives in different countries expressed the business community’s concern that liquidity issues will force banks to be more restrictive in terms of credit (Financial Times 2010a, Associazione Bancaria Italiana 2011).
A similar concern was expressed by the European Association of Craft, Small and Medium-Sized Enterprises in its comments on the Basel III agreement. While it welcomed the principles underlying the reform, the association warned about the risk of procyclical effects of the regulation. It also urged that, when moving to the implementation of Basel III, the specificities of cooperatives and savings banks are respected as regards their capital, in order to limit problems for access to finance for SMEs in many regions of Europe.
4. The Debate at the National Level: Perspectives from Countries in the OECD Scoreboard on Financing SMEs and Entrepreneurs
Discussions on the impact of Basel III have been taking place in many countries, informed by quantitative studies which have been undertaken to understand the impacts of the reform on the economy and lending. An OECD questionnaire submitted to experts from the countries participating in the OECD Scoreboard on Financing SMEs and Entrepreneurs 2012 revealed different views on the implications of Basel III for SMEs’ access to bank finance. While the sample for this survey was relatively small, its findings nevertheless shed light on the potential effects of Basel III on SME lending in the countries monitored.
While some experts expected little or even a positive impact on SME lending, others foresaw more severe effects, particularly on SMEs which are heavily indebted or dependent on bank credit. There was some expectation that the negative effects might be attenuated by a number of factors or would gradually dissipate. For example, the new rules maintain the Basel II risk weightings, under which the banks might be subject to smaller capital charges for loans to small enterprises compared to large enterprises. Since large banks would be most affected, and since SMEs are less likely to use large banks, they may not be overly penalized if small and medium-sized banks continued to lend. Most small and medium-sized banks, with their local roots and close relationships with customers, have a large enough capital base to maintain an adequate flow of funds to their customers. One country expert believed that commercial banks would continue to lend to SMEs because margins were higher than on loans to large enterprises. Finally, some experts stated that their banks were well capitalized and already met the core Tier 1 capital ratio, so that any deposit-taking institutions that needed to raise more capital would likely rely on prudent earnings retention.
In terms of action being taken by banks, on the basis of early assessments and monitoring at the national level, it was reported that they are acting in advance of the promulgation of any national rules implementing Basel III, in effect shortening the transition period. Mostare strengthening capital by issuing shares, retaining profits, reducing dividends, and disposing of nonstrategic assets.
While none of the governments surveyed has enacted rules to implement Basel III, they have undertaken a number of Basel-related actions. Some have enacted, or intend to enact, higher capital requirements than required for banks that pose systemic risks. Others are engaging in mitigating the possible negative impacts on SME lending by retainingcrisis measures, particularly in the area of government guarantees. Some thought that
78 ADB–OECD Study on Enhancing Financial Accessibility for SMEs
the national financial reforms might have a bigger impact on SME lending than Basel III,particularly if the move to separate retail banking from investment banking succeeded.
The results of this small survey are similar to those of other recent reports. Rather than taking the allowed 8 years to meet requirements, banks seem to be competing with each other to boost capital and liquidity, possibly in order to retain a good credit rating. Accumulating reserves in the midst of a weak recovery, when bankruptcies are still rising in some countries, could have negative impacts on the growth of the real economy and job creation. Policy makers might want to consider exerting pressure to promote a more gradual approach by banks to meet Basel III standards as specified in the Basel timelines themselves. Even the Basel Macro Assessment Group has suggested that, for bank-dependent sectors (like SMEs), a longer implementation period could allow for the development of nonbank lending channels, thus improving the impact of new rules on lending (Association of Chartered Certified Accountants 2011).
References
Association of Chartered Certified Accountants. 2011. Framing the debate: Basel III and SMEs. London.
Associazione Bancaria Italiana. 2011. Basel 3: corrections needed to avoid the risk of credit restrictions. Press release. 20 June.
Atkinson, P. 2011a. Possible Impact of Basel III on SME Lending. WPSMEE Informal Steering Group on SME and Entrepreneurship Financing and Country Experts. Paris: OECD. 16 September.
______. 2011b. Basel III in the Global Regulatory Framework. Presentation to Banca IMI conference. The Debt Crisis: Different Rules for a Different World. New York. 20 May.
Bank for International Settlements. 2010. Basel III: International framework for liquidity risk measurement, standards, and monitoring. Basel. December.
______. 2013a. Group of Governors and Heads of Supervision endorses revised liquidity standard for banks. Basel: Basel Committee on Banking Supervision. January.
______. 2013b. Regulatory Consistency Assessment Programme—Analysis of risk-weighted assets for market risk. Basel: Basel Committee on Banking Supervision.January.
______. 2013c. Basel III Monitoring Report. Basel: Basel Committee on Banking Supervision. September.
Blundell-Wignall, A. and P. Atkinson. 2010a. Thinking Beyond Basel III: Necessary Solutions for Capital and Liquidity. OECD Journal Vol. 2010 Issue 1.
______. 2010b. What Will Basel III Achieve. German Marshall Fund of the United States and Groupe d’Economie Mondiale de Sciences Po, November. http://gem.sciences-po.fr/content/publications/pdf/Blundell_Atkinson_Basel_III_achievements112010.pdf
Bank Lending Efficiency 79
Camino, D. and C. Cardone. 1999. The Valuation and Cost of Credit Insurance Schemes for SME’s: the Role of the Loan Guarantee Associations. International Small Business Journal 17, 13–31.
Cardone-Riportella, C. and A. Trujillo-Ponce. 2007. Efectos del aval de las SGRs en la financiación de las PYME y los requerimientos de capital de Basilea II. Revista Española de Financiación y Contabilidad 36, 753–85.
Cardone-Riportella, C., A. Trujillo-Ponce, and A. Briozzo. 2010. What do Basel Capital Accords Mean for SMEs? Working Paper 10, Business Economics Series 04. University Carlos III de Madrid. April.
Elliott, D., 2010. Basel III the Banks and the Economy. Brookings Paper. July.
European Association of Craft, Small and Medium-Sized Enterprises (UEAPME). 2010. New Capital Requirements for Banks (Basel III). Comments from UEAPME. Brussels: 27 October.
European Banking Authority. 2012. Assessment of SME proposals for CRD IV/CRR. September.
European Central Bank. 2011. Bank Lending Survey. July.
European Union. 2013. Regulation No 575/2013 of the European Parliament and of the Council on prudential requirements for credit institutions and investment firms and amending Regulation (EU) No 648/2012. June.
Financial Times. 2010a. Basel threat on borrowing. 10 September. p.13.
______. 2010b. Liquidity rules to squeeze smaller banks on processing of payments.31 December, p. 1.
______. 2013a. Basel bends on liquidity rules. 7 January.
______. 2013b. Banks to miss out on Basel softening. 9 January.
Parisot, L. 2010. View from the top. Financial Times. 9 August
80 ADB–OECD Study on Enhancing Financial Accessibility for SMEs
2.3. Sustainable Credit Guarantee Schemes for SMEs
2.3.1. Sustainable Credit Guarantee Schemes for SMEs: Lessons from Asia
Shigehiro Shinozaki45
Credit guarantees are a popular tool for improving SME access to finance in line with national SME development policies and poverty reduction strategies. In Asia, credit guarantees are provided by specialized institutions—either partially sponsored or fully owned by the government—and target SMEs as main clients, including female entrepreneurs and agri-businesses. Various guarantee products have been developed in Asia in response to specific country needs, with risk-sharing arrangements between guarantee institutions and financial institutions being relatively well-established. Although there is no universal prescription for increasing SME access to finance, credit guarantees are playing an important role in filling the SME financing gap in Asia. At the same time, credit guarantees open the door for a debate on potentially negative effects. This section reviews the credit guarantee systems and performance in selected Asian countries, and discusses the benefits and challenges regarding credit guarantees in supporting SME access to finance sustainably.
A. Introduction
In Asia, credit guarantees are mostly provided by specialized institutions—either partially sponsored or fully owned by the government—and target SMEs as main clients, including female entrepreneurs and agri-businesses. There are two critical reasons behind this arrangement. First, credit guarantees are typically utilized as a tool to improve SME access to finance in line with national SME development policies and poverty reduction strategies, which requires public initiatives for guarantee operations. Second, guarantee business copes with risky segments of enterprises and it is generally hard to maintain sufficient profits for sustainable operations, which results in fewer private-led guarantee institutions in Asia.
Going back to the basics, credit guarantees have four fundamental functions: (i) standardized operations, (ii) continuity of services, (iii) fee business (not gratuitous), and (iv) supplementary business to debt financing. Considering these functions, sophisticated institutional arrangements are needed for guarantee services to effectively reach out to end users. In particular, the guarantee industry cannot be formed as a standalone business; the provision of loans or other debt financing is a precondition for doing guarantee business. The quality of loan assets seriously affects the performance of credit guarantees. Thus, the issue of how to cope with backing SME loan assets is also key for designing a sustainable credit guarantee scheme.
Lessons from the recent and past financial crises have motivated countries to develop various guarantee products and services in Asia, adjusting them to specific country
45 Financial Sector Specialist (SME Finance), Office of Regional Economic Integration, Asian Development Bank. [email protected].
Bank Lending Efficiency 81
needs. Although there is no universal prescription for increasing SME access to finance,credit guarantees are playing an important role in filling the SME financing gap in Asia. At the same time, credit guarantees open the door for a debate on potentially negative effects.
B. Credit Guarantee Systems in Asia
Table 18 summarizes the credit guarantee systems in selected Asian economies, which was extracted from the data compiled by the Asian Credit Supplementation Institution Confederation (ACSIC). Credit guarantees have mostly been provided by specialized public institutions, except for Sri Lanka where the central bank takes a role of guarantor. Guarantee programs mainly target micro, small, and medium-sized enterprises (MSMEs) as beneficiaries, and often focus on particular segments such as women entrepreneurs (India) and agri-businesses (Nepal and Sri Lanka). Credit guarantees are often regarded as a tool to support national strategies for SME development and poverty reduction in Asia, where they are of a strongly public nature. A variety of guarantee products have been developed, responding to the needs in various countries, where risk-sharing arrangements (partial guarantee schemes) between guarantee institutions and financial institutions are relatively well-established. Even in that case, however, financial institutions are typically requiring real estate security as collateral for loans to cover their remaining credit risks. Credit guarantee systems have been centralized in most Asian economies, while some countries such as Indonesia are seeking to develop regional guarantee systems through newly established local guarantee institutions, given that guarantee benefits are effectively reaching rural SMEs. At present, reguarantee systems (credit insurance) have yet to be established in emerging Asia.
C. Credit Guarantee Business Performance
According to ACSIC data, outstanding guaranteed liabilities accounted for 1.6% of gross domestic product (GDP) on average in selected Asian economies (Figure 19). In particular,a relatively large volume of guarantee provision was identified in Japan (7.4% of GDP); the Republic of Korea (6.2%);46 and Taipei,China (4.0%). In other Asian economies—India, Indonesia, Malaysia, Nepal, the Philippines, Sri Lanka, and Thailand—guaranteed liabilities accounted for around 1% or less. Meanwhile, guaranteed liabilities in advanced non-Asian economies—represented by France, Germany, Italy, the United Kingdom, and the United States—accounted for 0.5% of GDP on average. Although the scale ofguarantees provided varies by country, credit guarantees have been actively granted to enterprises in several Asian economies.
The increased trend of guarantee provision in Asia was identified, but SME access to guarantees is still being restricted, except in Japan and the Republic of Korea. While more than one-third of the total MSMEs were able to obtain guarantees for loans in Japan (36.7%) and the Republic of Korea (35.8%), on average 3.7% of MSMEs in other Asian
46 This ratio was calculated based on the total outstanding guaranteed liabilities of the Korea Credit Guarantee Fund (KODIT), the Korea Federation of Credit Guarantee Foundations (KOREG), and the Korea Technology Finance Corporation (KOTEC).
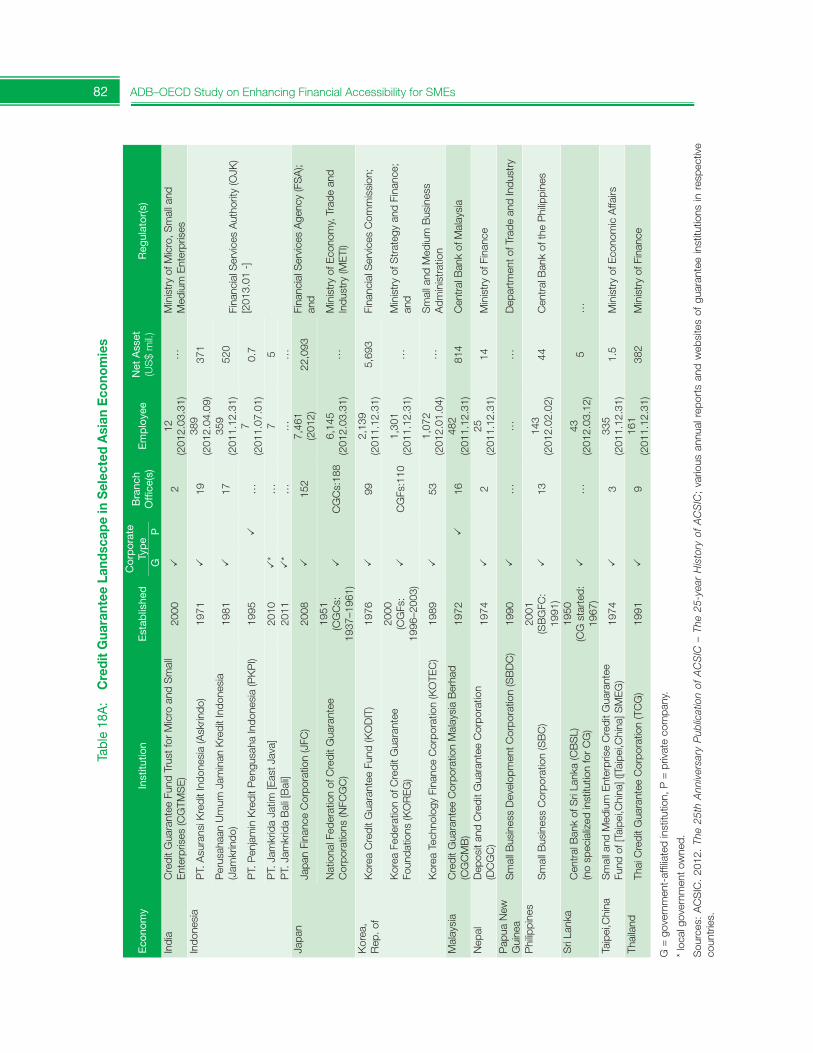
82 ADB–OECD Study on Enhancing Financial Accessibility for SMEsTa
ble
18A
: C
redi
t G
uara
ntee
Lan
dsca
pe in
Sel
ecte
d A
sian
Eco
nom
ies
G = governm
ent-affiliated institution, P = private company.
* lo
cal g
over
nmen
t ow
ned.
Sources: ACSIC. 2012.
The
25th
Ann
iver
sary
Pub
licat
ion
of A
CS
IC –
The
25-
year
His
tory
of
AC
SIC; various annual reports and websites of guarantee institutions in respective
coun
trie
s.
Econo
my
Inst
itutio
nE
stab
lishe
dC
orp
orat
e Type
Bra
nch
Office(s)
Employee
Net
Ass
et
(US$ mil.)
Reg
ulat
or(s
)G
PIn
dia
Credit G
uarantee Fund Trust for Micro and Small
Enterprises (C
GTM
SE)
2000
2
12
(201
2.03
.31)
…Ministry of Micro, Small and
Medium Enterprises
Indo
nesi
aP
T. A
sura
nsi K
redi
t Ind
ones
ia (A
skrin
do)
1971
19
389
(201
2.04
.09)
371
Financial Services Authority (OJK)
[201
3.01
-]
Perusahaan Umum
Jam
inan Kredit Indonesia
(Jam
krindo)
1981
17
359
(201
1.12
.31)
520
PT.
Pen
jam
in K
redi
t Pen
gusa
ha In
done
sia
(PK
PI)
1995
…
7 (2
011.
07.0
1)0.
7
PT. Jam
krida Jatim
[East Java]
2010
*
…7
5PT. Jam
krida Bali [Bali]
2011
*
……
…Japan
Japan Finance Corporation (JFC
)20
08
152
7,46
1 (2
012)
22,0
93Fi
nanc
ial S
ervi
ces
Age
ncy
(FS
A);
and
National Federation of Credit G
uarantee
Corporations (N
FCGC)
1951
(CGCs:
1937
–196
1)
CGCs:188
6,14
5 (2
012.
03.3
1)…
Ministry of Economy, Trade and
Industry (M
ETI)
Kor
ea,
Rep. of
Korea Credit G
uarantee Fund (KODIT)
1976
99
2,13
9 (2
011.
12.3
1)5,
693
Fina
ncia
l Ser
vice
s C
omm
issi
on;
Korea Federation of Credit G
uarantee
Foundations (KOREG)
2000
(CGFs:
1996
–200
3)
CGFs:110
1,30
1 (2
011.
12.3
1)…
Ministry of Strategy and Finance;
and
Kor
ea T
echn
olog
y Fi
nanc
e C
orpo
ratio
n (K
OTE
C)
1989
53
1,07
2 (2
012.
01.0
4)…
Small and Medium Business
Adm
inis
trat
ion
Malaysia
Credit G
uarantee Corporation Malaysia Berhad
(CGCMB)
1972
16
482
(201
1.12
.31)
814
Central Bank of Malaysia
Nep
alDeposit and Credit G
uarantee Corporation
(DCGC)
1974
2
25
(201
1.12
.31)
14Ministry of Finance
Pap
ua N
ew
Guinea
Sm
all B
usin
ess
Dev
elop
men
t Cor
pora
tion
(SB
DC
)19
90
……
…Department of Trade and Industry
Phi
lippi
nes
Sm
all B
usin
ess
Cor
pora
tion
(SB
C)
2001
(SBGFC
: 19
91)
13
143
(201
2.02
.02)
44Central Bank of the Philippines
Sri Lanka
Central Bank of Sri Lanka (CBSL)
(no specialized institution for CG)
1950
(CG started:
1967
)
…43
(2
012.
03.1
2)5
…
Taip
ei,C
hina
Small and Medium Enterprise Credit G
uarantee
Fund of [Taipei,China] ([Taipei,China] SMEG)
1974
3
335
(201
1.12
.31)
1.5
Ministry of Economic Affairs
Thai
land
Thai Credit G
uarantee Corporation (TCG)
1991
9
161
(201
1.12
.31)
382
Ministry of Finance
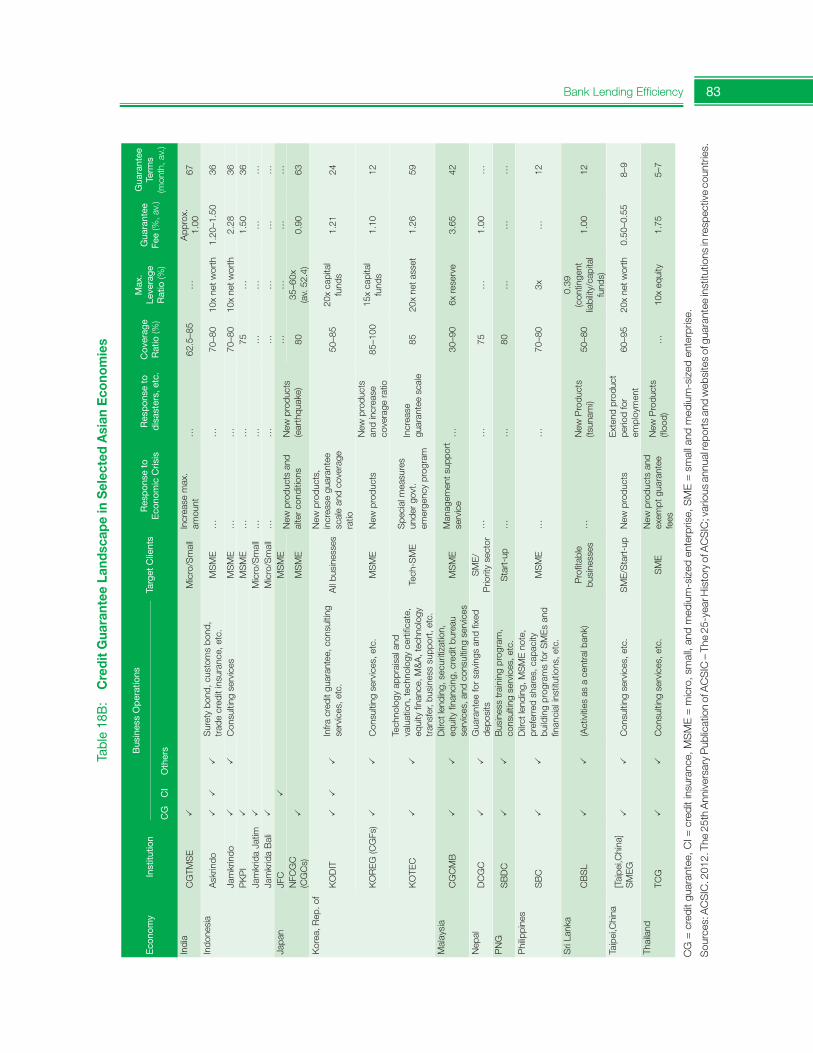
Bank Lending Efficiency 83Ta
ble
18B
: C
redi
t G
uara
ntee
Lan
dsca
pe in
Sel
ecte
d A
sian
Eco
nom
ies
CG = credit guarantee, C
I = credit insurance, M
SME = micro, small, and medium-sized enterprise, SME = small and medium-sized enterprise.
Sources: ACSIC. 2012. The 25th Anniversary Publication ofACSIC – The 25-year History of ACSIC; various annual reports and websites of guarantee institutions in respective countries.
Econo
my
Inst
itutio
nB
usin
ess
Op
erat
ions
Targ
et C
lient
sR
esp
onse
to
Eco
nom
ic C
risis
Res
pon
se t
o d
isas
ters
, etc
.C
over
age
Rat
io (%
)
Max
. Le
vera
ge
Rat
io (%
)
Gua
rant
ee
Fee (%, av.)
Gua
rant
ee
Term
s (m
onth
, av.
)C
GC
IO
ther
s
Indi
aCGTM
SE
Micro/Small
Incr
ease
max
. am
ount
…62
.5–8
5…
App
rox.
1.
0067
Indo
nesi
aA
skrin
do
Sur
ety
bond
, cus
tom
s bo
nd,
trad
e cr
edit
insu
ranc
e, e
tc.
MSME
……
70–8
010
x ne
t wor
th1.
20–1
.50
36
Jamkrindo
Con
sulti
ng s
ervi
ces
MSME
……
70–8
010
x ne
t wor
th2.
2836
PK
PI
MSME
……
75…
1.50
36Jamkrida Jatim
Micro/Small
……
……
……
Jamkrida Bali
Micro/Small
……
……
……
Japan
JFC
MSME
New
pro
duct
s an
d al
ter
cond
ition
sN
ew p
rodu
cts
(ear
thqu
ake)
……
……
NFC
GC
(CGCs)
MSME
8035
–60x
(a
v. 5
2.4)
0.90
63
Korea, R
ep. of
KO
DIT
Infra credit guarantee, consulting
serv
ices
, etc
.A
ll bu
sine
sses
New
pro
duct
s,
incr
ease
gua
rant
ee
scal
e an
d co
vera
ge
ratio
50–8
520
x ca
pita
l funds
1.21
24
KOREG (C
GFs)
C
onsu
lting
ser
vice
s, e
tc.
MSME
New
pro
duct
sN
ew p
rodu
cts
and
incr
ease
co
vera
ge r
atio
85–1
0015
x ca
pita
l funds
1.10
12
KO
TEC
Tech
nolo
gy a
ppra
isal
and
valuation, technology certificate,
equity finance, M&A, technology
transfer, business support, etc.
Tech-SME
Spe
cial
mea
sure
s un
der
govt
. em
erge
ncy
prog
ram
Incr
ease
gu
aran
tee
scal
e85
20x
net a
sset
1.26
59
Malaysia
CGCMB
Dilr
ct le
ndin
g, s
ecur
itiza
tion,
equity financing, credit bureau
serv
ices
, and
con
sulti
ng s
ervi
ces
MSME
Managem
ent support
serv
ice
…30
–90
6x re
serv
e3.
6542
Nep
alDCGC
Guarantee for savings and fixed
depo
sits
SME/
Prio
rity
sect
or…
…75
…1.
00…
PNG
SB
DC
Bus
ines
s tr
aini
ng p
rogr
am,
cons
ultin
g se
rvic
es, e
tc.
Sta
rt-u
p…
…80
……
…
Phi
lippi
nes
SB
C
Dilrct lending, MSME note,
preferred shares, capacity
building programs for SMEs and
financial institutions, etc.
MSME
……
70–8
03x
…12
Sri Lanka
CBSL
(Act
iviti
es a
s a
cent
ral b
ank)
Profitable
busi
ness
es…
New
Pro
duct
s (ts
unam
i)50
–80
0.39
(c
ontin
gent
lia
bilit
y/ca
pita
l funds)
1.00
12
Taip
ei,C
hina
[Tai
pei,C
hina
] SMEG
Con
sulti
ng s
ervi
ces,
etc
.SME/Start-up
New
pro
duct
sE
xten
d pr
oduc
t period for
empl
oym
ent
60–9
520
x ne
t wor
th0.
50–0
.55
8–9
Thai
land
TCG
Con
sulti
ng s
ervi
ces,
etc
.SME
New
pro
duct
s an
d ex
empt
gua
rant
ee
fees
New
Pro
duct
s (flood)
…10
x eq
uity
1.75
5–7
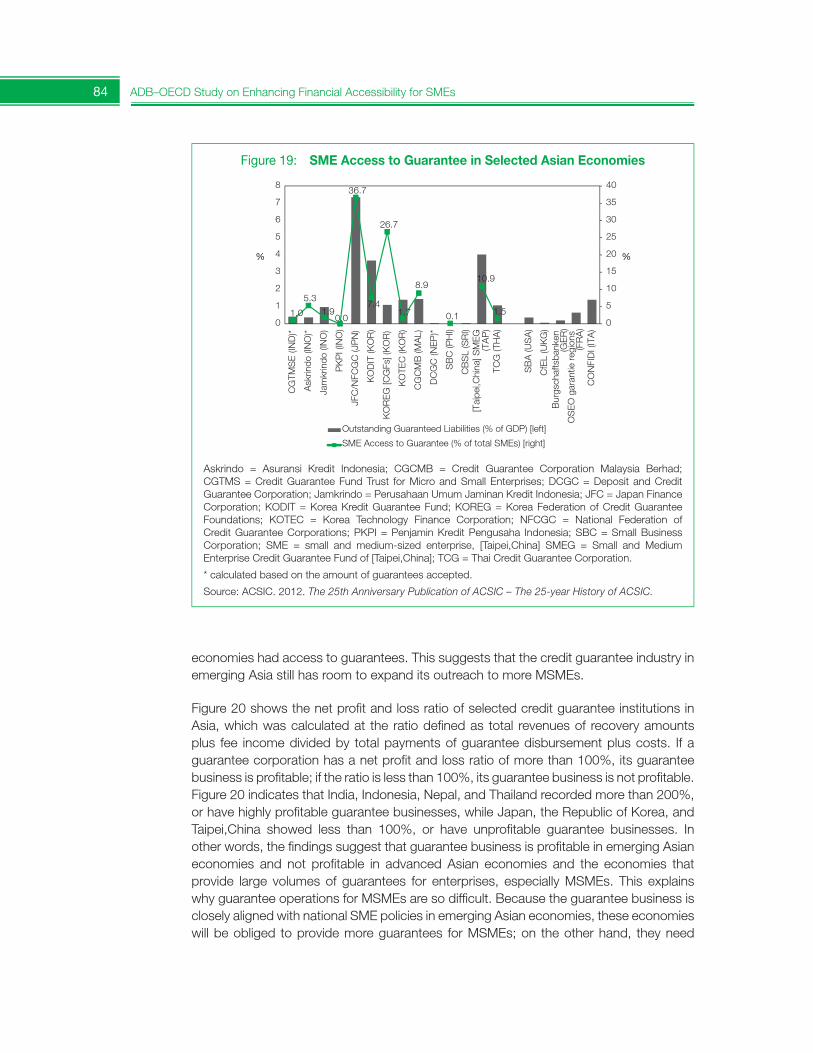
84 ADB–OECD Study on Enhancing Financial Accessibility for SMEs
economies had access to guarantees. This suggests that the credit guarantee industry in emerging Asia still has room to expand its outreach to more MSMEs.
Figure 20 shows the net profit and loss ratio of selected credit guarantee institutions in Asia, which was calculated at the ratio defined as total revenues of recovery amounts plus fee income divided by total payments of guarantee disbursement plus costs. If a guarantee corporation has a net profit and loss ratio of more than 100%, its guarantee business is profitable; if the ratio is less than 100%, its guarantee business is not profitable. Figure 20 indicates that India, Indonesia, Nepal, and Thailand recorded more than 200%, or have highly profitable guarantee businesses, while Japan, the Republic of Korea, and Taipei,China showed less than 100%, or have unprofitable guarantee businesses. In other words, the findings suggest that guarantee business is profitable in emerging Asian economies and not profitable in advanced Asian economies and the economies thatprovide large volumes of guarantees for enterprises, especially MSMEs. This explains why guarantee operations for MSMEs are so difficult. Because the guarantee business is closely aligned with national SME policies in emerging Asian economies, these economies will be obliged to provide more guarantees for MSMEs; on the other hand, they need
Figure 19: SME Access to Guarantee in Selected Asian Economies
Askrindo = Asuransi Kredit Indonesia; CGCMB = Credit Guarantee Corporation Malaysia Berhad; CGTMS = Credit Guarantee Fund Trust for Micro and Small Enterprises; DCGC = Deposit and Credit Guarantee Corporation; Jamkrindo = Perusahaan Umum Jaminan Kredit Indonesia; JFC = Japan Finance Corporation; KODIT = Korea Kredit Guarantee Fund; KOREG = Korea Federation of Credit Guarantee Foundations; KOTEC = Korea Technology Finance Corporation; NFCGC = National Federation of Credit Guarantee Corporations; PKPI = Penjamin Kredit Pengusaha Indonesia; SBC = Small Business Corporation; SME = small and medium-sized enterprise, [Taipei,China] SMEG = Small and Medium Enterprise Credit Guarantee Fund of [Taipei,China]; TCG = Thai Credit Guarantee Corporation.
* calculated based on the amount of guarantees accepted.
Source: ACSIC. 2012. The 25th Anniversary Publication of ACSIC – The 25-year History of ACSIC.
1.0
5.3 1.9
0.0
36.7
7.4
26.7
1.7
8.9
0.1
10.9
1.5 0
5
10
15
20
25
30
35
40
0
1
2
3
4
5
6
7
8
CG
TMS
E (I
ND
)*
Ask
rindo
(IN
O)*
Jam
krin
do (I
NO
)
PK
PI (
INO
)
JFC
/NFC
GC
(JP
N)
KO
DIT
(KO
R)
KO
REG
[CG
Fs] (
KO
R)
KO
TEC
(KO
R)
CG
CM
B (M
AL)
DC
GC
(NEP
)*
SB
C (P
HI)
CB
SL
(SR
I)[T
aipe
i,Chi
na] S
ME
G(T
AP
)TC
G (T
HA
)
SB
A (U
SA
)
CfE
L (U
KG
)B
urgs
chaf
tsba
nken
(GE
R)
OS
EO
gar
antie
regi
ons
(FR
A)
CO
NFI
DI (
ITA
)
% %
Outstanding Guaranteed Liabilities (% of GDP) [left]
SME Access to Guarantee (% of total SMEs) [right]
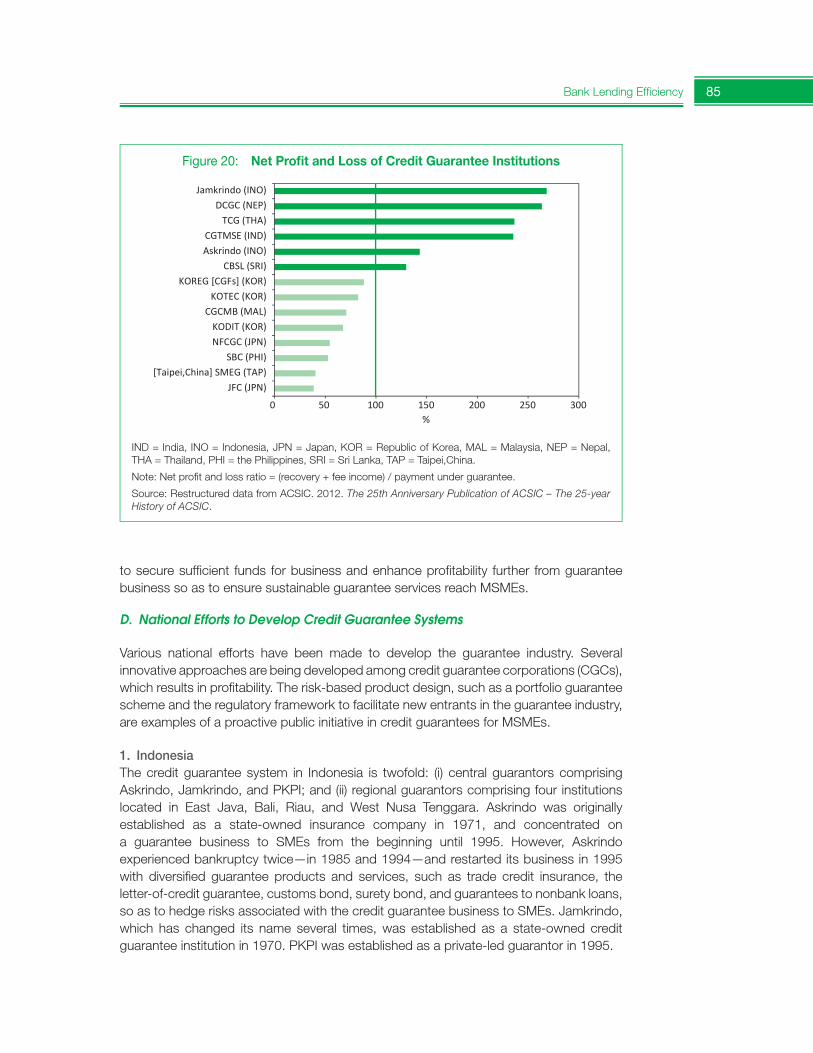
Bank Lending Efficiency 85
Figure 20: Net Profit and Loss of Credit Guarantee Institutions
0 50 100 150 200 250 300
JFC (JPN)
[Taipei,China] SMEG (TAP)
SBC (PHI)
NFCGC (JPN)
KODIT (KOR)
CGCMB (MAL)
KOTEC (KOR)
KOREG [CGFs] (KOR)
CBSL (SRI)
Askrindo (INO)
CGTMSE (IND)
TCG (THA)
DCGC (NEP)
Jamkrindo (INO)
%
IND = India, INO = Indonesia, JPN = Japan, KOR = Republic of Korea, MAL = Malaysia, NEP = Nepal, THA = Thailand, PHI = the Philippines, SRI = Sri Lanka, TAP = Taipei,China.
Note: Net profit and loss ratio = (recovery + fee income) / payment under guarantee.
Source: Restructured data from ACSIC. 2012. The 25th Anniversary Publication of ACSIC – The 25-year History of ACSIC.
to secure sufficient funds for business and enhance profitability further from guarantee business so as to ensure sustainable guarantee services reach MSMEs.
D. National Efforts to Develop Credit Guarantee Systems
Various national efforts have been made to develop the guarantee industry. Severalinnovative approaches are being developed among credit guarantee corporations (CGCs), which results in profitability. The risk-based product design, such as a portfolio guarantee scheme and the regulatory framework to facilitate new entrants in the guarantee industry, are examples of a proactive public initiative in credit guarantees for MSMEs.
1. IndonesiaThe credit guarantee system in Indonesia is twofold: (i) central guarantors comprising Askrindo, Jamkrindo, and PKPI; and (ii) regional guarantors comprising four institutions located in East Java, Bali, Riau, and West Nusa Tenggara. Askrindo was originally established as a state-owned insurance company in 1971, and concentrated on a guarantee business to SMEs from the beginning until 1995. However, Askrindo experienced bankruptcy twice—in 1985 and 1994—and restarted its business in 1995 with diversified guarantee products and services, such as trade credit insurance, the letter-of-credit guarantee, customs bond, surety bond, and guarantees to nonbank loans, so as to hedge risks associated with the credit guarantee business to SMEs. Jamkrindo, which has changed its name several times, was established as a state-owned credit guarantee institution in 1970. PKPI was established as a private-led guarantor in 1995.
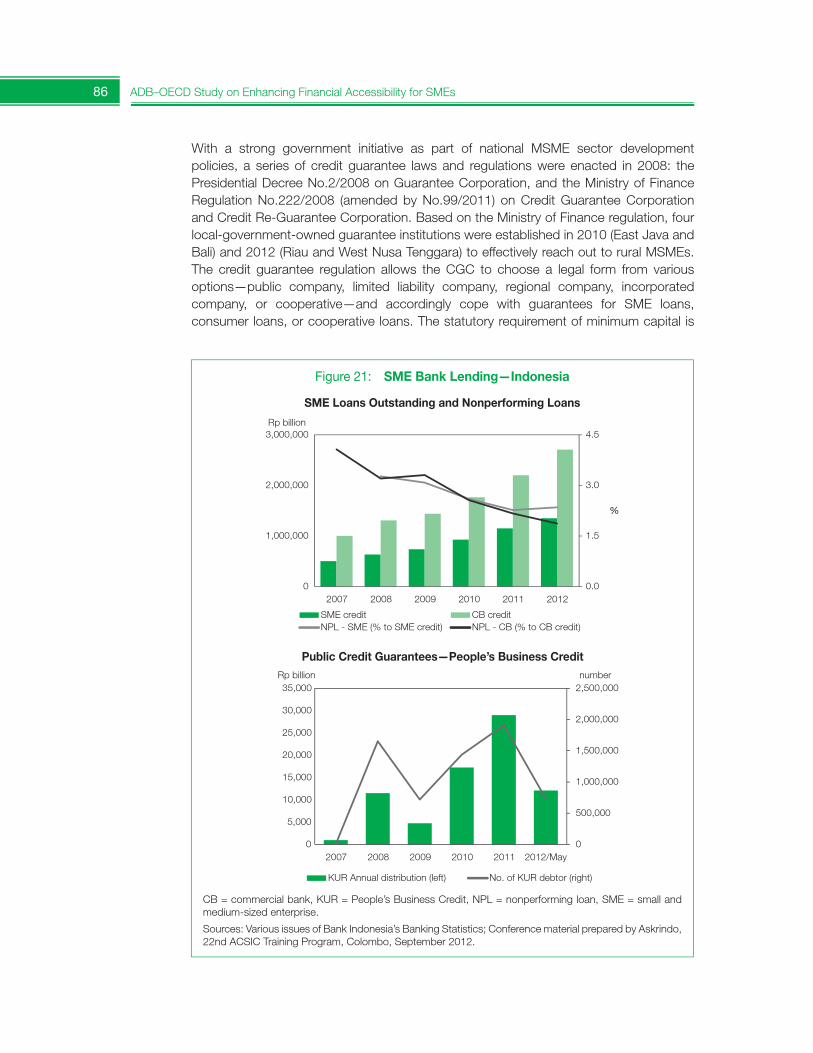
86 ADB–OECD Study on Enhancing Financial Accessibility for SMEs
With a strong government initiative as part of national MSME sector development policies, a series of credit guarantee laws and regulations were enacted in 2008: the Presidential Decree No.2/2008 on Guarantee Corporation, and the Ministry of Finance Regulation No.222/2008 (amended by No.99/2011) on Credit Guarantee Corporation and Credit Re-Guarantee Corporation. Based on the Ministry of Finance regulation, four local-government-owned guarantee institutions were established in 2010 (East Java and Bali) and 2012 (Riau and West Nusa Tenggara) to effectively reach out to rural MSMEs. The credit guarantee regulation allows the CGC to choose a legal form from various options—public company, limited liability company, regional company, incorporated company, or cooperative—and accordingly cope with guarantees for SME loans, consumer loans, or cooperative loans. The statutory requirement of minimum capital is
Figure 21: SME Bank Lending—Indonesia
0.0
1.5
3.0
4.5
%
0
1,000,000
2,000,000
3,000,000Rp billion
Rp billion number
2007 2008 2009 2010 2011 2012
SME credit CB creditNPL - SME (% to SME credit) NPL - CB (% to CB credit)
0
500,000
1,000,000
1,500,000
2,000,000
2,500,000
0
5,000
10,000
15,000
20,000
25,000
30,000
35,000
2007 2008 2009 2010 2011 2012/May
KUR Annual distribution (left) No. of KUR debtor (right)
SME Loans Outstanding and Nonperforming Loans
Public Credit Guarantees—People’s Business Credit
CB = commercial bank, KUR = People’s Business Credit, NPL = nonperforming loan, SME = small and medium-sized enterprise.
Sources: Various issues of Bank Indonesia’s Banking Statistics; Conference material prepared by Askrindo, 22nd ACSIC Training Program, Colombo, September 2012.
Bank Lending Efficiency 87
(i) Rp100 billion for national CGCs, (ii) Rp25 billion for regional CGCs, and (iii) Rp200 billion for reguarantee companies.
The Indonesian Capital Market Financial Institution Supervisory Agency (Bapepam-LK) under the Ministry of Finance regulated and supervised credit guaranteeinstitutions but its role as a nonbank regulator was merged into the newly established Financial Services Authority (OJK) in January 2013. There is the government credit guarantee scheme, People’s Business Credit (KUR), started in late 2007. KUR isprovided by four designated CGCs (Askrindo, Jamkrindo, and two regional CGCs) through 22 executing banks, targeting new customers to banks, with 70% partialguarantee and the government-covered insurance premium of 3.25% per annum (as of September 2012).
2. PhilippinesThere are two government-sponsored guarantee programs for MSMEs in the Philippines: (i) programs handled by the Small Business Corporation, and (ii) the Credit Surety Fund Program organized by the central bank (Bangko Sentral ng Pilipinas). The Small Business Corporation is a state-owned executing agency for MSME development policies, originallycreated by the Republic Act 6977 (amended by RA8289/1997 and RA9501/2008)—Magna Carta for MSMEs—in 1991. The corporation’s guarantee programs, as part of its MSME support operations, provide 70% partial guarantee for collateralized and noncollateralized loans to registered MSMEs at least 60% owned by Filipinos, excluding agri-sectors, real estate development, imported goods trading, and immoral activities. The government injected P2 billion capital to the Small Business Corporation, out of which P250 million was set aside for the Guarantee Reserve Fund. The corporation guaranteed P2 billion in loans during 2002–2012, with 453 MSME beneficiaries. It has also introducedthe Portfolio Guarantee Facility for banks, backed by the Borrower’s Risk Rating System.
The Credit Surety Fund Program, providing 80% partial guarantee, is a central bank initiative responding to the Magna Carta, which has been mainly sponsored by cooperatives and local governments (19 provinces and seven cities so far) through agreements, and supervised by an oversight committee comprising members elected by the fund contributors. Besides guarantee initiatives, the Magna Carta stipulates the mandatory lending for MSMEs, which requires banks to set aside 8% of their lending portfolios for micro and small enterprises and 2% for medium-sized enterprises.
3. Sri LankaThere is no specialized credit guarantor in Sri Lanka. Instead, the Central Bank of Sri Lanka takes a role of guarantee facilitator, based on Section 108(1) of the Monetary Act No.58/1949. The first credit guarantee scheme (CGS) was implemented in 1967, and at present 10 CGSs are active in Sri Lanka, five of which are sponsored by the central bank and the remaining five are directly sponsored by the government. CGSs are targeting not only SMEs but also all sectors including the tea plantation sector. The guarantee coverage ranges between 50% and 80%. Several CGSs are mandatory programs with refinancing schemes for participating financial institutions (PFIs). The fund for CGSs wasentrusted to the central bank. However, the high rejection rate of credit guarantee claims has become a hurdle for PFIs in promoting CGSs.
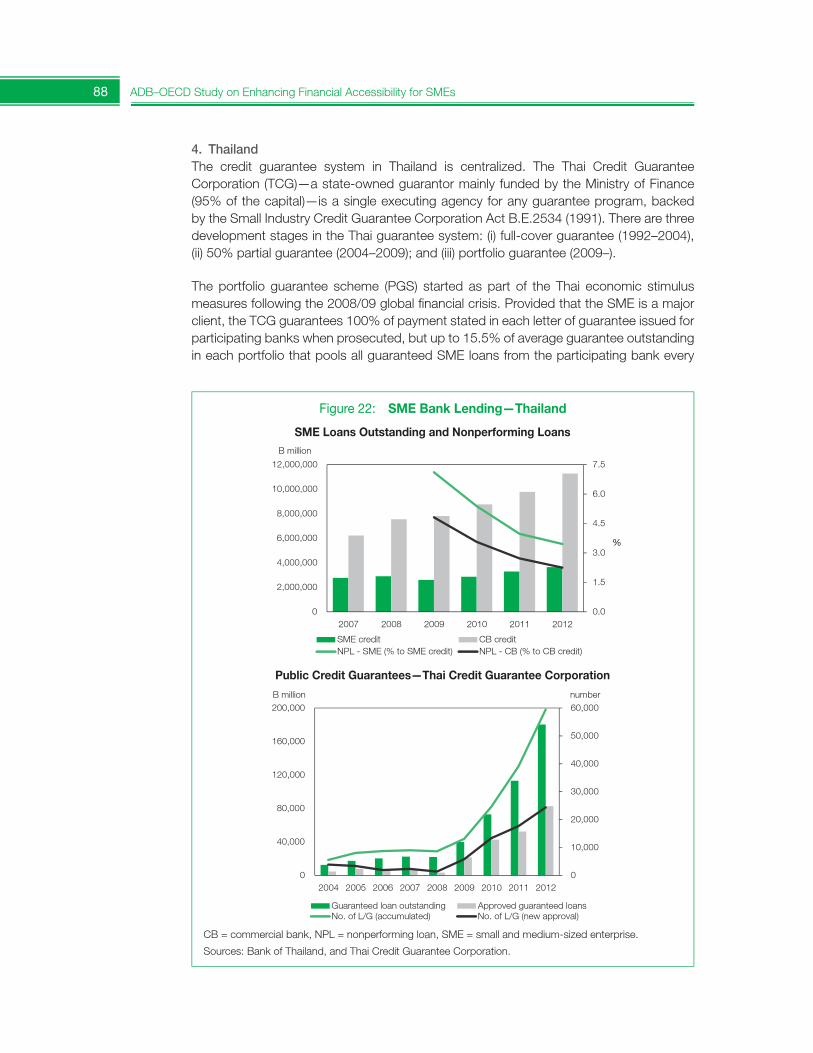
88 ADB–OECD Study on Enhancing Financial Accessibility for SMEs
4. ThailandThe credit guarantee system in Thailand is centralized. The Thai Credit Guarantee Corporation (TCG)—a state-owned guarantor mainly funded by the Ministry of Finance (95% of the capital)—is a single executing agency for any guarantee program, backedby the Small Industry Credit Guarantee Corporation Act B.E.2534 (1991). There are three development stages in the Thai guarantee system: (i) full-cover guarantee (1992–2004), (ii) 50% partial guarantee (2004–2009); and (iii) portfolio guarantee (2009–).
The portfolio guarantee scheme (PGS) started as part of the Thai economic stimulus measures following the 2008/09 global financial crisis. Provided that the SME is a major client, the TCG guarantees 100% of payment stated in each letter of guarantee issued for participating banks when prosecuted, but up to 15.5% of average guarantee outstanding in each portfolio that pools all guaranteed SME loans from the participating bank every
Figure 22: SME Bank Lending—Thailand
0.0
1.5
3.0
4.5
6.0
7.5
0
2,000,000
4,000,000
6,000,000
8,000,000
10,000,000
12,000,000
2007 2008 2009 2010 2011 2012
SME credit CB creditNPL - SME (% to SME credit) NPL - CB (% to CB credit)
0
10,000
20,000
30,000
40,000
50,000
60,000
0
40,000
80,000
120,000
160,000
200,000B million
B million
number
2004 2005 2006 2007 2008 2009 2010 2011 2012
Guaranteed loan outstanding Approved guaranteed loansNo. of L/G (accumulated) No. of L/G (new approval)
%
SME Loans Outstanding and Nonperforming Loans
Public Credit Guarantees—Thai Credit Guarantee Corporation
CB = commercial bank, NPL = nonperforming loan, SME = small and medium-sized enterprise.
Sources: Bank of Thailand, and Thai Credit Guarantee Corporation.
Bank Lending Efficiency 89
year. The PGS is a special measure with a limited period of 5–7 years. This scheme was also utilized during the severe flooding in 2011. Guaranteed loans outstanding, with continuous increase, accounted for B180 billion with 59,469 letters of guarantee in 2012 (Figure 22).47 Newly approved guarantees have been rapidly expanding since the introduction of the PGS in 2009.
In the capital market, the Securities and Exchange Commission has considered the development of an SME bond market, together with the TCG, addressing the potential for developing guaranteed SME bond products. By law, however, the TCG is not allowed to provide guarantee for nonbank financial institutions. Amendment of Act B.E.2534 (1991) is needed for the TCG to enter the guaranteed bond business.
E. Benefits and Challenges
Conceptually, credit guarantees are expected to (i) fill the supply–demand gap in SME finance, (ii) lower funding costs for SMEs, (iii) alleviate financing constraints for SMEs by partially or fully releasing them from collateral requirements, and (iv) respond in a timely fashion to external shocks such as a financial crisis. In addition, credit guarantees can reduce social opportunity costs—by increasing outreach to the underserved—and contribute to (i) mobilizing SME savings for investment, (ii) increasing the survival rate of SMEs, (iii) providing growth opportunities, and (iv) promoting a resilient national economic foundation. Such a promising cycle is expected in credit guarantee systems at the national level.
However, there are potential negative effects of credit guarantee systems. Basel Capital Accord’s risk-weighting system may drive banks to increase guaranteed SME lending but reduce unsecured SME lending to strengthen their capital adequacy ratios. In literature,Vogel and Adams (1997) pointed out that credit guarantees may reduce the effects of credit crunch countermeasures by shifting to more guaranteed loans for riskier firms. Also, the increased risk of adverse selection and moral hazard is a typical concern inhibiting the guarantee provision since credit guarantees may tempt malicious SME borrowers (e.g., intentional bankruptcy after getting guaranteed loans) and discourage financialinstitutions from closely monitoring borrowers, resulting in the use of funds inconsistent with loan objectives.
For SMEs, as a possible negative effect, the life of poorly performing SMEs might beprolonged through guaranteed loans. In other words, credit guarantees will not rescue SMEs having excessive debts, for instance. Also, credit guarantees may discourage SME borrowers from improving their management if such guarantees do not include any collateral requirements because owner assets are not at risk in the case of default.
For the government, the increased risk of bloated national budgets and the crowding out of private businesses are potential negative effects, since credit guarantee institutions are mostly public entities in Asia.
47 The TCG’s guarantee operations are based on the Small Industry Credit Guarantee Corporation Act B.E.2534 (1991), which does not allow the TCG to directly provide guarantee for SMEs. Bank’s credit approval is a precondition for granting guarantee.
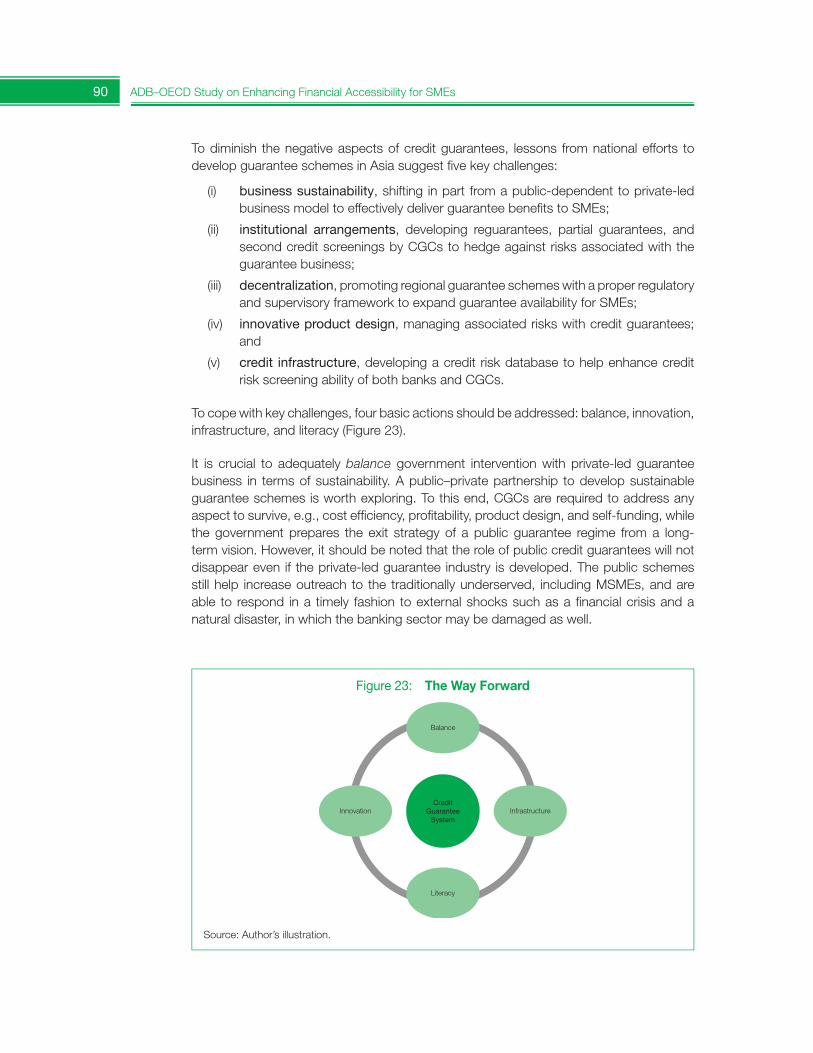
90 ADB–OECD Study on Enhancing Financial Accessibility for SMEs
To diminish the negative aspects of credit guarantees, lessons from national efforts to develop guarantee schemes in Asia suggest five key challenges:
(i) businesssustainability, shifting in part from a public-dependent to private-led business model to effectively deliver guarantee benefits to SMEs;
(ii) institutional arrangements, developing reguarantees, partial guarantees, and second credit screenings by CGCs to hedge against risks associated with the guarantee business;
(iii) decentralization, promoting regional guarantee schemes with a proper regulatory and supervisory framework to expand guarantee availability for SMEs;
(iv) innovative product design, managing associated risks with credit guarantees; and
(v) credit infrastructure, developing a credit risk database to help enhance credit risk screening ability of both banks and CGCs.
To cope with key challenges, four basic actions should be addressed: balance, innovation, infrastructure, and literacy (Figure 23).
It is crucial to adequately balance government intervention with private-led guarantee business in terms of sustainability. A public–private partnership to develop sustainable guarantee schemes is worth exploring. To this end, CGCs are required to address any aspect to survive, e.g., cost efficiency, profitability, product design, and self-funding, while the government prepares the exit strategy of a public guarantee regime from a long-term vision. However, it should be noted that the role of public credit guarantees will not disappear even if the private-led guarantee industry is developed. The public schemes still help increase outreach to the traditionally underserved, including MSMEs, and are able to respond in a timely fashion to external shocks such as a financial crisis and a natural disaster, in which the banking sector may be damaged as well.
Figure 23: The Way Forward
CreditGuarantee
System
Balance
Innovation Infrastructure
Literacy
Source: Author’s illustration.
Bank Lending Efficiency 91
For innovation, CGCs should elaborate diversified, demand-driven, and risk-based products and services—such as credit insurance, trade credit guarantee, thematic products responding to client needs, and capital-market-related products such as guaranteed SME bonds—to scale up the outreach to SMEs.
Infrastructure comprises three segments; (i) data infrastructure such as an SME credit risk database or a credit bureau; (ii) supporting infrastructure such as the base of supporting professionals, e.g., a “servicer” for debt collection; and (iii) legal infrastructure such as the regulatory and supervisory framework to support the development of a private-led guarantee industry with close collaboration between central and local governments.
Lastly, financial literacy is a key element in developing the guarantee industry. Knowledge gained through networking and peer learning among CGCs is critically important to the design and delivery of viable products and services to MSMEs. Capacity building and training opportunities are also needed to strengthen their business skills.
F. Conclusion
Although there is no universal prescription for increasing SME access to finance, credit guarantees are playing an important role in filling the SME financing gap in Asia. At the same time, credit guarantees open the door for a debate on potentially negative effects. Because of the strong public nature of credit guarantees, business sustainability is a critical concern. Balancing government intervention with a private-led guarantee industry is needed. Innovation and technology are key to developing demand-driven and risk-based credit guarantee products. SME data infrastructure is also crucial to establishing a sustainable credit guarantee system at the national level. Such data infrastructure will support CGCs in proper pricing and risk-based management. Promoting credit guarantee literacy for all stakeholders is a necessary component of the development of a national credit guarantee industry. A comprehensive policy and regulatory framework on credit guarantees should be well-designed to avoid market distortions and to facilitate innovative products, given the industry’s public nature in Asia.
References
Asian Credit Supplementation Institution Confederation (ACSIC). 2012. The 25th Anniversary Publication of ACSIC – The 25-year History of ACSIC.
Asuransi Kredit Indonesia (Askrindo). http://www.askrindo.co.id/
Chaisiriwongsuk, K. 2013. Note for panel discussion: How to develop sustainable creditguarantee business for SMEs – Thailand. The First ADB–OECD Workshop on Enhancing Financial Accessibility for SMEs. Manila. 6–7 March.
Credit Guarantee Corporation Malaysia. http://www.iguarantee.com.my/
Credit Guarantee Fund Trust for Micro and Small Enterprises. http://www.cgtsi.org.in/
Deposit and Credit Guarantee Corporation. http://www.dcgc.org.np/
Japan Finance Corporation. http://www.jfc.go.jp/
92 ADB–OECD Study on Enhancing Financial Accessibility for SMEs
Korea Federation of Credit Guarantee Foundations. http://www.koreg.or.kr/
Korea Kredit Guarantee Fund. http://www.kodit.co.kr/
Korea Technology Finance Corporation. http://www.kotec.or.kr/
Lagua, B. P. 2013. Note for panel discussion: How to develop sustainable credit guarantee business for SMEs – the Philippines. The First ADB–OECD Workshop on Enhancing Financial Accessibility for SMEs. Manila. 6–7 March.
Lankathilake, S. 2013. Note for panel discussion: How to develop sustainable credit guarantee business for SMEs – Sri Lanka. The First ADB–OECD Workshop on Enhancing Financial Accessibility for SMEs. Manila. 6–7 March.
Perusahaan Umum Jaminan Kredit Indonesia (Jamkrindo). http://www.jamkrindo.com/
Shinozaki, S. 2012. A New Regime of SME Finance in Emerging Asia: Empowering Growth-Oriented SMEs to Build Resilient National Economies. ADB Working Paper Series on Regional Economic Integration. 104. Manila: ADB.
Small and Medium Enterprise Credit Guarantee Fund of [Taipei,China] ([Taipei,China]SMEG). http://www.smeg.org.tw/
Small Business Corporation. http://www.sbgfc.org.ph/
Thai Credit Guarantee Corporation. http://www.tcg.or.th/eng/
Vogel, R. C. and D. W. Adams. 1997. Costs and Benefits of Loan Guarantee Programs. The Financier. Vol.4. No.1–2. Feb/May.
Wibowo, S. 2013. Note for panel discussion: How to develop sustainable credit guarantee business for SMEs – Indonesia. The First ADB–OECD Workshop on Enhancing Financial Accessibility for SMEs. Manila. 6–7 March.
Wirendra, F. and H. Sutanto. 2012. Performance of Credit Guarantee for SMEs Associated with Risk Mitigation on Lending. 22nd Annual Training Program of the Asian Credit Supplementation Institution Confederation. Colombo. 3–6 September.
Bank Lending Efficiency 93
2.3.2 Sustainable Credit Guarantee Schemes for SMEs: Lessons from the OECD Area
In many countries, CGSs represent a key policy tool to address the SME financing gap, while limiting the burden on public finances. This section aims to improve understanding about the role, impact, and sustainability of CGSs by investigating their characteristics along several dimensions, such as ownership structure and funding, the legal regulatory framework, and the operational characteristics of the schemes, including type of services, eligibility criteria, guarantee assignment process, and credit risk management. The section shows that public guarantee schemes are widespread across OECD and non-OECD economies as a direct policy tool to alleviate financial distress by SMEs. The section evaluates the use of CGSs in the aftermath of the 2008/09 financial crisis, asserting that the design of CGSs is crucial for their effectiveness and sustainability.48
A. Introduction
In the aftermath of the 2008/09 global financial crisis, in many OECD countries CGSs have represented an instrument of choice for policy makers to improve access to finance by SMEs and young firms. During 2008–2010, new guarantee programs were set up and existing loan guarantee programs ramped up as part of government anticrisis packages. In light of the uncertain recovery, in 2011–2012, many of these programs were continuedor, as part of policies intended to stimulate growth and job creation, some new elements were introduced, tailored to specific categories of SMEs.
The expansion of public guarantee instruments, as well as the increased support to private guarantee schemes, through funding or coguarantees has triggered greater demandfor monitoring and evaluation. This demand concerns in particular the effectiveness and sustainability of credit guarantee policies in stormy fiscal times. At the same time, there is a need to distinguish the specific challenges arising from the extensive use of credit guarantees as a countercyclical tool as opposed to their ordinary functioning as a structural element of financial systems.
Indeed, CGSs are a long-established risk transfer mechanism to ease access to finance for firms and entrepreneurs constrained by information asymmetry, limited credit history, and lack of collateral, which, in many countries, have existed since the beginning of the 20th century (Beck, Klapper, and Mendoza 2010). Undoubtedly, their diffusion and relevance have increased significantly over the last several decades, across OECD and non-OECD countries alike. If in OECD countries their late expansion is largely related to the increasing difficulties for SMEs in accessing debt finance, in several non-OECD countries CGSs have also developed rapidly as a mechanism for expanding credit markets and improving financial inclusion.
This section illustrates the evidence on expansion of CGSs in OECD countries, taking into account both public schemes and private or public–private schemes. Structural and emerging challenges for the effectiveness and sustainability of these schemes in
48 Section based on OECD (2012).
94 ADB–OECD Study on Enhancing Financial Accessibility for SMEs
the postcrisis environment are highlighted, drawing some key lessons from the OECD experience in sustaining SME financing through guarantees.
B. Credit Guarantee Schemes across OECD Countries: Public and Mutual Schemes
In many countries, CGSs represent a key policy tool to address the SME financing gap, while limiting the burden on public finances. SMEs and start-ups are typically limited in their capacity to access credit because of lack of collateral, limited or no credit history, and, often, lack of expertise needed to produce sophisticated financial statements. The information asymmetry that exists between the firm and the potential lender implies that the latter attributes a high risk of default to the borrower and, in the absence of adequate collateral, this eventually results in a partial or negative response to the credit demand. The credit guarantee mechanism is a commonly used response to this market failure. By protecting a part of the requested loan with a guarantee, the CGS reduces the risk of the lender and favors the provision of financing to viable businesses that are credit constrained. CGSs can also work to improve the efficiency of local financial markets. Tothe extent that the lender’s financing activities are limited to local firms only or to firms that operate in a narrow set of sectors, CGSs provide a way to spread risk. This happens if the scheme supports firms from several regions or different sectors.
There exists a wide variety of designs and types of CGSs, within and across OECD countries. The government plays an important role in its function as regulator of financial markets, but can also play a direct role in the guarantee schemes by providing financial support, participating in their management, or, indirectly, by granting counterguarantees whereby the government takes over the risk from the guarantor up to a predefined share of the guarantee.
Depending on the ownership structure and role of shareholders in the management of the scheme, CGSs can be classified into three main typologies: public guaranteeschemes (PGSs), public–private (or mixed) guarantee schemes, and private schemes.The use of PGSs is widespread across OECD and non-OECD economies, as a direct policy tool to alleviate financial distress of SMEs. The design and delivery mechanisms of public schemes are rather heterogeneous, however. The variations across countries reflect different policy priorities and market needs, as well as diverse legal and economic framework conditions.
In OECD countries, PGSs are generally managed by government-related agencies, but guarantee services may also be provided in a decentralized manner, through the financial system, with little government intervention in terms of how the guarantee scheme is run.In other cases, the public guarantee services are delivered through private legal entities started on public initiative and with majority participation by public entities.
Privately funded schemes and mixed models, which are characterized by the direct participation of the private sector, SME organizations, and banks in the funding and management of the scheme, are significantly more developed in OECD countries than innon-OECD economies, and may take different organizational forms.
Bank Lending Efficiency 95
An interesting model of private or mixed scheme in OECD countries is that of mutual guarantee schemes (MGSs), which, in some instances, represent a large share of the guarantee market. MGSs are private societies created by borrowers to improve their access to finance and are predominantly found in Europe and South America. They are characterized by strong ties with the local community and territorial system and, often, member firms operate in a specific sector or value chain. This provides a specific information advantage to the schemes, which are in fact commonly active in credit risk assessment: they evaluate their members, assess their creditworthiness, express recommendations to lending institutions, and are involved in the recovery of losses should the borrower default.49
The peer review process acts as a powerful mechanism for controlling risk and limiting opportunistic behavior. If an MGS suffers a loss in case of default, members have strongincentives to closely monitor their peers, which may prevent borrowers from excessively risky behavior and increase the repayment probability of the loan.
Governments and local authorities define the regulatory and legal framework and may provide financial support to MGSs, mainly in the form of counterguarantees. These enhance the guaranteed credit volume that can be made available to SMEs (i.e., the leverage ratio), as well as the credibility and reputation of the schemes.
In countries with well-established mutual schemes, a multilayered guarantee structure is commonly observed or is emerging in response to changes in the regulatory and competitive environment. There are local schemes that benefit from close proximityto firms and local financial institutions; larger regional schemes that provide co- and counterguarantees to the first-tier schemes; and the government, which plays a key role as guarantor of last resort, through a central guarantee fund. This is the case in Italy where a large number of MGSs (confidi) operate at the local level, typically in industrial areas that are characterized by clustering of highly specialized and interconnected SMEs and a well-defined territorial economic identity related to a sector or value chain. Regional and sector specialization and a system of public counterguarantees is also a feature of the Spanish model of mutual schemes (Sociedades de Garantía Recíproca). Another example of direct mutualism can be observed in Turkey, with 910 cooperatives at the local level, 32 regional unions, and one national umbrella organization (the Union of Credit and Guarantee Cooperatives for Tradesmen and Craftsmen [TESKOMB]) (AECM 2012, KPMG 2012).
C. The Role of Credit Guarantee Schemes during the Global Financial Crisis
PGSs and support to MGSs have significantly expanded in the aftermath of the 2008/09 financial crisis. In many OECD countries, existing loan guarantee programs were rampedup in terms of the total amount of guarantee funds and direct lending available, the percentage of the loan guaranteed, the size of the guaranteed or direct loan, and the
49 MGSs can be classified into institutions with direct and indirect mutuality. In the case of direct mutuality, the schemes are capitalized by the contribution of member firms, which take on joint responsibility for outstanding credits and are directly involved in the management. To be eligible for support, firms generally have to be members of the institution.
96 ADB–OECD Study on Enhancing Financial Accessibility for SMEs
number of eligible enterprises. In other countries, new programs were introduced or new instruments were created outside the traditional guarantee programs.
Table 19 illustrates the trend in government guarantee support during 2007–2011 for some OECD countries, measured in terms of the value of guaranteed loans. In most cases, government guarantees provided to SMEs increased dramatically during 2009–2010; during this time the value of guaranteed loans increased by 65% in Turkey, 80% in Chile, 86% in Italy, 155% in the Netherlands, and 338% in Denmark. In Spain, the stock of guarantees intended for the securitization of funds increased by 23%. In a few countries,the upsurge in government guarantee activity took place earlier, at the outbreak of the crisis. In 2008–2009, government-guaranteed loans increased by 64% in France and by 87% in the Czech Republic. In Portugal, loans to SMEs guaranteed by the public MutualCounterguarantee Fund more than doubled. In Hungary, the flows of guaranteed loans increased by 38%. In the Republic of Korea, the value of loans guaranteed by KODIT and KIBO (Technology Fund) increased by 42% during 2007–2009, and remained stableafterwards, also because of the policy measure that allowed the rollover of loans without any guarantees.
In 2011–2012, in some countries, as crisis measures were phased out and new programs introduced to foster growth and job creation, some guarantee instruments were tailored to specific categories of SMEs, such as start-ups or innovative firms. In other cases,guarantee schemes were introduced to support equity investments, addressing, among other objectives, the need for deleveraging firms and supporting them in key transitions, such as expansion or ownership transmission.
D. Effectiveness and Sustainability of Credit Guarantee Schemes in the Postcrisis Environment
The countercyclical use of CGSs to offset SME financial distress, through direct funding or counterguarantees, has implied, in many instances, an important change in their scale and scope. Evidence shows that CGSs have been effective in mobilizing large amounts of credit and easing access to finance for a larger number of enterprises. This, however, has substantially increased their exposure to risk, which may threaten their soundness over the medium to long term.
Also in the case of mutual schemes, the countercyclical expansion has brought about an important change in scale and greater exposure to risk. This change is taking place in conjunction with the ongoing transformation induced by regulatory reforms, such as Basel III. The greater complexity of the environment has further increased the need to upgrade the organizational efficiency and skill level of these schemes.
In several instances, the response to these challenges has been a change in scale, with mergers or consolidation. This can help reduce the relative costs of the service, as well as broaden the offer of guarantee instruments, which may respond to differentiated needs in the target population, including expansion, internationalization, or ownership changes. At the same time, a trade-off is emerging between efficient scale and proximity to borrowers, which historically has been the competitive advantage of MGSs. In some countries, this has been addressed by accelerating the rationalization of guarantee provision into
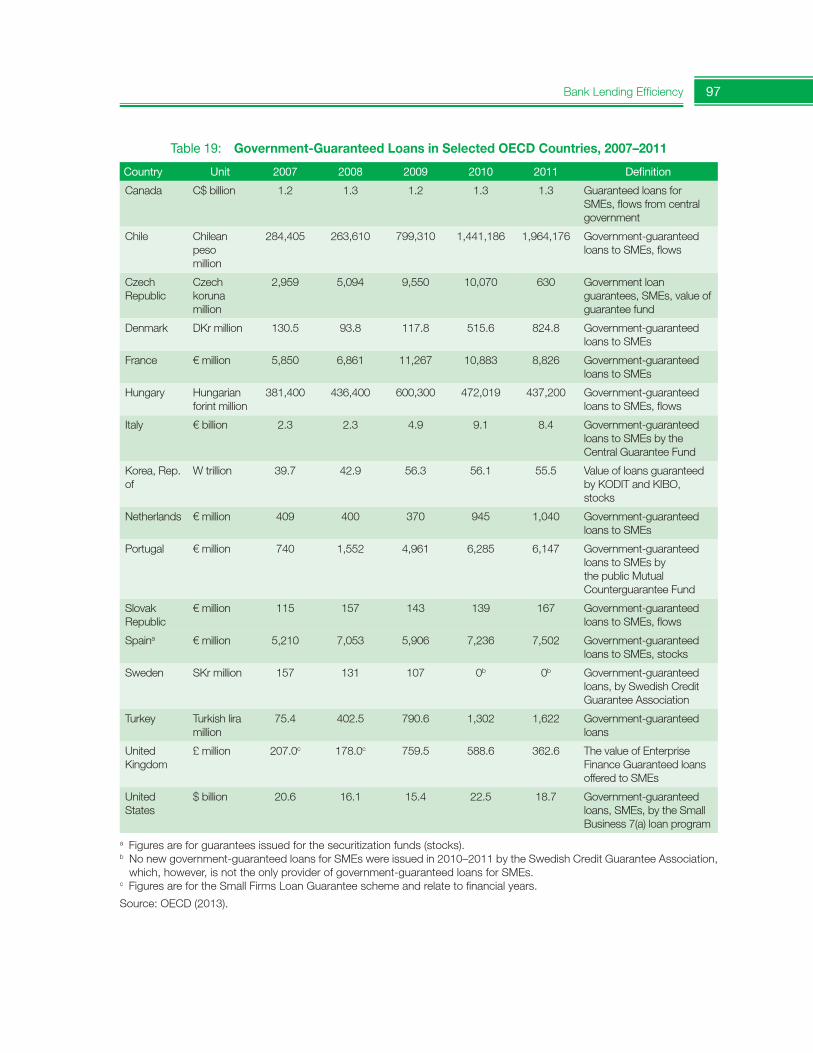
Bank Lending Efficiency 97
Table 19: Government-Guaranteed Loans in Selected OECD Countries, 2007–2011
Country Unit 2007 2008 2009 2010 2011 Definition
Canada C$ billion 1.2 1.3 1.2 1.3 1.3 Guaranteed loans for SMEs, flows from central government
Chile Chilean peso million
284,405 263,610 799,310 1,441,186 1,964,176 Government-guaranteed loans to SMEs, flows
Czech Republic
Czech koruna million
2,959 5,094 9,550 10,070 630 Government loan guarantees, SMEs, value of guarantee fund
Denmark DKr million 130.5 93.8 117.8 515.6 824.8 Government-guaranteed loans to SMEs
France € million 5,850 6,861 11,267 10,883 8,826 Government-guaranteed loans to SMEs
Hungary Hungarian forint million
381,400 436,400 600,300 472,019 437,200 Government-guaranteed loans to SMEs, flows
Italy € billion 2.3 2.3 4.9 9.1 8.4 Government-guaranteed loans to SMEs by the Central Guarantee Fund
Korea, Rep. of
W trillion 39.7 42.9 56.3 56.1 55.5 Value of loans guaranteed by KODIT and KIBO, stocks
Netherlands € million 409 400 370 945 1,040 Government-guaranteed loans to SMEs
Portugal € million 740 1,552 4,961 6,285 6,147 Government-guaranteed loans to SMEs by the public Mutual Counterguarantee Fund
Slovak Republic
€ million 115 157 143 139 167 Government-guaranteed loans to SMEs, flows
Spaina € million 5,210 7,053 5,906 7,236 7,502 Government-guaranteed loans to SMEs, stocks
Sweden SKr million 157 131 107 0b 0b Government-guaranteed loans, by Swedish Credit Guarantee Association
Turkey Turkish lira million
75.4 402.5 790.6 1,302 1,622 Government-guaranteed loans
United Kingdom
£ million 207.0c 178.0c 759.5 588.6 362.6 The value of Enterprise Finance Guaranteed loans offered to SMEs
United States
$ billion 20.6 16.1 15.4 22.5 18.7 Government-guaranteed loans, SMEs, by the Small Business 7(a) loan program
a Figures are for guarantees issued for the securitization funds (stocks). b No new government-guaranteed loans for SMEs were issued in 2010–2011 by the Swedish Credit Guarantee Association, which, however, is not the only provider of government-guaranteed loans for SMEs.
c Figures are for the Small Firms Loan Guarantee scheme and relate to financial years.
Source: OECD (2013).
98 ADB–OECD Study on Enhancing Financial Accessibility for SMEs
a strong credit guarantee chain scheme, which includes (i) first-tier schemes that areclose to the firms and the local systems; (ii) second-tier regional or intersector schemes, which provide mainly counterguarantees; and (iii) a well-established national guarantee fund and, in the case of European countries, a supranational counterguarantee fund. The experience of each individual system is unique and difficult to replicate in other areas. However, the principles underlying these schemes, and the counterguarantee role played by public institutions, can offer insights to other countries on the regulatory conditions and incentives that can facilitate bottom-up initiatives or private sector engagement.
Public support to the credit guarantee system is common and possibly essential for its long-term sustainability and for the engagement of private investors, with conditions that also meet government objectives, such as service to a large number of viable butcredit-constrained SMEs. However, the ordinary support of government should be clearly distinguished from temporary extraordinary measures and be designed so as to ensure additionality and avoid excessive transfer of risk from the private to the public sector. As a general principle, all parties concerned in addition to the government (SMEs, banks, guarantee schemes) should retain a sufficient share of the risk and responsibility to ensure proper functioning of the system and avoid moral hazard.
The design of CGSs is crucial for their effectiveness and sustainability. Target population, coverage ratio, credit risk management, and fee structure should ensure additionality, i.e., support access to finance of viable enterprises that face limitations in financial markets. An appropriate design is also crucial to ensure financial sustainability, taking into account on the one hand the need to limit default rates and cover the operating costs, and on the other hand the implications that coverage ratio and fees have on the type of applicants. Also, supervision, transparency, and certainty about contract enforcement are crucial for the development and sustainability of guarantee systems.
A major challenge for additionality of CGSs comes from selection mechanisms, the importance of which largely depends on the design of the scheme. The first selection mechanism concerns the type of firms which seek guaranteed loans. As financial conditions of guaranteed credits are generally more favorable than ordinary loan contracts, the scheme may attract borrowers with solid creditworthiness, which might be able to obtain funds without the guarantee support. At the other extreme, financial additionality may be absent if loan guarantees are attracting firms which seek finance for highly risky projects (adverse selection) or if the existence of the guarantee induces riskier behavior by borrowers and lenders (moral hazard).
A second selection mechanism that may reduce additionality takes place at the level of the lending institutions, as they may have an incentive to transfer regular credits to the program so as to reduce the overall risk of their outstanding credits. Additionality may also be reduced by “interlender substitution”, i.e., by established borrowers shifting their demand towards lending institutions that are linked to guarantee schemes, whose observed uptake would thus not reflect services to other credit-constrained companies (Vogel and Adams 1997).
Bank Lending Efficiency 99
The design of the scheme is crucial to governing the selection mechanisms and the incentives of borrowers and lenders. In particular, the following risk management tools may have a distinct impact on additionality, as well as on sustainability:
• Credit risk assessment. Retail appraisal and close follow-up by the guarantor may reduce adverse selection and moral hazard, though at relatively high operational costs.
• Coverage ratio. A high coverage ratio is typically an attractive feature for borrowers and lenders but may lower the incentive of the lender to properly screen borrowers. At the same time, low coverage ratios may limit the scheme’s uptake by both firms and lenders.
• Eligibility for CGSs. In an attempt to maximize additionality, some schemes restrict eligibility to those firms which have been denied credits on regular financial markets. In some cases, additionality is sought by narrowly defining the target of the program, which may be a sector or specific categories of firms for which severe market failures were identified. However, overly restrictive schemes bearthe risk that credits are artificially modified to fit formal requirements (Vogel and Adams 1997).
• The price of guarantees. CGSs need to strike a balance between financial returns and attracting viable customers. While high fees may increase operating budgets, they may also discourage creditworthy firms from applying for guarantees and reduce the overall uptake of the scheme, and hence impact on its capacity to leverage the equity fund.
Despite the increasing demand for evaluation, assessment evidence on CGSs is at present rather scarce. There is a need for more in-depth evaluation at the micro and macro levels, to assess the overall welfare implications of guarantee systems. More investigation is needed on the multidimensional aspects of credit guarantee systems, which take into account direct and indirect costs and benefits. Full assessment demands that financial sustainability and additionality are jointly taken into account, and that CGSs are evaluated against alternative policy instruments. For this purpose, it is necessary to improve the availability of data at the level of the firm and the scheme. In the case of PGSs that are run by public agencies which may have several programs in place, this requires an accounting approach which accurately records expenditures and incomes of the schemes on a regular basis.
References
AECM. 2012. AECM: 20 years of facilitating growth. August. Available at www.aecm.be/servlet/Repository/?ID=1113
Beck, T., L. F. Klapper, and J. C. Mendoza. 2010. The typology of partial credit guarantee funds around the world. Journal of Financial Stability, Elsevier, vol. 6(1), pp. 10–25. April.
KPMG. 2012. Credit access guarantees: a public asset between the State and the Market. International survey on guarantee market players. KPMG Advisory.
100 ADB–OECD Study on Enhancing Financial Accessibility for SMEs
OECD. 2012. SME and Entrepreneurship Financing: The role of credit guarantee schemes and mutual guarantee societies in supporting finance for small and medium-sized enterprises. Paris: OECD Working Party on SMEs and Entrepreneurship.
______. 2013. Financing SMEs and Entrepreneurs 2013: An OECD Scoreboard. Paris.
Vogel, R. C. and D. W. Adams. 1997. Costs and benefits of loan guarantee programs. The Financier, 4(1–2), Feb/May.
Bank Lending Efficiency 101
2.4. Trade Finance and Supply Chain Finance for SMEsSteven Beck and Sunniya Durrani-Jamal50
Among the most pressing needs of SMEs that operate internationally is access toadequate trade and supply chain finance. Data on the market size of trade and supply chain finance is difficult to come by but is estimated to be about $2.75 trillion annually. There is tremendous potential for trade finance and supply chain finance to support SMEs, jobs, and economic growth. An Asian Development Bank (ADB) survey of 500 firms globally revealed that, with 10% more trade finance, production and staffing would go up by 5%. Risk-bearing capacity, capital constraints, and a weak regulatory environment for supply chain finance are impediments to providing more trade and supply chain financeand need to be addressed on a collaborative basis by the private sector, development finance institutions, and governments globally.
A. Introduction
Trade finance comprises the loans and guarantees that underpin imports and exports. Inits narrowest form, trade finance involves loans from banks (to manufacture for exports or to purchase imports) and guarantees, often in the form of letters of credit which represent a bank obligation to pay, thereby removing an exporter’s payment risk on an importer and replacing it with a bank risk (risk on the bank that issued the letter of credit or other trade finance instrument).
Supply chain finance is a form of receivables finance or factoring. In its narrowest form (post-acceptance finance), the supplier sends an invoice to the buyer which the buyer approves in a supply chain finance platform, on an irrevocable basis. Once approved, the supplier is able to sell the invoice (i.e., asset-based finance) to a financier.
Unlike the advanced “just in time” efficiencies obtained in the physical supply chain in recent decades, the financial supply chain is still primarily a manual, nonintegrated, and inefficient process. Under the current system, cash flow for working capital is trapped in the supply chain, undermining the ability of companies, especially SMEs, to expand and create more jobs. For example, having to wait 30–180 days post-shipment for payment may mean having to shut down operations temporarily. With supply chain finance, receivingcash even just 30 days earlier could make a substantial difference; companies would have a steady flow of working capital to maintain production capacity, process new and existing orders, retain staff, and ultimately expand operations and employ more people.
This section begins with a discussion on
(i) the demand for trade and supply chain finance and their importance for SMEs;
(ii) the market size of trade and supply chain finance, and ADB’s estimates of the gaps in trade finance globally following the financial crisis of 2008;
(iii) how ADB’s Trade Finance Program closes these gaps;
50 Steven Beck is head of trade finance, and Sunniya Durrani-Jamal is senior economist with the Private Sector Operations Department of ADB.
102 ADB–OECD Study on Enhancing Financial Accessibility for SMEs
(iv) ADB’s work to close a knowledge gap, which includes informing policy andregulations governing trade finance, including Basel III;
(v) the benefits and challenges associated with supply chain finance;
(vi) ADB’s new Supply Chain Finance Program; and
(vii) other products that can be developed to meet niche financing requirements of SMEs.
B. Demand for Trade Finance and Supply Chain Finance
There are a number of factors driving the high demand for trade and supply chain finance. First, while access to credit is often cited by SMEs as a top priority, the financial crisis of 2008/09 accentuated demand for trade and supply chain finance as the crisis (i) reduced the availability of credit in general, (ii) impaired traditional working capital, and(iii) spurred more interest among companies to seek risk-mitigating instruments (such as trade finance).
In cases where large firms still had access to ample financial facilities during the global financial crisis (financial institutions generally focused limited capital resources and risk-bearing capacity on larger corporate clients during the crisis), SMEs supplying large firms may have had increased trouble accessing sufficient finance, which could ultimately threaten the flow of supply to large firms. As such, in addition to supporting SMEs, supply chain finance can also be an integral part of securing the supply chain over the long run. This realization has also increased demand.
Notwithstanding these factors heightening demand for trade and supply chain finance in challenging times, there is plenty of anecdotal evidence supporting the view that SMEs—an important engine for economic growth and jobs—are not receiving the financial support they need to grow and create more jobs, even during “normal” economic and financial times. Hence, the interest of governments in initiatives to make trade and supply chain finance available through official export credit agencies, multilateral developmentbanks, and other public institutions providing loans and guarantees to support trade and supply chains.
C. The Impact of the Global Financial Crisis on Trade Finance in Asia
In Asia the relative health of commercial banks (that strengthened after 1997) and the rising tide of intraregional trade protected it in a rather limited way from the ill effects of the crisis, and for a limited period.
Banks in Asia’s emerging markets (the People’s Republic of China [PRC], India, the Republic of Korea, Malaysia, and Thailand) are more integrated into the global financial system than banks in developing Asian countries (Bangladesh, Nepal, Pakistan, and Viet Nam) and had trouble acquiring funding in general, including for trade finance. At various intervals during the crisis, Asia suffered from a lack of United States (US) dollars to support trade. Approximately 80% of international trade is conducted in US dollars and insufficient dollars placed a major strain on Asia’s ability to conduct trade. US banks that had dollars
Bank Lending Efficiency 103
(US Treasury programs were important to ensure sufficient dollars) were reluctant to lend dollars to their correspondent banks around the world at the height of the crisis because they did not know which institution would go bankrupt next; the interbank market was shut. This overreliance on one currency poses risks to the international trade system, as has been seen at various intervals during the crisis. Interest in the renminbi as a potential alternative settlement currency rose as a result.
Another important impact of the crisis that hit Asia was the inability to get payment obligations from banks (such as letters of credit) guaranteed. These guarantees are critical to trade. The fact that most Asian banks were not in jeopardy and were in much better condition than US and European banks was lost. Trust and confidence in financial institutions everywhere evaporated at the height of the crisis, so did the interbank system of guarantees that are so important to trade. But even in the best of times, and notwithstanding crisis, banks in countries where ADB’s Trade Finance Program operates have trouble securing guarantees, hence the existence of persistent market gaps.
Pricing for trade finance doubled and fluctuated wildly during the height of the crisis, including for imports to Asia (required for export production).
Much of Asia was, and to a lesser extent remains, dependent on export markets in the US and Europe. As a result of the crisis, and ensuing recessions in traditional export markets, many Western buyers were performing poorly or going bankrupt. This resulted in a considerable rise in nonperforming loans in many export-dependent Asian developing countries and this has had an adverse impact on Asia’s banking sector.
The main point here is that while Asia’s finance sector was generally healthy, it was not immune to significant weaknesses in the West’s financial system. Notwithstanding the general health of Asia’s financial system, at the height of the crisis the ability of banks toprovide Asian companies with finance to support trade was severely impaired.
D. Market Size and Market Gaps
One thing that became clear during Trade Finance Expert Group meetings convened by the World Trade Organization in 2008 and 2009 to coordinate action against plummeting trade volumes was that there was almost no data on trade finance. Policy makers need statistics to help direct policy decisions, but none were available to help guide an official response to the crisis in trade finance. Calls from the private sector for massive government and multilateral action to enhance financial support for trade were not underpinned byhard data.
To help fill this knowledge gap, ADB published a survey-based study in the first quarter of 2013 which identified gaps in trade finance and related those gaps to lost economic growth and job creation (ADB 2013). Banks surveyed stated that, of the $4.6 trillion in trade finance requests that they received in 2011, they rejected $1.6 trillion in requests to finance imports and exports, indicating that there is substantial unmet global demand for trade finance. Among developing Asian countries, the proposed trade finance transaction requests received amounted to $2.1 trillion, of which $425 billion were rejected.
104 ADB–OECD Study on Enhancing Financial Accessibility for SMEs
To give these numbers some meaning, in terms of the relationship between gaps in trade finance and the impact on growth and jobs, ADB surveyed more than 500 companies to ask, if you had more trade finance available, would you increase production and hire more people? In response, 300 respondent companies said that if they had access to 5% more trade finance they would increase production by 2% and hire 2% more staff. Companies surveyed also said that access to 10% more trade finance would lead to production and staffing increases of 5%.
There are many reasons for the gaps in trade finance. With respect to the regulatory environment, Basel is one contributing factor, but another is anti-money-laundering andknow-your-client requirements. Following the terrorist attack on 9 September 2001 in the US, a plethora of strict anti-money-laundering and know-your-client requirements have come into force. The trouble is not so much that they have come into force, but that they are not uniform across jurisdictions. It is extremely costly and time consuming for an international or regional financial institution to carry out these requirements in countriessuch as Bangladesh or Nepal on an annual basis, and a lack of harmonization makes it even more so. The result is that banks generally have either pulled out of some developing countries or do not bother going into developing markets. As such, banks are increasingly unable to provide the guarantees that are so important to trade with emerging markets. This contributes to the trade finance gap. Even after the financial crisis, this lack of harmonization in anti-money-laundering and know-your-client requirements is not likely to disappear.
Weak banking systems and a lack of transparency in Asia account for an important part of the trade finance gap. In many markets where the Trade Finance Program operates, financial statements are difficult to figure out, central bank oversight is weak, nonperforming loan ratios are high, and there are often high concentrations of loss-making state-owned enterprises in bank portfolios. These elements mean that risk management units in financial institutions around the world are reluctant to agree to credit limits that would result in the provision of bank-to-bank guarantees (and funding) to support trade. The Trade Finance Program provides technical assistance and feedback on annual reviews and due diligence to the banks on which it assumes risk. This helps address weaknesses among banks which contribute to trade finance gaps. Arguably the most critical element to closing trade finance gaps is financial reform. A stable banking system that functions efficiently is perhaps the most important basis to reducing any market gaps, including for SMEs engaged (or wanting to be engaged) in trade.
ADB is in the process of conducting a second study to identify gaps for trade and supply chain finance and to understand what impact this gap has on growth and jobs. By continuing to conduct these studies ADB hopes to establish trends in gaps to facilitate an understanding and to underpin interventions to narrow gaps.
E. ADB’s Response to the Trade Finance Gap
ADB’s Trade Finance Program plays an important role in closing gaps for trade finance. The program does this by providing guarantees and loans within 24 hours at market rates through more than 200 partner banks to support trade in the most challenging Asian developing countries.
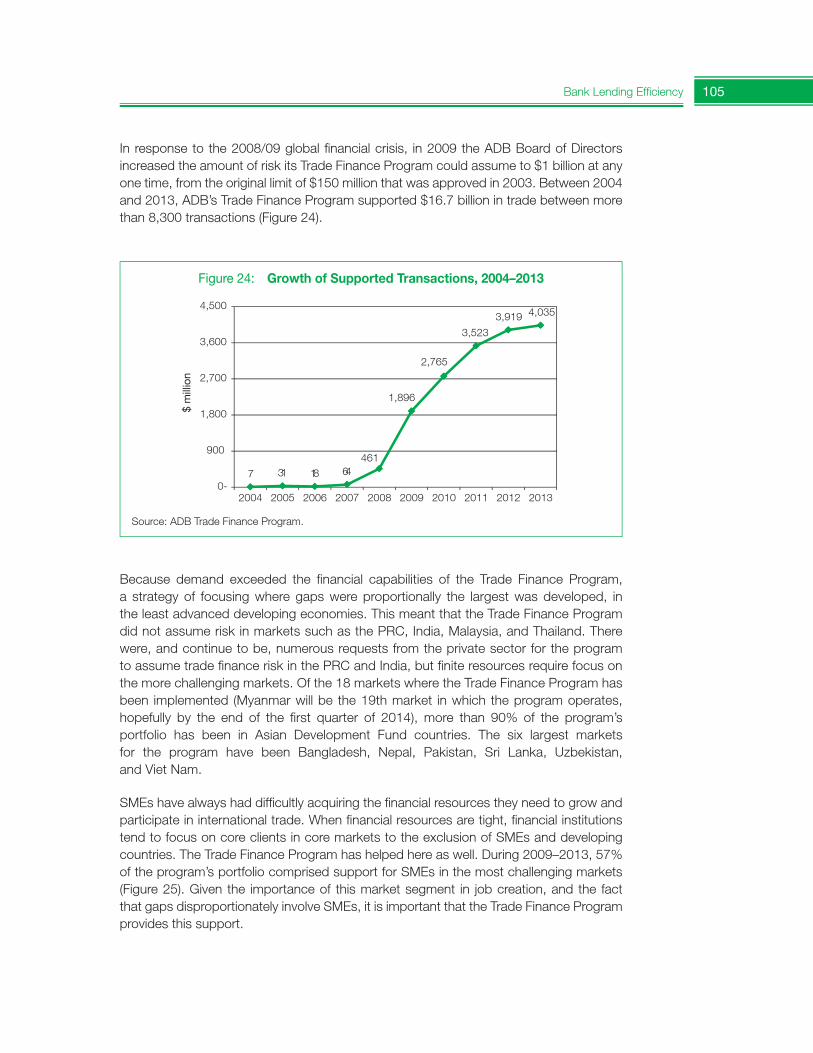
Bank Lending Efficiency 105
In response to the 2008/09 global financial crisis, in 2009 the ADB Board of Directors increased the amount of risk its Trade Finance Program could assume to $1 billion at any one time, from the original limit of $150 million that was approved in 2003. Between 2004 and 2013, ADB’s Trade Finance Program supported $16.7 billion in trade between more than 8,300 transactions (Figure 24).
Because demand exceeded the financial capabilities of the Trade Finance Program, a strategy of focusing where gaps were proportionally the largest was developed, in the least advanced developing economies. This meant that the Trade Finance Program did not assume risk in markets such as the PRC, India, Malaysia, and Thailand. There were, and continue to be, numerous requests from the private sector for the program to assume trade finance risk in the PRC and India, but finite resources require focus on the more challenging markets. Of the 18 markets where the Trade Finance Program has been implemented (Myanmar will be the 19th market in which the program operates, hopefully by the end of the first quarter of 2014), more than 90% of the program’s portfolio has been in Asian Development Fund countries. The six largest markets for the program have been Bangladesh, Nepal, Pakistan, Sri Lanka, Uzbekistan, and Viet Nam.
SMEs have always had difficultly acquiring the financial resources they need to grow and participate in international trade. When financial resources are tight, financial institutions tend to focus on core clients in core markets to the exclusion of SMEs and developing countries. The Trade Finance Program has helped here as well. During 2009–2013, 57% of the program’s portfolio comprised support for SMEs in the most challenging markets (Figure 25). Given the importance of this market segment in job creation, and the factthat gaps disproportionately involve SMEs, it is important that the Trade Finance Program provides this support.
Figure 24: Growth of Supported Transactions, 2004–2013
7 31 18 64 461
1,896
2,765
3,523
3,919 4,035
0-
900
1,800
2,700
3,600
4,500
2004 2005 2006 2007 2008 2009 2010 2011 2012 2013
$ m
illio
n
Source: ADB Trade Finance Program.
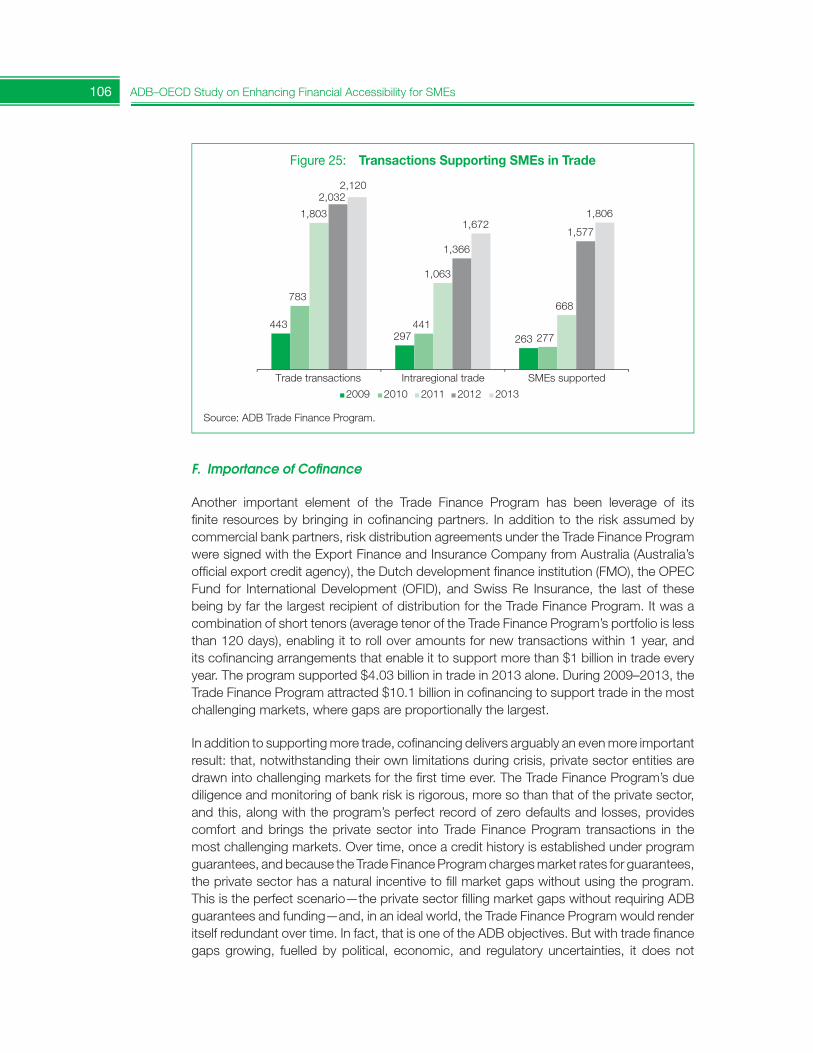
106 ADB–OECD Study on Enhancing Financial Accessibility for SMEs
F. Importance of Cofinance
Another important element of the Trade Finance Program has been leverage of itsfinite resources by bringing in cofinancing partners. In addition to the risk assumed by commercial bank partners, risk distribution agreements under the Trade Finance Program were signed with the Export Finance and Insurance Company from Australia (Australia’s official export credit agency), the Dutch development finance institution (FMO), the OPEC Fund for International Development (OFID), and Swiss Re Insurance, the last of these being by far the largest recipient of distribution for the Trade Finance Program. It was a combination of short tenors (average tenor of the Trade Finance Program’s portfolio is less than 120 days), enabling it to roll over amounts for new transactions within 1 year, andits cofinancing arrangements that enable it to support more than $1 billion in trade every year. The program supported $4.03 billion in trade in 2013 alone. During 2009–2013, the Trade Finance Program attracted $10.1 billion in cofinancing to support trade in the most challenging markets, where gaps are proportionally the largest.
In addition to supporting more trade, cofinancing delivers arguably an even more important result: that, notwithstanding their own limitations during crisis, private sector entities are drawn into challenging markets for the first time ever. The Trade Finance Program’s due diligence and monitoring of bank risk is rigorous, more so than that of the private sector, and this, along with the program’s perfect record of zero defaults and losses, provides comfort and brings the private sector into Trade Finance Program transactions in the most challenging markets. Over time, once a credit history is established under program guarantees, and because the Trade Finance Program charges market rates for guarantees, the private sector has a natural incentive to fill market gaps without using the program. This is the perfect scenario—the private sector filling market gaps without requiring ADB guarantees and funding—and, in an ideal world, the Trade Finance Program would render itself redundant over time. In fact, that is one of the ADB objectives. But with trade finance gaps growing, fuelled by political, economic, and regulatory uncertainties, it does not
Figure 25: Transactions Supporting SMEs in Trade
443 297 263
783
441 277
1,803
1,063
668
2,032
1,366
1,577
2,120
1,672 1,806
Trade transactions Intraregional trade SMEs supported
2009 2010 2011 2012 2013
Source: ADB Trade Finance Program.
Bank Lending Efficiency 107
seem likely any time soon. That said, ADB needs to keep this overall objective in view, to ensure the private sector is drawn in as much as possible.
G. Knowledge Dissemination is a Priority
In addition to the transactions done under the Trade Finance Program, there has been knowledge dissemination, which delivers tangible and measurable results in closing market gaps. Trade Finance Program personnel talk to banks and insurers regularly, including their risk management departments, to share the program’s experience in markets of operation. This has resulted in the private sector establishing limits for new markets to support trade. Information is critical to closing private sector market gaps, but it has been in short supply. Through its study on market gaps, and its systematic “knowledge dissemination” discussions with banks and insurers, the Trade Finance Program has closed financing gaps by closing knowledge gaps.
H. Trade Finance Register: An Important Tool to Assess Trade Finance Risk
In an effort to give statistical weight to the argument that trade finance carries a relatively low probability of loss, the Trade Finance Program proposed for the first time to track default and loss rates in trade finance at a global level. This initiative was named the Trade Finance Register and was housed at the International Chamber of Commerce (ICC). The pilot for this initiative, the ICC–ADB Trade Finance Register, worked with commercial banks to collect data on more than 5.2 million trade finance transactions. This data set, which spanned 2004–2009 including the global financial crisis, found a very low 0.02% probability of default. Since the initial register report there have been three more. In the latest report, the default rate on trade finance was identified at 0.05% on more than 11 million trade finance transactions. These statistics have been discussed with the Basel Committee, and are substantiating arguments in favor of treating trade finance differently for regulatory purposes. Having played its development role in establishing the register, ADB has left it to the ICC and its private financial institution partners to develop future reports. That said, ADB, through the Trade Finance Program, continues to work closely with the ICC and its sister multilateral development banks to provide data that will contribute to broader, deeper, and ongoing register reports.
While the statistical work that ADB’s Trade Finance Program initiated is important to underpin a substantive dialogue with regulators to loosen requirements for trade financeand therefore close the related gap, this information is also encouraging the private sector to assume more trade finance risk in challenging markets. For example, one of the largest insurance companies informed the Trade Finance Program that the statistical work initiated by the program, demonstrating the low probability of loss, was the single greatest factor in deciding whether or not to start a credit insurance business for trade finance.
As tougher regulatory requirements take hold and require the finance sector to continue deleveraging, new sources of trade finance funding need to be found. Investment funds are one potential large pool that should be attracted to trade finance. The register’s statistical work will help provide potential investors with the information they require to enter the trade finance business, still a little-known and little-understood business incapital markets and investor circles.
108 ADB–OECD Study on Enhancing Financial Accessibility for SMEs
I. Expansion to Myanmar
Myanmar’s banking system and commercial regulatory infrastructure is at an early stage of development, which makes it a real challenge for the Trade Finance Program to expand there. Myanmar is a perfect market for the program as it is an extreme example of why ADB and the Trade Finance Program exist: to be first movers into new and uncertain markets, to fill financing gaps for economic growth, to provide technical assistance to upgrade skills in the public and private sectors, and to create structures (including the provision of guarantees) through which partnerships are formed with international investors and banks.
Because it is planned that the Trade Finance Program will have expanded to Myanmar bythe end of the first quarter of 2014, it has been very busy there in 2013. The due diligence process in itself has been extremely important in delivering significant development impact in Myanmar. First, most of the Myanmar banks have never been through this kind of process, so what they learned (what kind of information ADB requires, how the information needs to be reported) is very valuable. Working with ADB’s Trade FinanceProgram through this process will help Myanmar’s new private banks understand what potential correspondent banks, international investors, and (over time) rating agencies will require. The open and frank feedback from the Trade Finance Program about its assessment of the banks has enhanced this learning process, which is so important at this stage of Myanmar’s development. Second, the Trade Finance Program talks with the Central Bank of Myanmar about its due diligence methodology and findings are providing important information and learning opportunities for bank regulators.Third, the due diligence process was critical for ADB to gain a better understanding of the banking system and individual banks in that market. Equally importantly, the Trade Finance Program is now able to share what is learned from the due diligence process with partners around the world. There is a thirst for knowledge about Myanmar and the due diligence process has provided important insight that can be shared. This is the beginning of a process to bring the international financial community to Myanmar and will serve to close gaps for trade finance in that country.
In addition, the Trade Finance Program conducted training seminars on trade finance for bankers in Yangon in 2013. This form of technical assistance is very important to Myanmar at this stage. It will help bankers deliver trade finance services to companies and will mitigate the program risk in dealing with Myanmar banks in trade finance transactions.
J. Boosting South–South Trade
It has become trendy to talk about the promise of South–South trade in creating economicgrowth and jobs. There is no doubt that the opportunities are enormous, but to realize its full potential there needs to be more points of contact and more relationships among banks to underpin more trade. With the exception of a few global banks with a presence in most corners of the world, there are no bank relationships between Latin America and Asia outside of Japan, the PRC, India, the Republic of Korea, and Singapore. This means that there are no direct relationships between banks anywhere in Latin America and Bangladesh, Indonesia, Pakistan, the Philippines, Sri Lanka, or Viet Nam. And the links between African and Asian banks are even sparser.

Bank Lending Efficiency 109
In an effort to resolve this impediment to realizing more South–South trade, work has been undertaken under the Trade Finance Program with the African Development Bank (AfDB) and the Inter-American Development Bank (IDB); the IDB’s trade finance programhas been actively introduced to Asian banks to encourage them to sign up to IDB’s trade finance. In turn, the IDB has encouraged Latin American banks to join the Trade Finance Program so that the program can provide guarantees to these banks covering payment obligations from Asian banks to support South–South trade. In addition to covering transactions, by having banks from both continents in the respective trade finance programs, both institutions will facilitate the establishment of direct relationships between banks on both continents.
The AfDB has implemented a trade finance program, which has been modeled after ADB’s Trade Finance Program. ADB worked closely to support the implementation of AfDB’s program and provided Trade Finance Program operations manuals, legal documentation, and training. The intention is to “swap” banks with the AfDB’s trade finance program, as has been initiated with the IDB.
1. ADB’s Supply Chain Finance ProgramWhile ADB has developed a strong capacity to support trade, including among SMEs, through its Trade Finance Program, there are gaps in ADB’s offering and capacity to support SMEs in supply chains. As such, ADB’s Board approved the concept for a new Supply Chain Finance Program in November 2012. ADB anticipates full implementation of the new program in 2014.
There are many benefits to supply chain finance for all parties—buyers, suppliers, and lenders. For buyers it (i) reduces working capital requirements by stretching out payment terms to suppliers, (ii) enhances relationships with suppliers through early payments, and (iii) helps secure delivery of supplies. For suppliers, supply chain finance (i) creates the opportunity to receive early payment of invoices, (ii) reduces working capital requirement by reducing payables outstanding, (iii) allows better and predictable payment flows, (iv) creates an enhanced buyer relationship, and (v) reduces financing costs. For lenders, supply chain finance leads to (i) increased buyer financing with enhanced returns,(ii) efficient transparency and visibility of underlying payables with an automated supplychain finance platform, and (iii) the opportunity to enhance relationships with buyers and their suppliers.
The most interesting aspect of supply chain finance that underpins ADB’s enthusiasm to fill gaps in this area is that it has the potential to address the two greatest impediments to SMEs accessing finance: poor financials and lack of collateral. Unlike traditional risk assessments that focus almost exclusively on financials and collateral, supply chain finance focuses on the strength and longevity of a supply chain as well as the mutualdependence between buyer and supplier.
Notwithstanding the benefits, there are challenges and impediments to supply chain finance that help explain why there is a gap in the market. Limited risk-bearing capacity among financial institutions is one. A lack of understanding around structures to mitigate risk under supply chains is a second. A third impediment in some emerging markets is a lack of a regulatory and legal environment that recognizes the true sale of receivables.
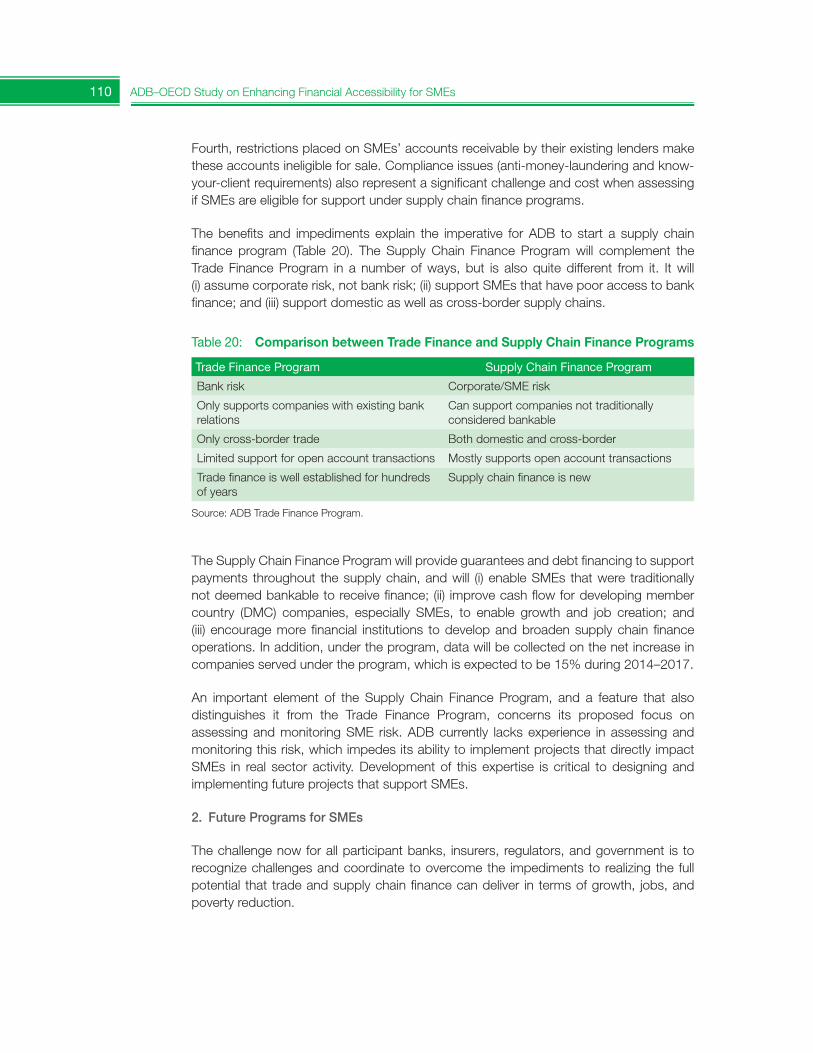
110 ADB–OECD Study on Enhancing Financial Accessibility for SMEs
Fourth, restrictions placed on SMEs’ accounts receivable by their existing lenders make these accounts ineligible for sale. Compliance issues (anti-money-laundering and know-your-client requirements) also represent a significant challenge and cost when assessing if SMEs are eligible for support under supply chain finance programs.
The benefits and impediments explain the imperative for ADB to start a supply chain finance program (Table 20). The Supply Chain Finance Program will complement the Trade Finance Program in a number of ways, but is also quite different from it. It will (i) assume corporate risk, not bank risk; (ii) support SMEs that have poor access to bank finance; and (iii) support domestic as well as cross-border supply chains.
The Supply Chain Finance Program will provide guarantees and debt financing to support payments throughout the supply chain, and will (i) enable SMEs that were traditionally not deemed bankable to receive finance; (ii) improve cash flow for developing member country (DMC) companies, especially SMEs, to enable growth and job creation; and(iii) encourage more financial institutions to develop and broaden supply chain finance operations. In addition, under the program, data will be collected on the net increase in companies served under the program, which is expected to be 15% during 2014–2017.
An important element of the Supply Chain Finance Program, and a feature that alsodistinguishes it from the Trade Finance Program, concerns its proposed focus on assessing and monitoring SME risk. ADB currently lacks experience in assessing and monitoring this risk, which impedes its ability to implement projects that directly impact SMEs in real sector activity. Development of this expertise is critical to designing and implementing future projects that support SMEs.
2. Future Programs for SMEs
The challenge now for all participant banks, insurers, regulators, and government is to recognize challenges and coordinate to overcome the impediments to realizing the full potential that trade and supply chain finance can deliver in terms of growth, jobs, and poverty reduction.
Table 20: Comparison between Trade Finance and Supply Chain Finance Programs
Trade Finance Program SupplyChainFinanceProgram
Bank risk Corporate/SME risk
Only supports companies with existing bank relations
Can support companies not traditionally considered bankable
Only cross-border trade Both domestic and cross-border
Limited support for open account transactions Mostly supports open account transactions
Trade finance is well established for hundreds of years
Supply chain finance is new
Source: ADB Trade Finance Program.
Bank Lending Efficiency 111
References
ADB. 2003. Report and Recommendation of the President to the Board of Directors on a Proposed Trade Finance Facilitation Program. Manila.
______. 2009. Major Change in Scope: Trade Finance Facilitation Program. Manila.
______. 2012. Report and Recommendation of the President to the Board of Directors on a Proposed Supply Chain Finance Program. Manila.
Beck, S. et al. 2013. ADB Trade Finance Survey: Major Findings. ADB Briefs. No.11. Manila: ADB.
Belin, O. 2013. The Three Structures Fueling Growth in Supply Chain Finance. Malibu: Pepperdine University.
CGI. 2007. Supply Chain Finance: A new way for trade Banks to strengthen customer relationships.
The Export-Import Bank of the United States: http://www.exim.gov/newsandevents/releases/2013/Ex-Im-Renews-Supply-Chain-Guarantee-for-Citibank-Supporting-CNH-Suppliers.cfm
SWIFT. 2013. A new start for Supply Chain Finance. White paper.
112 ADB–OECD Study on Enhancing Financial Accessibility for SMEs
2.5. The Role of Public Financial Institutions for SMEsVirginia Robano51
This section describes public financial institutions (PFIs) that attend SME financing needs,based on two interrelated dimensions: institutional and financial. The section describesseveral PFI characteristics such as mandate, governance arrangements, ownership, sources of funding, products offered, business model, and performance requirements. In addition, it provides a rationale for public intervention in financial markets, addressing both structural and cyclical justifications. The section describes the anticyclical PFI measures taken in the aftermath of the 2008/09 crisis, as well as the opportunities and challenges derived from the increased scale and scope of activities. Finally, the paper identifies some good practices.
A. Background
Governments across OECD and non-OECD countries engage in financial servicesprovision to pursue public policy objectives through PFIs. Their purpose is to mitigate failures in financial markets and enhance access to finance for strategic sectors or financially constrained groups, including SMEs, start-ups, or households.
PFIs take diverse institutional and financial forms, e.g., public commercial banks, development banks, SME support agencies, investment funds, and guarantee societies. Their governance and mandates vary according to their nature and the breadth of their objectives. PFIs in the form of development banks have long existed in some countries to address structural gaps in financing, such as the provision of funding for large infrastructure projects, long-term business investments, or the financing of new and innovative firms in sectors where market failures are likely to be more prevalent, such as research and development, with a large share of intangible assets and potentially large spillovers (Levy-Yeyati, Micco, and Panizza 2004). In some OECD countries, development agencies channel funds towards interest sectors (such as agriculture, biotechnology, or energy efficiency) or interest activities (such as exports). The main difference between public banks and public agencies is in their sustainability. Public banks, investment funds,and guarantee societies might be financially sustainable; SME support agencies depend on government transfers to finance their activities.
Since the 2008/09 global financial crisis, PFIs have played an increasing role in financial markets, addressing short-term financing gaps and mitigating cyclical fluctuations in lending activities of financial institutions. Following the sharp reduction in business lending, PFIs have been charged with new functions or asked to target a broader set of areas and players, often in the framework of short-term anticrisis plans that continue. This change in the scale and scope of activities poses new challenges to PFIs.
A growing number of governments choose to support the SME sector through public banks. France has recently reorganized its SME promotion activities into one institution,
51 Centre for Entrepreneurship, SMEs and Local Development (CFE) Consultant, Organisation for Economic Cooperation and Development.
Bank Lending Efficiency 113
the Banque Publique d’Investissement (Bpifrance), operational since February 2013. Portugal and the United Kingdom have announced the creation of new PFIs for 2014. In the case of the United Kingdom, the British Business Bank expects to start operating in the last quarter of 2014. Ireland and Latvia have signaled their interest in the possibility of promoting SME finance through a public bank. Australia is moving towards providing SME finance through a single entry point in order to ease regulatory burden. Similarly, in non-OECD countries, since 2008 Costa Rica provides SME finance through a one-stop window (Sistema Banca de Desarrollo).
Further, ongoing regulatory reforms (Basel III) have impacted the capital availability and the instruments that PFIs provide. Although Basel III concerns the overall business financial structure, SME finance has been particularly affected (OECD 2012). Basel III assigns a risk weight of 100% to SME credit (a 75% risk weight if the bank’s retail portfolio is diverse and no loan exceeds €1 million) (OECD 2012).
B. Rationale
Financial intermediaries exist to match those who want to borrow with those who want to lend, as in a market with numerous agents there is typically asymmetry of information. With imperfect information, prices do not clear markets, leading to credit rationing (Stiglitz and Weiss 1981).52 In addition, the matching process involves nonlinear transaction costs (which are also related to the amount of lending or borrowing involved) and a transformation of the maturity of deposits, as usually those who lend tend to prefer short-term contracts(i.e., to have their money readily available in case the need arises) and those who borrow tend to prefer long-term ones (to finance investment projects). Financial intermediaries provide another public good: project screening. Financial institutions usually have moreexperience and knowledge of the macroeconomic environment, being in a better position to assess risk than many of the borrowers who apply for loans (Manove, Padilla, and Pagano 2001). By screening projects, financial institutions can mitigate the number of failures and thus reduce private and social costs.
Financial services can be provided either by private or public agents. To identify lenders,several mechanisms are devised, e.g., in the case of direct lending, collateral requirements,use of credit scores, and relationship lending. If those instruments are unavailable, some government action might be justified (Craig, Jackson, and Thomson 2011). Government intervention can be direct (providing funds through debt, equity, or hybrid instruments) orindirect (improving the availability of credit information, providing guarantees, or facilitatingmethodologies for financial statement analysis). These products and services may be provided through different channels and by different institutions.
Structural deficiencies in financial markets justify public intervention in financial markets through a financial institution. PFIs can have a role, e.g., in promoting financial development in isolated regions (providing economic additionality) or in broadening access to finance for sectors overlooked by private banks (providing financial additionality), because borrowers lack collateral or have projects that require a large upfront investment, i.e., in transport
52 Credit rationing occurs when a project could be financed at a market interest rate (its net present value is positive) but lack of information prevents finding financing.
114 ADB–OECD Study on Enhancing Financial Accessibility for SMEs
and energy.53 Public intervention might seek to target specific sectors, understanding that there are positive externalities from socially valuable but financially unprofitable projects (IDB 2005, Gutiérrez et al. 2011). PFIs can also finance sectors affected by negative externalities, as in the case of agricultural projects subject to systemic risk or export risk (Levy-Yeyati, Micco, and Panizza 2004).
In addition to these structural reasons, PFIs can have a cyclical role. In a context of regulatory and financial environment change, when uncertainty might reduce willingness to lend by the private sector, or during economic downturns when the scarcity of capital might reduce private credit availability, there is an anticyclical role for PFIs supplying funds. Indeed, having the financial infrastructure already in place in the form of a PFI ready to inject liquidity in the system might accelerate the recovery process. This would also respond to a coordination failure problem, whereby private providers do not internalize the fact that, by increasing the supply of credit, they would speed up economic growth (Levy-Yeyati, Micco, and Panizza 2004).
Moreover, the public sector can absorb risk better at times of economic downturns, as public sector entities can more easily hedge risk over time and across a large amount of beneficiaries, being able to compensate for the reduced supply from private banks and the increased volatility in risk aversion by private providers (Arrow and Lind 1970).
C. The SME Context
The structural and cyclical reasons mentioned above affect SMEs disproportionately, as SME financing is constrained by information asymmetries and agency problems. Access to collateral and guarantees, which are frequently demanded to mitigate credit risk, is not always a viable solution for SMEs.
There are supply-side constraints on SME access to finance, as the small-scale lending involved might not compensate for the costs of screening and monitoring (OECD 2013b). Market solutions often leave SMEs as the “missing middle”, as their financial needs tendto be too large to be attended by microfinance institutions but too small to be attended by the standard banking models (OECD 2006, Klein 2010, Gutiérrez et al. 2011). For instance, in the case of the United Kingdom, the SME gap has been identified since 1931 (the Macmillan Gap) and a recent report places it at between £250,000 and £1 million. For projects below the £250,000 threshold, SMEs can obtain finance from personal savings and seed money; above £1 million, institutional investors show an interest in financing the projects (Skidelsky, Martin, and Wigstrom 2012). Still in the United Kingdom, a recent review concludes that this finance gap is structural, and it has been exacerbated by the recession (Rowlands 2009). Similarly, in Germany, after concluding that SMEs faced the “missing-middle” finance gap, in 2004 KfW launched a program (Unternehmerkapital) designed to adapt finance solutions originally intended to target larger firms to the needsof SMEs (OECD 2013b).
53 According to the Inter-American Development Bank (2005), these rationales express a social view on financial intermediation, which contrasts with the political view (when access to finance is promoted for political reasons, leading to state capture) and with the agency view (which suggests balancing costs and benefits of public intervention, before settling on a decision) (see also Levy-Yeyati, Micco, and Panizza 2007).
Bank Lending Efficiency 115
Many small businesses face difficulties in financing viable projects, which limits their potential to create jobs and spur aggregate welfare (Cressy 2002, OECD 2006, Schmit et al. 2011). According to Cressy (2002), there is no consensus on whether this “funding gap” is an equilibrium situation or a market failure. Government intervention would be desirable only in the latter case, and if the identified deficit is permanent rather than transitory.
The sector of activity of some SMEs (i.e., those with intangible assets) makes them prone to having financial constraints, as they typically own a limited amount of assets that can be used as collateral (European Association of Credit Guarantees [AECM], European Association of Public Banks [EAPB], Network of European Financial Institutions [NEFI] 2010). In addition, young firms (start-ups or in early stage) might lack credit history, which restricts their financing possibilities. Moreover, they might have new business models, or involve new technology, with the consequent restriction in access to finance. Yet, access to finance is not a problem only for young firms; those SMEs with established business models might need capital to finance expansion (into domestic or international markets), or everyday activities (working capital), or to change ownership or control.
The intrinsic characteristics of SMEs and young firms complicate in particular their access to capital (bond and equity) markets. The issuance and information fixed costs discourage professionals to lend to SMEs and young firms (ESMA 2012, OECD 2013b). Moreover, bond and equity finance implies a hand over of control or ownership that not all firms arewilling to accept (ESMA 2012).
The regulatory environment might be a barrier to SME finance as well, if property rightsor liquidation costs are not precisely defined (IDB 2005, 2013; Ratnovski and Narain 2007; Klein 2010; Schmit et al. 2011; International Finance Corporation [IFC] 2011; World Bank [2012]).
There are also demand-side constraints on SMEs, as it might happen that they are not fully aware of the financial opportunities available or they lack financial skills and training (i.e., in terms of preparation of financial statements to access credit). These constrains are likely to be higher for new firms, or at the stage of business planning and early development of financial processes (Accounting and Business 2013).54
There is a role for the state to spur aggregate welfare by ensuring that SMEs are sufficiently funded. SME activities and entrepreneurial dynamics can spill over into the economy, contributing to economic growth, innovation, job creation, and social inclusion (De la Torre et al. 2007, Beck 2012, Council of Europe Development Bank 2013). These positive effects might not be taken into account by private financial institutions if they cannot be privately appropriated.
54 The report by Accounting and Business (2013) identifies four stages in SME financial development: the initial stage (stage 0) corresponds to that of business planning; stage 1 is when the owner realizes that he or shecannot control everything and hires a professional finance manager; in stage 2 there is a standardization and formalization of processes, with staff to monitor cash flows and management of credit; and in the final stage 3 there is a finance team in charge of management reporting and business training. Lack of financial skills tends to emerge as a binding constraint, especially for new firms (those in stages 0 and 1) or at the stage of business planning and early development of financial processes.
116 ADB–OECD Study on Enhancing Financial Accessibility for SMEs
Also, the impact of finance sector deepening on firm performance and growth is stronger for SMEs than for large enterprises (Beck, Demirgüç-Kunt, and Maksimovic 2008).
D. Empirical Evidence on SME Access to Finance
The empirical evidence supports the idea that SMEs have constraints on their access to finance (OECD 2006, OECD–ECLAC 2013). In recent summary papers, Beck, Demirgüç-Kunt, and Martínez-Pería (2008); Beck, Demirgüç-Kunt, and Maksimovic (2008); and Beck (2010) review some of the problems in access to finance by SMEs, and some empirical evidence showing that SMEs are more credit constrained and use less external funding than large firms.55 Indeed, the OECD Scoreboard on SME finance shows that finance conditions for SMEs in most countries remained tighter than for large firms in the aftermath of the financial crisis, with SMEs in most countries facing higher interest rates, shortened maturities, and increased requests for collateral than large firms. Moreover, in some countries, the interest rate spread between SMEs and large firms increased also throughout the recovery (OECD 2013a).
There is a large geographical variation in the problem of access to finance. While in high-income OECD countries 15% of SMEs find that access to finance is a problem, in low-income countries the percentage increases to 45%, and is about 30% in upper-middle-income countries (Klein 2010). However, after the 2008/09 crisis, the OECD Scoreboard on Financing SMEs and Entrepreneurs shows that, while the growth in SME lending was moderate in many developed economies over 2010–2011, in emerging economies there was a more prominent increase in SME financing, in a context of rapid expansion of the business sector overall (OECD 2013a).
In countries with a good institutional setting (i.e., where property rights are well-defined), SMEs have less problems in accessing finance than in institutional environments characterized by lack of transparency and uncertainty about rights and their enforcement(Ratnovski and Narain 2007).
In a recent survey of 91 banks in 45 countries (13 of them OECD countries—Austria, Belgium, Chile, Finland, Greece, Hungary, Mexico, Poland, Slovakia, Slovenia, Sweden, Switzerland, and Turkey), Beck, Demirgüç-Kunt, and Martínez-Pería (2008) describe the approach used by banks to decide on SME finance, and find that more than 80% of public banks have separate departments to deal with SMEs and more than 90% of private and foreign-owned banks do so. However, while the sale of financial products is decentralized, the decision on whether to lend (the risk management, loan approval, and loan recovery functions) continues to be centralized. The authors also find that, when deciding on SME lending, foreign-owned banks rely on scoring models as one of the few inputs in the decision process, and that they tend to accept real estate as collateral. The authors find that the share of applications approved by
55 Beck (2010) suggests that financial development is positively associated with firm size, and recommends using the “access possibility frontier”, defined as the maximum share of SMEs that can be served by financial institutions in a commercially viable way, as an approach to understanding the size gap in corporate finance.The access possibility frontier would then give an idea of public policies designed to move towards the frontier and of the policies designed to push the frontier forward.
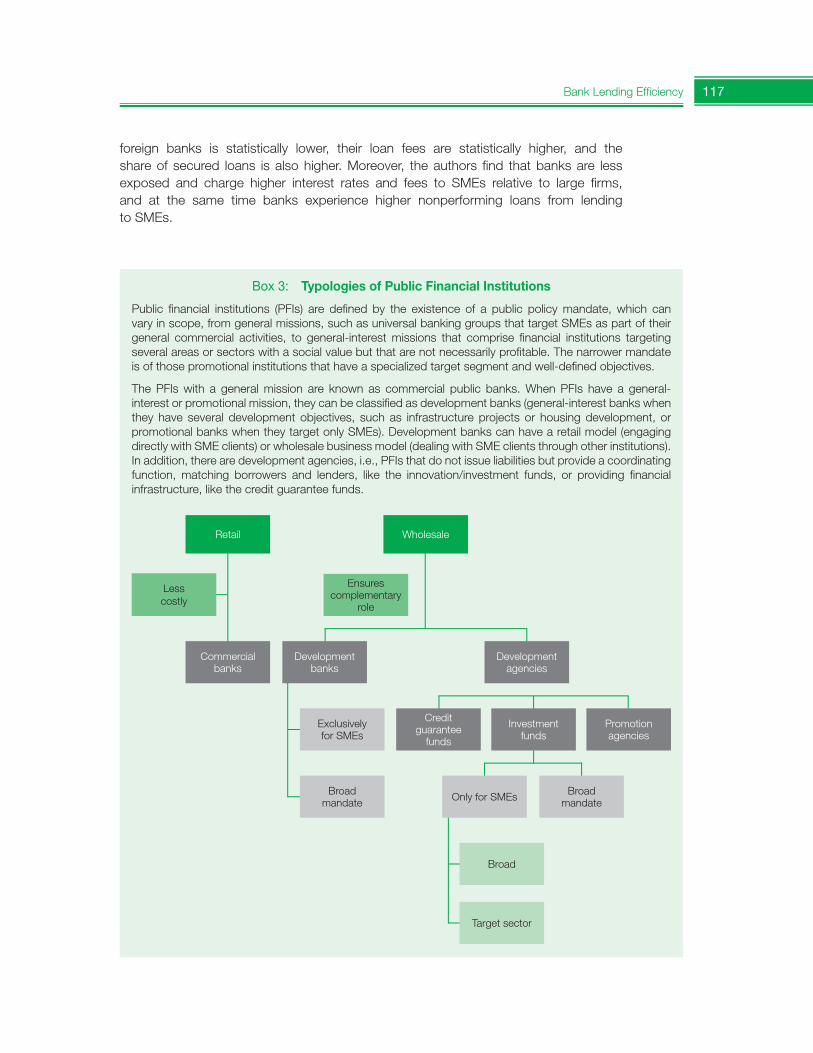
Bank Lending Efficiency 117
foreign banks is statistically lower, their loan fees are statistically higher, and the share of secured loans is also higher. Moreover, the authors find that banks are less exposed and charge higher interest rates and fees to SMEs relative to large firms, and at the same time banks experience higher nonperforming loans from lending to SMEs.
Box 3: Typologies of Public Financial Institutions
Public financial institutions (PFIs) are defined by the existence of a public policy mandate, which can vary in scope, from general missions, such as universal banking groups that target SMEs as part of their general commercial activities, to general-interest missions that comprise financial institutions targeting several areas or sectors with a social value but that are not necessarily profitable. The narrower mandate is of those promotional institutions that have a specialized target segment and well-defined objectives.
The PFIs with a general mission are known as commercial public banks. When PFIs have a general-interest or promotional mission, they can be classified as development banks (general-interest banks when they have several development objectives, such as infrastructure projects or housing development, or promotional banks when they target only SMEs). Development banks can have a retail model (engaging directly with SME clients) or wholesale business model (dealing with SME clients through other institutions). In addition, there are development agencies, i.e., PFIs that do not issue liabilities but provide a coordinating function, matching borrowers and lenders, like the innovation/investment funds, or providing financial infrastructure, like the credit guarantee funds.
Retail Wholesale
Ensures complementary
role
Commercial banks
Development banks
Development agencies
Exclusively for SMEs
Broad mandate
Broad
Target sector
Only for SMEs Broad mandate
Investment funds
Credit guarantee funds
Promotion agencies
Less costly
118 ADB–OECD Study on Enhancing Financial Accessibility for SMEs
E. Role of Public Financial Institutions during the Global Financial Crisis
In many OECD countries, the most severe economic recession since the Great Depression dried up financial flows to the real economy, particularly for SMEs, which rely more onbank lending than other sectors of the economy. Both demand- and supply-side factors explain the credit crunch to SMEs.
From the demand-side, the global recession affected the investment activities of SMEs, whose decline translated into a reduced demand for funding. In the case of France, Kremp and Sevestre (2011) find that the reductions in SME credit volumes granted during 2008–2010 can be attributed to decreases in the demand for loans.
From the supply-side, the reluctance of banks towards SME lending can be explained by poor SME prospects, stagnation in interbank lending, increased cost of capital, and the willingness to rebuild bank balance sheets (OECD 2009). The availability of funds decreased, as a consequence of both the Great Recession and the enhanced regulatory requirements (Basel III),56 making it difficult for private sector financial institutions to maintain their previous lending level. Moreover, the turmoil in financial markets increased the risk aversion of financial institutions. As the OECD Scoreboard on SME and entrepreneurship finance illustrates, the interest rate spread between SME loans and those of large firms increased, as did collateral requirements on SME lending. SME lending plummeted during 2008/09, creating liquidity shortages even for viable SMEs and exacerbating solvency problems (OECD 2013a).
1. Public Financial Institutions have Knowledge and InfrastructureIn contrast with structural market failures, distortions in times of crisis materialize quickly and require a more rapid intervention and considerable financial efforts for a limited period of time. There is a role for public intervention, in what has been called the “Sleeping Beauty syndrome” (Stephens 1999, cited by Smallridge and Olloqui 2011). This refers to the fact that, during normal times, PFIs do not intervene in particular markets or sectors, but in periods of crisis a quick reaction (“wake-up”) is needed, with PFIs providing (existing) technical expertise as well as funds, including geographically dispersed regions. A 2010survey implemented by the IDB with ALIDE support suggests that the reason why PFI operations were scaled-up during the crisis was for the experience and variety of lending instruments (IDB 2013, 12).
2. Public Financial Institutions have Lower Volatility of Risk AversionPFIs have lower volatility levels of risk aversion than private sector intermediaries because governments can spread risk across time and sectors. Therefore, there is a natural role for them in the aftermath of the crisis, substituting, at least in part, private institutions that are reluctant to lend (Arrow and Lind 1970).57 As Micco and Panizza (2006) claim, public lending is less affected by macroeconomic shocks than is private lending.
56 See OECD (2012) for an analysis of the impact of Basel III regulatory changes in SME access to finance. See also Levy-Yeyati, Micco, and Panizza (2004) for a general assessment of the effects of increased regulation on bank lending.
57 See De la Torre and Ize 2009; Rudolph 2010; Anginer, De la Torre, and Ize 2011.
Bank Lending Efficiency 119
3. Public Financial Institutions can Inject LiquidityPFIs have lower restrictions on funds availability, as it is usually the case that governments inject capital in them to compensate for the inability of the private sector to maintainlending levels.
To mitigate the adverse effects of the crisis on firms in general and SMEs in particular, governments around the world have increased policy efforts to relieve their financial distress and ensure their liquidity. Addressing long-standing finance challenges during times of crisis is a role complementary to the private sector, as it targets those market segments unattended by private providers and uses different instruments (i.e., longer maturity, administered interest rates). The recent financial crisis has demonstrated that PFIs play an important role in mitigating cyclical fluctuations in lending activities of financial institutions and offset coordination failures among market participants.
PFIs also have increased their scope of activities, broadening the segments supported. The severity of the financial crisis prompted many PFIs to temporarily loosen their eligibility criteria in order to support a wider range of market participants, including large firms (Beck, Demirgüç-Kunt, and Maksimovic 2008; Ratnovski and Narain 2007; De Luna-Martínez and Vicente 2012; Klein 2010). For instance, the Government of Germany requested KfW to increase its infrastructure programs by €3 billion and lend to large companies with short-term liquidity shortfalls (Rudolph 2010).
4. Anticrisis MeasuresThe objective of anticrisis measures undertaken by PFIs was to keep the lending channel going on in the economy in order to avoid a sudden stop. Across most countries, one PFI initial measure was to ameliorate the conditions of the current instrument of choice, particularly debt funding, which was (and still is) the most common source for SMEs.
In Europe and in Latin America, PFIs scaled-up their financing operations, which were mostly direct loans for working capital and credit export for SMEs (Olloqui and Palma-Arancibia 2012). In the United States, as public loans granted by the Small Business Administration (SBA) account for about 1% of all small businesses loans (Wiersch and Shane 2013),58 securitization measures were increased to augment liquidity. In a global survey of PFIs, De Luna-Martínez and Vicente (2012) confirm that PFIs scaled-up their operations to compensate for the credit crunch in the private finance sector.
The surge in operational scale during the crisis was accompanied by a substantial increase in the scope of activities, covering new sectors.
On the other hand, as a consequence of the crisis, many PFIs in Latin America changed their business models, although most often temporarily. While in 1998 first-tier lending accounted for 50% of all activities, in 2004 it accounted for 67% and in 2011 it scaled back to 58%. PFIs participation in second-tier lending, originally justified under the low operational costs and higher coverage through the private network, has slowed, accounting in 2011 for 34% of activities (ALIDE 2012). The reason argued by commercial
58 In the US, debt instruments are the first source of funding for SMEs; however, the Small Business Administration has used this instrument on a smaller scale than European PFIs.
120 ADB–OECD Study on Enhancing Financial Accessibility for SMEs
banks for this scaling back is that, even though initial funding for SME lending was coming through another PFI, the banks themselves would be responsible for assuming the risk in financing SMEs and they were not willing to take that risk. First-tier PFIs in Latin American countries have started channeling their resources through nonfinancial intermediaries, such as nongovernment organizations specialized in microfinance, and rural savings banks.
In addition, in Latin American countries, missions have been revised and PFIs have reoriented towards regional and/or sector mandates, as opposed to targeted ones (IDB 2013). However, the crisis did not imply a change of ownership. In some European countries, the credit crunch has in part fostered the return to full ownership of some public banks (Italy’s MedioCredito Centrale, Serbia’s Development Fund, the Slovak Republic’s SZRB, and Slovenia’s SID) so that they can benefit from access to structural funding. The funding instruments to alleviate access to finance for SMEs have evolved as well, partlybecause of the crisis. Thus, indirect instruments (guarantees and counterguarantees) have been created and expanded.
F. Opportunities and Challenges for Public Financial Institutions in the Postcrisis Environment
PFIs supported governments in their responses to the financial crisis of 2008/09. However, the increased scale and scope of activities could pose challenges to the PFI risk-management capacity for some smaller PFIs, or highlight the need to build expertise in the new areas of intervention.
Another key challenge is how to scale back the financial assistance to those sectors that can be served by the market once the recovery strengthens. In fact, some of the financial mechanisms adopted, such as the use of cross-subsidies, the adoption of soft performance targets, and the administrative reduction in the cost of funds might prevent market development over the medium to long term, generating unfair competition and discouraging private participation.
Following the expansion of activities during the recent crisis, many PFI mandates broadened de facto, and PFIs increased their lending activities as part of countercyclical policies. Some authors specify that there is no need for a PFI to have an explicit mandate to address countercyclical measures (Gutiérrez et al. 2011). De la Torre and Ize (2009) specifically advocate for PFIs having countercyclical discretion, and not to have to followprespecified norms. However, from a mission statement point of view, it presents the challenge of deciding when to phase out activities to leave room for the private sector.
With respect to corporate governance arrangements, PFIs can have an independent or a government-appointed board. Both options have advantages and disadvantages. Assessing the performance of the board presents many challenges, as many subjective and qualitative elements interact (OECD 2007, Frederick 2011). As risk-taking activities in the SME segment are more volatile than in other sectors, there might be a conflict between the mission statement and managerial incentives. In particular, preserving financial performance might require a reduction of lending or recapitalization, which might conflict with PFIs’ mandates (Ratnovski and Narain 2007). Also, it is difficult to liquidate
Bank Lending Efficiency 121
PFIs when there are problems—recapitalization is costly and regulatory intervention may be sensitive. Within government there might be another conflict between the supervisory role and the PFI business role.
Funding mechanisms depend on the structure that the PFI has taken, and on the operational objectives. In some cases, after an initial disbursement from the state, the PFIhas to be financially sustainable; in other cases, the PFI partially finances its activities with profits from lending to other segments.
Capital plays a different role for public and private financial institutions. In private institutions, capital acts as a balance between risk-taking incentives and insurance in case of need. In PFIs, the state is the (implicit) guarantor of funds; therefore it presents the risk of excessively funding some development activities beyond what might be socially desirable. Even though governments have more limited scope to provide direct funding, the fact that PFIs recapitalized some banks and capital was injected into the system, might give the impression that these measures will be undertaken again should another crisis occur.
Having a public policy mandate implies that both development banks and development agencies have to abide by it. Financial considerations might enter into the decision, for example, of whether to foster growth in a segment (i.e., SMEs). It might be necessary to undergo some financial losses until the market is developed, or until the investment realizes. On the other hand, financial constraints may lead to lending only to profitable firms or viable projects. There, a challenge arises concerning the possibility of engaging in competition with the private sector. There is an additional risk of crowding out the private sector because PFIs have access to cheaper funds and might be subject to less regulation. This generates an uneven playing field (Ratnovski and Narain 2007).
Another aspect to consider when assessing the opportunities and challenges that PFIs face concerns the plausible fragmentation of support that SMEs might be subject to. During a crisis, say at national level, banks might find insufficient access to funds to operate their regular activities. One of the most compelling piece of evidence in this regard is the information presented in the OECD Scoreboard on Financing SMEs andEntrepreneurs (OECD 2012, 2013a, and 2014).59 Foreign banks (or banks whose matrix is located outside the geographical location of the crisis) might not have the incentive to continue lending to SMEs because of the increase in credit risk that a crisis might present. In such events, supranational PFIs might be able to channel resources from other regions to restore the lending channel in that context. Alternatively, seeking cofinancing opportunities with the private sector might be useful as a way to pool resources and increase cooperation in order to overcome the fragmentation of support. For example, the European Investment Bank (EIB) group is strengthening cooperation with national promotional banks. One general challenge that PFIs face is on the decision of how tofinance the products, and on whether the allocation of public funds to alternative targets might have resulted in larger welfare (International Finance Corporation 2011). Financing
59 Also, Kraemer-Eis, Lang, and Gvetadze (2013) cite evidence showing that banks discriminate against SMEs by charging higher interest rates to small firms.
122 ADB–OECD Study on Enhancing Financial Accessibility for SMEs
development policies with public funds might be risky, as PFI management might have the perception that public funds are unlimited.
The financial crisis has led to a reconsideration of PFIs’ business models. In some countries, this has implied a shift, at least in part, from second- to first-tier lending in order to overcome the increased risk aversion towards SME lending by private players.
When the provision of credit is done through first-tier lending, dealing directly with SMEs, the PFIs need to have a large and extended branch to access its customers. In this model, the interest rate can be lower because of the lower transaction cost of not dealing with intermediaries. On the other hand, the advantage of using second-tier instrumentsis that it ensures a complementary role with the private sector. In addition, second-tier instruments might be more efficient as they benefit from existing private infrastructure. Moreover, risk management need not be as sophisticated as it is in direct lending, as it only needs to assess the risk of the private institutions that will be dealing with the SMEs (Gutiérrez et al. 2011). And risk credit is partially absorbed by the partner institution (De Luna-Martínez and Vicente 2012). However, recent evidence on the performance of banks in Latin America shows that banks engaged in retail lending channeling funds from PFIs would not lend because they were unwilling to assume the increased credit risk that the crisis situation created (ALIDE 2012). In research conducted covering a period just before the crisis of 2008/09, Beck, Demirgüç-Kunt, and Martínez-Pería (2008) find that, while the approach to financing differs according to whether the bank is public or private (or foreign-owned), these differences are less significant than the level of country development, as measured by income. The authors stress that the lending environment is more important in shaping bank financing to SMEs than firm size or bank ownership type.
Some authors believe that the increased lending due to anticyclical measures should be priced at market rates to allow PFIs to obtain profits from the countercyclical activity, provided that credit is given to viable firms and not to firms with failed business models trying to postpone termination (Gutiérrez et al. 2011). In fact, this is precisely what ALMI (Sweden) did during the crisis, on the understanding that if SMEs were approaching public banks to obtain funding, it was because of a previous rejection by private banks at market rates (OECD 2014). However, this view might seem to contrast with the standard argument of Stiglitz and Weiss (1981) about how pricing for risk leads to adverse selection. During the recent crisis, some PFIs specifically provided SMEs with loans at below market rates.
The instruments provided by PFIs to SMEs vary alongside the nature of the SME, its age, sector of activity, and region. Most SMEs finance themselves with debt instruments; in some cases PFIs provide a set of conditions that are more favorable than those of the markets. In some other cases, just alleviating the financing gap is the reason that justifies lending, and loans are offered at market interest rates (which in some cases might be higher than the average, given the fact that SMEs are riskier than other segments).
G. Good Practices and Evaluation
This section has provided an overview of the opportunities and challenges derived from the intervention of PFIs in financial markets, addressing both structural and cyclical concerns,
Bank Lending Efficiency 123
along the institutional and financial dimensions. This section discusses good practicesand policy recommendations identified in the literature. The main message is that context matters: both local relevance and institutional fit are essential to ensure the success of the PFI (Beck 2010, Thorne 2011, IDB 2013). It is important not to overlook other constraints in addition to financial ones, and compare alternatives (Beck 2010). Along the samelines, IFC (2011) suggests bearing in mind the financial context (accounting and auditing standards, credit reporting systems, collateral and insolvency regimes, and payments and settlements systems) of each country when deciding on public sector interventions. Similarly, Kraemer-Eis, Lang, and Gvetadze (2013) suggest that policy instruments must be under continuous revision in order to remain optimal.
Across studies that several institutions have undertaken there is a consensus that the performance of PFIs improves with a clear and sustainable mandate, an adequate risk management system, and sound corporate governance, which in particular clarifies the ownership policy (Smallridge and Olloqui 2011, World Bank 2012, IDB 2013). The same research acknowledges that the implementation of these good practices is difficult to achieve in countries with a weak institutional setting. IFC (2011) suggests that, in such cases, the implementation of second-tier lending functions best, and to improve its functioning it suggests building capacity and technical expertise, and finding the right private provider, as well as ensuring an independent and capable governance structure.
Risk management strategies depend on whether the business model adopted is that of wholesale or retail institutions. PFIs should aim for market-friendly interventions, where there is advance clarification of the amounts that are going to be allocated for lending. Wholesale banking allows for the private sector to identify and screen customers in order to generate fewer distortions and better allocation of resources (IFC 2011, De la Torre and Ize 2009). Gutiérrez et al. (2011) warn about the fact that risk management in activities where the private sector is not operating requires highly specialized management. While in wholesale activities risk management is needed at the institutional level (to select the institution which will coordinate the direct lending) but not at the project level (Gutiérrez et al. 2011), the response of banks engaged in retail lending managing PFIs’ money targeted to SMEs showed that banks were reluctant to assume the implied credit risk and were therefore not lending to SMEs.
PFIs should be financially sustainable and able to add economic value, even though their objective is not to maximize profits but generate enough resources to accomplishthe mandate. Riskier projects with lower interest rates are not financially sustainable (Gutiérrez et al. 2011).
The OECD (2006) stresses that the problem of access to finance for SMEs is alleviated if pricing is done by charging service fees (instead of pricing by risk).
Regarding risk management, PFIs should be able to assess credit risk, liquidity risk, market risk (on interest rates and on currencies), and operational risk (IDB 2013). Klein (2010) suggests that PFIs have financing schemes where profits can cover the costof capital. He advocates that it should be clarified when PFIs receive subsidies, and sunset clauses for finance programs specified. Kraemer-Eis, Lang, and Gvetadze (2013)
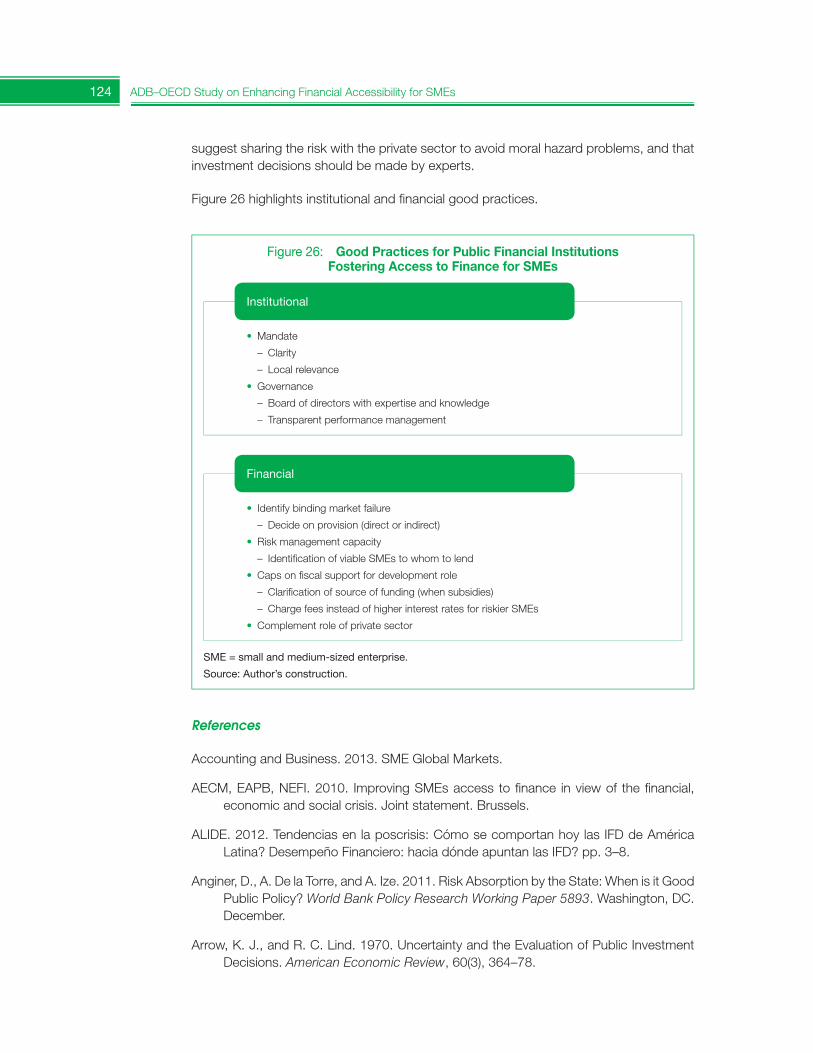
124 ADB–OECD Study on Enhancing Financial Accessibility for SMEs
suggest sharing the risk with the private sector to avoid moral hazard problems, and that investment decisions should be made by experts.
Figure 26 highlights institutional and financial good practices.
References
Accounting and Business. 2013. SME Global Markets.
AECM, EAPB, NEFI. 2010. Improving SMEs access to finance in view of the financial, economic and social crisis. Joint statement. Brussels.
ALIDE. 2012. Tendencias en la poscrisis: Cómo se comportan hoy las IFD de América Latina? Desempeño Financiero: hacia dónde apuntan las IFD? pp. 3–8.
Anginer, D., A. De la Torre, and A. Ize. 2011. Risk Absorption by the State: When is it Good Public Policy? World Bank Policy Research Working Paper 5893. Washington, DC. December.
Arrow, K. J., and R. C. Lind. 1970. Uncertainty and the Evaluation of Public Investment Decisions. American Economic Review, 60(3), 364–78.
Figure 26: Good Practices for Public Financial Institutions Fostering Access to Finance for SMEs
Institutional
Financial
• Mandate
– Clarity
– Local relevance
• Governance
– Board of directors with expertise and knowledge
– Transparent performance management
• Identify binding market failure
– Decide on provision (direct or indirect)
• Risk management capacity
– Identification of viable SMEs to whom to lend
• Caps on fiscal support for development role
– Clarification of source of funding (when subsidies)
– Charge fees instead of higher interest rates for riskier SMEs
• Complement role of private sector
SME=smallandmedium-sizedenterprise.
Source: Author’s construction.
Bank Lending Efficiency 125
Beck, T. 2010. SME Finance: What have we learned and what do we need to learn? In W. E. Forum. 2010. Financial Development Report 2010.
______. 2012. Finance and Growth: lessons from the literature and the recent crisis. mimeo.
Beck, T., A. Demirgüç-Kunt, V. Maksimovic. 2008. Financing patterns around the world: are small firms different? Journal of Financial Economics, 467–87.
Beck, T., A. Demirgüç-Kunt, and M. S. Martínez-Pería. 2008. Bank Financing for SMEs around the World: Drivers, Obstacles, Business Models and Lending Practices. World Bank Policy Research Working Paper 4785. Washington, DC. November.
Council of Europe Development Bank. 2013. Micro, Small and Medium-Sized Enterprises: CEB Financing and its Social Value - Synthesis. Paris.
Craig, B. R., W. E. Jackson III, and J. B. Thomson. 2011. Public Policy in Support of Small Business: The American Experience. Federal Reserve Bank of Cleveland Working Paper 11/16. August.
Cressy, R. 2002. Funding Gaps: A Symposium. The Economic Journal, 112, F1–F16. February.
De la Torre, A., and A. Ize. 2009. Financial Paradigms: What do they suggest about regulatory reform? Crisis Response.
De Luna-Martínez, J., and C. L. Vicente. 2012. Global Survey of Development Banks. World Bank Policy Research Working Paper 5969. Washington, DC. February.
ESMA. 2012. Securities and Markets Stakeholder Group – Report on Helping SMEs Access Funding. ESMA/2012/SMSG/59.
European Association of Public Banks. 2010. 2009–2010 Annual Report of the European Association of Public Banks. Brussels.
European Investment Bank. 2013. Retrieved 8 August 2013, from http://www.eib.org/about/press/2013/2013-113-eib-delivers-on-increased-sme-lending-and-approves-support-for-youth-employment.htm
Frederick, W. R. 2011. Enhancing the Role of the Boards of Directors of State-Owned Enterprises. OECD Corporate Governance Working Papers #2. doi:10.1787/22230939
Gutiérrez, E. et al. 2011. Development Banks: Role and Mechanisms to Increase their efficiency. World Bank Policy Research Working Paper 5729. Washington, DC. July.
Horslund, L. 2013. Nordic Investment Bank. Retrieved 8 June 2013, from http://www.nib.int/news_publications/interviews_and_opinions/1290/researcher_well-being_of_smes_key_for_nordic_baltic_competitiveness
Inter-American Development Bank. 2005. IPES 2005: Unlocking credit, The Quest for Deep and Stable Bank Lending. Washington, DC.
126 ADB–OECD Study on Enhancing Financial Accessibility for SMEs
______. 2013. Public Development Banks: Towards a new paradigm? Washington, DC.
International Finance Corporation. 2011. SME Finance Policy Guide. Washington, DC.
Klein, M. 2010. Profitably Promoting Promising Small and Medium Enterprises. Development Visions. KfW.
Kraemer-Eis, H., F. Lang, and S. Gvetadze. 2013. Bottlenecks in SME financing. European Investment Bank, forthcoming November. Luxembourg: mimeo.
Kremp, E. and P. Sevestre. 2011. Did the crisis induce credit rationing for French SMEs? Mimeo.
Levy-Yeyati, E., A. Micco, U. Panizza. 2004. Should the Government Be in the Banking Business? The Role of State-Owned and Development Banks. Inter-American Development Bank Research Department WP 517. November.
______. 2007. A Reappraisal of State-Owned Banks. Economia. February.
Manove, M., A. Padilla, M. Pagano. 2001. Collateral vs. Project Screening: A Model of Lazy Banks. Centre for Studies in Economics and Finance Working Paper 10. May.
Micco, A., and U. Panizza. 2006. Bank ownership and lending behavior. Economics Letters, vol. 93(2), pp. 248–54. Elsevier. November.
Organisation for Economic Co-operation and Development (OECD). 2006. The SME Financing Gap: Theory and Evidence (Vol. I). Paris: OECD Publishing.
______. 2007. Framework for the Evaluation of SME and Entrepreneurship Policies and Programmes. Paris: OECD Publishing.
______. 2009. Impact of the global crisis on SMEs and entrepreneurship financing and policy responses. Paris: OECD Publishing.
______. 2012. Financing SMEs and Entrepreneurs 2012: An OECD Scoreboard. Paris: OECD Publishing.
______. 2013a. Financing SMEs and Entrepreneurs 2013: An OECD Scoreboard. Paris: OECD Publishing.
______. 2013b. Perspectives on Global Development 2013: Industrial Policies in a Changing World. Paris: OECD Publishing. doi:10.1787/persp_glob_dev-2013-en
______. 2014. Financing SMEs and Entrepreneurs 2014: an OECD Scoreboard. Paris: OECD Publishing.
OECD–ECLAC. 2012. Latin American Economic Outlook 2013: SME Policies for Structural Change. Paris: OECD Publishing.
Olloqui, F. d. and C. Palma-Arancibia. 2012. Las nuevas oportunidades para las instituciones financieras de desarrollo en América Latina. Inter-American Development Bank, Sector de Instituciones para el Desarrollo; Notás Técnicas #IDB-TN-402. May.
Bank Lending Efficiency 127
Ratnovski, L. and A. Narain. 2007.Public Financial Institutions in Developed Countries - Organization and Oversight. IMF Working Paper 07/227. September.
Rowlands, C. 2009. The Provision of Growth Capital to UK Small and Medium Sized Enterprises. London: Department of Business, Innovation and Skills. Available athttp://www.bis.gov.uk/files/file53698.pdf
Rudolph, H. P. 2010. State Financial Institutions: Can they be relied on to kick-start lending? Crisis Response. January.
Schmit, M. et al. 2011. Roles, Missions and Business Models of Public Financial Institutions in Europe. Vienna: SUERF – The European Money and Finance Forum.
Skidelsky, R., F. Martin, and C. Wigstrom. 2012. Blueprint for a British Investment Bank. London: Center for Global Studies.
Smallridge, D. and F. d. Olloqui. 2011. A Health Diagnostic Tool for Public Development Banks. IDB, Institutional Capacity and Finance Sector, Technical Notes #225. January.
Stiglitz, J. and A. Weiss. 1981. Credit Rationing in Markets with Imperfect Information. The American Economic Review, 71(3), 393–410. June.
Thorne, J. 2011. A framework for successful Development Banks. Development Bank of Southern Africa. Development Planning Division.
Wiersch, A. M. and S. Shane. 2013. Economic Commentary 14 August. Retrieved 16 June 2013 from Federal Reserve Bank of Cleveland: http://www.clevelandfed.org/research/commentary/2013/2013-10.cfm
World Bank. 2012. Global Financial Development Report 2013: Rethinking the Role of the State in Finance. Washington, DC: World Bank. doi:10.1596/978-0-8213-9503-5. License: Creative Commons Attribution CC BY 3.0.

129
3 Diversified Financing Models
3.1. Nonbank Financing for SMEs: The Role of Factoring for Financing SMEs in Asia
Shigehiro Shinozaki60
Factoring is a growing business in the world, and this includes Asia, though on a lesser scale. In diversified financing models, factoring takes on a catalytic role in connecting small and medium-sized enterprises (SMEs) to the growth-and-graduation cycle of enterprises. To respond to the short-term financing needs of such enterprises, the factoring industry is likely to target growing SMEs to develop a niche market. Asia’s factoring industry has dual potential. At the national level, domestic factoring—as a part of supply chainfinancing—will support growth-oriented SMEs to expand, given funding flexibility. At the global level, international factoring as a complement to trade finance will support SME exporters and promote intraregional trade that serves global rebalancing. Increased trade in Asia is creating more business opportunities for the factoring industry. The majority of enterprises are SMEs in any country and their contribution to total exports is significant. The more SMEs are internationalized, the more intraregional trade is encouraged. The factoring industry is in part expected to promote SME internationalization in support of intraregional trade. The more that SME savings are mobilized through intraregional trade, the more that global rebalancing is promoted. At the same time, the factoring industry can support financial inclusion in Asia. This section reviews the performance of the factoring industry—including its roles, benefits, and challenges—and addresses the potential of factoring in Asia.
A. Trade Finance, Supply Chain Finance, and Factoring
The banking sector is a key player in Asia’s financial systems, where the improvement of bank lending efficiency is a key priority. On the other hand, there are limits to the amount of bank lending to SMEs in complex global financial systems. Thus, the issue of how to respond to growth capital needs of SMEs arising from a continuously changing businessenvironment, is another key policy subject for scaling up the SME sector. To this end, diversified funding alternatives beyond conventional bank credit, which can be promoted by financial institutions that have yet to focus on SME financing, are needed for growth-oriented SMEs.
60 Financial Sector Specialist (SME Finance), Office of Regional Economic Integration, Asian Development Bank. [email protected]. Author thanks Mikhail Treyvish, chair of the Asian Chapter of the International Factors Group, for his valuable comments to this section.
130 ADB–OECD Study on Enhancing Financial Accessibility for SMEs
Nonbank financial institutions (NBFIs) are expected to play an important role bysupplementing available bank lending for SMEs. Diverse institutions such as specialized financiers (e.g., credit cooperatives, credit unions, pawnshops, finance companies, leasing companies, and factoring companies), capital market organizers (e.g., stock exchanges, and securities dealers and brokers), and risk-taking institutions (e.g., venture capitalists, private equity funds, pension funds, and mutual funds) are collectively categorized as NBFIs. To encourage the NBFI industry, the establishment of a sound competitive environment between banks and NBFIs is a critical challenge, in which a holistic approach is needed in developing a policy and regulatory framework for NBFIs that provide finance to SMEs.
Trade finance61 and supply chain finance for SMEs are important as their internationalization helps to promote inclusive economic growth in Asia. As a supporting industry, SMEs contribute to intraregional trade through subcontracts with large firms. In the globalizedeconomy, large firms seek the division of labor to enhance business efficiency to win out over their competitors, which accelerates their dependency on overseas markets for efficient production. This trend can lead subcontracted SMEs into foreign markets toestablish or maintain business relations with large firms, where trade finance and supplychain finance can help SMEs survive.
Supply chain finance is a relatively new concept. Although there is not yet a standardized definition, it can be expressed as a combination of trade finance and a technological platform that connects trading partners and financial institutions, and provides various services related to supply chain events, as defined by the International Factors Group (IFG). Various combinations of financing instruments and services can be arranged undersupply chain finance.
Figure 27 shows the demand for trade finance and supply chain finance based on data from the ADB Trade Finance Program Survey conducted in 2012. As indicated in the left chart, if trade finance support increases over present conditions, the companies surveyed (exporters and importers) will expand through increased production levels and trade activities, thereby creating more jobs and increasing salaries. As for supply chain finance, the right chart indicates that 42% of banks surveyed recognized supply chain finance as a tool for filling trade finance gaps and that 50% of banks felt existing supply chain financemodels were insufficient. Although valid samples were quite limited (24 banks), this implies that supply chain finance has yet to penetrate banks deeply. Before designing the policy and regulatory frameworks at the national level, supply chain finance products should be properly designed to respond to small suppliers’ financing needs, and product literacy should be promoted for potential users including SMEs. Factoring is one of the promising supply chain finance instruments for SME suppliers, and is expected to complement the trade finance gap or unmet demands on trade finance.
61 Trade finance is short-term supplier financing to hedge the payment risks between importers and exporters through the exchange of specific proof documents such as the letter of credit and shipping documents, or the sales of receivables from exporters to the third party (forfaiter). Letter-of-credit-based finance or documentary credit for suppliers or exporters is a typical trade finance modality.
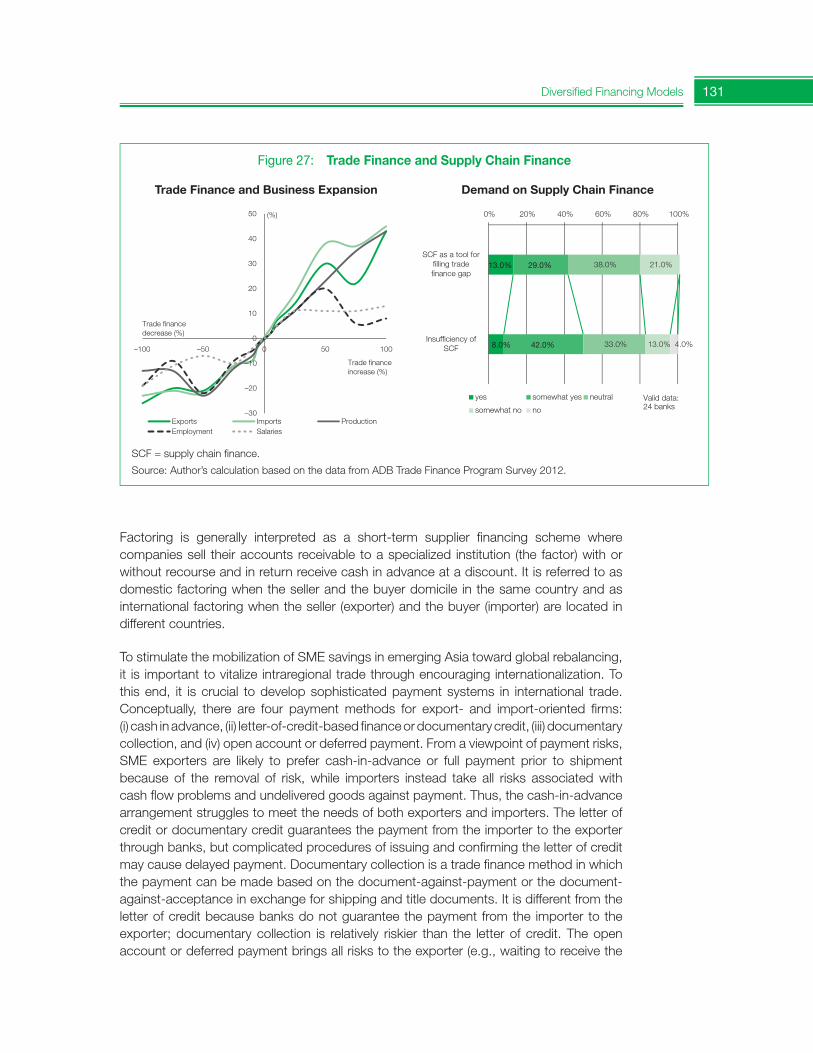
131Diversified Financing Models
Factoring is generally interpreted as a short-term supplier financing scheme where companies sell their accounts receivable to a specialized institution (the factor) with or without recourse and in return receive cash in advance at a discount. It is referred to as domestic factoring when the seller and the buyer domicile in the same country and as international factoring when the seller (exporter) and the buyer (importer) are located in different countries.
To stimulate the mobilization of SME savings in emerging Asia toward global rebalancing, it is important to vitalize intraregional trade through encouraging internationalization. To this end, it is crucial to develop sophisticated payment systems in international trade. Conceptually, there are four payment methods for export- and import-oriented firms: (i) cash in advance, (ii) letter-of-credit-based finance or documentary credit, (iii) documentary collection, and (iv) open account or deferred payment. From a viewpoint of payment risks, SME exporters are likely to prefer cash-in-advance or full payment prior to shipment because of the removal of risk, while importers instead take all risks associated with cash flow problems and undelivered goods against payment. Thus, the cash-in-advance arrangement struggles to meet the needs of both exporters and importers. The letter of credit or documentary credit guarantees the payment from the importer to the exporter through banks, but complicated procedures of issuing and confirming the letter of credit may cause delayed payment. Documentary collection is a trade finance method in which the payment can be made based on the document-against-payment or the document-against-acceptance in exchange for shipping and title documents. It is different from theletter of credit because banks do not guarantee the payment from the importer to the exporter; documentary collection is relatively riskier than the letter of credit. The open account or deferred payment brings all risks to the exporter (e.g., waiting to receive the
Figure 27: Trade Finance and Supply Chain Finance
–30
–20
–10
0
10
20
30
40
50
–100 –50 0 50 100
Exports Imports ProductionEmployment Salaries
Trade finance decrease (%)
Trade finance increase (%)
(%)
13.0%
8.0%
29.0%
42.0%
38.0%
33.0%
21.0%
13.0% 4.0%
0% 20% 40% 60% 80% 100%
SCF as a tool forfilling tradefinance gap
Insufficiency ofSCF
yes somewhat yes neutral
somewhat no no
Valid data: 24 banks
SCF = supply chain finance.
Source: Author’s calculation based on the data from ADB Trade Finance Program Survey 2012.
Trade Finance and Business Expansion Demand on Supply Chain Finance
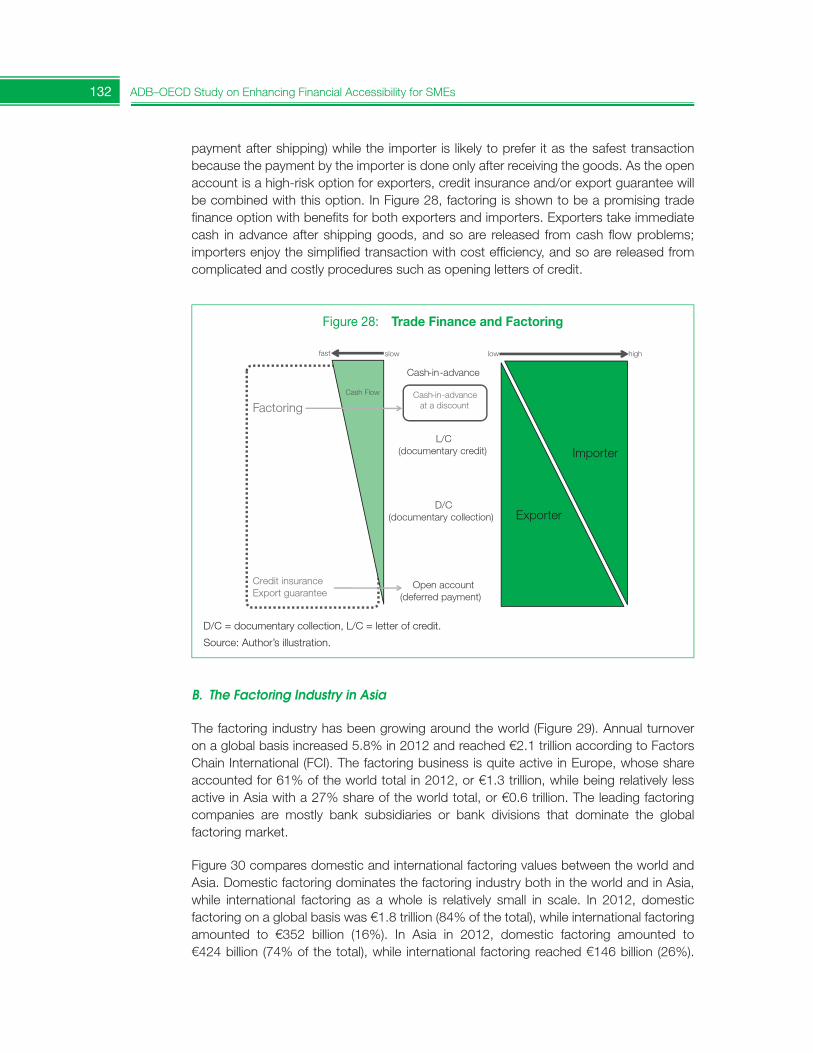
132 ADB–OECD Study on Enhancing Financial Accessibility for SMEs
payment after shipping) while the importer is likely to prefer it as the safest transaction because the payment by the importer is done only after receiving the goods. As the open account is a high-risk option for exporters, credit insurance and/or export guarantee will be combined with this option. In Figure 28, factoring is shown to be a promising trade finance option with benefits for both exporters and importers. Exporters take immediate cash in advance after shipping goods, and so are released from cash flow problems; importers enjoy the simplified transaction with cost efficiency, and so are released from complicated and costly procedures such as opening letters of credit.
Figure 28: Trade Finance and Factoring
Exporter
Importer
Cash-in-advance
L/C (documentary credit)
D/C
(documentary collection)
Open account
(deferred payment)
high low slow fast
Factoring
Credit insurance Export guarantee
Cash Flow Cash-in-advance at a discount
D/C = documentary collection, L/C = letter of credit.
Source: Author’s illustration.
B. The Factoring Industry in Asia
The factoring industry has been growing around the world (Figure 29). Annual turnover on a global basis increased 5.8% in 2012 and reached €2.1 trillion according to Factors Chain International (FCI). The factoring business is quite active in Europe, whose shareaccounted for 61% of the world total in 2012, or €1.3 trillion, while being relatively less active in Asia with a 27% share of the world total, or €0.6 trillion. The leading factoring companies are mostly bank subsidiaries or bank divisions that dominate the global factoring market.
Figure 30 compares domestic and international factoring values between the world and Asia. Domestic factoring dominates the factoring industry both in the world and in Asia,while international factoring as a whole is relatively small in scale. In 2012, domestic factoring on a global basis was €1.8 trillion (84% of the total), while international factoring amounted to €352 billion (16%). In Asia in 2012, domestic factoring amounted to €424 billion (74% of the total), while international factoring reached €146 billion (26%).
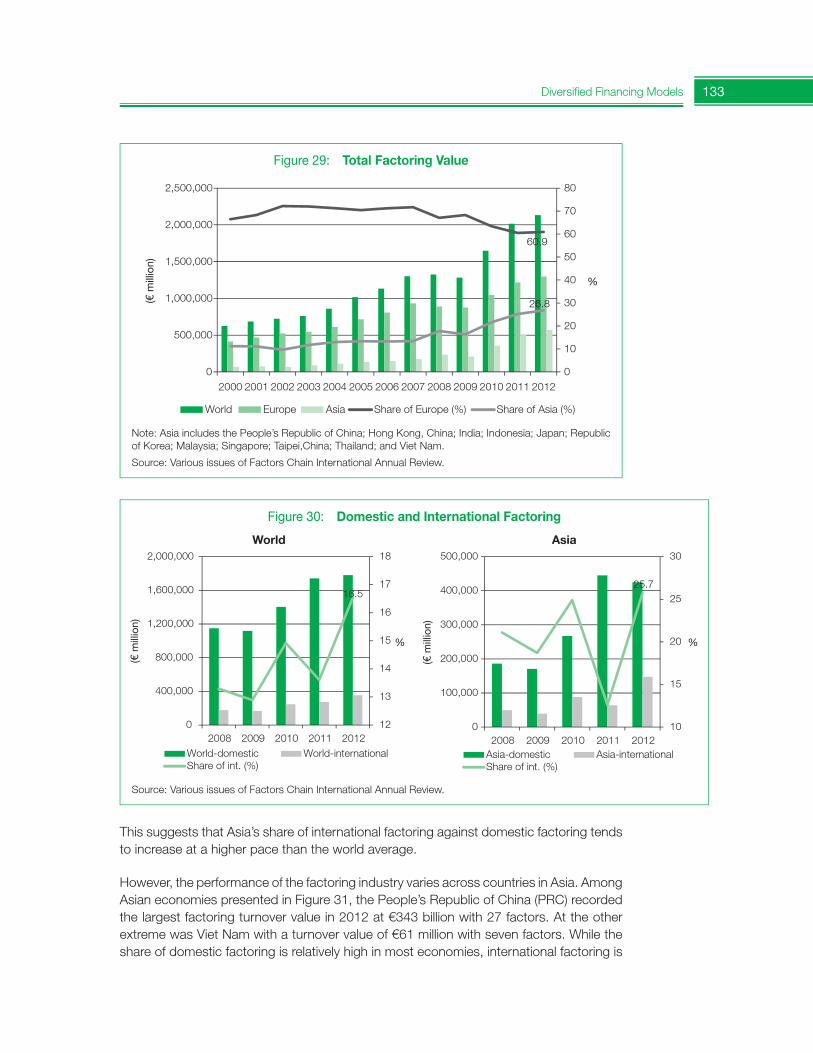
133Diversified Financing Models
This suggests that Asia’s share of international factoring against domestic factoring tends to increase at a higher pace than the world average.
However, the performance of the factoring industry varies across countries in Asia. Among Asian economies presented in Figure 31, the People’s Republic of China (PRC) recorded the largest factoring turnover value in 2012 at €343 billion with 27 factors. At the other extreme was Viet Nam with a turnover value of €61 million with seven factors. While the share of domestic factoring is relatively high in most economies, international factoring is
Figure 29: Total Factoring Value
60.9
26.8
0
10
20
30
40
50
60
70
80
%
0
500,000
1,000,000
1,500,000
2,000,000
2,500,000
2000 2001 2002 2003 2004 2005 2006 2007 2008 2009 2010 2011 2012
World Europe Asia Share of Europe (%) Share of Asia (%)
(€ m
illio
n)
Note: Asia includes the People’s Republic of China; Hong Kong, China; India; Indonesia; Japan; Republic of Korea; Malaysia; Singapore; Taipei,China; Thailand; and Viet Nam.
Source: Various issues of Factors Chain International Annual Review.
Figure 30: Domestic and International Factoring
16.5
12
13
14
15
16
17
18
% %
0
400,000
800,000
1,200,000
1,600,000
2,000,000
2008 2009 2010 2011 2012World-domestic World-internationalShare of int. (%)
25.7
10
15
20
25
30
0
100,000
200,000
300,000
400,000
500,000
2008 2009 2010 2011 2012Asia-domestic Asia-internationalShare of int. (%)
(€ m
illio
n)
(€ m
illio
n)
Source: Various issues of Factors Chain International Annual Review.
World Asia
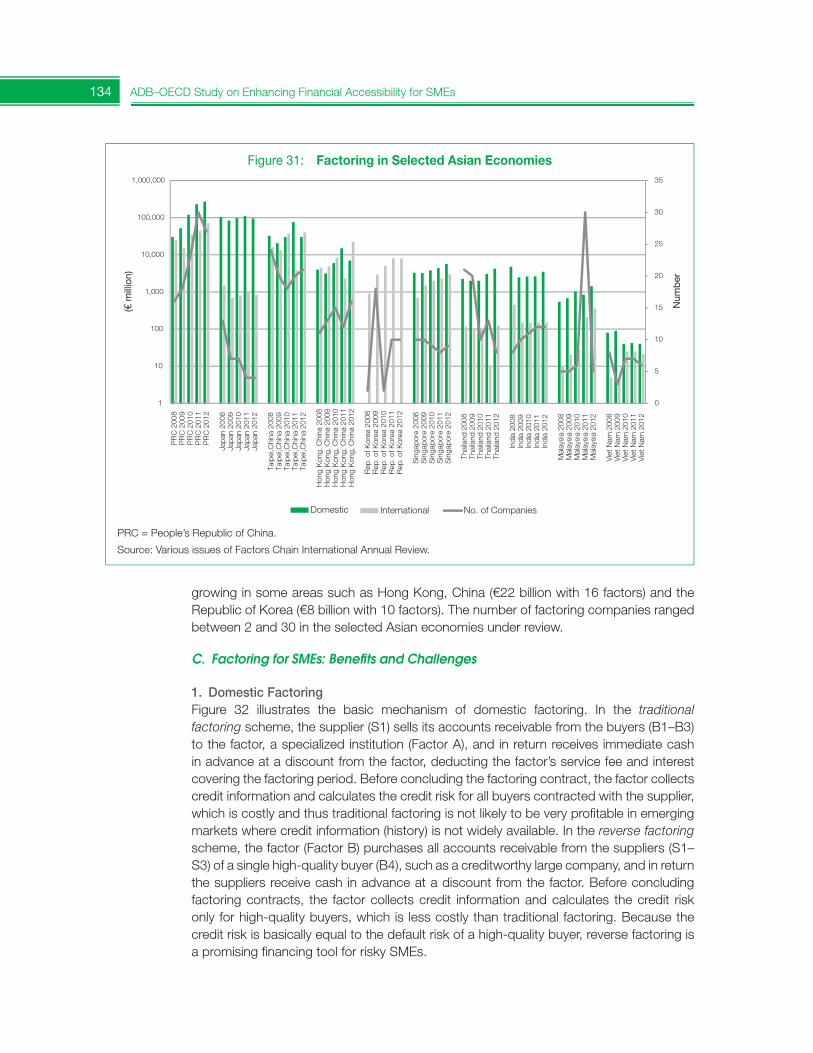
134 ADB–OECD Study on Enhancing Financial Accessibility for SMEs
growing in some areas such as Hong Kong, China (€22 billion with 16 factors) and the Republic of Korea (€8 billion with 10 factors). The number of factoring companies ranged between 2 and 30 in the selected Asian economies under review.
C. Factoring for SMEs: Benefits and Challenges
1. Domestic FactoringFigure 32 illustrates the basic mechanism of domestic factoring. In the traditional factoring scheme, the supplier (S1) sells its accounts receivable from the buyers (B1–B3) to the factor, a specialized institution (Factor A), and in return receives immediate cashin advance at a discount from the factor, deducting the factor’s service fee and interest covering the factoring period. Before concluding the factoring contract, the factor collects credit information and calculates the credit risk for all buyers contracted with the supplier, which is costly and thus traditional factoring is not likely to be very profitable in emerging markets where credit information (history) is not widely available. In the reverse factoring scheme, the factor (Factor B) purchases all accounts receivable from the suppliers (S1–S3) of a single high-quality buyer (B4), such as a creditworthy large company, and in return the suppliers receive cash in advance at a discount from the factor. Before concluding factoring contracts, the factor collects credit information and calculates the credit risk only for high-quality buyers, which is less costly than traditional factoring. Because the credit risk is basically equal to the default risk of a high-quality buyer, reverse factoring is a promising financing tool for risky SMEs.
Figure 31: Factoring in Selected Asian Economies
0
5
10
15
20
25
30
35
1
10
100
1,000
10,000
100,000
1,000,000P
RC
200
8P
RC
200
9P
RC
201
0P
RC
201
1P
RC
201
2
Japa
n 20
08Ja
pan
2009
Japa
n 20
10Ja
pan
2011
Japa
n 20
12
Taip
ei,C
hina
200
8Ta
ipei
,Chi
na 2
009
Taip
ei,C
hina
201
0Ta
ipei
,Chi
na 2
011
Taip
ei,C
hina
201
2
Hon
g K
ong,
Chi
na 2
008
Hon
g K
ong,
Chi
na 2
009
Hon
g K
ong,
Chi
na 2
010
Hon
g K
ong,
Chi
na 2
011
Hon
g K
ong,
Chi
na 2
012
Rep
. of K
orea
200
8R
ep. o
f Kor
ea 2
009
Rep
. of K
orea
201
0R
ep. o
f Kor
ea 2
011
Rep
. of K
orea
201
2
Sin
gapo
re 2
008
Sin
gapo
re 2
009
Sin
gapo
re 2
010
Sin
gapo
re 2
011
Sin
gapo
re 2
012
Thai
land
200
8Th
aila
nd 2
009
Thai
land
201
0Th
aila
nd 2
011
Thai
land
201
2
Indi
a 20
08In
dia
2009
Indi
a 20
10In
dia
2011
Indi
a 20
12
Mal
aysi
a 20
08M
alay
sia
2009
Mal
aysi
a 20
10M
alay
sia
2011
Mal
aysi
a 20
12
Vie
t Nam
200
8V
iet N
am 2
009
Vie
t Nam
201
0V
iet N
am 2
011
Vie
t Nam
201
2
Domestic International No. of Companies
(€ m
illio
n)
Num
ber
PRC = People’s Republic of China.
Source: Various issues of Factors Chain International Annual Review.
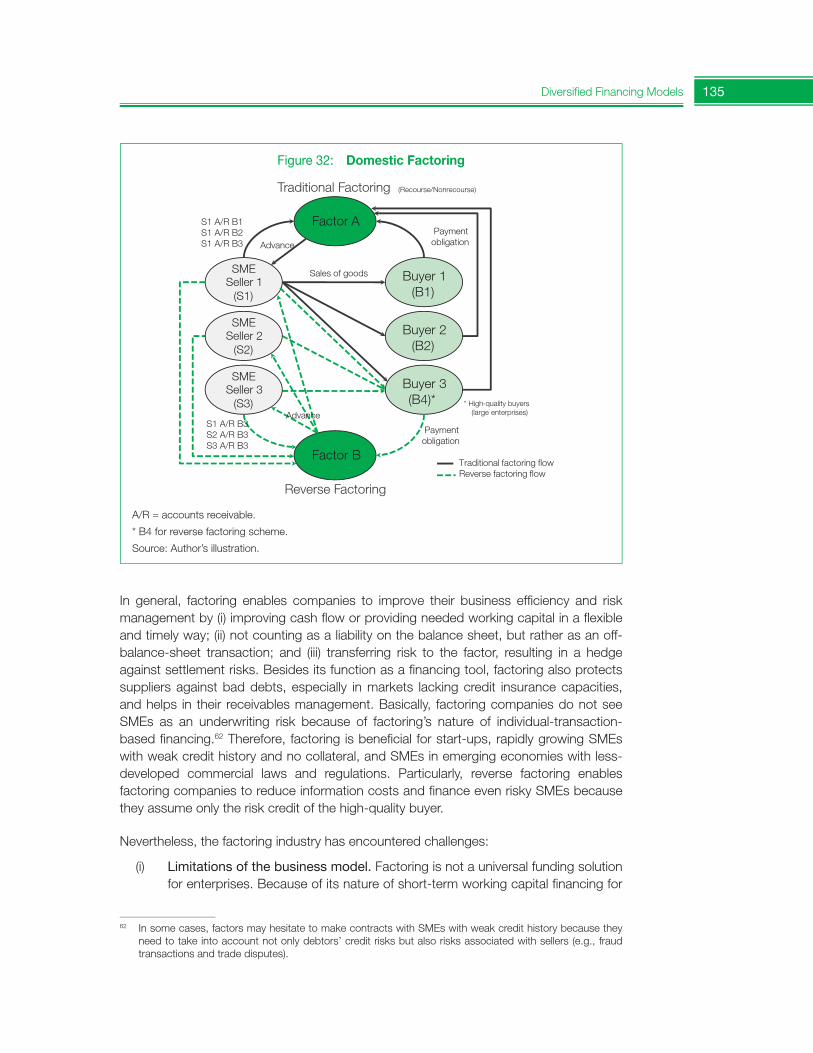
135Diversified Financing Models
In general, factoring enables companies to improve their business efficiency and risk management by (i) improving cash flow or providing needed working capital in a flexible and timely way; (ii) not counting as a liability on the balance sheet, but rather as an off-balance-sheet transaction; and (iii) transferring risk to the factor, resulting in a hedge against settlement risks. Besides its function as a financing tool, factoring also protects suppliers against bad debts, especially in markets lacking credit insurance capacities, and helps in their receivables management. Basically, factoring companies do not see SMEs as an underwriting risk because of factoring’s nature of individual-transaction-based financing.62 Therefore, factoring is beneficial for start-ups, rapidly growing SMEs with weak credit history and no collateral, and SMEs in emerging economies with less-developed commercial laws and regulations. Particularly, reverse factoring enables factoring companies to reduce information costs and finance even risky SMEs because they assume only the risk credit of the high-quality buyer.
Nevertheless, the factoring industry has encountered challenges:
(i) Limitations of the business model. Factoring is not a universal funding solution for enterprises. Because of its nature of short-term working capital financing for
62 In some cases, factors may hesitate to make contracts with SMEs with weak credit history because they need to take into account not only debtors’ credit risks but also risks associated with sellers (e.g., fraud transactions and trade disputes).
Figure 32: Domestic Factoring
SME Seller 1
(S1)
Buyer 1 (B1)
Buyer 2 (B2)
Buyer 3 (B4)*
Factor A
Factor B
Sales of goods
Payment obligation
S1 A/R B1 S1 A/R B2 S1 A/R B3 Advance
S1 A/R B3 S2 A/R B3 S3 A/R B3
Advance
Payment obligation
Traditional Factoring
Reverse Factoring
SME Seller 2
(S2)
SME Seller 3
(S3) * High-quality buyers (large enterprises)
(Recourse/Nonrecourse)
Traditional factoring flow Reverse factoring flow
A/R = accounts receivable.
* B4 for reverse factoring scheme.
Source: Author’s illustration.
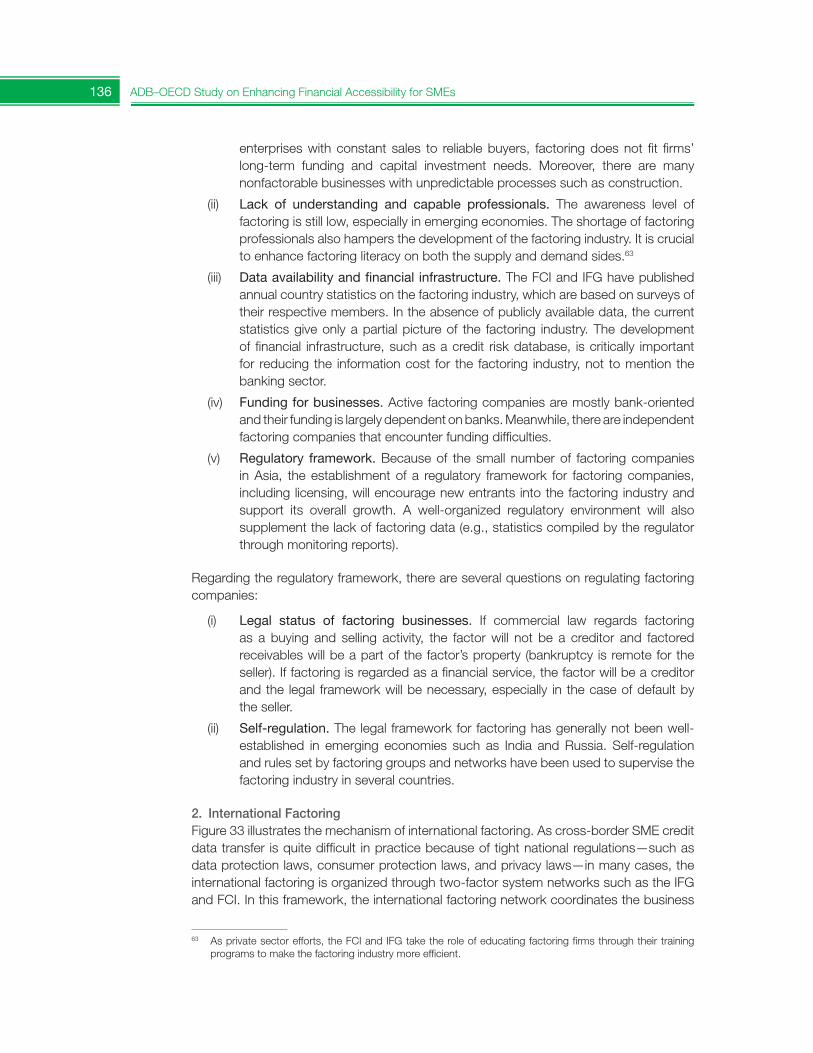
136 ADB–OECD Study on Enhancing Financial Accessibility for SMEs
enterprises with constant sales to reliable buyers, factoring does not fit firms’ long-term funding and capital investment needs. Moreover, there are many nonfactorable businesses with unpredictable processes such as construction.
(ii) Lack of understanding and capable professionals. The awareness level of factoring is still low, especially in emerging economies. The shortage of factoring professionals also hampers the development of the factoring industry. It is crucial to enhance factoring literacy on both the supply and demand sides.63
(iii) Dataavailabilityandfinancialinfrastructure. The FCI and IFG have published annual country statistics on the factoring industry, which are based on surveys of their respective members. In the absence of publicly available data, the current statistics give only a partial picture of the factoring industry. The development of financial infrastructure, such as a credit risk database, is critically important for reducing the information cost for the factoring industry, not to mention the banking sector.
(iv) Funding for businesses. Active factoring companies are mostly bank-oriented and their funding is largely dependent on banks. Meanwhile, there are independent factoring companies that encounter funding difficulties.
(v) Regulatory framework. Because of the small number of factoring companies in Asia, the establishment of a regulatory framework for factoring companies, including licensing, will encourage new entrants into the factoring industry and support its overall growth. A well-organized regulatory environment will also supplement the lack of factoring data (e.g., statistics compiled by the regulator through monitoring reports).
Regarding the regulatory framework, there are several questions on regulating factoring companies:
(i) Legal status of factoring businesses. If commercial law regards factoring as a buying and selling activity, the factor will not be a creditor and factored receivables will be a part of the factor’s property (bankruptcy is remote for the seller). If factoring is regarded as a financial service, the factor will be a creditor and the legal framework will be necessary, especially in the case of default by the seller.
(ii) Self-regulation. The legal framework for factoring has generally not been well-established in emerging economies such as India and Russia. Self-regulation and rules set by factoring groups and networks have been used to supervise the factoring industry in several countries.
2. International FactoringFigure 33 illustrates the mechanism of international factoring. As cross-border SME credit data transfer is quite difficult in practice because of tight national regulations—such as data protection laws, consumer protection laws, and privacy laws—in many cases, the international factoring is organized through two-factor system networks such as the IFG and FCI. In this framework, the international factoring network coordinates the business
63 As private sector efforts, the FCI and IFG take the role of educating factoring firms through their training programs to make the factoring industry more efficient.
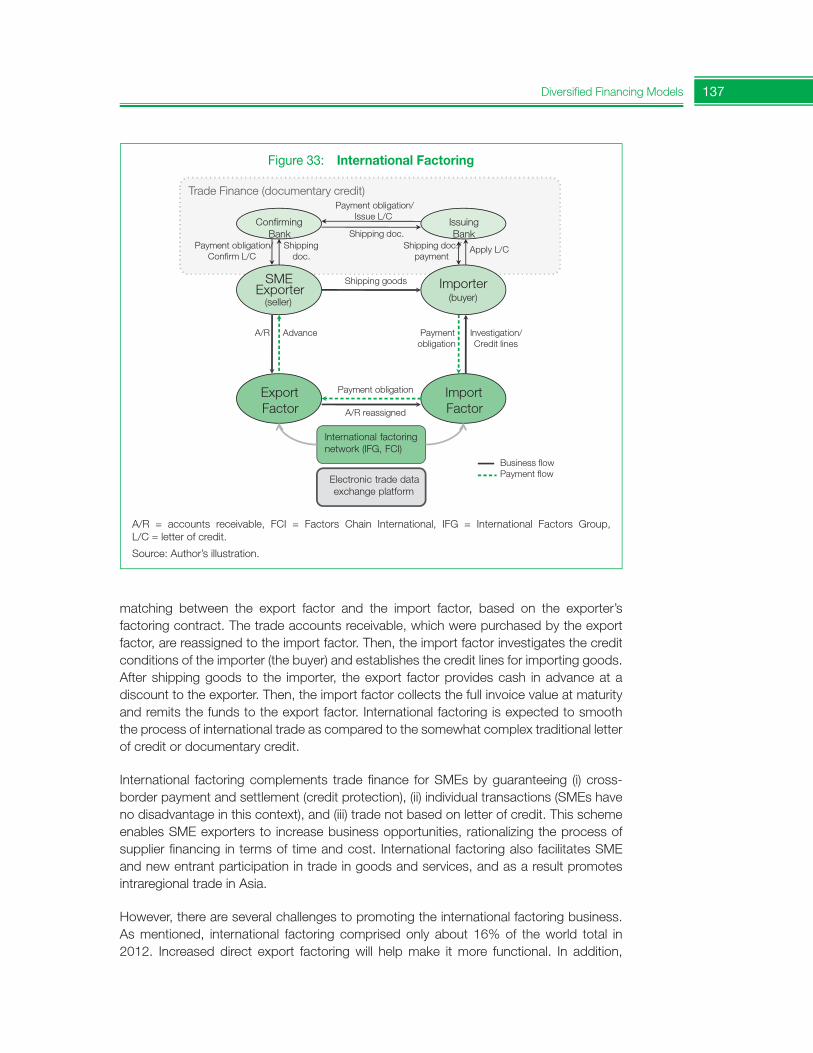
137Diversified Financing Models
matching between the export factor and the import factor, based on the exporter’s factoring contract. The trade accounts receivable, which were purchased by the export factor, are reassigned to the import factor. Then, the import factor investigates the credit conditions of the importer (the buyer) and establishes the credit lines for importing goods. After shipping goods to the importer, the export factor provides cash in advance at a discount to the exporter. Then, the import factor collects the full invoice value at maturity and remits the funds to the export factor. International factoring is expected to smooth the process of international trade as compared to the somewhat complex traditional letter of credit or documentary credit.
International factoring complements trade finance for SMEs by guaranteeing (i) cross-border payment and settlement (credit protection), (ii) individual transactions (SMEs have no disadvantage in this context), and (iii) trade not based on letter of credit. This scheme enables SME exporters to increase business opportunities, rationalizing the process ofsupplier financing in terms of time and cost. International factoring also facilitates SME and new entrant participation in trade in goods and services, and as a result promotes intraregional trade in Asia.
However, there are several challenges to promoting the international factoring business. As mentioned, international factoring comprised only about 16% of the world total in 2012. Increased direct export factoring will help make it more functional. In addition,
Figure 33: International Factoring
Shipping goods
Export Factor
Import Factor
Payment obligation
Payment obligation
Advance A/R
A/R reassigned
Investigation/ Credit lines
International factoring network (IFG, FCI)
Electronic trade data exchange platform
Issuing Bank
Confirming Bank
Apply L/C
Payment obligation/ Issue L/C
Payment obligation/ Confirm L/C
Shipping doc.
Shipping doc. Shipping doc./
payment
Trade Finance (documentary credit)
SME Exporter
(seller)
Importer (buyer)
Business flow Payment flow
A/R = accounts receivable, FCI = Factors Chain International, IFG = International Factors Group, L/C = letter of credit.
Source: Author’s illustration.
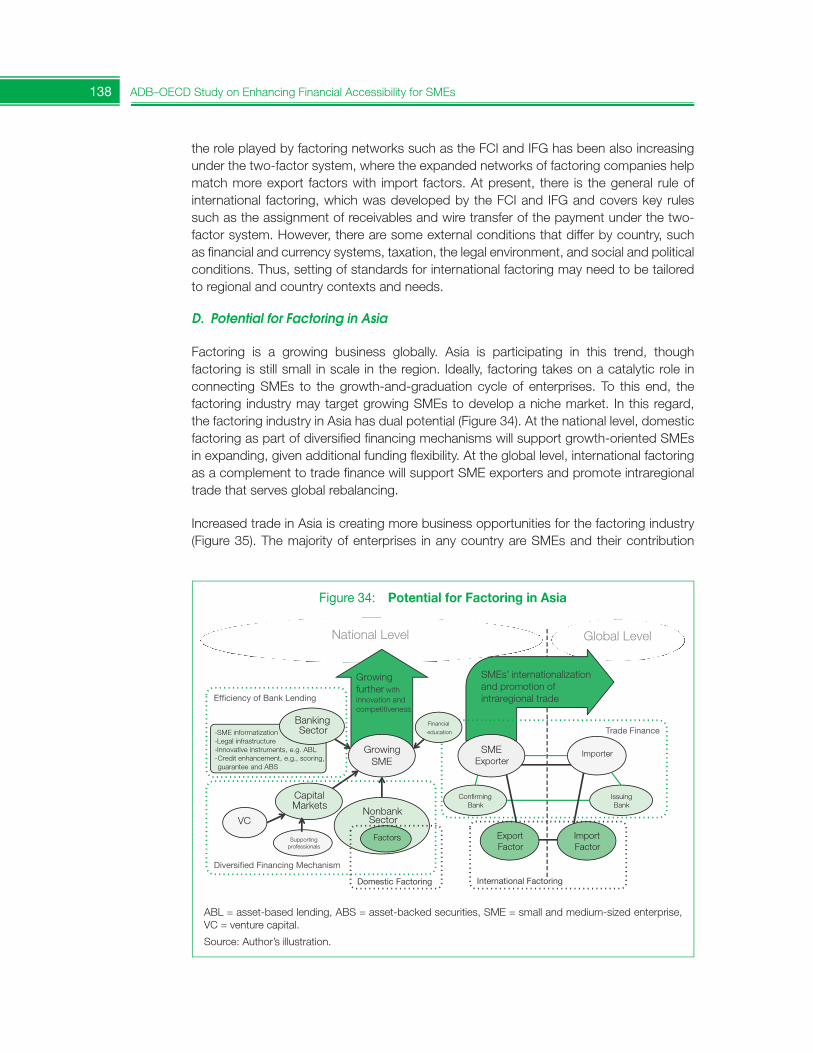
138 ADB–OECD Study on Enhancing Financial Accessibility for SMEs
the role played by factoring networks such as the FCI and IFG has been also increasing under the two-factor system, where the expanded networks of factoring companies help match more export factors with import factors. At present, there is the general rule of international factoring, which was developed by the FCI and IFG and covers key rulessuch as the assignment of receivables and wire transfer of the payment under the two-factor system. However, there are some external conditions that differ by country, such as financial and currency systems, taxation, the legal environment, and social and political conditions. Thus, setting of standards for international factoring may need to be tailored to regional and country contexts and needs.
D. Potential for Factoring in Asia
Factoring is a growing business globally. Asia is participating in this trend, though factoring is still small in scale in the region. Ideally, factoring takes on a catalytic role in connecting SMEs to the growth-and-graduation cycle of enterprises. To this end, the factoring industry may target growing SMEs to develop a niche market. In this regard, the factoring industry in Asia has dual potential (Figure 34). At the national level, domestic factoring as part of diversified financing mechanisms will support growth-oriented SMEs in expanding, given additional funding flexibility. At the global level, international factoring as a complement to trade finance will support SME exporters and promote intraregionaltrade that serves global rebalancing.
Increased trade in Asia is creating more business opportunities for the factoring industry (Figure 35). The majority of enterprises in any country are SMEs and their contribution
Figure 34: Potential for Factoring in Asia
Global Level National Level
Capital Markets
NonbankSector
Factors
VC
Supporting professionals
Growing further with innovation and competitiveness
Growing SME
-SME informatization -Legal infrastructure -Innovative instruments, e.g. ABL -Credit enhancement, e.g., scoring, guarantee and ABS
Banking Sector
Efficiency of Bank Lending
Diversified Financing Mechanism
SMEs’ internationalization and promotion of intraregional trade
Confirming Bank
Issuing Bank
Importer SME Exporter
Export Factor
Import Factor
Trade Finance Financial
education
Domestic Factoring
International Factoring
ABL = asset-based lending, ABS = asset-backed securities, SME = small and medium-sized enterprise, VC = venture capital.
Source: Author’s illustration.
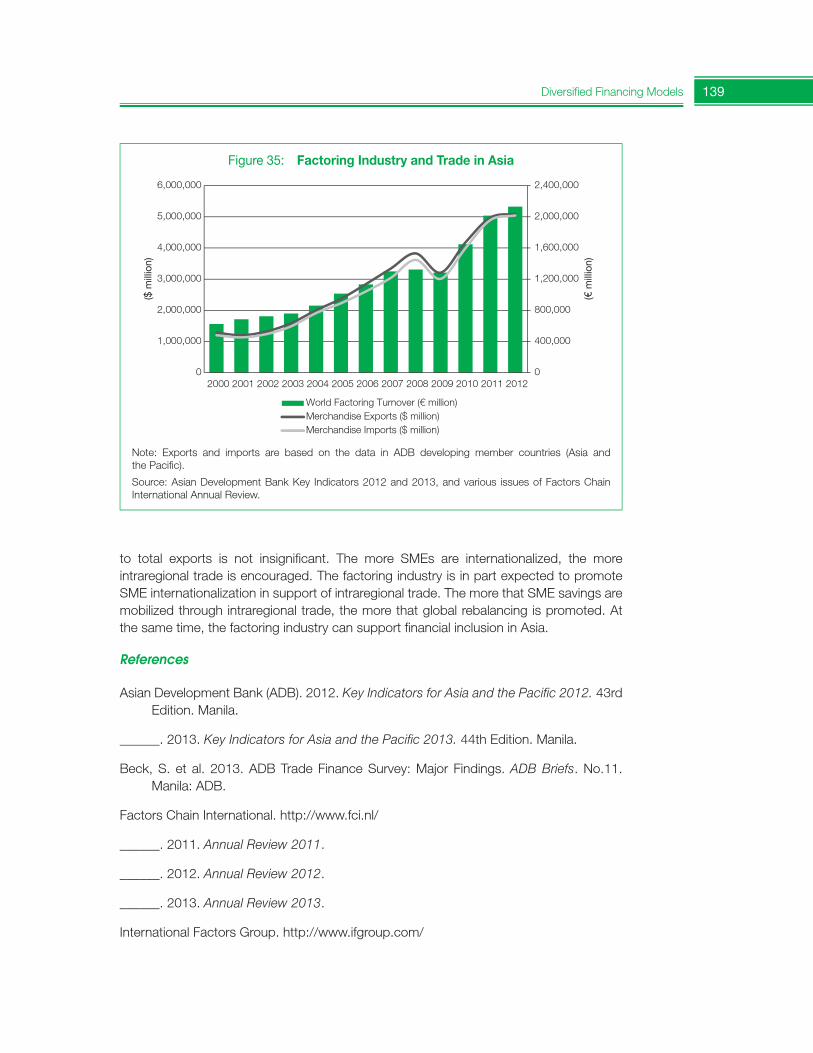
139Diversified Financing Models
to total exports is not insignificant. The more SMEs are internationalized, the more intraregional trade is encouraged. The factoring industry is in part expected to promote SME internationalization in support of intraregional trade. The more that SME savings aremobilized through intraregional trade, the more that global rebalancing is promoted. At the same time, the factoring industry can support financial inclusion in Asia.
References
Asian Development Bank (ADB). 2012. Key Indicators for Asia and the Pacific 2012. 43rd Edition. Manila.
______. 2013. Key Indicators for Asia and the Pacific 2013. 44th Edition. Manila.
Beck, S. et al. 2013. ADB Trade Finance Survey: Major Findings. ADB Briefs. No.11. Manila: ADB.
Factors Chain International. http://www.fci.nl/
______. 2011. Annual Review 2011.
______. 2012. Annual Review 2012.
______. 2013. Annual Review 2013.
International Factors Group. http://www.ifgroup.com/
Figure 35: Factoring Industry and Trade in Asia
0
400,000
800,000
1,200,000
1,600,000
2,000,000
2,400,000
0
1,000,000
2,000,000
3,000,000
4,000,000
5,000,000
6,000,000
2000 2001 2002 2003 2004 2005 2006 2007 2008 2009 2010 2011 2012
Merchandise Imports ($ million)Merchandise Exports ($ million)World Factoring Turnover (€ million)
($ m
illio
n)
(€ m
illio
n)
Note: Exports and imports are based on the data in ADB developing member countries (Asia and the Pacific).
Source: Asian Development Bank Key Indicators 2012 and 2013, and various issues of Factors Chain International Annual Review.

140 ADB–OECD Study on Enhancing Financial Accessibility for SMEs
Klapper, L. 2006. The Role of Factoring for Financing Small and Medium Enterprises. Journal of Banking and Finance. 30. pp. 3,111–30.
Shinozaki, S. 2012. A New Regime of SME Finance in Emerging Asia: Empowering Growth-Oriented SMEs to Build Resilient National Economies. ADB Working Paper Series on Regional Economic Integration. 104. Manila: ADB.
141Diversified Financing Models
3.2. Capital Market Financing for SMEs
3.2.1. Raising Growth Capital for SMEs: The Case for Mezzanine Finance
This section discusses the limitations of debt financing and introduces the range ofnonbank financing instruments available to SMEs and entrepreneurs, with a focus onmezzanine finance. In the post-2007 environment of tight bank credit, governments are considering measures to promote the wider use of hybrid instruments, such as mezzanine finance, to supply growth capital to SMEs and entrepreneurs. It outlines models of finance and recent government support.64
A. Introduction
Governments around the world have long assigned a high priority to improving conditions for access to finance for new, innovative, and fast-growing SMEs and established firmspursuing expansion. The financing gap that affects these businesses is often a growth capital gap. Substantial amounts of funds might be needed to finance projects with high growth prospects, while the associated profit patterns are often difficult to forecast. Traditional financing techniques, based mainly upon debt and guarantees, are not always the most appropriate form of financing for such dynamic firms. Yet, for most enterprises, there are a few alternatives to traditional debt. Bank lending continues to be the most common source of external finance for many SMEs and entrepreneurs, which are often heavily reliant on straight debt to fulfil their start-up, cash flow, and investment needs.
Capital gaps also exist for companies seeking to effect important transitions in their activities, such as ownership and control changes, as well as for SMEs seeking to deleverage and improve capital structures. The long-standing need to strengthen capital structures and to decrease dependence on borrowing has now become more urgent, as many firms were obliged to increase leverage in order to survive the global financial crisis. Indeed, the problem of SME overleveraging may have been exacerbated by the policy responses to the financial crisis, as the emergency stabilization programs tended to focus on mechanisms that enabled firms to increase their debt (e.g., direct lending, loan guarantees), as funding from other sources (e.g., business angels, venture capital) became more scarce (OECD 2010a, 2012).
In the aftermath of the 2008/09 global financial crisis, the bank credit constraints experienced by SMEs in many countries have further highlighted the vulnerability of the SME sector to changing conditions in bank lending. Banks in many OECD countries have been contracting their balance sheets in order to meet more rigorous prudential rules. As banks continue their deleveraging process, there is a broad concern that credit constraints will simply become the “new normal” for SMEs and entrepreneurs and that they could be disproportionately affected by the ongoing financial reforms, and especially by the rapid pace of their implementation, as they are more dependent on bank finance than large firms and less able to adapt readily (OECD 2012).
64 Section based on Chapter 3 OECD (2014).
142 ADB–OECD Study on Enhancing Financial Accessibility for SMEs
As the banking sector remains weak and banks adjust to the new regulatory environment, institutional investors and other nonbank players, including wealthy private investors, have a potential role to play in filling the financing gap that may widen in the postcrisis environment. However, a lack of awareness and understanding on the part of SMEs, financial institutions, and governments of these alternative instruments, their modalities, and operations constitute a major barrier to their use.
This section discusses the limitations of debt financing and introduces the range ofnonbank financing instruments available to SMEs and entrepreneurs, with a focus onmezzanine finance. In the post-2007 environment of tight bank credit, governments are considering measures to promote the wider use of hybrid instruments, such as mezzanine finance, to supply growth capital to SMEs and entrepreneurs.
B. Financing SMEs: The Spectrum of Financing Instruments
1. SME Lending: Market Failures and Mitigation TechniquesThe most common source of financing for most SMEs is banks or similar depositary institutions (e.g., savings banks or cooperative banks). Generally, this financing comes in the form of overdrafts, term loans, or through the use of credit cards. Traditional debt financing represents an unconditional claim on the borrower, who must pay a specified amount of interest to creditors at fixed intervals, regardless of financial condition. The interest rate may be fixed or adjusted periodically according to a reference rate. Moreover, bank claims have high priority in cases of bankruptcy.
The popularity of traditional debt finance lies partly in the fact that it is one of the leastexpensive forms of external finance.65 It generates moderate returns for the lender and is therefore appropriate for low-risk businesses which generate stable cash flows. These are typically firms with modest growth, tested business models, and access to collateral or guarantees.
Furthermore, in OECD, countries since the 1980s, as large corporations and local authorities have been moving away from the banking system and borrowing on more favorable terms in the capital market, banks have been encouraged to enhance their capacity to reach potential borrowers. One of the responses of major banks has been to target the “middle market”, i.e., retail banking and SME lending, a trend that the financial crisis has partly reversed (Griggs 2012).
At the same time, specific constraints may limit lending to SMEs, which, in addition, generally involves small loan volumes (under €1 million) and can imply relatively high unit costs for banks, as the administrative costs associated with the evaluation of the borrower’s creditworthiness are typically fixed.
Traditional debt finance generates moderate returns for lenders and is therefore appropriate for low-to-moderate risk profiles. It typically sustains the ordinary activity and short-term needs of SMEs and is generally characterized by stable cash flow, modest growth, tested business models, and access to collateral or guarantees.
65 Additionally, debt payments are in many countries tax deductible.
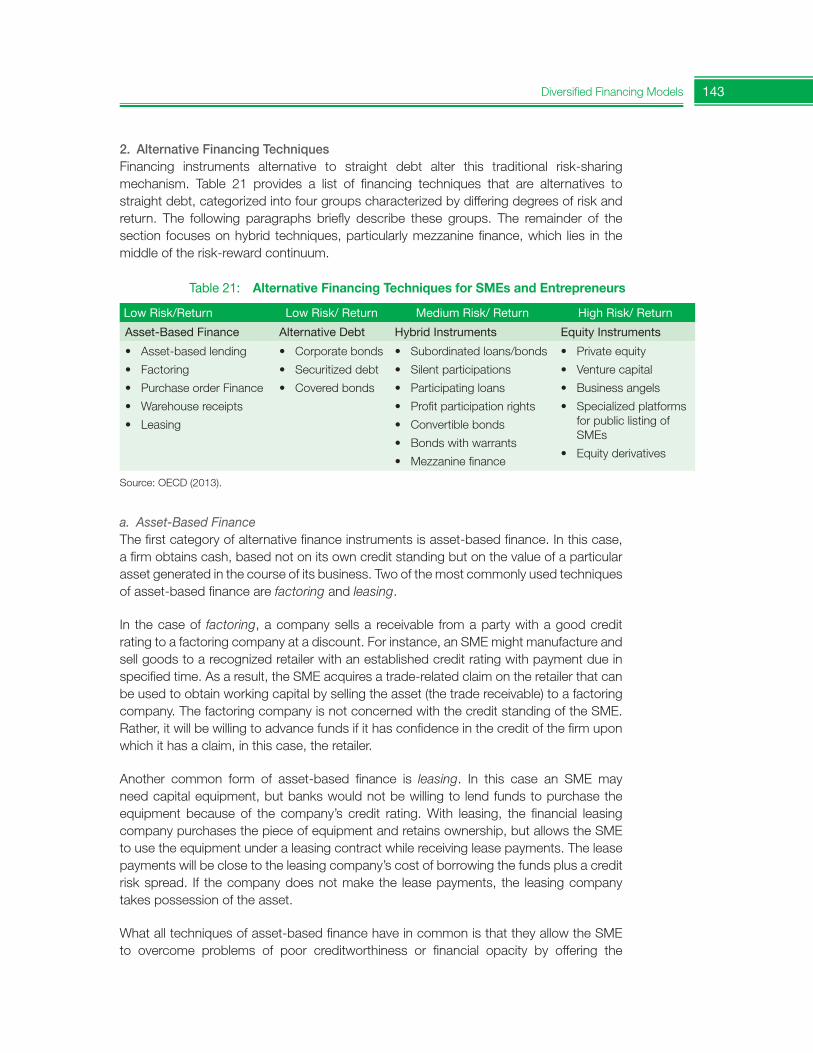
143Diversified Financing Models
2. Alternative Financing TechniquesFinancing instruments alternative to straight debt alter this traditional risk-sharing mechanism. Table 21 provides a list of financing techniques that are alternatives to straight debt, categorized into four groups characterized by differing degrees of risk and return. The following paragraphs briefly describe these groups. The remainder of the section focuses on hybrid techniques, particularly mezzanine finance, which lies in the middle of the risk-reward continuum.
Table 21: Alternative Financing Techniques for SMEs and Entrepreneurs
Low Risk/Return Low Risk/ Return Medium Risk/ Return High Risk/ Return
Asset-BasedFinance Alternative Debt HybridInstruments EquityInstruments
• Asset-based lending
• Factoring
• Purchase order Finance
• Warehouse receipts
• Leasing
• Corporate bonds
• Securitized debt
• Covered bonds
• Subordinated loans/bonds
• Silent participations
• Participating loans
• Profit participation rights
• Convertible bonds
• Bonds with warrants
• Mezzanine finance
• Private equity
• Venture capital
• Business angels
• Specialized platforms for public listing of SMEs
• Equity derivatives
Source: OECD (2013).
a. Asset-Based FinanceThe first category of alternative finance instruments is asset-based finance. In this case, a firm obtains cash, based not on its own credit standing but on the value of a particular asset generated in the course of its business. Two of the most commonly used techniques of asset-based finance are factoring and leasing.
In the case of factoring, a company sells a receivable from a party with a good credit rating to a factoring company at a discount. For instance, an SME might manufacture and sell goods to a recognized retailer with an established credit rating with payment due in specified time. As a result, the SME acquires a trade-related claim on the retailer that can be used to obtain working capital by selling the asset (the trade receivable) to a factoring company. The factoring company is not concerned with the credit standing of the SME. Rather, it will be willing to advance funds if it has confidence in the credit of the firm upon which it has a claim, in this case, the retailer.
Another common form of asset-based finance is leasing. In this case an SME may need capital equipment, but banks would not be willing to lend funds to purchase the equipment because of the company’s credit rating. With leasing, the financial leasing company purchases the piece of equipment and retains ownership, but allows the SME to use the equipment under a leasing contract while receiving lease payments. The lease payments will be close to the leasing company’s cost of borrowing the funds plus a credit risk spread. If the company does not make the lease payments, the leasing company takes possession of the asset.
What all techniques of asset-based finance have in common is that they allow the SME to overcome problems of poor creditworthiness or financial opacity by offering the
144 ADB–OECD Study on Enhancing Financial Accessibility for SMEs
provider of funds an asset that is independent of its own credit standing. However, with the exception of leasing, most of these techniques are a close substitute for short-termworking capital and thus have little capacity to narrow the “growth capital gap.”
b. Alternative Debt InstrumentsThe next category of AFTs illustrated in Table 21 consists of alternative debt instruments, such as corporate bonds (when issued by SMEs) and securitized debt, in which investors in the capital markets, rather than banks, provide the financing for SMEs. Few SMEs have succeeded in issuing corporate bonds because of difficulties that small privately held companies have in meeting investor protection regulations and the high relative cost of bond issuance for small companies.
Securitization of SME debt takes place when cash flows from assets are transferred to a specialized company that uses these flows to support a fixed income security(an asset-backed security) that is sold to investors (Thompson 1995). In the case of SME loan securitization, the originating bank or similar entity sells SME loans to a specialized company. The specialized company creates a new security backed by the payments of SMEs, which is sold to investors. The investor accepts the risk of nonpayment by the SMEs in the portfolio and receives payments of interest and principal. Thus, the financing of the SME is transferred from the banking system to the capital market.
One basic characteristic of these instruments is that, like bank loans, they represent an unconditional claim on the borrower, who must pay a specified amount of interest to creditors at fixed intervals, regardless of financial condition. They also have high priority in cases of bankruptcy. The interest rate may be fixed or adjusted periodically according to a reference rate. However, neither corporate bonds nor securitization is widely used by SMEs. In this sense, these techniques, which are on the border between traditional finance and alternative finance instruments, can only be described as innovative since they are not widely used by SMEs. It will require effort by private entities and/or public authorities to create an environment in which it is possible to develop instruments that are suitable for sale to investors and use such instruments on a sizeable scale.
Two further considerations that limit the applicability of these techniques for SMEs should be kept in mind. First, these techniques are likely to be accessible only to the best-rated SMEs. Second, these instruments do not address the problem of excessive SME reliance on debt or provide an improved capital structure for the firm.
Despite the factors that limit the applicability of corporate bond issuance andsecuritization by SMEs, there may still be some justification to consider public efforts to encourage their utilization for SME financing. If these instruments are structured so as to make issuance possible by SMEs, they might enlarge the range of financing instruments available to them, offering alternatives to traditional bank-based finance. Furthermore, it is arguable that, since the onset of the financial crisis in 2007/08, banks in many OECD countries are limiting their lending to reasonably creditworthy SMEs; in other words, the market in SME financing has not been functioning normally.
145Diversified Financing Models
In those circumstances, it would be justifiable to consider exploring the use of these techniques.66
The basic techniques illustrated concern the financing of low-risk SMEs. The following paragraphs consider techniques that are better suited to higher-risk, higher-return activities. In Table 21, these techniques fall under two broad headings: hybrid techniques,and equity techniques.
c. Hybrid InstrumentsA common feature of hybrid techniques and equity is that the investor accepts more risk and expects a higher return than with the other techniques outlined above. As mentioned, the risk–reward characteristics of bank credits induce bankers to avoid risk even at the cost of forgoing high rewards. By providing an alternative risk–reward structure that enables an investor to accept more risk in exchange for a higher return, hybrid techniques and equity have the capacity to produce a better alignment of the interests of the SME and the provider of finance.
d. Equity InstrumentsEquity instruments, which represent shares of the company, are found at the right end of the risk–return spectrum. Equity investors take the highest risk, in that they are paidonly after senior creditors and investors in hybrid instruments have received all payments. However, equity investors are entitled to all residual profits of the company. This category also includes equity derivatives such as futures, options, and warrants. At the same time, it is the most expensive form of finance and it usually obliges the owners of the firm to share control with outsiders.
C. What is Mezzanine Finance?
Because hybrid finance is better able to distribute risk and reward with investors than straight debt finance, it is often a suitable form of finance for SMEs seeking expansion, but also seeking lower financing costs and less loss of control than occurs in anequity transaction.
Given the relevance of hybrid finance as a source of growth capital for SMEs, this section focuses on one particular kind of hybrid instrument, mezzanine finance—a generic term for financing techniques that incorporate elements of debt and equity in a single investment vehicle. A typical mezzanine facility combines several financing instruments of varying degrees of risk and return, such as subordinated debt, profit participation certificates, and equity warrants. It differs from “straight debt” finance in that it implies greater sharing of risk and reward between the user of capital and the investor. However, the risk and the expected return are lower than for pure equity. In the event of bankruptcy, mezzanine investors have lower rankings than other creditors, but higher rankings than pure equity investors (Table 22).
66 For a discussion of the potential of securitization to support SME access to finance see Kraemer-Eis, Schaber,and Tappi (2010).
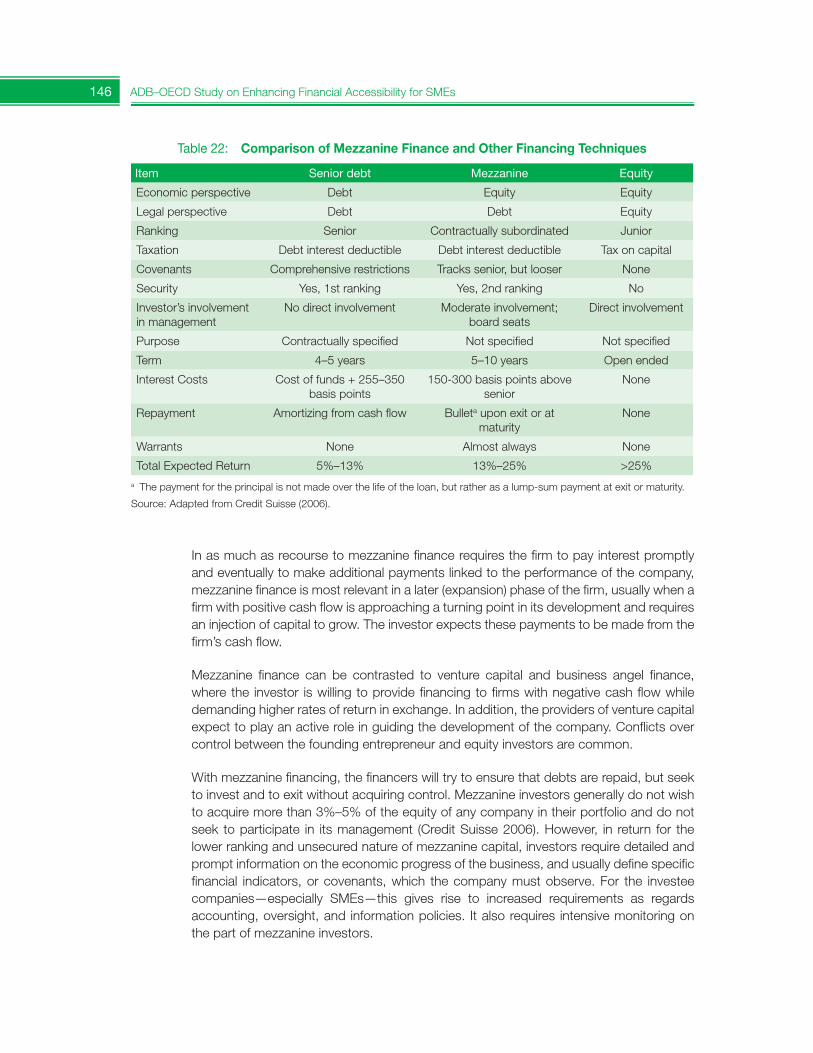
146 ADB–OECD Study on Enhancing Financial Accessibility for SMEs
In as much as recourse to mezzanine finance requires the firm to pay interest promptly and eventually to make additional payments linked to the performance of the company, mezzanine finance is most relevant in a later (expansion) phase of the firm, usually when a firm with positive cash flow is approaching a turning point in its development and requires an injection of capital to grow. The investor expects these payments to be made from the firm’s cash flow.
Mezzanine finance can be contrasted to venture capital and business angel finance, where the investor is willing to provide financing to firms with negative cash flow while demanding higher rates of return in exchange. In addition, the providers of venture capitalexpect to play an active role in guiding the development of the company. Conflicts over control between the founding entrepreneur and equity investors are common.
With mezzanine financing, the financers will try to ensure that debts are repaid, but seek to invest and to exit without acquiring control. Mezzanine investors generally do not wishto acquire more than 3%–5% of the equity of any company in their portfolio and do not seek to participate in its management (Credit Suisse 2006). However, in return for the lower ranking and unsecured nature of mezzanine capital, investors require detailed and prompt information on the economic progress of the business, and usually define specific financial indicators, or covenants, which the company must observe. For the investee companies—especially SMEs—this gives rise to increased requirements as regards accounting, oversight, and information policies. It also requires intensive monitoring on the part of mezzanine investors.
Table 22: Comparison of Mezzanine Finance and Other Financing Techniques
Item Senior debt Mezzanine Equity
Economic perspective Debt Equity Equity
Legal perspective Debt Debt Equity
Ranking Senior Contractually subordinated Junior
Taxation Debt interest deductible Debt interest deductible Tax on capital
Covenants Comprehensive restrictions Tracks senior, but looser None
Security Yes, 1st ranking Yes, 2nd ranking No
Investor’s involvement in management
No direct involvement Moderate involvement; board seats
Direct involvement
Purpose Contractually specified Not specified Not specified
Term 4–5 years 5–10 years Open ended
Interest Costs Cost of funds + 255–350 basis points
150-300 basis points above senior
None
Repayment Amortizing from cash flow Bulleta upon exit or at maturity
None
Warrants None Almost always None
Total Expected Return 5%–13% 13%–25% >25%a The payment for the principal is not made over the life of the loan, but rather as a lump-sum payment at exit or maturity.
Source: Adapted from Credit Suisse (2006).
147Diversified Financing Models
Mezzanine finance complements rather than replaces other forms of finance. As it is considered equivalent to an increase in equity by banks and other traditional lenders, it offers greater scope for additional straight debt. In addition, it can be used in conjunction with various forms of equity finance, such as private equity, venture capital, business angels, or listing on an exchange or similar trading platform.
1. Instruments for Mezzanine FinanceA mezzanine facility typically includes several financing instruments (tranches) of varying degrees of risk and return. The exact mix of instruments in a specific facility can be tailored to suit the risk–reward preferences of the SME and the investors. To the extent that the facility has a large share of fixed rate current pay assets, it will tend to have a low but steady yield. Yield can be enhanced by increasing the proportion of higher risk assets in the facility or by delaying payments until later stages of the operation.
A simple mezzanine facility contains (i) one or more categories of subordinated debt;(ii) a tranche in which the investor receives a success fee, i.e., a share of the firm’s earnings or profits; and/or (iii) an equity-related tranche in which an investor receives a payment whose value is contingent upon a rise in the value of the company, usually reflected in the company’s share price. The latter tranche is often called the “equity kicker”. The following paragraphs illustrate in more detail the main components of mezzanine facilities.
(i) Subordinated loans (sometimes called junior debt) are unsecured loans, at a specific rate of interest, independent of the state of the company’s finance,where the lender’s claim for repayment in the event of bankruptcy ranks behind that of providers of senior debt but ahead of equity investors. Principal is usually repaid in “bullet” form, i.e., at the end of the loan. For a higher interest rate, the facility may provide for payment in kind in which both interest and principal are paid at the loan’s maturity.
(ii) Under sales or turnover participation rights, the investor receives a payment based upon the performance of the company, in terms of revenue, turnover, or earnings. Participating loans are loans whose remuneration, interest, or capital repayment, is contingent upon the results of the business (e.g., profit, financial position, share price) rather than being fixed. This participation can be confined to the purpose for which the loan was provided or pertain to the whole business of the company. Additionally, fixed interest payments can be included in the contract. Participating loans do not share losses. In the event of bankruptcy, providers of participating loans share in the results of the liquidation in the same way as other loan creditors.
(iii) Profit participation rights are equity investments that entitle the holder to rights over the company’s assets (e.g., participation in profits or in the surplus on liquidation, subscription for new stock) but not ownership rights, such as participation to shareholders’ meeting and voting. Profit participation rights are not defined by law and can therefore to a large extent be negotiated and designed to suit the parties, resembling borrowed capital, with minimum interest payments which are independent of the company’s profits, or equity capital, with the right to participate in the company’s profits and/or liquidation proceeds.
148 ADB–OECD Study on Enhancing Financial Accessibility for SMEs
(iv) “Silent” participation is closer in legal form to an equity investment than subordinated or participating loans. In this form of financing one or more persons take an equity stake in a company, but without assuming any liability to the company’s creditors. The typical silent participation affects only the company’s internal affairs and is not apparent to outside observers. The details of participation in profits or losses, involvement in the company’s management, supervision, andinformation rights can be structured flexibly.
(v) Equity “kickers” include a payment to the investor that reflects the increased value of the company enabled by mezzanine finance. The most common equity kickers are warrants which give the holder the right to purchase a specific number of shares at a predetermined price. The value of the warrant is the difference between the price at which a share of the company can be purchased by exercising the warrant (the strike price) and the market price. The value ofthis instrument can be determined by market process where the company is publicly traded or is sold to an outside investor through a merger or acquisition. In cases where no such basis for pricing the equity interest is available, the value of the equity warrant is determined using a valuation technique specified in the contract.
2. Types of Firms Suitable for Mezzanine FinanceMezzanine capital is a suitable form of finance for SMEs with a strong cash position and a moderate growth profile. However, it is not intended to be a permanent feature of the capital structure of any firm. Rather, it is applied at certain defined points in the business life cycle, in order to assist the firm in effecting certain transitions in its development. In particular, mezzanine capital can serve SMEs when the risks and opportunities of the business are increasing but they have insufficient equity backing, and, for this same reason, face difficulties in accessing debt capital (Credit Suisse 2006).
The traditional market for mezzanine finance has been upper-tier SMEs, with high rating (BBB+ or above) and demand for funds above €2 million. Thus, it is a form of finance that mainly supports growth plans of medium-sized companies; it does not generally apply to the smaller segment of the SME sector. Nevertheless, in recent years, some financial institutions, particularly public financial institutions, have started to extend mezzanine finance to SMEs below the upper tier and with smaller funding needs. For SMEs in this segment, which normally have to rely on regular loans or equity to meet their funding requirements, the opening up of the mezzanine market to smallerand lower-rated borrowers enables broader choice, more tailor-made financing, and better conditions for negotiation on the terms for new senior debts and equity (European Commission 2007).
In general, an important precondition for raising mezzanine capital is that the earning power and market position of the business should be well-established and stable. A company must demonstrate an established track record in its industry, show a profit or at the very least post no loss, and have a strong business plan for the future. Qualitative factors, such as the track record and capabilities of the management, play important parts in the investment decision.
149Diversified Financing Models
D. Government Support to Mezzanine Finance
The rationale for government intervention in the market for mezzanine finance relates to the existence of a financing gap (or market failure) in certain parts of the SME finance market, meaning that SMEs that are apparently creditworthy and have reasonable economic prospects cannot obtain funding in the market. The growth capital segment of the market is more problematic than the one concerning established SMEs with strong cash flows or those buttressed by guarantees and collateral. Substantial amounts of funds might be needed to finance projects with high growth prospects, while the associated profitpatterns are often difficult to forecast (OECD 2010b).
Policy makers in some countries and in international organizations have sought to encourage the use of mezzanine finance because of its potential to provide finance efficiently to key categories of SMEs, and to extend it to SMEs with lower credit ratings and smaller funding needs than the companies most commonly served by commercial providers.
Table 23 illustrates the forms that government support may take in this market. These can be classified into three categories:
(i) Participation in the commercial mezzanine market, through the creation of investment funds that target certain categories of SMEs and award mandates to private investment specialists. In many OECD countries, governments have formed special investment funds that invest alongside private investors in SMEs. Some of these funds may only invest in mezzanine vehicles, while many have flexible investment mandates that permit them to invest in a broader range of assets. There are two main ways in which public entities invest in SMEs through funds:
(a) a simple fund structure in which the public entity joins other public and private entities and provides resources (equity, debt, or mezzanine) to SMEs; or
(b) a fund of funds structure, in which the public entity allocates funding to several funds that provide financing to SMEs.
(ii) Direct funding to SMEs can be provided by a special agency (e.g., an SME support agency or development bank) under a specific program. Typically, these programs contain some mix of subordinated loans with a mechanism for participation in the sales, earnings, or profits of the company when performance is good. Alternatively, the official agency may provide guarantees while private institutions offer the facility.
(iii) Funding of private investment companies at highly attractive terms. This type of government support to mezzanine finance development is observed specifically in the United States. Under the Small Business Investment Company (SBIC) mechanism, a government agency, the US Small Business Administration (SBA), issues debt and makes funding available to SBICs. These are privately owned and managed investment companies that provide funding (in equity or mezzanineform) to SMEs. The SBA is a senior creditor of the SBIC and receives interest regardless of the performance of the companies in the SBIC’s portfolio. The SBA
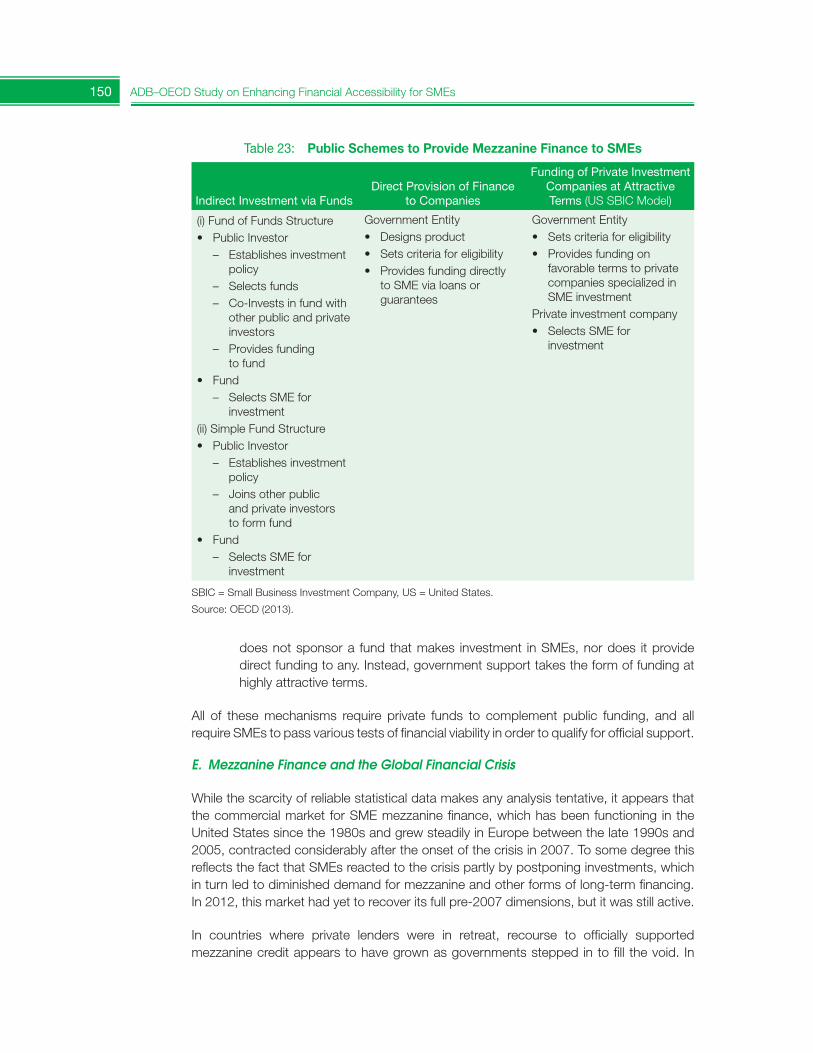
150 ADB–OECD Study on Enhancing Financial Accessibility for SMEs
does not sponsor a fund that makes investment in SMEs, nor does it provide direct funding to any. Instead, government support takes the form of funding at highly attractive terms.
All of these mechanisms require private funds to complement public funding, and all require SMEs to pass various tests of financial viability in order to qualify for official support.
E. Mezzanine Finance and the Global Financial Crisis
While the scarcity of reliable statistical data makes any analysis tentative, it appears that the commercial market for SME mezzanine finance, which has been functioning in theUnited States since the 1980s and grew steadily in Europe between the late 1990s and 2005, contracted considerably after the onset of the crisis in 2007. To some degree this reflects the fact that SMEs reacted to the crisis partly by postponing investments, which in turn led to diminished demand for mezzanine and other forms of long-term financing. In 2012, this market had yet to recover its full pre-2007 dimensions, but it was still active.
In countries where private lenders were in retreat, recourse to officially supported mezzanine credit appears to have grown as governments stepped in to fill the void. In
Table 23: Public Schemes to Provide Mezzanine Finance to SMEs
Indirect Investment via FundsDirect Provision of Finance
to Companies
Funding of Private Investment Companies at Attractive Terms (US SBIC Model)
(i) Fund of Funds Structure • Public Investor
– Establishes investment policy
– Selects funds – Co-Invests in fund with
other public and private investors
– Provides funding to fund
• Fund – Selects SME for
investment(ii) Simple Fund Structure• Public Investor
– Establishes investment policy
– Joins other public and private investors to form fund
• Fund – Selects SME for
investment
Government Entity • Designs product• Sets criteria for eligibility• Provides funding directly
to SME via loans or guarantees
Government Entity • Sets criteria for eligibility• Provides funding on
favorable terms to private companies specialized in SME investment
Private investment company• Selects SME for
investment
SBIC = Small Business Investment Company, US = United States.
Source: OECD (2013).
151Diversified Financing Models
cases where programs were well-established before 2007 (e.g., Canada and the United States), some contraction was discernible immediately after the crisis as SMEs reduced costs in the face of declining demand and investors became visibly more cautious. There has, however, been a subsequent recovery and these programs seem to be on track for further growth. In cases where measures were introduced in response to the crisis,utilization has remained high as governments have stepped in to fill the gap at a timewhen private banks’ credit offerings were shrinking. Recent policy initiatives by several governments suggest that other OECD governments recognize the potential for this instrument to respond to a specific financing gap for SMEs.
F. Conclusions
Broadening the range of financing instruments available to SMEs and entrepreneurs is crucial to reducing the vulnerability of the sector to changes in the credit market and to address the “growth capital gap” that constrains the most dynamic enterprises. OECD work is under way to map the range of financing instruments available to SMEs and entrepreneurs and to assess the potential and challenges of these instruments in addressing different financing needs of SMEs.
This section has focused on the functioning of the market in mezzanine finance and on policy programs in this area. On balance, this form of finance has not received asmuch public attention as venture capital or specialized exchanges for SMEs, but it holdspotential to respond to two critical problems in SME finance.
First, mezzanine finance can play an important role in widening the range of financing vehicles available to SMEs. The expansion phase of the firm financing cycle, where mezzanine is most commonly used, has been identified as one where market failure is common. This is not to say that mezzanine is the best solution to the scarcity of growth capital at all times, but that it is highly relevant when used by certain firms in specific situations. While mezzanine finance is less suited than venture capital to financing high-tech start-ups and guiding them through successive phases of the growth cycle, it is more effective in meeting the needs of established companies seeking to grow and those seeking to effect major transformations.
Second, mezzanine finance may be especially relevant at the present juncture in global finance, since it enables companies to improve their capital structure and lessen their vulnerability in times of stress. This can be particularly useful when SMEs have beenhighly leveraged and dependent upon close relationships with banks. Given the present need in many countries to deleverage, mezzanine may have the potential to help SMEs to improve the quality of their balance sheets and help them to move into the next phase of expansion.
Furthermore, in cases where the withdrawal of private funding has eased but private investors still hesitate to take new risks, mezzanine can be a highly relevant tool for exiting the crisis. Because it has characteristics that help investors recognize new growth opportunities, partly through innovative risk-sharing techniques, mezzanine has the potential to encourage new private funding and to direct investment to those firms with the best growth prospects.
152 ADB–OECD Study on Enhancing Financial Accessibility for SMEs
At the same time, mezzanine finance does not represent a definitive solution to the financing of SMEs. Many SMEs are not well-suited to this form of finance, and most firmsusing mezzanine finance will continue to need traditional debt and equity finance. Also, the use of mezzanine finance instruments requires a certain level of financial skills on thepart of entrepreneurs and SME managers, who often lack awareness and capabilities to understand and access a wider range of financial options than traditional debt. Rather, the early evidence suggests that mezzanine finance can be an important part of the continuum of financing options that together constitute an efficient financial system.
One salient fact about the market in mezzanine finance is its uneven development across OECD countries. It seems difficult to ascribe differences in the use of mezzanine to obvious factors such as the state of development of the economy or the institutionalstructure of the financial system. Even countries at similar levels of development and with similar financial structures appear to have vastly different levels of usage of mezzanine.
In some countries, a well-developed commercial market in mezzanine finance has functioned for more than two decades with minimal public involvement. However, the traditional market for commercial mezzanine finance has been upper-tier SMEs, with high credit ratings and demand for funds above €2 million. Increasingly, governments in OECD countries have developed measures to offer mezzanine products to SMEs with lesser credit ratings and smaller funding needs. Public intervention has been taking two main forms: (i) participation in the commercial mezzanine market by public entities (national or subnational development funds, international organizations), which create investmentfunds targeted to certain categories of SMEs and award mandates to private investmentspecialists, who in turn invest in targeted companies; and (ii) direct public financing to SMEs under programs managed by public financial institutions or development banks.
The ability to assess the full potential of mezzanine finance for SMEs and entrepreneurs, and the effectiveness of public institutions in providing these facilities, is hampered by the lack of data on commercial mezzanine finance in terms of financing volume, number and type of firms, as well as data on public investment funds in countries and international organizations. In this regard, progress is needed in terms of collection of statistical data on the amount of public funding provided through both commercial vehicles and public financial institutions, and on the performance of SMEs using this type of finance. To help fill these gaps, more extensive analysis and policy dialogue involving key players, such as official agencies that actively provide mezzanine finance, industry associations, private financial institutions, and international financial institutions, should be encouraged.
References
Credit Suisse. 2006. Mezzanine Finance. A Hybrid Instrument with a Future. Economic Briefing no. 42.
European Commission. 2007. Mezzanine Finance. Final Report, Fifth Round Table between Bankers and SMEs, DG Enterprise and Industry, European Commission. http://ec.europa.eu/enterprise/newsroom/cf/_getdocument.cfm?doc_id=1065
153Diversified Financing Models
Griggs, R. 2012. Annual Report 2011/12, Banking Taskforce, Appeals Process, Independent External Reviewer. United Kingdom. Available at: http://www.betterbusinessfinance.co.uk/images/uploads/Annual_Report_Master_2012.pdf
Kraemer-Eis¸ H., M. Schaber, and A. Tappi. 2010. SME Loan Securitisation: An Important Tool to Support European SME Lending. EIB Working Paper 2010/7. European Investment Bank.
OECD. 2010a. Assessment of government support programmes for SMEs and entrepreneurs’ access to finance in the global crisis. Paris.
______. 2010b. High Growth Enterprises. What Governments can do to make a difference. Paris.
______. 2012. Financing SMEs and Entrepreneurs 2012. An OECD Scoreboard. Paris.
______. 2013. Alternative Financing Instruments for SMEs and Entrepreneurs: The Case of Mezzanine Finance. Paris.
______. Forthcoming. Financing SMEs and Entrepreneurs 2014. An OECD Scoreboard. Paris.
Thompson, J. K. 1995. Securitisation: An International Perspective. Paris: OECD.
154 ADB–OECD Study on Enhancing Financial Accessibility for SMEs
3.2.2. The Potential of SME Capital Markets in Emerging AsiaShigehiro Shinozaki67
Asia’s bank-centered financial systems require reduction of the supply–demand gap in lending as a core policy pillar to improve SME access to finance. Meanwhile, the diversification of financing models beyond conventional bank lending is another key policy pillar to better serve various financing needs of SMEs and expand their financial accessibility. The rapid growth of emerging Asia is generating SME long-term funding needs and requires robust capital markets as an alternative channel toprovide growth capital for SMEs. The G-20 leaders also addressed the importance of promoting long-term financing for SMEs in the context of investment. The development of capital markets that SMEs can tap is one of the policy challenges under the pillar of diversified financing models which requires more sophisticated and innovativeinstitutional arrangements in order to respond effectively to the real needs of SMEs. This section explores the potential of capital market financing for SMEs in emerging Asia, reviewing the challenges of existing SME capital markets and assessing demands on SMEs, regulators, policy makers, market organizers, securities firms, and investors for developing an SME market, based on the findings from intensive surveys. Given the responses to the national growth strategies and the crosscutting issues of global policy agendas such as climate change, energy efficiency, and green finance, the potential for developing the “exercise” equity market68 and the social capital market in Asia is also explored in this section.
A. Introduction
SMEs are the backbone of a resilient national economy in every country because they stimulate domestic demand through job creation, innovation, and competition. Meanwhile, SMEs involved in the global supply chain have the potential to encourage international trade and to mobilize domestic demand. Prioritizing SME development is therefore critical for promoting inclusive economic growth in Asia.
Given the global economic uncertainty, adequate and stable access to finance is crucialfor SMEs to survive and grow. In Asia, however, most SMEs have been suffering poor access to finance, which is one of the core factors impeding SME development. There is a perceived supply–demand gap in SME finance. The International Finance Corporation (IFC) and McKinsey & Company estimated the value of the gap in formal SME credit in 2010 at $700 billion–$850 billion, which is equivalent to 21%–26% of the total formal SME credit outstanding in the developing world. If informal SMEs and microenterprises are included, the total gap in developing countries in terms of unmet financing demand exceeds $2 trillion.
67 Financial Sector Specialist (SME Finance), Office of Regional Economic Integration, Asian Development Bank (ADB). [email protected]. This is based on ADB. 2014. ADB Working Paper Series on Regional Economic Integration, No. 121. Manila (January).
68 The exercise market is a concept of equity market for potentially high-growth SMEs. It is separate from the exchange market and refers to a preparatory market for smaller but growing firms that will eventually tap the exchange market and provides them with a chance to learn more market rules and obligations before tapping the organized market.
155Diversified Financing Models
Such a supply–demand gap suggests the limitations of bank lending for enterprises in raising sustainable and safe funds for business, especially for SMEs. Once unexpected events such as a financial crisis occur, the banking sector will naturally respond to such events and take actions to mitigate associated risks, which will cause a credit crunch in the banking sector and seriously affect SME access to finance. Moreover, Basel III might accelerate this trend in banks by further restricted financing for SMEs. The root causes of financial crises change as global financial systems become more advanced. Well-established SME finance policies will alleviate credit contraction, but cannot removeit entirely. To supplement the limitations of bank lending for SMEs amid the complex global financial environment, the diversification of financing models, with flexibility and innovation, is indispensable.
Capital market financing for SMEs is one of the policy challenges under the pillar of diversified financing models which requires more sophisticated and innovative institutional arrangements in order to respond effectively to the real needs of SMEs. Long-term financing for investment, including SMEs, is key for sustainable growth and job creation, as stated at the G-20 Finance Ministers and Central Bank Governors Meeting in Moscow in July 2013. On the occasion of the Saint Petersburg Summit in September 2013, the G-20 leaders also addressed the importance of promoting long-term financing for SMEs in the context of investment.
SMEs are a large mass of enterprises differing by sector and size, which include sole proprietorships and slower-growing or zero-growth firms (although those are not a grouptapping capital markets). High-end SMEs, a group of firms that seek to innovatively raise growth capital for business, are (i) central to the ability of an economy as a whole to create jobs, (ii) a major group seeking long-term funding, and (iii) an appropriate group to tap capital markets.
On the whole, SMEs, especially start-ups, tend to have a lower probability of survival thanlarger firms, which creates a general pattern of simultaneous high rates of SME market entry and exit across virtually all economic sectors and encourages financial institutions to regard them as being inherently riskier loan prospects than larger firms. Hence, banks’ hesitation to provide long-term financing because of uncertain economic circumstances is seriously affecting SME growth capital funding.
Bank-centered financial systems in Asia require robust capital markets as an alternative channel to provide growth capital. The development of long-term financing instruments for high-end SMEs and proper regulatory frameworks for new instruments will be a keygrowth agenda among policy makers and regulators, which should be incorporated into a comprehensive range of policy options on SME finance.
Capital markets are typically susceptible to changing external economic conditions, especially during a financial crisis. In OECD countries, most economies were severely impacted by the 2008/09 global financial crisis, with the level of equity investments in 2011 still below precrisis levels in several countries (Figure 36). SME capital markets should be well-designed to mitigate risks arising from the external environment, which requires a sophisticated institutional mechanism that supports SMEs in direct finance and manages any possible risks.
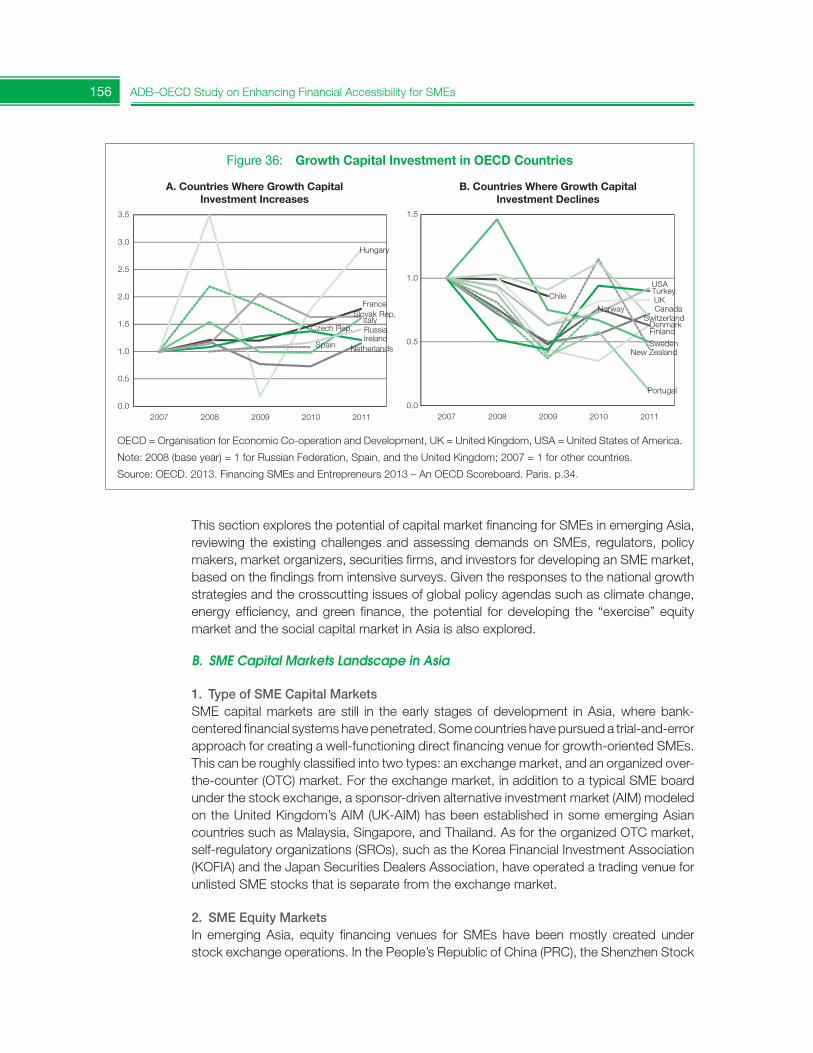
156 ADB–OECD Study on Enhancing Financial Accessibility for SMEs
Figure 36: Growth Capital Investment in OECD Countries
Czech Rep.
France
Hungary
Ireland
Italy
Netherlands
Russia
Slovak Rep.
Spain
0.0
0.5
1.0
1.5
2.0
2.5
3.0
3.5
2007 2008 2009 2010 2011
Canada
Chile
Denmark Finland
New Zealand
Norway
Portugal
Sweden
Switzerland
Turkey UK
USA
0.0
0.5
1.0
1.5
2007 2008 2009 2010 2011
Czech Rep.
France
Hungary
Ireland
Italy
Netherlands
Russia
Slovak Rep.
Spain
0.0
0.5
1.0
1.5
2.0
2.5
3.0
3.5
2007 2008 2009 2010 2011
Canada
Chile
Denmark Finland
New Zealand
Norway
Portugal
Sweden
Switzerland
Turkey UK
USA
0.0
0.5
1.0
1.5
2007 2008 2009 2010 2011
A. Countries Where Growth Capital Investment Increases
B. Countries Where Growth Capital Investment Declines
OECD = Organisation for Economic Co-operation and Development, UK = United Kingdom, USA = United States of America.
Note: 2008 (base year) = 1 for Russian Federation, Spain, and the United Kingdom; 2007 = 1 for other countries.
Source: OECD. 2013. Financing SMEs and Entrepreneurs 2013 – An OECD Scoreboard. Paris. p.34.
This section explores the potential of capital market financing for SMEs in emerging Asia, reviewing the existing challenges and assessing demands on SMEs, regulators, policy makers, market organizers, securities firms, and investors for developing an SME market, based on the findings from intensive surveys. Given the responses to the national growth strategies and the crosscutting issues of global policy agendas such as climate change, energy efficiency, and green finance, the potential for developing the “exercise” equity market and the social capital market in Asia is also explored.
B. SME Capital Markets Landscape in Asia
1. Type of SME Capital MarketsSME capital markets are still in the early stages of development in Asia, where bank-centered financial systems have penetrated. Some countries have pursued a trial-and-error approach for creating a well-functioning direct financing venue for growth-oriented SMEs. This can be roughly classified into two types: an exchange market, and an organized over-the-counter (OTC) market. For the exchange market, in addition to a typical SME board under the stock exchange, a sponsor-driven alternative investment market (AIM) modeled on the United Kingdom’s AIM (UK-AIM) has been established in some emerging Asiancountries such as Malaysia, Singapore, and Thailand. As for the organized OTC market, self-regulatory organizations (SROs), such as the Korea Financial Investment Association (KOFIA) and the Japan Securities Dealers Association, have operated a trading venue for unlisted SME stocks that is separate from the exchange market.
2. SME Equity MarketsIn emerging Asia, equity financing venues for SMEs have been mostly created under stock exchange operations. In the People’s Republic of China (PRC), the Shenzhen Stock
157Diversified Financing Models
Exchange has developed a three-tier market venue comprising the Main Board, the SME Board (in May 2004), and ChiNext (in October 2009, a high-tech venture board) in line with national economic development strategies. Hong Kong, China’s Growth Enterprise Market is an alternative stock market for high-growth enterprises, operated by the StockExchange of Hong Kong. India has recently developed dedicated stock exchanges for SMEs, following the recommendation of the Prime Minister’s Task Force in June 2010. The Bombay Stock Exchange launched the SME Exchange in March 2012 and it had 41 listed SMEs as of 19 November 2013. The National Stock Exchange has also launched anSME platform named Emerge, with three listed SMEs. KOSDAQ is the largest organized market for SMEs and venture businesses in the Republic of Korea and is operated by the Korea Exchange. As KOSDAQ is becoming a funding venue for high-end larger enterprises, a new market designed for SMEs named KONEX was launched under the Korea Exchange in July 2013. MESDAQ under Bursa Malaysia was relaunched as the ACE (Access, Certainty, Efficiency) market in August 2009, a sponsor-driven alternativemarket. Catalist in Singapore, established in December 2007, is a sponsor-supervised market regulated by the Singapore Exchange for rapidly growing enterprises, modeled on the UK-AIM. The Securities Exchange of Thailand has operated the market for alternative investment (mai) since June 1999, targeting SMEs as potential issuers (Box 4).
Box 4: Challenges to Developing SME Capital Markets in Thailand
The Market for Alternative Investment (mai) was established under the Stock Exchange of Thailand in 1998. Its main mission is to provide opportunities for entrepreneurs and SMEs to tap long-term growth capital. Since the first listed company appeared in 2001, the mai market has been growing. As of 19 September 2013, the mai held 89 listed companies with total market capitalization of B180 billion and total turnover value of B448 billion. So far, 14 companies have successfully moved from the mai to the main board of the stock exchange since establishment. The Government of Thailand initially introduced a tax incentive scheme for newly listed companies in the mai, i.e., a reduction of corporate tax from 30% to 20% for five accounting periods, which boosted the number of listed companies in 2004 and 2005. This tax privilege is no longer available as the government has uniformly reduced corporate tax for all firms.
The listing requirements on the mai have been relaxed compared to the main board. For instance, the issuer must continuously operate at least for 2 years (3 years in the main board) and hold paid-up capital of no less than B20 million after public offering (B300 million in the main board). There should be no less than 300 minority shareholders (1,000 in the main board). The mai copes with only equity products (common stock and warrant) and no bond issuance and trading. At present, the Securities and Exchange Commission has overseen the development of the SME bond market, together with the Thai Credit Guarantee Corporation for the design of potential guaranteed SME bond products.a
The active issuers in the mai are manufacturing and service industries, most of which are family-run businesses operating for 5–20 years. The technology sector is the potential segment of mai issuers in the future. The main investors in mai stocks are domestic individuals and institutions (97% of trading in 2012). Foreign investor participation in the mai accounted for only 1.6% of trading in 2012. The Government of Thailand has supported establishment of several venture capital funds such as the SME Venture Capital Fund that amounted to B1 billion since 2000, but the venture capital industry is still quite small in scale in Thailand. The Thai Venture Capital Association comprises 14 members.
The Securities and Exchange Commission is responsible for regulating and supervising Thai capital markets including the Stock Exchange of Thailand and the mai. Although still in the trial-and-error stage, the commission is taking several initiatives to develop SME capital markets in Thailand. First is the program to promote SME bond issuance through educating SMEs (through free seminars on issuing bonds) and creating incentive schemes
continued on next page
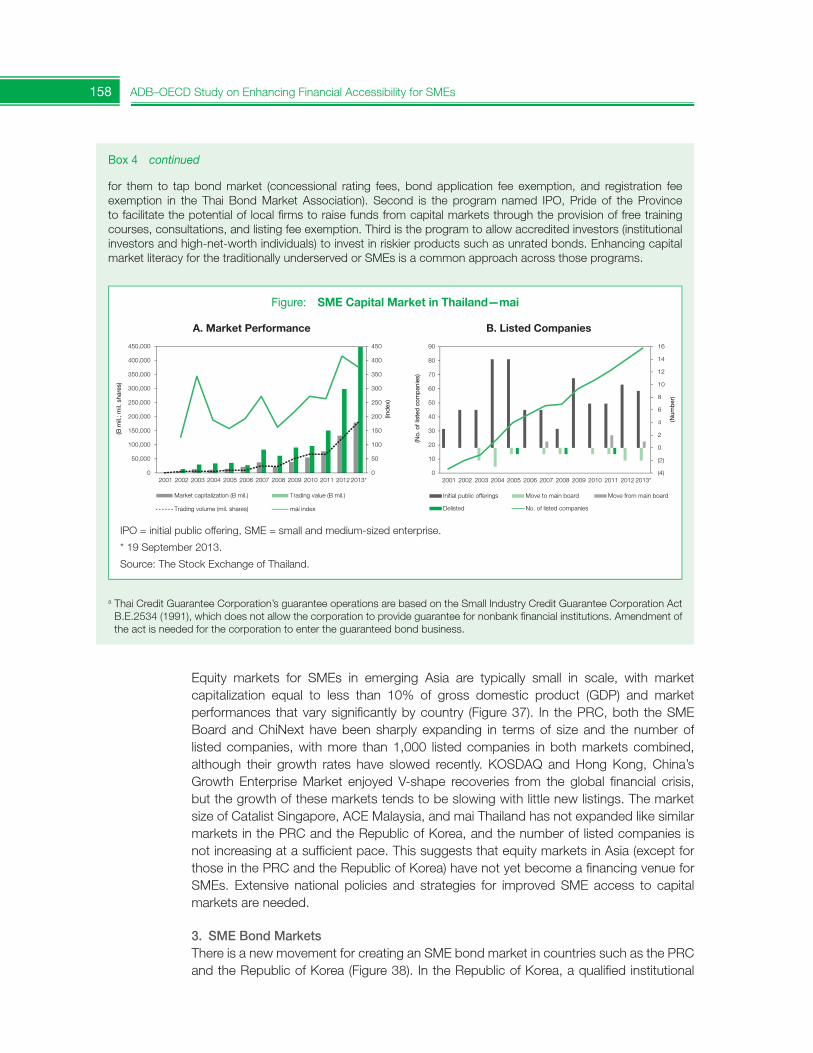
158 ADB–OECD Study on Enhancing Financial Accessibility for SMEs
Box 4 continued
for them to tap bond market (concessional rating fees, bond application fee exemption, and registration fee exemption in the Thai Bond Market Association). Second is the program named IPO, Pride of the Province to facilitate the potential of local firms to raise funds from capital markets through the provision of free training courses, consultations, and listing fee exemption. Third is the program to allow accredited investors (institutional investors and high-net-worth individuals) to invest in riskier products such as unrated bonds. Enhancing capital market literacy for the traditionally underserved or SMEs is a common approach across those programs.
a Thai Credit Guarantee Corporation’s guarantee operations are based on the Small Industry Credit Guarantee Corporation Act B.E.2534 (1991), which does not allow the corporation to provide guarantee for nonbank financial institutions. Amendment of the act is needed for the corporation to enter the guaranteed bond business.
Figure: SME Capital Market in Thailand—mai
IPO = initial public offering, SME = small and medium-sized enterprise.
* 19 September 2013.
Source: The Stock Exchange of Thailand.
A. Market Performance B. Listed Companies
0
50
100
150
200
250
300
350
400
450
0
50,000
100,000
150,000
200,000
250,000
300,000
350,000
400,000
450,000
2001 2002 2003 2004 2005 2006 2007 2008 2009 2010 2011 2012 2013*
Market capitalization (B mil.) Trading value (B mil.)
Trading volume (mil. shares) mai index
(4)
(2)
0
2
4
6
8
10
12
14
16
0
10
20
30
40
50
60
70
80
90
2001 2002 2003 2004 2005 2006 2007 2008 2009 2010 2011 2012 2013*
Initial public offerings Move to main board Move from main board
Delisted No. of listed companies
(B m
il.; m
il. s
hare
s)
(Ind
ex)
(No.
of l
iste
d c
omp
anie
s)
(Num
ber
)
0
50
100
150
200
250
300
350
400
450
0
50,000
100,000
150,000
200,000
250,000
300,000
350,000
400,000
450,000
2001 2002 2003 2004 2005 2006 2007 2008 2009 2010 2011 2012 2013*
Market capitalization (B mil.) Trading value (B mil.)
Trading volume (mil. shares) mai index
(4)
(2)
0
2
4
6
8
10
12
14
16
0
10
20
30
40
50
60
70
80
90
2001 2002 2003 2004 2005 2006 2007 2008 2009 2010 2011 2012 2013*
Initial public offerings Move to main board Move from main board
Delisted No. of listed companies
(B m
il.; m
il. s
hare
s)
(Ind
ex)
(No.
of l
iste
d c
omp
anie
s)
(Num
ber
)Equity markets for SMEs in emerging Asia are typically small in scale, with market capitalization equal to less than 10% of gross domestic product (GDP) and marketperformances that vary significantly by country (Figure 37). In the PRC, both the SME Board and ChiNext have been sharply expanding in terms of size and the number of listed companies, with more than 1,000 listed companies in both markets combined, although their growth rates have slowed recently. KOSDAQ and Hong Kong, China’s Growth Enterprise Market enjoyed V-shape recoveries from the global financial crisis, but the growth of these markets tends to be slowing with little new listings. The market size of Catalist Singapore, ACE Malaysia, and mai Thailand has not expanded like similar markets in the PRC and the Republic of Korea, and the number of listed companies is not increasing at a sufficient pace. This suggests that equity markets in Asia (except for those in the PRC and the Republic of Korea) have not yet become a financing venue for SMEs. Extensive national policies and strategies for improved SME access to capital markets are needed.
3. SME Bond MarketsThere is a new movement for creating an SME bond market in countries such as the PRC and the Republic of Korea (Figure 38). In the Republic of Korea, a qualified institutional
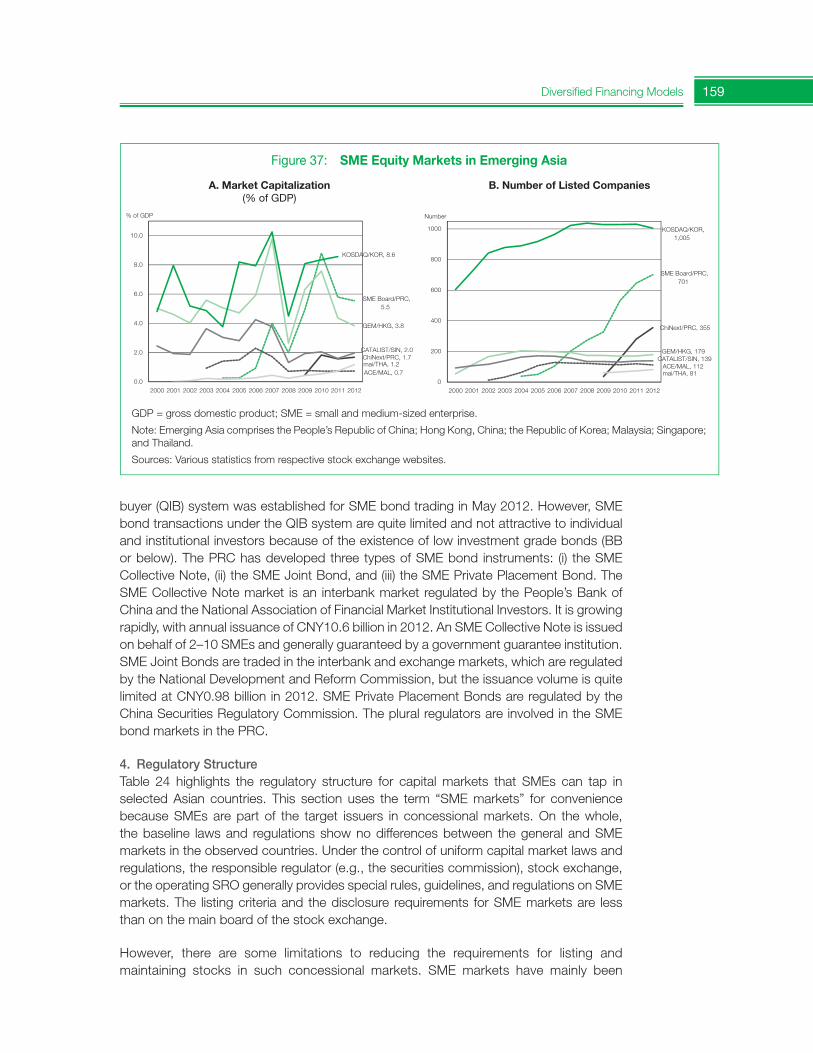
159Diversified Financing Models
Figure 37: SME Equity Markets in Emerging Asia
SME Board/PRC, 5.5
ChiNext/PRC, 1.7
GEM/HKG, 3.8
KOSDAQ/KOR, 8.6
ACE/MAL, 0.7
CATALIST/SIN, 2.0
mai/THA, 1.2
0.0
2.0
4.0
6.0
8.0
10.0
2000 2001 2002 2003 2004 2005 2006 2007 2008 2009 2010 2011 2012
% of GDP
SME Board/PRC, 701
ChiNext/PRC, 355
GEM/HKG, 179
KOSDAQ/KOR, 1,005
ACE/MAL, 112 CATALIST/SIN, 139
mai/THA, 81
0
200
400
600
800
1000
2000 2001 2002 2003 2004 2005 2006 2007 2008 2009 2010 2011 2012
Number
A. Market Capitalization (% of GDP)
B. Number of Listed Companies
GDP = gross domestic product; SME = small and medium-sized enterprise.
Note: Emerging Asia comprises the People’s Republic of China; Hong Kong, China; the Republic of Korea; Malaysia; Singapore; and Thailand.
Sources: Various statistics from respective stock exchange websites.
buyer (QIB) system was established for SME bond trading in May 2012. However, SME bond transactions under the QIB system are quite limited and not attractive to individual and institutional investors because of the existence of low investment grade bonds (BB or below). The PRC has developed three types of SME bond instruments: (i) the SME Collective Note, (ii) the SME Joint Bond, and (iii) the SME Private Placement Bond. The SME Collective Note market is an interbank market regulated by the People’s Bank ofChina and the National Association of Financial Market Institutional Investors. It is growing rapidly, with annual issuance of CNY10.6 billion in 2012. An SME Collective Note is issued on behalf of 2–10 SMEs and generally guaranteed by a government guarantee institution. SME Joint Bonds are traded in the interbank and exchange markets, which are regulated by the National Development and Reform Commission, but the issuance volume is quite limited at CNY0.98 billion in 2012. SME Private Placement Bonds are regulated by the China Securities Regulatory Commission. The plural regulators are involved in the SME bond markets in the PRC.
4. Regulatory StructureTable 24 highlights the regulatory structure for capital markets that SMEs can tap in selected Asian countries. This section uses the term “SME markets” for convenience because SMEs are part of the target issuers in concessional markets. On the whole, the baseline laws and regulations show no differences between the general and SME markets in the observed countries. Under the control of uniform capital market laws and regulations, the responsible regulator (e.g., the securities commission), stock exchange, or the operating SRO generally provides special rules, guidelines, and regulations on SME markets. The listing criteria and the disclosure requirements for SME markets are less than on the main board of the stock exchange.
However, there are some limitations to reducing the requirements for listing and maintaining stocks in such concessional markets. SME markets have mainly been
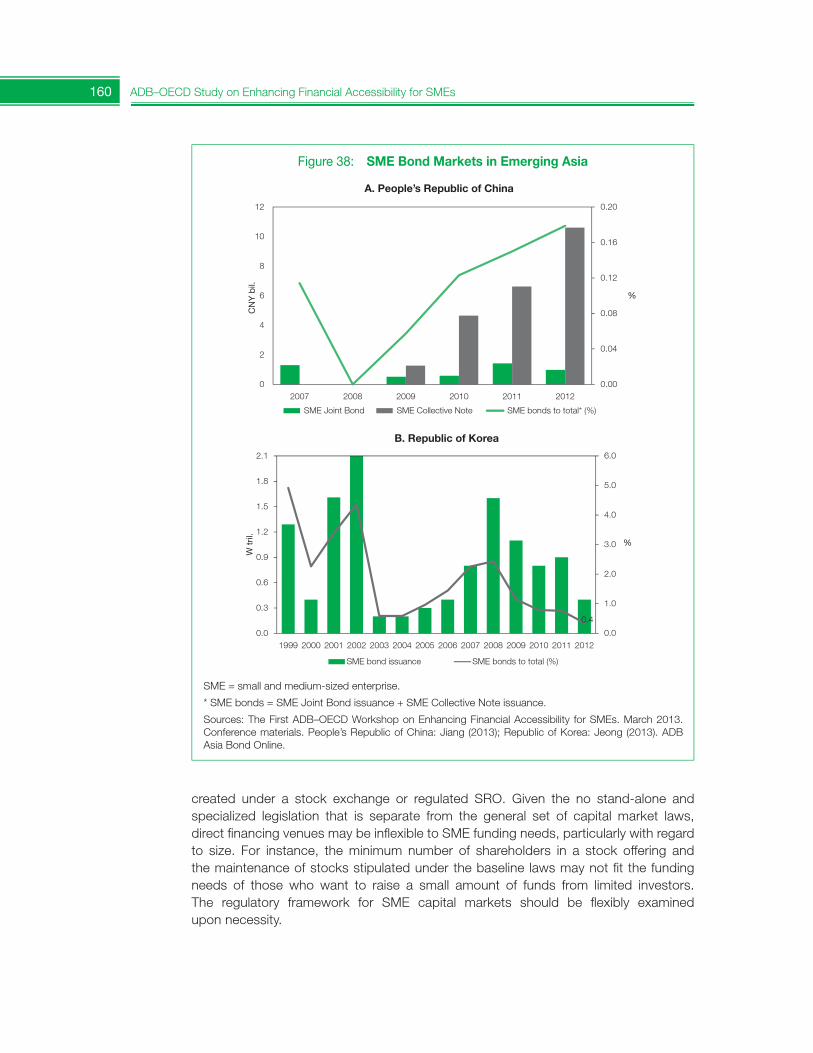
160 ADB–OECD Study on Enhancing Financial Accessibility for SMEs
created under a stock exchange or regulated SRO. Given the no stand-alone and specialized legislation that is separate from the general set of capital market laws,direct financing venues may be inflexible to SME funding needs, particularly with regard to size. For instance, the minimum number of shareholders in a stock offering and the maintenance of stocks stipulated under the baseline laws may not fit the funding needs of those who want to raise a small amount of funds from limited investors.The regulatory framework for SME capital markets should be flexibly examined upon necessity.
Figure 38: SME Bond Markets in Emerging Asia
SME = small and medium-sized enterprise.
* SME bonds = SME Joint Bond issuance + SME Collective Note issuance.
Sources: The First ADB–OECD Workshop on Enhancing Financial Accessibility for SMEs. March 2013. Conference materials. People’s Republic of China: Jiang (2013); Republic of Korea: Jeong (2013). ADB Asia Bond Online.
A. People’s Republic of China
0.4
0.0
1.0
2.0
3.0
4.0
5.0
6.0
0.0
0.3
0.6
0.9
1.2
1.5
1.8
2.1
1999 2000 2001 2002 2003 2004 2005 2006 2007 2008 2009 2010 2011 2012
SME bond issuance SME bonds to total (%)
0.00
0.04
0.08
0.12
0.16
0.20
0
2
4
6
8
10
12
2007 2008 2009 2010 2011 2012
SME Joint Bond SME Collective Note SME bonds to total* (%)
W t
ril.
%
CN
Y b
il.
%
B. Republic of Korea
0.4
0.0
1.0
2.0
3.0
4.0
5.0
6.0
0.0
0.3
0.6
0.9
1.2
1.5
1.8
2.1
1999 2000 2001 2002 2003 2004 2005 2006 2007 2008 2009 2010 2011 2012
SME bond issuance SME bonds to total (%)
0.00
0.04
0.08
0.12
0.16
0.20
0
2
4
6
8
10
12
2007 2008 2009 2010 2011 2012
SME Joint Bond SME Collective Note SME bonds to total* (%)
W t
ril.
%
CN
Y b
il.
%
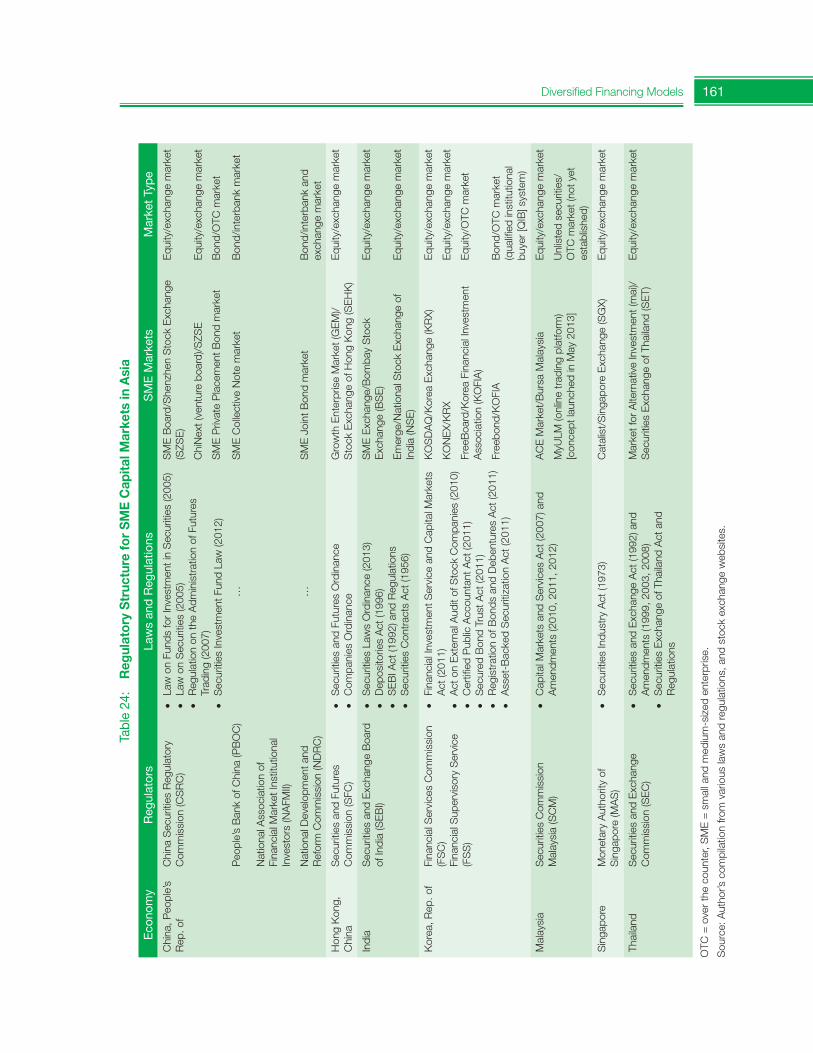
161Diversified Financing Models
Tabl
e 24
: R
egul
ator
y S
truc
ture
for
SM
E C
apita
l Mar
kets
in A
sia
Econo
my
Reg
ulat
ors
Law
s an
d R
egul
atio
nsS
ME
Mar
kets
MarketType
Chi
na, P
eopl
e’s
Rep. of
Chi
na S
ecur
ities
Reg
ulat
ory
Com
mis
sion
(CS
RC
)• Law on Funds for Investment in Securities (2005)
• Law on Securities (2005)
• Regulation on the Adm
inistration of Futures
Trad
ing
(200
7)• Securities Investment Fund Law (2012)
SME Board/Shenzhen Stock Exchange
(SZS
E)
Equ
ity/e
xcha
nge
mar
ket
Chi
Nex
t (ve
ntur
e bo
ard)
/SZS
EE
quity
/exc
hang
e m
arke
t
SME Private Placement B
ond market
Bon
d/O
TC m
arke
t
People’s Bank of China (PBOC)
…SME Collective Note market
Bon
d/in
terb
ank
mar
ket
National Association of
Financial M
arket Institutional
Investors (NAFM
II)
Nat
iona
l Dev
elop
men
t and
Reform Com
mission (N
DRC)
…SME Joint Bond market
Bon
d/in
terb
ank
and
exch
ange
mar
ket
Hon
g K
ong,
C
hina
Sec
uriti
es a
nd F
utur
es
Com
mis
sion
(SFC
)•
Sec
uriti
es a
nd F
utur
es O
rdin
ance
• C
ompa
nies
Ord
inan
ceGrowth Enterprise Market (GEM)/
Stock Exchange of Hong Kong (SEHK)
Equ
ity/e
xcha
nge
mar
ket
Indi
aS
ecur
ities
and
Exc
hang
e B
oard
of India (SEBI)
• Securities Law
s Ordinance (2013)
• D
epos
itorie
s A
ct (1
996)
• S
EB
I Act
(199
2) a
nd R
egul
atio
ns•
Sec
uriti
es C
ontr
acts
Act
(195
6)
SME Exchange/Bom
bay Stock
Exc
hang
e (B
SE
)E
quity
/exc
hang
e m
arke
t
Emerge/National Stock Exchange of
Indi
a (N
SE
)E
quity
/exc
hang
e m
arke
t
Korea, R
ep. of
Fina
ncia
l Ser
vice
s C
omm
issi
on
(FS
C)
Fina
ncia
l Sup
ervi
sory
Ser
vice
(F
SS
)
• Financial Investment S
ervice and Capital M
arkets
Act
(201
1)• Act on External Audit of Stock Com
panies (2010)
• Certified Public Accountant A
ct (2011)
• S
ecur
ed B
ond
Trus
t Act
(201
1)• Registration of Bonds and Debentures Act (2011)
• A
sset
-Bac
ked
Sec
uriti
zatio
n A
ct (2
011)
KO
SD
AQ
/Kor
ea E
xcha
nge
(KR
X)E
quity
/exc
hang
e m
arke
t
KO
NE
X/K
RX
Equ
ity/e
xcha
nge
mar
ket
Free
Boa
rd/K
orea
Fin
anci
al In
vest
men
t A
ssoc
iatio
n (K
OFI
A)
Equ
ity/O
TC m
arke
t
Free
bond
/KO
FIA
B
ond/
OTC
mar
ket
(qualified institutional
buye
r [Q
IB] s
yste
m)
Malaysia
Sec
uriti
es C
omm
issi
on
Malaysia (SCM)
• Capital M
arkets and Services Act (2007) and
Am
endm
ents
(201
0, 2
011,
201
2)ACE Market/Bursa Malaysia
Equ
ity/e
xcha
nge
mar
ket
MyULM
(online trading platform)
[concept launched in May 2013]
Unlisted securities/
OTC
mar
ket (
not y
et
esta
blis
hed)
Sin
gapo
reMonetary Authority of
Singapore (M
AS)
• S
ecur
ities
Indu
stry
Act
(197
3)Catalist/Singapore Exchange (SGX)
Equ
ity/e
xcha
nge
mar
ket
Thai
land
Sec
uriti
es a
nd E
xcha
nge
Com
mis
sion
(SE
C)
• S
ecur
ities
and
Exc
hang
e A
ct (1
992)
and
A
men
dmen
ts (1
999,
200
3, 2
008)
• Securities Exchange of Thailand Act and
Reg
ulat
ions
Market for Alternative Investment (mai)/
Securities Exchange of Thailand (SET)
Equ
ity/e
xcha
nge
mar
ket
OTC
= over the counter, SME = small and medium-sized enterprise.
Source: Author’s com
pilation from various laws and regulations, and stock exchange websites.
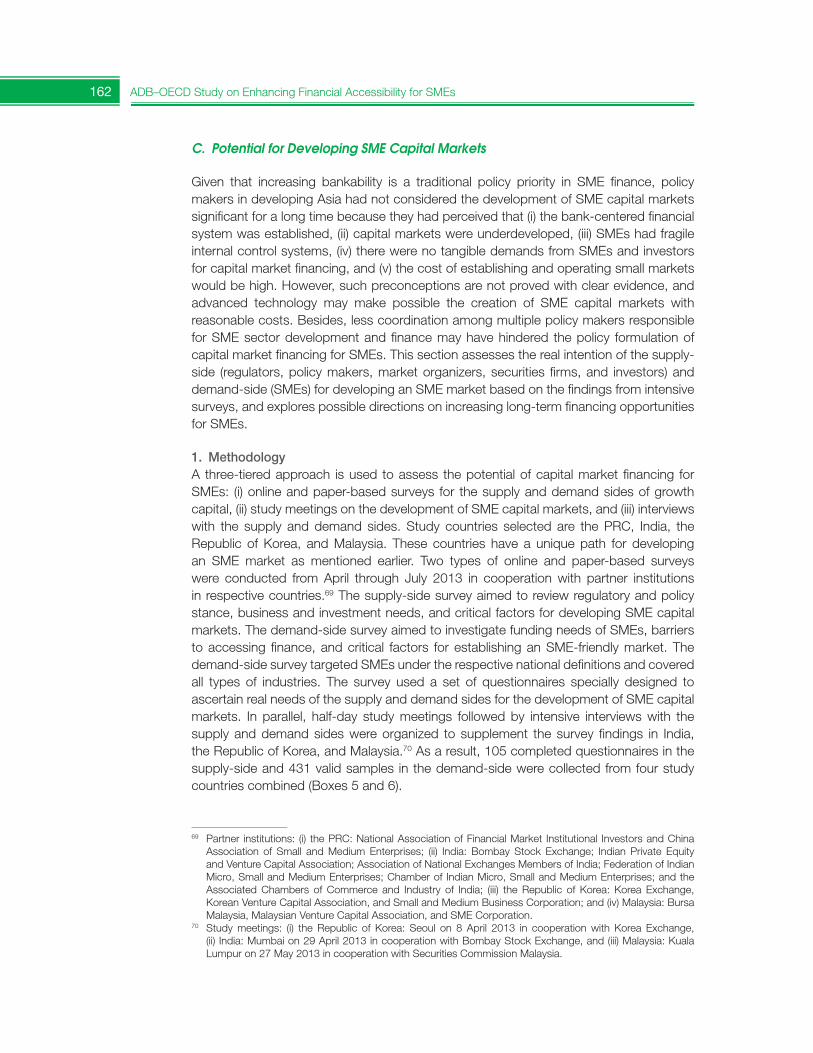
162 ADB–OECD Study on Enhancing Financial Accessibility for SMEs
C. Potential for Developing SME Capital Markets
Given that increasing bankability is a traditional policy priority in SME finance, policy makers in developing Asia had not considered the development of SME capital markets significant for a long time because they had perceived that (i) the bank-centered financial system was established, (ii) capital markets were underdeveloped, (iii) SMEs had fragile internal control systems, (iv) there were no tangible demands from SMEs and investors for capital market financing, and (v) the cost of establishing and operating small markets would be high. However, such preconceptions are not proved with clear evidence, and advanced technology may make possible the creation of SME capital markets with reasonable costs. Besides, less coordination among multiple policy makers responsible for SME sector development and finance may have hindered the policy formulation of capital market financing for SMEs. This section assesses the real intention of the supply-side (regulators, policy makers, market organizers, securities firms, and investors) and demand-side (SMEs) for developing an SME market based on the findings from intensive surveys, and explores possible directions on increasing long-term financing opportunitiesfor SMEs.
1. MethodologyA three-tiered approach is used to assess the potential of capital market financing forSMEs: (i) online and paper-based surveys for the supply and demand sides of growth capital, (ii) study meetings on the development of SME capital markets, and (iii) interviews with the supply and demand sides. Study countries selected are the PRC, India, the Republic of Korea, and Malaysia. These countries have a unique path for developing an SME market as mentioned earlier. Two types of online and paper-based surveys were conducted from April through July 2013 in cooperation with partner institutionsin respective countries.69 The supply-side survey aimed to review regulatory and policy stance, business and investment needs, and critical factors for developing SME capital markets. The demand-side survey aimed to investigate funding needs of SMEs, barriersto accessing finance, and critical factors for establishing an SME-friendly market. The demand-side survey targeted SMEs under the respective national definitions and covered all types of industries. The survey used a set of questionnaires specially designed to ascertain real needs of the supply and demand sides for the development of SME capital markets. In parallel, half-day study meetings followed by intensive interviews with the supply and demand sides were organized to supplement the survey findings in India,the Republic of Korea, and Malaysia.70 As a result, 105 completed questionnaires in the supply-side and 431 valid samples in the demand-side were collected from four study countries combined (Boxes 5 and 6).
69 Partner institutions: (i) the PRC: National Association of Financial Market Institutional Investors and China Association of Small and Medium Enterprises; (ii) India: Bombay Stock Exchange; Indian Private Equity and Venture Capital Association; Association of National Exchanges Members of India; Federation of Indian Micro, Small and Medium Enterprises; Chamber of Indian Micro, Small and Medium Enterprises; and the Associated Chambers of Commerce and Industry of India; (iii) the Republic of Korea: Korea Exchange, Korean Venture Capital Association, and Small and Medium Business Corporation; and (iv) Malaysia: BursaMalaysia, Malaysian Venture Capital Association, and SME Corporation.
70 Study meetings: (i) the Republic of Korea: Seoul on 8 April 2013 in cooperation with Korea Exchange,(ii) India: Mumbai on 29 April 2013 in cooperation with Bombay Stock Exchange, and (iii) Malaysia: Kuala Lumpur on 27 May 2013 in cooperation with Securities Commission Malaysia.
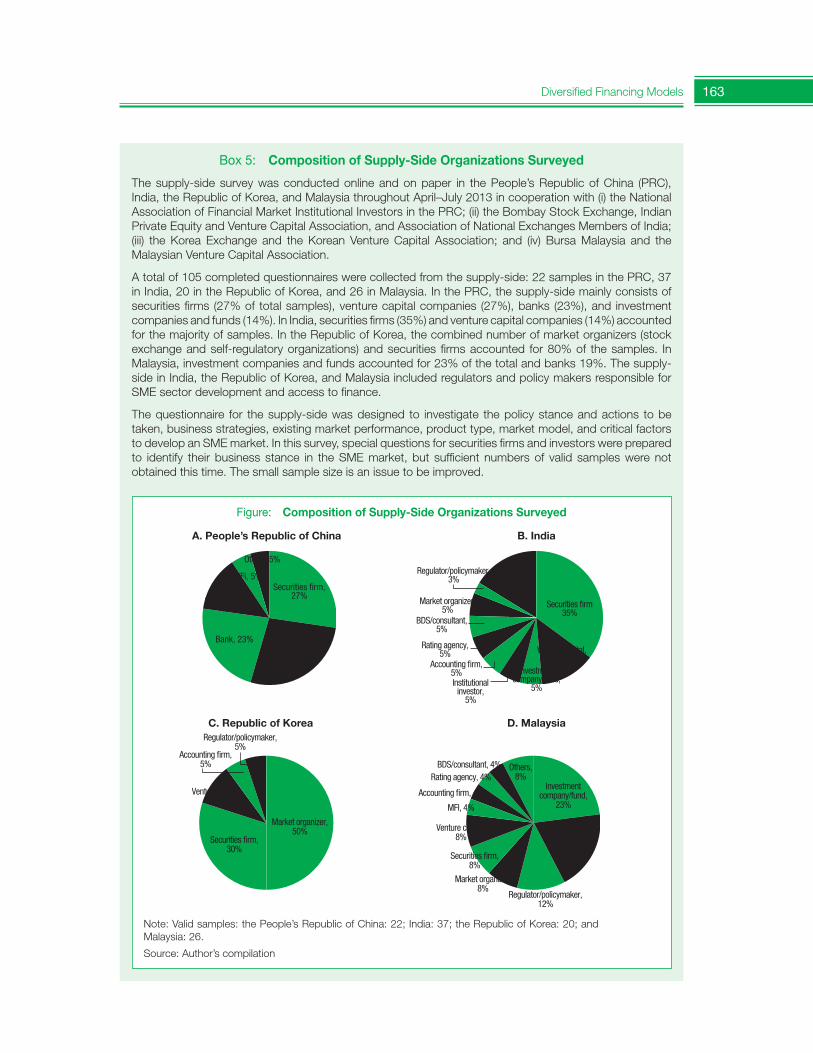
163Diversified Financing Models
Box 5: Composition of Supply-Side Organizations Surveyed
The supply-side survey was conducted online and on paper in the People’s Republic of China (PRC), India, the Republic of Korea, and Malaysia throughout April–July 2013 in cooperation with (i) the National Association of Financial Market Institutional Investors in the PRC; (ii) the Bombay Stock Exchange, Indian Private Equity and Venture Capital Association, and Association of National Exchanges Members of India; (iii) the Korea Exchange and the Korean Venture Capital Association; and (iv) Bursa Malaysia and the Malaysian Venture Capital Association.
A total of 105 completed questionnaires were collected from the supply-side: 22 samples in the PRC, 37 in India, 20 in the Republic of Korea, and 26 in Malaysia. In the PRC, the supply-side mainly consists of securities firms (27% of total samples), venture capital companies (27%), banks (23%), and investment companies and funds (14%). In India, securities firms (35%) and venture capital companies (14%) accounted for the majority of samples. In the Republic of Korea, the combined number of market organizers (stock exchange and self-regulatory organizations) and securities firms accounted for 80% of the samples. In Malaysia, investment companies and funds accounted for 23% of the total and banks 19%. The supply-side in India, the Republic of Korea, and Malaysia included regulators and policy makers responsible for SME sector development and access to finance.
The questionnaire for the supply-side was designed to investigate the policy stance and actions to be taken, business strategies, existing market performance, product type, market model, and critical factors to develop an SME market. In this survey, special questions for securities firms and investors were prepared to identify their business stance in the SME market, but sufficient numbers of valid samples were not obtained this time. The small sample size is an issue to be improved.
Figure: Composition of Supply-Side Organizations Surveyed
Note: Valid samples: the People’s Republic of China: 22; India: 37; the Republic of Korea: 20; and Malaysia: 26.
Source: Author’s compilation
MFI, 5%
Investmentcompany/fund
14%
Bank, 23%Venture capital,
27%
Securities firm,27%
Others, 5%
Others, 16%
Venture capital,14%
Investmentcompany/fund,
5%Institutionalinvestor,
5%
Accounting firm,5%
Rating agency,5%
BDS/consultant,5%
Market organizer,5%
Regulator/policymaker,3%
Securities firm35%
Market organizer,50%
Regulator/policymaker,5%
Accounting firm,5%
Venture capital,10%
Securities firm,30%
Investmentcompany/fund,
23%
Bank,19%
Regulator/policymaker,12%
Market organizer,8%
Securities firm,8%
Venture capital,8%
MFI, 4%
Accounting firm, 4%
Rating agency, 4%BDS/consultant, 4% Others,
8%
A. People’s Republic of China B. India
C. Republic of Korea D. Malaysia

164 ADB–OECD Study on Enhancing Financial Accessibility for SMEs
Box 6: Profile of SMEs Surveyed
The demand-side survey was conducted online and on paper in the People’s Republic of China (PRC), India, the Republic of Korea, and Malaysia throughout April–July 2013 in cooperation with (i) the China Association of Small and Medium Enterprises; (ii) the Federation of Indian Micro, Small and Medium Enterprises; Chamber of Indian Micro, Small and Medium Enterprises; and the Associated Chambers of Commerce and Industry of India; (iii) the Korean Venture Capital Association and Small and Medium Business Corporation; and (iv) SME Corporation in Malaysia. In the PRC, the survey was conducted in cooperation with the China Association of Small and Medium Enterprises at the China SME Investment and Financing Expo held in Beijing on 13–15 July 2013. A total of 431 completed questionnaires were collected from the demand-side: 303 from the PRC, 40 from India, 28 from the Republic of Korea, and 60 from Malaysia.
The survey referred to the national definition of SMEs in each country. In the PRC, SMEs surveyed were mainly from the following sectors: service (47% of total samples), manufacturing (15%), construction and real estate (12%), trade (10%), agriculture (7%), and transportation and telecommunication (4%); 45% of the sampled SMEs were located in Beijing; 50% were firms operating for 10 years or less; and 54% were firms having 100 employees or less.
In India, SMEs surveyed were mainly from the following sectors: service (38% of total samples), manufacturing (30%), trade (10%), transportation and telecommunication (5%), construction and real estate (3%), and agriculture (3%); 73% of the sampled SMEs were located outside of large cities (New Delhi and Mumbai); 73% were firms operating for 10 years or less; and 93% were firms having 100 employees or less.
In the Republic of Korea, SMEs surveyed were mainly from the following sectors: manufacturing (71% of total samples), service (11%), transportation and telecommunication (7%), and construction and real estate (4%); 86% of the sampled SMEs were located outside of Seoul; 61% were firms operating for 10 years or less; and 93% were firms having 100 employees or less.
In Malaysia, SMEs surveyed were mainly from the following sectors: service (38% of total samples), agriculture (33%), trade (10%), manufacturing (8%), and construction and real estate (5%); 78% of the sampled SMEs were located outside of Kuala Lumpur; 52% were firms operating for 10 years or less; and 80% were firms having 100 employees or less.
At the time of survey, business conditions of SMEs surveyed were generally good as compared to 6 months prior in study countries. In the PRC, India, and Malaysia, the majority of sampled SMEs were bigger than they had been 6 months prior.
The questionnaire for the demand-side was designed to investigate business conditions, funding instruments, obstacles to accessing finance, demands on capital market financing, and factors critical to developing an SME market. Similar to the supply-side survey, the small sample size is an issue to be improved.
continued on next page
2. Supply-Side Analysisa. Policy Stance on SME Capital MarketsMore than 80% of the supply-side respondents in respective study countries have recognized that developing an SME capital market is a policy priority at the national level (Figure 39). There were three dimensions of perception behind their answers: (i) awareness of the underserved segment, i.e., SMEs, in the capital market; (ii) increased roles of capital markets as part of national growth strategies; and (iii) limitations of traditional bank-centered finance systems. Around 80% of the respondents in each country answered that potentialdemands on SMEs for long-term financing increase as Asia’s growth is continuously driving the global economy and that SME growth is accelerated further through directly providing growth capital for SMEs, which contributes to resilient national economies. Moreover, they identified that the limitations of bank financing for SMEs require diverse financing models, which is an SME capital market. Their answers for the development of SME markets are likely to be constructed from a long-term strategic point of view.
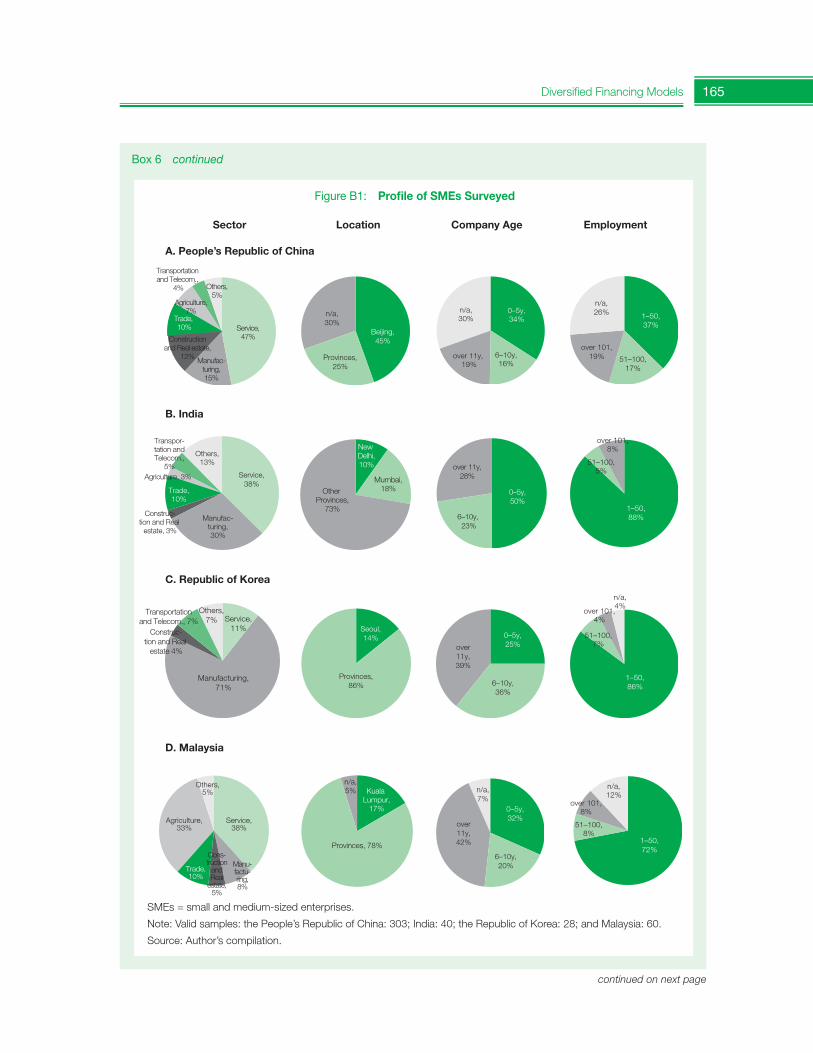
165Diversified Financing Models
0–5y,34%
n/a,30%
over 11y, 19%
6–10y,16%
n/a,30%
Beijing,45%
Provinces,25%
Service,47%
Others,5%
Agriculture,7%
Trade, 10%
Transportation and Telecom.,
4%
Constructionand Real estate,
12% Manufac-turing,15%
0–5y,25%over
11y,39%
6–10y,36%
Provinces,86%
Seoul,14%
Manufacturing,71%
Construc-tion and Real
estate 4%
Transportationand Telecom., 7%
Others,7% Service,
11%
over 11y,28%
6–10y, 23%
0–5y,50%
New Delhi,10%
Mumbai,18%Other
Provinces,73%
Service,38%
Others,13%
Manufac-turing,30%
Trade,10%
Agriculture, 3%
Transpor-tation andTelecom.,
5%
Construc-tion and Real
estate, 3%
n/a,7%
0–5y,32%
6–10y,20%
over11y,42%
n/a,5%
Provinces, 78%
Kuala Lumpur,
17%
Others,5%
Agriculture,33%
Trade,10%
Cons-truction
andReal
estate,5%
Manu-factu-ring,8%
Service,38%
1–50,37%
51–100,17%
over 101,19%
n/a,26%
1–50,88%
51–100,5%
over 101,8%
1–50,86%
51–100,7%
over 101,4%
n/a,4%
1–50,72%
51–100,8%
over 101,8%
n/a,12%
Figure B1: Profile of SMEs Surveyed
SMEs = small and medium-sized enterprises.
Note: Valid samples: the People’s Republic of China: 303; India: 40; the Republic of Korea: 28; and Malaysia: 60.
Source: Author’s compilation.
A. People’s Republic of China
B. India
C. Republic of Korea
D. Malaysia
Sector Location Company Age Employment
Box 6 continued
continued on next page
166 ADB–OECD Study on Enhancing Financial Accessibility for SMEs
Figure B2: Business Conditions of SMEs Surveyed
SMEs = small and medium-sized enterprises; FI = financial institution.
Note: Valid samples: the People’s Republic of China: 303; India: 40; the Republic of Korea: 28; and Malaysia: 60.
Source: Author’s compilation.
A. People’s Republic of China B. India
C. Republic of Korea D. Malaysia
Box 6 continued
0% 20% 40% 60%
Business environment good
Financial condition good
Employees increased
Business expansion
Funding for business easy
Borrowing from FI easy
Loan rate decreased
yes somewhat yesyes somewhat yes
60%0% 20% 40%
Business environment good
Financial condition good
Employees increased
Business expansion
Funding for business easy
Borrowing from FI easy
Loan rate decreased
yes somewhat yesyes somewhat yes
0% 20% 40% 60%
Business environment good
Financial condition good
Employees increased
Business expansion
Funding for business easy
Borrowing from FI easy
Loan rate decreased
yes somewhat yesyes somewhat yes
0% 20% 40% 60% 80%
Business environment good
Financial condition good
Employees increased
Business expansion
Funding for business easy
Borrowing from FI easy
Loan rate decreased
yes somewhat yesyes somewhat yes
b. Policy Actions to be TakenThere are several policy options and approaches to stimulate SME capital markets at thenational level. The respondents ranked necessary measures to develop an SME market, with different priorities from country to country (Figure 40). On the whole, however, all study countries considered it necessary to have a comprehensive policy framework for SME access to capital markets. Policy measures to develop an investor base for an SME market and promoting market literacy for SMEs and investors are the most important actions to be taken by the government to realize a functional market. In the PRC, the establishment of SME financial and nonfinancial databases, including an SME white paper, ranked top as a necessary policy support area for SME markets with transparency. In India, policy measures to build the base of professionals that support SMEs in capital markets, e.g., disclosure support by consultants and certified public accountants, ranked first as needed actions for active SME markets.

167Diversified Financing Models
Figure 39: Is Developing Capital Markets for SMEs a Policy Priority?
0% 20% 40% 60% 80% 100%
yes somewhat yes
China, People's Rep. of
India
Korea, Rep. of
Malaysia
(Reasons)
A. People’s Republic of China B. India
0% 20% 40% 60% 80%
Demands on SMEsincreased
Limits of bank financingfor SMEs requireA precautionary
measure against crisesSME growth accelerated
through providinggrowth capital
100%
yes somewhat yes
0% 20% 40% 60% 80%
Demands on SMEsincreased
Limits of bank financingfor SMEs requireA precautionary
measure against crisesSME growth accelerated
through providinggrowth capital
100%
yes somewhat yes
C. Republic of Korea D. Malaysia
0% 20% 40% 60% 80%
Demandson SMEs increased
Limits of bank financingfor SMEs requireA precautionary
measure against crisesSME growth accelerated
through providinggrowth capital
100%
yes somewhat yes
0% 20% 40% 60% 80%
Demands on SMEsincreased
Limits of bank financingfor SMEs requireA precautionary
measure against crisesSME growth accelerated
through providinggrowth capital
100%
yes somewhat yes
SME = small and medium-sized enterprise.
Note: Valid samples: the People’s Republic of China: 22; India: 37; the Republic of Korea: 20; and Malaysia: 26.
Source: Author’s compilation.
c. Performance of SME Capital MarketsAnswers from four countries on the growth potential of SME markets somewhat corresponded to the actual performance of existing SME markets. While the PRC respondents expected continuous growth of SME markets (SME Board and ChiNext under the Shenzhen Stock Exchange) considering the strong appetite of SMEs for growth capital, Malaysia had a cautious view of the growth of the existing capital market that SMEs could tap (ACE/Bursa Malaysia) considering the unpopularity of the market, with market information not well disseminated among SMEs (Figure 41). The Republic of Korea also tended to have a cautious view of the growth of SME markets, still concerned about the aftermath of the global financial crisis and possible economic shocks. India had a neutral stance on the growth potential of existing SME platforms (Bombay and national stock exchanges) because their markets were relatively new and might be vulnerable in times of economic uncertainty.
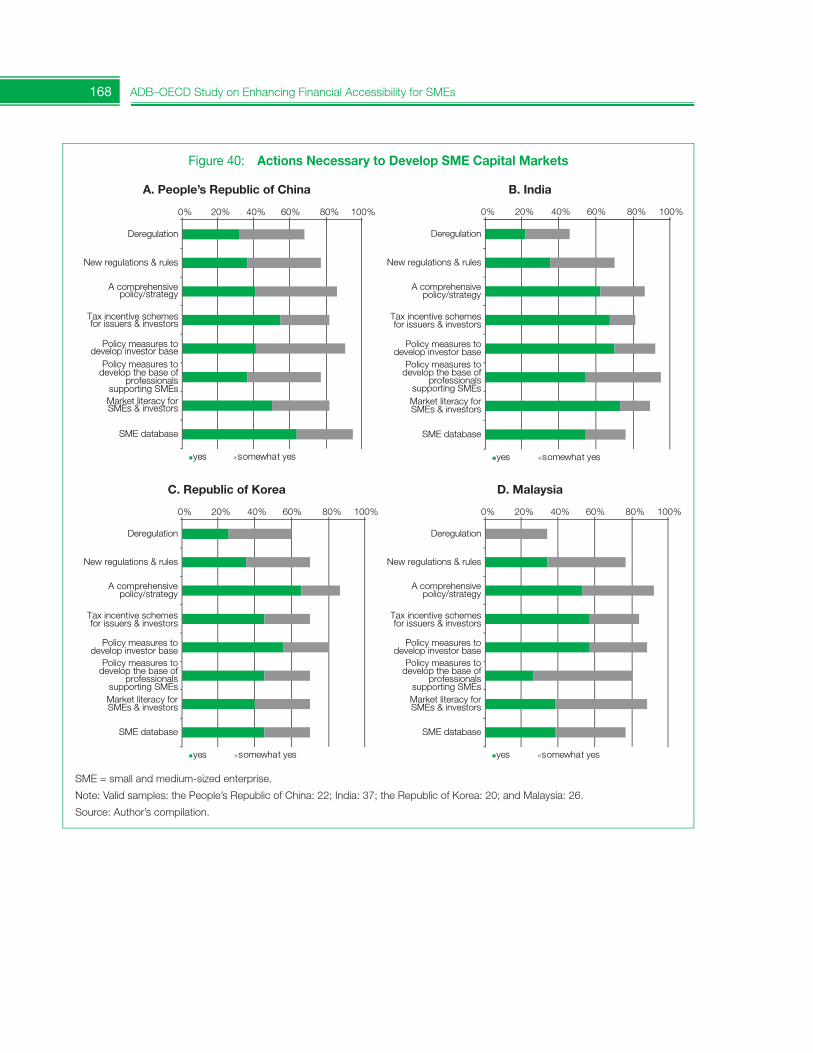
168 ADB–OECD Study on Enhancing Financial Accessibility for SMEs
Figure 40: Actions Necessary to Develop SME Capital Markets
A. People’s Republic of China B. India
0% 20% 40% 60% 80% 100%
yes somewhat yes
New regulations & rules
Deregulation
A comprehensivepolicy/strategy
Tax incentive schemesfor issuers & investors
Policy measures todevelop investor base
Policy measures todevelop the base of
professionalssupporting SMEsMarket literacy forSMEs & investors
SME database
C. Republic of Korea D. Malaysia
0% 20% 40% 60% 80% 100%
yes somewhat yes
New regulations & rules
Deregulation
A comprehensivepolicy/strategy
Tax incentive schemesfor issuers & investors
Policy measures todevelop investor base
Policy measures todevelop the base of
professionalssupporting SMEsMarket literacy forSMEs & investors
SME database
SME = small and medium-sized enterprise.
Note: Valid samples: the People’s Republic of China: 22; India: 37; the Republic of Korea: 20; and Malaysia: 26.
Source: Author’s compilation.
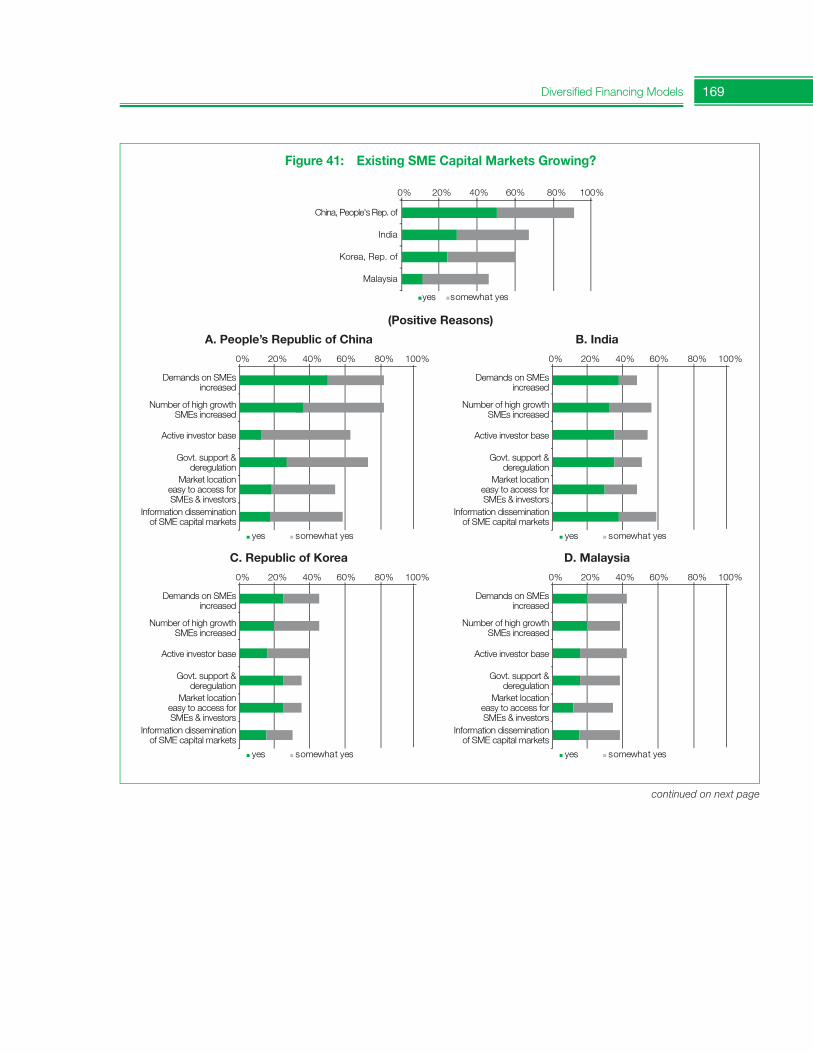
169Diversified Financing Models
Figure 41: Existing SME Capital Markets Growing?
0% 20% 40% 60% 80% 100%
yes somewhat yes
China, People's Rep. of
India
Korea, Rep. of
Malaysia
(Positive Reasons)
A. People’s Republic of China B. India
0% 20% 40% 60% 80% 100%
yes somewhat yes
Number of high growthSMEs increased
Demands on SMEsincreased
Active investor base
Govt. support &deregulation
Market locationeasy to access forSMEs & investors
Information disseminationof SME capital markets
0% 20% 40% 60% 80% 100%
yes somewhat yes
Number of high growthSMEs increased
Demands on SMEsincreased
Active investor base
Govt. support &deregulation
Market locationeasy to access forSMEs & investors
Information disseminationof SME capital markets
C. Republic of Korea D. Malaysia
0% 20% 40% 60% 80% 100%
yes somewhat yes
Number of high growthSMEs increased
Demands on SMEsincreased
Active investor base
Govt. support &deregulation
Market locationeasy to access forSMEs & investors
Information disseminationof SME capital markets
0% 20% 40% 60% 80% 100%
yes somewhat yes
Number of high growthSMEs increased
Demands on SMEsincreased
Active investor base
Govt. support &deregulation
Market locationeasy to access forSMEs & investors
Information disseminationof SME capital markets
continued on next page
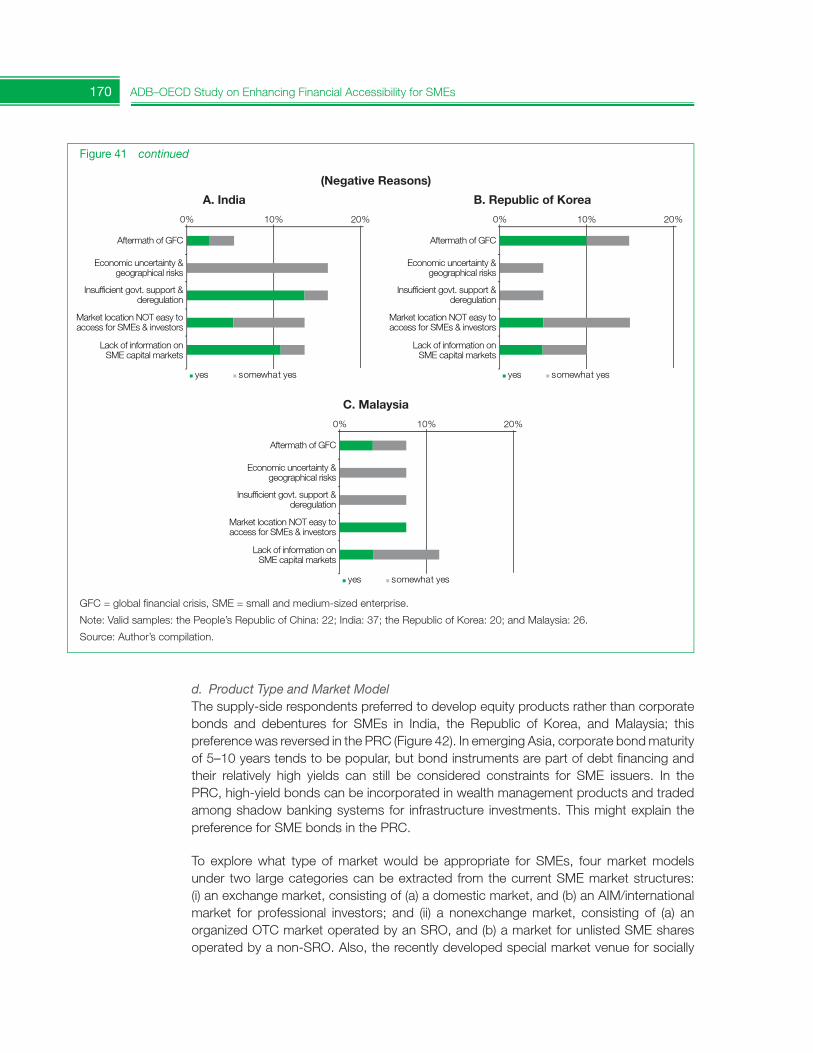
170 ADB–OECD Study on Enhancing Financial Accessibility for SMEs
d. Product Type and Market ModelThe supply-side respondents preferred to develop equity products rather than corporate bonds and debentures for SMEs in India, the Republic of Korea, and Malaysia; this preference was reversed in the PRC (Figure 42). In emerging Asia, corporate bond maturityof 5–10 years tends to be popular, but bond instruments are part of debt financing and their relatively high yields can still be considered constraints for SME issuers. In the PRC, high-yield bonds can be incorporated in wealth management products and traded among shadow banking systems for infrastructure investments. This might explain the preference for SME bonds in the PRC.
To explore what type of market would be appropriate for SMEs, four market models under two large categories can be extracted from the current SME market structures: (i) an exchange market, consisting of (a) a domestic market, and (b) an AIM/international market for professional investors; and (ii) a nonexchange market, consisting of (a) an organized OTC market operated by an SRO, and (b) a market for unlisted SME shares operated by a non-SRO. Also, the recently developed special market venue for socially
Figure 41 continued
(Negative Reasons)
A. India B. Republic of Korea
0% 10% 20%
yes somewhat yes
Economic uncertainty &geographical risks
Aftermath of GFC
Insufficient govt. support &deregulation
Market location NOT easy toaccess for SMEs & investors
Lack of information onSME capital markets
0% 10% 20%
yes somewhat yes
Economic uncertainty &geographical risks
Aftermath of GFC
Insufficient govt. support &deregulation
Market location NOT easy toaccess for SMEs & investors
Lack of information onSME capital markets
C. Malaysia
0% 10% 20%
yes somewhat yes
Economic uncertainty &geographical risks
Aftermath of GFC
Insufficient govt. support &deregulation
Market location NOT easy toaccess for SMEs & investors
Lack of information onSME capital markets
GFC = global financial crisis, SME = small and medium-sized enterprise.
Note: Valid samples: the People’s Republic of China: 22; India: 37; the Republic of Korea: 20; and Malaysia: 26.
Source: Author’s compilation.

171Diversified Financing Models
Figure 42: What Type of Product is Appropriate for SMEs?
SME = small and medium-sized enterprise.
Note: Valid samples: the People’s Republic of China: 22; India: 37; the Republic of Korea: 20; and Malaysia: 26.
Source: Author’s compilation.
0% 20% 40% 60% 80% 100%
Equity
Bond
China, People's Rep. of IndiaKorea, Rep. of Malaysia
oriented firms, called a social capital market (see section D), which could be classified in either exchange or nonexchange market, was added in the brainstorming for new SME capital market models.
There were two split opinions among country respondents (Table 25). In the PRC, India, and the Republic of Korea around 70% of the respondents preferred the development of a domestic exchange market as an appropriate capital market venue for SMEs, while around 30%–40% stated that a nonexchange market represented by a non-SRO-operated market, and a specialized market for socially oriented firms, was an inappropriatemarket venue for SMEs. They generally felt that the exchange market has a cost-efficient structure because there were established trading platforms to be utilized for SMEs under the stock exchange and a relatively well-organized risk-conscious mechanism with transparency backed by laws and regulations. They had concerns about there being no potential investor base for the non-SRO-operated SME market outside of the stockexchange’s control and the social capital market.
Conversely, around 65% of the respondents in Malaysia preferred the development of a nonexchange and non-SRO-operated market for SMEs, while the remainder indicated that the domestic exchange market was inappropriate for them. They mainly expected the non-SRO-operated market for unlisted SMEs to be a preparatory market before they accessed the regular market of stock exchange. In Malaysia, the ACE market under Bursa Malaysia has not been performing well for a long time in terms of market capitalization and the number of listed companies. In May 2013, the Securities Commission Malaysia announced a plan for creating a new trading venue for start-ups and SMEs, separate from the exchange market, named MyULM (Malaysia Unlisted Market), a private-led marketsupervised by the commission. The respondents in Malaysia considered that, even ifthe exchange market provides preferential measures for SMEs, such as lowering listing criteria and fees, the lack of SME ability to tap capital markets, especially in complying
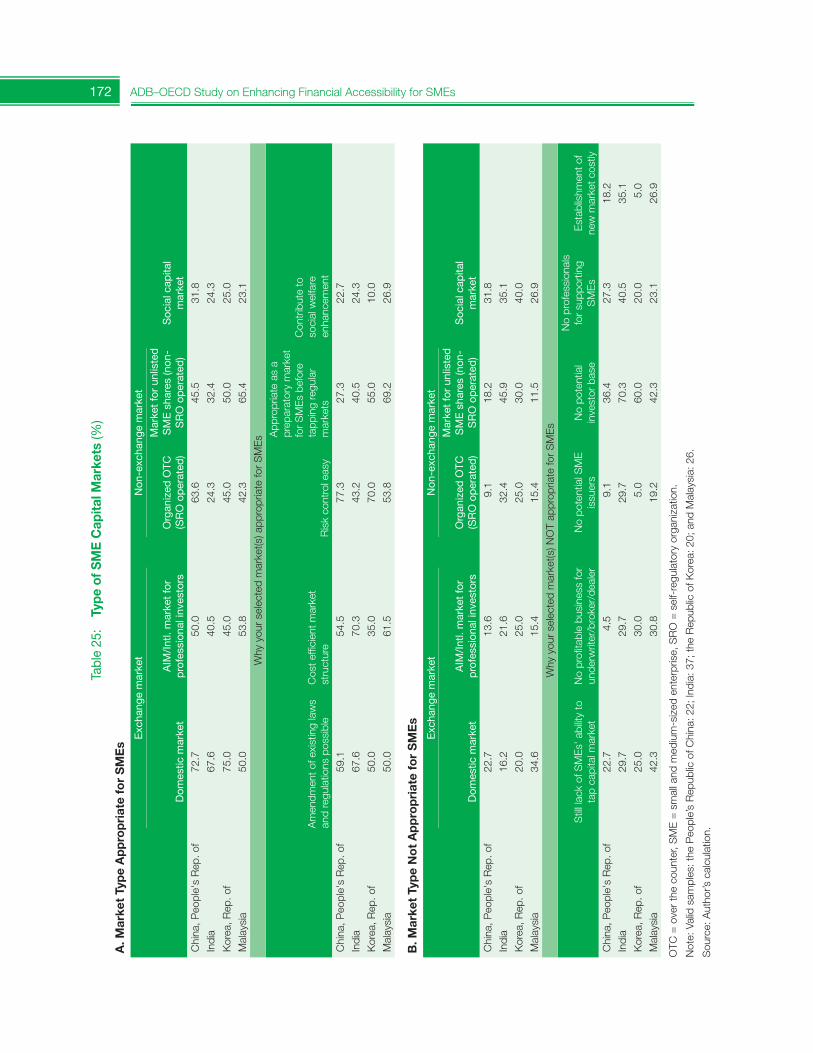
172 ADB–OECD Study on Enhancing Financial Accessibility for SMEsTa
ble
25:
Type
of S
ME
Cap
ital M
arke
ts (%
)
A. M
arke
t Ty
pe
Ap
pro
pri
ate
for
SM
Es
Exc
hang
e m
arke
tNon
-exchang
emarket
Soc
ial c
apita
l m
arke
tD
omes
tic m
arke
tA
IM/I
ntl.
mar
ket
for
pro
fess
iona
l inv
esto
rsO
rgan
ized
OTC
(S
RO
op
erat
ed)
Mar
ket
for
unlis
ted
SMEshares(non
-S
RO
op
erat
ed)
China, People's Rep. of
72.7
50.0
63.6
45.5
31.8
Indi
a67
.640
.524
.332
.424
.3
Korea, R
ep. of
75.0
45.0
45.0
50.0
25.0
Malaysia
50.0
53.8
42.3
65.4
23.1
Why your selected market(s) appropriate for SMEs
Amendm
ent of existing laws
and
regu
latio
ns p
ossi
ble
Cost efficient m
arket
stru
ctur
eR
isk
cont
rol e
asy
App
ropr
iate
as
a pr
epar
ator
y m
arke
t for SMEs before
tapp
ing
regu
lar
mar
kets
Con
trib
ute
to
social welfare
enha
ncem
ent
China, People's Rep. of
59.1
54.5
77.3
27.3
22.7
Indi
a67
.670
.343
.240
.524
.3Korea, R
ep. of
50.0
35.0
70.0
55.0
10.0
Malaysia
50.0
61.5
53.8
69.2
26.9
B. M
arke
t Ty
pe
No
t A
pp
rop
riat
e fo
r S
ME
s
Exc
hang
e m
arke
tNon
-exchang
emarket
Soc
ial c
apita
l m
arke
tD
omes
tic m
arke
tA
IM/I
ntl.
mar
ket
for
pro
fess
iona
l inv
esto
rsO
rgan
ized
OTC
(S
RO
op
erat
ed)
Mar
ket
for
unlis
ted
SMEshares(non
-S
RO
op
erat
ed)
China, People's Rep. of
22.7
13.6
9.1
18.2
31.8
Indi
a16
.221
.632
.445
.935
.1Korea, R
ep. of
20.0
25.0
25.0
30.0
40.0
Malaysia
34.6
15.4
15.4
11.5
26.9
Why your selected market(s) N
OT appropriate for SMEs
Still lack of SMEs' ability to
tap
capi
tal m
arke
tNo profitable business for
unde
rwrit
er/b
roke
r/de
aler
No potential SME
issu
ers
No
pote
ntia
l in
vest
or b
ase
No professionals
for supporting
SMEs
Establishm
ent of
new
mar
ket c
ostly
China, People's Rep. of
22.7
4.5
9.1
36.4
27.3
18.2
Indi
a29
.729
.729
.770
.340
.535
.1Korea, R
ep. of
25.0
30.0
5.0
60.0
20.0
5.0
Malaysia
42.3
30.8
19.2
42.3
23.1
26.9
OTC
= over the counter, SME = small and medium-sized enterprise, SRO = self-regulatory organization.
Note: Valid sam
ples: the People’s Republic of C
hina: 22; India: 37; the Republic of Korea: 20; and Malaysia: 26.
Source: Author’s calculation.
173Diversified Financing Models
with disclosure requirements, is still a critical barrier to establishing an SME market. They also considered that a private preparatory market is needed to foster the base of potential SMEs that eventually move to the exchange market.
e. Critical Factors Needed to Create an SME MarketFigure 43 shows the comparison of critical factors needed to create an SME market between the supply and demand sides. In every study country, there was a gap between the priority actions of both sides to establishing a functional SME market. In the PRC, the supply-side, mainly comprising securities firms and venture capital firms, indicated that the top three priorities were (i) a well-established regulatory and supervisory framework, (ii) a mechanism that supports SMEs in preparing disclosure documents, and (iii) simplified listing procedures. These actions ranked eighth, sixth, and third in the demand-side. The top three priorities for SMEs were (i) raising funds speedily, (ii) the small amount of funding available, and (iii) simplified listing procedures, while these ranked eighth, fifth, and third inthe supply-side. Only the third priority was shared between both sides.
In India, the top three priorities in the supply-side were (i) raising funds speedily for SMEs, (ii) simplified listing procedures, and (iii) information dissemination of SME capital markets, while these ranked fourth, third, and 10th in the demand-side. The top three in the demand-side were (i) simplified disclosure requirements, (ii) low cost for listing and maintenance, and (iii) simplified listing procedures, and these ranked 10th, fifth, and second in the supply-side. The item of simplified listing procedures was shared betweenboth sides among the top three issues.
In the Republic of Korea, the top three priorities in the supply-side were (i) simplified listing procedures, (ii) low cost for listing and maintenance for SMEs, and (iii) low cost for establishing and operating an SME market, and these top two issues ranked sixth and fifth in the demand-side. The top three in the demand-side were (i) a well-established regulatory and supervisory framework, (ii) tax incentive schemes for issuers and investors, and (iii) simplified disclosure requirements, and these ranked sixth, seventh, and ninth in the supply-side.
In Malaysia, the top three priorities in the supply-side were (i) tax incentive schemes for issuers and investors, (ii) low cost for establishing and operating an SME market, and (iii) raising funds speedily for SMEs, and the first and the third issues ranked fifth and fourth in the demand-side. The top three in the demand-side were (i) simplified listing procedures, (ii) simplified disclosure requirements, and (iii) low cost for listing and maintenance, and these ranked ninth, 11th, and seventh in the supply-side.
The critical factors needed to create an SME market vary among countries because of different circumstances regarding SME financing and capital markets. However, these findings suggest a common issue in priority actions between the supply and demand sides, i.e., actions to reduce the cost burden for SMEs to tap capital markets. The cost issue is often touched upon when establishing an SME market because the market size is typically anticipated to be small in scale. As indicated in Table 25, on the whole, country respondents tended not to see the establishment cost as a critical barrier to a new market if it is needed. However, the cost issue is crucial for creating a sustainable market venue for SMEs. Given that governments regard an SME market as part of national growth
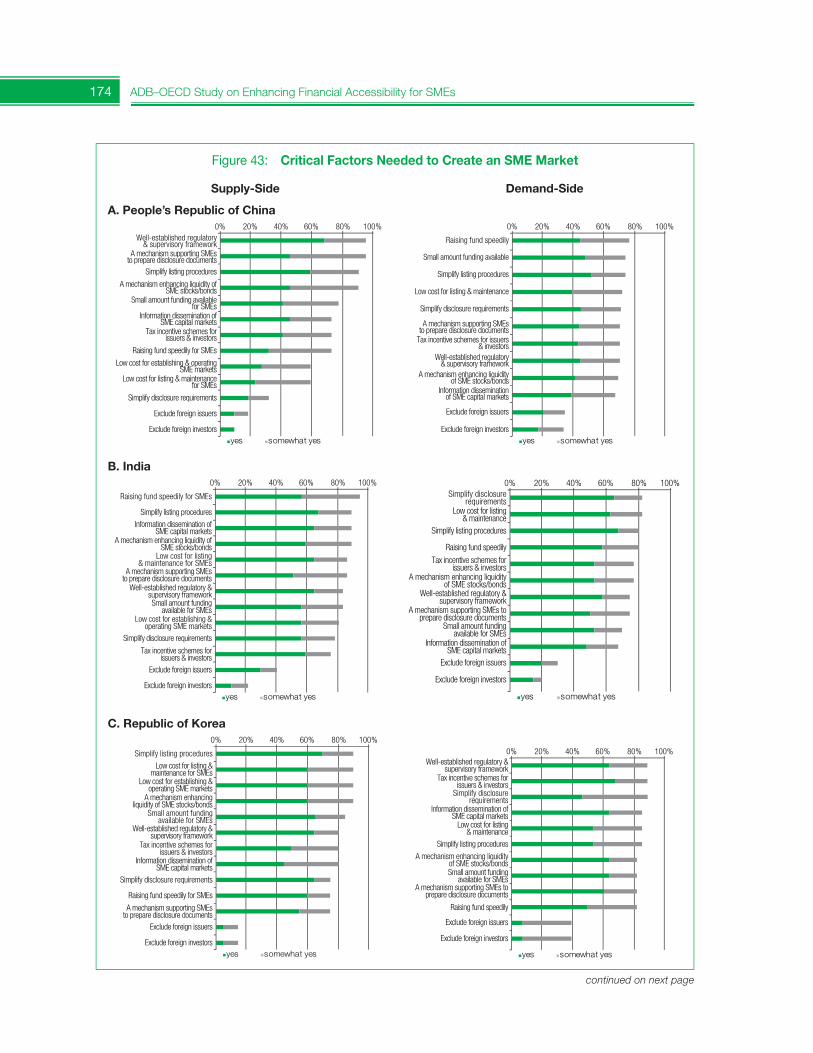
174 ADB–OECD Study on Enhancing Financial Accessibility for SMEs
Figure 43: Critical Factors Needed to Create an SME Market
Supply-Side
A. People’s Republic of China
B. India
C. Republic of Korea
Demand-Side
0% 20% 40% 60% 80% 100%
yes somewhat yes
Raising fund speedily
Small amount funding available
Simplify listing procedures
Low cost for listing & maintenance
Simplify disclosure requirements
A mechanism supporting SMEsto prepare disclosure documents
Tax incentive schemes for issuers& investors
Well-established regulatory& supervisory framework
A mechanism enhancing liquidityof SME stocks/bonds
Information disseminationof SME capital markets
Exclude foreign issuers
Exclude foreign investors
0% 20% 40% 60% 80% 100%
yes somewhat yes
Well-established regulatory& supervisory framework
A mechanism supporting SMEsto prepare disclosure documents
Simplify listing procedures
A mechanism enhancing liquidity ofSME stocks/bonds
Small amount funding availablefor SMEs
Information dissemination ofSME capital markets
Tax incentive schemes forissuers & investors
Raising fund speedily for SMEs
Low cost for establishing & operatingSME markets
Low cost for listing & maintenancefor SMEs
Simplify disclosure requirements
Exclude foreign issuers
Exclude foreign investors
0% 20% 40% 60% 80% 100%
yes somewhat yes
Raising fund speedily for SMEs
Simplify listing procedures
Information dissemination ofSME capital markets
A mechanism enhancing liquidity ofSME stocks/bonds
Low cost for listing& maintenance for SMEs
A mechanism supporting SMEsto prepare disclosure documents
Well-established regulatory &supervisory frameworkSmall amount funding
available for SMEsLow cost for establishing &
operating SME markets
Simplify disclosure requirements
Tax incentive schemes forissuers & investors
Exclude foreign issuers
Exclude foreign investors
0% 20% 40% 60% 80% 100%
yes somewhat yes
Simplify disclosurerequirements
Low cost for listing& maintenance
Simplify listing procedures
Raising fund speedily
Tax incentive schemes forissuers & investors
A mechanism enhancing liquidityof SME stocks/bonds
Well-established regulatory &supervisory framework
A mechanism supporting SMEs toprepare disclosure documents
Small amount fundingavailable for SMEs
Information dissemination ofSME capital markets
Exclude foreign issuers
Exclude foreign investors
0% 20% 40% 60% 80% 100%
yes somewhat yes
Well-established regulatory &supervisory framework
Tax incentive schemes forissuers & investors
Simplify disclosurerequirements
Information dissemination ofSME capital markets
Low cost for listing& maintenance
Simplify listing procedures
A mechanism enhancing liquidityof SME stocks/bondsSmall amount funding
available for SMEsA mechanism supporting SMEs to
prepare disclosure documents
Raising fund speedily
Exclude foreign issuers
Exclude foreign investors
0% 20% 40% 60% 80% 100%
yes somewhat yes
Simplify listing procedures
Low cost for listing &maintenance for SMEs
Low cost for establishing &operating SME markets
A mechanism enhancingliquidity of SME stocks/bonds
Small amount fundingavailable for SMEs
Well-established regulatory &supervisory framework
Tax incentive schemes forissuers & investors
Information dissemination ofSME capital markets
Simplify disclosure requirements
Raising fund speedily for SMEs
A mechanism supporting SMEsto prepare disclosure documents
Exclude foreign issuers
Exclude foreign investors
continued on next page
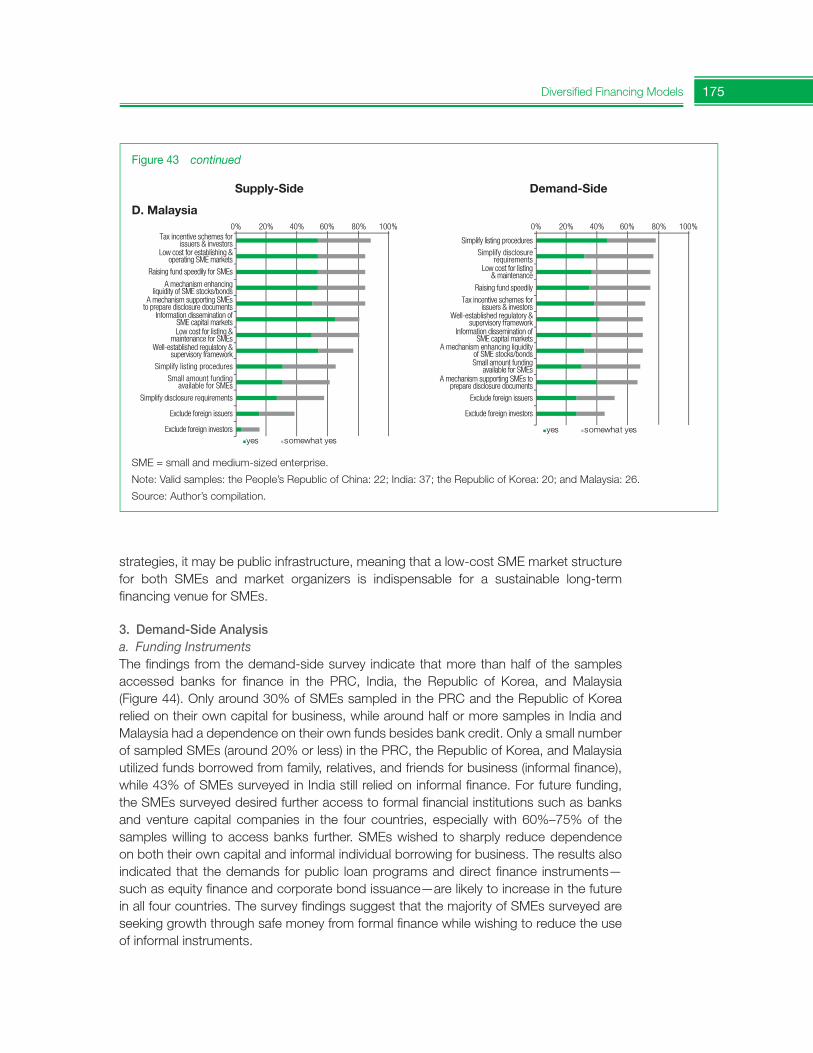
175Diversified Financing Models
Supply-Side
D. Malaysia
Demand-Side
Figure 43 continued
0% 20% 40% 60% 80% 100%
yes somewhat yes
Simplify listing procedures
Simplify disclosurerequirements
Low cost for listing& maintenance
Raising fund speedily
Tax incentive schemes forissuers & investors
Well-established regulatory &supervisory framework
Information dissemination ofSME capital markets
A mechanism enhancing liquidityof SME stocks/bondsSmall amount funding
available for SMEsA mechanism supporting SMEs to
prepare disclosure documents
Exclude foreign issuers
Exclude foreign investors
0% 20% 40% 60% 80% 100%
yes somewhat yes
Tax incentive schemes forissuers & investors
Low cost for establishing &operating SME markets
Raising fund speedily for SMEs
A mechanism enhancingliquidity of SME stocks/bonds
A mechanism supporting SMEsto prepare disclosure documents
Information dissemination ofSME capital marketsLow cost for listing &
maintenance for SMEsWell-established regulatory &
supervisory framework
Simplify listing procedures
Small amount fundingavailable for SMEs
Simplify disclosure requirements
Exclude foreign issuers
Exclude foreign investors
SME = small and medium-sized enterprise.
Note: Valid samples: the People’s Republic of China: 22; India: 37; the Republic of Korea: 20; and Malaysia: 26.
Source: Author’s compilation.
strategies, it may be public infrastructure, meaning that a low-cost SME market structure for both SMEs and market organizers is indispensable for a sustainable long-term financing venue for SMEs.
3. Demand-Side Analysisa. Funding InstrumentsThe findings from the demand-side survey indicate that more than half of the samples accessed banks for finance in the PRC, India, the Republic of Korea, and Malaysia (Figure 44). Only around 30% of SMEs sampled in the PRC and the Republic of Korea relied on their own capital for business, while around half or more samples in India and Malaysia had a dependence on their own funds besides bank credit. Only a small number of sampled SMEs (around 20% or less) in the PRC, the Republic of Korea, and Malaysia utilized funds borrowed from family, relatives, and friends for business (informal finance), while 43% of SMEs surveyed in India still relied on informal finance. For future funding, the SMEs surveyed desired further access to formal financial institutions such as banks and venture capital companies in the four countries, especially with 60%–75% of the samples willing to access banks further. SMEs wished to sharply reduce dependence on both their own capital and informal individual borrowing for business. The results also indicated that the demands for public loan programs and direct finance instruments—such as equity finance and corporate bond issuance—are likely to increase in the future in all four countries. The survey findings suggest that the majority of SMEs surveyed are seeking growth through safe money from formal finance while wishing to reduce the use of informal instruments.
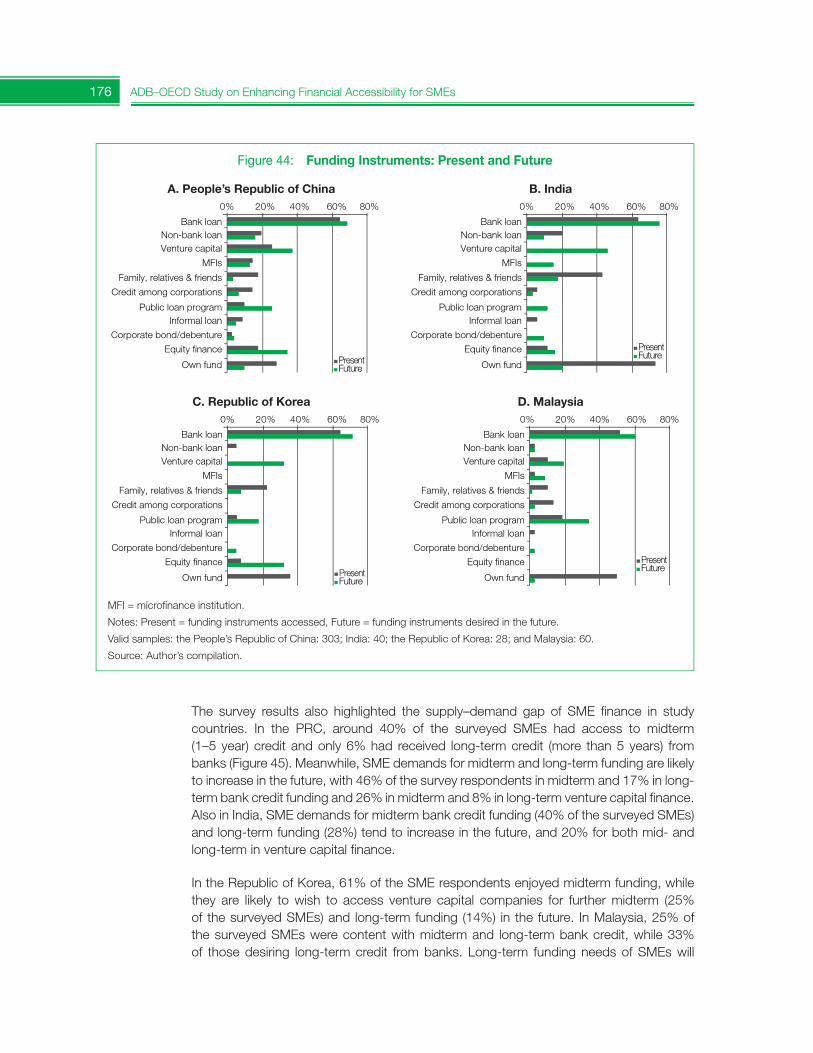
176 ADB–OECD Study on Enhancing Financial Accessibility for SMEs
Figure 44: Funding Instruments: Present and Future
A. People’s Republic of China B. India
C. Republic of Korea D. Malaysia
Public loan program
Bank loan
Venture capitalNon-bank loan
Family, relatives & friends
Credit among corporations
Informal loan
MFIs
0% 20% 40% 60% 80%
PresentFuture
Corporate bond/debenture
Equity finance
Own fund
Public loan program
Bank loan
Venture capitalNon-bank loan
Family, relatives & friends
Credit among corporations
Informal loan
MFIs
0% 20% 40% 60% 80%
PresentFuture
Corporate bond/debenture
Equity finance
Own fund
Public loan program
Bank loan
Venture capitalNon-bank loan
Family, relatives & friends
Credit among corporations
Informal loan
MFIs
0% 20% 40% 60% 80%
PresentFuture
Corporate bond/debenture
Equity finance
Own fund
Public loan program
Bank loan
Venture capitalNon-bank loan
Family, relatives & friends
Credit among corporations
Informal loan
MFIs
0% 20% 40% 60% 80%
PresentFuture
Corporate bond/debenture
Equity finance
Own fund
MFI = microfinance institution.
Notes: Present = funding instruments accessed, Future = funding instruments desired in the future.
Valid samples: the People’s Republic of China: 303; India: 40; the Republic of Korea: 28; and Malaysia: 60.
Source: Author’s compilation.
The survey results also highlighted the supply–demand gap of SME finance in studycountries. In the PRC, around 40% of the surveyed SMEs had access to midterm (1–5 year) credit and only 6% had received long-term credit (more than 5 years) from banks (Figure 45). Meanwhile, SME demands for midterm and long-term funding are likely to increase in the future, with 46% of the survey respondents in midterm and 17% in long-term bank credit funding and 26% in midterm and 8% in long-term venture capital finance. Also in India, SME demands for midterm bank credit funding (40% of the surveyed SMEs) and long-term funding (28%) tend to increase in the future, and 20% for both mid- and long-term in venture capital finance.
In the Republic of Korea, 61% of the SME respondents enjoyed midterm funding, while they are likely to wish to access venture capital companies for further midterm (25% of the surveyed SMEs) and long-term funding (14%) in the future. In Malaysia, 25% of the surveyed SMEs were content with midterm and long-term bank credit, while 33% of those desiring long-term credit from banks. Long-term funding needs of SMEs will
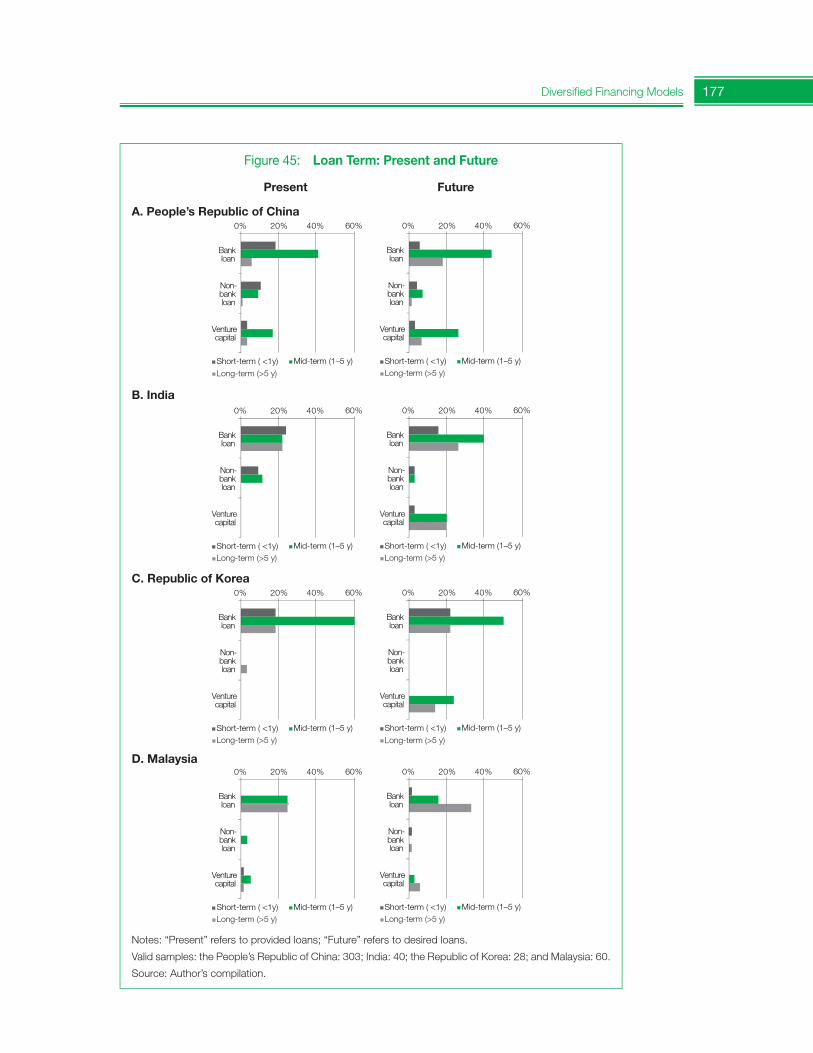
177Diversified Financing Models
Figure 45: Loan Term: Present and Future
FuturePresent
A. People’s Republic of China0% 20% 40%
Bank loan
Non-bank loan
Venture capital
Short-term ( <1y) Long-term (>5 y)
Mid-term (1–5 y)
60% 0% 20% 40%
Bank loan
Non-bank loan
Venture capital
Short-term ( <1y) Long-term (>5 y)
Mid-term (1–5 y)
60%
B. India0% 20% 40%
Bank loan
Non-bank loan
Venture capital
Short-term ( <1y) Long-term (>5 y)
Mid-term (1–5 y)
60% 0% 20% 40%
Bank loan
Non-bank loan
Venture capital
Short-term ( <1y) Long-term (>5 y)
Mid-term (1–5 y)
60%
C. Republic of Korea0% 20% 40%
Bank loan
Non-bank loan
Venture capital
Short-term ( <1y) Long-term (>5 y)
Mid-term (1–5 y)
60% 0% 20% 40%
Bank loan
Non-bank loan
Venture capital
Short-term ( <1y) Long-term (>5 y)
Mid-term (1–5 y)
60%
D. Malaysia0% 20% 40%
Bank loan
Non-bank loan
Venture capital
Short-term ( <1y) Long-term (>5 y)
Mid-term (1–5 y)
60% 0% 20% 40%
Bank loan
Non-bank loan
Venture capital
Short-term ( <1y) Long-term (>5 y)
Mid-term (1–5 y)
60%
Notes: “Present” refers to provided loans; “Future” refers to desired loans.
Valid samples: the People’s Republic of China: 303; India: 40; the Republic of Korea: 28; and Malaysia: 60.
Source: Author’s compilation.
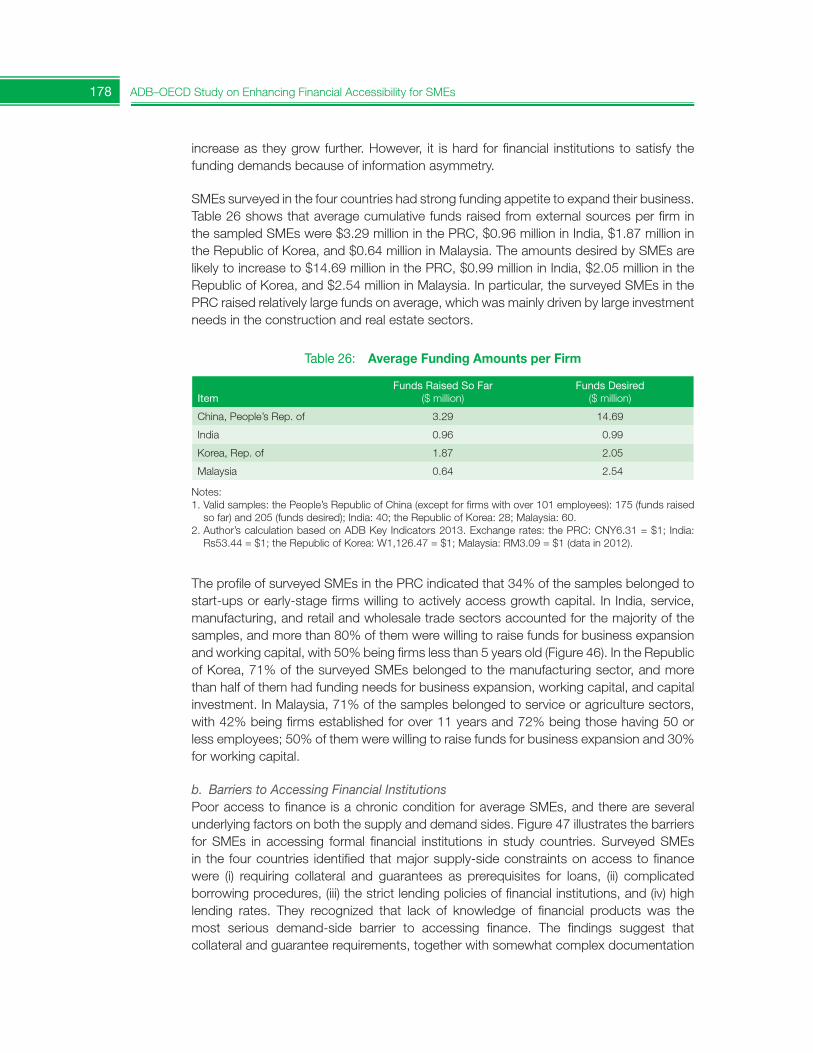
178 ADB–OECD Study on Enhancing Financial Accessibility for SMEs
increase as they grow further. However, it is hard for financial institutions to satisfy the funding demands because of information asymmetry.
SMEs surveyed in the four countries had strong funding appetite to expand their business. Table 26 shows that average cumulative funds raised from external sources per firm in the sampled SMEs were $3.29 million in the PRC, $0.96 million in India, $1.87 million in the Republic of Korea, and $0.64 million in Malaysia. The amounts desired by SMEs are likely to increase to $14.69 million in the PRC, $0.99 million in India, $2.05 million in the Republic of Korea, and $2.54 million in Malaysia. In particular, the surveyed SMEs in the PRC raised relatively large funds on average, which was mainly driven by large investment needs in the construction and real estate sectors.
Table 26: Average Funding Amounts per Firm
ItemFunds Raised So Far
($ million)Funds Desired
($ million)
China, People’s Rep. of 3.29 14.69
India 0.96 0.99
Korea, Rep. of 1.87 2.05
Malaysia 0.64 2.54
Notes: 1. Valid samples: the People’s Republic of China (except for firms with over 101 employees): 175 (funds raised so far) and 205 (funds desired); India: 40; the Republic of Korea: 28; Malaysia: 60.
2. Author’s calculation based on ADB Key Indicators 2013. Exchange rates: the PRC: CNY6.31 = $1; India: Rs53.44 = $1; the Republic of Korea: W1,126.47 = $1; Malaysia: RM3.09 = $1 (data in 2012).
The profile of surveyed SMEs in the PRC indicated that 34% of the samples belonged to start-ups or early-stage firms willing to actively access growth capital. In India, service, manufacturing, and retail and wholesale trade sectors accounted for the majority of the samples, and more than 80% of them were willing to raise funds for business expansion and working capital, with 50% being firms less than 5 years old (Figure 46). In the Republic of Korea, 71% of the surveyed SMEs belonged to the manufacturing sector, and more than half of them had funding needs for business expansion, working capital, and capital investment. In Malaysia, 71% of the samples belonged to service or agriculture sectors, with 42% being firms established for over 11 years and 72% being those having 50 or less employees; 50% of them were willing to raise funds for business expansion and 30% for working capital.
b. Barriers to Accessing Financial InstitutionsPoor access to finance is a chronic condition for average SMEs, and there are several underlying factors on both the supply and demand sides. Figure 47 illustrates the barriers for SMEs in accessing formal financial institutions in study countries. Surveyed SMEs in the four countries identified that major supply-side constraints on access to finance were (i) requiring collateral and guarantees as prerequisites for loans, (ii) complicated borrowing procedures, (iii) the strict lending policies of financial institutions, and (iv) high lending rates. They recognized that lack of knowledge of financial products was the most serious demand-side barrier to accessing finance. The findings suggest that collateral and guarantee requirements, together with somewhat complex documentation
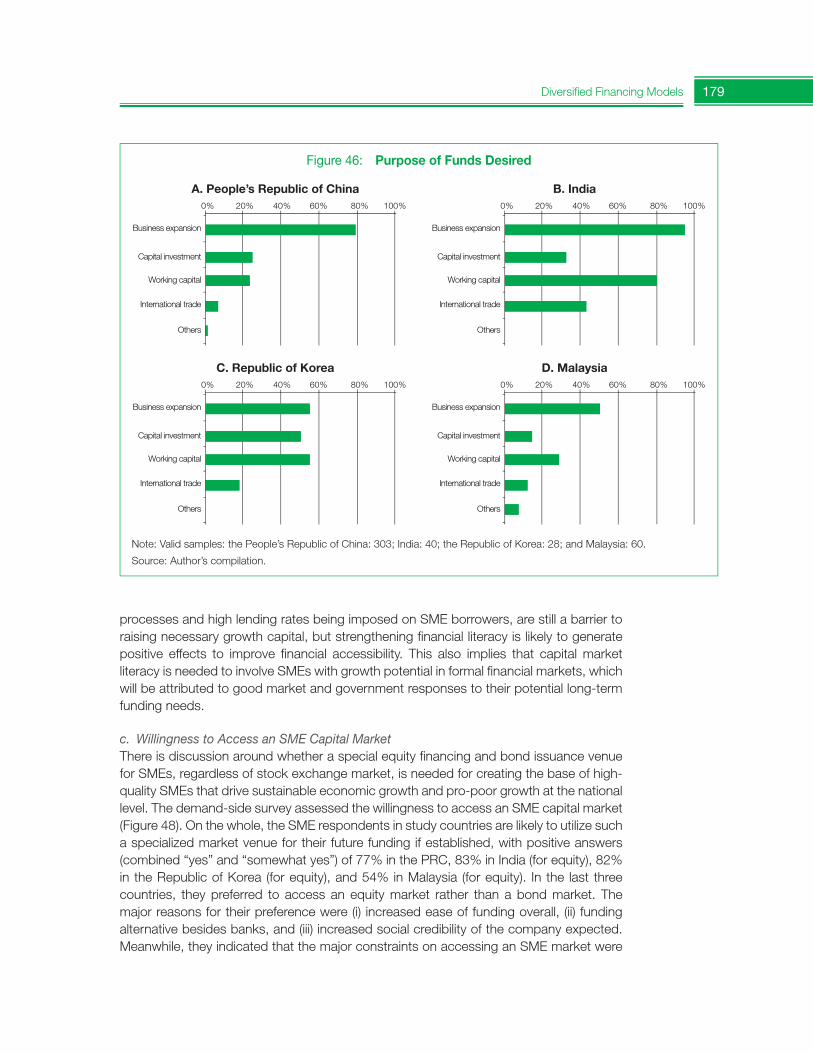
179Diversified Financing Models
processes and high lending rates being imposed on SME borrowers, are still a barrier to raising necessary growth capital, but strengthening financial literacy is likely to generate positive effects to improve financial accessibility. This also implies that capital market literacy is needed to involve SMEs with growth potential in formal financial markets, which will be attributed to good market and government responses to their potential long-term funding needs.
c. Willingness to Access an SME Capital MarketThere is discussion around whether a special equity financing and bond issuance venue for SMEs, regardless of stock exchange market, is needed for creating the base of high-quality SMEs that drive sustainable economic growth and pro-poor growth at the national level. The demand-side survey assessed the willingness to access an SME capital market(Figure 48). On the whole, the SME respondents in study countries are likely to utilize such a specialized market venue for their future funding if established, with positive answers (combined “yes” and “somewhat yes”) of 77% in the PRC, 83% in India (for equity), 82% in the Republic of Korea (for equity), and 54% in Malaysia (for equity). In the last three countries, they preferred to access an equity market rather than a bond market. The major reasons for their preference were (i) increased ease of funding overall, (ii) funding alternative besides banks, and (iii) increased social credibility of the company expected. Meanwhile, they indicated that the major constraints on accessing an SME market were
Figure 46: Purpose of Funds Desired
A. People’s Republic of China B. India
C. Republic of Korea D. Malaysia
Note: Valid samples: the People’s Republic of China: 303; India: 40; the Republic of Korea: 28; and Malaysia: 60.
Source: Author’s compilation.
0% 20% 40% 60% 80%
Business expansion
Capital investment
Working capital
International trade
Others
100% 0% 20% 40% 60% 80%
Business expansion
Capital investment
Working capital
International trade
Others
100%
0% 20% 40% 60% 80%
Business expansion
Capital investment
Working capital
International trade
Others
100% 0% 20% 40% 60% 80%
Business expansion
Capital investment
Working capital
International trade
Others
100%
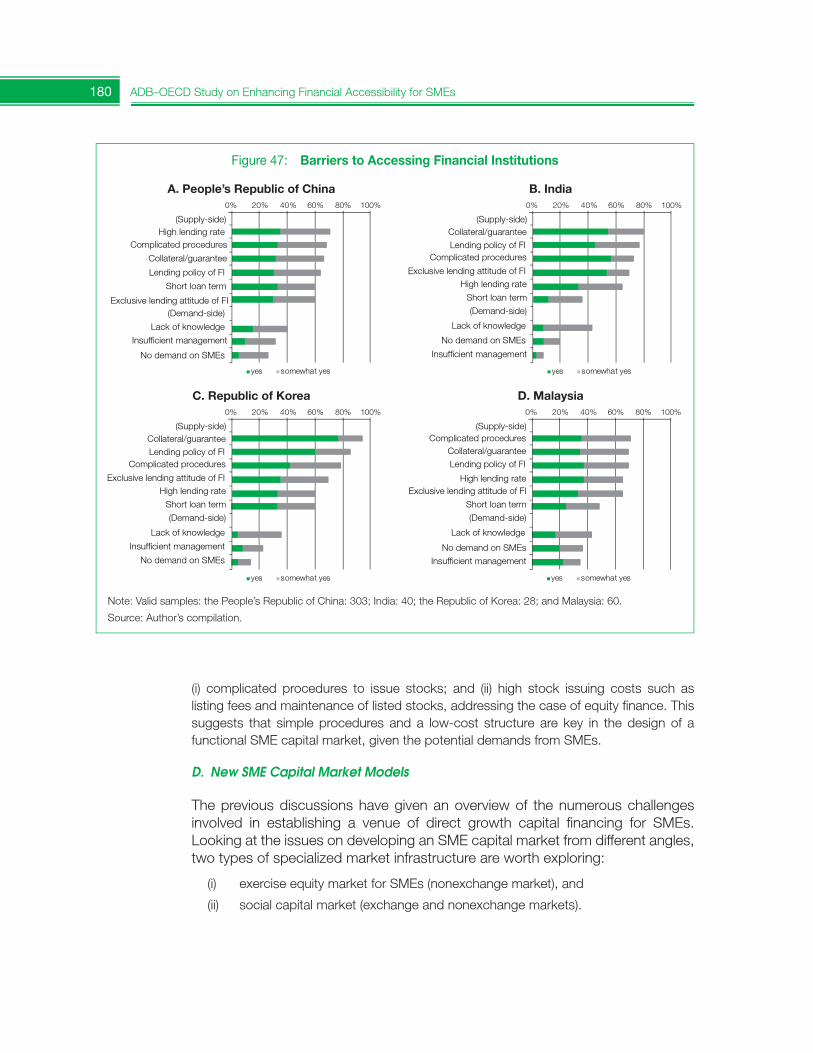
180 ADB–OECD Study on Enhancing Financial Accessibility for SMEs
(i) complicated procedures to issue stocks; and (ii) high stock issuing costs such as listing fees and maintenance of listed stocks, addressing the case of equity finance. This suggests that simple procedures and a low-cost structure are key in the design of a functional SME capital market, given the potential demands from SMEs.
D. New SME Capital Market Models
The previous discussions have given an overview of the numerous challenges involved in establishing a venue of direct growth capital financing for SMEs. Looking at the issues on developing an SME capital market from different angles, two types of specialized market infrastructure are worth exploring:
(i) exercise equity market for SMEs (nonexchange market), and
(ii) social capital market (exchange and nonexchange markets).
Figure 47: Barriers to Accessing Financial Institutions
A. People’s Republic of China B. India
C. Republic of Korea D. Malaysia
Note: Valid samples: the People’s Republic of China: 303; India: 40; the Republic of Korea: 28; and Malaysia: 60.
Source: Author’s compilation.
Exclusive lending attitude of FI
(Supply-side)
Complicated proceduresHigh lending rate
Lending policy of FI
Short loan term
(Demand-side)
Collateral/guarantee
0% 20% 40% 60% 80% 100%
yes somewhat yesyes somewhat yes
Lack of knowledge
Insufficient management
No demand on SMEs
Exclusive lending attitude of FI
(Supply-side)
Complicated procedures
High lending rate
Lending policy of FI
Short loan term(Demand-side)
Collateral/guarantee
0% 20% 40% 60% 80% 100%
yes somewhat yesyes somewhat yes
Lack of knowledge
Insufficient management
No demand on SMEs
Exclusive lending attitude of FI
(Supply-side)
Complicated procedures
High lending rate
Lending policy of FI
Short loan term(Demand-side)
Collateral/guarantee
0% 20% 40% 60% 80% 100%
yes somewhat yesyes somewhat yes
Lack of knowledge
Insufficient management
No demand on SMEs
Exclusive lending attitude of FI
(Supply-side)Complicated procedures
High lending rate
Lending policy of FI
Short loan term(Demand-side)
Collateral/guarantee
0% 20% 40% 60% 80% 100%
yes somewhat yesyes somewhat yes
Lack of knowledge
Insufficient managementNo demand on SMEs
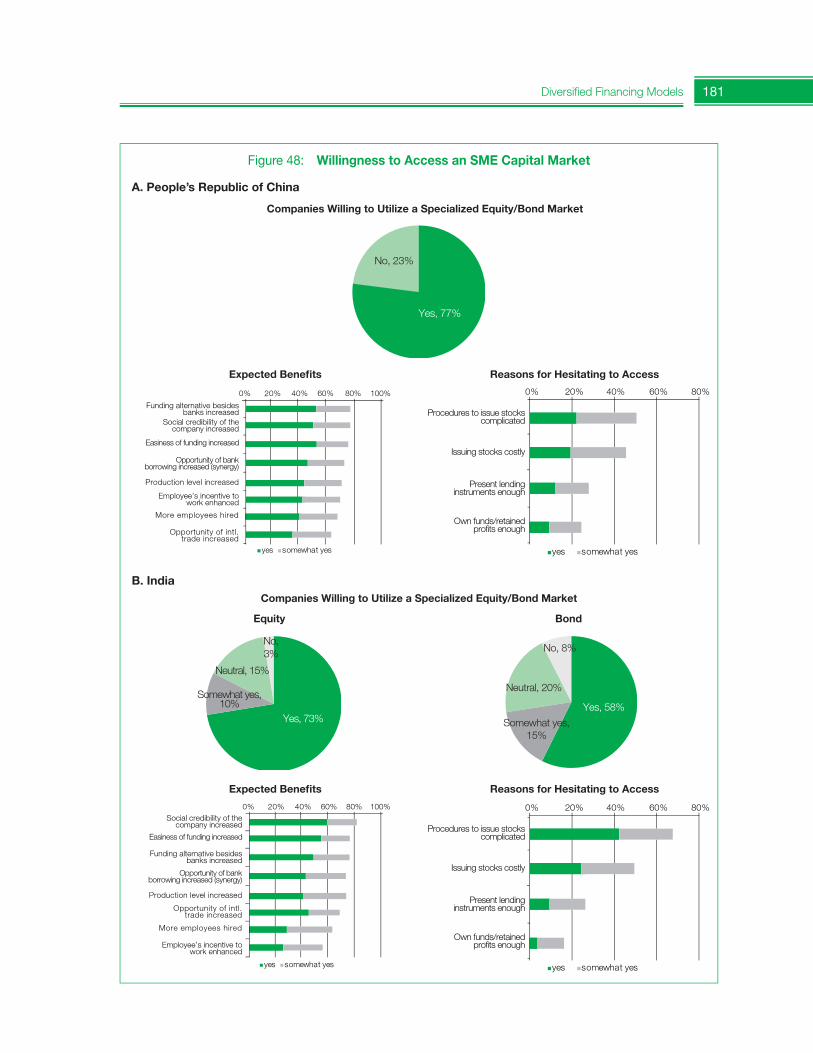
181Diversified Financing Models
Figure 48: Willingness to Access an SME Capital Market
A. People’s Republic of China
Companies Willing to Utilize a Specialized Equity/Bond Market
Expected Benefits Reasons for Hesitating to Access
Expected Benefits Reasons for Hesitating to Access
Companies Willing to Utilize a Specialized Equity/Bond Market
Equity Bond
B. India
No, 23%
Yes, 77%
0% 20% 40% 60% 80% 100%
Opportunity of bankborrowing increased (synergy)
Funding alternative besidesbanks increased
Social credibility of thecompany increased
Easiness of funding increased
Production level increased
Employee’s incentive towork enhanced
More employees hired
Opportunity of intl.trade increased
yes somewhat yesyes somewhat yes
0% 20% 40% 60% 80%
yes somewhat yes
Procedures to issue stockscomplicated
Issuing stocks costly
Present lendinginstruments enough
Own funds/retainedprofits enough
Yes, 58%
No, 8%
Neutral, 20%
Somewhat yes,15%
No,3%
Yes, 73%
Neutral, 15%
Somewhat yes,10%
0% 20% 40% 60% 80% 100%
Opportunity of bankborrowing increased (synergy)
Funding alternative besidesbanks increased
Social credibility of thecompany increased
Easiness of funding increased
Production level increased
Employee’s incentive towork enhanced
More employees hired
Opportunity of intl.trade increased
yes somewhat yesyes somewhat yes
0% 20% 40% 60% 80%
yes somewhat yes
Procedures to issue stockscomplicated
Issuing stocks costly
Present lendinginstruments enough
Own funds/retainedprofits enough
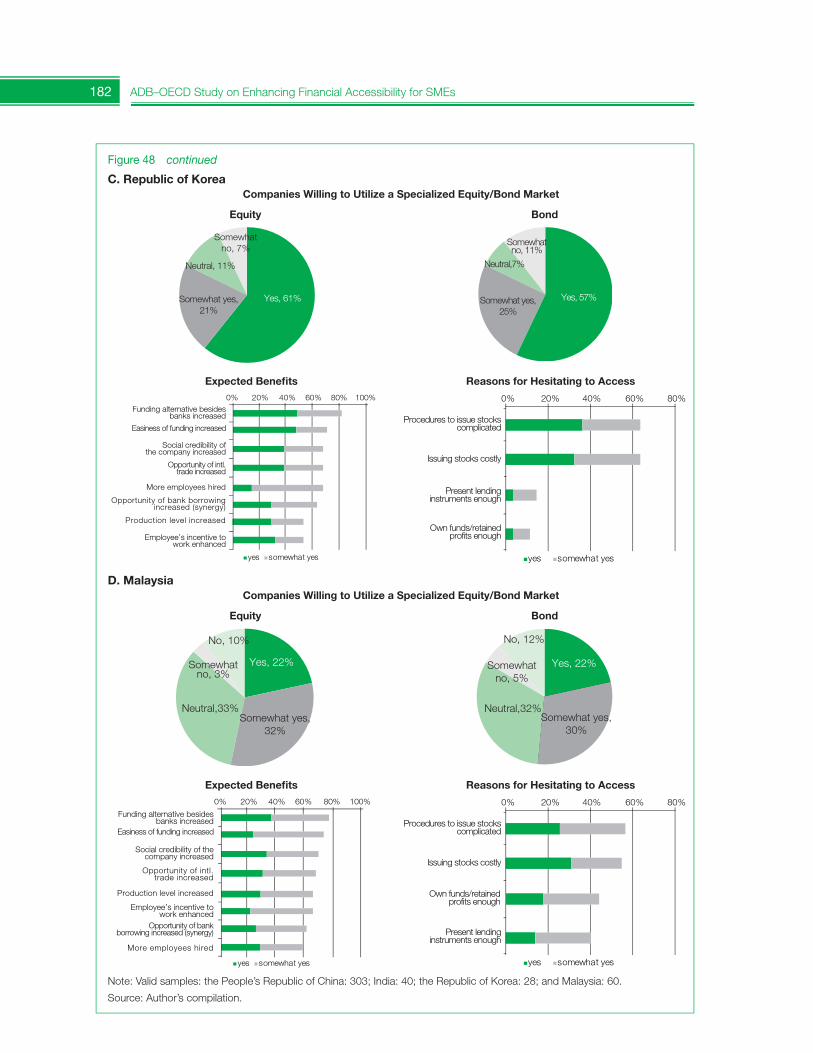
182 ADB–OECD Study on Enhancing Financial Accessibility for SMEs
Figure 48 continued
C. Republic of Korea
D. Malaysia
Companies Willing to Utilize a Specialized Equity/Bond Market
Companies Willing to Utilize a Specialized Equity/Bond Market
Equity
Equity
Bond
Bond
Somewhatno, 11%
Somewhat yes,25%
Neutral,7%
Yes, 57%Yes, 61%Somewhat yes,21%
Neutral, 11%
Somewhatno, 7%
0% 20% 40% 60% 80% 100%
Opportunity of intl.trade increased
Social credibility ofthe company increased
Funding alternative besidesbanks increased
Easiness of funding increased
More employees hired
Employee’s incentive towork enhanced
Production level increased
Opportunity of bank borrowingincreased (synergy)
yes somewhat yesyes somewhat yes
0% 20% 40% 60% 80%
yes somewhat yes
Procedures to issue stockscomplicated
Issuing stocks costly
Present lendinginstruments enough
Own funds/retainedprofits enough
Somewhatno, 5%
No, 12%
Somewhat yes,30%
Neutral,32%
Yes, 22%Somewhatno, 3%
No, 10%
Somewhat yes,32%
Neutral,33%
Yes, 22%
0% 20% 40% 60% 80% 100%
Opportunity of bankborrowing increased (synergy)
Funding alternative besidesbanks increased
Social credibility of thecompany increased
Easiness of funding increased
Production level increased
Employee’s incentive towork enhanced
More employees hired
Opportunity of intl.trade increased
yes somewhat yesyes somewhat yes
0% 20% 40% 60% 80%
yes somewhat yes
Procedures to issue stockscomplicated
Issuing stocks costly
Present lendinginstruments enough
Own funds/retainedprofits enough
Note: Valid samples: the People’s Republic of China: 303; India: 40; the Republic of Korea: 28; and Malaysia: 60.
Source: Author’s compilation.
Expected Benefits Reasons for Hesitating to Access
Expected Benefits Reasons for Hesitating to Access
183Diversified Financing Models
1. Exercise Equity Market for SMEsThe creation of an exercise equity market for SMEs, separate from the exchange market, can be beneficial, especially in lower-middle-income Asian countries.71 The concept is to create a preparatory market for smaller but growing firms that will eventually tap the regular market of the stock exchange. This market will provide a chance for SMEs to learn more market rules and obligations such as disclosure before tapping the organized market, and to improve corporate culture through learning the importance of increased corporate value for growth. The exercise market has a comprehensive mechanism for supporting SMEs in equity finance from various angles, which is combined with (i) fostering the venture capital industry as an initial risk capital provider for SMEs; (ii) developing the base of professionals supporting the SME disclosure process, such as certified public accountants networks; and (iii) designing government policy support measures such as tax incentives for SME issuers and investors.
Developing SME capital markets presents a twofold challenge: demand creation, and market sustainability. To this end, a well-organized investor base and supporting professionals with government preferential measures are prerequisite to stimulating demand for an SME market. Meanwhile, with low-cost operations, liquidity enhancement mechanisms such as market making and obligatory shareholder allotment are indispensable to making the SME market sustainable.
Figure 49 shows the conceptual combination of SME funding sources and risk capital providers in the growth cycle of enterprises. The financing needs of firms are dependent on their stage of growth. For instance, growing SMEs tend to seek access to long-term funding instruments for further growth of their business, which creates increased demands from SMEs for capital market financing. However, most SMEs have little ability to tap the regular stock exchange market because of relatively strict listing requirements and, more importantly, a lack of basic knowledge of capital market financing. Therefore, the creation of a venue for learning market rules, obligations, and benefits through the experience of issuing and trading stocks within the established system, yet separate from the regular market, is potentially useful for growth-oriented SMEs. The creation of investor and professional bases that support SMEs in equity financing is needed to implement this concept. In this regard, extensive national policies and strategies for SME access to capital markets, with appropriate regulatory backing, are key to realizing the preparatory market concept.
It is a concern that, unless stand-alone regulations are established through separate legislation from the general capital market laws, the exercise market may conflict with such general laws. For instance, if the number of shareholders for a stock offering and maintaining stocks in the nonexchange market exceeds the statutory minimum number stipulated in the general capital market laws, SMEs listed in such a market will be regarded as public companies under the general laws, which means that they cannot enjoy preferential treatment even if they are listed in the special market. In other words, their funding will be limited to small-scale fund raising from a limited investor base.
71 The concept was discussed in Indonesia as part of the JICA Capital Market Project (2008–2010). Theterm “exercise equity market” is a phrase developed from a stream of discussions on SME capital marketin Indonesia.
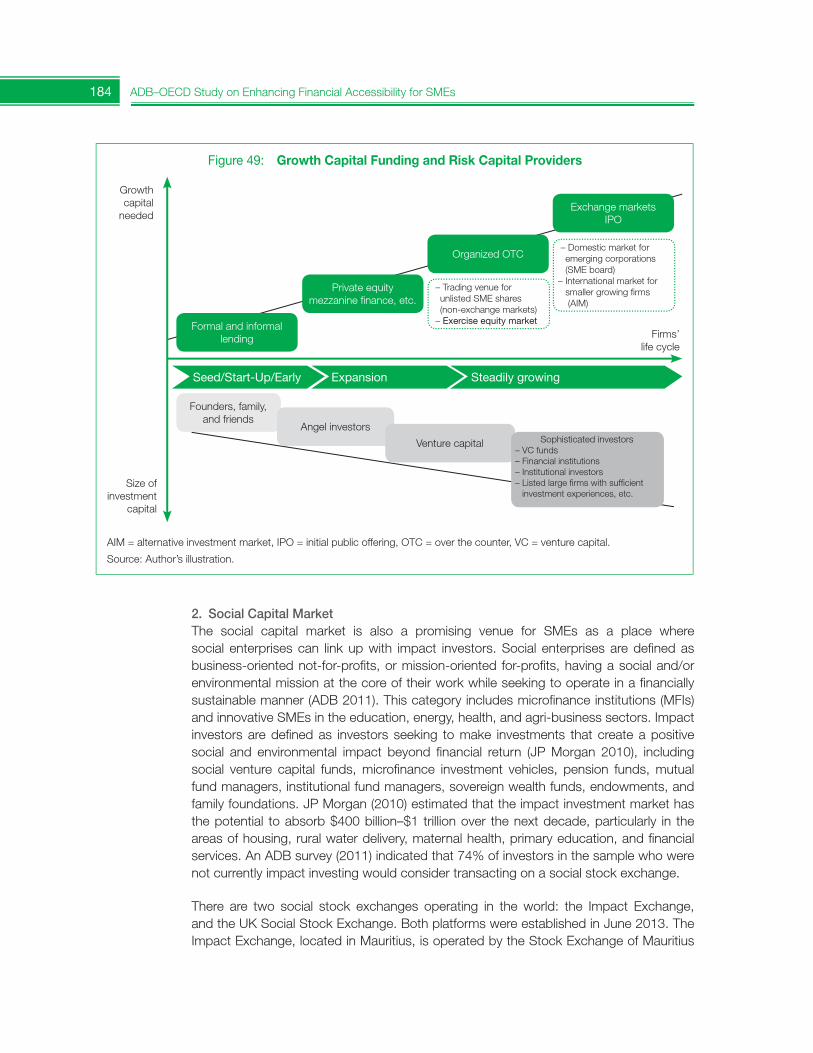
184 ADB–OECD Study on Enhancing Financial Accessibility for SMEs
2. Social Capital MarketThe social capital market is also a promising venue for SMEs as a place where social enterprises can link up with impact investors. Social enterprises are defined as business-oriented not-for-profits, or mission-oriented for-profits, having a social and/or environmental mission at the core of their work while seeking to operate in a financiallysustainable manner (ADB 2011). This category includes microfinance institutions (MFIs) and innovative SMEs in the education, energy, health, and agri-business sectors. Impact investors are defined as investors seeking to make investments that create a positive social and environmental impact beyond financial return (JP Morgan 2010), including social venture capital funds, microfinance investment vehicles, pension funds, mutual fund managers, institutional fund managers, sovereign wealth funds, endowments, and family foundations. JP Morgan (2010) estimated that the impact investment market has the potential to absorb $400 billion–$1 trillion over the next decade, particularly in the areas of housing, rural water delivery, maternal health, primary education, and financial services. An ADB survey (2011) indicated that 74% of investors in the sample who were not currently impact investing would consider transacting on a social stock exchange.
There are two social stock exchanges operating in the world: the Impact Exchange, and the UK Social Stock Exchange. Both platforms were established in June 2013. The Impact Exchange, located in Mauritius, is operated by the Stock Exchange of Mauritius
Figure 49: Growth Capital Funding and Risk Capital Providers
Growth capital
needed
Firms’ life cycle
Formal and informal lending
Founders, family, and friends
Angel investors
Venture capital Sophisticated investors– VC funds– Financial institutions– Institutional investors– Listed large firms with sufficient
investment experiences, etc.
Private equity mezzanine finance, etc.
Organized OTC
Exchange markets IPO
– Domestic market for emerging corporations (SME board)
– International market for smaller growing firms (AIM)
– Trading venue for unlisted SME shares (non-exchange markets)
– Exerciseequitymarket
Size of investment
capital
Seed/Start-Up/Early Expansion Steadilygrowing
AIM = alternative investment market, IPO = initial public offering, OTC = over the counter, VC = venture capital.
Source: Author’s illustration.
185Diversified Financing Models
and supervised by the Singapore-based Impact Investment Exchange Asia, targeting Asian and African social enterprises. Impact Investment Exchange Asia also established an online platform, named Impact Partners, in March 2011 that provides a dedicated matching service for social enterprises and impact investors. The UK Social Stock Exchange, with 11 listed social enterprises at present, was launched by the London Stock Exchange Group as part of the national strategies for fostering social impact businesses in the United Kingdom. A recent survey conducted by JP Morgan and the Global Impact Investing Network showed that impact investors plan to commit $9 billion in 2013, up from $8 billion in 2012.
A social stock exchange has similar functions as the regular stock exchange market, where social enterprises can raise capital through offerings of shares, bonds, or other financial instruments. It seems that trial-and-error efforts were made to decide the trading platform in the present social stock exchanges. Impact Investment Exchange Asia initially planned to launch a stand-alone trading platform for Asian social enterprises as Asia’s first private-led social exchange, but ultimately decided to use the existing exchange market for operations, probably because of potential barriers to sustainable operations in a new platform. The use of an existing platform brings several benefits to a new market:(i) cost efficiency, (ii) transparency and credibility, and (iii) standardized operations andmanagement. These are challenges to be overcome in creating an independent market, with a possible solution being the creation of an exchange market or partial collaboration with the existing stock exchange. At the same time, however, such arrangements could prove inflexible for the particular funding needs of different issuers given that market operations would be explicitly controlled by general capital market laws and regulations.
E. Conclusion
Asia’s largely bank-centered financial systems require reduction of the supply–demand gap in lending as a core policy pillar to improve SME access to finance. Diversification of financing models is another core policy pillar that can better serve various financing needs of SMEs and expand their financial accessibility, which includes the development of capital market financing for SMEs as a venue for providing long-term growth capital.
The demand-side survey identified SMEs long-term funding needs. They are seeking to access formal finance and diversify long-term funding instruments for stable growth of business while wishing to reduce dependency on their own capital and informal finance.However, traditional bank lending has limitations when it comes to satisfying such SME long-term funding demands because of information asymmetry. SMEs cite supply-side barriers—such as collateral requirements, complex procedures for loan applications, lending policies of financial institutions, and high lending rates—as causes of poor access to finance, while recognizing that lack of knowledge of financial products is another serious barrier to financial accessibility. This implies that strengthening financial literacy supports SMEs in improving their financial access, and this can be applied to their access to capital markets as well. The preference of access to an SME capital market, especially equity financing, was identified among SMEs surveyed, where they expected to be released from poor funding environments and to grow further with increased social credibility, while having concerns about high-costs and complex procedures to access it. This suggests
186 ADB–OECD Study on Enhancing Financial Accessibility for SMEs
that simple procedures and low-cost structures for SMEs are key for creating a functional SME capital market.
The supply-side survey identified that developing an SME capital market is a policypriority toward sustainable economic growth, considering the segment is underserved in capital markets (i.e., SMEs) and the limitations of bank-centered financial systems. The supply-side generally recognized that a comprehensive policy framework for SME access to capital markets is needed, with policy measures to develop an investor base and promote market literacy. However, the lackluster performance of existing SME capital markets is generating a discreet stance for developing an SME market among the supply-side.
Referring to the existing market structures, capital markets that SMEs can tap are classified into four models under two categories: (i) an exchange market comprising (a) a domestic market, and (b) a professional market; and (ii) a nonexchange market comprising (a) an SRO-operated market, and (b) a non-SRO-operated OTC market. The market type appropriate for supporting SME growth at the national level is dependent on the country context. Two opinions were extracted from the supply-side survey. The countries that support the development of a domestic exchange market for SMEs stressed the cost efficient structure of existing markets because of established trading platforms to be utilized for an SME market and the risk-conscious mechanism backed by existing regulations, while having a concern about the lack of potential investors in nonexchange markets. On the other hand, the countries that support the development of a nonexchange market for SMEs indicated the need for a preparatory market before tapping the regular exchange market in order to create a base of high-quality potential issuers for higher segments of the market, considering that SMEs still lack the ability to tap the exchange market.
Although the priority factors to develop an SME market are different by country, the supply- and demand-side surveys suggest there is a key action that needs to happen for progress to be made, i.e., reduce the cost burden for SMEs to tap capital markets. The cost issue should be overcome to create a sustainable long-term financing venue for SMEs, which requires more sophisticated and innovative institutional arrangements that serve the real needs of SMEs. This will also result in the establishment of a robust capitalmarket that supplements the limitations of traditional bank lending at the national level.
A twofold development path can be considered in the SME capital market: (i) private initiatives linked to private sector development (business oriented), and (ii) public initiatives under the financial inclusion policy and national growth strategies (social oriented). In such two tracks, exchange markets and nonexchange markets can be organized. Accordingly, three types of costs come out: infrastructure cost, regulatory cost, and policy cost (Table 27). For the infrastructure cost, the expected cost size will be different between exchange and nonexchange markets, depending on the usage of existing exchange platforms, but it will not be different between private and public initiatives. The establishment costs for trading platforms in the organized OTC market arise but will not be so expensive because of the small scale of the market. The expected regulatory cost will not be so different between exchange and nonexchange markets because the
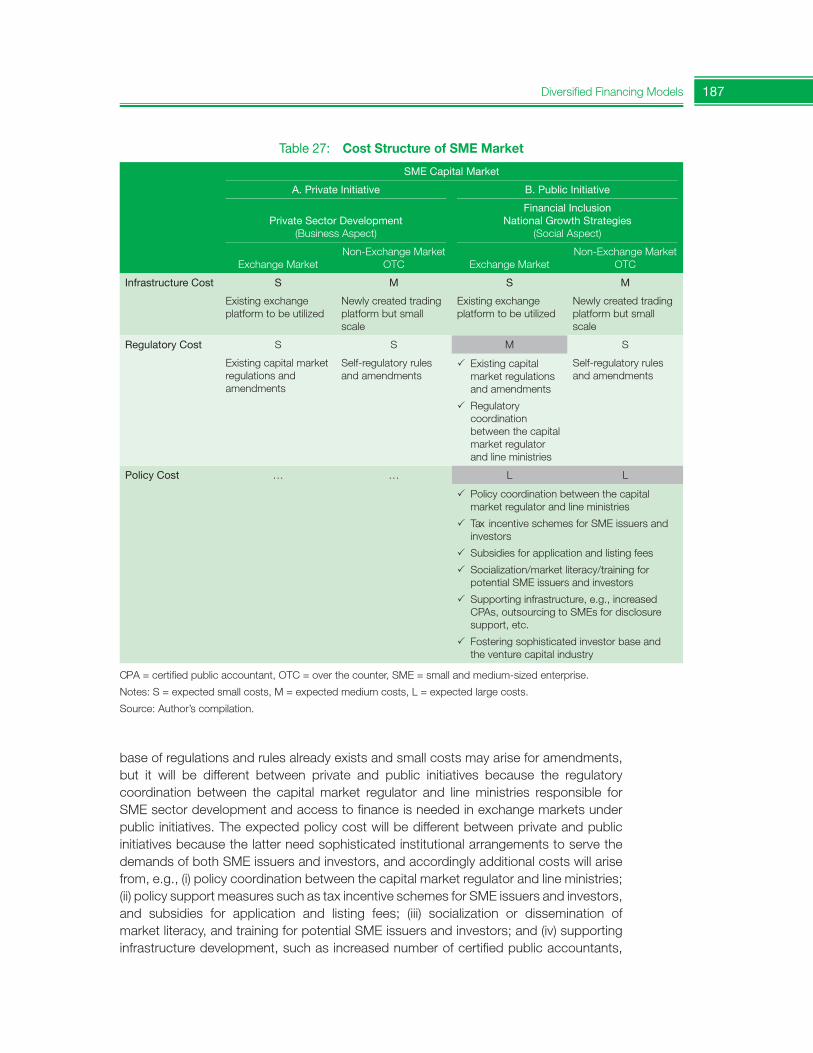
187Diversified Financing Models
base of regulations and rules already exists and small costs may arise for amendments, but it will be different between private and public initiatives because the regulatory coordination between the capital market regulator and line ministries responsible for SME sector development and access to finance is needed in exchange markets under public initiatives. The expected policy cost will be different between private and public initiatives because the latter need sophisticated institutional arrangements to serve the demands of both SME issuers and investors, and accordingly additional costs will arise from, e.g., (i) policy coordination between the capital market regulator and line ministries; (ii) policy support measures such as tax incentive schemes for SME issuers and investors, and subsidies for application and listing fees; (iii) socialization or dissemination of market literacy, and training for potential SME issuers and investors; and (iv) supporting infrastructure development, such as increased number of certified public accountants,
Table 27: Cost Structure of SME Market
SME Capital Market
A. Private Initiative B. Public Initiative
Private Sector Development (Business Aspect)
Financial Inclusion National Growth Strategies
(Social Aspect)
Exchange MarketNon-Exchange Market
OTC Exchange MarketNon-Exchange Market
OTC
Infrastructure Cost S M S M
Existing exchange platform to be utilized
Newly created trading platform but small scale
Existing exchange platform to be utilized
Newly created trading platform but small scale
RegulatoryCost S S M S
Existing capital market regulations and amendments
Self-regulatory rules and amendments
Existing capital market regulations and amendments
Regulatory coordination between the capital market regulator and line ministries
Self-regulatory rules and amendments
PolicyCost … … L L
Policy coordination between the capital market regulator and line ministries
Tax incentive schemes for SME issuers and investors
Subsidies for application and listing fees
Socialization/market literacy/training for potential SME issuers and investors
Supporting infrastructure, e.g., increased CPAs, outsourcing to SMEs for disclosure support, etc.
Fostering sophisticated investor base and the venture capital industry
CPA = certified public accountant, OTC = over the counter, SME = small and medium-sized enterprise.
Notes: S = expected small costs, M = expected medium costs, L = expected large costs.
Source: Author’s compilation.
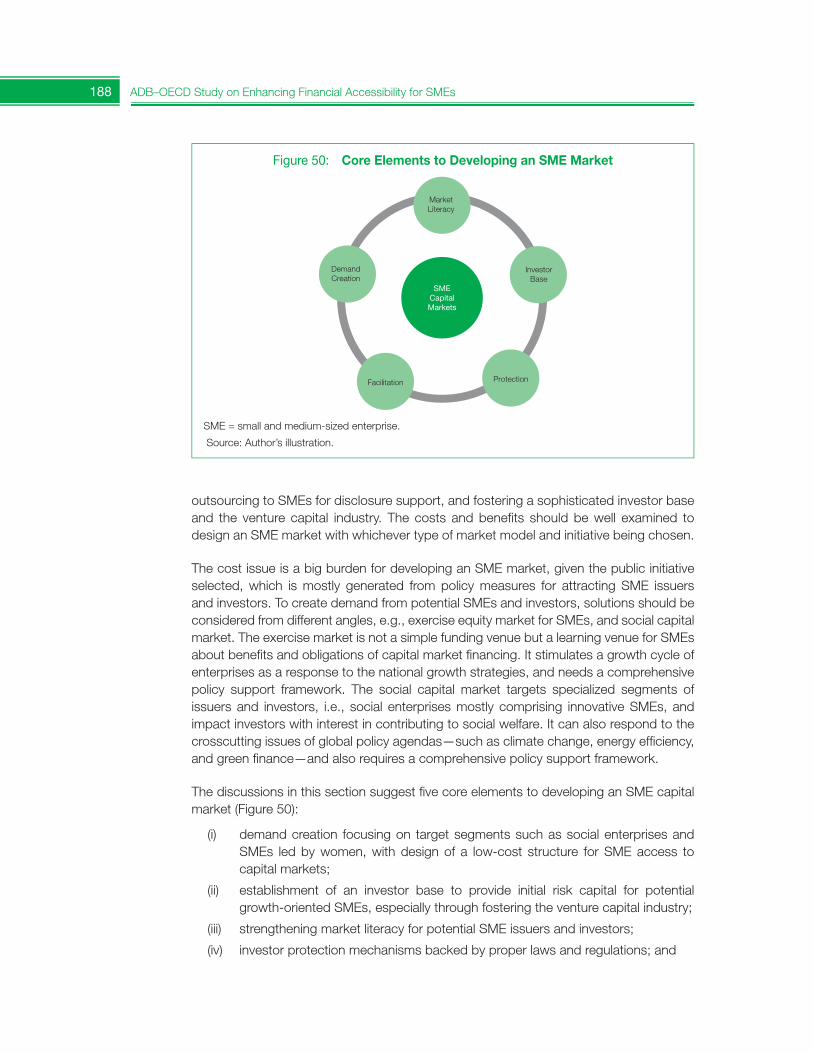
188 ADB–OECD Study on Enhancing Financial Accessibility for SMEs
outsourcing to SMEs for disclosure support, and fostering a sophisticated investor base and the venture capital industry. The costs and benefits should be well examined todesign an SME market with whichever type of market model and initiative being chosen.
The cost issue is a big burden for developing an SME market, given the public initiative selected, which is mostly generated from policy measures for attracting SME issuers and investors. To create demand from potential SMEs and investors, solutions should be considered from different angles, e.g., exercise equity market for SMEs, and social capital market. The exercise market is not a simple funding venue but a learning venue for SMEs about benefits and obligations of capital market financing. It stimulates a growth cycle of enterprises as a response to the national growth strategies, and needs a comprehensive policy support framework. The social capital market targets specialized segments of issuers and investors, i.e., social enterprises mostly comprising innovative SMEs, and impact investors with interest in contributing to social welfare. It can also respond to the crosscutting issues of global policy agendas—such as climate change, energy efficiency, and green finance—and also requires a comprehensive policy support framework.
The discussions in this section suggest five core elements to developing an SME capitalmarket (Figure 50):
(i) demand creation focusing on target segments such as social enterprises andSMEs led by women, with design of a low-cost structure for SME access to capital markets;
(ii) establishment of an investor base to provide initial risk capital for potential growth-oriented SMEs, especially through fostering the venture capital industry;
(iii) strengthening market literacy for potential SME issuers and investors;
(iv) investor protection mechanisms backed by proper laws and regulations; and
Figure 50: Core Elements to Developing an SME Market
SMECapitalMarkets
DemandCreation
MarketLiteracy
InvestorBase
Facilitation Protection
SME = small and medium-sized enterprise.
Source: Author’s illustration.

189Diversified Financing Models
(v) facilitation measures for access to an SME market backed by a comprehensive policy support framework with well-organized policy coordination among regulators and line ministries responsible for SME sector development and access to finance.
References
Asian Development Bank (ADB). AsianBondsOnline. http://www.asianbondsonline .adb.org/
______. 2011. Impact Investors in Asia: Characteristics and Preferences for Investing in Social Enterprises in Asia and the Pacific. Manila.
______. 2013. Key Indicators for Asia and the Pacific 2013. 44th Edition. Manila.
Bursa Malaysia. http://www.bursamalaysia.com/
China Securities Regulatory Commission. http://www.csrc.gov.cn/
Financial Services Commission. http://www.fsc.go.kr/eng/
Growth Enterprise Market. http://www.hkgem.com/
Group of Twenty (G-20). 2013. Communiqué. The G-20 Finance Ministers and Central Bank Governors Meeting. Moscow. 19–20 July.
______. 2013. G-20 Leaders’ Declaration. Saint Petersburg Summit. Saint Petersburg.5 –6 September.
Impact Investment Exchange Asia. http://www.asiaiix.com/
Jeong, H. J. 2013. The Potency of the SME Bond Market in [the Republic of] Korea: Presentation material for the First ADB–Organisation for Economic Co-operation and Development (OECD) Workshop on Enhancing Financial Accessibility for SMEs. Manila. 6–7 March.
Jiang, S. 2013. The Potency of the SME Bond Market in [the People’s Republic of] China: Presentation material for the First ADB–OECD Workshop on Enhancing Financial Accessibility for SMEs. Manila. 6–7 March.
J.P. Morgan. 2010. Impact Investments: An Emerging Asset Class. http://www.jpmorgan chase.com/corporate/socialfinance/document/impact_investments_nov2010.pdf
______. 2013. Perspectives on Progress: The Impact Investor Survey. http://www.jpmorganchase.com/corporate/socialfinance/document/207350_JPM_Perspectives_on_Progress_2013-01-07_1018749_ada.pdf
Korea Exchange. https://eng.krx.co.kr/
Monetary Authority of Singapore. http://www.mas.gov.sg/
OECD. 2013. Financing SMEs and Entrepreneurs 2013: An OECD Scoreboard. Paris.
190 ADB–OECD Study on Enhancing Financial Accessibility for SMEs
Securities and Exchange Board of India. http://www.sebi.gov.in/
Securities and Exchange Commission Thailand. http://www.sec.or.th/
Securities and Futures Commission of Hong Kong. http://www.sfc.hk/
Securities Commission Malaysia. http://www.sc.com.my/
Shenzhen Stock Exchange. http://www.szse.cn/
Singapore Exchange. http://www.sgx.com/
Shinozaki, S. 2012. A New Regime of SME Finance in Emerging Asia: Empowering Growth-Oriented SMEs to Build Resilient National Economies. ADB Working Paper Series on Regional Economic Integration. 104. Manila: ADB.
______. 2014. Capital Market Financing for SMEs: A Growing Need in Emerging Asia. ADB Working Paper Series on Regional Economic Integration. 121. Manila: ADB.
Stein, P., T. Goland, and R. Schiff. 2010. Two trillion and counting: Assessing the credit gap for micro, small, and medium-size enterprises in the developing world. McKinsey & Company and International Finance Corporation.
Stock Exchange of Thailand. http://www.set.or.th/en/
191
4 Challenges for SME Access to Finance: Lessons from Experiences of ADB and OECD
T his chapter describes the similarities and differences in small and medium-sized enterprise (SME) access to finance across Asia and OECD regions, covering bank and nonbank finance options, capital markets, and the policies and regulations
implemented to enhance financial accessibility for SMEs. The chapter is structured as follows: it first identifies the common problems, and then describes the solutions and policy recommendations that have been applied. Then it highlights special issues in each region, and the policy solutions implemented.
4.1. Access to Finance for SMEs is a Structural Problem
In Asian and OECD countries, SMEs face structural challenges in their access to finance. Both demand and supply factors intervene. From the demand-side, intrinsic characteristics of SMEs (lack of collateral, small amount of lending involved, and information opacity) make them less attractive to lenders than bigger firms. From the supply-side, the small amount of lending might not compensate for the costs of monitoring and screening, financial intermediaries might not be geographically widespread to serve the needs ofSMEs in isolated regions, or the products offered might not be suitable to cover SME financing needs.
4.2. SMEs Depend on Debt Instruments
In addition, both in Asian and OECD countries, there is a strong dependence of SMEs on debt instruments, which might be rational as debt instruments tend to suit SMEs needs better than equity-type ones because they are less costly and technically less intensive; they have a different tax treatment (interests on debt are deducted before calculating overall profits while dividends on equity are paid after taxes are deducted); and firm owners might be disinclined to give ownership or control rights in exchange for capital. Dividends on equity instruments, however, are only paid if the firm has been profitable, while debt has to be paid always.
192 ADB–OECD Study on Enhancing Financial Accessibility for SMEs
4.3. There is a Role for Public Financial Institutions
In Asian and OECD countries, public financial institutions are widespread to foster SME lending, given that credit rationing and SME intrinsic characteristics make it difficult to find credit for viable projects in the market. Public intervention in financial markets is undertaken on the assumption that there are positive externalities from lending to SMEs, providing economic and financial additionality.
Moreover, public financial institutions can have an anticyclical role, providing credit during economic downturns when the private sector is unable and/or unwilling to lend. For governments, having financial infrastructure already in place and available to supply credit can speed up the recovery process, solving a coordination failure problem. The public sector can also absorb risk better at times of economic downturns, as they can more easily hedge risk over time and across a large amount of beneficiaries, being able to compensate for the reduced supply from private banks and the increased volatility in risk aversion by private providers (Arrow and Lind 1970).
4.4. Similar Challenges in Asia and OECD: How to Increase SME Bankability…
However, the magnitude of challenges is different across Asian and OECD regions. In Asia, enhancing bankability of SMEs is a bigger challenge than in OECD countries, although the problem is also present there. To foster SME lending, Bangladesh and India have set up annual SME lending volume targets. A similar policy approach has been undertaken by several OECD countries as a temporary crisis response measure (i.e., Germany andIreland). Finland has increased the lending cap on government financing for SMEs; in Sweden the public financial institution ALMI augmented the share of cofinancing of itsinstruments (OECD 2013a).
In OECD countries, many direct lending programs incorporate capacity building nonfinancial assistance to help SMEs overcome their information opacity. This is the case for example in Canada, Chile, Denmark, Finland, Germany, Israel, the Republic of Korea, the Netherlands, Norway, Russia, Slovenia, Sweden, and Turkey (OECD 2013a).
4.5. … and Also Bank Efficiency
In addition, increasing bank efficiency is a common shared problem in Asian and OECD countries, although the problem is more acute in Asia. Nevertheless, both areas present the challenge of improving the instruments and enhancing the supply of bank options for SMEs. As mentioned, the provision of sustainable credit guarantee systems—a widespread measure in Asian and OECD countries—has the benefit of being an indirect measure with power for leverage.
Another area for improvement where steps have already been made is on SME data infrastructure. Since 2012 the OECD has produced its OECD Scoreboard on Financing
Challenges for SME Access to Finance 193
SMEs and Entrepreneurs, which monitors access to finance, government policies, and framework conditions through 13 indicators. The indicators cover access to finance overtime through debt instruments and equity instruments, credit conditions (interest rate spreads), solvency, and government policy measures. Taken together, the set of indicators offer policy makers and other stakeholders a consistent structure with which to (i) evaluate whether SME financing needs are being met, (ii) support the design and evaluation of policy measures, and (iii) monitor the implications of financial reforms on SME access to finance. Since 2013, ADB has produced the Asia SME Finance Monitor, which collects data from 14 countries. The monitor reviews various country aspects of SME finance covering the banking sector, nonbank sector, capital markets, and related policies and regulations to support evidence-based policy making on SME finance in Asia and the Pacific. These initiatives are supplemented by national and regional demand-side surveys in order to provide a more comprehensive view of the evolution in financing trends and needs in ADB and OECD countries. This data infrastructure will contribute to designing new policy approaches of SME finance to address the long-standing challenges of sustainable and inclusive growth in the two areas and eventually rebalancing the global economy.
To increase bank efficiency, the Pacific region has conducted a reform of its system of secured transactions. The objective of the reform is to allow more borrowing on better terms than under the previous legal system, benefitting SMEs in particular.
Asset-based finance (such as leasing, factoring, and purchase order discounting) is a common instrument for SMEs in OECD areas and a potential instrument to be developed in Asian developing countries. Moreover, the finance institution in charge of providing the finance differs by region. In OECD countries, banks offer asset-based products; in Asia,nonbank financial institutions (credit cooperatives, pawnshops, specialized leasing and/or factoring institutions) are the ones offering SME credit other than bank finance, although their operations are still very small in scale.
4.6. The Financial Crisis had a Different Impact in Asia and in OECD Countries
In the OECD, the financial crisis led to a drop in the demand for goods and services that impacted big and small firms. The deterioration of credit conditions affected the supply of credit, and there was a decrease in the offer of equity financing instruments. In Asia, the impact of the crisis was relatively less serious than in OECD countries, and it led to a reorganization of intraregional trade, given the reduction in the demand for goods and services from OECD countries. It also increased awareness of the effects that capital flows can have on the overall economy.
4.7. Basel III will Have a Different Impact in Asia and in OECD Countries
Basel III requires banks to have tighter risk management as well as greater capital and liquidity, which has sparked a debate on the potential negative impact on SME lending.
194 ADB–OECD Study on Enhancing Financial Accessibility for SMEs
As many emerging Asian countries have yet to decide whether or not to introduce Basel III, it will have more influence on the banking sector in the OECD area than in emerging Asian economies. However, when building resilient national economies, bank regulators in the two areas need to balance financial stability and financial inclusion with a high levelof risk consciousness against unexpected events such as a financial crisis. Resulting asset preference and deleveraging of banks, particularly European banks with significant presence in Asia, could limit the availability of funding for SMEs even in the region not yet introducing Basel III.
4.8. Capital Market Development
In OECD countries, the financial crisis of 2008/09 motivated policy makers to look foralternatives to debt finance for SMEs. Equity-type instruments might suit the needs of SMEs with high-growth potential. There is a wide range of alternative to debt products, which rank from low-risk, low-return products (such as asset-based finance, or corporate bonds or securitized debt) to high-risk, high-return products (such as private equity, venture capital, and equity derivatives). Corporate bonds and securitization are scarcely used by SMEs. It will require effort by private entities and/or public authorities to create an environment in which it is possible to develop instruments that are suitable for sale to investors and use such instruments on a sizeable scale. There are two further considerations that limit the applicability of these techniques to SMEs: these techniques are likely to be accessible only to the best-rated SMEs, and these instruments do not address the problem of excessive SME reliance on debt or provide an improved capital structure for the firm (OECD 2013b).
In Asia, the nonbank sector and the venture capital industry are at early stages of development and have not established feasible SME products. In addition, the policy framework is not sufficiently advanced to support innovative financial instruments for SMEs. However, Asia’s rapid growth is gradually generating the base of growth-oriented SMEs and forming a new demand from them for stable long-term funding for sustainable business growth. Moreover, lessons from the 1997/98 Asian financial crisis and the 2008/09 global financial crisis have motivated many Asian countries to develop alternative financing models that go beyond traditional bank lending. Accordingly, SME capital markets are seen as one potential policy area for SME development in Asia. In this context, how to create the base of investors as risk capital providers to SMEs is a critical challenge for well-functioning SME capital markets.
4.9. Policy Measures
In OECD countries, the crisis led to a substantial number of policy measures destined to restore the lending channel to SMEs. Measures were direct (increase lending to SMEs) and indirect (ameliorating the guarantee programs, providing credit mediation andbusiness advice). One of the most widespread measures was the increase in scale and scope of existing public guarantees schemes to SMEs. Coverage was expanded and maturity was increased.
Challenges for SME Access to Finance 195
In Asia, the provision of credit guarantees was also a widespread policy option to recover SME lending levels. In some cases, government policies provided interest rate subsidies to SME lending, but this option presents many drawbacks as it distorts the market, discouraging private lending to SMEs. Policy makers in Asia have regarded SMEs as growth entities but a risky segment. Thus, national strategies on SME access tofinance often attached importance to refinancing and public credit guarantee schemes, addressing the development of domestic SMEs.
Public financial institutions have been used to provide countercyclical credit measures, in the context of temporary relief, although given the uneven economic recovery in the euro area, most of the measures were extended until the end of 2013. Other measures to support SME lending include the reduction of government payment delays to SMEs, and tax payment deferrals.
In Asia, more coordination is needed among financial regulators and line ministries responsible for SME development and access to finance. In many Asian countries, line ministries have designed their own financing schemes to policy targets such as fishers, agri-businesses, local SMEs, small-scale manufacturers, and SME exporters and importers. These schemes have been developed often without cooperation from financial regulators or the central bank. As potential policy intervention, government measures to support internationalization of SMEs, especially the supporting industries or parts industries, will be needed given the accelerating globalization of economies. In particular, SMEs in Southeast Asian countries will be exposed to further liberalized trade and investment under the Association of Southeast Asian Nations Economic Community, which is due to be established in 2015. The policies for expanding SME finance should be addressed in a holistic manner that goes beyond already established ways.
4.10. Lessons Learnt
The banking sector is a leading player in financial systems in both Asian and OECD countries. Hence, enhancing bankability for SMEs is a common policy priority in SME access to finance in the two areas. In Asia, access to finance has become a critical part of national financial inclusion strategies and is generally incorporated as a key policy pillar in midterm and/or annual SME sector development plans at the national level. It is often discussed together with financing schemes for microenterprises in terms of social welfare enhancement. In OECD countries, access to finance represents a long-standing critical challenge for SMEs and entrepreneurs and has also become a part of macroeconomic policies in terms of job creation.
Meanwhile, the recent financial crises have motivated both Asian and OECD countries to develop alternative financing models in SME finance beyond the conventional ways of relying on bank lending. Hence, diversifying financing models for SMEs has become another policy priority in the two areas but from different points of view. In Asia, sour experiences of the Asian financial crisis and the global financial crisis sharply raised Asia’s risk consciousness against global economic uncertainty, and further highlighted the limitations of bank lending to SMEs. In OECD countries, the global financial crisis seriously
196 ADB–OECD Study on Enhancing Financial Accessibility for SMEs
harmed the cash flows of SMEs and forced them into bankruptcy. Taking account of these conditions in Asia and OECD countries, broadening the financing model is needed for the scaling up of SME access to finance and promoting balanced and resilient national economies in the two regions.
Thus, policy frameworks on SME access to finance should address two pillars—bank lending efficiency and diversified financing models—given the established bank-centered financial systems and the limitations of traditional bank lending in Asia and OECD countries.
Among the lessons learnt, there is the need to increase the lending efficiency for SMEs,providing a suitable financial infrastructure and innovative product design. The scale of SME lending and the type of products desired (longer maturities) might not attract privateproviders to offer financing. There is, therefore, a role for public financial institutions in solving structural and cyclical problems in SME access to finance, provided that the financing goes to viable businesses that cannot find financing in the market or to business opportunities that provide economic and/or financial additionality. The options to finance SMEs can be direct or indirect. Direct intervention provides loans or equity-typeinstruments, while alternative finance instruments are not suited for all SMEs. Alternative (to debt) finance instruments serve the needs of a subgroup of SMEs with high growth potential. Indirect intervention provides sustainable credit guarantees for viable SMEs. Atthe same time, nonfinancial assistance (capacity building, financial and managerial know-how) can help SMEs to find financing in the market, which is an important role of national policy makers responsible for SME development. In Asia, the secured transactions reform recently undertaken might enable SMEs to access finance on more convenient terms.
Meanwhile, information and communication technology helps private providers design and develop innovative financing models that serve various funding needs of SMEs in different business life cycles. Crowdfunding, a new financing model where individuals lend to each other or small businesses through specialized lending websites, is one such example. By making use of information and communication technology, capital market financing for high-end SMEs, in either exchange or nonexchange markets, is also worth exploring in countries where long-term financing needs from SMEs are perceived. In the context of Asia, nonbank financial institutions have yet to sufficiently develop SME financing business models. Increasing trade finance and supply chain finance for SMEs, especially the supporting industries and parts industries, will promote the internationalization of SMEs that aim to expand their business into overseas markets, and will help them access short-term working capital financing, which will provide opportunities for SMEs to survive and grow further. When new financing models emerge, regulators and policy makers are required to cope with potential risks of regulatory arbitrage.
Taking account of common and different conditions on financing SMEs in Asia and OECD countries, policy makers and regulators need to develop a comprehensive range of policy options that support wide-ranging financing models for SMEs, which will contribute to realizing resilient national economies with sustainable growth. To this end, lessons extracted from different financial markets and policy interventions are a useful tool for a country to use in designing feasible SME finance policies accommodating individual country contexts.
Challenges for SME Access to Finance 197
References
Arrow, K. J., and R. C. Lind. 1970. Uncertainty and the Evaluation of Public Investment Decisions. American Economic Review, 60(3), 364–78.
OECD. 2013a. The role of public financial institutions in fostering SME access to finance.[CFE/SME(2013)8/REV1]
______. 2013b. Alternative Financing Instruments for SMEs and entrepreneurs: The Case of Mezzanine Finance. Paris: OECD Publishing.
Shinozaki, S. 2012. A New Regime of SME Finance in Emerging Asia: Empowering Growth-Oriented SMEs to Build Resilient National Economies. ADB Working Paper Series on Regional Economic Integration. 104. Manila: ADB.
Printed in the Philippines
Asian Development Bank6 ADB Avenue, Mandaluyong City1550 Metro Manila, Philippineswww.adb.org
ADB–OECD Study on Enhancing Financial Accessibility for SMEs
ADB–OECD Study on Enhancing Financial Accessibility for SMEsLessons from Recent Crises
The report takes a comparative look at ADB and OECD experiences, and aims to identify promising policy solutions for creating an SME base that is resilient to crisis, from a viewpoint of access to finance, and which can help drive growth and development.
About the Asian Development Bank
ADB’s vision is an Asia and Pacific region free of poverty. Its mission is to help its developing member countries reduce poverty and improve the quality of life of their people. Despite the region’s many successes, it remains home to approximately two-thirds of the world’s poor: 1.6 billion people who live on less than $2 a day, with 733 million struggling on less than $1.25 a day. ADB is committed to reducing poverty through inclusive economic growth, environmentally sustainable growth, and regional integration.
Based in Manila, ADB is owned by 67 members, including 48 from the region. Its main instruments for helping its developing member countries are policy dialogue, loans, equity investments, guarantees, grants, and technical assistance.
Lessons from Recent Crises