ADB Working Paper Series on Regional Economic … City, 1550 Metro Manila, Philippines....
32
Critical Review of East Asia – South America Trade Shintaro Hamanaka and Aiken Tafgar No. 105 | January 2013 ADB Working Paper Series on Regional Economic Integration
Transcript of ADB Working Paper Series on Regional Economic … City, 1550 Metro Manila, Philippines....
Critical Review of East Asia – South America Trade
Shintaro Hamanaka and Aiken TafgarNo. 105 | January 2013
ADB Working Paper Series onRegional Economic Integration


Shintaro Hamanaka* and Aiken Tafgar**
Critical Review of East Asia – South America Trade
ADB Working Paper Series on Regional Economic Integration
No. 105 January 2013
*Economist, Office of Regional Economic Integration, Asian Development Bank, 6 ADB Avenue, Mandaluyong City, 1550 Metro Manila, Philippines. [email protected]
**Consultant, Office of Regional Economic Integration, Asian Development Bank, 6 ADB Avenue, Mandaluyong City, 1550 Metro Manila, [email protected]
The ADB Working Paper Series on Regional Economic Integration focuses on topics relating to regional cooperation and integration in the areas of infrastructure and software, trade and investment, money and finance, and regional public goods. The Series is a quick-disseminating, informal publication that seeks to provide information, generate discussion, and elicit comments. Working papers published under this Series may subsequently be published elsewhere.
Disclaimer: The views expressed in this paper are those of the authors and do not necessarily reflect the views and policies of the Asian Development Bank (ADB) or its Board of Governors or the governments they represent. ADB does not guarantee the accuracy of the data included in this publication and accepts no responsibility for any consequence of their use. By making any designation of or reference to a particular territory or geographic area, or by using the term ―country‖ in this document, ADB does not intend to make any judgments as to the legal or other status of any territory or area.
Unless otherwise noted, $ refers to US dollars. © 2013 by Asian Development Bank January 2013 Publication Stock No. WPS125321

Contents . . . . . . . . . . . . . . . .
. . . . . . . . . . . . . . . . . . . . . . . . . . . . . . . . . . . . . . . . . . . . . . . . . . . . . . . . . . . . . . . . . . . . . . . . . . . . . . . . . . . . . . . . .
. . . . . . . . . . . . . . . .
Abstract iv
1. Introduction 1
2. The Recent Development of Trade Ties Between East Asia and South America 2
3. East Asia’s Trade Ties with South America: The People’s Republic of China and Japan Compared 6
3.1 Imports: The People’s Republic of China vs. Japan 6
3.2 Exports: The People’s Republic of China vs. Japan 9
4. Summary 12
References 14
ADB Working Paper Series on Regional Economic Integration 15
Figure
1. Inter-Regional Trade between East Asia and South America 2
Tables
1. East Asian Perspective on Inter-Regional Trade with South America 3
2. South American Perspective on Inter-Regional Trade with East Asia 3
3. Key Inter-Regional Traders in East Asia and South America 4
4. Inter-Regional Trade Bias 5
5. Asia’s Import Bias toward Brazil and Chile (Asian side data) 6
6. The PRC’s Major Import Items from Brazil and Chile (PRC side data) 7
7. Japan’s Major Import Items from Brazil and Chile (Japanese side data) 8
8. Asia’s Export Bias toward Brazil and Chile (Asian side data) 9
9. The PRC’s Major Export Items to Brazil and Chile (PRC side data) 10
10. Japan’s Major Export Items to Brazil and Chile (Japanese side data) 11

Abstract There is a general consensus that trade between East Asia and South America is becoming increasingly important. However, we know little about the actual dynamic development of this inter-regional trade. This paper examines whether the trend of East Asia–South America trade is a general phenomena or a country- and commodity-specific issue, and whether the increase in trade values has a solid basis in terms of commodity diversification and/or price and quantity effects. While South America has an overall trade surplus with East Asia, detailed country and commodity analysis of inter-regional trade reveal several potential weaknesses in South America’s trade with East Asia. Our research finds that (i) the increase in trade between the two regions can be explained mainly by the increase in the People’s Republic of China’s (PRC) trade with South America, (ii) the increase in the PRC’s imports from South America is limited to a few commodities, (iii) the increase in East Asia’s imports from South America is due partly to commodity price increases, and (iv) the PRC has started to export various types of electronics and machinery products to South America. Overall, East Asia’s exports to South America seem to show more promising signs of growth than South America’s exports to East Asia. Keywords: Regional integration/cooperation, trade policy, inter-regional trade, East Asia trade, South America trade JEL Classification: F1 , F13, F14, F15, O2, O24

Critical Review of East Asia – South America Trade | 1
1. Introduction External trade is one of the main contributors to the economic progress of a country or region. On one hand, trade can be an engine of economic growth; on the other, it can be a vehicle that spreads economic crisis. As the importance of trade grows, recent literature has emphasized trade integration within a region, or intra-regional trade integration.1 This paper looks at another dimension—the potential of trade between two regions, or inter-regional trade integration. Given a significant difference in factor endowments between two regions, inter-regional trade holds huge potential for growth despite the geographical distance between the regions. This also implies that inter-regional trade constrained by distance can be increased significantly when transport costs decline (Asian Development Bank [ADB], Inter-American Development Bank [IDB], and Asian Development Bank Institute [ADBI] 2012, p. 22). This paper analyzes inter-regional trade between East Asia and South America. We can easily assume that the inter-regional trade between the two regions is undergoing a dynamic change because East Asia is becoming the center of the world’s economic growth and South America is very rich in natural resources. However, recent studies suggest that inter-regional trade between East Asia and South America has several inherent weaknesses that can be summarized as ―asymmetric relations‖ (Jenkins 2012). These asymmetric relations include (i) the significance of East Asia to South America with respect to trade, and the corresponding insignificance of South America to East Asia; (ii) the composition of East Asian exports (mainly manufactured products) vs. South American exports (primary commodities); and (iii) the variety in exported items from East Asia compared with the concentration of exported items from South America. Overall, this paper examines whether the trend of inter-regional trade is a general phenomenon or a country- or commodity-specific issue, and whether the increase of inter-regional trade has a solid basis in terms of commodity diversification and price and quantity effects, bearing the asymmetric relations in mind. This paper is structured as follows. Section 2 assesses the importance of the two regions to one another, using measures such as trade growth, inter-regional trade shares, and trade bias. The section also examines whether trade between the two regions is becoming stronger or weaker. Section 3 compares the trade of two key East Asian countries—the People’s Republic of China (PRC) and Japan—with South America, covering commodity-level analysis in terms of both value and quantity. Section 4 considers the policy implications of the paper’s findings. In this paper, we mainly analyze inter-regional trade in recent decade since East Asia–South America trade increased significantly beginning in 2000, a development triggered by the rise of the PRC (Whalley and Medianu 2010). East Asia refers to eight countries: the PRC, Indonesia, Japan, the Republic of Korea, Malaysia, Singapore, the Philippines, and Thailand. South America includes 10 countries: Argentina, Bolivia, Brazil, Chile, Colombia, Ecuador, Paraguay, Peru, Uruguay, and Venezuela. South America, rather than Latin America, is used because the principal focus of this paper is countries on the South American continent. Mexico is excluded because East Asia’s trade with Mexico is different in nature than its trade with South American countries since Mexico is a member of the North American Free Trade Area (NAFTA).
1 In the case of intra-regional trade integration in East Asia, see Hamanaka (2012).

2 | Working Paper Series on Regional Economic Integration No. 105
2. The Recent Development of Trade Ties between East Asia and South America
Trade between the two regions increased between 2001 and 2011 despite the disruption caused by the global economic crisis in 2008/09 (Figure 1). It is also observed that the value of imports of each region is larger than the value of exports, which is partly due to transport costs. Considering distances that entail large transport costs, it is reasonable to assume that South America's primary commodity exports to East Asia (East Asia’s imports from South America) are larger than East Asia’s manufacturing exports to South America (South America’s imports from East Asia). However, as we will see later, this South American trade surplus with East Asia does not imply that the inter-regional trade is favorable to South America because the larger values of South American exports are mainly due to commodity price inflation.
Figure 1: Inter-Regional Trade between East Asia and South America
Trade from East Asia to South America Trade from South America to East Asia
Source: United Nations (UN) Comtrade.
Since the increase in trade is a world-wide phenomenon, we analyze the apparent development of inter-regional trade in terms of share. From the East Asian perspective, trade shares reveal that trade with South America has become more important but still seems very small relative to East Asia’s trade with the rest of the world (Table 1). South America appears to be significant to East Asia with respect to imports more than exports. From the South American perspective, on the other hand, trade with East Asia is increasing and is not negligible (Table 2). Moreover, the significance of East Asia to South America appears to encompass both exports and imports.

Critical Review of East Asia – South America Trade | 3
Table 1: East Asian Perspective on Inter-Regional Trade with South America
Share of Exports to
South America
(%)
Share of Imports from South America
(%)
Inter-Regional Trade Share
(Trade with South America / Trade with the
World)*100
2001 2011 2001 2011 2001 2011
China, People’s Rep. of 1.5 3.9 2.4 5.9 1.9 4.9
Japan 1.4 1.7 1.9 3.3 1.6 2.5
Republic of Korea 2.5 3.6 1.9 2.9 2.2 3.3
Indonesia 0.9 1.4 1.0 2.3 0.9 1.8
Malaysia 0.4 0.8 0.8 1.9 0.6 1.3
Philippines 0.2 0.6 0.8 1.4 0.5 1.0
Singapore 0.4 0.5 0.4 1.7 0.4 1.1
Thailand 0.7 2.1 1.4 1.6 1.0 1.9
Total East Asia 1.3 2.7 1.7 4.0 1.5 3.3
Source: Authors’ calculations using UN Comtrade data.
Table 2: South American Perspective on Inter-Regional Trade with East Asia
Share of Exports to
East Asia
(%)
Share of Imports from East Asia
(%)
Inter-Regional Trade Share
(Trade with South America / Trade with
the World)*100
2001 2011 2001 2011 2001 2011
Argentina 10.4 14.4 13.7 21.5 11.8 17.8
Bolivia 1.1 14.3 10.7 22.2 6.2 17.9
Brazil 10.3 27.0 13.6 26.3 11.9 26.7
Chile 22.3 41.1 15.1 26.3 19.0 34.0
Colombia 2.2 5.7 12.0 21.8 7.2 13.5
Ecuador 8.3 2.8 16.3 24.0 12.6 13.8
Paraguay 4.7 3.2 19.5 36.3 14.9 26.0
Peru 16.0 24.9 15.9 26.7 16.0 25.7
Uruguay 9.7 – 8.6 – 9.0 –
Venezuela 1.3 15.6 10.3 16.2 4.8 16.2
Total South America 9.7 23.4 13.4 24.6 11.5 24.0
– = Data not available. Source: Authors’ calculations using UN Comtrade data.

4 | Working Paper Series on Regional Economic Integration No. 105
Further, it is observed that inter-regional trade between East Asia and South America is dominated by a few countries (Table 3). In East Asia, Japan had traditionally been the dominant trader with South America until it was recently overtaken by the PRC. In South America, Brazil is, by far, the dominant player, followed by Chile.
Table 3: Key Inter-Regional Traders in East Asia and South America
Share of East Asia’s Total Trade with South America
(based on East Asian statistics)
Share of South America’s Total Trade with East Asia
(based on South American statistics)
2001 2011
2001 2011
Value (million $)
Share
(%) Value
(million $) Share
(%) Value
(million $) Share
(%) Value
(million $) Share
(%)
PRC 9,706 29.7 177,553 60.6 Argentina 5,533 16.2 28,609 10.7
Japan 12,178 37.3 41,885 14.3 Bolivia 191 0.6 3,007 1.1
Rep. of Korea 6,454 19.8 35,567 12.1 Brazil 13,519 39.6 128,721 48.1
Indonesia 803 2.5 6,885 2.4 Chile 6,617 19.4 53,186 19.9
Malaysia 938 2.9 5,425 1.9 Colombia 1,803 5.3 15,112 5.7
Philippines 359 1.1 1,151 0.4 Ecuador 1,257 3.7 6,447 2.4
Singapore 933 2.9 8,451 2.9 Paraguay 471 1.4 4,642 1.7
Thailand 1,299 4.0 8,520 2.9 Peru 2,258 6.6 21,454 8.0
Uruguay 462 1.4 – –
Venezuela 2,009 5.9 6,409 2.4
Total East Asia
32,669 100 285,438 100 Total South America
34,121 100 267,587 100
– = Data not available; PRC = People’s Republic of China. Source: Authors’ calculations using UN Comtrade data.
The increase in inter-regional trade shares, particularly any country or region’s trade with East Asia as a share of its total trade, could be a world-wide phenomenon. Almost all countries in the world increased their trade with East Asia between 2001 and 2011, especially with the PRC. South America’s increasing level of trade with East Asia may not be an exception to this global trend. Thus, we look at trade bias, defined below (Plummer, Cheong, and Hamanaka 2012). The trade bias index measures the relative significance of a partner country or region from the perspective of a certain country or region. If the index is equal to 1 (neutral), then the member countries of a free trade area or regional grouping of countries under consideration do not have a bias toward trading either with members or with outsiders. If the index is more than 1, then the countries or regions under consideration have a bias toward trading among themselves. If the index is less than 1, then the countries or regions under consideration have a bias toward trading with outsiders.2
2 For example, assume that Country A’s share of the PRC’s total trade is 2%. It cannot be argued that 2% is large
or small without first knowing the importance of Country A in world trade. If country A’s share of world trade is 2%, then the trade bias index is 1 and, therefore, the PRC’s trade with Country A has no regional bias (neutral). If country A’s share in world trade is 1%, then the PRC’s trade with Country A has a positive bias (0.5). On the other hand, if Country A’s share in world trade is 4%, then the PRC’s trade with Country A has a negative bias (2.0).
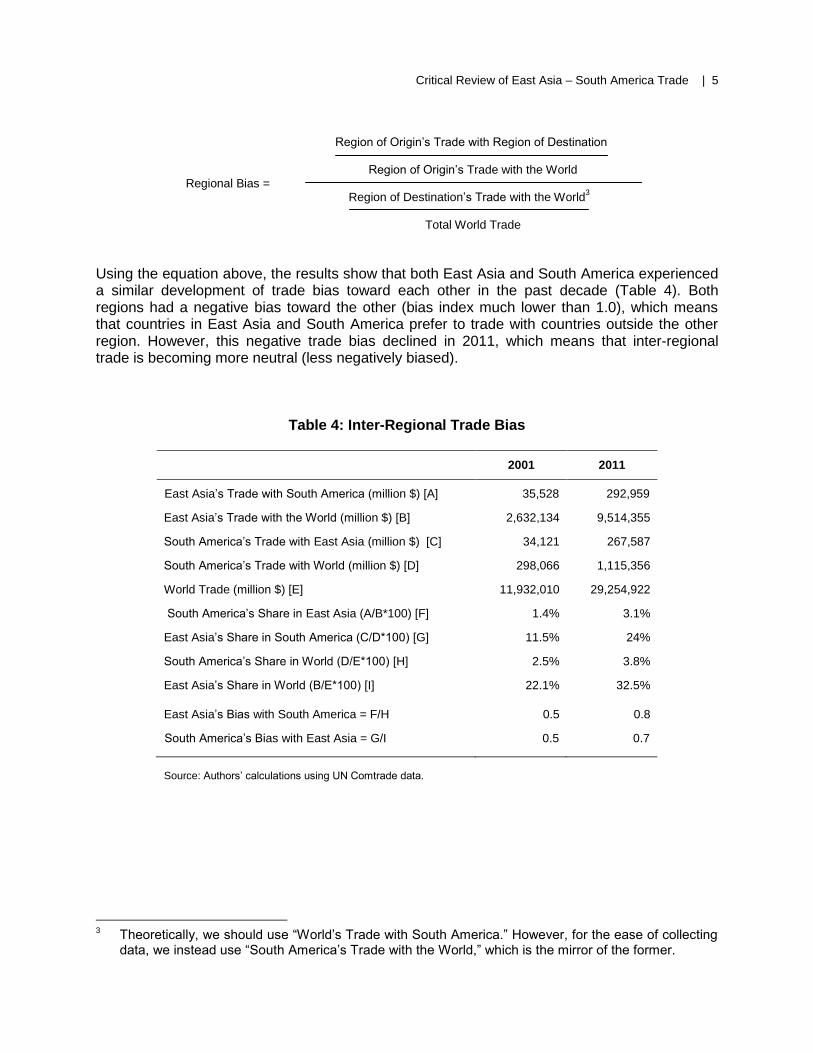
Critical Review of East Asia – South America Trade | 5
Region of Origin’s Trade with Region of Destination
Region of Origin’s Trade with the World
Regional Bias = Region of Destination’s Trade with the World
3
Total World Trade
Using the equation above, the results show that both East Asia and South America experienced a similar development of trade bias toward each other in the past decade (Table 4). Both regions had a negative bias toward the other (bias index much lower than 1.0), which means that countries in East Asia and South America prefer to trade with countries outside the other region. However, this negative trade bias declined in 2011, which means that inter-regional trade is becoming more neutral (less negatively biased).
Table 4: Inter-Regional Trade Bias
2001 2011
East Asia’s Trade with South America (million $) [A] 35,528 292,959
East Asia’s Trade with the World (million $) [B] 2,632,134 9,514,355
South America’s Trade with East Asia (million $) [C] 34,121 267,587
South America’s Trade with World (million $) [D] 298,066 1,115,356
World Trade (million $) [E] 11,932,010 29,254,922
South America’s Share in East Asia (A/B*100) [F] 1.4% 3.1%
East Asia’s Share in South America (C/D*100) [G] 11.5% 24%
South America’s Share in World (D/E*100) [H] 2.5% 3.8%
East Asia’s Share in World (B/E*100) [I] 22.1% 32.5%
East Asia’s Bias with South America = F/H 0.5 0.8
South America’s Bias with East Asia = G/I 0.5 0.7
Source: Authors’ calculations using UN Comtrade data.
3 Theoretically, we should use ―World’s Trade with South America.‖ However, for the ease of collecting
data, we instead use ―South America’s Trade with the World,‖ which is the mirror of the former.
6 | Working Paper Series on Regional Economic Integration No. 105
3. East Asia’s Trade Ties with South America: The People’s Republic of China and Japan Compared
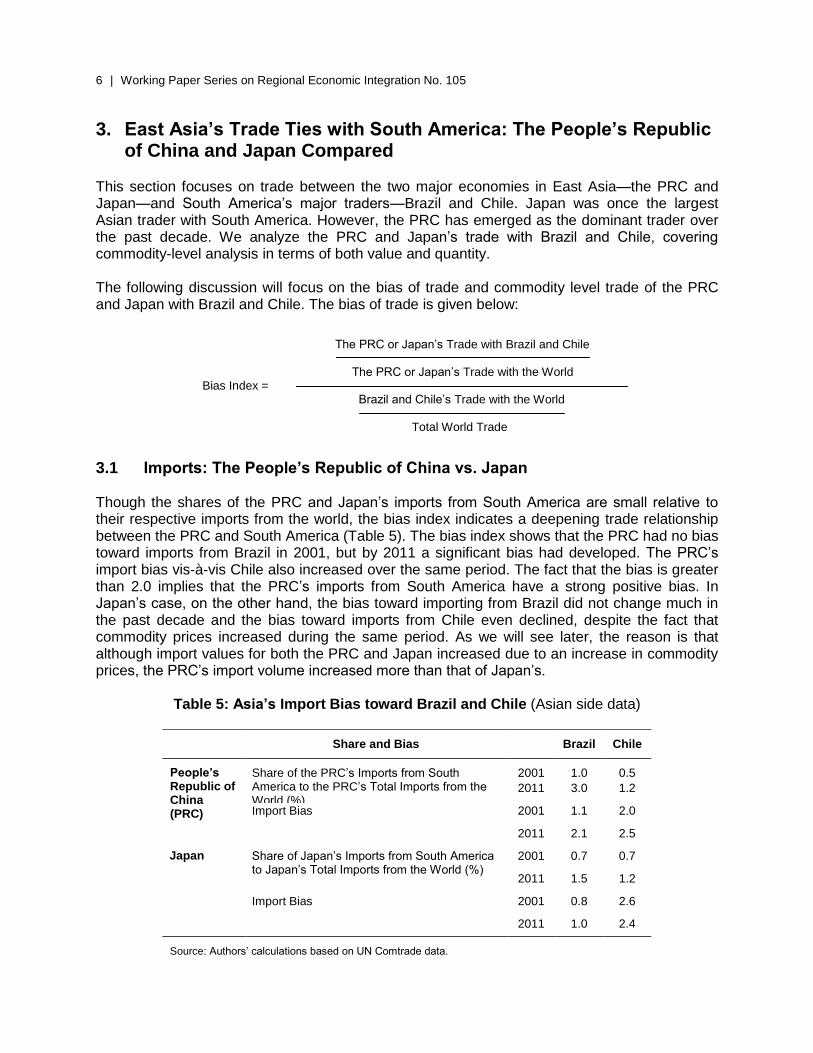
This section focuses on trade between the two major economies in East Asia—the PRC and Japan—and South America’s major traders—Brazil and Chile. Japan was once the largest Asian trader with South America. However, the PRC has emerged as the dominant trader over the past decade. We analyze the PRC and Japan’s trade with Brazil and Chile, covering commodity-level analysis in terms of both value and quantity. The following discussion will focus on the bias of trade and commodity level trade of the PRC and Japan with Brazil and Chile. The bias of trade is given below:
The PRC or Japan’s Trade with Brazil and Chile
The PRC or Japan’s Trade with the World
Bias Index = Brazil and Chile’s Trade with the World
Total World Trade
3.1 Imports: The People’s Republic of China vs. Japan Though the shares of the PRC and Japan’s imports from South America are small relative to their respective imports from the world, the bias index indicates a deepening trade relationship between the PRC and South America (Table 5). The bias index shows that the PRC had no bias toward imports from Brazil in 2001, but by 2011 a significant bias had developed. The PRC’s import bias vis-à-vis Chile also increased over the same period. The fact that the bias is greater than 2.0 implies that the PRC’s imports from South America have a strong positive bias. In Japan’s case, on the other hand, the bias toward importing from Brazil did not change much in the past decade and the bias toward imports from Chile even declined, despite the fact that commodity prices increased during the same period. As we will see later, the reason is that although import values for both the PRC and Japan increased due to an increase in commodity prices, the PRC’s import volume increased more than that of Japan’s.
Table 5: Asia’s Import Bias toward Brazil and Chile (Asian side data)
Source: Authors’ calculations based on UN Comtrade data.
Share and Bias Brazil Chile
People’s Republic of China (PRC)
Share of the PRC’s Imports from South America to the PRC’s Total Imports from the World (%)
2001 1.0 0.5
2011 3.0 1.2
Import Bias 2001 1.1 2.0
2011 2.1 2.5
Japan Share of Japan’s Imports from South America to Japan’s Total Imports from the World (%)
2001 0.7 0.7
2011 1.5 1.2
Import Bias
2001 0.8 2.6
2011 1.0 2.4

Critical Review of East Asia – South America Trade | 7
Table 6 lists the major imports of the PRC from Brazil as indicated by their shares. These items are mostly mineral products, vegetable products, base metals, and foodstuffs. Between 70% and 90% of the PRC’s imports from the two countries consist of HS 12, HS 26, and HS 74. Imports from Brazil are mostly HS 26 and HS 12. The largest import of the PRC from Brazil is HS 260111 under HS 26, and HS 120100 under HS 12. On the other hand, imports from Chile are mostly HS 74 and HS 26. Under HS 74, nearly all imports are HS 740311, and HS 260300 under HS 26. A large portion of the PRC’s imports from Brazil and Chile are limited to a few 6-digit items. Further, these items are primary products (mainly natural resources and agricultural products). While some have argued that trade with the PRC brings an opportunity for South America to diversify its exports (Calle 2010), this has not been the case so far.
Table 6: The PRC’s Major Import Items from Brazil and Chile (PRC side data)
PRC = People’s Republic of China. Note: Share = (PRC's import of the product from Brazil or Chile in 2011 / PRC's total imports from Brazil or Chile in 2011) * 100. Source: Authors’ calculations based on UN Comtrade data.
Value %
in 2011
Volume
million $ million kg
200 2011 2001 2011
Brazil 26 Ores, slag, and ash 762 26,157 49.9
260111 Iron ore, concentrate, not iron pyrites, unagglomerated
540 23,935 45.7 19,691 134,164
260112 Iron ore, concentrate, not iron pyrites, agglomerated
205 1,822 3.5 4,844 8,538
12 Oil seed, oleagic fruits, grain, seed, fruit, etc., nes 620 11,791 22.5
120100 Soya beans 620 11,790 3,160 20,622
27 Mineral fuels, oils, distillation products, etc. 0.0 4,885 9.3
47 Pulp of wood, fibrous cellulosic material, waste, etc. 149 1,824 3.5
17 Sugars and sugar confectionery 24 1,268 2.4
Chile 74 Copper and articles thereof 564 12,610 61.3
740311 Copper cathodes and sections of cathodes unwrought
529 11,219 54.5 320 1,264
740200 Unrefined copper, copper anodes, electrolytic refining
28 1,216 5.9 17 123
26 Ores, slag, and ash 326 5,532 26.9
260300 Copper ores and concentrates 311 3,743 18.2 694 1,427
260111 Iron ore, concentrate, not iron pyrites, unagglomerated
6 1,391 6.8 190 7,695
47 Pulp of wood, fibrous cellulosic material, waste etc 243 998 4.9
08 Edible fruit, nuts, peel of citrus fruit, melons 22 452 2.2
23 Residues, wastes of food industry, animal fodder 57 199 1.0

8 | Working Paper Series on Regional Economic Integration No. 105
In the case of Japan, the dominant imports from South America are HS 02, HS 03, and HS 26 (Table 7). About 67% of imports from Brazil are HS 26 and HS 02. The majority of these imports are under HS 260111 and HS 260112, and HS 020714. Around 76% of Japan’s imports from Chile are HS 26 and HS 03, which mainly consist of HS 260300, HS 261310, HS 030310, and HS 030420.
Table 7: Japan’s Major Import Items from Brazil and Chile (Japanese side data)
Value % in 2011
Volume
million $ million kg
2001 2011 2001 2011
Brazil 26 Ores, slag and ash 6,826 53.8
260111 Iron ore, concentrate, not iron pyrites, unagglomerated
584 5,275 41.6 21,975 29,301
260112 Iron ore, concentrate, not iron pyrites, agglomerated
113 1,520 12 2,821 7,363
02 Meat and edible meat offal 1,481 11.7
020714 Fowls, cuts & offal, fro 150 1,463 11.6 104 408
020712 Fowls, domestic, not cut 7 11 0.1 5 5
09 Coffee, tea, mate and spices 619 4.9
76 Aluminium and articles thereof 559 4.4
72 Iron and steel 461 3.6
Chile 26 Ores, slag, and ash 5,875 59.8
260300 Copper ores and concentrates 767 5,030 51.2 1,781 2,084
261310 Molybdenum concentrates, roasted 38 458 4.7 12 22
03 Fish, crustaceans, molluscs, aquatic invertebrates nes 1,521 15.5
030310 Salmon, Pacific, frozen, whole 238 568 5.8 86 94
030420 Fish fillets, frozen 120 537 5.5 24 49
74 Copper and articles thereof 759 7.7
44 Wood and articles of wood, wood charcoal 726 7.4
02 Meat and edible meat offal 215 2.2
Source: Authors’ calculations using UN Comtrade data. Note: Share = (Japan’s import of the product from Brazil or Chile in 2011 / Japan’s total import from Brazil or Chile in 2011)*100.

Critical Review of East Asia – South America Trade | 9
It is evident that the imports of the PRC and Japan from South America are concentrated in a limited number of 6-digit items and that in both countries imports have been affected by increases in commodity prices. The difference between the two countries is that the PRC’s import volume increased more than that of Japan’s between 2001 and 2011. The mechanism by which the PRC’s imports from Brazil and Chile increased implies an inflationary phenomenon in addition to a large increase in volume. To illustrate this, consider that while the value of HS 120100 imports of the PRC from Brazil increased by nearly 20 times in the past decade, the volume increased by only seven times. Likewise, HS 260111 imports from Brazil increased by around 44 times in terms of value between 2001 and 2011, while increasing only seven times in terms of volume. In the case of the PRC’s imports from Chile, HS 740311 imports increased by around 21 times in terms of value, and only four times in terms of volume. On the other hand, increases in Japan’s imports from Brazil and Chile can mainly be explained by increases in commodity prices. HS 260111 imports from Brazil increased only 33% in terms of volume, although they increased 9 times in terms of value. Likewise, HS 260300 imports from Chile increased only 17% in terms of volume, compared to seven times in terms of value. These observations imply that if commodity prices had been stable, the value of Japan’s imports from South America would not have increased much between 2001 and 2011.
3.2 Exports: The People’s Republic of China vs. Japan Though the shares of the PRC and Japan’s exports to South America are small relative to their exports to the world, there seems to be a deepening trade relationship indicated by the bias index (Table 8). The PRC had a negative bias toward Brazil until it became neutral in 2011. In the case of Chile, the bias has not changed significantly since 2001. Since the PRC’s export bias toward both countries was nearly 1.0 in 2011, it appears that the PRC exported to South American countries in 2011 just like it exported to other countries, unlike in 2001 when it preferred to trade with partners other than Brazil and Chile. In the case of Japan, on the other hand, the bias index toward both Brazil and Chile remained small and had not changed that much over the most recent decade. Japan’s export bias index with the two countries remains lower than 1.0, which means that Japan has a negative bias toward them. It can, therefore, be argued that while exporting to South America is becoming more important for the PRC it remains insignificant for Japan.
Table 8: Asia’s Export Bias toward Brazil and Chile (Asian side data)
Source: Authors’ calculations based on UN Comtrade data.
Share and Bias Brazil Chile
China, People’s Rep. of (PRC)
The PRC’s Exports to South America as a share of the PRC’s Exports to the World (%)
2001 0.5 0.3
2011 1.7 0.6
Export Bias 2001 0.5 1.0
2011 1.0 1.0
Japan Japan’s Exports to South America as a share of Japan’s Exports to the World (%)
2001 0.6 0.1
2011 0.8 0.3
Export Bias 2001 0.6 0.4
2011 0.4 0.5

10 | Working Paper Series on Regional Economic Integration No. 105
Table 9 lists the major exports of the PRC to Brazil and Chile. Around 30%–50% of the PRC’s exports to the two countries consist of HS 84, HS 85, and HS 87. For exports to Chile, apparel-related items (HS 61 and HS 62) are dominant as well. Unlike the case of imports from South America, the PRC’s exports are not concentrated among a few 6-digit items. The PRC’s largest export item under HS 85 (HS 851790) accounts for only 10% of the entire HS 85 group. The largest export item under HS 84 (HS 847330) accounts for only 12% of this 2-digit group. In the case of the PRC’s exports to Chile, the largest item under HS 85 is HS 852520, which accounts for 25%. Moreover, Chinese exports to South America have become more diversified with the addition of newly traded items in 2011. For example, in the case of the PRC’s exports to Chile, newly exported items in 2011 are HS 848180, HS 845011, HS 852812, HS 870322, and HS 870210. Overall, the PRC exports various types of electric appliances such as air conditioners, radios, televisions, and washing machines to South America.
Table 9: The PRC’s Major Export Items to Brazil and Chile (PRC side data)
Major Item
(Based on 2011 shares)
Value % in 2011
Volume
million $ million kg or # Note
2001 2011 2001 2011
Brazil 85 Electrical, electronic equipment 365 7,462 23.4
851790 Parts of line telephone/telegraph equipment, nes
8 815 2.6 0.7 9 kg
854230 Monolithic integrated circuit 0.3 668 2.1 0.0 0.3 #
852990 Parts for radio and TV transmit–receive equipment, nes
22 456 1.4 0.1 33 kg
851780 Electric apparatus for line 0 430 1.4 0 – #
84 Nuclear reactors, boilers, machinery, etc
191 5,889 18.5
847330 Parts and accessories of data processing equipment, nes
38 726 2.3 11 32 kg
841510 Air conditioners window and wall types, self-contained
1 270 0.9 0.2 25 #
847130 Portable digital data pr 0 245 0.8 0 1 #
90 Optical, photo, technical, medical, etc apparatus
31 2,023 6.4
87 Vehicles other than railway, tramway 18 1,601 5
870322 Automobiles, spark ignition engine of 1000–1500 cc
0.0 332 1.0 0.0 38 #
871419 Motorcycle parts except sacaddles
3 142 0.4 1 31 kg
870323 Automobiles, spark ignition engine of 1500–3000 cc
0 136 0.4 0 13 #
29 Organic chemicals 100 1,425 4.5
Chile 85 Electrical, electronic equipment 89 1,563 14.5
852520 Transmit–receive apparatus for radio, TV, etc.
0.0 391 3.6 0.0 1 #
852812 Color television receive 3.4 226 2.1 – 7 #

Critical Review of East Asia – South America Trade | 11
Major Item
(Based on 2011 shares)
Value % in 2011
Volume
million $ million kg or # Note
2001 2011 2001 2011
851780 Electric apparatus for line 0.0 117 1.1 0.0 – #
84 Nuclear reactors, boilers, machinery, etc 52 1,281 11.8
847130 Portable digital data pr 0 425 3.9 0 2 #
848180 Taps, cocks, valves and similar appliances, nes
7 65 0.6 0.6 7 Kg
847160 I/O units w/in storage 17 51 0.5 0.6 1 #
61 Articles of apparel, accessories, knit or crochet
95 1,153 10.7
62 Articles of apparel, accessories, not knit or crochet
126 945 8.74
87 Vehicles other than railway, tramway 17 716 6.6 870322 Automobiles, spark ignition
engine of 1000–1500 cc 0 174 1.6 0 20 #
870210 Diesel powered buses 0 75 0.7 0 9 #
871120 Motorcycles, spark ignition engine of 50–250 cc
0.3 63 0.6 0.0 4 #
– = Data not available. Source: Authors’ calculations using UN Comtrade data.
Table 10 lists the major exports of Japan to Brazil and Chile. As shown by the shares, the most dominant exports of Japan to these two countries are HS 84 and HS 87. The concentration of exports in HS 84 and HS 87 is clearer in the case of Japan than in the PRC’s case. The concentration of exports in a limited number of 6-digit items is evident in the case of Japan’s exports. In particular, HS 870323 and other automobile-related parts are critically important export items for Japan, although Japan also exports intermediate products including machineries.
Table 10: Japan’s Major Export Items to Brazil and Chile (Japanese side data)
Major Item
(Based on 2011 shares)
Value
% in 2011
Volume
million $ million kg
or # Note
2001 2011 2001 2011
Brazil 84 Nuclear reactors, boilers, machinery, etc 716 1,970 31.8
840991 Parts for spark-ignition engines except aircraft
64 248 4 3 8 kg
847989 Machines and mechanical appliances nes
33 131 2.1 0.6 1 #
87 Vehicles other than railway, tramway 389 1,587 25.6
870323 Automobiles, spark ignition engine of 1500–3000 cc
68 517 8.3 – 48 #
Table 9: Continued

12 | Working Paper Series on Regional Economic Integration No. 105
Major Item
(Based on 2011 shares)
Value
% in 2011
Volume
million $ million kg
or # Note
2001 2011 2001 2011
870840 Transmissions for motor vehicles 27 222 3.6 2 12 kg
85 Electrical, electronic equipment 581 624
90 Optical, photo, technical, medical, etc apparatus 206 329 5.3
40 Rubber and articles thereof 47 273 4.4
Chile
87 Vehicles other than railway, tramway 241 1,039 44.3
870323 Automobiles, spark ignition engine of 1500–3000 cc
83 468 20 – 44 #
870322 Automobiles, spark ignition engine of 1000–1500 cc
19 209 8.9 – 24 #
27 Mineral fuels, oils, distillation products, etc 0.8 582 24.8
271000 Petroleum oils and oils obta 0 582 24.8 0 624 kg
271220 Paraffin wax containing < 0.75% oil 0 0.2 0.0 0 0.1 kg
84 Nuclear reactors, boilers, machinery, etc 56 295 12.6
842952 Shovels and excavators with revolving superstructure
4 54 2.3 2 8 #
842720 Self-propelled works trucks, non-electric 5 43 1.8 2 8 #
40 Rubber and articles thereof 47 169 7.2
90 Optical, photo, technical, medical, etc apparatus 17 56 2.4
– = Data not available. Share = (Japan’s export of the product to Brazil or Chile in 2011 / Japan's total exports to Brazil or Chile in 2011)*100. Source: Authors’ calculations using UN Comtrade data.
4. Summary There is a general consensus that trade between East Asia and South America is becoming more important. In this paper, we consider the question of whether the trend of inter-regional trade is a general phenomena or a country- or commodity-specific issue, and whether the increase in inter-regional trade has a solid basis in terms of commodity diversification and price and quantity effects. We found that (i) the increase in inter-regional trade between the two regions can mainly be explained by the increase in the PRC’s trade with South America, (ii) the increase in the PRC’s imports from South America is limited to a few types of commodities, (iii) the increase in East Asia’s commodity imports from South America is partly due to commodity price increases, and (iv) the PRC has begun to export various types of electronics and machinery products to South America. The comparison between the trade of the PRC and Japan with South America is interesting. While Japan was the largest Asian trader with South America in 2001, the PRC had become East Asia’s largest trader with South America by 2011. The majority of the PRC’s imports from
Table 10: Continued

Critical Review of East Asia – South America Trade | 13
South America are primary products. For example, around 70% of Chinese imports from Brazil are iron ore (HS 260111) and soya beans (HS 120100), and around 80% of Chinese imports from Chile are copper ores (HS 260300) and copper cathodes (HS 740311). The PRC’s primary product imports from South America increased significantly between 2001 and 2011, due to an increase in both volumes and prices. Furthermore, while Japan’s primary product imports also increased in terms of value over the same period, the increase in import volumes was small, which implies that if commodity prices had remained stable, the value of Japan’s imports from South America would not have increased. Thus, South America’s exports to East Asia are extremely vulnerable to commodity price fluctuations (Koleski 2011). In the case of East Asia’s exports to South America, with the PRC being the dominant exporter, the items being exported are diverse. For example, the PRC has begun to export to Brazil and Chile various types of electric appliances such as air conditioners, radios, televisions, and washing machines, which may eventually have a negative influence on domestic production as suggested by Rosales (2012). On the other hand, Japan’s exports to Brazil and Chile are less diverse, consisting mainly of automobiles and intermediate products. If we look at the aggregate level, it appears that inter-regional trade between East Asia and South America is increasing. However, cross-country and commodity analysis in this paper reveals several important features of this inter-regional trade. First, while East Asia’s imports from South America (South America’s exports to East Asia) are larger than East Asia’s exports to South America (South America’s imports from East Asia), East Asia’s import items are limited to a small number of primary commodities. Moreover, the recent increase in commodity import values is partly due to commodity price increases. Thus, South America’s exports may decline sharply in terms of value if commodity prices were to decline. Second, the PRC has recently started to export various types of electric appliances to South America. Chinese products are successfully penetrating South American markets and this trend may continue for a while. Thus, East Asia’s exports, particularly the PRC’s, are expected to continue growing steadily. Even though South America currently enjoys a trade surplus with East Asia, it is East Asia’s (the PRC’s) exports to South America that are expected to grow steadily rather than South America’s exports to East Asia, which are vulnerable to commodity price fluctuations. Overall, the growth trend of East Asian exports to South America seems to be more promising than that of South American exports to East Asia.

14 | Working Paper Series on Regional Economic Integration No. 105
References
Asian Development Bank (ADB), Inter-American Development Bank (IDB), and Asian Development Bank Institute (ADBI). 2012. Shaping the Future of Asia and the Pacific–Latin America and Caribbean Relationship.
M.A. Calle. 2010. A Brief Note about the [People's Republic of] China–Latin American Trade
Partnership: An Opportunity for Trade Diversification or a Threat to a Green Agenda in the Region? Revista de Negocios Internacionales. 3 (2). pp. 57–63.
S. Hamanaka. 2012. Is Trade in Asia Really Integrating? ADB Working Paper Series on
Regional Economic Integration. 91. Manila: ADB. R. Jenkins. 2012. Latin America and [the People's Republic of] China—A New Dependency.
Third World Quarterly. 33 (7). pp. 1337–1358. K. Koleski. 2011. Backgrounder: [The People's Republic of] China in Latin America. US–
[People's Republic of] China Economic and Security Review Commission. http://www.uscc.gov/ Backgrounder_China_in_Latin_America.pdf
M. Plummer, D. Cheong, and S. Hamanaka. 2010. Methodology for Impact Assessment of Free
Trade Agreements. Manila: ADB.
O. Rosales. 2012. Trade Competition from [the People's Republic of] China. Quarterly Americas.
Americas Society and Council of the Americas. J. Whalley and D. Medianu. 2010. The Deepening [People's Republic of] China–Brazil
Economic Relationship. CESifo Working Paper Series. 3289.

Critical Review of East Asia – South America Trade | 15
ADB Working Paper Series on Regional Economic Integration*
1. ―The ASEAN Economic Community and the European Experience‖ by Michael G.
Plummer
2. ―Economic Integration in East Asia: Trends, Prospects, and a Possible Roadmap‖ by Pradumna B. Rana
3. ―Central Asia after Fifteen Years of Transition: Growth, Regional Cooperation, and Policy Choices‖ by Malcolm Dowling and Ganeshan Wignaraja
4. ―Global Imbalances and the Asian Economies: Implications for Regional Cooperation‖ by Barry Eichengreen
5. ―Toward Win-Win Regionalism in Asia: Issues and Challenges in Forming Efficient Trade Agreements‖ by Michael G. Plummer
6. ―Liberalizing Cross-Border Capital Flows: How Effective Are Institutional Arrangements against Crisis in Southeast Asia‖ by Alfred Steinherr, Alessandro Cisotta, Erik Klär, and Kenan Šehović
7. ―Managing the Noodle Bowl: The Fragility of East Asian Regionalism‖ by Richard E. Baldwin
8. ―Measuring Regional Market Integration in Developing Asia: a Dynamic Factor Error Correction Model (DF-ECM) Approach‖ by Duo Qin, Marie Anne Cagas, Geoffrey Ducanes, Nedelyn Magtibay-Ramos, and Pilipinas F. Quising
9. ―The Post-Crisis Sequencing of Economic Integration in Asia: Trade as a Complement to a Monetary Future‖ by Michael G. Plummer and Ganeshan Wignaraja
10. ―Trade Intensity and Business Cycle Synchronization: The Case of East Asia‖ by Pradumna B. Rana
11. ―Inequality and Growth Revisited‖ by Robert J. Barro
12. ―Securitization in East Asia‖ by Paul Lejot, Douglas Arner, and Lotte Schou-Zibell
13. ―Patterns and Determinants of Cross-border Financial Asset Holdings in East Asia‖ by Jong-Wha Lee
14. ―Regionalism as an Engine of Multilateralism: A Case for a Single East Asian FTA‖ by Masahiro Kawai and Ganeshan Wignaraja
15. ―The Impact of Capital Inflows on Emerging East Asian Economies: Is Too Much Money Chasing Too Little Good?‖ by Soyoung Kim and Doo Yong Yang
16. ―Emerging East Asian Banking Systems Ten Years after the 1997/98 Crisis‖ by Charles Adams

16 | Working Paper Series on Regional Economic Integration No. 105
17. ―Real and Financial Integration in East Asia‖ by Soyoung Kim and Jong-Wha Lee
18. ―Global Financial Turmoil: Impact and Challenges for Asia’s Financial Systems‖ by Jong-Wha Lee and Cyn-Young Park
19. ―Cambodia’s Persistent Dollarization: Causes and Policy Options‖ by Jayant Menon
20. ―Welfare Implications of International Financial Integration‖ by Jong-Wha Lee and Kwanho Shin
21. ―Is the ASEAN-Korea Free Trade Area (AKFTA) an Optimal Free Trade Area?‖ by Donghyun Park, Innwon Park, and Gemma Esther B. Estrada
22. ―India’s Bond Market—Developments and Challenges Ahead‖ by Stephen Wells and Lotte Schou- Zibell
23. ―Commodity Prices and Monetary Policy in Emerging East Asia‖ by Hsiao Chink Tang
24. ―Does Trade Integration Contribute to Peace?‖ by Jong-Wha Lee and Ju Hyun Pyun
25. ―Aging in Asia: Trends, Impacts, and Responses‖ by Jayant Menon and Anna Melendez-Nakamura
26. ―Re-considering Asian Financial Regionalism in the 1990s‖ by Shintaro Hamanaka
27. ―Managing Success in Viet Nam: Macroeconomic Consequences of Large Capital Inflows with Limited Policy Tools‖ by Jayant Menon
28. ―The Building Block versus Stumbling Block Debate of Regionalism: From the Perspective of Service Trade Liberalization in Asia‖ by Shintaro Hamanaka
29. ―East Asian and European Economic Integration: A Comparative Analysis‖ by Giovanni Capannelli and Carlo Filippini
30. ―Promoting Trade and Investment in India’s Northeastern Region‖ by M. Govinda Rao
31. ―Emerging Asia: Decoupling or Recoupling‖ by Soyoung Kim, Jong-Wha Lee, and Cyn-Young Park
32. ―India’s Role in South Asia Trade and Investment Integration‖ by Rajiv Kumar and Manjeeta Singh
33. ―Developing Indicators for Regional Economic Integration and Cooperation‖ by Giovanni Capannelli, Jong-Wha Lee, and Peter Petri

Critical Review of East Asia – South America Trade | 17
34. ―Beyond the Crisis: Financial Regulatory Reform in Emerging Asia‖ by Chee Sung Lee and Cyn-Young Park
35. ―Regional Economic Impacts of Cross-Border Infrastructure: A General Equilibrium Application to Thailand and Lao People’s Democratic Republic‖ by Peter Warr, Jayant Menon, and Arief Anshory Yusuf
36. ―Exchange Rate Regimes in the Asia-Pacific Region and the Global Financial Crisis‖ by Warwick J. McKibbin and Waranya Pim Chanthapun
37. ―Roads for Asian Integration: Measuring ADB's Contribution to the Asian Highway Network‖ by Srinivasa Madhur, Ganeshan Wignaraja, and Peter Darjes
38. ―The Financial Crisis and Money Markets in Emerging Asia‖ by Robert Rigg and Lotte Schou-Zibell
39. ―Complements or Substitutes? Preferential and Multilateral Trade Liberalization at the Sectoral Level‖ by Mitsuyo Ando, Antoni Estevadeordal, and Christian Volpe Martincus
40. ―Regulatory Reforms for Improving the Business Environment in Selected Asian Economies—How Monitoring and Comparative Benchmarking can Provide Incentive for Reform‖ by Lotte Schou-Zibell and Srinivasa Madhur
41. ―Global Production Sharing, Trade Patterns, and Determinants of Trade Flows in East Asia‖ by Prema-chandra Athukorala and Jayant Menon
42. ―Regionalism Cycle in Asia (-Pacific): A Game Theory Approach to the Rise and Fall of Asian Regional Institutions‖ by Shintaro Hamanaka
43. ―A Macroprudential Framework for Monitoring and Examining Financial Soundness‖ by Lotte Schou-Zibell, Jose Ramon Albert, and Lei Lei Song
44. ―A Macroprudential Framework for the Early Detection of Banking Problems in Emerging Economies‖ by Claudio Loser, Miguel Kiguel, and David Mermelstein
45. ―The 2008 Financial Crisis and Potential Output in Asia: Impact and Policy Implications‖ by Cyn-Young Park, Ruperto Majuca, and Josef Yap
46. ―Do Hub-and-Spoke Free Trade Agreements Increase Trade? A Panel Data Analysis‖ by Jung Hur, Joseph Alba, and Donghyun Park
47. ―Does a Leapfrogging Growth Strategy Raise Growth Rate? Some International Evidence‖ by Zhi Wang, Shang-Jin Wei, and Anna Wong
48. ―Crises in Asia: Recovery and Policy Responses‖ by Kiseok Hong and Hsiao Chink Tang

18 | Working Paper Series on Regional Economic Integration No. 105
49. ―A New Multi-Dimensional Framework for Analyzing Regional Integration: Regional Integration Evaluation (RIE) Methodology‖ by Donghyun Park and Mario Arturo Ruiz Estrada
50. ―Regional Surveillance for East Asia: How Can It Be Designed to Complement Global Surveillance?‖ by Shinji Takagi
51. ―Poverty Impacts of Government Expenditure from Natural Resource Revenues‖ by Peter Warr, Jayant Menon, and Arief Anshory Yusuf
52. ―Methods for Ex Ante Economic Evaluation of Free Trade Agreements‖ by David Cheong
53. ―The Role of Membership Rules in Regional Organizations‖ by Judith Kelley
54. ―The Political Economy of Regional Cooperation in South Asia‖ by V.V. Desai
55. ―Trade Facilitation Measures under Free Trade Agreements: Are They Discriminatory against Non-Members?‖ by Shintaro Hamanaka, Aiken Tafgar, and Dorothea Lazaro
56. ―Production Networks and Trade Patterns in East Asia: Regionalization or Globalization?‖ by Prema-chandra Athukorala
57. ―Global Financial Regulatory Reforms: Implications for Developing Asia‖ by Douglas W. Arner and Cyn-Young Park
58. ―Asia’s Contribution to Global Rebalancing‖ by Charles Adams, Hoe Yun Jeong, and Cyn-Young Park
59. ―Methods for Ex Post Economic Evaluation of Free Trade Agreements‖ by David Cheong
60. ―Responding to the Global Financial and Economic Crisis: Meeting the Challenges in Asia‖ by Douglas W. Arner and Lotte Schou-Zibell
61. ―Shaping New Regionalism in the Pacific Islands: Back to the Future?‖ by Satish Chand
62. ―Organizing the Wider East Asia Region‖ by Christopher M. Dent
63. ―Labour and Grassroots Civic Interests In Regional Institutions‖ by Helen E.S. Nesadurai
64. ―Institutional Design of Regional Integration: Balancing Delegation and Representation‖ by Simon Hix
65. ―Regional Judicial Institutions and Economic Cooperation: Lessons for Asia?‖ by Erik Voeten

Critical Review of East Asia – South America Trade | 19
66. ―The Awakening Chinese Economy: Macro and Terms of. Trade Impacts on 10 Major Asia-Pacific Countries‖ by Yin Hua Mai, Philip Adams, Peter Dixon, and Jayant Menon
67. ―Institutional Parameters of a Region-Wide Economic Agreement in Asia: Examination of Trans-Pacific Partnership and ASEAN+α Free Trade Agreement Approaches‖ by Shintaro Hamanaka
68. ―Evolving Asian Power Balances and Alternate Conceptions for Building Regional Institutions‖ by Yong Wang
69. ―ASEAN Economic Integration: Features, Fulfillments, Failures, and the Future‖ by Hal Hill and Jayant Menon
70. ―Changing Impact of Fiscal Policy on Selected ASEAN Countries‖ by Hsiao Chink Tang, Philip Liu, and Eddie C. Cheung
71. ―The Organizational Architecture of the Asia-Pacific: Insights from the New Institutionalism‖ by Stephan Haggard
72. ―The Impact of Monetary Policy on Financial Markets in Small Open Economies: More or Less Effective During the Global Financial Crisis?‖ by Steven Pennings, Arief Ramayandi, and Hsiao Chink Tang
73. ―What do Asian Countries Want the Seat at the High Table for? G20 as a New Global Economic Governance Forum and the Role of Asia‖ by Yoon Je Cho
74. ―Asia’s Strategic Participation in the Group of 20 for Global Economic Governance Reform: From the Perspective of International Trade‖ by Taeho Bark and Moonsung Kang
75. ―ASEAN’s Free Trade Agreements with the People’s Republic of China, Japan, and the Republic of Korea: A Qualitative and Quantitative Analysis‖ by Gemma Estrada, Donghyun Park, Innwon Park, and Soonchan Park
76. ―ASEAN-5 Macroeconomic Forecasting Using a GVAR Model‖ by Fei Han and Thiam Hee Ng
77. ―Early Warning Systems in the Republic of Korea: Experiences, Lessons, and Future Steps‖ by Hyungmin Jung and Hoe Yun Jeong
78. ―Trade and Investment in the Greater Mekong Subregion: Remaining Challenges and the Unfinished Policy Agenda‖ by Jayant Menon and Anna Cassandra Melendez
79. ―Financial Integration in Emerging Asia: Challenges and Prospects‖ by Cyn-Young Park and Jong-Wha Lee
80. ―Sequencing Regionalism: Theory, European Practice, and Lessons for Asia‖ by Richard E. Baldwin

20 | Working Paper Series on Regional Economic Integration No. 105
81. ―Economic Crises and Institutions for Regional Economic Cooperation‖ by C. Randall Henning
82. ―Asian Regional Institutions and the Possibilities for Socializing the Behavior of States‖ by Amitav Acharya
83. ―The People’s Republic of China and India: Commercial Policies in the Giants‖ by Ganeshan Wignaraja
84. ―What Drives Different Types of Capital Flows and Their Volatilities‖ by Rogelio Mercado and Cyn-Young Park
85. ―Institution Building for Africal Regionalism‖ by Gilbert M. Khadiagala
86. ―What Drives Different Types of Capital Flows and Their Volatilities‖ by Rogelio Mercado and Cyn-Young Park
87. ―The Role of the People’s Republic of China in International Fragmentation and Production Networks: An Empirical Investigation‖ by Hyun-Hoon Lee, Donghyun Park, and Jing Wang
88. ―Utilizing the Multiple Mirror Technique to Assess the Quality of Cambodian Trade Statistics: by Shintaro Hamanaka
89. ―Is Technical Assistance under Free Trade Agreements WTO-Plus?‖ Review of Japan–ASEAN Economic Partnership Agreements‖ by Shintaro Hamanaka
90. ―Intra-Asia Exchange Rate Volatility and Intra-Asia Trade: Evidence by of Goods‖ by Hsiao Chink Tang
91. ―Is Trade in Asia Really Integrating?‖ by Shintaro Hamanaka
92. ―The PRC's Free Trade Agreements with ASEAN, Japan, and the Republic of Korea: A Comparative Analysis‖ by Gemma Estrada, Donghyun Park, Innwon Park, and Soonchan Park
93. ―Assessing the Resilience of ASEAN Banking Systems: The Case of Philippines‖ by Jose Ramon Albert and Thiam Hee Ng‖
94. ―Strengthening the Financial System and Mobilizing Savings to Support More Balanced Growth in ASEAN+3" by A. Noy Siackhachanh
95. ‖Measuring Commodity-Level Trade Costs in Asia: The Basis for Effective Trade Facilitation Policies in the Region‖ by Shintaro Hamanaka and Romana Domingo
96. ―Why do Imports Fall More than Exports Especially During Crises? Evidence from Selected Asian Economies‖ by Hsiao Chink Tang
97. ―Determinants of Local Currency Bonds and Foreign Holdings: Implications for Bond Market Development in the People’s Republic of China‖ by Kee-Hong Bae
Critical Review of East Asia – South America Trade | 21
98. ―ASEAN–China Free Trade Area and the Competitiveness of Local Industries: A Case Study of Major Industries in the Lao People’s Democratic Republic‖ by Leebeer Leebouapao, Sthabandith Insisienmay, and Vanthana Nolintha
99. ―The Impact of ACFTA on People's Republic of China-ASEAN Trade: Estimates Based on an Extended Gravity Model for Component Trade‖ by Yu Sheng, Hsiao Chink Tang, and Xinpeng Xu
100. ―Narrowing the Development Divide in ASEAN: The Role of Policy‖ by Jayant Menon
101. ―Different Types of Firms, Products, and Directions of Trade: The Case of the People’s Republic of China‖ by Hyun-Hoon Lee, Donghyun Park, and Jing Wang
102. ―Anatomy of South–South FTAs in Asia: Comparisons with Africa, Latin America, and the Pacific Islands‖ by Shintaro Hamanaka
103. ―Japan's Education Services Imports: Branch Campus or Subsidiary Campus?‖ by Shintaro Hamanaka
104. ―A New Regime of SME Finance in Emerging Asia: Empowering Growth-Oriented SMEs to Build Resilient National Economies‖ by Shigehiro Shinozaki
*These papers can be downloaded from (ARIC) http://aric.adb.org/archives.php? section=0&subsection=workingpapers or (ADB) http://www.adb.org/publications/series/ regional-economic-integration-working -papers


Critical Review of East Asia – South America Trade
The paper examines whether trade between East Asia and South America is a general phenomenon or a country-specific/commodity-specific issue, and whether increased trade is due to diversification and/or price/quantity effects. We find that (1) trade between the People’s Republic of China and South America is most significant; (2) the increase in East Asia’s imports from South America is a price effect; and (3) the growth of East Asia’s export to South America seems more promising than that of South America’s export to East Asia.
About the Asian Development Bank
ADB’s vision is an Asia and Pacific region free of poverty. Its mission is to help its developing member countries reduce poverty and improve the quality of life of their people. Despite the region’s many successes, it remains home to two-thirds of the world’s poor: 1.7 billion people who live on less than $2 a day, with 828 million struggling on less than $1.25 a day. ADB is committed to reducing poverty through inclusive economic growth, environmentally sustainable growth, and regional integration.
Based in Manila, ADB is owned by 67 members, including 48 from the region. Its main instruments for helping its developing member countries are policy dialogue, loans, equity investments, guarantees, grants, and technical assistance.
Asian Development Bank6 ADB Avenue, Mandaluyong City1550 Metro Manila, Philippineswww.adb.org/povertyPublication Stock No. WPS125321 Printed in the Philippines