ADB Cambodia: Diversifying Beyond Garments and Tourism
175
ASIAN DEVELOPMENT BANK CAMBODIA DIVERSIFYING BEYOND GARMENTS AND TOURISM COUNTRY DIAGNOSTIC STUDY
Transcript of ADB Cambodia: Diversifying Beyond Garments and Tourism

ASIAN DEVELOPMENT BANK
CAMBODIADIVERSIFYING BEYOND GARMENTS AND TOURISMCOUNTRY DIAGNOSTIC STUDY


CAMBODIADIVERSIFYING BEYOND GARMENTS AND TOURISMCOUNTRY DIAGNOSTIC STUDY
Economics and Research DepartmentNovember 2014
ASIAN DEVELOPMENT BANK

© 2014 Asian Development Bank
All rights reserved. Published in 2014.Printed in the Philippines.
ISBN 978-92-9254-807-0 (Print), 978-92-9254-808-7 (e-ISBN) Publication Stock No. RPT146996-2
Cataloging-in-Publication Data
Asian Development Bank Cambodia: Diversifying beyond garments and tourism.Mandaluyong City, Philippines: Asian Development Bank, 2014.
1. Economic development. 2. Cambodia. I. Asian Development Bank.
The views expressed in this publication are those of the authors and do not necessarily reflect the views and policies of the Asian Development Bank (ADB) or its Board of Governors or the governments they represent.
ADB does not guarantee the accuracy of the data included in this publication and accepts no responsibility for any consequence of their use.
By making any designation of or reference to a particular territory or geographic area, or by using the term “country” in this document, ADB does not intend to make any judgments as to the legal or other status of any territory or area.
ADB encourages printing or copying information exclusively for personal and noncommercial use with proper acknowledgment of ADB. Users are restricted from reselling, redistributing, or creating derivative works for commercial purposes without the express, written consent of ADB.
In this report, “$” refers to US dollars unless otherwise specified.
Asian Development Bank6 ADB Avenue, Mandaluyong City1550 Metro Manila, PhilippinesTel +63 2 632 4444Fax +63 2 636 2444www.adb.org
For orders, please contact:Public Information CenterFax +63 2 636 [email protected]

iii
FOREWORD
Cambodia’s economy has grown rapidly for more than 2 decades. The catalysts of growth have been strong performances in the key sectors of garments, agriculture, and tourism. Rising foreign investment, deeper integration in global value chains, and a stable macroeconomy have contributed to this performance.
The Royal Government of Cambodia continues to implement reforms to sustain and build on these gains. And we are continuing to find ways to improve economic management, support job creation, enhance rural development, improve gender equality, and promote good governance. These are all geared toward achieving development which supports equity and efficiency. As a result, the gains from the economic expansion have been shared through higher household incomes and reduced poverty. We recognize that much has been achieved, but that much more is possible.
We welcome this report and its key findings. It identifies the critical constraints to development as the need for better infrastructure, especially in the energy sector and rural areas; a shift up in the level of skills and education; and improvements in governance to enhance the business environment. We also appreciate the need to increase the collection of fiscal resources and improve the allocation of these resources to economic and social investments. We will review the report’s findings on the need to diversify and upgrade the economy’s productive activities as we develop our industrial strategy.
The Royal Government of Cambodia is grateful for the timely conduct of the study. The ideas and findings in this report will certainly be useful in providing inputs to support and operationalize the Rectangular Strategy for Growth, Employment, Equity, and Efficiency, and our longer-term vision for the economy and society. We seek an agenda that enables Cambodia to continue to grow, reduce poverty, and allow all members of society to participate in, contribute to, and benefit from the growth progress.
H.E. Dr. Aun PornmonirothMinister of Economy and FinanceChairman of the Supreme National Economic CouncilRoyal Government of Cambodia

iv
PREFACE
Cambodia is in the challenging process of economic transition as it seeks to move beyond low-skill, low-value activities and expand its industrial base to generate broad-based inclusive growth. As the Government of Cambodia continues to build on strong growth and address emerging challenges, this study supports Cambodia’s efforts to sustain growth and make it more inclusive. The study identifies the critical constraints to development: namely, the need for better infrastructure, especially in the energy sector and rural transport; higher skills and educational levels; and improved governance to enhance the business and investment environment. The study also recognizes the need for better collection and allocation of fiscal resources to meet growing demand for economic and social investment. A special section highlights the need to diversify and upgrade the economy’s productive activities as the country develops and transitions toward higher-value activities in global value chains. The study was conducted by a team from the Economic Analysis and Operations Support Division, under the direction of Cyn-Young Park, Assistant Chief Economist, Economics and Research Department, Asian Development Bank (ADB). Background papers were prepared by Michael Smiddy on industrial policy and Partha Banerjee on energy. The study team included Paul Vandenberg, Kee-Yung Nam, Maria Rowena Cham, Paulo Rodelio Halili, Lilibeth Poot, Emmanuel San Andres, Rhina Ricci Lopez-Tolentino, and Maria Melissa Gregorio. Contributing ADB consultants included Ma. Concepcion Latoja, Regina Baroma, Arlene Evangelio, Amador Foronda, Roger Mercado, Ronaldo Ico, Lyndree Malang, and Lotis Quiao. The study was edited by Jill Gale de Villa, Eric Van Zant, and Alastair McIndoe. Michael Cortes provided layout, cover design, and typesetting.
In conducting the study, ADB consulted with representatives from government, the private sector, development partners, and research institutions on the approach and findings. The study team is grateful for the support provided by the Government of Cambodia. Special thanks go to Dr. Hang Chuon Naron, who, as Vice-Chair of the Supreme National Economic Council and Secretary of State, Ministry of Economy and Finance, helped initiate the study; and H.E. Ros Seilava, Under Secretary of State, Ministry of Economy and Finance and a member of the council. ADB is committed to continued partnership and dialogue with the government to support its efforts to reduce poverty and achieve inclusive growth. To this end, the work of ADB’s Cambodia Resident Mission is much appreciated for fostering collaboration with the government and other stakeholders. Peter Brimble, formerly Senior Country Economist, played an important role in this regard under the direction of Putu Kamayana, former Country Director, and his successor, Eric Sidgwick. The study team also thanks the speakers at consultation workshops in 2012 and 2013, including, along with those already mentioned, Enrique Aldaz-Carroll, Alessandra D’Amico, Senaka Fernando, Saing Chan Hang, H.E. Hunleng Hay, Muhammad Ehsan Khan, Srinivasa Madhur, Gordon Peters, Vathana Roth, and H.E. Sok Siphana. Briefings were held at ADB headquarters with colleagues from the Southeast Asia Department and the Economics and Research Department, including former Chief Economist Changyong Rhee and Deputy Chief Economist Juzhong Zhuang. Makiko Matsumoto, Sophorn Tun, and Sukti Dasgupta from the International Labour Organization contributed to the study through a parallel and joint study on employment in Cambodia. The feedback during these consultations provided valuable inputs to the analysis and recommendations. Special thanks go to ADB’s Rehan Kausar and Michael White, who provided comments on the energy and urban development sections, respectively.
Shang-Jin WeiChief EconomistEconomics and Research Department

v
CONTENTS
Foreword iiiPreface ivAbbreviations and Acronyms xiCambodia Fast Facts 2013 xiiExecutive Summary xiii
1. Development Performance 1 1.1 Maximizing Natural Growth Opportunities 1 1.2 Economic Development Plans 3 1.3 Macroeconomic Performance 5 1.4 Economic Growth by Major Expenditure Component 6 1.5 Monetary Policy and Financial Sector Management 8 1.6 Fiscal Policy 12 1.7 Balance of Payments 14 1.8 Sources of Economic Growth, by Production Sector 15 1.9 Poverty and Inequality 32
2. Critical Constraints to Growth 35 2.1 Human Capital 36 2.2 Infrastructure 45 2.3 Macroeconomic Risks 58 2.4 Microeconomic Risks 61 2.5 Market Failures 66 2.6 Finance 68 2.7 Conclusion 72
3. Critical Constraints to Inclusiveness 73 3.1 Availability of Productive Employment Opportunities 73 3.2 Human Capabilities 77 3.3 Leveling the Playing Field 92 3.4 Social Safety Nets 99 3.5 Conclusion 101
4. Diversification and Upgrading 103 4.1 Patterns of Specialization and Diversification 103 4.2 Into Which Products Can Cambodia Diversify? 110 4.3 Policies for Diversification and Upgrading 115 4.4 Conclusion 125 Appendix 4.1: Product Sophistication, Revealed Comparative Advantage, and Proximity and Path 127 Appendix 4.2: Priority Export Products 128
5. Summary and Policy Recommendations 133 5.1 Human Capital and Access to Decent Employment 133 5.2 Infrastructure: Electricity, Rural Roads, and Rural Water and Sanitation 136 5.3 Governance 139 5.4 Fiscal Resources 140 5.5 The Way Forward and Special Challenge 141
References 143

vi
BOXES, FIGURES, AND TABLESBOXES 1.1 Managing Dedollarization 21.2 Socioeconomic Development Plans and GDP Growth 42.1 Growth Diagnostics Framework 364.1 Tariff Preferences Aid Diversification: Cambodia’s Bicycle Industry 1044.2 Institutional Mechanisms for Industrial Policy 1194.3 Key Elements of the Rice Policy 121 FIGURES 1.1 Shares of Major Expenditure Components in GDP, 1995–2011 (%) 71.2 Contribution of Major Expenditure Components to GDP Growth, 1995–2011 (%) 71.3 Major Expenditure Components in Selected Asian Countries, 2000 and 2012 (% of GDP) 81.4 GDP Growth and Inflation, 2000–2013 (%) 91.5 Growth of Money Supply and Fiscal Balance, 2000–2013 (%) 91.6 GDP Growth and Change in the Exchange Rate, 2000–2012 101.7 Official and Market KR/$ Exchange Rates, 2006-2013 101.8 Domestic Credit Provided by Banks and Growth of Total Loans, 2005–2013 111.9 Health of the Banking Sector, 2006–2012 (%) 111.10 Nonperforming Loans, 2005–2013 (%) 121.11 Government Expenditure by Function, 2001–2013 (% of total) 131.12 Overall Fiscal Balance in Selected Asian Countries, 1995–2013 (% of GDP) 131.13 Fiscal Deficit Financing, 2002–2012 (% of GDP) 141.14 Net Exports, 2000–2013 ($ billion) 141.15 Balance of Payments, 1998–2012 (% of GDP) 151.16 Gross Reserves and Months of Import Coverage, 2005–2013 ($ billion) 151.17 Shares of Major Production Sectors in GDP, 1995–2013 (%) 161.18 Contribution to Total Output Growth by Major Production Sector, 1995–2013 (percentage points) 161.19 Agriculture Employment in Selected Asian Countries, 1998–2012 (% of total employment) 171.20 Agriculture Output and Employment Growth, 1995–2012 (%) 171.21 Agriculture Subsectors, 1995–2010 (% of total agriculture output) 181.22 Farming Subsector and Agriculture Growth, 1995–2010 (%) 181.23 Agriculture Value Added per Worker, 1995–2012 (constant 2005 $) 191.24 Cereal Yield, 1995–2013 (kilograms per hectare) 201.25 Agriculture Subsectors’ Contribution to Agriculture Growth, 1995–2010 (%) 201.26 Output of Major Agriculture Products, 2000–2013 (tons) 211.27 Production of Fisheries Subsectors, 2000–2013 221.28 Growth of Agriculture and its Subsectors, 1995–2010 (%) 221.29 Industry’s Shares of Total Output and Growth Rate, 1995–2013 (%) 241.30 Industry Subsectors’ Share of Total Industry Output, 1995–2013 (%) 241.31 Contribution of Subsectors to Industry Growth, 1995–2013 (%) 241.32 Contribution of Subsectors to Manufacturing Growth, 1995–2010, (%) 26

vii
FIGURES, continued1.33 Exports of Garments, Textiles, and Footwear, 2001–2013 ($ billion) 261.34 Major Markets for Garments, Textiles, and Footwear Exports, 2001–2013 (% of $ value) 271.35 Exports by Commodity, 2002–2012 (% of $ value) 271.36 Services Subsectors’ Contribution to Services Growth, 1995–2013 (%) 281.37 Tourism Industry, 1995–2013 281.38 Contribution of the Travel and Tourism Industry to Employment, 1995–2013 291.39 Total Annual Visitor Arrivals to Cambodia, 1995–2013 (‘000 arrivals) 291.40 International Visitor Arrivals in ASEAN by Country Shares, 2000–2012 (%) 301.41 Visitor Arrivals in Cambodia, by Major Geographic Region, 2006–2013 301.42 Tourism Competitiveness Ranks of ASEAN Countries, 2008 and 2013 311.43 Elements of Cambodia’s Tourism Competitiveness: Scores in 2008 and 2013 311.44 Competitiveness in Tourism Infrastructure 321.45 Poverty Rates, 2004 and 2009 (%) 331.46 Poverty Incidence by Province, 2009 (%) 331.47 Income Inequality in Selected Asian Countries, Latest Year Available (%) 341.48 Income Distribution by Quintile, 2004 and 2009 342.1 Social Return on Investment in ASEAN Countries, 1995–2013 (%) 352.2 Expenditure on Education, 1995–2013 (% of GDP) 372.3 Education Expenditure in Cambodia 382.4 Gross Enrollment Ratios in Preprimary Education, Selected ASEAN Countries, 2012 (%) 382.5 Repetition and Dropout Rates in Various Levels, SY2008/2009 and SY2012/2013 (%) 392.6 Repetition Rates at the Primary Level, Selected ASEAN Countries (%) 392.7 Number of Higher Education Institutes, 2001–2010 412.8 Education Level and Experience Required by Employers 432.9 Skills Gaps among Workers (%) 442.10 Global Competitiveness: Infrastructure Scores in Selected ASEAN Countries, 2013 452.11 Access to Electricity in Selected Asian Countries, 2011 (% of population) 452.12 Average Electricity Tariffs in ASEAN Countries (US cents/kWh) 492.13 Expenditure on Transport and Communications, 1995–2013 502.14 Road Maintenance Budget, 2007–2012 ($ million) 512.15 Passengers at Sihanoukville Port, 2001–2011 (‘000) 532.16 Container Port Traffic, Southeast Asian Countries, 2007–2012 (TEU) 542.17 Freight and Passenger Train Services, 2000–2011 572.18 Passenger Volume, Phnom Penh and Siem Reap International Airports, 2005–2013 (million) 572.19 Quality of Air Transport: Scores of Selected ASEAN Countries, 2013 582.20 Fiscal Deficit, 1998–2013 (% of GDP) 582.21 Fiscal Deficit, Government Revenues and Expenditures: Selected ASEAN, 2013 (% of GDP) 592.22 Government Tax Revenue Sources, 2003–2012 (KR million) 592.23 Size of External Debt and Debt Service Ratio, 2001–2012 602.24 Governance Indicators in ASEAN Countries, 2012 (percentile ranking) 612.25 Most Problematic Factors for Business, 2008–2009 and 2013–2014 622.26 Control of Corruption in Southeast Asia, 1996–2012 (percentile rank) 63

viii
FIGURES, continued2.27 Rule of Law in ASEAN Countries, 1996–2012 (percentile ranking) 642.28 Distance to Frontier, Doing Business 2008 and 2014 Reports 662.29 Gross Domestic Savings in Selected Asian Countries, 1995–2012 (% of GDP) 682.30 Savings and Investment, 1995–2012 (% of GDP) 692.31 Domestic Credit in Selected ASEAN Countries, 2000–2013 (% of GDP) 702.32 Interest Rate Spread in Selected ASEAN Countries, 2000–2012 (percentage points) 702.33 Deposit Rates in Selected ASEAN Countries, 2000–2012 (%) 712.34 Lending Rates in Selected ASEAN Countries, 2000–2013 (%) 713.1 Diagnostics Framework for Constraints to Reducing Poverty and Inequality 753.2 Labor Force Participation Rates, by Location and Sex, 2007–2013 (%) 753.3 Employment Status, by Location, 2007–2013 (%) 763.4 Informal Employment and Underemployment, by Area, Sex, Age Group, and Education Level, 2013 (%) 763.5 Growth in GDP per Person Employed, 1990–2012 (constant 1990 PPP $ ’000) 773.6 Share of Employment by Sector, 2007–2013 (%) 773.7 Employment by Sector and Province, 2013 (%) 773.8 Educational Attainment of People Aged 15 and Over, Employed and Unemployed, 2013 (%) 783.9 Adult Literacy Rates in Selected ASEAN Countries, Latest Year Available (%) 783.10 Net Enrollment Rates, 2006–2013 (%) 783.11 Net Enrollment Rates, by Province, 2013 (%) 793.12 Reasons for Not Attending School, 6–17 Years Old, 2009 and 2013 (%) 803.13 Reasons for Not Attending School, 6–17 Years Old, by Gender, 2013 (%) 813.14 Public Expenditure on Education in ASEAN Countries, Early 2000 and Latest Data (% of GDP) 823.15 Expenditure per Primary and Secondary Student in Selected Asian Countries, 82 Early 2000 and Latest Data (% of GDP per capita) 3.16 Primary Schools without Water and Toilets, 2013 (% of schools) 833.17 Student–Teacher Ratios, 2013 833.18 Schools Not Providing a Full Curriculum, 2013 (%) 843.19 Leading Causes of Mortality in Cambodia, 2010 (per 100,000 people) 853.20 Nutritional Status of Children under 5 and Low Birth Weight Incidence, 2005–2010 (%) 863.21 Nutritional Status of Children in Selected Southeast Asian Countries, 87 Latest Year (% of children under 5) 3.22 Prevalence of Undernourishment, 1990–2012 (% of population) 883.23 Physicians, Nurses, and Midwives, 2012 (per 1,000 people) 883.24 Household Health Expenditure, 2013 (%) 893.25 Percentage of the Population that Became Ill and Sought Consultation or Treatment, 2013 903.26 Health-Seeking Behavior for First Treatment of Illness, by Province and Health Care Provider 90 (% of population that became ill) 3.27 Government Expenditure on Health, 1995–2012 913.28 Public Health Expenditure in ASEAN Countries, 1995 and 2013 (% of GDP) 913.29 Improved Water Source and Sanitation Facilities in ASEAN, 2012 (% with access) 923.30 Improved Water Source (Wet Season) and Sanitation Facilities, 2013 (%) 933.31 Access to Electricity, by Area, Province, and Income Quintile, 2013 (% of households) 94

ix
FIGURES, continued3.32 Access to Telecommunications in Cambodia and the Rest of ASEAN, 2000–2013 94 (subscriptions per 100 people) 3.33 Access to Telecommunications, by Area, Province, and Income Quintile, 2013 (% of households) 953.34 Households Owning or Farming Land, 2013 963.35 Source of Land, by Major Geographic Domain and Income Quintile, 2013 (% of households) 963.36 Land with Access to Irrigation, 2013 (%) 973.37 Access to Loans, 2013 (% of households) 983.38 Household Loans by Source, 2013 (% of total number of loans) 983.39 Average Monthly Interest Rate on Loans to the Poorest Quintile, by Source of Loan, 2013 (%) 983.40 Coverage of the National Social Security Fund for Civil Servants, 2010 1003.41 Total Expenditures on National Social Security Fund Benefits, 2007–2009 (KR billion) 1014.1 Composition of Cambodia’s Exports, 1990–2013 (%) 1054.2 Index of Export Concentration in ASEAN Countries, 2013 1064.3 Number of Products with Revealed Comparative Advantage, 1991–2013 (%) 1074.4 Trend in Export Sophistication (EXPY), Selected ASEAN Countries, 1990–2013 1094.5 Disaggregation of Cambodia’s Exports by PRODY Group, 1990–2013 (% of total) 1094.6 Disaggregation of Exports by PRODY Group, Selected ASEAN Countries, 110 Average 2010-2013 (% of total) 4.7 Product Space: Cambodia and Viet Nam 1114.8 Cambodia‘s Classic, Disappearing, Marginal, and Emerging Products 1134.9 Cambodia’s Product Space Map: Classic, Emerging, Disappearing, and Marginal Products 1144.10 Unweighted Plots of Product Technological Sophistication (PRODY) against the Path, 2009–2011 1154.11 Weighted Plots of Product Technological Sophistication (PRODY) 116 against the Scope for Further Diversification, 2009–2011 B1.2 Gross Domestic Product Growth, 1996–2013 (%) 4B2.1 Problem Tree of the Growth Diagnostics Framework 36B4.1 Bicycle Exports, 2005–2013 ($ million) 106B4.2 Leadership and Coordination: High-Level Body or Steering Committee 121 TABLES 1.1 Broad Indicators of Socioeconomic Growth, 1995–2013 51.2 Per Capita Income in Selected Asian Countries, 1995–2013 61.3 Construction Industry, 1995–2013 (%) 251.4 Production of Mineral Commodities, 2004–2011 (tons) 251.5 Manufacturing Subsectors, 1995–2010 (%) 261.6 Services Sector, 1995–2013 (%) 281.7 Poverty Rates, Selected Asian Countries, Latest Year 322.1 Overview of the Labor Market, 2004–2013 372.2 National Assessment of Learning Outcomes (average score) 382.3 Education Level and Pedagogical Training of Teachers 402.4 Global Competitiveness Report, 2013–2014 (rank among 148 countries) 412.5 Enrollment in Higher Education and TVET in Cambodia, 2004–2010 41

x
TABLES, continued2.6 Higher Education Enrollment by Discipline, 2006–2009 (% of total) 422.7 Projected Demand for and Supply of Higher Education Graduates, 2009–2014 (total for the 6 years) 422.8 Skills Employers Find Lacking Most in Employees 442.9 Main Sources of Lighting by Geographical Domain, 2013 (% of households) 462.10 Cambodia’s Electricity Sector, 2012 462.11 Installed Electricity Capacity and Generation, 2012 472.12 Hydropower Plants as of May 2013 482.13 Grid Systems 482.14 Length of Transmission and Distribution Lines, 2012 (km) 492.15 Electricité du Cambodge Tariffs as of 31 December 2012 (US cents/kWh) 492.16 Road Network, 2012 512.17 Road Transport Indicators, ASEAN Countries, Latest Year Available 512.18 Transport Burden in Selected Countries 522.19 Infrastructure at Sihanoukville Port 532.20 Cargo Throughput at Sihanoukville Port, 2005–2011 532.21 Major Infrastructure at Phnom Penh International Port 542.22 Cargo Throughput at Phnom Penh International Port, 2006–2011 542.23 Comparison of the Duration and Cost of Importing and Exporting, 2013 552.24 Paying Bribes in the Business Community, 2007 and 2012 (% of firms) 632.25 Overall Ease of Doing Business in ASEAN Countries, 2008 and 2014 652.26 Ease of Doing Business, Specific Measures, 2008 and 2014 652.27 Critical Constraints of Cambodia’s Economy 723.1 People Who Never Attended School, by Age Group, 2013 (%) 793.2 Financing Plan for Scholarships for Poor and Disadvantaged Students, 2009 and 2013 (KR million) 813.3 Health Outcomes in Cambodia, 1990–2012 853.4 Nutritional Status of Children, 2010 (%) 863.5 Health Outcomes in ASEAN Countries, 2012 873.6 Sanitation Facilities, 2013 (% of households) 933.7 Social Protection Coverage, 2008–2010 1003.8 Summary of Diagnosis of Constraints to Reducing Poverty and Inequality 1024.1 Top Five Exports, 1990–2013 (% of total) 1054.2 Destinations of Cambodia’s Exports, 2007 and 2011 1074.3 Industrial Policy Components: Mechanisms and Examples 125

xi
ABBREVIATIONS AND ACRONYMS
ADB — Asian Development BankASEAN — Association of Southeast Asian NationsCAMFEBA — Cambodia Federation of Employers and Business AssociationsCDC — Council for the Development of CambodiaCIB — Cambodian Investment BoardCSES — Cambodia Socio-Economic SurveyDGH — Directorate General for HealthFDI — foreign direct investmentGDP — gross domestic productGMAC — Garments Manufacturers Association of CambodiaICT — information and communication technologyIFC — International Finance CorporationIMF — International Monetary FundLao PDR — Lao People’s Democratic RepublicMDG — Millennium Development GoalMOEYS — Ministry of Education, Youth, and SportsMPWT — Ministry of Public Works and TransportNBC — National Bank of CambodiaNGO — nongovernment organizationNIS — National Institute of StatisticsNPL — nonperforming loanPPP — public–private partnershipPRC — People’s Republic of ChinaQIP — Qualified Investment ProjectR&D — research and developmentRCA — revealed comparative advantageRGC — Royal Government of CambodiaSARS — severe acute respiratory syndromeSDBS — Statistical Database SystemSEZ — special economic zoneSMEs — small and medium-sized enterprisesSPS — sanitary and phytosanitaryTEU — twenty-foot equivalent unitTVET — technical and vocational education and trainingUN — United NationsUNESCO — United Nations Educational, Scientific, and Cultural OrganizationUS — United StatesWDI — World Development IndicatorsWEF — World Economic ForumWHO — World Health Organization
WEIGHTS AND MEASURESkm — kilometerMW — megawatt


xiii
EXECUTIVE SUMMARY
During the last 2 decades, Cambodia achieved remarkable economic growth and development—its gross domestic product (GDP) has expanded at an average 7.6% a year since 1995. The country seized growth opportunities from its rich natural resources and the evolving dynamics of the regional and global economy. It effectively leveraged its land and water resources to steadily boost agricultural production, particularly rice, making Cambodia the world’s eight-largest rice producer. Cambodia is also Asia’s 10th largest garment exporter, a position it was able to reach by taking advantage of a global quota regime and the search by garment producers for new low-cost production sites. In addition, Cambodia’s unique cultural heritage has helped it make its mark as a tourism destination in Southeast Asia.
Rapid economic expansion brought important gains in national income and poverty reduction. Even so, Cambodia remains one of Asia’s eight low-income countries and the second-poorest country in Southeast Asia. It also faces considerable challenges in building a modern, sophisticated, and vibrant economy, and to raise living standards to the levels of its more developed neighbors. To sustain its strong economic performance, several growth-supporting factors must be strengthened—infrastructure remains inadequate and unreliable, education attainment and skills are subpar, governance is weak, and savings rates are still low.
This study suggests that Cambodia needs to address these highly interrelated weaknesses to avoid getting trapped in low-wage, low-value-added production, and to maintain a stable political environment that is conducive to investment and commerce. Moving into higher-value-added production and climbing the global value chain will require sustained improvements in infrastructure, human capital, governance, and other economic factors.
Although strong growth is pivotal for improving living standards, creating decent jobs and providing healthy returns for farmers and small businesses will play a critical role in making growth more inclusive. This will require firm government commitment and well-designed interventions to boost access to economic opportunities and improve social protection. Adequate public investment in education, health, and basic social services to enhance human capacity—especially for the disadvantaged—is a prerequisite. At the same time, market and institutional failures, and social exclusion, must be addressed to broaden access to productive assets, such as infrastructure, credit, and land.
This study identifies the major constraints to inclusive growth in Cambodia, using a diagnostic framework based on the inclusive growth concept developed by the Asian Development Bank. Although the factors affecting economic growth and social development are complex and interrelated, this framework allows a systemic assessment of the key elements for inclusive growth, among them: infrastructure, especially energy and rural transport; skills and education; governance; fiscal spending; decent employment; social infrastructure and services, including education and health care; and access to public services and social protection. These constraints are summarized in the following text.

xiv
Cambodia: Critical Development Constraints Country Diagnostic Studies
Human Capital and Decent EmploymentBoth the low levels of human capital and limited access to decent employment must be addressed before Cambodia will be able to provide higher-value products and services. Human capital development covers “cradle-to-grave” measures that ensure early childhood health and nutrition, education and training, and lifelong learning. Research shows the effects of early childhood development—especially the nutrition a child receives during the 1,000 days from conception through age 2—has significant impact on later life. The prevalence of stunting, wasting, and underweight children in Cambodia is among the highest in Southeast Asia—about 15% of the population was undernourished during 2011–2013, compared with the 11% average for the rest of the region. The country needs a good quality health care system that provides broad and affordable access as a foundation for human development.
Low secondary school completion rates undermine marked gains in primary education. Parents and young people in Cambodia tend to underestimate the value of education, and enrollment is low even in technical and vocational education and training (TVET). Basic learning materials and equipment are scarce, curricula weak, and mathematics scores low.
Increased resources could greatly strengthen human capital development if appropriately used. Government expenditure on education is among the lowest in the region, at less than 2% of GDP during 1995–2013. Although considerable resources have targeted primary education, the emphasis on secondary and tertiary education has declined. A comprehensive education and training plan and strategy would provide clear direction for human capital development and resource allocation. The United Nations Development Programme’s recent study, Human Capital Implications of Future Economic Growth in Cambodia: Elements of a Suggested Roadmap, could be particularly useful.
The current labor market shows evidence of glaring skill mismatches and other gaps. Upgrading technical skills would benefit all aspects of Cambodia’s economy, but is urgently needed in farming, manufacturing, services, and public administration. Training institutions must be better aligned with labor market demand.
Infrastructure: Electricity, Rural Roads, Water, and SanitationReliable infrastructure is essential to support growth and economic inclusion. Despite notable improvements since 1995, more is needed to reduce the costs of doing business and maximize Cambodia’s growth potential. The private sector consistently ranks inadequate infrastructure among the top five constraints to doing business there.
The lack of long-term power planning during the early stages of Cambodia’s reconstruction led to a major deficit in providing electricity. Not only is access to electricity among the lowest in Southeast Asia—just 51% of households are served—but access levels vary widely across provinces. Furthermore, electricity tariffs are among the highest in the region, caused in part by high import, transmission, and distribution costs. These access and cost factors deter investment in energy-intensive industries.
Current power supply depends heavily on traditional, unsophisticated, and imported energy sources—the latter exposing the country to international energy price volatility. Petroleum accounts for 60% of total electricity generation with oil-fired power plants accounting for 55% of total installed capacity. Because the electricity supply is unreliable, many firms resort to using costly diesel generators to supplement the supply. About 40% of businesses surveyed for the 2012 Investment Climate Assessment cited the unreliability of electricity supply among their top three business concerns.
Executive Summary

xv
Executive Summary
Transport infrastructure is improving—especially roads, which account for over 90% of passenger and freight traffic. Although the main roads are developed, rural roads—74% of the network—desperately need upgrading. The 2007 Strategic Plan for Rural Roads underscores the link between rural road development, livelihood promotion, economic growth, and poverty reduction. Nearly all rural roads remain unpaved, adding significant cost and time to travel.
Cambodia’s rail system is being rehabilitated after the damage incurred by years of conflict and neglect, limited replacement of rolling stock, and insufficient maintenance. Once completed, rail service will compete with road transport, reducing business costs.
Cambodia has the lowest rate of rural access to sanitation facilities in Southeast Asia and the second lowest in rural access to good quality water. Destruction from civil conflict, inadequate budgets, and unclear institutional structures for rehabilitation severely limit water and sanitation infrastructure outside Phnom Penh. About 90% of the population has access to improved water sources in the capital, but this falls to 67% in other cities and 42% in rural areas. The situation is similar for sanitation.
GovernanceThere has been marked improvement in the rule of law, public administration and finance, and regulation of market activity during the last 2 decades. The improved governance framework enhanced property rights and transaction security, both vital for business. Despite these gains, continuing to strengthen governance will be crucial in speeding the country’s economic transition to higher-income status. The informal payments often needed to obtain government licenses, permits, and access to basic services are a major weakness in governance. The business community agrees: the World Economic Forum’s Global Competitiveness Report 2013–2014 says corruption and inefficient government bureaucracy are major barriers to doing business in Cambodia. Reforms that combat corruption—such as the enactment of the Anti-Corruption Law in 2010 and measures under the Public Financial Management Reform Program—resulted in a slight decline in perceptions of corruption in recent years. Yet informal payments for government services are still common, raising investment, production, and logistics costs. They can also deter foreign direct investment, especially from countries with strict anticorruption laws.
Fiscal Resources Cambodia’s vast development needs require long-term and recurrent financing for hard and soft infrastructure. However, a narrow tax base and weak tax administration constrain the government’s ability to generate revenue to advance its development agenda. Revenue collection averaged just 14% of GDP in 2010–2013, predominantly through indirect taxes. On the positive side, Cambodia continues to enjoy a peace dividend after decades of civil conflict ended in the late 1990s, reallocating government spending away from defense toward public services.
The government relies heavily on concessional loans and grants from development partners to meet its expenditure program. Over time, it must reduce this reliance and increase domestic resource mobilization through taxation and other forms of revenue generation, while improving management of existing revenues.

xvi
Cambodia: Critical Development Constraints Country Diagnostic Studies
Access to Public Services and Social Protection As mentioned earlier, marked regional disparities and income inequalities limit social service provision. Poor access to safe water and sanitation often leads to gastroenteric and diarrheal diseases in rural communities, damaging children’s health in particular.
Access to social protection is also very limited due to the nascent development stage of the country’s social protection schemes. The government has increased spending on social protection and has attempted to widen coverage, but progress has been slow. As the economy rapidly industrializes and urbanizes, a modern social protection system will be needed to replace the variety of traditional and informal means of providing social protection.
Special Challenge: Diversification and UpgradingCambodia faces the special challenge of diversifying and upgrading productive capabilities to improve both economic resilience and growth potential. Currently, economic output rests on four pillars: garments, rice, tourism, and construction. Although this provides some diversity among economic sectors, the mix is nonetheless limited and exposes the economy to demand disruptions and price shocks. The global financial crisis cut into garment production and exports, exposing the country’s vulnerability to its narrow industrial focus. Moreover, about 80% of merchandise exports go to slow-growing markets in Canada, Europe, and the United States; only 15% of merchandise exports go to Asia.
Cambodia’s export basket is rudimentary and has not changed much during the last decade. Diversifying into higher-value products and services will help the country avoid being caught in a low-wage, low-technology equilibrium. But it is equally important that diversification and upgrading be developed so they contribute to upgrading skills and creating good quality jobs.
Policy RecommendationsThe constraints analysis used in this report leads to a series of key recommendations for policymakers (see Chapter 5 for the full list).
Human Development
Key Priorities
� Expand health care and encourage improved nutrition.� Improve the quality of secondary education and raise completion rates.� Provide an accreditation and certification framework for TVET.
Specific recommendations
� Increase the number of physicians and other health care professionals and expand health care coverage and access. Ensure effective implementation and financial management of the new health insurance program under the National Social Security Fund.
� Ensure that the first 1,000 days of life are well supported through nutrition and health care. Strengthen prenatal and postnatal care provided by primary health centers and provide support and funding for reproductive, maternal, newborn, and child health services.
Executive Summary

xvii
Executive Summary
� Strengthen public awareness of the importance of good nutrition. Provide adequate resources to expand school-based midday meal programs in poor areas to improve nutrition and encourage parents to send their children to school.
� Decrease the number of students per teacher, which is currently over 40 in many schools, to a maximum of 30 in primary schools and 25 in secondary schools. This will increase the time teachers can devote to each student and improve learning outcomes. Additional teachers will be required to meet these targets.
� Reduce the share of secondary school teachers who have not completed upper secondary education, from the current 20% to 10% by 2017 and to zero by 2022. Provide appropriate in-service and distance learning opportunities for teachers to upgrade their credentials.
� Improve the quality of pre- and in-service teacher training for better quality of instruction and learning outcomes. Review the curriculum and pedagogy to ensure that education and skills provided in secondary schools meet the needs of the job market or entry to higher education.
� Improve the quality and relevance of TVET to satisfy labor market demand. The National Employment Agency should provide better and more detailed information to the National Training Board and employers on current and future skills required.
� Promote private sector involvement in education policy in designing training programs, setting education standards, assessing TVET, and accrediting training institutes. Attract and secure private sector participation and investment in establishing sector-specific centers of excellence.
Infrastructure Development
Key Priorities
� Complete electricity generation expansion and reduce energy imports.� Strengthen rural electricity enterprises and offer incentives to expand coverage. � Expand the network of paved rural roads. � Improve water and sanitation in rural towns and villages.
Specific Recommendations
� Integrate regional grids into a national network, which will be critical for supplying countrywide electricity and distributing generating capacity coming on stream in the next few years.
� Prioritize electricity provision to all villages by 2020 through combined improvement in generation, transmission, and distribution.
� Provide the government support necessary to ensure scheduled power generation capacity is on stream by 2020. This new capacity should reduce imported electricity from its current 64% share to below 30% by 2020 and help satisfy the expected increase in electricity demand.
� With increased generating capacity, a national grid, and improved rural energy supply, tariffs can be lowered and the large gap between rural and urban electricity prices reduced.
� Designate the Rural Electrification Fund as the central coordination agency for pooling funds from development partners for rural electrification. Ensure regular consultations with development partners to plan strategy and implementation. This approach could be modeled on programs where rural electrification has been successful, such as those of the central coordination agencies in Bangladesh and India.
� Ensure the Ministry of Public Works and Transport has sufficient funds for road development projects. Target a significant increase in road density and the share of paved roads, from the current 23% to 40% by 2025.
� Finish rehabilitating the railways to allow a greater share of bulk goods to be transported by rail and thus reduce heavy wear and tear on roads. Ensure rail connectivity with ports in Cambodia and Thailand.

xviii
Cambodia: Critical Development Constraints Country Diagnostic Studies
� Upgrade, expand, and maintain urban and rural sewerage and drainage infrastructure outside the capital to fight disease and expand social inclusion.
� Enhance household sewage disposal through improved toilets and connections to sewerage systems and septic tanks. Campaign to reduce open defecation in rural areas from the nearly two-thirds of households today, targeting much lower levels by 2020.
Improved Governance
Key Priorities
� Strengthen the Anti-Corruption Unit and enforce the 2010 Anti-Corruption Law.� Work with development partners to improve public sector administration and financial management.� Improve legal capacity to settle commercial disputes.
Specific Recommendations
� Continue strengthening the Anti-Corruption Unit and ensure full implementation of the 2010 Anti-Corruption Law through education on corruption, measures to prevent corruption, and law enforcement. Violators should be prosecuted with sufficient penalties to deter corrupt practices.
� Publicize fees for processing public permits and licenses in offices and on government websites to increase transparency. This should include fees jointly published in late 2012 by the Ministry of Economy and Finance and the Council for the Development of Cambodia, and the fees announced early in 2013 by the Ministry of Commerce. Encourage other ministries to follow suit.
� Support reforms that combat corruption and strengthen the legal framework, such as the Anti-Corruption Law, the Public Finance System Law, and the Public Financial Management Reform Program. Promote civil society involvement in public contracts by introducing and institutionalizing digitized processes for bidding, procurement, and contract disclosure at both national and local government levels.
� With development partner support, continue to advance the four main reform programs in public sector management—the National Program for Administrative Reform, the Legal and Judicial Reform Program, the Decentralization and Deconcentration Reform Program, and the Public Financial Management Reform Program.
Fiscal Resource Management
Key Priorities
� Enhance revenue mobilization to meet public investment and social service demand. � Strengthen government tax collection and administration.� Increase the revenue share from direct taxes and explore other sources of revenue generation and
savings.
Specific Recommendations
� Prioritize measures to improve revenue generation from the current 15% of GDP to 17% by 2018. Concentrate on taxpayer compliance measures and improve governance of tax collection agencies.
Executive Summary

xix
Executive Summary
� Target a reduction in tax arrears through a focused strategy and a dedicated arrears collection team. Assess the effectiveness of the profit-tax exemption for attracting new investment to make the incentive less generous and more focused on attracting investment in nontraditional products and services.
� Widen the direct tax base by including more individuals and small firms while continuing the important work of the Large Taxpayers Department. Reduce exemptions on electricity, financial services, and petroleum. Generate additional revenue through broader application and, in some cases, higher rates for excise taxes on tobacco and diesel.
� Improve tax administration productivity through the greater use of information technology and more effective human resource recruitment and management. Offer a broader range of tax payment options through information technology and electronic banking.
� Prepare for increased social services spending and wider coverage of social protection over the medium term as fiscal constraints have aggravated the dilemma between meeting short-term growth targets and long-run social protection goals. Consolidate ad-hoc social programs and systematically implement social safety nets under a comprehensive national social protection system with sustainable long-term goals and plans.


1
1. Development Performance
1. DEVELOPMENT PERFORMANCE
Angkor Wat temple complex, a world heritage site. Cambodia attracted 4.2 million international visitors in 2013 and generated $2.5 billion in tourism receipts (Ministry of Tourism [MOT] website).
These developments are nothing short of remarkable when set against the country’s troubled past. Cambodia suffered grave internal conflict during the 1975–1979 Khmer Rouge regime, which ruptured the economy, caused widespread loss of infrastructure, and was a major setback in the country’s human capital development. Viet Nam invaded in 1978 and occupied the country in the 1980s, and the government grappled with rebel groups into the 1990s. A peace accord was signed with rebel groups in 1991, but the last vestiges of armed opposition were only controlled in the late 1990s. Restored political stability provided a foundation for investment and a greater focus on economic priorities.
Despite significant socioeconomic progress since political stability was restored, Cambodia remains a low-income country. It is the second poorest country in the ASEAN, only just ahead of Myanmar. In 2009, about half of Cambodia’s population lived on less than $2 per day. Sustained high growth will be essential for poverty reduction. Greater regional integration under the ASEAN Economic Community will provide new opportunities for growth, but also new competitive challenges for the country’s productive sectors.
1.1. Maximizing Natural Growth Opportunities Cambodia’s strong growth performance resulted from its ability to capitalize on several natural growth opportunities. In agriculture, expanded
Cambodia covers a land area of 181,035 square kilometers and has 15 million people. It ranks eighth in land area and seventh in population among the 10 member countries of the Association of Southeast Asian Nations (ASEAN). The vast majority of Cambodians are ethnic Khmer and Buddhist, thus avoiding the ethnic and religious tensions that have bedeviled other countries in the region (National Institute of Statistics [NIS], Cambodia Socio-Economic Survey [CSES] Tables).
The country borders three emerging economies—the Lao People’s Democratic Republic (Lao PDR), Thailand, and Viet Nam—and has a vital link to the sea through its coast on the Gulf of Thailand. Plains in the Tonle Sap Basin and the Mekong Lowlands comprise about three-quarters of the country’s topography. Upland areas are suitable for plantations, mainly for rainfed rice. The Mekong River enters Cambodia from the north before making its way to the sea through Viet Nam in the southeast. The flat, well-watered terrain is conducive to food production.
Agriculture (including fisheries) is a mainstay of the economy, employing over 70% of the workforce and contributing 37% of national value added. Large parts of the country are forested, although forestry is not a significant industry. Oil and natural gas deposits lie offshore and are being explored, but have yet to be exploited.
The economy has grown rapidly, with real per capita income doubling in the 12 years to 2013. Human development has improved, marked by a significant decline in poverty and gains across a range of socioeconomic variables. The key sectors of the economy have gone from strength to strength, with Cambodia now the world’s 8th largest rice exporter and Asia’s 10th largest garment producer. The tourism industry is riding on a wave of interest in the

2
Cambodia: Diversifying Beyond Garments and Tourism Country Diagnostic Study
cultivation of fertile land, supported by ample water and a large rural labor force, led to major increases in rice production. In manufacturing, the country developed a vibrant garment and footwear sector, placing it on the first rung of the industrialization ladder. The manufacturing sector blossomed when investors sought new low-wage production sites with quota-free access to advanced markets. Garment and textile exports totaled $36 billion during 2001–2013 (Garment Manufacturers’ Association of Cambodia [GMAC] website). And, as noted earlier, tourism is performing well.
Even so, key growth-supporting factors show weaknesses. The education and skills level of the workforce is low, despite recent efforts to increase enrollment. Energy costs are among the highest in Asia and supply is unreliable. Transport infrastructure, although improving, remains weak in key areas. Governance in government institutions is improving, but corruption remains a significant problem. Widespread use of the US dollar as currency in Cambodia (“dollarization”) has removed currency risk, but poses a challenge to conducting effective monetary policy (Box 1.1).
The US dollar is used extensively in payments and deposits in Cambodia. The share of dollars in circulation is difficult to estimate, but the ratio of foreign currency deposits, predominantly dollars, to broad money increased from 60% in the late 1990s to 80% in 2010.
Cambodia is heavily dollarized due to events of its recent economic history. During the Khmer Rouge period, the financial system was destroyed and the riel abolished. The riel was reinstated in the 1980s, but businesses and households were wary of the currency, mindful that it had been abolished, and put their trust in the dollar instead. Moreover, the presence of United Nations peacekeepers and election monitors in the early 1990s resulted in large inflows of dollars.
In other countries, expanded use of the dollar has been associated with macroeconomic instability; for example, in Chile, Colombia, and Peru. In Cambodia, the economy has been stable for the last 2 decades and growth has been strong. However, the use of the dollar has persisted and indeed increased. This is explained by the legacy of the dollar’s use (that is, path dependence or what economists call hysteresis), the heavy inflow of dollars from garments exports and tourism, and an underdeveloped financial system.
A strong and widely used national currency is a symbol of pride and national sovereignty. Cambodia’s main economic benefits are from seigniorage and the use of monetary policy instruments. Many countries have sought to reduce the level of dollarization, but drastic attempts to do this have more often than not produced negative results, as in the Lao People’s Democratic Republic. Current thinking is that a gradual process of dedollarization is the best strategy. At a broad level, continued macroeconomic stability and a deepening of the financial system will provide the best conditions for raising confidence in the riel.
Higher reserve requirements are now being imposed on foreign currency deposits than on riel deposits. Other specific policies for Cambodia could include (1) devising a deposit insurance scheme with higher coverage on riel deposits, (2) requiring that prices be denominated in the riel, (3) requiring that official accounting and financial reporting use the riel, (4) making it easier and less costly to clear checks in the riel than the dollar, (5) encouraging the payment of wages in the riel in the private sector and among international organizations (to follow current practice in the public sector), and (6) setting the minimum wage in the riel instead of in the dollar.
Sources: Duma (2011); Menon (2008).
Box 1.1. Managing Dedollarization

3
1. Development Performance
A narrow production base concentrated in rice, garments, tourism, and construction is also a challenge for enhancing and sustaining economic growth and poverty reduction. To secure a successful transition from a low-income to a middle-income country, Cambodia needs to improve its key growth-supporting factors and build competitive advantage in current sectors while expanding into new ones. All of this will require raising farm productivity, increasing value through agro-processing, indigenizing garment-making capabilities, adding new areas of light manufacturing, and expanding tourism options. The government is already focused on these challenges.
1.2. Economic Development Plans
Cambodia’s economic strategy has evolved considerably over the last 4 decades. In the 1960s, the country developed a socialist economy that combined private enterprise with considerable state control and ownership in both rural and urban activities. A radical communist economic model was imposed during the Khmer Rouge period. The socialist model was resumed in the early 1980s, with a gradual move to a more market-oriented approach from the early 1990s. This transition followed the path taken by communist countries in the region at about the same time: the People’s Republic of China initiated cautious market reforms in 1978 that gathered momentum by the early 1990s and Viet Nam began its market reforms in 1986. Both countries grew rapidly as a result of market reform, foreign investment, and capable economic leadership. Cambodia has followed a similar process.
Cambodia’s economic direction is provided by a series of national economic plans and socioeconomic goals. The First Five-Year Program of Socioeconomic Restoration and Development, 1986–1990, prioritized the agriculture sector, infrastructure, and reconstruction. This was followed by the 1994 National Program to Rehabilitate and
Develop Cambodia. This was the first full-fledged comprehensive national program that provided a long-term development vision and it became the framework for subsequent national plans (Box 1.2).
Next came the Socio-Economic Development Plan in 1996, which was supported by the Public Investment Program, a 3-year rolling investment program. In 2000, the United Nations Millennium Summit adopted the Millennium Development Goals (MDGs), which the government supported by setting specific MDGs. In late 2002, the government adopted the National Poverty Reduction Strategy. Trade agreements, accession to the World Trade Organization in 2004, and the significant flow of foreign direct investment (FDI) helped boost the industry sector, particularly manufacturing. Since 2004, national strategic development plans have been pursued using the Rectangular Strategy for Growth, Employment, Equity, and Efficiency adopted by the government in that year. The current National Strategic Development Plan emphasizes good governance; achievement of macroeconomic balances in trade, budget, and inflation; and the promotion of growth and diversification. The plan aims to ensure a better quality of life for Cambodians in a democratic, rules-based society.
A significant element in the country’s growth strategy is integration with regional and global economies. This is seen most clearly in an open regime for FDI, greater involvement in international trade, and heightened participation in regional integration bodies and development vehicles. The creation of the ASEAN Economic Community in 2015 will provide additional support to the growth process. Recent estimates suggest that, among ASEAN’s 10 member countries, Cambodia will reap the greatest gains from economic community (Itakura 2012). Benefits will accrue from tariff reductions, liberalization of services, and improvements in trade facilitation. Cambodia also stands to gain from the ASEAN+ initiatives in which the bloc negotiates free trade and comprehensive economic agreements with countries in Asia and beyond.

4
Cambodia: Diversifying Beyond Garments and Tourism Country Diagnostic Study
Box 1.2. Socioeconomic Development Plans and GDP Growth
Figure B1.2. Gross Domestic Product Growth, 1996–2013 (%)
Economic Development Plans in Cambodia since 1996
Rectangular Strategy for Growth, Employment, Equity, and Efficiency in Cambodia
The overarching economic development strategy of the government adopted in 2004 based on the fundamentals of sustaining peace and order, broad-based long-term economic growth, equitable distribution of opportunities and income, and environmental sustainability.
Socioeconomic Development Plan
(SEDP) I1996–2000
SEDP II2001–2005
National Strategic
Development Plan (NSDP)
NSDP Update2009–2013
NSDP2014–2018
Promotion of macro-economic stability through employment, social reconstruction, and development of rural areas
Implementation of the Triangle Strategy based on peace and stability, integration into the international com-munity, and promoting social and economic development
Execution of the government’s development vision as articulated in the Rectangular Strategy, emphasizing good governance, macroeconomic balance, growth, and diversification in a democratic society.
GDP = gross domestic product.Sources: World Bank, World Development Indicators (WDI), accessed July 2014; Ministry of Planning (MOP) (2009).
1995 1996 1997 1998 20001999 2001 2002 2003 2004 2005 2006 2007 2008 2009 2010 2012 201320110
2
4
6
8
10
12
14

5
1. Development Performance
1.3. Macroeconomic PerformanceCambodia’s gross domestic product (GDP) expanded at an average annual rate of 7.6% in 1995–2013 (Table 1.1). Growth did not fall below 5% during that period, except in 2009, and the economy achieved double-digit growth for 4 consecutive years in the mid-2000s, fueled by significant garment exports and good farm yields.
Cambodia weathered the Asian financial crisis in 1997–1998 and the global financial crisis in 2008–2009. Its GDP grew by 5.7% in 1997 and 5.0% in 1998, when countries with open capital accounts (including Indonesia and Thailand) recorded low or negative growth. During the 2000s, with accession to the World Trade Organization, Cambodia became much more integrated with the global economy. This generated considerable benefit, but also increased the country’s vulnerability to shocks. Because of its close trade links with Europe and the United States, Cambodia’s GDP fell to below 1% in 2009 amid the global financial crisis, although it also rebounded quickly. GDP expanded by 7.5% in 2013 (Table 1.1), and projections suggest that the
growth could continue to expand by as much as 7.0% or more annually into the 2020s (International Monetary Fund [IMF] 2014).
Continued growth has resulted in a large expansion in output. The economy in 2013 was 3.8 times its size in 1995 and 1.7 times its size in 2005, measured in constant 2005 dollars. Other economies in the region expanded at lower rates in 1995–2013, including the Philippines (2.3 times), Indonesia (2.1 times), and Thailand (1.7 times). The Lao PDR and Viet Nam expanded at a similar but slightly lower rate—3.4 and 3.1 times, respectively (World Bank, World Development Indicators [WDI] database).
Despite robust economic expansion, Cambodia is among Asia’s poorest countries, with per capita GDP of $1,008 in 2013, a level comparable to Afghanistan, Bangladesh, Myanmar, Nepal, and Tajikistan (Table 1.2). What is more, Cambodia’s neighbors have also grown rapidly in recent years. Per capita income in the Lao PDR and Viet Nam are above $1,500 and both are now classified as middle-income countries. And other ASEAN countries are considerably more affluent, including Indonesia at $3,557 and Thailand at $5,480 (Table 1.2).
1995 2005 2008 2009 2010 2011 2012 2013Current GDP ($ million) 3,441 6,293 10,332 10,402 11,242 12,830 14,054 15,250
GDP Growth Rate (%) 6.5 13.3 6.7 0.1 6.0 7.1 7.3 7.5
Inflation Rate (%) 7.8 5.8 19.7 -0.7 4.0 5.4 2.9 2.9
Current Account Balance (% of GDP) –3.1 –3.6 –7.9 –7.5 –6.9 –5.5 –8.6 –8.5
Fiscal Balance (% of GDP) –7.2 –0.7 –0.1 –6.3 –3.1 –4.3 –2.3 –5.3
Total Reserves minus Gold ($ million) 192 953 2,292 2,851 3,255 3,450 4,267 4,516
Exchange Rate (KR/$) 2,451 4,093 4,054 4,139 4,185 4,059 4,033 4027
Poverty Incidence 50.2 (2004) 34.0 23.9 22.1 20.5 … …
GINI Coefficient 41.9 (2004) 37.9 36 … … … …
… = data not available, GDP = gross domestic product, KR = Cambodia riel.Sources: Asian Development Bank (ADB), Statistical Database System (SDBS) website; World Bank, WDI; both accessed July 2014; National Bank of Cambodia (NBC) (2013) for fourth quarter 2013; and Ministry of Economy and Finance (2014) for December 2013.
Table 1.1. Broad Indicators of Socioeconomic Growth, 1995–2013

6
Cambodia: Diversifying Beyond Garments and Tourism Country Diagnostic Study
1.4. Economic Growth by Major Expenditure Component Cambodia’s economy exhibits a fair degree of structural balance between the four main expenditure components—consumption, invest-ment, government spending, and net exports. The main weakness is investment, which remains lower than desirable for a country trying to maintain rapid growth. As a share of GDP, investment increased steadily from an average of 15% in 1995–1999 to over 20% in the last few years (Figure 1.1). All the same, the investment ratio is lower than that in surrounding countries, including the Lao PDR and Viet Nam, which are at a similar or slightly more advanced stage of development. The high rate of output growth, given the relatively modest investment ratio suggests high social returns to capital. Given the development needs of capital-scarce Cambodia, the general upward trend in investment’s share of GDP is welcome.
Average investment spending grew 13% annually during 1995–2011, with large variations in some years (World Bank, WDI database). For example, investment fell 23% in 1998 before increasing to
57% in 1999. Similarly, investment rose 16% in 2008 before falling 8% in 2010. Since 2007, investment has been growing less rapidly than in the earlier part of the decade. Growth in investment accounted for 23% of GDP growth on average during 1995–2011 (Figure 1.2).1
Although the bulk of aggregate demand is accounted for by private consumption, its share of GDP has fallen steadily, from 91% in 1999 to just over 80% currently. The decline is accounted for by a rising share of investment. Overall, consumption expanded 7% annually on average in 1995–2012.
Government expenditure has been fairly constant since 1995, at 4%–6% of GDP, although fiscal stimulus to counter the 2008 global financial crisis sent it higher than 7% of GDP during 2009–2012. Government expenditure contributed 0.35 percentage points on average to GDP growth during 1995–2012.2
1 This average figure excludes 2009 data because the impact of the 2008 global financial crisis was reflected in 2009 statistics. Including the 2009 figure could significantly alter the computed average annual contribution of investment to GDP growth.
2 The average excludes 2009 when the government undertook a large stimulus program; using 2009 data would distort the average for 1995–2012.
Table 1.2. Per Capita Income in Selected Asian Countries, 1995–2013
… = data not available, GDP = gross domestic product, Lao PDR = Lao People’s Democratic Republic.Source: World Bank, WDI database, accessed July 2014.
CountryGDP per Capita (current $)
1995 2000 2005 2012 2013Afghanistan ... ... 252 688 678
Nepal 214 237 321 690 694
Bangladesh 317 356 421 752 829
Cambodia 320 299 471 946 1,008
Tajikistan 213 139 340 953 1,037
Pakistan 479 514 694 1,260 1,299
Lao PDR 362 321 472 1,417 1,646
Viet Nam 288 433 699 1,755 1,911
Sri Lanka 718 855 1,242 2,923 3,280
Indonesia 1,041 790 1,273 3,557 3,475
Thailand 2,849 1,969 2,690 5,480 5,779

7
1. Development Performance
Exports have grown rapidly, supported, as noted earlier, by rising garment and tourism receipts. Overall, the trade balance is negative although the extent is not large and is offset by positive capital inflows. Cambodia’s export sector has played a vital role in the country’s emergence. In 1995–2012, exports were equal to 59% of GDP, with an annual growth rate of 15%. Imports were higher—67% of GDP—and grew at a slightly slower pace of 13% a year. The contribution of net exports to growth averaged only 0.50 percentage points in 2010–2012 and was mostly negative in earlier periods.
Consumption’s share of expenditure in GDP in Cambodia is higher and investment’s share is lower than in neighboring countries (Figure 1.3). The average consumption share was 88% during 2000–2012, comparable to the Lao PDR’s 85%, a country closer to Cambodia’s income level, and much higher than Indonesia’s 69%, Thailand’s 68%, and Viet Nam’s 74%. In the same period, Cambodia’s investment share averaged 19%, below the rates for the Lao PDR (24%) and Viet Nam (33%)—its comparator countries—as well as more developed countries in the region.
Figure 1.1. Shares of Major Expenditure Components in GDP, 1995–2011 (%)
GDP = gross domestic product.Source: World Bank, WDI database, accessed October 2014.
Figure 1.2. Contribution of Major Expenditure Components to GDP Growth, 1995–2011 (%)
GDP = gross domestic product.Source: Calculations using data from World Bank, WDI database, accessed October 2014.
1995 1996 1997 1998 20001999 2001 2002 2003 2004 2005 2006 2007 2008 2009 2010 2011–20
20
0
40
60
80
100
120
Investment Net exportsConsumption Government expenditures
1995 1996 1997 1998 20001999 2001 2002 2003 2004 2005 2006 2007 2008 2009 2010 2011–10
–5
0
5
10
15
20
Investment Net exportsConsumption Government expenditures

8
Cambodia: Diversifying Beyond Garments and Tourism Country Diagnostic Study
1.5. Monetary Policy and Financial Sector Management Monetary policy in Cambodia is determined and implemented by the National Bank of Cambodia (NBC), the country’s monetary authority. The NBC’s primary mission is to maintain price stability and develop and maintain a stable financial sector to support sustainable economic growth through efficient resource mobilization, private sector development, employment generation, and FDI (Chantana 2007). The NBC’s Policy Committee formulates monetary policy with assistance from the Economics Research and International Cooperation Department.
The main tools the NBC uses to contain inflation are reserve requirement and foreign exchange management. In general, inflation has stayed within manageable levels, averaging 3.3% annually between 2001 and 2013 (if the 19.7% spike in 2008 is excluded). From very low levels in the early 2000s, inflation began escalating after 2003 on economic recovery and rising food and oil prices (Figure 1.4). In response, the NBC tightened monetary policy. During 2008’s spike in inflation, the reserve requirement was raised from 8% to 16% to reduce
money supply. The NBC also put a cap of 15% on bank lending to the real estate sector in June 2008 to contain rapid credit growth and prevent an asset price bubble from forming.
Because of a highly dollarized and cash-based monetary system, the NBC has limited capacity to conduct effective monetary policy. Monetary policy objectives are mostly met by using the reserve requirement and limiting monetary financing of the budget deficit to control base money and minimize pressure on the exchange rate and general price levels. During the early 2000s, when the market was still shallow and structural banking reforms were just beginning to gain traction, high levels of growth in the monetary base coincided with periods of widening fiscal deficits. More recently, the NBC has been better able to keep growth of the monetary base in check despite higher fiscal deficits, and particularly a sharp rise in 2009 caused by expanded fiscal spending to counter the impact of the global financial crisis (Figure 1.5). With economic expansion becoming more robust since the recovery in 2010, the NBC has gradually raised the reserve requirement (IMF 2013).
The foreign exchange rate mechanism is also a critical instrument for the NBC. Cambodia has had a managed floating exchange rate regime since
Figure 1.3. Major Expenditure Components in Selected Asian Countries, 2000 and 2012 (% of GDP)
GDP = gross domestic product, Lao PDR = Lao People’s Democratic Republic.Sources: ADB (2013b); World Bank, WDI database, accessed January 2014.
Investment Net exportsConsumption Government expenditures
2000 2012
Cambodia Indonesia Lao PDR Thailand Viet Nam–20
0
40
20
60
80
100
120
Cambodia Indonesia Lao PDR Thailand Viet Nam–20
0
40
20
60
80
100
120

9
1. Development Performance
The Foreign Exchange Law (1997) allows unrestricted money transfers out of the country. The official exchange rate reflects the foreign currency demand and supply dynamics between the NBC, the government, and the public sector. A parallel market rate determined by a freely floating mechanism governs all private sector transactions, but the government has been successful in keeping the differential between the official and market rates very low; that is, within a 1% range (Figure 1.7).
1992, with the NBC intervening when necessary to keep the exchange rate stable. The riel depreciated sharply against the dollar in the early 1990s. But as the economy developed, the depreciation has steadied, averaging 8.4% annually from 1995 to 1999. Since 2000, the exchange rate has become more stable, with average annual depreciation of 0.4% during 2000–2012 (Figure 1.6). The riel depreciated by more than 2% in 2009, reflecting the impact of the global financial crisis, but quickly recovered its value as the growth has picked up.
Figure 1.4. GDP Growth and Inflation, 2000–2013 (%)
CPI = consumer price index, GDP = gross domestic product.Source: ADB (2014a).
Figure 1.5. Growth of Money Supply and Fiscal Balance, 2000–2013 (%)
GDP = gross domestic product.Source: ADB (2014a).
2000 2001 2002 2003 2004 2005 2006 2007 2008 2009 20112010 20132012–2
2
0
4
6
8
10
12
14
Food inflationGDP growth CPI inflation
GD
P gr
owth
–5
5
0
10
15
20
25
30
35
Food
and
CPI i
nflat
ion
2000 2001 2002 2003 2004 2005 2006 2007 2008 2009 20112010 20132012
–3–4–5–6–7
–1–2
10
234567
Fiscal position (% of GDP) Growth in M2
Fisc
al po
sitio
n
–10–20–30–40–50–60–70
100
203040506070
M2
grow
th

10
Cambodia: Diversifying Beyond Garments and Tourism Country Diagnostic Study
Cambodia has taken steps to develop an interbank market and make its monetary policy operations more market based. In 2008, the NBC introduced a liquidity shortage resolution scheme to allow banks to request temporary overdraft facilities (NBC 2009). This was bolstered in January 2009 with the issuance of a government proclamation (known as a prakas) to assist eligible financial institutions
with their liquidity requirements.3 In 2013, the NBC introduced the negotiable certificates of deposits in line with the Financial Sector Development Strategy 2011–2020.
The government has sought to develop the legal framework for a stable, efficient, and transparent financial sector, a process that began with the Law on Banking and Financial Institutions (1999). Additional laws on Negotiable Instruments and Payments Transactions (2005) and Anti-Money Laundering and Combating Financing of Terrorism (2007) were passed. A Law on Financial Lease has been drafted.
The Financial Sector Blueprint 2001–2010 and the Revised Blueprint 2006–2015 have been instrumental in providing strategic guidelines for financial sector development, supervision, and policy making. In November 2011, the government adopted the Financial Sector Development Strategy 2011–2020 for medium-term financial sector development.
3 A prakas is a proclamation of a ministerial or an interministerial decision signed by the relevant minister. For the financial sector, a prakas may be signed by the finance minister or the NBC’s governor.
Figure 1.6. GDP Growth and Change in the Exchange Rate, 2000–2012 (%)
GDP = gross domestic product, KR = riel.Note: Positive changes in the exchange rate represent a depreciation of the riel against the dollar.Source: ADB (2013b).
Figure 1.7. Official and Market KR/$ Exchange Rates, 2006–2013
KR = riel.Source: NBC, Economic and Monetary Statistics, various issues.
–4
20
–2
64
810121416
Change in KR per $ GDP growth
2000 2001 2002 2003 2004 2005 2006 2007 2008 2009 20112010 2012
GD
P gr
owth
3,850
3,950
4,050
4,000
3,900
4,100
4,150
4,200
Market exchange rate Official exchange rate
KR/$
2006 2007 2008 2009 2010 2011 2012 2013

11
1. Development Performance
Cambodia’s financial landscape is changing rapidly as a result of government reforms and the growth of bank operations. Between 2006 and 2012, bank assets grew at an average of 33% per year. Total loans grew by 71% in 1996–1999, by 134% during 2000–2005, and by 661% during 2006–2013, reflecting the development of both the financial sector and the real economy. Credit provided to the economy equaled 45% of GDP in 2013, up from just 9% in 2005 (Figure 1.8).
The banking system is now stable and well capitalized (Figure 1.9). The capital adequacy ratio—the ratio of regulatory capital to risk-weighted assets—has been considerably above the regulatory minimum of 15% since 2004. The share of nonperforming loans to total loans has declined from 9.9% in 2006 to 2.3% in 2012. Return on assets and return on equity were at 2.0% and 10.7%, respectively, in 2012, and have recovered from depressed levels of 1.0% and 4.9% in 2009, underscoring the renewed vigor of financial institutions.
Strengthened supervisory capacity is helping safeguard financial stability. In 2006, the NBC introduced the Cambodian Off-Site Bank Reporting for Prompt Corrective Action, a computerized monitoring tool to enhance banking supervision. With this and other capacity-building efforts, the ratio of nonperforming loans to total loans (and
total assets) has declined since the mid-2000s (Figure 1.10).
The NBC continues to work to strengthen and deepen the financial sector through the Financial Sector Development Strategy 2011–2020 (ADB 2012b). Institutional support for modernizing the financial system—such as establishing the Cambodia Stock Exchange and Cambodia Credit Bureau—has increased in recent years. A moratorium on
Figure 1.8. Domestic Credit Provided by Banks and Growth of Total Loans, 2005–2013
Figure 1.9. Health of the Banking Sector, 2006–2012 (%)
GDP = gross domestic product. Source: ADB (2014a).
NPL = nonperforming loan.Sources: International Monetary Fund (IMF) (2009, 2012, 2014).
2005 2006 2007 2008 2009 20112010 201320120
1510
5
45
2025303540
50
Credit to the private sector (% of GDP) Growth of loans (%)
Dom
estic
cre
dit
0
20
10
30
40
50
60
70
80
Gro
wth
of t
otal
loan
s
0
10
20
15
5
25
30
35
Return on assetsRegulatory capital to risk-weighted assets
2006 2009 2012
Return on equityNPLs

12
Cambodia: Diversifying Beyond Garments and Tourism Country Diagnostic Study
issuing bank licenses is being considered to trim overbanking.4 Technical preparations are under way for the securitization of central bank deposits, which will be crucial for establishing an interbank market to manage riel and dollar liquidity more efficiently and, eventually, these changes should enable the NBC to manage monetary policy better. The NBC is also seeking to increase financial access for low-income groups and promote greater use of the riel.
1.6. Fiscal Policy Because the economy’s highly dollarized structure limits the use of traditional monetary policy, fiscal policy has been a key tool for promoting economic growth, reducing poverty, and providing short-term demand stimulus. Public spending needs for infrastructure and social services are enormous, yet funds are limited by the low revenue base. The government balanced these pressures and maintained a low fiscal deficit prior to 2008, but then engaged in fiscal expansion to cushion the economy from global financial crisis. The government has
4 “Overbanking” refers to a situation in which there are too many banks for the total market size to sustainably support.
since tried to reduce the fiscal deficit to create fiscal space to counter future shocks. It has also worked to increase and better manage its revenues to provide necessary funding for development expenditures.
On the expenditure side, the focus has been supporting economic growth and social spending to protect vulnerable members of society. Over the last decade, spending on social security and welfare, health, and education, along with general public services, has been increased to help achieve MDG targets and reduce poverty. The share of government spending on social security and welfare services tripled during 2001–2013. Health and education were also given priority in the overall government budget, with shares rising substantially from 2001 to 2007. Health spending’s share rose from 11% to 14% and education from 17% to 20% in that period. Despite the adverse budgetary impact of the global financial crisis during 2008–2012, the shares of health and education spending in 2013 stood at 16% and 19% of total government expenditure respectively (Figure 1.11). Overall, fiscal expenditure as a share of GDP rose from 8% in 2000 to 11% in 2013.
The fiscal deficit rose to 6% of GDP in 2009, mainly as a result of stimulus spending to counter the effects of the global financial crisis (Figure 1.12). The
Figure 1.10. Nonperforming Loans, 2005–2013 (%)
NPL = nonperforming loan.Source: CEIC Global Database, accessed July 2014.
1Q 2
005
2Q 2
005
3Q 2
005
4Q 2
005
1Q 2
006
2Q 2
006
3Q 2
006
4Q 2
006
1Q 2
007
2Q 2
007
3Q 2
007
4Q 2
007
1Q 2
008
2Q 2
008
3Q 2
008
4Q 2
008
1Q 2
009
2Q 2
009
3Q 2
009
4Q 2
009
1Q 2
010
2Q 2
010
3Q 2
010
4Q 2
010
1Q 2
011
2Q 2
011
3Q 2
011
4Q 2
011
1Q 2
012
4Q 2
012
2Q 2
012
4Q 2
013
3Q 2
012
1Q 2
013
2Q 2
013
3Q 2
013
0
2
4
6
8
10
12
NPLs (share of total loans) NPLs (share of assets)

13
1. Development Performance
foreign investors. The share of external financing in GDP varied during the last decade and was 4.3% in 2012 (Figure 1.13). Grants have been most useful in patching budgetary deficiencies, especially in light of fiscal consolidation efforts in recent years. The share of grants in total revenue and in GDP averaged 25.4% and 3.3%, respectively, in 2009–2012.
deficit has since been reduced, to about 2% by 2013, similar to levels of other ASEAN countries. The government is trying to avoid domestic financing of the budget deficit to dispel inflationary pressures and keep the macro economy stable. More importantly, prudent fiscal policymaking is essential to maintaining fiscal credibility, a factor that makes the business environment attractive, particularly to
Figure 1.11. Government Expenditure by Function, 2001–2013 (% of total)
Source: ADB (2014a).
2001 2002 2003 2004 2005 2006 2007 2008 2009 2010 2013201220110
30
5040
2010
60708090
100
Health Social security and welfare Economic services
General public services Defense Education
Figure 1.12. Overall Fiscal Balance in Selected Asian Countries, 1995–2013 (% of GDP)
GDP = gross domestic product, Lao PDR = Lao People’s Democratic Republic.Source: ADB, SDBS, accessed October 2014.
1995 1996 1997 1998 20001999 2001 2002 2003 2004 2005 2006 2007 2008 2009 2010 20132011 2012–14
–10–12
–6–8
–4–2
024
Cambodia Lao PDR Malaysia Philippines Thailand Viet Nam

14
Cambodia: Diversifying Beyond Garments and Tourism Country Diagnostic Study
1.7. Balance of PaymentsCambodia runs a balance-of-payments surplus with investment inflows and foreign aid offsetting a persistent current account deficit, allowing foreign exchange reserves to increase steadily. A positive trade balance in manufactured goods has helped cover negative balances in nearly all other goods, including food, chemicals, and machinery (Figure 1.14).
The current account deficit increased in 2011–2013 and was supported by increased investment and aid flows. The deficit widened to 10.5% of GDP in 2013, much higher than the usual range of 3%–5% and exceeding the previous high of 7.9% in 2008 (Figure 1.15). A narrow export base and undiversified manufacturing sector leave the economy vulnerable to slower growth in key export markets.
Political and macroeconomic stability together with a liberalized and export-oriented development policy attracted significant FDI into key sectors such as garments, construction, tourism, and agriculture. In 2012, FDI at $1.5 billion was almost twice its level prior to the global financial crisis (ADB, SDBS). Foreign aid as a share of GDP rose 50% during 2010–2012. Gross official reserves rose from just under
$1.0 billion in 2005 to $4.4 billion at the end of 2013, providing coverage for 5.5 months’ worth of imports (Figure 1.16).
Figure 1.13. Fiscal Deficit Financing, 2002–2012 (% of GDP)
GDP = gross domestic product.Sources: World Bank, WDI database, accessed October 2014.
2002 2003 2004 2005 2006 2007 2008 2009 201220112010–2
0
2
4
6
8
10
12
GrantsNet domestic financing Net external loans
Figure 1.14. Net Exports, 2000–2013 ($ billion)
Source: UN Comtrade database, accessed October 2014.
0 21–1–2–3 3 4 5
20022003
20002001
20052004
20062007200820092010201120122013
Machinery and transport Other products
Chemical and related products Manufactured goods and articles
Food, beverages, and tobacco Crude materials, minerals,and oils

15
1. Development Performance
1.8. Sources of Economic Growth, by Production Sector
Cambodia’s production structure is balanced between agriculture, industry, and services. Agriculture’s share of national output has declined, falling from almost half of national output in 1995 to 34% in 2013. During the same period, industry’s share rose from 15% to 26% and that of services from 36% to 41%. This pattern is typical of a fast-growing, low-income country involved in a process of structural transformation (Figure 1.17).
All three sectors have contributed to growth during the last 2 decades (Figure 1.18). Industry and services made more substantial contributions, as part of the process of structural transformation away from farming. Industry’s proportional contribution to GDP growth averaged 37% annually during 1995–2008 and accelerated to 41% in 2010–2013. Agriculture remains an important economic sector, and efforts to increase its output further are critical to inclusive growth, because a large proportion of the workforce is engaged in the sector. The services sector, which grew year-on-year for nearly 2 straight decades (with the exception of 2008), contributed
Figure 1.15. Balance of Payments, 1998–2012 (% of GDP)
GDP = gross domestic product.Source: ADB, SDBS; IMF elibrary; both accessed January 2014.
Figure 1.16. Gross Reserves and Months of Import Coverage, 2005–2013 ($ billion)
Source: Calculations using data from ADB (2014a).
20022001200019991998 2003 2004 2005 2006 2007 2008 2009 2011 2012 20132010–12
–4–2
–10
–6–8
02468
10
Foreign aid (net loans)Current account balance Net investment inflows Overall balance
2005 2006 2007 2008 2009 20112010 201320120.0
1.51.00.5
2.02.53.03.5
4.54.0
5.0
Foreign exchange reserves Months of import coverage
Gro
ss re
serv
es
0
21
3456789
Mon
ths o
f im
port
s cov
erag
e

16
Cambodia: Diversifying Beyond Garments and Tourism Country Diagnostic Study
an average 42% to annual GDP growth during 1995–2013.
Within the three major sectors, however, growth is highly concentrated in specific subsectors while others remain underdeveloped. In manufacturing, for example, the concentration of production has shifted to garments and away from food processing. In agriculture, the share of farming expanded over time, while the share of forestry and logging contracted. A key challenge is the extent to which
additional growth can be squeezed from a limited number of subsectors. Additional foreign garment factories engaged in “cut-make-trim” production, increased production of unprocessed rice, and more short tourism trips to key temple sites will support growth to an extent, but the potential growth from these sources is limited. Diversification toward higher value and more technologically advanced products and services is a key challenge for medium- and long-term growth.
Figure 1.17. Shares of Major Production Sectors in GDP, 1995–2013 (%)
GDP = gross domestic product.Source: ADB, SDBS, accessed October 2014.
Figure 1.18. Contribution to Total Output Growth by Major Production Sector, 1995–2013 (percentage points)
Source: Calculations using data from CEIC Global Database, accessed January 2014.
1995 1996 1997 1998 20001999 2001 2002 2003 2004 2005 2006 2007 2008 2009 2010 2013201220110
2010
4030
5060708090
100
ServicesAgriculture Industry
1995 1996 1997 1998 20001999 2001 2002 2003 2004 2005 2006 2007 2008 2009 2010 201320122011–4
0–2
42
68
10121416
ServicesAgriculture Industry

17
1. Development Performance
1.8.1. AgricultureAs a key economic sector, the development of agriculture is one of four areas targeted by the Rectangular Strategy for Growth, Employment, Equity, and Efficiency. Modernizing and increasing productivity in agriculture is also a key to promoting broad-based economic growth in the National Strategic Development Plan Update 2009–2013.
With Cambodia’s generally flat terrain and vast water resources, agriculture continues to hold considerable potential for development. The sector is important to enhance domestic food security, increase export earnings, and contribute to
inclusive growth by raising household income and reducing rural poverty. This employment–poverty nexus is especially relevant in the context of female agriculture workers. As a less-developed Asian country still undergoing structural transformation, a higher share of Cambodia’s employment is in agriculture than is the case in its Asian neighbors. In 1998, agriculture accounted for 78% of the country’s total employment, compared with an average of 44% in the selected ASEAN countries in Figure 1.19. A decade later, agricultural employment declined slightly to 72% of the total, while the Asian average dropped to 37%. Employment in the sector has grown by less than 2% since 2007 (Figure 1.20).
Figure 1.19. Agriculture Employment in Selected Asian Countries, 1998–2012(% of total employment)
Source: World Bank, WDI database, accessed October 2014.
Figure 1.20. Agriculture Output and Employment Growth, 1995–2012 (%)
Source: World Bank, WDI database, accessed October 2014.
Cambodia Indonesia Malaysia Philippines Thailand Viet Nam0
10
3020
405060708090
1998 20122008
1995 1996 1997 1998 20001999 2001 2002 2003 2004 2005 2006 2007 2008 2009 2010 20122011–15
–10
0
–5
5
10
15
20
Growth of the agriculture sector Growth of agriculture employment

18
Cambodia: Diversifying Beyond Garments and Tourism Country Diagnostic Study
Within agriculture, the main subsectors are farming and fisheries (Figure 1.21). Livestock and poultry, and forestry and logging are less significant contributors to agricultural output.
Farming. The subsector’s main crop is rice, which is generally sold as paddy (unmilled rice) and is a key export crop. In 2013, 3.05 million hectares yielded 9.4 million tons of rice. Cambodia’s system of rice cultivation is rain-reliant, with wet-season production accounting for 86% of the total yield. Farm output grew 6.6% annually from 1995 to 2005. Bolstered by improved irrigation and increased use of farm inputs, the farming subsector has continued to
grow, albeit slightly slower at 6.3% annually in 2006–2010 (Figure 1.22). The government’s 2010 Policy Document on the Promotion of Paddy Production and the Export of Milled Rice (Royal Government of Cambodia [RGC] n.d.a) set the target of producing 4 million tons of paddy and exporting 1 million tons of milled rice by 2015.5 The “rice policy,” as it is known, also sets out a policy framework to reach these ambitious goals by increasing productivity, diversification, and commercialization in the subsector.
5 Cambodia exported 209,000 tons of rice in 2012, based on UN Comtrade data.
Figure 1.21. Agriculture Subsectors, 1995–2010 (% of total agriculture output)
Sources: Calculations using data from CEIC Global Database, accessed January 2014; ADB (2013b).
Figure 1.22. Farming Subsector and Agriculture Growth, 1995–2010 (%)
Source: Calculations using data from CEIC Global Database, accessed January 2014.
Forestry and logging Fisheries Livestock and poultry Farming
0
302010
40506070
9080
100
1995 1996 1997 1998 20001999 2001 2002 2003 2004 2005 2006 2007 2008 2009 2010
20001995 1996 1997 1998 1999 2001 2002 2003 2004 2005 2006 2007 2008 2009 2010–10
–5
0
5
10
15
20
25
30
Growth rate of agricultureGrowth rate of farming

19
1. Development Performance
A number of factors restrain the growth potential of farming. The small-scale production set-up of rural farms, with low capital intensity and limited use of ancillary farm technology, makes economies of scale impossible to achieve for household operations. Land productivity is affected by fragmentation problems resulting in declining landholding size, and by land degradation aggravated by drought, flooding, and soil erosion. Most farming is subsistence-centered, using only small amounts of improved farm inputs, with modern farming tools beyond the means of the average farmer. Smallholders use few pesticides, insecticides, and herbicides; the overwhelming majority of commercial vegetable farmers use pesticides (ADB 2011a).
The farm sector is prone to sudden climatic shifts. It suffered severe setbacks in 2000, when heavy floods resulted in a contraction in agriculture output, and in 2003, when drought reduced production of both dry- and wet-season rice crops. The average annual growth of agricultural output was near 10% during 2005–2010, but in 2011 the country was hit by the most severe flooding in more than a decade.
Both farmers and millers have limited access to capital and, although funding from microfinance and development finance institutions is helping
address the financing gap, the issue of access to capital funds has yet to be resolved (Cunningham 2011). Partly as a result, Cambodia’s agriculture productivity indicators are low relative to those of other Asian countries, although agriculture value added per worker and cereal yield per hectare started to inch up after 2005 (Figures 1.23 and 1.24).
Despite these challenges, farming contributes the most to agriculture sector growth—69% in 2001–2005 and 65% in 2006–2010 (Figure 1.25). Higher production rates since 2005 for crops other than rice suggest these have good potential and improved marketability, which could be avenues for diversifying agriculture and exports. The production of cassava, corn, sweet potato, vegetables, and soybean has increased (Figure 1.26). Cassava production in 2013 was 15 times its 2005 level, corn production had almost doubled, and vegetable production almost tripled.
Fisheries. With a 435-kilometer continental coastline and 4,520 square kilometers of freshwater, abundant water resources make the fisheries subsector a key player in Cambodia’s food security and nutrition, and in output and employment generation. On average, fisheries accounted for 28% of agricultural output and contributed
Figure 1.23. Agriculture Value Added per Worker, 1995–2012 (constant 2005 $)
Lao PDR = Lao People’s Democratic Republic.Source: World Bank, WDI database, accessed October 2014.
1995 1996 1997 1998 20001999 2001 2002 2003 2004 2005 2006 2007 2008 2009 2010 201220110
200
400
600
800
1,000
1,200
Lao PDR Philippines Thailand Viet NamBangladesh Cambodia India Indonesia

20
Cambodia: Diversifying Beyond Garments and Tourism Country Diagnostic Study
$887 million to GDP in 2010.6 Fisheries provided direct employment to about 420,000 people and impacted 2 million people through livelihood benefits in 2009. During the wet season, nearly all rural households engage in subsistence fishing (Food and Agriculture Organization 2011). Fish are an important component of the average Cambodian diet, and policies to promote fish production have important implications for national food and nutrition. Fisheries activities also leave an important ecological imprint that could affect the subsector’s 6 Estimates based on nominal fisheries as a share of GDP using
data from CEIC Global Database.
future productivity, so that conservation is essential to the sector’s sustainable development.
Fish production comes from inland and marine capture as well as aquaculture (Figure 1.27). Inland fisheries, centered on the Tonle Sap and Mekong floodplains, account for about three-fourths of the total catch. Nearly 600,000 tons of fish were caught in 2013, a six-fold increase from 2000 (Ministry of Agriculture, Forestry, and Fisheries website). Marine capture yields tripled from 2000 to 2013, with an increased number of both foreign and local boats fishing in Cambodian waters. Aquaculture, using
Figure 1.24. Cereal Yield, 1995–2013 (kilograms per hectare)
Lao PDR = Lao People’s Democratic RepublicSource: World Bank, WDI database, accessed October 2014.
Figure 1.25. Agriculture Subsectors’ Contribution to Agriculture Growth, 1995–2010 (%)
Source: Calculations using data from CEIC Global Database, accessed January 2014.
1995 1996 1997 1998 20001999 2001 2002 2003 2004 2005 2006 2007 2008 2009 2010 2013201220110
1,000
2,000
3,000
4,000
5,000
6,000
Lao PDR Philippines Thailand Viet NamBangladesh Cambodia India Indonesia
20001995 1996 1997 1998 1999 2001 2002 2003 2004 2005 2006 2007 2008 2009 2010–10
–5
5
0
15
10
20
Forestry and logging Fisheries FarmingLivestock and poultry

21
1. Development Performance
Figure 1.26. Output of Major Agriculture Products, 2000–2013 (tons)
Source: Ministry of Agriculture, Forestry, and Fisheries website.
Rice Sweet potato Maize
Cassava Vegetable Mung bean
Soya Peanut Sugarcane
Sesame Tobacco Jute
Mill
ions
Thou
sand
s
Thou
sand
s
Mill
ions
Thou
sand
s
Thou
sand
s
Thou
sand
s
Thou
sand
s
Thou
sand
s
Thou
sand
s
Thou
sand
s
Thou
sand
s
109876543210
9
8
7
6
5
4
3
2
1
0
2000
2001
2002
2003
2004
2005
2006
2007
2008
2009
2012
2013
2010
2011
2000
2001
2002
2003
2004
2005
2006
2007
2008
2009
2012
2013
2010
2011
2000
2001
2002
2003
2004
2005
2006
2007
2008
2009
2012
2013
2010
2011
2000
2001
2002
2003
2004
2005
2006
2007
2008
2009
2012
2013
2010
2011
2000
2001
2002
2003
2004
2005
2006
2007
2008
2009
2012
2013
2010
2011
2000
2001
2002
2003
2004
2005
2006
2007
2008
2009
2012
2013
2010
2011
2000
2001
2002
2003
2004
2005
2006
2007
2008
2009
2012
2013
2010
2011
2000
2001
2002
2003
2004
2005
2006
2007
2008
2009
2012
2013
2010
2011
2000
2001
2002
2003
2004
2005
2006
2007
2008
2009
2012
2013
2010
2011
2000
2001
2002
2003
2004
2005
2006
2007
2008
2009
2012
2013
2010
2011
2000
2001
2002
2003
2004
2005
2006
2007
2008
2009
2012
2013
2010
2011
2000
2001
2002
2003
2004
2005
2006
2007
2008
2009
2012
2013
2010
2011
90 1,000900800700600500400
500450400350300250
150200
200180160140120100
80604020
0
10050
0
300200100
0
80
70
60
50
40
30
20
10
0
90
80
70
60
50
40
30
20
10
0
35
30
25
20
15
10
5
0
1,800
1,600
1,400
1,200
1,000
800
600
400
200
0
100908070605040302010
0
201816141210
86420
1.00.90.80.70.60.50.40.30.20.10.0

22
Cambodia: Diversifying Beyond Garments and Tourism Country Diagnostic Study
mainly cage and pond techniques, accounts for less than 10% of total fishery output. Production of aquaculture grew by an average of 17% per year during 2008–2013 due to improved infrastructure and distribution of fish feed and fingerlings.
The growth of value added in fisheries is somewhat erratic, but averaged 3% annually in 1995–2004 and 4% in 2005–2010 (Figure 1.28). Fisheries’ reliability as a source of growth is driven more by supply than by rising demand—Cambodia already has one of the highest levels of per capita consumption of fish in Southeast Asia. Fisheries can be improved by addressing factors that hamper productivity, such
as fishers’ lack of access to modern technology and technical skills and threats from overfishing, pollution, and the loss of mangroves and flooded forests.
The Strategic Planning Framework for Fisheries 2010–2019 and the National Fisheries Policy detail mechanisms to help realize the vast potential of fisheries. Their goals include environmentally safe fisheries, conservation of biodiversity, and sustainable use of fisheries resources through legal enforcement, use of action plans, and the strengthening of institutions (Nam and Bunthang 2011).
Figure 1.27. Production of Fisheries Subsectors, 2000–2013
Source: Ministry of Agriculture, Forestry, and Fisheries website.
Figure 1.28. Growth of Agriculture and its Subsectors, 1995–2010 (%)
Source: Calculations using data from CEIC Global Database, accessed January 2014.
2000 2001 2002 2003 2004 2005 2006 2007 2008 2009 20132010 2011 20120
300
100
400
200
500
700
600
800
AquacultureInland capture Marine capture
‘000
tons
20001995 1996 1997 1998 1999 2001 2002 2003 2004 2005 2006 2007 2008 2009 2010–40
–20–30
–100
1020304050
Farming Fisheries LivestockForestry Agriculture

23
1. Development Performance
Livestock and Poultry. This subsector primarily comprises raising cattle, buffalo, pigs, and chickens. Its share of total agriculture output was stable at about 15% in 2000–2010. Value added has increased each year since 2001, except in 2009, peaking at 11% in 2001. The subsector contributed about 13% to annual agriculture growth during 2000–2010 (Figure 1.25, p. 20).
The subsector is characterized by small-scale production. For example, farmers raise poultry mainly as an income supplement. The subsector is unable to attract a significant number of domestic or international investors due to the lack of animal biosecurity measures to prevent the introduction of disease and to promote adherence to sanitary standards. In addition, road infrastructure linking farm areas to border areas is underdeveloped, resulting in high transport costs. Lack of border control, quarantine facilities, and animal medicines, as well as weak veterinary services, leave the country vulnerable to transboundary animal diseases. All these factors are contributing to stunting the subsector’s growth, and without appropriate government support, the potential of the livestock and poultry subsector is considerably diminished (Cambodia Forestry Administration 2010).
Forestry. About 73% of the country’s land area was covered by forests in 1965. With a rising population and expanded farming and nonfarm activities, forest cover fell to 57% in 2011. Value added from forestry primarily comes from wood production and utilization, and domestic and international forest trade involving trade in timber, wildlife products, and nontraditional forest products. During the first years of transition to an open economy, forest products, especially timber, became a source of foreign exchange with markets that initially included the Lao PDR, the former Soviet Union, and Viet Nam, then shifted to the People’s Republic of China, Japan, Malaysia, and Thailand (Cambodia Forestry Administration 2010).
Relative to other agriculture subsectors, forestry and logging have performed poorly since the mid-1990s. Except for a spurt of growth in 1997, the subsector recorded negative or close to zero growth
during 1995–2004, in part due to the suspension of forest concessions in 2002. After a brief period of growth in 2004–2006, the subsector has expanded only marginally in recent years (Figure 1.28). Its contribution to agriculture output averaged 3% in 2006–2010 and year-on-year growth averaged only 2% during the same period.
Expanding forest coverage to 60% of total land area by 2015 is among Cambodia’s MDG targets. A revival of the sector’s performance is envisioned in the National Strategic Development Plan 2014–2018, to be achieved through demarcating land areas covered by forests, classifying forests and developing a forest resources inventory, improving law enforcement against illegal logging, and enhancing governance in forestry management.
1.8.2. IndustryCambodia’s industry sector has performed remarkably well since the country transitioned to an open market economy, with industry accounting for 26% of output in 2013 (Figure 1.29) and contributing 41% to GDP growth in that year (see Figure 1.18, p. 16). Driven by a robust manufacturing subsector, industry’s value added has been growing by more than double the annual rate of agriculture’s value added (Figure 1.30).
Manufacturing is the largest contributor to industry output, accounting for at least 70% since 1998, with construction adding another 24%. Mining and utilities account for the remaining 4% (Figure 1.30). Manufacturing also contributed most to industry growth—averaging 9.4 percentage points in 2000–2012.7 Construction contributed 2.3 percentage points per year during 2000–2012. The contributions of mining and utilities are smaller (Figure 1.31).
Construction and Mining. The urban landscape, particularly in Phnom Penh, has changed vastly with the construction of buildings and infrastructure, creating strong demand for mining materials
7 This average excludes 2009 data, when growth declined abruptly, and which would distort the 2005–2012 average.

24
Cambodia: Diversifying Beyond Garments and Tourism Country Diagnostic Study
Figure 1.30. Industry Subsectors’ Shares of Total Industry Output, 1995–2013 (%)
Sources: Calculations using data from ADB (2013a, 2014b).
Figure 1.31. Contribution of Subsectors to Industry Growth, 1995–2013 (%)
Source: Calculations using data from ADB, SDBS, accessed October 2014.
Figure 1.29. Industry’s Share of Total Output and Growth Rate, 1995 –2013 (%)
Source: ADB, SDBS, accessed October 2014.
1995 1996 1997 1998 20001999 2001 2002 2003 2004 2005 2006 2007 2008 2009 2010 201320122011–15–10
0–5
1510
5
20253035
Share of total output Year-on-year growth
1995 1996 1997 1998 20001999 2001 2002 2003 2004 2005 2006 2007 2008 2009 2010 2013201220110
2010
4030
5060708090
100
Utilities MiningManufacturing Construction
1995 1996 1997 1998 20001999 2001 2002 2003 2004 2005 2006 2007 2008 2009 2010 201320122011–15
–5–10
50
101520253035
Utilities MiningManufacturing Construction

25
1. Development Performance
(Table 1.3). Mining is dominated by industrial and construction materials (crushed stone, sand, gravel). Production of laterite and crude stone grew more than 12-fold from 2004 to 2011, while sand production increased at least 100-fold (Table 1.4). Extractive activities currently involve exploration for natural gas and petroleum along the coast.
Manufacturing. The production of garments, textiles, and footwear dominates manufacturing, and their share of sector output rose from 15% in 1995 to 75% in 2010. Cambodia has become an attractive production site due to its low wages, preferential tariffs, and quota-free access to major markets. The food, beverage, and tobacco subsector continues to grow, but its relative importance has diminished with the rise of garments, textiles, and footwear. Food, beverages, and tobacco accounted for 36% of manufacturing output from 1995 to 1999, but for only about 10% since 2006. The shares of
other subsectors, including rubber, wood, paper, and publishing have experienced a similar decline (Figure 1.32 and Table 1.5).
The output of garments, textiles, and footwear grew 60% annually in 1995–2000, but slowed to 8% in 2006–2010 (Table. 1.5). Exports increased four-fold between 2001 and 2013, from $1.2 billion to $4.9 billion (Figure 1.33), including a contraction of almost 20% in 2009 due to the global financial crisis. Reliance on global clothing retailers in Europe and the United States left this sector susceptible to adverse demand shocks. The fall in exports in 2009 highlighted the need for Cambodia to diversify its markets (Figure 1.34). Footwear exports were less affected by the crisis and have recorded positive growth since 2006, averaging 32% per year. Figure 1.35 shows the lack of export diversification, with garments dominating exports for more than a decade.
Table 1.3. Construction Industry, 1995–2013 (%)
Source: Calculations using data from ADB, SDBS, accessed October 2014.
Table 1.4. Production of Mineral Commodities, 2004–2011 (tons)
… = data not available.Sources: Fong-Sam (2012); Soto-Viruet and Fong-Sam (2013).
Indicator 1995–2000 2001–2005 2006–2010 2011 2013Share of Industry Output 27.6 22.4 23.7 17.6 19.5
Growth Rate 8.0 13.9 1.2 7.9 16.9
Contribution to Industry Growth (percentage points)
2.3 3.1 0.4 1.5 3.1
Commodity 2004 2006 2008 2010 2011Cement .‥ .‥ 772,029 789,025 800,000
Gravel .‥ 45,625 37,500 82,500 82,500
Laterite, Blocks 118,400 .‥ 454,750 1,612,500 1,500,000
Salt 40,000 59,000 78,000 .‥ .‥
Sand (construction material) 363,700 2,043,500 6,581,500 38,367,500 40,000,000
Stone: Crude Construction Material 501,600 676,832 2,039,336 6,331,000 6,300,000
Limestone .‥ .‥ 1,000,000 1,000,000 1,000,000

26
Cambodia: Diversifying Beyond Garments and Tourism Country Diagnostic Study
Figure 1.33. Exports of Garments, Textiles, and Footwear, 2001–2013 ($ billion)
Source: Data from GMAC website, accessed February 2014.
Figure 1.32. Contribution of Subsectors to Manufacturing Growth, 1995–2010, (%)
Source: Calculations using data from CEIC Global Database, accessed January 2014.
1995 1996 1997 1998 20001999 2001 2002 2003 2004 2005 2006 2007 2008 2009 2010–10
–5
50
101520253035
Other manufacturing
Wood, paper, and publishing
Rubber
Garments, textiles, and footwearFood, beverages, and tobacco
Table 1.5. Manufacturing Subsectors, 1995–2010 (%)
Source: Calculations using data from CEIC Global Database, accessed 23 January 2014.
Subsector
Share of Total Manufacturing Output Growth Rate per Subsector
1995–2000 2001–2005 2006–2010 1995–2000 2001–2005 2006–2010Garments, Textiles, and Footwear 34.6 70.4 75.9 59.5 19.9 7.9
Rubber 3.1 1.9 1.2 21.5 -5.6 8.2
Food, Beverage, and Tobacco 33.3 13.9 10.0 4.7 1.6 5.3
Food, Paper, and Publishing 10.7 2.7 2.0 1.0 -7.0 5.6
Other Manufacturing 18.3 11.0 11.0 9.5 8.6 1.1
2001 2002 2003 2004 2005 2006 2007 2008 2009 2010 2013201220110.0
2.0
3.0
1.0
4.0
5.0
6.0
FootwearGarments and textiles

27
1. Development Performance
1.8.3. ServicesThe services sector accounts for just over 40% of GDP, more than industry or agriculture (Table 1.6 and Figure 1.18). Trade, finance, and other services are the most dynamic subsectors, accounting for 78% of sector output annually during 1995–2013. Improved financial architecture has led to stellar
year-on-year growth in finance, averaging 9% since 2000. Trade contributed the most to services sector growth (Figure 1.36).
Tourism, a key component of the services sector, accounted for 17% of GDP in 2013, nearly a six-fold increase from 1995 (Figure 1.37). About 54% of investment approved by the Cambodia Investment
Figure 1.34. Major Markets for Garments, Textiles, and Footwear Exports, 2001–2013 (% of $ value)
Source: Data from GMAC website, accessed February 2014.
Figure 1.35. Exports by Commodity, 2002–2012 (% of $ value)
Source: Calculations using data from CEIC Global Database, accessed June 2013.
0 10 20 30 6040 70 80 90 100
20042005
20022001
2003
20072006
200820092010201120122013
Other Markets Canada European Union United States
2002 2003 20052004 2006 2007 2008 2009 20112010 20120
40302010
5060708090
100
Timber Other wood articlesClothing Shoes
Cigarettes
Other textile products
Rice OthersRubber Fishing products

28
Cambodia: Diversifying Beyond Garments and Tourism Country Diagnostic Study
Table 1.6. Services Sector, 1995–2013 (%)
Source: Calculations using data from ADB, SDBS, accessed October 2014.
Figure 1.36. Services Subsectors’ Contribution to Services Growth, 1995–2013 (%)
Note: Trade includes hotel and restaurants. Finance includes real estate.Source: Calculations using data from ADB, SDBS, accessed October 2014.
Figure 1.37. Tourism Industry, 1995–2013
GDP = gross domestic product.Source: Calculations using data from Ministry of Tourism (2014) and World Bank, WDI database, both accessed October 2014.
Indicator 1995–2000 2001–2005 2006–2010 2011 2013Share of GDP 37.1 40.9 41.1 39.8 40.5
Growth Rate 8.0 10.2 7.0 5.7 8.7
Contribution to GDP Growth(percentage point)
2.9 4.0 2.9 2.3 3.5
1995 1996 1997 1998 20001999 2001 2002 2003 2004 2005 2006 2007 2008 2009 2010 2011 2012 2013–4
108642
–20
121416
Other services
Finance
Public administration
Transport and communicationsTrade
1995 1996 1997 1998 200120001999 20022003 2004 2005 2006 2007 2008 2009 20112010 201320120
1,6001,4001,2001,000
800600400200
1,8002,0002,2002,4002,6002,800
International tourism receipts ($ million) % of GDP
Inte
rnat
iona
l tou
rism
rece
ipts
0
108642
12141618202224
% of
GD
P

29
1. Development Performance
Board in 2006–2011 was in tourism, twice the combined shares of agriculture and industry. Tourism also creates considerable direct and indirect employment (Figure 1.38).
Cambodia received some 4.2 million visitor arrivals in 2013, up from less than 250,000 in 1995, with arrivals growing by about 20% annually during the 2000s (Figure 1.39). The severe acute respiratory syndrome (SARS) epidemic in 2003 and the 2008 global financial crisis temporarily reduced arrivals, but the tourism sector rebounded quickly after both events. Still, Cambodia accounted for less than 5%
of total arrivals in Southeast Asia in 2012. Malaysia and Thailand had much higher shares, at 30% and 27%, respectively (Figure 1.40).
Tourism is benefiting from closer regional ties and the rise of a middle class in Asia with money to spend on leisure. About 77% of visitors to Cambodia originate from other Asian and Pacific countries, followed by Europe at 17% and the Americas with 6% (Figure 1.41). Over 90% of international arrivals visit Cambodia for tourism; these are mostly one-time visits that are not repeated (Supreme National Economic Council 2011). Cambodia will need to
Figure 1.38. Contribution of the Travel and Tourism Industry to Employment, 1995–2013
Note: Direct employment includes jobs related to accommodation; food and beverage; retail trade; transport; and cultural, sports, and recreation activities. Indirect employment includes jobs in travel and tourism investment, government travel and tourism spending, the impact of purchases from suppliers, and spending by direct and indirect employees. Source: Calculations using data from World Travel and Tourism Council website, accessed June 2014.
Direct employment Indirect employment
0
200
400
600
1,000
800
1,200
‘000
peo
ple
1995 1996 1997 1998 1999 2000 2001 2002 2003 2004 2005 2006 2007 2008 2009 2011 20122010 2013
Figure 1.39. Total Annual Visitors to Cambodia, 1995–2013 (‘000 arrivals)
Source: Ministry of Tourism (2014).
20001995 1996 1997 1998 1999 2001 2002 2003 2004 2005 2006 2007 2008 2009 2010 2011 2012 20130
500
1,5001,000
2,0002,5003,0003,5004,0004,500
Arriv
als, ‘0
00

30
Cambodia: Diversifying Beyond Garments and Tourism Country Diagnostic Study
diversify its tourism offerings if the government is to meet its target of 8 million foreign tourists and 8 million to 10 million domestic tourists in 2020 (ADB 2011c).8
The Travel and Tourism Competitiveness Report 2013 (World Economic Forum [WEF] 2013b) ranked Cambodia 106th of 140 countries (Figure 1.42). It
8 Tourist arrivals were 2.5 million in 2010. The Tourism Master Plan (Ministry of Commerce 2014) targets 8.0 million international tourist arrivals.
achieved a high score in the prioritization of tourism, price competitiveness, and affinity for travel and tourism, but received low scores for health and hygiene, tourism infrastructure, information and communications technology, and cultural resources (Figure 1.43). Developing infrastructure for better health and hygiene, particularly water and sanitation, will improve the health of the population and the country’s attractiveness as a tourist destination. Cambodia fared poorly in tourism infrastructure, with its scores for air, land, and information and communication technology infrastructure lower
Figure 1.40. International Visitor Arrivals in ASEAN by Country Shares, 2000–2012 (%)
Lao PDR = Lao People’s Democratic Republic.Source: World Bank, WDI database, accessed October 2014.
Figure 1.41. Visitor Arrivals in Cambodia, by Major Geographic Region, 2006–2013 (million)
ASEAN = Association of Southeast Asian Nations.Source: Calculations using data from Ministry of Tourism (2014).
2000 2001 2002 2003 2004 2005 2006 2007 2008 2009 2010 201220110
15
10
5
20
25
30
35
40
Myanmar Philippines Singapore ThailandBrunei Cambodia Indonesia Lao PDR
Viet NamMalaysia
2006 2007 2008 2009 2011 20122010 20130
1.51.0
.5
2.02.53.03.54.04.5
AmericasEurope Rest of the worldASEAN Asia and Oceania
Milli
on

31
1. Development Performance
than other ASEAN countries surveyed (Figure 1.44). Upgrading hard infrastructure such as airports, ports, roads, and railways will clearly help transport tourists to, from, and within Cambodia. Almost half of all tourists to Cambodia arrive by land; thus,
developing the rural road network will be essential for boosting travel within and between provinces to diversify tourism beyond Angkor Wat and the temples near Siem Reap, currently the mainstay of the country’s tourism offerings.
Figure 1.42. Tourism Competitiveness Ranks of ASEAN Countries, 2008 and 2013
ASEAN = Association of Southeast Asian Nations.Sources: WEF (2008b, 2013b).
Figure 1.43. Elements of Cambodia’s Tourism Competitiveness: Scores in 2008 and 2013
ICT = information and communication technology, T&T = travel and tourism.Note: Data refer to scores in the Travel and Tourism Competitiveness Reports for 2008 and 2013. Scores range from 1 to 7, with higher scores preferred.Sources: WEF (2008b, 2013b).
Cambodia BruneiDarussalam
Indonesia Malaysia Philippines Singapore Thailand Viet Nam0
20
40
60
80
100
120
2013 (rank among 140 countries)2008 (rank among 130 countries)
21 43 5 6 7
Policy rules and regulationsNatural resources
Ground transport infrastructureT&T Competitiveness Index
T&T regulatory frameworkHuman, cultural, and natural resources
Health and hygieneICT Infrastructure
Tourism infrastructureCultural resources
Business environment and infrastructureAir transport infrastructure
Environmental sustainabilityHuman resources
Safety and securityPrice competitiveness in T&T industry
Affinity for T&TPrioritization of T&T
2008 2013

32
Cambodia: Diversifying Beyond Garments and Tourism Country Diagnostic Study
The government’s vision for tourism is set out in the Tourism Development Strategic Plan 2012 –2020 to promote the industry’s efficiency and establish tourism as a sustainable source of growth. The plan focuses on six priorities: product development, marketing, and promotion; connectivity; safety; management of negative impacts; legal system and management; and development of human resources.
1.9. Poverty and InequalityCambodia ranks 136th of 187 countries on the United Nations Development Programme’s Human Development Index, a combined measure of per capita income, education, and life expectancy.9 The country’s score rose from 0.44 in 2000 to 0.58 in 2013.
9 Cambodia’s ranking worsened from 130th to 136th in 2000–2013, partly because the number of countries ranked increased from 177 to 187.
1.9.1. Poverty Poverty has declined remarkably in recent years—during 2007–2011, the share of Cambodia’s population living below the national poverty line plunged from 45% to 21% (World Bank, WDI). The international poverty line of $1.25-a-day reveals a similarly significant decline in poverty (Table 1.7).10 These large declines are enabling Cambodia to close the gap with neighboring countries. In 2009, its poverty level was comparable to those of the Philippines and Viet Nam.
The reduction in poverty has been most pronounced in rural areas, where the headcount ratio fell from 38% to 25% during 2004–2009 (Figure 1.45). The decline is accounted for by two reinforcing factors. First, many of the poor had been living on incomes
10 National poverty lines are defined according to each country’s specific economic and social circumstances and vary considerably among nations, meaning that poverty incidence figures based on national poverty lines are not comparable across countries. International poverty lines attempt to hold the real value of poverty lines consistent across countries by accounting for differences in purchasing power across countries. Use of the international poverty line allows for comparison of poverty incidence across countries. The common international poverty lines are $2 a day and $1.25 a day (extreme poverty).
Figure 1.44. Competitiveness in Tourism Infrastructure
ASEAN = Association of Southeast Asian Nations, ICT = information and communication technology.Note: Data refer to average scores in the Travel and Tourism Competitiveness Reports for 2007, 2008, 2009, 2011, and 2013. ASEAN average represents average scores for Indonesia, Malaysia, Philippines, Singapore, Thailand, and Viet Nam. Scores range from 1 to 7 with higher scores preferred.Source: Calculations using data from World Economic Forum (WEF) (2013).
1 2 3 4 5 6 7
Air transportinfrastructure
Ground transportinfrastructure
Tourisminfrastructure
ICT infrastructure
ASEAN average Cambodia
Table 1.7. Poverty Rates, Selected Asian Countries, Latest Year
Lao PDR = Lao People’s Democratic Republic.Source: World Bank, WDI database, accessed July 2014.
Country
Latest Year for the
International Poverty Line
Poverty Headcount Ratio(% of the population)
At $1.25 a Day
At $2 a Day
At the National Poverty
Line (latest year)
Cambodia 2009 19 50 21 (2011)
Indonesia 2011 16 43 11 (2013)
Lao PDR 2008 34 66 28 (2008)
Malaysia 2009 0 2 2 (2012)
Philippines 2009 18 42 25 (2012)
Thailand 2010 < I 4 13 (2011)
Viet Nam 2008 17 43 17 (2012)

33
1. Development Performance
just below the poverty line. The increase in rural farm and nonfarm income has been effective in pushing them above the national poverty line and the $1.25-per-day line. For the higher poverty line of $2 per day, the reduction has been less impressive and the poverty level remains high. About 50% of the population survived on $2 or less in 2009. The second factor in rapid poverty reduction is strong growth throughout the economy and in particular agriculture, which has increased rural household income. In the mid-2000s, Cambodia experienced 4 consecutive years of GDP growth above 10%. Agriculture was a strong performer
during that period and appeared to shed the boom-and-bust cycle that was common to the sector prior to 2005. Annual gains in farm output were sustained in subsequent years. Nevertheless, poverty remains high in some areas. In 5 of the 24 provinces, the poverty rate exceeds 30% (Figure 1.46). Poverty in urban areas is lower than that in rural areas and has fallen at a slower rate, from 18% to 15% in 2004–2009.
1.9.2. Inequality The initial years of high growth were accompanied by worsening inequality. The Gini coefficient rose
Figure 1.45. Poverty Rates, 2004 and 2009 (%)
Source: World Bank, WDI database, accessed July 2014.
Figure 1.46. Poverty Incidence by Province, 2009 (%)
Source: Estimates using National Institute of Statistics (NIS) (2009).
2004
National poverty line Urban poverty line Rural poverty line At $1–a–day At $2–a–day
2011 2004 2009 2004 2009 2004 2009 2004 20090
10
3020
40506070
Ratta
naki
ri
Prea
h Vi
hear
Kam
pong
Tho
m
Kam
pong
Spe
u
Siem
Rea
p
Odd
ar M
eanc
hey
Prey
Ven
g
Bant
eay M
eanc
hey
Kam
pong
Cha
m
Kam
pot
Purs
at
Batta
mba
ng
Krat
ie
Kam
pong
Chh
nang
Koh
Kong
Syay
Rie
ng
Stun
g Tre
ng
Phno
m P
enh
Take
o
Kand
al
Pailin
Mon
dulk
iri
Siha
nouk
ville
Kep
0
10
20
30
40
50
60

34
Cambodia: Diversifying Beyond Garments and Tourism Country Diagnostic Study
from 0.38 in 1994 to 0.42 in 2004 (World Bank, WDI). However, during the more recent phase of rapid growth, the trend reversed and the Gini coefficient fell to 0.36, below the critical benchmark of 0.40 that conventionally separates moderately unequal countries from those with a high rate
(Figure 1.47). The richest 20% of income earners still account for 45% of the country’s total income, while the poorest earn only 8% of it. During the recent period of declining inequality, the income share of the richest quartile declined and the share of the other four income quartiles rose (Figure 1.48).
Figure 1.47. Income Inequality in Selected Asian Countries, Latest Year Available (%)
Lao PDR = Lao People’s Democratic Republic.Source: World Bank, WDI database, accessed July 2014.
Figure 1.48. Income Distribution by Quintile, 2004 and 2009
Source: World Bank, WDI database, accessed July 2014.
2004
Cambodia Indonesia Lao PDR Philippines Viet Nam2009 2005 2011 2002 2008 2003 2009 2002 2008
0
20
3025
1015
354045
5
50
Third 20% Second 20% Lowest 20%Highest 20% Fourth 20%
2004 2009
49 44
811
15
21
710
14
20

35
2. Critical Constraints to Growth
2. CRITICAL CONSTRAINTS TO GROWTH
To sustain high growth at or above an annual average of 7%–8%, Cambodia needs to renew its efforts to promote economic diversification and industrial upgrading while continuing to leverage its comparative advantage. Additional support would be required for the country to produce more complex and high-value goods and services, and to avoid getting caught in a low-value, low-wage production trap. And the priority should be on making further improvements in the business environment and investment in public goods.
The government has maintained a stable macroeconomic environment and invested in key growth-supporting factors (infrastructure and education), thus providing a backdrop for strong
growth. The social return on investment, which measures the efficiency of investment in generating growth, has been the highest in Southeast Asia for the last 2 decades (Figure 2.1).
Drawing on the growth diagnostics framework developed in Hausmann, Rodrik, and Velasco (2005), Box 2.1 assesses Cambodia’s economy to determine the key constraints to sustaining and accelerating growth. The analysis is organized around the three general areas provided in the framework: (1) factors that affect the social return on investment—education and infrastructure, (2) the appropriability of the return on investment—government and market failure, and (3) access to low-cost finance—both domestic and foreign .
Figure 2.1. Social Return on Investment in ASEAN Countries, 1995–2013 (%)
ASEAN = Association of Southeast Asian Nations, GDP = gross domestic product, Lao PDR = Lao People’s Democratic Republic.Note: Social return on investment is the ratio of the GDP growth rate and gross capital formation as a percentage of GDP. Myanmar is excluded due to its incomplete data series.Source: World Bank, WDI database, accessed October 2014.
1995 1996 1997 1998 1999 2000 2001 2002 20042003 20062005 2007 2008 2009 2010 20122011 2013–100
–20–40–60–80
020406080
Philippines Singapore Thailand Viet NamBrunei Darussalam Cambodia Indonesia Lao PDR Malaysia

36
Cambodia: Diversifying Beyond Garments and Tourism Country Diagnostic Study
2.1. Human Capital There is a need to increase investment in human capital. Developing an adequate skills base is essential for realizing the potential of young people coming into the job market. The working-age population (15–64 years) has increased rapidly, from about 7.6 million in 2004 to 9.6 million in 2013 (Table 2.1). Although Cambodia is moving toward the end of this demographic transition and fertility
rates have declined, a large influx of young people into the labor force will continue for some time.
Cambodia’s economic performance and future growth opportunities will depend largely on its ability to equip its young people with adequate education and skills for productive jobs and entrepreneurship.
The short supply of skilled labor stems from major disruptions in education during the civil war of
Figure B2.1. Problem Tree of the Growth Diagnostics Framework
Box 2.1. Growth Diagnostics Framework
The Hausmann, Rodrik, and Velasco (2005) approach provides a consistent framework for identifying the most critical or binding constraints to growth and for discerning the priorities and sequence of policies required to ignite and sustain growth. The growth diagnostics approach starts with a set of proximate determinants of growth, investigates which of these pose the greatest impediments or are the most critical constraints to higher growth, and determines specific distortions behind the impediments. The point of departure of the inquiry is a standard endogenous growth model in which growth depends on the social return to accumulation, private appropriability of this social return, and the cost of financing. Each of these three broad determinants of growth is in turn a function of many other factors, which can be presented in a problem tree (Figure B2.1.).
Low appropriability
Market failures
Coordination externalities
Low levels of private investment and entrepreneurship
Low return to economic activity
High cost of finance
Low domestic savings
Poor intermediation
Poor local finance
Bad international finance
Low socialreturns
Information externalities:
“self-discovery”
Poor geography
Low human capital
Poor infrastructure
Micro risks: property rights,
corruption, taxes
Macro risks: financial, monetary,
fiscal instability
Government failures
Sources: Hausmann, Rodrik, and Velasco (2005); authors.

37
2. Critical Constraints to Growth
the early 1970s and the subsequent Khmer Rouge regime. The state of education has improved greatly during the last 2 decades, broadening access for students of all socioeconomic and geographical backgrounds. However, limited funding seems to be a perpetual issue that hampers progress.
The share of government expenditure on education was the lowest in Southeast Asia, at less than 2% of gross domestic product (GDP) between 1995 and 2013 (Figure 2.2). Investment in education since the 1990s has concentrated on primary education, with education policy focused on achieving universal primary education. Remaining resources were mostly allocated to developing secondary education, while preprimary and tertiary education received very limited support (Figure 2.3).
Early years in education need more attention and public support. Preprimary education, a basic foundation of learning for school children, has
expanded during the last decade due to support from public and private institutions. But it was still below the average of 68% for East Asia and the Pacific in 2012 and below that of comparator countries in Southeast Asia (Figure 2.4).11
The overall quality of education remains a challenge. A national assessment system has yet to be standardized and regularly administered, but national assessment tests for grades 3, 6, and 9 in mathematics and language (Khmer) show that students’ learning achievements, although improving, remain low. Grades 3 and 9 students only managed mean scores in mathematics of 48% and 44%, respectively, which were below the passing score of 50% (Table 2.2). Language test scores were higher, and for grades 6 and 9 averaged well above 60% (the passing score for languages is also 50%).
11 UNESCO Institute for Statistics, accessed July 2014.
2004 2007 2009 2013Total Working-Age Population, 15–64 years (‘000) 7,589 8,232 8,865 9,604
Labor Force (‘000) 6,235 6,888 7,480 7,974
Labor Force Participation Rate 82.2 83.7 84.4 83.0
Employed (‘000) 6,577 7,313 7,469 7,951
Employment Rate 81.3 83.0 84.3 82.8
Table 2.1. Overview of the Labor Market, 2004–2013
Source: NIS, Cambodia Socio-Economic Survey (CSES), accessed January 2014.
Figure 2.2. Expenditure on Education, 1995–2013 (% of GDP)
GDP = gross domestic product.Source: ADB (2013b, 2014a).
1995 1996 1997 1998 1999 2000 2001 2002 20042003 20062005 2007 2008 2009 2010 2011 201320120
4321
56789
Brunei Darussalam Cambodia Malaysia Philippines Thailand

38
Cambodia: Diversifying Beyond Garments and Tourism Country Diagnostic Study
Progression rates have improved, but dropout rates remain high among lower- and upper-secondary students. The average repetition rate in the primary level fell to 5% in the 2012/2013 school year (SY) from 9% in SY2008/2009, but the dropout rates edged up from 8% to 11% (Figure 2.5). At the lower- and upper-secondary levels, the dropout rates are even higher at 21% and 14%, respectively. Dropout rates were also much higher in rural than in urban areas. Boys are more likely to repeat than girls.
Figure 2.3. Education Expenditure in Cambodia
Source: UNESCO Institute for Statistics, accessed May 2013.
Figure 2.4. Gross Enrollment Ratios in Preprimary Education, Selected ASEAN Countries, 2012 (%)
Lao PDR = Lao People’s Democratic Republic.Source: UNESCO Institute for Statistics, accessed October 2014.
Table 2.2. National Assessment of Learning Outcomes (average score)
Source: World Bank, Global Partnership for Education Database, accessed June 2014.
Assessment Grade Mathematics LanguageGrade 3 (2009) 48 54
Grade 6 (2007) 59 68
Grade 9 (2010) 44 68
Secondary Tertiary
Preprimary PrimaryEducation expenditure as % of total
Total government expenditure
87
13
73
215
1
2.3a. Share of Education Expenditure in Total Government Expenditure, 2011
2.3b. Share of Education Levels in Education Expenditures, 2011
Total Male Female
Cam
bodi
a
Indo
nesia
Lao
PDR
Lao
PDR
Lao
PDR
Viet
Nam
Thai
land
Cam
bodi
a
Indo
nesia
Viet
Nam
Thai
land
Cam
bodi
a
Indo
nesia
Viet
Nam
Thai
land
0
4060
20
10080
120

39
2. Critical Constraints to Growth
Cambodia has lowered its repetition rate substantially, especially at the primary level, but the share of repeaters to total enrollment at the primary level remains the second highest in Southeast Asia (Figure 2.6).
The low level of learning outcomes suggests a serious deficiency in the education system. The scarcity of basic learning materials and equipment and a weak curriculum in English and mathematics are major issues. In addition, the quality of teachers is a critical constraint on the performance of
schools. A high proportion of teachers have not completed educational qualifications and pedagogical training. Of Cambodia’s 89,000 teachers, only 14% hold a bachelor’s degree, and less than 1% have a master’s degree. More than 95% of primary school teachers have completed only up to upper secondary education. Among secondary school teachers, only 27% have obtained a bachelor’s degree (Table 2.3).
The shortage of qualified teachers necessitates additional investment to upgrade teachers’
Figure 2.5. Repetition and Dropout Rates in Various Levels, SY2008/2009 and SY2012/2013 (%)
SY = school year.Source: Ministry of Education, Youth, and Sport (2010a, 2014), accessed October 2014.
Lower secondaryPrimary Upper secondary Primary Lower secondary2008/2009 2012/2013
Upper secondary
Cam
bodi
a
Urb
an
Rura
l
Mal
e
Fem
ale
Cam
bodi
a
Urb
an
Rura
l
Mal
e
Fem
ale
Cam
bodi
a
Urb
an
Rura
l
Mal
e
Fem
ale
Cam
bodi
a
Urb
an
Rura
l
Mal
e
Fem
ale
Cam
bodi
a
Urb
an
Rura
l
Mal
e
Fem
ale
Cam
bodi
a
Urb
an
Rura
l
Mal
e
Fem
ale
0
5
15
10
20
25
Repetition Dropout
Figure 2.6. Repetition Rates at the Primary Level, Selected ASEAN Countries (%)
Lao PDR = Lao People’s Democratic Republic.Note: Latest year is 2012 for Cambodia, Indonesia, and Viet Nam; 2010 for Myanmar; and 2009 for the Philippines.Source: World Bank, WDI database, accessed October 2014.
CambodiaIndonesia Lao PDRMyanmar PhilippinesViet Nam0
5
10
15
20
25
latest year2005

40
Cambodia: Diversifying Beyond Garments and Tourism Country Diagnostic Study
education and skills. Teachers need to keep abreast of the advancement of technology and development of knowledge, as students’ learning outcomes largely depend on how well a teacher knows the subject matter and can ably teach the curriculum. Over time, Cambodia needs to expand the number of qualified teachers in primary and secondary schools.
Skills mismatches and gaps in the labor market are evident. According to the World Economic Forum’s Global Competiveness Report, Cambodia’s education system is the weakest in Southeast Asia (Table 2.4). While Cambodia’s education-related indicators are not the lowest in all categories, they are below other countries’ indicators in many categories. Improving the education system could strengthen the provision of market-relevant technical and vocational training in upper secondary schools and encourage the teaching of soft skills needed in the workplace, such as communications, problem solving, and working together.
The low completion rate for secondary school and the poor overall quality of education have limited the number of tertiary education enrollees. Less than 2,000 students enrolled in a 4-year bachelor’s degree program in SY2009/2010, and about 3,300 enrolled in a 2-year associate degree program (Table 2.5). The number of higher education institutions increased from 15 to 72 between 2001
and 2008, mostly concentrated in Phnom Penh. Of the 72 institutions, 46 are privately run (Figure 2.7).
Popular areas of study among Cambodian higher education students include foreign languages, management, accounting, and computer science. These had the highest number of enrollees during 2006–2009 (Table 2.6). Table 2.7 shows projections for the demand and supply of higher education graduates for 2009–2014. Most disciplines are likely to provide more than an adequate supply of graduates, with the exceptions of engineering, health science, and marketing. Nevertheless, employers continue to note that graduates lacked the essential skills and practical experience required for employment in the fields for which they were supposed to be qualified.
Both technical and vocational education and training (TVET) and higher education have a low-enrollment problem (Table 2.5). Although the number of students enrolled in TVET has grown in the last few years, it is low compared with the number of youths in the country. Many students do not pursue TVET because staying in school is costly. Further, the value of TVET to future earning potential may not be widely understood. Secondary school graduates who have followed the TVET curriculum earn 60% more than primary school graduates, and postsecondary TVET graduates earn a wage premium of 112% over lower-
Table 2.3. Education Level and Pedagogical Training of Teachers
Source: Ministry of Education, Youth and Sport (MOEYS) (2014), accessed July 2014.
EducationLevel Taught
Highest Education Level Achieved
PrimaryLower
SecondaryUpper
SecondaryBachelor's
DegreeMaster'sDegree
DoctoralDegree
Overall
Number 1,708 23,934 50,006 12,611 555 4.0
% 1.9 26.9 56.3 14.2 0.6 0.0
Primary
Number 1,364 15,768 25,893 1832 37 1.0
% 3.0 35.1 57.7 4.1 0.1 0.0
Secondary
Number 164 6,240 21,733 10,728 518 3.0
% 0.4 15.8 55.2 27.2 1.3 0.0

41
2. Critical Constraints to Growth
Comparative Indicators Cam
bodi
a
Indo
nesia
Lao
PDR
Thai
land
Viet
Nam
Phili
ppin
es
Mal
aysia
Brun
ei
Dar
ussa
lam
Sing
apor
e
Global Competitiveness Index 88 38 81 37 70 59 24 26 2
Quality of Primary Education 106 55 79 86 97 76 33 17 3
Primary Education Enrollment, net % 31 56 42 101 15 108 55 47 1
Secondary Education Enrollment, gross % 125 92 122 94 96 83 105 9 18
Tertiary Education Enrollment, gross % 104 87 100 55 89 81 62 94 20
Quality of Educational System 76 36 57 78 95 40 19 32 3
Quality of Math and Science Education 102 35 90 80 85 96 27 29 1
Quality of Management Schools 108 58 82 53 125 6 35 52 6
Internet Access in Schools 89 50 87 65 41 74 36 32 4
Availability of Research and Training 90 48 88 64 125 51 20 87 14
Extent of Staff Training 66 25 55 50 98 27 11 26 6
Type of Education 2004–2005 2005–2006 2006–2007 2007–2008 2008–2009 2009–2010Bachelor's Degree 1,041 1,126 1,158 1,408 1,330 1,981Associate Degree 1,237 2,201 2,172 3,151 1,959 3,308Vocational Training
Certificate 1,2,3 (from grades 10–12)
594 503 1,562 1,524 1,214 746
Vocational Training Certificate (less than 1 year/informal)
10,692 17,722 64,970 67,178 11,7240 66,695
Training at Private Institutes and NGOs
14,330 26,434 18,505 40,387 45,887 47,447
Table 2.4. Global Competitiveness Report, 2013–2014 (rank among 148 countries)
Lao PDR = Lao People’s Democratic Republic.Source: WEF (2013a).
Table 2.5. Enrollment in Higher Education and TVET in Cambodia, 2004–2010
NGO = nongovernment organization, TVET = technical and vocational education and training.Note: A bachelor’s degree is a 4-year degree course; an associate degree is a 2-year course. Source: United Nations Development Programme (UNDP) (2011).
Figure 2.7. Number of Higher Education Institutes, 2001–2010
Source: HR Inc. Cambodia (2009).
2001 2002 2003 2004 2005 2006 2007 2008 20100
6070
5040302010
8090
100
PrivatePublic

42
Cambodia: Diversifying Beyond Garments and Tourism Country Diagnostic Study
Table 2.6. Higher Education Enrollment by Discipline, 2006–2009 (% of total)
Note: Includes public and private higher education institutions. Foundation year is a year of study to prepare students whose educational background or achievements are insufficient to qualify to pursue the course in which they are enrolled. Source: UNDP (2011).
Table 2.7. Projected Demand for and Supply of Higher Education Graduates,2009–2014 (total for the 6 years)
Note: Total supply excludes unspecified disciplines, comprising 7,425 degrees in the 6-year period.Source: HR Inc. Cambodia (2009).
Study Discipline 2006–2007 2008–2009Various
Mathematics, chemistry, physics, biology 1.8 2.2Foundation year 2.2 3.3Computer science 8.8 6.9Sociology, humanities, arts 5.6 6.3Tourism 3.6 2.2Foreign languages 16.5 12.7Law 4.9 5.5Health science 5.8 5.7Agriculture and rural development 4.1 3.9Engineering and mechanical 3.1 3.4
Subtotal: Various 56.4 52.1Business Management
Business 7.9 7.9 Marketing 0.9 1.2 Management 14.6 12.2 Banking and finance 1.2 2.6 Economics 6.1 6.4 Accounting 8.8 11.3 Finance 4.1 6.4
Subtotal: Management 43.6 48.0
Discipline Demand Supply Excess SupplySupply as % of
DemandDisciplines in Excess Supply
Business and management 11,414 46,974 35,560 412
Foreign languages 2,916 32,958 30,042 1,130Information technology 2,928 17,956 15,028 613Accounting 9,220 23,562 14,342 256Banking, finance, and economics 17,215 30,683 13,468 178Sociology, humanities, and arts 1,570 13,789 12,219 878Law 1,184 11,820 10,636 998Tourism 2,632 6,591 3,959 250Other science 860 4,773 3,913 555Agriculture and rural development 5,141 8,638 3,497 168
Disciplines in Excess Demand
Engineering 8,153 7,197 –956 88
Health science 14,307 12,424 –1,883 87Marketing 8,066 2,501 –5,565 31
Total 85,606 219,866 134,260 257

43
2. Critical Constraints to Growth
secondary school graduates. Yet, only about 17% of students express a desire to enroll in TVET (World Bank 2012).
The government has emphasized improving skills as part of its Rectangular Strategy for Growth, Employment, Equity, and Efficiency. Although firms do not currently perceive skills as a top business constraint, skills shortages will undermine the process of upgrading and diversifying industry, services, and agriculture. Estimates based on a recent survey of firms in Cambodia (World Bank and ADB 2012) indicate that 9.2% of firms reported skills shortages as a major constraint to growth, an increase from the 6.5% in an earlier assessment (World Bank 2004). The 2012 survey also noted that 22% of foreign-owned firms identified skills shortages as a “severe” or “very severe” constraint to their businesses. Employers also point to the relative shortage of skilled TVET and higher education graduates. In a survey of 78 employers (World Bank 2012), 73% reported that university graduates did not have the right skills (only 12% said there are not enough university graduates) and 62% of employers noted that vocational training graduates did not have the right skills (38% suggested that there are too few vocational graduates). Moreover, 31% of employers noted that it is difficult to train or upgrade their
workforce, reflecting that training programs are not widely available and are of low quality, and that the skills foundation is generally weak.
Education and experience are major considerations in hiring. Employers find higher education important for professional work, but seek workers with skills certificates and associate degrees for specialized work. In hiring general workers, employers place greater emphasis on work experience than education (Figure 2.8).
Employers perceived the greatest skills shortages in senior management; they also identified “soft skills” as the most important type that employees lack. In the same survey of employers (World Bank 2012), more than 70% reported a major shortage of management skills, 36% reported that middle management and supervisor skills were in short supply, and 34% noted that skills of professionals such as engineers and lawyers were insufficient. Among the most deficient soft skills, 52% of employers identified work attitudes in unskilled workers, 45% cited decision-making skills in semi-skilled workers, and 64% mentioned analytical skills in skilled workers.
Formal and informal vocational training programs have not been addressing the needs of the labor market and this is evident from the skills mismatch
Figure 2.8. Education Level and Experience Required by Employers
2.8a. Education Level Usually Required 2.8b. Experience Required
Source: BDLink Cambodia (2008).
Associate degree
Not important
0 10 20 30 605040 70 80 90 100
Worker
Specialized
Professional
Bachelor’s/master’s Doctoral
High school Skill certificateNo
0 10 20 30 605040 70 80 90 100
Worker
Specialized
Professional
Depends Yes

44
Cambodia: Diversifying Beyond Garments and Tourism Country Diagnostic Study
indicated by employers for selected sectors. About 19% of employers surveyed indicated that workers with vocational training lacked the necessary skills to do their jobs and 63% indicated that such workers had some but not all of the necessary skills (Figure 2.9). For workers with higher education the results were similar: 28% of employers indicated that these workers lacked the required skills and 61% noted that the workers lacked some skills. The skills gap varies between sectors and workers. Those with higher education, particularly, lack skills for jobs in hospitality and construction.
Employers also indicated the skills that are lacking per type of worker (Table 2.8). For unskilled workers, employers ranked a lack of motivation or poor work attitude as the skill most lacking; for semi-skilled workers, a need to improve decision-making ranked first; and for skilled workers, it was a lack of analytical ability.
Overall, the skills gaps and mismatches are linked to the access to and quality of education and skills training and to the priority government gives to different levels of the education system. Insufficient information and coordination with the labor market
compound the problem, as employers seem to lack channels to communicate their need for specific skills or to influence the government’s policies for skills development. Supply-side factors include the challenges of
Figure 2.9. Skills Gaps among Workers (%)
Note: Data refer to the percentage of formal sector firms reporting on vocational training graduates and the skills necessary to perform their jobs. “Yes” means the firm felt that workers had the required skills.Source: World Bank (2010).
Yes
0 10 20 30 605040 70 80 90 100
with vocational training
with higher education
with vocational training
with higher education
with vocational training
with higher education
with vocational training
with higher education
Cons
truct
ion
Tota
lH
ospi
talit
yG
arm
ents
Yes, but not all skills No
Table 2.8. Skills Employers Find Lacking Most in Employees
Source: UNDP (2011).
Worker Skill Level Skill PercentageUnskilled Work attitude 52
Foreign language 37Technical 32Experience 32Communication 30
Semi-Skilled Decision making 45Experience 42Analytical 40Technical 36Work attitude 35
Skilled Analytical 64Decision making 55Experience 37Technical 32Work attitude 29

45
2. Critical Constraints to Growth
� managing resources in ways that create incentives for higher education and TVET institutes to perform well, be accountable for results, and produce a quality workforce;
� teaching technical and soft skills;
� bringing schools and industries closer together to promote high quality education relevant to the market demand; and
� motivating households to encourage children to attend school and complete their education.
2.2. InfrastructureThe government recognizes the importance of improved infrastructure for sustaining growth and reducing poverty. Cambodia’s infrastructure is less developed than in neighboring countries, due to destruction during the civil conflict and subsequent underinvestment (Figure 2.10). An inadequate supply of infrastructure is consistently ranked among the top five constraints voiced by business executives (WEF 2013a).
2.2.1. ElectricityThe cost of electricity is high, while access to electricity is among the lowest in Southeast Asia (Figure 2.11). Both are major constraints on business because they increase production costs. Over 40% of businesses surveyed for the 2012 Investment Climate Assessment cited the quality of electricity supply among their top three business constraints (World Bank and ADB 2012). A quarter of respondents ranked it as their top constraint.
Figure 2.10. Global Competitiveness, Infrastructure Scores in Selected ASEAN Countries, 2013
Lao PDR = Lao People’s Democratic Republic.Source: WEF (2013a).
Cambodia IndonesiaBruneiDarussalam
Lao PDR Malaysia Myanmar Philippines Singapore Thailand Viet Nam0
1
2
3
4
5
6
7
Overall score Infrastructure quality
Figure 2.11. Access to Electricity in Selected Asian Countries, 2011 (% of population)
Lao PDR = Lao People’s Democratic Republic.Source: World Bank, WDI, accessed July 2014.
0 10 20 30 605040 70 80 90 100
Nepal
Lao PDR
Indonesia
Viet Nam
Bangladesh
Cambodia

46
Cambodia: Diversifying Beyond Garments and Tourism Country Diagnostic Study
Cambodia has yet to benefit from economies of scale in power generation. Electricity is generated by the state-owned Electricité du Cambodge, independent power producers, and consolidated licensees (Table 2.11). The total installed capacity was 582 megawatts (MW) in 2012: independent power producers controlled 77%, Electricité du Cambodge 13%, and consolidated licensees 9%. Independent power producers provided 92% of electricity generated, Electricité du Cambodge 5%,
The electrification rate was 51% in 2013. The residential subsector continues to be the primary user of electricity (consuming 51% of the supply), followed by services (27%), and industry (19%). The coverage of electricity supply varies widely across regions, with urban households much better supplied than rural. In Phnom Penh, 100% of households are covered and 94% have coverage on the other cities, but in rural areas, the coverage is a low 38%. In Siem Reap, a popular tourist destination, less than a third of the villages are covered. In areas served by private rural electricity enterprises, supply is intermittent and often limited to 4–5 hours in the evening (ADB 2011b). In 2013, 44% of rural households used batteries for lighting and 16% used kerosene lamps (NIS, CSES Tables; Table 2.9).
From the early 1990s and until recently, insufficient attention was paid to planning for the economy’s power needs, resulting in inadequate generating capacity, lack of a nationwide grid, and lack of diversification in the structure of production. Consequently, Cambodia depends heavily on electricity imports, which provided 64% of electricity consumed in 2012 (Table 2.10). About three-quarters of total imports are sourced from Viet Nam and the rest are mostly from Thailand. Imports from Viet Nam cost twice as much as imports from Thailand.
Table 2.9. Main Sources of Lighting by Geographical Domain, 2013 (% of households)
... = data not available.Source: All numbers, including the totals, are from NIS, CSES Tables, accessed July 2014.
Table 2.10. Cambodia’s Electricity Sector, 2012
kW = kilowatt, kWh = kilowatt-hour, Lao PDR = Lao People’s Democratic Republic.Source: Electricity Authority of Cambodia (2013).
Sources of Lighting Cambodia Phnom Penh Other Urban Other RuralPublicly-Provided Electricity/
City Power50.9 100.0 94.3 37.9
Generator 0.3 … … 0.4
Battery 34.3 … 2.9 43.5
Kerosene Lamp 12.4 … 2.2 15.5
Candle 0.3 … 0.5 0.4
None … … … 0.0
Solar 0.8 … … 1.0
Other 1.0 … 0.1 1.3
Total 100.0 100.0 100.0 100.0
Households (‘000) 3,162 363 331 2,468
Description Unit AmountElectricity Generated million kWh 1,423
Total Imports million kWh 2,104
From Viet Nam million kWh 1,560
From Thailand million kWh 535
From Lao PDR million kWh 9
Total Electricity Available million kWh 3,527
Energy Sold to Consumers million kWh 3,266
Generation Capacity kW 581,935
Consumers number 992,597
Overall Loss % 7.4

47
2. Critical Constraints to Growth
and consolidated licensees 3%. Total electricity generation exceeded 1,400 gigawatt-hours.
Domestically produced electricity is mostly generated from petroleum, leaving the country vulnerable to oil price volatility.12 Oil-run generators provided 60% of the electricity generated in 2012, with hydropower providing 36% and wood, other biomass and coal the rest.13 Cambodia has a huge hydropower potential—10,000 MW, of which 50% is in the Mekong River, 40% in its tributaries, and
12 Cambodia has unexploited oil and gas reserves. Eight sedimentary basins have been divided into 19 blocks onshore and 6 blocks offshore (Cambodia National Petroleum Authority website). Twenty-eight exploratory wells have been drilled, but the scale of deposits has not been estimated (RGC 2009). Expectations were lowered after it was discovered that the reserves lie in a complicated geological reserve (Reegle website).
13 In June 2013, electricity supply to Kampong Speu, Kandal, and Phnom Penh received a boost from a new 50-MW coal-fired plant in Sihanoukville province.
10% in the southwestern coastal area outside the Mekong basin. With the exception of the large-scale 190-MW Kamchay Plant commissioned in 2011 and a few small and micro hydropower plants, few hydropower dams are on-line (Tables 2.11 and 2.12). However, projects of about 1,000 MW capacity are being developed and, once on-line, they will substantially boost domestic power generation and provide a major shift to cleaner and renewable energy sources (Ministry of Industry, Mines, and Energy, 2012). The government recognizes that these new sources could impact local livelihoods, food security, environmental sustainability, forest degradation, and net carbon emissions (RGC 2012), and that it will need to address these concerns.
The new hydropower projects are part of the Power Development Plan for 2008–2021. Eighteen new power plants are scheduled for completion by 2020. Nine are hydropower, which will account for nearly two-thirds of added capacity; the rest will be mainly fueled by coal.14 The new plants will add 3,576 MW to the system, dramatically increasing capacity and broadening the sources of power generation.
The national grid covers about 80% of the electricity delivered to consumers. Establishing a complete national grid is a government priority. Currently, grids across the borders with the Lao People’s Democratic Republic (Lao PDR), Thailand, and Viet Nam supply adjacent areas inside Cambodia, and other domestic grids support their respective areas (Table 2.13).
The grids have been expanded considerably since 2005. Medium-voltage lines (22 kilovolts) were constructed to support three grids, one each covering the southern, eastern, and northeastern areas. As of 2012, the total length of the medium- and low-voltage lines was 12,880 kilometers (km) and 12,463 km, respectively (Table 2.14). However, the grids do not reach isolated rural areas.
Because of unreliable electricity supply, many firms incur the additional cost of setting up and
14 Council for the Development of Cambodia, Cambodia Investment Board, and Cambodia Special Economic Zone Board website, Investors Information, Infrastructure, Electricity.
Table 2.11. Installed Electricity Capacity and Generation, 2012
kW = kilowatt, kWh = kilowatt per hour. a Consolidated licensees are a combination of some or all types of licenses. A license can be issued to Electricité du Cambodge and to isolated distribution systems, granting the right to generate, transmit, dispatch, distribute, and sell electricity to consumers. Source: Electricity Authority of Cambodia (2013).
Installed Capacity
(kW)
Share of Total
Installed Capacity
(%)
Electricity Generated
(million kWh)
Share of Total
Electricity Generated
(%)
Total 581,935 100 1,423 100
Producer
Independentpower producers
451,844 77.7 1,306.0 91.8
Consolidatedlicenseesa
54,361 9.3 40.2 2.8
Electricité du Cambodge
75,730 13.0 76.9 5.4
Source
Hydropower 225,060 38.7 517.4 36.4
Diesel, heavyfuel oil
321,005 55.2 856.6 60.2
Wood, otherbiomass
22,500 3.9 11.7 0.8
Coal 13,000 2.2 37.4 2.6

48
Cambodia: Diversifying Beyond Garments and Tourism Country Diagnostic Study
operating their own power generators. Frequent power outages curtail production and shorten the life of capital equipment. Two generation licensees provide supply to captive industries: Kampot Power Plant supplies Kampot Cement Company and Angkor Bio Cogen Company supplies rice producer Angkor Kasekam Roongroeung.
The government aims to increase rural access to electricity and is targeting the electrification of all villages by 2020 and at least 70% of all households having access to grid electricity by 2030 (Electricity Authority of Cambodia 2012).
At $0.13 per kilowatt-hour, Cambodia’s average tariff is the second highest in Southeast Asia (Figure 2.12, p. 49). The country has different tariffs for domestic, commercial, industrial, and government users. In general, tariffs are much higher outside Phnom Penh (Table 2.15, p. 49). High input costs are a major reason for the high cost of electricity, with small and fragmented generating capacity and large transmission and distribution losses contributing to high tariffs. The majority of generating plants are oil-fueled and electricity prices depend on the price of imported oil.
Table 2.13. Grid Systems
kWh = kilowatt-hour, MV = medium voltage.Source: Electricity Authority of Cambodia (2013).
Table 2.12. Hydropower Plants as of May 2013
MW = megawatt.Sources: For O Chum II, Kirirom I, and the two microhydros: Ministry of Industry, Mines, and Energy (2011); for Kamchay: Henderson and S. Mesa (2013); for Kirirom III: Energy Business Review (2013).
Hydropower Plant ProvinceInstalled
Capacity (MW)Commissioned
SinceO Chum II Rattanakiri 1.000 1993
Kirirom I Kampong Speu and Koh Kong 12.000 May 2002
O Romis Microhydropower Mondulkiri 0.185 Nov 2008
O Moleng Microhydropower Mondulkiri 0.185 Nov 2008
Kamchay Kampot 190.000 2011
Kirirom III Southwest region 18.000 2013
Total 221.370
System
Energy Input to System
(million kWh)% of Total
Energy Sold to Consumers (million kWh)
% of Total
Number of Consumers
Served% of Total
National Grid 2,791 79.3 2,622 80.3 651,236 65.6
Kampot–Sihanouk Grid 116 3.3 102 3.1 33,590 3.4
Kampong Cham Grid 42 1.2 33 1.0 54,061 5.4
Viet Nam Grid at MV 318 9.0 277 8.5 131,378 13.2
Thai grid at MV 143 4.1 127 3.9 29,847 3.0
Lao grid at MV 9 0.3 8 0.2 3,563 0.4
Isolated Distribution Systems 29 0.8 24 0.7 88,920 9.0
Generation Licensees to Captive Industries
72 2.0 72 2.2 2 0.0
Total 3,520 100.0 3,266 100.0 992,597 100.0

49
2. Critical Constraints to Growth
Table 2.14. Length of Transmission and Distribution Lines, 2012 (km)
km = kilometer, kV = kilovolt, LV = low voltage, MV = medium voltage. a Medium voltage line is 22 kV; below that is a low voltage line.b A consolidated license is a combination of some or all types of licenses, which provide the rights to generate, transmit, dispatch, distribute, and/or sell electricity.c A special transmission license grants the right to construct, own, and operate specified transmission facilities.Source: Electricity Authority of Cambodia (2013).
MV Linea LV LineGeneral Distribution
Electricité du Cambodge 7,419.64 5,332.91
Consolidated licensees with special purpose transmission license and distribution licenseb
1,020.02 533.18
Consolidated licensees with generation and distribution licenseb 2,291.88 3,764.36
Distribution licensees 1,853.47 2,832.90
Special Purpose Transmission Licenseesc
TPLC Holdings 71.00
Transco Energy (Cambodia) 8.00
BVC Power Development 215.86
Total 12,879.86 12,463.35
Client Phnom Penh Other AreasDomestic 15.13–20.34 15.19–91.75
Commercial, Industrial, Government 18.24–31.33 12.00–91.75
Figure 2.12. Average Electricity Tariffs in ASEAN Countries (US cents/kWh)
ASEAN = Association of Southeast Asian Nations, kWh = kilowatt-hour, Lao PDR = Lao People’s Democratic Republic, US = United States.Note: Average electricity tariffs were computed for each sector. Philippine tariffs for commercial and industrial sectors are not available.Source: Poch and Tuy (2012).
Table 2.15. Electricité du Cambodge Tariffs as of 31 December 2012 (US cents/kWh)
kWh = kilowatt-hour, US = United States.Note: $1 = 4,033 riels.Source: Calculations using data from Electricity Authority of Cambodia (2013).
Cambodia IndonesiaBruneiDarussalam
Malaysia MyanmarLao PDR Philippines ThailandSingapore Viet Nam0
5
10
15
20
25
Residential IndustrialCommercial

50
Cambodia: Diversifying Beyond Garments and Tourism Country Diagnostic Study
2.2.2. Transport NetworkRoad vehicles are the dominant mode of transport, servicing more than 90% of passenger and freight movements. Traffic on rail and water transport has declined steadily due to the deterioration of facilities and inefficient service. Domestic civil aviation has been growing due to burgeoning tourism, but its contribution to overall transport service is minimal.
Government expenditure on transport and communication has fluctuated since the early 1990s (Figure 2.13), averaging 4% of total government spending during 1995–1997, but has been below 2% since 2007. In absolute terms, spending on transport and communication rose significantly between 2004 and 2013 except for a dip in 2011. Road Transport. Development partners have supported the rehabilitation of primary national roads, and 94% of primary national roads have two lanes and are paved and in good condition. However secondary national, provincial, and rural roads are in disrepair and are the chief weakness of the road transport system. About half of the secondary national roads and 85% of provincial roads remain unpaved and have only a single lane (Table 2.16). Nearly all rural roads are unpaved and thus difficult to use during the rainy season. Among countries of the Association of Southeast Asian Nations (ASEAN), Cambodia has the lowest percentage of paved roads (Table 2.17). The budget for routine
road maintenance has increased in recent years, but funding for periodic maintenance has declined since 2009 (Figure 2.14).
The poor state of rural roads contributes to the high cost of farm-to-market transport. For example, transporting 1 ton of agricultural product over 100 kilometers costs about $15.00 in Cambodia compared with $7.50 in Viet Nam and only $4.00 in Thailand (World Bank 2009). Farmers, traders, and processors identify high transport costs (due to poor infrastructure and illegal fees) as a major constraint on their profitability (Agrifood Consulting and Camconsult 2006). A typical rural household in Cambodia spends more hours traveling than does a rural household in Bangladesh, Ethiopia, or the Philippines (Table 2.18).
Transport costs consume a large part of poor rural households’ incomes. Farmers can also be affected if middlemen try to recoup the high transport costs of taking agricultural products to market and depress the farm gate prices. An efficient transport network will help raise rural incomes and allow farmers and rural agro-enterprises to transport their products to market in a timely manner. More secondary, provincial, and rural roads need to be paved and upgraded to all-weather conditions to reduce transport costs and travel time. An improved road network will also help improve rural access to social services.
Figure 2.13. Expenditure on Transport and Communications, 1995–2013
KR = riel.Source: ADB (2014a).
0
302010
405060708090
Expenditure Share of total expenditure
KR b
illion
0
321
456789
% of
tota
l exp
endi
ture
1995 1996 1997 1998 20001999 2001 2002 2003 2004 2005 2006 2007 2008 2009 2010 201320122011

51
2. Critical Constraints to Growth
Table 2.16. Road Network, 2012
km = kilometer.Source: Ministry of Public Works and Transport (MPWT) (2012).
Table 2.17. Road Transport Indicators, ASEAN Countries, Latest Year Available
km = kilometer, km2 = square kilometer, Lao PDR = Lao People’s Democratic Republic.Source: World Bank, WDI database, accessed February 2014.
Figure 2.14. Road Maintenance Budget, 2007–2012 ($ million)
Source: MPWT (2012).
Road Classification Length (km)Road Type as % of Total Road Length
Paved Roads per Classification (%)
Number of Bridges
Primary National Road 2,258 4.8 93.7 589
Secondary National Road 3,342 7.1 55.9 698
Provincial Road 6,607 14.0 15.1 904
Rural Road 35,000 74.1 0.3 1,869
Total 47,207 100.0 23.0 4,060
Roads, Total
Network (‘000 km)
Road Density(km of road/ 100 km2 of
land area)Paved Roads
(% of total roads)
Vehicles (per 1,000
people)Cambodia 40 22 6 21
Indonesia 476 25 57 60
Lao PDR 40 17 14 20
Malaysia 144 44 80 361
Myanmar 34 5 12 7
Philippines 200 67 10 67
Singapore 3 4,794 100 186
Thailand 180 35 99 157Viet Nam 160 48 48 13
2007 2008 2009 20112010 20120
10
5
15
20
25
30
35Periodic maintenace Routine maintenance Emergency maintenance

52
Cambodia: Diversifying Beyond Garments and Tourism Country Diagnostic Study
The government has acknowledged the importance of rural roads in sustaining growth and reducing poverty. The Strategic Plan for Rural Roads Development is anchored on “improving social and economic conditions of rural Cambodia, with an emphasis on improving the livelihood of the rural poor and creating livelihood opportunities for women in rural areas, through the sustainable improvement and maintenance of rural roads” (Ministry of Rural Development 2007a, viii). The plan lists inadequate programming and planning, limited financing, unsustainability, and weak institutions as constraints to the development of rural roads. The necessary legal and institutional systems could be strengthened to improve road safety and ensure that regulations are enforced and clear roles are assigned to the agencies involved in transport.
Port and Inland Waterway Facilities. Cambodia’s two international ports, Phnom Penh and Sihanoukville, have been expanded and modernized with donor financing. Further expansion and modernization are imperative to support increased exports and investments in the country’s special economic zones. For example, additional storage facilities are needed to increase exports of agricultural products and reach the government’s target of exporting 1 million tons of rice annually by 2015. Exploiting off-shore oil reserves will also require adequate oil terminal facilities.
Sihanoukville is the country’s only deep-water port, handling 70% of imports and exports. Facilities include wharfs, an oil terminal (able to store 60,000 cubic meters of refined oil), a container berth, an
old jetty, and storage facilities (Table 2.19). The port caters mainly to feeder ships from Singapore; it also handles oil tankers and general cargo vessels from Malaysia, Thailand, and other countries in the region. The port handled an annual average of 891 ships in 2007–2011. About 45% of freight traffic is containerized, 32% is cement (32%), and 18% comprises oil products (18%).
The total cargo handled in Sihanoukville port has increased significantly since 2005 (Table 2.20). But passenger traffic has been low except for a surge in 2009 and 2010 (Figure 2.15), when additional passenger cruise ships and naval ships visited on rest and recreation and goodwill tours.15
On the Tonle Sap River at Phnom Penh, a major inland port provides access to vessels from the sea through Viet Nam. Port facilities include a container and general cargo terminal, a passenger terminal, a warehouse, and a dry port (Table 2.21). The port serves an average of 150 ships per year, including Singapore-based cargo vessels that usually take 10–12 days for a return voyage. Phnom Penh’s port infrastructure consists of three main cargo ports and two oil terminals. The current capacity of the port is 120,000 twenty-foot equivalent units (TEUs)16 per year, enough to cater to the maximum cargo throughput handled so far (Table 2.22). A new port that will increase the total capacity to 300,000 TEUs per year is being constructed to accommodate the expected increase in cargo traffic.
15 Sihanoukville Infrastructure and Real Estate website, accessed May 2013.
16 Equivalent to a twenty-foot container.
Table 2.18. Transport Burden in Selected Countries
… = not available, km = kilometer.a The total transport effort expended per household is measured in ton-km; 1 ton-km is the “transport effort” in moving a 1-ton load for 1 km.Source: Ministry of Rural Development (2007b).
CountryHousehold Size
(people)Trips
per Day (No.)Hours of Travel
per Day
Distance Traveled per
Day (km)
Transport Effort per Year
(ton-km)a
Bangladesh 5.4 32 4.4 26.0 244.0
Cambodia 5.8 15 6.7 23.1 58.4
Ethiopia 5.8 5 3.5 … 23.2
Philippines 5.3 6 2.4 … 63.8

53
2. Critical Constraints to Growth
Cambodia also has maritime ports at Koh Kong near the Thai border and in Kampot Province. These cater mainly for interisland cargo and only take smaller vessels due to their lack of modern equipment and limited berth lengths.
Cambodia still has a relatively small international freight market with no major bulk commodity
flows, unlike some of its neighbors. The number of containers the two main ports handle is low by regional standards (Figure 2.16). Although port infrastructure has increased, inefficiencies in operations and customs procedures remain, resulting in high transaction costs and longer port handling times. For example, shipping
Table 2.19. Infrastructure at Sihanoukville Port
m = meter.Source: MPWT (2012).
Table 2.20. Cargo Throughput at Sihanoukville Port, 2005–2011
TEU = twenty-foot equivalent unit.Source: Port Autonome de Sihanoukville website, accessed September 2013.
Figure 2.15. Passengers at Sihanoukville Port, 2001–2011 (‘000)
Source: MPWT (2012).
Name, Location Structure Length (m) Depth (m) Year ConstructedOld Jetty Outer Jetty 290 –9.0 1960
Inner Jetty 290 –8.0 1960
New Wharf Concrete block 350 –8.5 1970
Container Berth Concrete block 400 –10.0 2007
Oil Terminal (used by private companies listed below)
Sokimex Jetty 200 –10.5
Tela Pontoon 110 –6.5
Oil terminal Stone wharf 53 –4.2
Type 2005 2008 2011Total Cargo (tons) 1,380,846 2,057,967 2,439,384
Container (TEU) 211,141 258,775 237,941
General Cargo (TEU) 107,929 291,114 372,554
0
5
10
15
20
25
30
Passenger departuresPassenger arrivals
2001 2002 2003 2004 2005 2006 2007 2008 2009 20112010

54
Cambodia: Diversifying Beyond Garments and Tourism Country Diagnostic Study
a dry forty-foot container from Sihanoukville to Singapore costs about $600, but only $220 from Ho Chi Minh to Singapore (World Bank 2009).
Costs associated with handling and inland transport of imports at the main ports are high by regional standards (Table 2.23). Importers pay $223/TEU for port and terminal handling plus $205/TEU for inland transport and handling. However, exporting costs less, which may be due to the nature of Cambodia’s main export product—garments—and the active role of the industry association in reducing trade
costs (World Bank and International Finance corporation [IFC] 2009).
Other constraints to efficient and competitive trade logistics are rooted in operational, procedural, organizational, and other causes. The largest cost items for imports and exports are cargo clearance procedures and document processing. Customs procedures are slow, reflected in the average number of days that a container is processed while in port. In Cambodia, trade costs not related to transport are more than three times those in Thailand and two
Table 2.21. Major Infrastructure at Phnom Penh Port
m = meter, m2 = square meter.Source: MPWT (2012).
TEU = twenty-foot equivalent unit.Source: MPWT (2012).
Table 2.22. Cargo Throughput at Phnom Penh International Port, 2006–2011
Description Specification Vessel LimitationsContainer and General
Cargo TerminalQuay: 20 m x 300 mBerthing capacity: 3 vessels at one time
Water depth: –5.0 m
Passenger Terminal 2 pontoons of 15 m x 45 m each Water depth: –3.5 m
Warehouse Area: 70m x 50m = 3,500 m2
Area: 50m x 30m =1,500 m2
Inland Container Depot Area: 92,000 m2
Type 2006 2007 2008 2009 2010 2011Total Cargo (tons) 956,170 1,106,701 1,240,339 1,297,115 1,294,800 1,508,413
Container (TEU) 38,233 47,504 47,507 43,312 62,256 81,631
Figure 2.16. Container Port Traffic, Southeast Asian Countries, 2007–2012 (TEU)
TEU = twenty-foot equivalent unit. Source: World Bank, WDI database, accessed July 2014.
2007 2008 2009 2010 201220110
21
43
56789
10
Cambodia ThailandIndonesia Viet Nam

55
2. Critical Constraints to Growth
times those in Viet Nam (Chheang and Hamanaka 2011). Bribery and corruption also add to the cost of transport logistics.
Long turnaround times are also an issue, although trade facilitation, customs procedures, and port administration are improving. It takes 5 days on average to clear exports which is comparable to the regional average. Clearance for imports is 6 days which is still longer than the regional average of 4.6 days (World Bank and IFC, Doing Business 2013a). However, the initiation of “blue” and “green” channels for imports has reduced the clearance time for some goods to just 1 day.
Inland waterways are a traditional means for moving goods and people, especially during the rainy season. Cambodia’s extensive inland waterways—the Mekong, the Tonle Sap, the Bassac, and their numerous tributaries—provide 1,750 km of navigable waterways, although only 580 km are
navigable year round (Ministry of Public Works and Transport 2012). There are severe draft restrictions during summer, as only small craft with a 0.6-meter or less draft are able to operate in the river system. The capacity of vessels plying the Mekong ranges from 20 to 150 tons, depending on the river depth at various locations and times of the year.
In general, inland water transport receives limited support and faces severe constraints in port facilities, especially a lack of navigation aids, limited storage, and the absence of wharf infrastructure at important river crossings. Although many communities depend on these waterways in the absence of a road network in their areas, this is unlikely to be a key means of moving goods and people in future. In any case, limited funds prevent the government from expanding and rehabilitating its inland waterways (RGC and Belgian Technical Cooperation 2006).
Table 2.23. Comparison of Duration and Cost of Importing and Exporting, 2013
Lao PDR = Lao People’s Democratic Republic.Sources: World Bank and International Finance Corporation (IFC), Doing Business website (2013a); economy profiles for Brunei Darussalam, Cambodia, Indonesia, Lao PDR, Malaysia, Myanmar, Philippines, Singapore, Thailand, and Viet Nam from World Bank and IFC (2013c–l).
Export Import
CountryTotal Days
Total Cost ($)
Ports and Terminal Handling
Inland Transportation and Handling
Total Days
Total Cost ($)
Ports and Terminal Handling
Inland Transportation and Handling
Share of
Total Days (%)
Share of
Total Cost (%)
Share of
Total Days (%)
Share of
Total Cost (%)
Share of
Total Days (%)
Share of
Total Cost (%)
Share of
Total Days (%)
Share of
Total Cost (%)
Brunei Darussalam
19 705 16 34 16 32 15 770 13 41 7 29
Cambodia 22 795 14 13 9 25 24 930 17 24 8 22
Indonesia 17 615 12 27 18 26 23 660 17 25 9 24
Lao PDR 23 1,950 13 8 13 69 26 1,910 8 8 15 71
Malaysia 11 450 18 27 27 41 8 485 25 25 25 38
Myanmar 25 670 8 25 8 30 27 660 22 25 7 30
Philippines 15 585 20 38 13 29 14 660 21 30 7 28
Singapore 6 460 17 33 33 30 4 440 25 34 25 32
Thailand 14 595 21 27 14 35 13 760 15 21 8 28
Viet Nam 21 610 14 25 10 33 21 600 19 29 5 33

56
Cambodia: Diversifying Beyond Garments and Tourism Country Diagnostic Study
However, the government recognizes the Mekong River’s importance in rural, domestic, and international transport. The 2006 Master Plan for Waterborne Transport on the Mekong River System in Cambodia laid out strategies to improve and rehabilitate transport operations, including regular dredging of waterways, container facilities, handling equipment, and navigation aids. The master plan also includes strategies for environmentally responsible dredging, and for a bilateral navigation agreement with Viet Nam.
Rail Transport. Rail transport is not playing a significant role in supporting economic activity, aside from transporting key bulk goods such as petroleum and cement. The rehabilitation of the railway, which is under way, will reduce the volume of bulk freight on the roads, significantly reducing road damage.
Cambodia’s rail system consists of two single-track main lines with a total length of 640 km. The Northern Line links Poipet on the Thai border in the northwest to Phnom Penh; the Southern Line runs from the capital to Sihanoukville on the coast. The last 48 km of the Northern Line from Sisophon to Poipet (referred to as “the missing link”) is being rehabilitated. The main commodities carried by rail are petroleum (from Sihanoukville to depots in Battambang and Phnom Penh), cement, sugar, and other cargo for which expeditious delivery is not essential.
Passenger trains ceased to run on the Southern Line in 2004 and the Northern Line in 2008 (Figure 2.17). Freight trains continue on both lines, but the travel time between Phnom Penh and Sihanoukville is 18–20 hours,17 compared with 4–5 hours18 by road.
The repair and rehabilitation of the railways will enhance the country’s economic growth and help reduce poverty. The project will reduce the number
17 Calculation based on information from Council for the Development of Cambodia, Cambodia Investment Board, and Cambodia Special Economic Zone Board website, Investors Information, Infrastructure, Railways, accessed September 2013.
18 Port Autonome de Sihanoukville website, accessed September 2013.
of heavy vehicles on the road by up to 50%, leading to fewer road accidents, savings in road and sea transport costs, lower carbon dioxide emissions, and improved safety by shifting dangerous or flammable cargo from roads to rail.
With declining traffic and revenue, and the need to rehabilitate infrastructure, continued subsidies to the railways weigh on the government budget. The government took a major step in June 2009 when it signed a concession agreement with a private sector agency to operate and maintain the rail network for 33 years. The agreement is to provide freight services only. Main lines are being rehabilitated, with cofinancing from the Asian Development Bank, the OPEC Fund for International Development, and Malaysia, and with counterpart funding from the Government of Cambodia. Significant portions have already been rehabilitated and opened for operation. The rehabilitation also includes two branch lines: Phnom Penh station to the Green Trade Warehouse complex and Sihanoukville container terminal to the Sihanoukville port. A Greater Mekong Subregion cross-border rail facility and rail and road freight terminal is to be built at Poipet (ADB 2011d). The challenge is now to find a niche market for the railway and restructure its organization to make it more responsive to evolving sector demand.
Air Transport. Airport infrastructure has improved, but requires further upgrading to handle expanding tourist traffic. Phnom Penh International Airport and Siem Reap International Airport are the major facilities. Each handled an average of 1.7 million passengers per year during 2005–2013 (Figure 2.18). Passenger arrivals have increased sharply since 2005, dominated by growing international traffic, though there was a dip during the global financial crisis. The two main airports operate above capacity and are being expanded so that each can handle 5 million passengers per year. Both airports are accessible via primary national roads. The government plans to build new international airports in Phnom Penh and Siem Reap to meet increased demand: the Tourism Development Strategic Plan 2012–2020 anticipates foreign tourist arrivals reaching 8 million annually by 2020.

57
2. Critical Constraints to Growth
Air transport is key to tourism growth in Cambodia. The government’s commitment to an “open skies” policy since 1999 and deregulation of the airline industry allowed foreign carriers to operate in the country, resulting in competitive fares, additional flights, and increased tourist arrivals. The formation of the State Secretariat of Civil Aviation in 1996 was instrumental in improving compliance with the safety and security of international air transport. It encouraged private sector participation in the management, operation, maintenance, and capital
upgrading of airports, terminals, and air traffic and navigation services through build-operate-transfer concessions. The legal and regulatory framework for civil aviation was strengthened by the 2008 Civil Aviation Law and numerous safety-related regulations. These efforts are starting to bear fruit (Figure 2.19), as reflected in the higher rating of Cambodia’s airport infrastructure than those of the Philippines and Viet Nam in the Global Competitiveness Report 2013–2014 (WEF 2013b).
Figure 2.17. Freight and Passenger Train Services, 2000–2011
Source: MPWT (2012).
Southern line freightNorthern line freight
20012000 2002 2003 2004 2005 2006 2007 2008 2009 201120100
200400600800
1,0001,2001,4001,6001,8002,000
Num
ber o
f fre
ight t
rain
serv
ices
0
20015010050
250300350400450500
Num
ber o
f pas
seng
er tr
ain se
rvice
s
Northern line passenger Southern line passenger
Figure 2.18. Passenger Volume, Phnom Penh and Siem Reap Airports, 2005–2013 (million)
PPIA = Phnom Penh International Airport, SRIA = Siem Reap International Airport.Note: Each airport is designed for the capacity to handle annually 1.5 million passengers. Phnom Penh is designed for 30,000 tons of cargo annually; Siem Reap for 3,000 tons of cargo.Sources: Cambodia Airports website, accessed February 2014; State Secretariat of Civil Aviation website, accessed May 2013.
20062005
PPIA SRIA PPIA SRIA PPIA SRIA PPIA SRIA PPIA SRIA PPIA SRIA PPIA SRIA PPIA SRIA PPIA SRIA
2007 2008 2009 2010 2011 2012 2013
0.0
1.0
0.5
1.5
2.0
2.5
3.0
Domestic arrivals Domestic departures International arrivals International departures

58
Cambodia: Diversifying Beyond Garments and Tourism Country Diagnostic Study
2.3. Macroeconomic Risks2.3.1. Fiscal PositionThe main fiscal challenge is to increase domestic revenue mobilization. Additional revenue is needed to fund public investments in physical and social infrastructure (energy, roads, education) that are crucial to economic growth and development (Figure 2.20). Additional revenue will also help replenish fiscal buffers and ensure that resources are available to help counter sudden economic downturns.
Revenue as a share of GDP remained flat in the decade to 2004, averaging 8%–10%. Revenue collection improved with the implementation of the Law on Taxation, passed in 1997 and amended 2003. Further fiscal reforms were implemented under the two phases of the Public Financial Management Reform Program (2004–2006 and 2008–2010). The Law on Public Finance System (2008) laid down fundamental principles to manage public finances. These initiatives broadened the tax base in the informal sector and strengthened tax auditing. In other fiscal efforts, the tax and customs departments have been modernized and the anti-smuggling plan upgraded. Tax exemptions beyond the allowable limit set out by the Law on Investments were officially prohibited. These reforms, especially
in business taxes and customs administration, resulted in a gradual increase in revenues. Tax revenue as a share of GDP rose from 7.3% in 2000 to 12.4% in 2013. This has supported growth in total government revenues to just over 14.9% in 2013; however, the revenues are still lower than in most other countries in the region (Figure 2.21).
Revenues are dominated by indirect taxes, which accounted for 52% of all taxes in 2012 (Figure 2.22). Taxes on international trade contributed one-third
Figure 2.19. Quality of Air Transport: Scores of Selected ASEAN Countries, 2013
ASEAN = Association of Southeast Asian Nations.Note: Scores are a weighted average of scores in reply to the question “How would you assess infrastructure (e.g., transport, telephony, and energy) in your country?” In the scoring, 1 = extremely underdeveloped and 7 = extensive and efficient by international standards.Source: WEF (2013b).
GDP = gross domestic product.Source: ADB (2014a).
Figure 2.20. Fiscal Deficit, 1995–2013 (% of GDP)
CambodiaIndonesiaSingapore PhilippinesMalaysia Thailand BruneiDarussalam
Viet Nam0
3
2
1
4
5
6
76.8 5.8
5.54.8
4.54.1 4.0
3.5
–10
0
5
–5
10
15
20
25
ExpenditureRevenue
1995 2000 2005 2010 2012 20132011
Fiscal deficit

59
2. Critical Constraints to Growth
of tax revenues in the early 2000s and, although they have fallen to about one-fifth, the share remains high relative to other countries in the region. The share is likely to decline further as tariff reductions continue under the ASEAN Economic Community 2015 and other bilateral and multilateral agreements.
Provincial taxes contribute a small share of total revenues.
Low tax revenues are caused by weaknesses in tax administration and tax policy. On the former, about 80% of taxes come from large taxpayers, and the creation of the Large Taxpayers Department has helped to increase revenues, though these gains have leveled off in recent years. A large buildup of tax arrears has reduced revenue inflows and a more aggressive strategy to tackle the arrears should be developed. Thus, along with the effort to strengthen tax collection from a greater number of large taxpayers, a broader effort to increase direct taxes is needed. The hiring of 200 new tax auditors from mid-2011 to mid-2012 was clearly a help in this effort. The General Department of Taxation continues to operate as a directorate of the Ministry of Economy and Finance, but increased autonomy might help to improve its governance and management.
Better tax information and services to the public and small enterprises would increase collection. Better tax department use of information and communication technology (ICT) is needed to ensure officials can focus on increasing tax collection rather than on low-level administrative tasks. Cambodia’s tax department has no substantial ICT function in-house, which most developed countries and several emerging ones have (among them, the People’s Republic of China, the Philippines, and Thailand). Tax collection would likely also improve through greater use of ICT to make payments. Taxpayers currently do not have access to advanced payment mechanisms, such as phone banking, internet banking, direct debit through a bank, or payment kiosks. All of these facilities are available to taxpayers in neighboring Thailand, for example. Taxpayers in Cambodia do not even have the facility of sending a check by mail for tax payment—common in advanced countries prior to electronic payments (Araki and Claus 2014).
Weak tax policy is also contributing to low revenues. The profit-tax exemption on new investments under the Qualified Investment Projects incentive scheme can be stretched to a maximum of 9 years
Figure 2.21. Fiscal Deficit, Government Revenues and Expenditures, Selected ASEAN Countries, 2013 (% of GDP)
ASEAN = Association of Southeast Asian Nations, GDP = gross domestic product, Lao PDR = Lao People’s Democratic Republic.Source: ADB (2014a).
Figure 2.22. Government Tax Revenue Sources, 2003–2012 (KR million)
KR = riel.Note: The methodology for classifying and defining government finance items is based on IMF (1986).Source: IMF, Cambodia Article IV Country Consultation, various years.
Revenue Expenditure Fiscal deficit–10
5
1510
–50
20253035
Cambodia Indonesia Lao PDR
Philippines Thailand Viet Nam
2003 2004 2005 2006 2007 2008 2010 2011 201220090
3
4
2
1
5
6
7
Indirect taxes
Trade taxes Direct taxes
Provincial taxes

60
Cambodia: Diversifying Beyond Garments and Tourism Country Diagnostic Study
and results in considerable foregone tax revenue. It is also unclear if the incentive is effective in attracting new investment. Furthermore, the tax guide for companies (based on the Cambodian Tax Law) includes a number of goods or services to which full or partial exemptions apply, including electricity, financial services, and several petroleum products. Excise taxes are generally low and a revision of their application could increase revenues. Tobacco and diesel may be particularly targeted.
2.3.2. InflationInflation has held steady and is not a threat to macroeconomic stability. Cambodia experienced triple-digit inflation in the early 1990s due to rapid monetary expansion from deficit financing. Inflation was subsequently reduced through prudent macroeconomic management and was maintained at the single-digit level from the late 1990s to the mid-2000s.
2.3.3. Current Account BalanceCambodia’s external position remains stable despite a widening current account deficit. The
deficit, largely driven by a widening merchandise trade gap, continues to be financed by foreign direct investment and official loans and grants, which have grown rapidly since 2005. But with healthy growth in official reserves, the exchange rate has remained relatively stable.
2.3.4. External DebtCambodia’s external debt structure is relatively uncomplicated. It almost entirely comprises concessional loans, both bilateral and multilateral, with relatively long maturities. The stock of debt has increased steadily since 2007 and was $5.7 billion in 2012. The debt-to-GDP ratio rose from 33% to 41% in that period (Figure 2.23).
Debt service was less than 1% of goods and services exports in 2007, but rose steadily to 1.5% in 2012. The risk of debt distress is low and standard stress tests do not reveal any serious vulnerability, according to the International Monetary Fund’s debt sustainability analysis in 2012 (IMF 2013). The present values of debt-to-GDP, debt-to-exports, and debt-to-revenue ratios are also expected to decline over the next 20 years. However, the debt-to-revenue ratio appears sensitive to exchange rate
Figure 2.23. Size of External Debt and Debt Service Ratio, 2001–2012
GDP = gross domestic product.Source: World Bank, WDI database, accessed July 2014.
0
2010
4030
5060708090
0.0
0.40.2
0.80.6
1.01.21.41.61.8
External debt stock (% of GDP) Debt service ratio (% of exports)
2000 2001 2002 2003 2004 2005 2006 2007 2008 2009 20112010 2012
Exte
rnal
deb
t sto
ck
Deb
t ser
vice r
atio
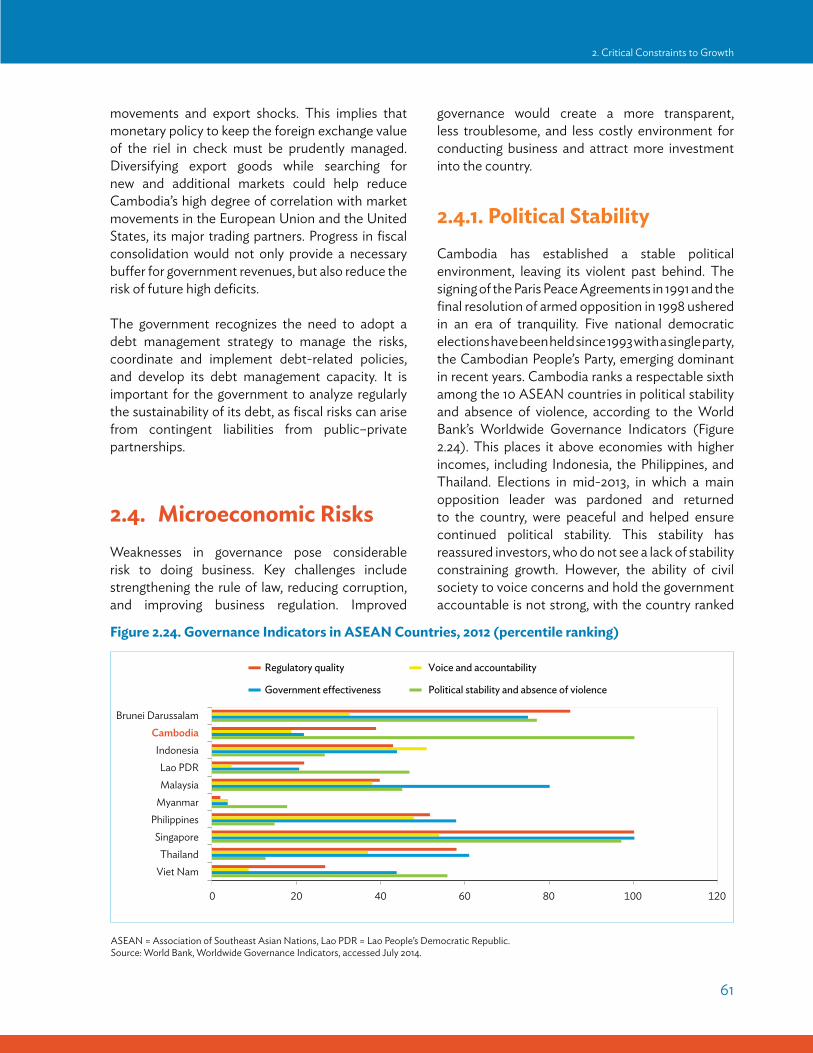
61
2. Critical Constraints to Growth
movements and export shocks. This implies that monetary policy to keep the foreign exchange value of the riel in check must be prudently managed. Diversifying export goods while searching for new and additional markets could help reduce Cambodia’s high degree of correlation with market movements in the European Union and the United States, its major trading partners. Progress in fiscal consolidation would not only provide a necessary buffer for government revenues, but also reduce the risk of future high deficits.
The government recognizes the need to adopt a debt management strategy to manage the risks, coordinate and implement debt-related policies, and develop its debt management capacity. It is important for the government to analyze regularly the sustainability of its debt, as fiscal risks can arise from contingent liabilities from public–private partnerships.
2.4. Microeconomic RisksWeaknesses in governance pose considerable risk to doing business. Key challenges include strengthening the rule of law, reducing corruption, and improving business regulation. Improved
governance would create a more transparent, less troublesome, and less costly environment for conducting business and attract more investment into the country.
2.4.1. Political Stability Cambodia has established a stable political environment, leaving its violent past behind. The signing of the Paris Peace Agreements in 1991 and the final resolution of armed opposition in 1998 ushered in an era of tranquility. Five national democratic elections have been held since 1993 with a single party, the Cambodian People’s Party, emerging dominant in recent years. Cambodia ranks a respectable sixth among the 10 ASEAN countries in political stability and absence of violence, according to the World Bank’s Worldwide Governance Indicators (Figure 2.24). This places it above economies with higher incomes, including Indonesia, the Philippines, and Thailand. Elections in mid-2013, in which a main opposition leader was pardoned and returned to the country, were peaceful and helped ensure continued political stability. This stability has reassured investors, who do not see a lack of stability constraining growth. However, the ability of civil society to voice concerns and hold the government accountable is not strong, with the country ranked
Figure 2.24. Governance Indicators in ASEAN Countries, 2012 (percentile ranking)
ASEAN = Association of Southeast Asian Nations, Lao PDR = Lao People’s Democratic Republic.Source: World Bank, Worldwide Governance Indicators, accessed July 2014.
200 6040 80 100 120
PhilippinesSingapore
ThailandViet Nam
MyanmarMalaysiaLao PDR
Indonesia
Brunei DarussalamCambodia
Regulatory quality Voice and accountability
Government effectiveness Political stability and absence of violence

62
Cambodia: Diversifying Beyond Garments and Tourism Country Diagnostic Study
seventh in the ASEAN region in these indicators, which have shown little improvement in the last 2 decades.
2.4.2. CorruptionCorruption has long been regarded as a major barrier to improving the business environment and governance in Cambodia (ADB 2012a), and is a significant deterrent to investment. Corruption is often a direct financial burden on businesses, and dealing with it at the firm level also contributes to the high cost of doing business, perpetuates uncertainty, and encourages smaller firms to remain in the informal economy. Business surveys consistently find that corruption is the top business constraint. In the most recent Global Competitiveness Report (WEF 2013a), corruption was almost twice as significant a problem as the next major concern—inefficient government bureaucracy, which is also related to government performance (Figure 2.25). On the positive side, corruption appears to have decreased during the last half decade, while other
concerns (skilled labor, finance, and infrastructure) have increased in importance.
Cambodia ranked low in governance indicators in the World Bank’s World Governance Indicators compared with other ASEAN countries (Figure 2.26), on par with the Lao PDR and only slightly higher than Myanmar on the corruption measure. And transparency International’s 2013 Corruption Perceptions Index ranks Cambodia lowest in ASEAN. The 2013 Global Corruption Barometer survey suggests that the key institutions in Cambodia affected by corruption are the judiciary, the police, public officials and civil servants, political parties, and the private sector (Transparency International 2013a, 2013b).
Bribes, often referred to as “informal payments” or “gifts,” are required to get action from government officials, including access to basic services. About half the firms in the Asian Development Bank and World Bank survey of 2012 said they expected to give gifts to public officials to “get things done”; for example, securing a water or electricity connection.
Figure 2.25. Most Problematic Factors for Business, 2008–2009 and 2013–2014
Note: From a list of 16 factors, respondents were asked to select the 5 most problematic for doing business and to rank them between 1 (most problematic) and 5. Data in bars indicate the responses weighted according to their rankings.Sources: WEF (2008a, 2013a).
50 1510 20 25 30
Foreign currency regulations
Poor public healthInflation
Crime and theftTax rates
Insufficient capacity to innovatePoor work ethic in national labor force
Restrictive labor regulationsGovernment instability/coups
Tax regulationsAccess to financing
Policy instability
Inadequately educated workforceInefficient government bureaucracy
Corruption
Inadequate supply of infrastructure
2013–2014 2008–2009

63
2. Critical Constraints to Growth
In the same survey, 65% of respondents expected to pay bribes for a construction permit. Bribe-taking is prevalent at least partly because public sector salaries, especially of frontline and clerical officials, are below what is widely considered necessary for achieving an adequate household income. Although a large number of responding firms said they expected to have to pay bribes to get things done, the expectation has nevertheless decreased since 2007, except for acquiring a water connection (Table 2.24). This is in line with the general finding that corruption has fallen somewhat since the late 2000s.
Corruption is prevalent in government procurement. An Asian Development Bank assessment concluded that there is a general perception that processes lack “transparency and integrity” and it is difficult to prove or act upon specific allegations. The assessment suggests that procurement specialists suspect collusion among tendering agencies, procurement review committees, and bidders. Practices include rigged specifications, limited publicity of bid opportunities, falsification of information in bid evaluation reports, and expectations that winning bidders will have to provide kickbacks (ADB 2012c). The importance of having a comprehensive and focused law on
procurement has been raised by development partners for at least the last decade, but to date no such law has been enacted. A subdecree on procurement was approved 1995 and one on Implementing Rules and Regulations for Public Procurement was issued in 2006. The detailed instructions for the former were updated in 2010.
The decline in overall corruption in recent years may be the result of the enactment of the Anti-Corruption Law in 2010. This seeks to combat corruption through education, prevention, and law enforcement using a process of public participation and international cooperation. Among other
Figure 2.26. Control of Corruption in Southeast Asia, 1996–2012 (percentile rank)
Lao PDR = Lao People’s Democratic Republic.Note: Percentile rank 0–100, with a higher score indicating less corruption. For example, Cambodia’s percentile rank in 2012 was 14, indicating that it ranks higher than only 14% of the 215 countries involved in the Worldwide Governance Indicators survey. This captures perceptions of the extent to which public power is exercised for private gain, including both petty and grand forms of corruption, as well as “capture” of the state by elites and private interests. Source: World Bank, WDI database, accessed July 2014.
BruneiDarussalam
Cambodia Indonesia Lao PDR Malaysia Myanmar Philippines Singapore Thailand Viet Nam RegionalAverage
0
2010
4030
6050
708090
100
1996 20082003 2012
Table 2.24. Paying Bribes in the Business Community, 2007 and 2012 (% of firms)
Sources: IFC and World Bank, Enterprise Survey (Cambodia), accessed May 2013; World Bank and ADB (2012).
Reported Expectation 2007 2012Give Gifts to Public Officials
“To Get Things Done” 61 48
Give Gifts to Get a Construction Permit 92 65
Give Gifts to Get an Electrical Connection
58 51
Give Gifts to Get a Water Connection 33 50

64
Cambodia: Diversifying Beyond Garments and Tourism Country Diagnostic Study
measures, the law requires civil servants to declare their financial assets every 2 years. The Anti-Corruption Unit was established in 2010 to enforce the new law.
2.4.3. Rule of Law and Property Rights
The legal environment and judicial institutions for enforcing contracts and guaranteeing property rights are weak. During the Khmer Rouge period in the late 1970s, the legal system was effectively abolished and much of the legal profession eliminated. Rehabilitating the system continues to this day. The government undertook a major review of the law in the late 1990s and early 2000s, which led to the enactment of a new Civil Procedure Code (2006), Code of Criminal Procedure (2007), and Penal Code (2009). Efforts to strengthen the legal profession have also continued, although many judges and others in the legal profession remain without formal legal training.
Cambodia ranks second weakest in the rule of law among the 10 ASEAN countries, just above Myanmar, according to the Worldwide Governance Indicators
(Figure 2.27). There has been modest improvement in the rule of law since the reform process started in the early 2000s. Even so, it takes 483 days to resolve disputes through the formal court system, involves 44 procedures, and requires a cost equal to 103% of the claim (World Bank and IFC 2013a). Courts have little power to act independently of the executive branch of government, and there are few checks and balances on the judicial system. Moreover, the court system lacks resources, capacity, and an adequate institutional framework. Court officials are badly underpaid. The lack of transparency within legal processes casts doubt on the independence of the judiciary system. As a result, citizens tend to rely on less transparent patronage systems and on recourse to the intervention of senior officials to settle disputes (Chene 2009).
The government has general respect for the property rights of the business community and no businesses have been nationalized or appropriated, allowing foreign investors to feel relatively safe in their investments. However, its widespread granting of economic land concessions to big businesses, including foreign firms, is a serious problem and poses a threat to human rights by potentially violating the human rights of people living on these lands.
Figure 2.27. Rule of Law in ASEAN Countries, 1996–2012 (percentile ranking)
ASEAN = Association of Southeast Asian Nations, Lao PDR = Lao People’s Democratic Republic.Note: Regional average data excludes Cambodia.Source: World Bank, Worldwide Governance Indicators, accessed July 2014.
Singapore ThailandMyanmarCambodia Indonesia
Viet NamLao PDR
PhilippinesBrunei Darussalam
0
20
40
60
80
100
120
1996 1998 2000 2002 2003 2004 2005 2006 2007 2008 2009 2010 2011 2012
Malaysia

65
2. Critical Constraints to Growth
2.4.4. Business RegulationThe overall business environment has improved. In the World Bank and IFC’s Doing Business report for 2014, Cambodia ranks 137th globally in the overall ease of doing business, an improvement of eight places since the 2008 report (Table 2.25). In the 2014 report, Cambodia remains ahead of the Lao PDR and has reduced the gap with Indonesia. But it continues to lag behind more advanced ASEAN countries, and its increased overall ranking in recent years is mostly attributable to improvements in just one measure—getting credit (Table 2.26). Cambodia’s scores on a range of other indicators have fallen relative to 2008.
In 2008, Cambodia’s credit information and regulations were among the worst in the world. Since then, the country has made improvements, notably the new Law on Secured Transactions that legalized the use of movable property as collateral and created an online unified registry. In more recent years, regulations for sharing credit information have been put in place, and a private credit bureau began operations and now covers 12% of the adult population. These changes allowed Cambodia to climb to 42nd place globally in the 2014 Doing Business report.
Other aspects of the regulatory environment are ranked much lower and in some cases have deteriorated in recent years, including the legal enforcement of contracts, which is critical for effective credit transactions. Regulations for starting a business are particularly cumbersome (Cambodia ranked 184th), requiring 11 procedures and an average of 104 days. Resolving insolvency is also a concern (ranked 163rd), taking an average of
Table 2.25. Overall Ease of Doing Business in ASEAN Countries, 2008 and 2014
Lao PDR = Lao People’s Democratic Republic.Note: A lower rank indicates an easier environment for doing business. Ranking is out of 189 economies in the 2014 report and 178 economies in the 2008 report.Source: World Bank and IFC (2007, 2013a).
Country Rank in 2008 Rank in 2014Singapore 1 1
Malaysia 24 6
Thailand 15 18
Brunei Darussalam 78 59
Viet Nam 91 99
Indonesia 123 120
Philippines 133 108
Cambodia 145 137
Lao PDR 164 159
Table 2.26. Ease of Doing Business, Specific Measures, 2008 and 2014
… = data not available.Note: A lower rank indicates an easier environment for doing business. Ranking is out of 189 economies in the 2014 report and 178 economies in the 2008 report.Source: World Bank and IFC (2007, 2013a).
Topic 2008 Report 2014 Report Change in RankStarting a Business 162 184 –22Dealing with Construction Permits 144 161 –17Getting Electricity .‥ 134Registering Property 98 118 –20Getting Credit 177 42 135Protecting Investors 64 80 –16Paying Taxes 21 65 –44Trading across Borders 139 114 25Enforcing Contracts 134 162 –28Resolving Insolvency .‥ 163Employing Workers 133 .‥Closing a Business 178 .‥

66
Cambodia: Diversifying Beyond Garments and Tourism Country Diagnostic Study
6 years to wind up a failed business and getting only 8.2 cents on the dollar for creditors. Dealing with construction permits requires 21 procedures and a wait of more than 1.5 years. Another indicator that scores poorly is getting access to electricity.
Firms do not rate paying taxes as a major constraint, but it continues to be a cumbersome process. The 2014 Doing Business report shows that a business makes an average of 40 tax payments a year, requiring 173 hours of work (World Bank and IFC 2013a; World Bank 2014). The effect of this arduous procedure as a deterrent to doing business may be somewhat offset by Cambodia’s low tax rates for personal and corporate income compared with other ASEAN countries. Income tax rates range from 5% to 20% depending on income bracket; the corporate tax rate is 20%. So-called Qualified Investment Projects are given tax holidays for 3–6 years.
Although the overall business environment has improved, it stands at only the midpoint in the distance to the “frontier”, which is the best performance, per indicator, by economy in the
Doing Business survey (Figure 2.28). Cambodia still has a long way to go in enforcing contracts, trading across borders, dealing with construction permits, and starting a business.
2.5. Market Failures
2.5.1. Coordination Externalities The need to address coordination failures is best seen in the rice policy (RGC n.d.a).19 This recognizes that policy coordination is essential to meet high production and export targets, and that public support is needed for the rice industry. The main areas calling for government coordination are infrastructure (roads, electricity, irrigation, ICT); extension services and inputs; land management reform; finance; marketing; farmer organization; and institution building.
19 Royal Government of Cambodia (2010), Policy Document on the Promotion of Paddy Production and Rice Exports.
Figure 2.28. Distance to Frontier, Doing Business 2008 and 2014 Reports
Note: “Distance to frontier” shows the distance of each economy from the frontier, which represents the highest performance observed on each of the indicators across all economies included in Doing Business since each indicator was included in the surveys. An economy’s distance to the frontier is indicated on a scale of 0 to 100, where 0 represents the lowest performance and 100 the highest (the frontier). For example, a score of 75 in the 2012 Doing Business report means an economy was 25 percentage points away from the frontier constructed from the best performances across all economies and across time. A score of 80 in the 2013 report would indicate the economy is improving. In this way the distance to frontier measure complements the yearly ease of doing business ranking, which compares economies with one another at one point in time.Sources: World Bank and IFC (2007, 2013a).
200 6040 80 100
Starting a businessDealing with construction
Overall
Registering propertyGetting electricity
Pecentage points away from the frontier
Getting creditProtecting investors
Paying taxesTrading across borders
Enforcing contractsResolving insolvency
2014 2008

67
2. Critical Constraints to Growth
Finance is a major bottleneck for the rice industry, with millers lacking working capital to purchase paddy from farmers; instead, farmers sell their paddy, which is low value, in domestic or export markets. The rice policy recommends establishing an export–import bank and an agricultural development bank. The broader idea is to develop subsector coordination policies for other commodities, including rubber, cashew, soybean, and aquaculture.
In nonfarm sectors, coordination is often done through industry associations. A notable example is the Cambodia Garment Manufacturers Association, which promotes the industry and liaises directly with the government on regulatory issues. The Cambodia Tourism Association plays a similar role. At a thematic level, the Cambodian Federation of Employers and Business Associations focuses on industrial relations, human resources issues, and business environment issues.
Industry and business associations work through the Government–Private Sector Forum, established by the Prime Minister in 1999.20 The forum aims to improve the business environment, build trust, and come up with solutions to problems raised by the private sector. Semiannual plenary sessions are supported by frequent meetings of working groups covering agriculture, tourism, manufacturing and small and medium-sized enterprises, tax and governance, banking, trade facilitation, infrastructure, and industrial relations. The private-sector-only working groups meet monthly to identify issues and develop suggestions related to legal and policy concerns (laws, subdecrees, prakas21), and to direct operational matters such as road conditions, unofficial fees, and damaged infrastructure. Government–private sector working groups, co-chaired by the relevant government minister, are then held to present and seek solutions to problems. Unresolved issues are brought to the attention of the Prime Minister and addressed at plenary sessions.22
20 The Council for Development of Cambodia acts as the forum’s secretariat.
21 A prakas is a proclamation of a ministerial or an interministerial decision signed by the relevant minister.
22 CAMFEBA Government–Private Sector Forum website, accessed January 2014.
Changes brought about through public–private consultation include extending a tax holiday for the garment sector, reducing the share of containers scanned at Sihanoukville port to reduce cost and time delays, granting a refund on value-added tax for goods destined for export, postponing a tax on accommodation, and reducing the solvency ratio for commercial and specialized banks from 20% to 15%. A review of the public–private dialogue estimated the savings to the private sector from these changes at $69 million during a 5-year period (IFC n.d.).
The government has been discussing an industrial policy, although it is not clear that such a broad approach would be able to tackle the specific coordination failures faced by specific subsectors. The government has several programs to promote investment in industry, but a recent assessment found that the programs were not particularly effective (Smiddy 2012).
2.5.2. Information Externalities: Cost DiscoveryThe limited diversification of the economy suggests that information externalities are a barrier to investment. The problem of “cost discovery”—the effort and risk involved in determining whether a new product can be produced at low cost—was overcome for garments manufacturers in the 1990s. Foreign investors found that garments could be produced competitively despite poor infrastructure, high energy costs, weaknesses in governance, and lack of a well-educated workforce, with quota- and tariff-free access to other markets making this possible. Cost competitiveness was less evident in other sectors, although nongarment firms are increasingly investing and taking advantage of many of the same benefits that the garments sector enjoyed. This process may accelerate as the initial nontraditional firms provide an example for other firms to enter nongarment subsectors. Bicycle manufacturers are a case in point, and Cambodia is also attracting firms in electrical and electronics assembly.
The government is trying to assure potential investors that Cambodia is cost competitive by

68
Cambodia: Diversifying Beyond Garments and Tourism Country Diagnostic Study
providing incentives to reduce costs. These include the Export Market Access Fund, which provides an export subsidy; exemptions from value-added tax on construction and production materials and equipment; and the Qualified Investment Projects scheme. The scheme offers an exemption from profit tax typically for 6 years plus a “priority period” or a special depreciation allowance of 40% in the first year for capital-intensive projects. The scheme also provides guarantees of equal treatment regardless of nationality, a guarantee against nationalization, exemptions from price controls on the investor’s products, and for no restrictions on remitting foreign earnings abroad.
Investors can also reduce cost by setting up in special economic zones (SEZs). In Cambodia, these are privately run but regulated by the government under legislation passed in 2005 that created the Cambodian Special Economic Zone Board. Cambodia’s approach to the SEZs was modeled on the successful experience of the People’s Republic of China. Each SEZ is a one-stop shop for regulatory and administrative issues in which the SEZ management can obtain clearances and licenses for a set fee. The other cost (and coordination) benefits the SEZs offer are infrastructure, with the secured provision of lighting, water purification, electricity, sewerage treatment, dry ports, and telecommunications. Cambodia has 11 SEZs operating, hosting 92 companies.
2.6. FinanceThe level of domestic savings is low and interest rate spreads are high. This combination—a prominent feature of Cambodia’s current financial landscape—limits access to finance for the business sector and government, which have responded by drawing on foreign sources of finance. There are grounds for optimism that the situation will improve as the financial sector has developed considerably in recent years, offering more opportunities for saving, supplying more credit, and generating confidence in the banking system.
Domestic savings were extremely low during the 1990s, never exceeding 4% of GDP and often plunging into negative figures (Figure 2.29). With stronger economic growth, higher incomes, and efforts to develop a secure financial system, the savings rate has climbed, peaking at 16% in 2008, and averaging 11% in the decade to 2011. Despite the progress, the savings rate is still low by any standards and considerably below that of other ASEAN countries, several of which have achieved rates above 30% in recent years. The Lao PDR had one of the lowest savings rates in the region, which has also sharply increased, to 20% since 2006.
Low savings may be attributed to Cambodians’ continued reluctance to save in their own currency, a throwback from the civil conflict of the
Figure 2.29. Gross Domestic Savings in Selected ASEAN Countries, 1995–2012 (% of GDP)
ASEAN = Association of Southeast Asian Nations, GDP = gross domestic product, Lao PDR = Lao People’s Democratic Republic.Source: World Bank, WDI database, accessed July 2014.
Cambodia Indonesia Viet Nam
1995 1996 1997 1998 20001999 2001 2002 2003 2004 2005 2006 2007 2008 2009 2010 20122011–10
–5
201510
50
25303540
Lao PDR Thailand

69
2. Critical Constraints to Growth
1970s, when the riel was abolished (see Box 1.1 in Chapter 1). Most Cambodians still prefer to keep savings in dollars, even though interest rates for riel deposits are generally double or triple the rates offered on dollar accounts. Converting riels to gold, jewelry, or dollars is still considered a safe way of maintaining value. Low nominal interest rates during the last decade and a lack of diverse savings products have also kept the level of domestic savings low.
The low level of domestic savings hampers investment, which has not managed to rise much above 20% in the last decade (Figure 2.30). The shortfall between domestic savings and investment is made up by foreign finance in the form of debt, foreign direct investment, and official development assistance.
Financial intermediation is inefficient. The number of bank branches doubled from 243 in 2006 to 497 in 2013 (National Bank of Cambodia various issues). During the same period, total bank deposits grew more than fivefold, from 5.7 trillion riels (KR) to KR30.2 trillion. To make banking more accessible, modern services such as ATMs, debit cards, and credit cards also expanded rapidly. For example, the number of ATMs multiplied—from one unit in 2005 to 766 by 2013. At least one million debit cards had been issued by the end of 2013. Such developments allowed the number of deposit accounts in
commercial banks to increase by 153% to 1,765,000 in 2013 from 699,000 in 2008; loan accounts grew by 68% to 385,000 from 229,000 during the same period.23
Increased bank deposits and banks’ higher capital bases have enhanced the level of private sector intermediation, which increased from 6% in 2009 to 34% in 2012 (CEIC, Global Database).24 Nevertheless, financial intermediation in Cambodia is still limited, as reflected in the low domestic credit-to-GDP ratio compared with Thailand and Viet Nam (Figure 2.31). Moreover, the efficiency of banking intermediation, measured by the spread between lending and deposit rates, remains low (though the spread was high, at about 14 percentage points for 2006–2011). Although it has fallen steadily since then, it remains significantly above spreads in Indonesia, Thailand, and Viet Nam (Figure 2.32) due to very low deposit rates and higher lending rates than in several other ASEAN countries (Figures 2.33 and 2.34).
Access to finance has improved, but is still limited. Finance is a particular constraint for investors in completely new areas of activity, SMEs,
23 The number of deposit and loan accounts cited refers to the total number of deposit and loan accounts in commercial banks, using data from the IMF Financial Access Survey, accessed July 2014.
24 Intermediation is measured using the growth of the financial sector’s claims on the private sector.
Figure 2.30. Savings and Investment, 1995–2012 (% of GDP)
GDP = gross domestic product.Source: ADB, SDBS, accessed October 2014.
1995 1996 1997 1998 20001999 2001 2002 2003 2004 2005 2006 2007 2008 2009 2010 20122011
Investment Savings
–5
10
5
0
15
20
25

70
Cambodia: Diversifying Beyond Garments and Tourism Country Diagnostic Study
and the informal sector. Smaller enterprises tend not to apply for formal credit because of collateral requirements, complex procedures, and high interest rates, preferring to access credit through informal sources.
Rapid financial sector development seems to have improved the supply of finance in recent years. The microfinance sector has expanded rapidly, especially in poor rural areas. Since 2005, microfinance institutions have nearly quadrupled their reach, serving 1.3 million clients in 2012 from
just 350,000 (Cambodia Microfinance Association 2012). Loans provided by microfinance institutions totaled KR5.3 trillion, or approximately $1.3 billion, at the end of 2013 (National Bank of Cambodia 2014). Profitability has been increasing, with net profit at about KR213.6 billion (or about $53.4 million) in 2013, a 216% increase from 2010.
Nevertheless, limited access to finance and financial services continues to be a problem for most private firms in Cambodia, and particularly constrains the business development of SMEs in
Figure 2.31. Domestic Credit in Selected ASEAN Countries, 2000–2013 (% of GDP)
ASEAN = Association of Southeast Asian Countries, GDP = gross domestic product.Source: World Bank, WDI, accessed October 2014.
Figure 2.32. Interest Rate Spread in Selected ASEAN Countries, 2000–2012 (percentage points)
ASEAN = Association of Southeast Asian Nations, Lao PDR = Lao People’s Democratic Republic.Sources: Data for Indonesia, Lao PDR, Thailand and Viet Nam are from World Bank, WDI database, accessed July 2014; Cambodia data from CEIC, Global Database, accessed June 2014.
Cambodia Indonesia Viet Nam
2000 2001 2002 2003 2004 2005 2006 2007 2008 2009 2010 2011 2012 20130
4020
140120100
8060
160180
Lao PDR Thailand
Cambodia Indonesia Viet Nam
0
20
15
10
5
25
30
Lao PDR Thailand
2000 2001 2002 2003 2004 2005 2006 2007 2008 2009 2010 2011 2012

71
2. Critical Constraints to Growth
rural areas and in the agriculture sector. In a survey of private firms (comprising 85% SMEs and 15% large firms), 71% of them cited lack of capital and financing for investment as a growth constraint (IFC and European Union 2010). These firms were especially concerned with high loan rates, stringent collateral requirements, and insufficient linkages with appropriate financial institutions, which make external financing challenging and force them to resort to their own savings to fund business growth needs (IFC and European Union 2010). Although large and some medium-sized firms may not be
as financially constrained as smaller private firms, it is because most of them are foreign-owned and may access funds through their parent companies. A majority of enterprises in Cambodia are SMEs and informal, with internal savings and informal finance as the only recourse for financing, thereby limiting their growth prospects. New entrants and innovators in sectors other than garments or tourism could face even more difficulties in accessing finance as upgrading is time- and capital-intensive; this also partly explains the country’s lack of diversification.
Figure 2.33. Deposit Rates in Selected ASEAN Countries, 2000–2012 (%)
ASEAN = Association of Southeast Asian Nations, Lao PDR = Lao People’s Democratic Republic. Source: World Bank, WDI database, accessed July 2014.
0
42
141210
86
1618
Cambodia Indonesia Viet NamLao PDR Thailand
2000 2001 2002 2003 2004 2005 2006 2007 2008 2009 2010 2011 2012
Figure 2.34. Lending Rates in Selected ASEAN Countries, 2000–2013 (%)
ASEAN = Association of Southeast Asian Nations, Lao PDR = Lao People’s Democratic Republic.Sources: Data for Indonesia, Lao PDR, Thailand, and Viet Nam from World Bank, WDI database, accessed July 2014; Cambodia data from CEIC, Global Database, accessed June 2014.
0
10
5
15
20
25
30
35
2000 2001 2002 2003 2004 2005 2006 2007 2008 2009 2010 2011 2012 2013
Cambodia Indonesia Viet NamLao PDR Thailand

72
Cambodia: Diversifying Beyond Garments and Tourism Country Diagnostic Study
2.7. ConclusionThe economy is expected to continue its high growth path but needs to diversify through sustained private investments. Diagnosis of key aspects of the economy has identified four critical constraints that could derail this growth: weak human capital (limited skills of the workforce), inadequate logistics
infrastructure (poor quality of secondary and rural roads), high electricity costs and inadequate supply, and widespread corruption (Table 2.27). In addition, although fiscal conditions in general are not an immediate concern to macroeconomic stability and growth prospects, low revenue generation limits the scope for public investment, thus potentially constraining growth.
Table 2.27. Critical Constraints of Cambodia’s Economy
Broad Determinants of Growth
Factors Affecting Determinants of Growth
How the Factor Influences Growth
Is it a Critical Constraint?
Social Return on Investment Human capital �� Low educational attainment levels and low quality of schooling
�� Labor force lacks necessary skills
�
�
Transport network �� Poor quality of the secondary and rural roads
�� Railway under rehabilitation
�
Electricity �� Limited access to electricity�� Tariffs among highest in
Asia�� Dependent on high cost,
imported supply
�
�
Appropriability of Returns Macroeconomic risks �� Weak revenue generation, restricting funds for public investments
�� Low to moderate inflation�� Stable external position
despite widening current account deficit
�� Public debt at manageable level
�
Microeconomic risks �� Corruption and weak rule of law
�� Moderate tax rates
�
Market failures �� Low value added in production
�� Low level of diversification �� Coordination failures
managed through public–private consultation
Cost of Finance Access to finance �� Financial intermediation improving
�� Rising level of domestic credit
�� Access by new, small firms is constrained
�� Low savings rate
Source: ADB.

73
3. Critical Constraints to Inclusiveness
3. CRITICAL CONSTRAINTS TO INCLUSIVENESS
3.1. Availability of Productive Employment OpportunitiesGenerating decent employment is the most critical element of inclusive growth. Cambodia’s labor force is still expanding and its labor force participation rate, at 84% of the working-age population, is high (Figure 3.2). Less than 0.5% of the labor force is unemployed according to the National Institute of Statistics’ Cambodia Socio-Economic Survey 2013, but nearly 60% of the employed work in the informal sector, mostly as own-account or unpaid family workers (Figure 3.3). Such employment is precarious and vulnerable given its informal arrangements, lack of decent working conditions and social security, inadequate earnings, and low productivity.
On the positive side, 41% of workers in 2013 had paid employment, up significantly from 26% in 2007. Much of this shift can be attributed to an increase in the share of such jobs in Phnom Penh, from 50% in 2007 to 64% in 2013. The number of own-account workers has increased in rural and urban areas, the result of a large decline in the share of unpaid family workers. Not surprisingly, informal employment is higher in rural than in urban areas, and tends to be higher among people with no or little schooling and among female and older workers (Figure 3.4). The share of underemployed workers is low in rural and urban areas.
Strong growth since the 1990s has lifted living standards and improved social conditions throughout Cambodia, but many challenges remain. Although poverty declined substantially in the 2000s, it is still high by regional standards.25 The majority of jobs continue to be in the informal economy; social service coverage, although expanding, remains lower than the regional average; and inequality is also high, with a Gini coefficient of 0.44.
This chapter assesses the inclusiveness of economic growth using a diagnostic approach (Figure 3.1). Growth is inclusive when all segments of society can participate in and benefit from the opportunities it creates, and all citizens receive adequate protection from economic shocks and transitions (Ali and Son 2007, Zhuang 2010). Further reforms for greater inclusion require firm government commitments and well-designed interventions to increase opportunities for productive and decent employment, improve the quality of education and health services, level the playing field, and broaden social protection.
25 The share of Cambodia’s population living below the new national poverty line decreased from 50% to 20% during 2004–2011. The new national poverty line is based on the Cambodia Socio-Economic Survey of 2009, which updated the earlier poverty line set in 1997 and based on data from the 1993/1994 survey. The new poverty lines are 6,327 riels (KR) in Phnom Penh, KR4,352 in other urban areas, KR3,503 in rural areas, and a weighted average of KR3,871 nationwide (Ministry of Planning 2013). Using the $1.25-a-day poverty line, the poverty headcount ratio declined by more than half, from 44.5% in 1994 to 18.6% in 2009 (World Bank, WDI database, accessed June 2013).

74
Cambodia: Diversifying Beyond Garments and Tourism Country Diagnostic Study
Labor productivity growth—growth of gross domestic product (GDP) per employed worker—has accelerated, rising from 2.4% annually in the 1990s to 3.4% in 2000–2005 and then almost doubling
to 7.2% in 2006–2012 (Figure 3.5). However, labor productivity remains low relative to other countries in the region.
Figure 3.1. Diagnostics Framework for Constraints to Reducing Poverty and Inequality
Source: ADB (2007).
Figure 3.2. Labor Force Participation Rates, by Location and Sex, 2007–2013 (%)
Note: The working-age population is defined as people aged 15–64, of which the labor force comprises all employed or unemployed for the 7 days prior to the survey. Employed persons are those who worked at least 1 hour during the 7 days, or had a job/economic activity from which they were temporarily absent. Unemployed comprises all people who were, during the 7 days prior to the survey without work, available for work, and actively seeking work. Urban and rural exclude Phnom Penh.Source: NIS, CSES Tables, accessed July 2014.
Slow rate of poverty reduction and high inequality
Unequal access to opportunities
Lack of productive and decent employment opportunities
Inadequate social safety nets
Low economic growth due to low levels of private investment
and entrepreneurship (follow the Growth
Diagnostic Framework in Chapter 2)
Unequal access to employment
opportunities (follow the unequal access to
opportunities branch)
Weak human capabilities��Unequal access to
education��Unequal access to
health��Unequal access to other social services
Exclusion��Geographical exclusion��Economic exclusion��Social exclusion
Inadequate public service delivery
��Limited resources��Poor targeting��Poor governance
Market failures
Uneven playing field��Unequal access to
infrastructure��Unequal access to
productive assets (credit, land)
2007 2010 2013
Cam
bodi
a
Phno
m P
enh
Urb
an
Rura
l
Cam
bodi
a
Phno
m P
enh
Urb
an
Rura
l
Cam
bodi
a
Phno
m P
enh
Urb
an
Rura
l0
40
6050
2030
708090
10
100
Total Female Male

75
3. Critical Constraints to Inclusiveness
Employment remains concentrated in agriculture, but the share of agricultural jobs has declined, from 58% in 2007 to 49% in 2013, amid rapid expansion of jobs in industry and services (Figure 3.6).
Industry and services jobs are mostly in urban areas, principally in Phnom Penh, where 73% of the labor force was engaged in services and 25% in industry in 2013 (Figure 3.7).
In 2013, women accounted for 48.9% of the labor force and 41.4% of skilled agricultural, forestry, and fishery workers (NIS, CSES Tables 2013). Twice as many women as men are employed in service shops and retail sales. Men outnumber women in professional occupations such as technicians, plant and machine operators, and assemblers.
Figure 3.3. Employment Status, by Location, 2007–2013 (%)
Note: Urban and rural exclude Phnom Penh.Source: NIS, CSES Tables, accessed July 2014.
Figure 3.4. Informal Employment and Underemployment, by Area, Sex, Age Group, and Education Level, 2013 (%)
Note: People employed in the informal sector were own-account workers, self-employed, or unpaid family workers during the 7 days prior to the survey. Underemployed were those who worked for less than 40 hours during the 7 days prior to the survey and wanted additional work.Source: Calculations based on 2013 data from NIS, CSES Tables.
2007 2010 2013
Cam
bodi
a
Phno
m P
enh
Urb
an
Rura
l
Cam
bodi
a
Phno
m P
enh
Urb
an
Rura
l
Cam
bodi
a
Phno
m P
enh
Urb
an
Rura
l0
40
6050
2030
708090
10
100
Paid employee Employer Own account worker/self-employed Unpaid family worker
Area Sex Age group Education level
Cam
bodi
a
Urb
an
Rura
l
Mal
e
Fem
ale
15–2
4
25–3
4
35–4
4
45–5
4
55–6
4
No
educ
atio
n
Belo
w p
rimar
y
Prim
ary e
duca
tion
Low
er se
cond
ary
Hig
her s
econ
dary
Voca
tiona
l tra
inin
g and
prof
essio
nal c
ertifi
cate
Uni
vers
ity a
nd a
bove
0
40
6050
2030
7080
10
90
Informal Underemployed

76
Cambodia: Diversifying Beyond Garments and Tourism Country Diagnostic Study
Figure 3.5. Growth in GDP per Person Employed, 1990–2012 (constant 1990 PPP $ ’000)
GDP = gross domestic product, PPP = purchasing power parity.Source: World Bank, WDI database, accessed July 2014.
Figure 3.6. Share of Employment by Sector, 2007–2013 (%)
Note: The agriculture sector includes agriculture, forestry, and fishing; industry includes mining and quarrying, manufacturing, electricity, gas, steam, air conditioning supply, water supply, sewerage, waste management and remediation activities, and construction; services comprises all other subsectors.Source: NIS, CSES Tables, accessed July 2014.
1990 19951994199319921991 1996 1997 1998 20001999 2001 2002 2003 2004 2005 2006 2007 2008 2009 2010 201220110
42
86
1012141618
Cambodia Indonesia Myanmar Philippines Thailand Viet Nam
Figure 3.7. Employment by Sector and Province, 2013 (%)
Source: Calculations based on data from NIS, CSES Tables 2013.
Area Sex Province
Cam
bodi
aO
ther
urb
an
Oth
er ru
ral
Male
Fem
ale
Bant
eay M
eanc
hey
Batta
mba
ng
Kam
pong
Chh
nang
Kam
pong
Cha
m
Kam
pong
Spe
u
Kam
pong
Tho
m
Kam
pot
Kand
al
Kep
Koh
Kong
Krat
ie
Mon
dulki
ri
Odd
ar M
eanc
hey
Phno
m P
enh
Prea
h Vi
hear
Prey
Ven
g
Purs
at
Ratta
nakir
i
Siem
reap
Siha
nouk
ville
Stun
g Tre
ng
Svay
Rie
ng
Take
o
0
40
6050
2030
70
9080
10
100Agriculture Industry Services
0 10 20 30 605040 70 80 90 100
2007
2010
2013
Agriculture Industry Services

77
3. Critical Constraints to Inclusiveness
(3) increasing the quality and efficiency of education, (4) linking education and training to labor market needs, and (5) building capacity for decentralizing education planning and management.
Both the supply of and access to education have improved, but the quality of education, the level of qualifications and skills, and the employability of graduates need to be enhanced. Technical and vocational education and training is also still in its infancy.
Generally Low Educational Attainment. Insufficient education restricts access for Cambodians to formal sector jobs. In 2013, 73% of the working-age population had no or only primary schooling: 13% had never attended school, 33% had some primary education, and 27% had finished primary education (Figure 3.8). Women are particularly disadvantaged, with 79% having only a primary school education. Only 3% of the total workforce holds a university degree. Cambodia has one of the lowest literacy rates in the Association of Southeast Asian Nations (ASEAN), at 86% for women and 88% for men (Figure 3.9). Workers with little or no education tend to end up working in the informal sector, whereas workers with vocational training or a professional certificate (who comprise less than 1% of the working population) are gainfully employed.
Limited and Unequal Access to Secondary and Higher Education. Access to education improved from 2006 to 2013, with net enrollment in the primary level increasing from 91% to 96% (Figure 3.10). Some geographic disparity in access to primary education persists, but 13 of 24 provinces recorded a primary enrollment rate above 95% (Figure 3.11).
About 12% of children aged 6–11 have never attended primary school (Table 3.1), with nonattendance and high drop-out rates linked to parents’ attitudes and household poverty (Figure 3.12). Many parents consider their primary-school-aged children too young to attend school. Many also expect their children to contribute to household incomes and chores or consider themselves too poor to send their children to school. The lack of schools, teachers, and
3.2. Human CapabilitiesTo secure decent employment opportunities, people need skills, knowledge, and other capabilities. Some segments of the population may have weaker capabilities than others owing to limited access to education, health care, and social services such as clean water and sanitation. Growth is inclusive when broad and equal access to such services is ensured.
Human capital development has been at the core of Cambodia’s development strategy since reconstruction began in the early 1990s (RGC 2009), specifically through efforts to enhance the quality of education and health services, expand social security, and encourage gender equality.
3.2.1. EducationEducation has been a key government focus since the National Programme to Rehabilitate and Develop Cambodia, the country's first national development program, announced in 1994.26 The program introduced major education reforms, including commitments under the 2007 Education Law to provide free basic education.27
The government’s long-term goal is to assure equitable access to 9 years of high-quality basic education by 2015 (MOEYS 2003), alongside promoting well-regulated public–private partner-ships in upper secondary education, technical and vocational education and training, and higher education. The highest priority is to implement the National Education for All Plan and associated teacher development programs (MOEYS n.d.). The current Education Strategic Plan’s five objectives are (1) ensuring equitable access to education, (2) making 9 years of basic education universal,
26 The National Programme to Rehabilitate and Develop Cambodia is considered the first national development plan following the general election and promulgation of a new constitution, and Prince Norodom Sihanouk’s accession to the throne all in 1993.
27 During 1991–2006, successful government reforms were implemented, such as the construction of new schools, provision of scholarships, abolition of school fees, and expansion of community-based early learning opportunities, resulting in significant gains in access to primary and lower secondary schools (ADB 2011d).

78
Cambodia: Diversifying Beyond Garments and Tourism Country Diagnostic Study
Figure 3.8. Educational Attainment of People Aged 15 and Over, Employed and Unemployed, 2013 (%)
Source: Calculations based on data from NIS, CSES Tables 2013.
Figure 3.9. Adult Literacy Rates in Selected ASEAN Countries, Latest Year Available (%)
ASEAN = Association of Southeast Asian Nations.Note: The data are 2009 for Cambodia; 2010 for Malaysia; 2011 for Indonesia; and 2012 for Brunei Darussalam, Myanmar, and Singapore.Source: ADB, SDBS, accessed October 2014.
Figure 3.10. Net Enrollment Rates, 2006–2013 (%)
Source: MOEYS, Education Statistics and Indicators, various years, accessed July 2014.
Unemployed Employed Working-age population
Total Male Female Total Male Female Total Male Female0
20
3025
1015
354045
5
50
Higher secondary Vocational training and professional certificate University and higher
No education Below primary Primary education Lower secondary
BruneiDarussalam Cambodia Indonesia Malaysia Myanmar Singapore
Tota
l
Mal
e
Fem
ale
Tota
l
Mal
e
Fem
ale
Tota
l
Mal
e
Fem
ale
Tota
l
Mal
e
Fem
ale
Tota
l
Mal
e
Fem
ale
Tota
l
Mal
e
Fem
ale0
40
6050
2030
70
9080
10
100
2006 2007 2008 2009 2010 2011 2012 20130
20
40
60
80
100
Primary Lower secondary Upper secondary

79
3. Critical Constraints to Inclusiveness
school supplies, especially in rural areas, are often cited as contributing factors to high nonattendance.
Net enrollment at the secondary level remains low—about 38% for lower secondary and 17% for the upper secondary levels. Access to secondary education is also much less equitably distributed, with lower secondary net enrollment rates ranging from 16% (Rattanakiri province) to 53% (Takeo), and upper secondary rates ranging from only 8% (Oddar Meanchey) to 30% (Phnom Penh). At both levels, enrollment is higher in urban than in rural areas. Across the country, girls have slightly higher enrollment rates than boys in both lower and upper secondary school. In Phnom Penh, however, upper secondary enrollment of boys, at 31%, is higher than girls, at 29% (MOEYS 2014).
There is a large drop in enrollment rates between the primary and lower secondary levels, averaging 59 percentage points across provinces. The greatest drops are in Rattanakiri and Mondulkiri, at 83 and 79 percentage points, respectively, while seven other provinces show a drop of 65 percentage points. Most children in these nine provinces leave school while in or just after completing primary school, resulting in a very low transition rate to secondary school. Moreover, less than half of students entering secondary school complete their secondary education, mainly for financial reasons. About 51% of children not enrolling in lower-secondary school and two-thirds of those not enrolling in upper-secondary school, report poverty, the need to earn income, and household work as the main reasons (NIS 2009).
Figure 3.11. Net Enrollment Rates, by Province, 2013 (%)
Source: MOEYS (2014), accessed July 2014.
Area Sex Province
Cam
bodi
a
Urb
an
Rura
l
Mal
e
Fem
ale
Bant
eay M
eanc
hey
Batta
mba
ng
Kam
pong
Chh
nang
Kam
pong
Cha
m
Kam
pong
Spe
u
Kam
pong
Tho
m
Kam
pot
Kand
al
Kep
Koh
Kong
Krat
ie
Mon
dulk
iri
Odd
ar M
eanc
hey
Pailin
Phno
m P
enh
Prea
h Vi
hear
Prea
h Si
hano
uk
Prey
Ven
g
Purs
at
Ratta
naki
ri
Siem
reap
Stun
g Tre
ng
Svay
Rie
ng
Take
o
0
40
6050
2030
70
9080
10
100
Primary Lower secondary Upper secondary
Source: Calculations based on data from NIS, CSES Tables 2013.
Table 3.1. People Who Never Attended School, by Age Group, 2013 (%)
Age Group CambodiaPhnom
PenhOther Urban Rural
Primary School Age (6–11) 12.3 5.0 9.5 13.4
Lower Secondary School Age (12–14) 1.5 0 0.3 1.8
Upper Secondary School Age (15–17) 4.3 1.8 0.5 5.1
Higher Education Age (18–24) 4.9 1.7 3.0 5.7

80
Cambodia: Diversifying Beyond Garments and Tourism Country Diagnostic Study
The Ministry of Education, Youth, and Sports has recognized the problem and has started providing subsidies to households to keep children in school. In 2006, the ministry implemented the Scholarship for the Poor Programmes (targeting secondary school students and providing a pilot test for primary school students). The program provided scholarships to 18,684 children of lower-secondary age across all provinces, except Phnom Penh. Eligible children are selected using a poverty assessment mechanism that gathers information on students’ living standards through a survey and calculates a poverty index for each child. Scholarships are awarded to 50% of all students with the highest poverty index score, with the amount varying according to the recipient’s poverty level and school grades. An evaluation of the program showed that it had helped increase enrollment by 30% over 2004 levels (Filmer and Schady 2006), resulting in the program being extended to primary schools.
The Department of General Secondary Education provides scholarships to secondary school students. For grade 7–9 students, scholarships are aimed at expanding educational opportunities for students with high academic achievement and from the poorest and most disadvantaged families. For
students in grades 10–12, scholarships are mainly merit-driven and based on grade 9 exam scores, but also take into account household poverty. The program especially targets girls and ethnic minorities, with girls receiving a minimum of 60% of total upper-secondary scholarships.
These initiatives have generated positive results and are needed to keep students in school, but a limited education budget is constraining them to put in active voice. The recurrent financing required for these programs has increased from 6.92 billion riels (KR) in 2009 to KR11.5 billion in 2013 (Table 3.2). The future of the scholarship programs will depend on availability of resources and priorities in the education sector.
High Opportunity Cost of Education. Although education expenses account for about 3.5% of disposable income in the rural areas, compared with 5.7% in Phnom Penh, alternative income-earning opportunities for rural children (mostly informal jobs in agriculture) raise the opportunity cost of education (NIS, CSES Tables 2013). Girls are expected to contribute to household income and chores more than boys, suggesting that household income is a more significant deterrent to educating females than males (Figure 3.13).
Figure 3.12. Reasons for Not Attending School, 6–17 Years Old, 2009 and 2013 (%)
Source: NIS, CSES Tables for 2009 and 2013, accessed July 2014.
50 1510 20 25 30 35
No suitable school available/school istoo far; and/or no teacher/supplies
High cost of schooling
Due to disability or illness lastingmore than 3 months
Other reasons
Must help with household chores
Did not do well in school
Too poor
Don’t want to
Too young
Must contribute to household income
2013 2009

81
3. Critical Constraints to Inclusiveness
Insufficient Spending on Education. Cambodia lags behind most other Southeast Asian countries in the share of GDP spent on public education (Figure 3.14). The country increased its expenditure on education from 1.7% of GDP in early 2000 to 2.6% in 2010, but this is higher only than Myanmar. Per primary and secondary student, spending is the lowest in Southeast Asia (Figure 3.15). The lack of resources and limited allocation of government funding has led to shortages in teachers (especially with adequate training), teaching materials, and school facilities.
At least 60% of primary schools in Battambang, Koh Kong, Mondulkiri, Pailin, Preah Vihear, Rattanakiri and Stung Treng are without water facilities (Figure 3.16). In all provinces, some primary schools do
not have indoor toilets. This situation is most pronounced in Mondulkiri, Rattanakiri, and Preah Vihear, where 61%, 57%, 41% of primary schools, respectively, do not have indoor toilets. Such conditions threaten students’ health and safety; hurt their academic performance; and discourage school attendance, especially among girls.
The shortage of teachers contributes to high student–teacher ratios, of about 40–50 students in an average primary school class (Figure 3.17). The problem is particularly acute in Kampong Cham, Rattanakiri, and Siem Reap, which have more than 60 primary school students per class on average, severely limiting the time teachers can spend with individual students.
Table 3.2. Financing Plan for Scholarships for Poor and Disadvantaged Students, 2009 and 2013 (KR million)
KR = riel.Source: MOEYS, accessed May 2013.
Activity 2009 2013Scholarships for Lower Secondary Education 6,172 10,197
Scholarships for Upper Secondary Education 0 0
Operation of Local Management Committees 240 500
Monitoring 505 800
Total Resources 6,917 11,497
Figure 3.13. Reasons for Not Attending School, 6–17 Years Old, by Gender, 2013 (%)
Source: NIS, CSES Tables, accessed July 2014.
50 1510 20 25 30 35
No suitable school available/school istoo far; and/or no teacher/supplies
High cost of schooling
Due to disability or illness lastingmore than 3 months
Other reasons
Must help with household chores
Did not do well in school
Too poor
Too young
Don’t want to
Must contribute to household income
Female Male

82
Cambodia: Diversifying Beyond Garments and Tourism Country Diagnostic Study
Although most Cambodian villages have a primary school, many schools do not offer a full curriculum up to the end of grade 6 (Figure 3.18). And not all children living far from schools with upper primary grades can manage the travel involved. In four provinces (Koh Kong, Preah Vihear, Rattanakiri,
Stung Treng), more than 20% of primary schools do not offer the full elementary curriculum. In another four (Banteay Meanchey, Koh Kong, Preah Vihear, Siem Reap), the curriculum of more than 10% of the upper secondary schools does not reach grade 12.
Figure 3.14. Public Expenditure on Education in ASEAN Countries, Early 2000 and Latest Data (% of GDP)
ASEAN = Association of Southeast Asian Nations, GDP = gross domestic product, Lao PDR = Lao People’s Democratic Republic.Note: The “early 2000” data are 2000 for Brunei Darussalam, Cambodia, the Lao PDR, Malaysia, Myanmar, the Philippines, Singapore, and Thailand; 2001 for Indonesia; and 2008 for Viet Nam. The latest figures are 2009 for the Philippines; 2010 for Cambodia, the Lao PDR, and Viet Nam; 2011 for Malaysia and Myanmar; 2012 for Thailand and Indonesia; and 2013 for Brunei Darussalam and Singapore.Source: World Bank, WDI database, accessed July 2014.
Figure 3.15. Expenditure per Primary and Secondary Student in Selected Asian Countries, Early 2000 and Latest Data (% of GDP per capita)
GDP = gross domestic product.Note: For expenditure on primary students, early 2000s figures are 2000 for Cambodia, Malaysia, the Philippines, and Thailand, but 2007 for Indonesia and 2008 for Singapore. The latest figures are 2013 for Indonesia and Singapore, 2012 for Indonesia and Thailand, 2011 for Malaysia, 2010 for Cambodia and Singapore, and 2008 for the Philippines. For expenditure on secondary students, early 2000s figures are 2000 for Malaysia and the Philippines, 2001 for Cambodia and Thailand, 2007 for Indonesia, and 2008 for Singapore. The latest figures are 2012 for Indonesia and Thailand, 2011 for Malaysia, 2010 for Singapore, and 2008 for the Philippines. Cambodia does not have data for the late 2000s, but only for 2001.Source: World Bank, WDI database, accessed July 2014.
10 32 4 5 6 7 8
PhilippinesSingapore
ThailandViet Nam
MyanmarMalaysiaLao PDR
IndonesiaBrunei Darussalam
Cambodia
Latest data Early 2000
Primary Secondary
Cam
bodi
a
Indo
nesia
Mal
aysia
Philip
pine
s
Sing
apor
e
Thai
land
Cam
bodi
a
Indo
nesia
Mal
aysia
Philip
pine
s
Sing
apor
e
Thai
land
0
40
20
30
10
50
Early 2000 Latest data

83
3. Critical Constraints to Inclusiveness
Inadequate education undermines youth employability. Many young people are relegated to jobs in the informal sector, where decent and productive opportunities are rare. A United Nations report noted that 250,000 rural, unskilled young people and 1.5 million children worked in the informal sector (United Nations and Kingdom of Cambodia 2010).
3.2.2. HealthClearly, health is essential to building human capabilities and poor health hurts labor productivity and earning capacity. Health outcomes in Cambodia have been improving in the last 2 decades amid stronger government commitment to the issue
Figure 3.16. Primary Schools without Water and Toilets, 2013 (% of schools)
Source: MOEYS (2014), accessed February 2014.
Figure 3.17. Student–Teacher Ratios, 2013
Source: MOEYS (2014), accessed February 2014.
Area Province
Cam
bodi
a
Urb
an
Rura
l
Bant
eay M
eanc
hey
Batta
mba
ng
Kam
pong
Chh
nang
Kam
pong
Cha
m
Kam
pong
Spe
u
Kam
pong
Tho
m
Kam
pot
Kand
al
Kep
Koh
Kong
Krat
ie
Mon
dulk
iri
Odd
ar M
eanc
hey
Pailin
Phno
m P
enh
Prea
h Vi
hear
Prey
Ven
g
Purs
at
Ratta
naki
ri
Siem
reap
Prea
h Si
hano
uk
Stun
g Tre
ng
Svay
Rie
ng
Take
o
0
20
4030
10
50
807060
90
Without water Without toilet
Area Province
Cam
bodi
a
Urb
an
Rura
l
Bant
eay M
eanc
hey
Batta
mba
ng
Kam
pong
Chh
nang
Kam
pong
Cha
m
Kam
pong
Spe
u
Kam
pong
Tho
m
Kam
pot
Kand
al
Kep
Koh
Kong
Krat
ie
Mon
dulk
iri
Odd
ar M
eanc
hey
Pailin
Phno
m P
enh
Prea
h Vi
hear
Prey
Ven
g
Purs
at
Ratta
naki
ri
Siem
reap
Prea
h Si
hano
uk
Stun
g Tre
ng
Svay
Rie
ng
Take
o
0
20
4030
10
506070
Primary Secondary

84
Cambodia: Diversifying Beyond Garments and Tourism Country Diagnostic Study
(RGC 2009). The Health Strategic Plan 2008–2015, for example, aims to reduce
� newborn, child, and maternal morbidity and mortality through better reproductive health;
� morbidity and mortality from HIV/AIDS, malaria, tuberculosis, and other communicable diseases; and
� the burden of noncommunicable diseases and other health problems.
Life expectancy at birth has increased from 52 to 69 years for men in the last 2 decades and from 57 to 74 years for women. Infant, child, and maternal mortality rates have also decreased significantly since 1990 (Table 3.3).
The progress in public health has already enabled Cambodia to meet national targets under its 2015 Millennium Development Goals, such as reducing infant and under-5 mortality rates to 50 and 65 per 1,000 live births, respectively.28 Scaled-up 28 The Ministry of Planning developed its own set of national
development goals for 2015 by setting medium-term targets that build on medium-term planning exercises in 2002 and 2003 and national indicators. Although they are based on the Millennium Development Goals agreed at the United Nations Millennium Summit in 2000, some modifications have been made to adapt the global goals to the context of Cambodia.
immunization and breastfeeding programs helped on this front. Vaccination of children aged 12 –23 months against diphtheria, whooping cough, and tetanus rose to about 95% in 2012 from 38% in 1990 (World Bank, World Development Indicators [WDI] database). Children are breastfed for an average of 20 months, and 74% of infants under 6 months are exclusively breastfed (NIS, Directorate General for Health [DGH], and ICF Macro 2011). Provision of vitamin A supplements has also expanded, from 79% of children 6–59 months old in 1999 to 98% in 2012.29
Some progress is also evident in the fight against communicable diseases. The prevalence of HIV/AIDS (among the population aged 15–49) declined marginally, to 0.8% in 2011 from 0.9% in 2009 (World Bank WDI database). In 2010, the affliction and death rates from acute respiratory infection, which is the leading cause of morbidity and mortality in the country, were 555 and 8 per 100,000 people, respectively (Figure 3.19). Gastroenteric infections contribute to morbidity, with diarrhea prevalent among children less than 24 months old and affecting about 15% of the total population in 2010. The incidence of tuberculosis decreased to 411 cases per 100,000 people in 2012 from 577 in 2000
29 In 2009, the National Nutrition Program developed the National Vitamin A Policy to ensure uniform provision of vitamin A to children aged 6–59 months. 2012 data is from World Bank, WDI database, accessed August 2014.
Figure 3.18. Schools Not Providing a Full Curriculum, 2013 (%)
Source: MOEYS (2014), accessed February 2014.
Area Province
Cam
bodi
a
Urb
an
Rura
l
Bant
eay M
eanc
hey
Batta
mba
ng
Kam
pong
Chh
nang
Kam
pong
Cha
m
Kam
pong
Spe
u
Kam
pong
Tho
m
Kam
pot
Kand
al
Kep
Koh
Kong
Krat
ie
Mon
dulk
iri
Odd
ar M
eanc
hey
Pailin
Phno
m P
enh
Prea
h Vi
hear
Prey
Ven
g
Purs
at
Ratta
naki
ri
Siem
reap
Prea
h Si
hano
uk
Stun
g Tre
ng
Svay
Rie
ng
Take
o
0
105
15
30
2025
35
4540
50
Primary Lower secondary Upper secondary

85
3. Critical Constraints to Inclusiveness
and the success rate for treating cases was 93% in 2011 (World Bank, WDI database). Yet, Cambodia still had the highest incidence of tuberculosis in the Western Pacific region (World Health Organization [WHO] 2011). The incidence of dengue was also on the rise, peaking in 2012 at 42,362 (from 9,542 in 2008), but declining in 2013 to 16,722.30.
But the prevalence of malnutrition is still high in rural areas. The progress in children’s nutritional status,
30 Dengue incidences for 2008–2012 are from the National Center for Parasitology, Entomology and Malaria Control: Dengue Control Programme. The dengue incidence for 2013 is from WHO (2014).
evident in the early 2000s, has stagnated since the mid-2000s (Figure 3.20). The incidence of stunting among children under 5 years old declined from 49% in 2000 to about 40% in 2008, but increased slightly again to 41% in 2010. The proportion of underweight children and the incidence of wasting have also marginally increased since 2005, following a significant drop between 2000 and 2005. All these factors suggest that chronic malnutrition is prevalent among children.
The prevalence of low birth weight, often taken as an indicator of intergenerational transmission of poor nutrition and health, was 11% in 2010, the same as in 2000. This lack of progress is despite the increased use of prenatal health services, with the proportion of pregnant women receiving prenatal care rising to 89% in 2010 from 69% in 2005 (World Bank, WDI database).
Nutrition is critical to building human capital because it influences a child’s overall health and development. Poor nutrition from conception to the second birthday damages long-term physical and cognitive development, resulting in deficiencies that can never be fully overcome (ADB 2013a). Among impaired persons, 20% had been impaired since birth, underscoring the importance of maternal nutrition and antenatal care. By influencing physiological and mental development, early childhood health shocks can diminish children’s educational and productive potential in later years.
Table 3.3. Health Outcomes in Cambodia, 1990–2012
… = no data available.Note: The 2012 maternal mortality rates refer to 2013 modeled estimates. Source: World Bank, WDI database, accessed July 2014.
YearLife Expectancy at Birth
(years)Infant Mortality
(per 1,000 live births)Child Mortality (per
1,000 live births)
Maternal Mortality
(per 100,000 live births)
Male Female Male Female
1990 52 57 85 124 109 1,200
1995 55 61 88 ‥ ‥ 860
2000 59 65 82 118 103 540
2005 65 70 52 ‥ ‥ 320
2012 69 74 34 44 35 170
Figure 3.19. Leading Causes of Mortality in Cambodia, 2010 (per 100,000 people)
Source: World Health Organization (WHO) (2011).
0 2 4 8 106
Acute respiratory infections
Traffic accidentHigh blood pressure
AIDSTuberculosis
Cardiopath
Meningitis
Dengue
Tetanus
Liver cancer

86
Cambodia: Diversifying Beyond Garments and Tourism Country Diagnostic Study
Table 3.4. Nutritional Status of Children, 2010 (%)
Source: NIS, DGH, and ICF Macro (2011).
Indicator Stunting
(height for age)Underweight
(weight for age)Wasting
(weight for height)Gender Male 41.6 28.0 11.4 Female 38.2 28.6 10.4Location Urban 27.5 18.8 11.6 Rural 42.2 30.0 10.8Mother’s Education No schooling 47.6 34.2 11.3 Primary 40.4 28.7 11.7 Secondary and higher 30.7 20.7 9.7Wealth Quintile Poorest 51.1 35.4 11.9 Second 44.4 32.6 9.6 Third 39.3 27.8 11.5 Fourth 34.2 24.6 11.1 Richest 23.1 15.9 10.1
In general, children in rural areas, are in the poorest quintile group, and have mothers with little or no education, are most likely to be malnourished (Table 3.4). In rural areas in 2010, 42% of children were stunted, compared with 28% in urban areas. Likewise, 30% of children in rural areas were underweight compared with 19% in urban areas. Interestingly, the incidence of acutely malnourished children was slightly higher in urban areas, where
about 12% of children were affected by wasting, compared with about 11% of children in rural areas.
Children from the poorest quintile are impacted by stunting and being underweight more than twice as much as children from the richest quintile. Children of uneducated mothers are also more prone to stunting and being underweight than those whose mothers have at least primary education. Stunting
Figure 3.20. Nutritional Status of Children under 5 and Low Birth Weight Incidence, 2005–2010 (%)
Source: World Bank, WDI database, accessed July 2014.
Stunting Underweight Wasting Low birth weight0
105
2015
253035404550
2000 20082005 2010

87
3. Critical Constraints to Inclusiveness
and wasting are slightly more prevalent in boys than girls.
Health outcomes remain low by regional standards. Cambodia’s life expectancy is the sixth highest in the Association of Southeast Asian Nations (ASEAN), but its infant and under-5 mortality rates are below only those of the Lao People’s Democratic Republic and Myanmar (Table 3.5). Maternal mortality is lower than in Indonesia and the two countries just mentioned.
Cambodia’s nutrition profile does not compare favorably with that of its neighbors. The prevalence of being underweight, stunting, and wasting among children is the highest in Southeast Asia, except for the Lao People’s Democratic Republic, where they are higher, and Indonesia, where wasting is marginally higher (Figure 3.21).
The undernutrition rate has been persistently higher than the Southeast Asian average since the early 1990s (Figure 3.22). About 15% of Cambodia’s
Table 3.5. Health Outcomes in ASEAN Countries, 2012
ASEAN = Association of Southeast Asian Nations, Lao PDR = Lao People’s Democratic Republic.Note: Data for maternal mortality are modeled estimates for 2013.Source: World Bank, WDI database, accessed July 2014.
CountryLife Expectancy at Birth (years)
Infant Mortality (per 1,000 live
births)
Child Mortality (per 1,000 live
births)
Maternal Mortality (per 100,000 live
births)Brunei Darussalam 78 7 8 27Cambodia 71 34 40 170Indonesia 71 26 31 190Lao PDR 68 54 72 220Malaysia 75 7 9 29Myanmar 65 41 52 200Philippines 69 24 30 120Singapore 82 2 3 6Thailand 74 11 13 26Viet Nam 76 18 23 49
Figure 3.21. Nutritional Status of Children in Selected Southeast Asian Countries,Latest Year (% of children under 5)
ASEAN = Association of Southeast Asian Nations, Lao PDR = Lao People’s Democratic Republic.Note: Data for maternal mortality are modeled estimates for 2013.Source: World Bank, WDI database, accessed July 2014.
Cambodia Indonesia Lao PDR Myanmar Philippines Viet Nam0
105
2015
253035404550
Underweight WastingStunting

88
Cambodia: Diversifying Beyond Garments and Tourism Country Diagnostic Study
Figure 3.23. Physicians, Nurses, Midwives, 2012 (per 1,000 people)
Lao PDR = Lao People’s Democratic Republic.Note: 2010 data are used for Malaysia and Singapore, 2011 data for Viet Nam.Source: World Bank, WDI database, accessed October 2014.
10 32 4 5 6 7 8 9
Singapore
Viet Nam
Myanmar
Malaysia
Lao PDR
Indonesia
Cambodia
Physicians Nurses and midwives
population was undernourished during 2011–2013, compared with the regional average of 11%.
Inadequate Supply of Medical Workers. The dearth of health care workers both in quantity and level of expertise may explain the country’s underperformance in its health outcomes. Availability of professional health services is severely limited. Only 1.2 skilled health workers (physicians, nurses, midwives) serve each 1,000 Cambodians (Figure 3.23). In 2011, 18,045 health care professionals were employed—91 of these were specialist doctors (WHO and Ministry of Health 2012). The limited number of qualified local health professionals constrains the delivery of health services. Inadequate funding, logistics, and data also prevent the government from addressing problems at the primary health care level.
Limited and Uneven Access to Health Care. Overall access to health care is limited, but the situation is even worse for the poor and women. Income remains the biggest determinant of household access to health services, and the vast majority of families do not have access to free health care. Health care access problems affected 72% of women in 2010, an improvement from 89% in 2005 (NIS, DGH, and ICF Macro 2011). For poor women, it is worse: 84% of women in the lowest income quintile reported problems accessing health care, compared with 55% in the highest quintile. Among
women in the poorest quintile, 79% reported not having enough money for treatment versus 48% in the highest quintile.
A lack of female doctors is another barrier to women’s access to health care—at least one-third of women were concerned about not having female doctors to attend to them (NIS, DGH, and ISF Macro 2011). In 2011, 84% of regular doctors and 92% of specialist doctors were male.
Figure 3.22. Prevalence of Undernourishment, 1990–2012 (% of population)
Note: Data refer to the proportion of the population estimated to be at risk of caloric inadequacy.Source: Food and Agriculture Organization, accessed February 2014.
0
20
3025
1510
5
35
4540
50
Cambodia Southeast Asia19
90–1
992
1991
–199
3
1992
–199
4
1993
–199
5
1994
–199
6
1995
–199
7
1996
–199
8
1997
–199
9
1998
–200
0
1999
–200
1
2000
–200
2
2001
–200
3
2002
–200
4
2003
–200
5
2004
–200
6
2005
–200
7
2006
–200
8
2007
–200
9
2008
–201
0
2009
–201
1
2010
–201
2
2011
–201
3

89
3. Critical Constraints to Inclusiveness
Interpersonal dynamics within a household may also contribute to the problem of women accessing health care. The need for permission from husbands to go to a health center affected 33% of women; only 45% of women claimed to be able to make health-related decisions on their own (NIS, DGH, and ISF 2011). Not wanting to go alone for health care affected 40% of women across all income quintiles, with those in the lower income quintiles even less willing to go alone. The tendency to go to clinics with a companion compounds the problem by raising transport costs.
The share of health expenditure in total household expenditure rises from the lowest to the highest income percentiles, suggesting that poor households seek less health services or more inexpensive ones (Figure 3.24). But the share is higher in rural than in urban areas, likely reflecting higher transport costs. From the provincial data, household health spending seems to be relatively low where transport costs are a significant share of total health expenditure, suggesting that this hinders health service access. Mondulkiri households allocated the highest portion of total health expenditure to transport, at 28%, followed by households in Kandal, Kep, and Kratie, which spent at least 15% on transport.
Limited Coverage of Subsidized Health Care. In most provinces, more than 90% of Cambodians sought consultation or treatment when they were ill (Figure 3.25). People used private hospitals and clinics nearly three times as often as public hospitals, although poor households tended to make greater use of public facilities (Figure 3.26). People tend to use public health facilities less because of a lack of confidence in them; long waiting times; restricted hours of service; unpredictable informal (and formal) charges; real and perceived poor quality of care, facilities, and medication; uneven clinical skills of providers and lack of medical staff; poor staff attitude toward patients; reluctance to travel; distance from the home; and preference for home-based health care, which is provided by private medical practitioners (Annear et al. 2006).
On average, at least one member in 10% of households receives free or subsidized health care. In Banteay Meanchey, Kampong Thom, Kep, and Phnom Penh subsidized health care was primarily granted through inclusion in the list of poor households that is held by the local authorities. In other provinces, patients received subsidized treatment upon providing documentary proof such as a Household Priority Access Card or Equity Card.
Figure 3.24. Household Health Expenditure, 2013 (%)
HH = household.Note: Income quintiles are based on expenditures data and use the new methodology of computing consumption aggregate, which the government applied from April 2013.Source: Calculations based on data from NIS, CSES Tables 2013.
AreaHH
head Income quintile Province
Cam
bodi
aU
rban
Rura
lM
ale
Fem
ale
Poor
est
Seco
ndTh
irdFo
urth
Rich
est
Bant
eay M
eanc
hey
Batta
mba
ng
Kam
pong
Chh
nang
Kam
pong
Cha
m
Kam
pong
Spe
uKa
mpo
ng T
hom
Kam
pot
Kand
alKe
pKo
h Ko
ngKr
atie
Mon
dulk
iriO
ddar
Mea
nche
yPh
nom
Pen
hPr
eah
Vihe
arPr
ey V
eng
Purs
atRa
ttana
kiri
Siem
reap
Siha
nouk
ville
Stun
g Tre
ngSv
ay R
ieng
Take
o
0
10
2015
5
2530
Share of health expenditure in total household expenditure Share of transport in total health expenditure

90
Cambodia: Diversifying Beyond Garments and Tourism Country Diagnostic Study
Figure 3.26. Health-Seeking Behavior for First Treatment of Illness, by Province and Health Care Provider (% of population that became ill)
Notes: Income quintiles are based on expenditures data and use the new methodology of computing consumption aggregate, which the government started applying in April 2013.Source: Calculations based on data from NIS, CSES Tables 2013.
Area Sex Income quintile Province
Cam
bodi
aU
rban
Rura
lM
ale
Fem
ale
Poor
est
Bant
eay M
eanc
hey
Batta
mba
ng
Kam
pong
Chh
nang
Kam
pong
Cha
m
Kam
pong
Spe
uKa
mpo
ng T
hom
Kam
pot
Kand
alKe
pKo
h Ko
ngKr
atie
Mon
dulk
iriO
ddar
Mea
nche
yPh
nom
Pen
hPr
eah
Vihe
arPr
ey V
eng
Purs
atRa
ttana
kiri
Siem
reap
Siha
nouk
ville
Stun
g Tre
ngSv
ay R
ieng
Take
o
0
40
6050
2030
70
9080
10
100
Nonmedical sector and others Private hospital/clinic/pharmacy and home office/home visit of trained health worker
Public hospital/rehabilitation center
Seco
ndTh
irdFo
urth
Rich
est
But members of only 6% of households (and only 14% of those in the poorest quintile) have such cards (NIS, CSES Tables 2013).
The government has significantly intensified its support for the health sector, increasing its spending 35 times from 1995 to 2013. Resources allocated to health services rose to KR902 billion
in 2013, compared with just KR26 billion in 1995. Government health spending increased sharply between 1995 and 2000 and has risen steadily since then, reflecting the government’s focus on public health in its social sector agenda (Figure 3.27). As a result, health spending as a share of GDP rose significantly between 1995 and 2013, but only at about 1.5% of GDP (Figure 3.28).
Figure 3.25. Percentage of the Population that Became Ill and Sought Consultation or Treatment, 2013
Note: Income quintiles are based on expenditure data and use the new methodology of computing consumption aggregate, which the government started applying in April 2013.Source: Calculations based on data from NIS, CSES Tables 2013.
Area Sex Income quintile Province
Cam
bodi
aU
rban
Rura
lM
ale
Fem
ale
Poor
est
Seco
ndTh
irdFo
urth
Rich
est
Bant
eay M
eanc
hey
Batta
mba
ng
Kam
pong
Chh
nang
Kam
pong
Cha
m
Kam
pong
Spe
uKa
mpo
ng T
hom
Kam
pot
Kand
alKe
pKo
h Ko
ngKr
atie
Mon
dulk
iriO
ddar
Mea
nche
yPh
nom
Pen
hPr
eah
Vihe
arPr
ey V
eng
Purs
atRa
ttana
kiri
Siem
reap
Siha
nouk
ville
Stun
g Tre
ngSv
ay R
ieng
Take
o
0
50
7060
40302010
8090
100

91
3. Critical Constraints to Inclusiveness
3.2.3. Water and SanitationWater and sanitation infrastructure is in short supply due to its destruction during the civil war, lack of budgetary resources, and unclear institutional structure. Access to improved water sources and sanitation has been increasing, albeit
slowly. Among ASEAN countries, Cambodia has the lowest access to rural sanitation facilities and the second lowest access to good quality water in rural areas (Figure 3.29). Urban facilities are generally in much better condition. Large regional disparity also exists in both the access to and the presence of improved water sources and sanitation (Figure 3.30).
Inequality in access to improved water and sanitation affects children more than any other demographic group, although the incidence of gastroenteric diseases varies widely across provinces;31 the incidence was highest in Stung Treng and lowest in Rattanakiri. Provinces with poor sanitation facilities have higher incidence of diarrheal disease.
In Phnom Penh, at least 90% of households have access to improved water sources during both dry and wet seasons (NIS, CSES Tables 2013). In rural areas, 52% of households have access in the dry season, but only 42% in the wet season. Among households in the poorest quintile, only 48% (during dry season) and 39% (during wet season) have access to improved water sources, whereas 70% (dry season) and 64% (wet season) of the richest quintile have such access.
31 Based on calculations using survey data from NIS, CSES Tables 2013.
Figure 3.27. Government Expenditure on Health, 1995–2012
KR = riel.Source: ADB (2013b).
1995 1996 1997 1998 200120001999 20022003 2004 2005 2006 2007 2008 2009 201220112010 20130
300200100
400500600700800900
Share of health expenditure in government expenditure on social services (%)
Expe
nditu
re o
n he
alth
0
15105
202530354045
%
Expenditure on health (KR billion) Share of health expenditure in total government expenditure (%)
Figure 3.28. Public Health Expenditure in ASEAN Countries, 1995 and 2013 (% of GDP)
ASEAN = Association of Southeast Asian Nations, GDP = gross domestic product, Lao PDR = Lao People’s Democratic Republic.Source: ADB (2014a); World Bank, WDI database, accessed October 2014.
0.50.0
1995 2003
1.51.0 2.0 2.5 3.0
Singapore
Thailand
Viet Nam
Philippines
Myanmar
Malaysia
Lao PDR
Indonesia
Cambodia
BruneiDarussalam

92
Cambodia: Diversifying Beyond Garments and Tourism Country Diagnostic Study
Access to improved water also varies across provinces. In Koh Kong and Svay Rieng, at least 90% of households have access during the wet season, while those in Kep, Mondulkiri, and Rattanakiri have access rates below 15% of households.
Because it is difficult and expensive to extend the piped water system, water facilities in rural areas are limited to hand pumps, dug wells, ring wells, and
rainwater harvesting systems. For many rural people, drinking water is sourced from unprotected dug wells and surface water, which are highly susceptible to contamination from fecal matter, waste, and chemicals. During the wet season, lasting 7 months of the year, many people use rainwater collected from unprotected tanks or containers.
The high cost of better sanitation facilities and inadequate awareness of sanitation’s benefits contribute to the low demand for these facilities in some areas (Robinson 2010). In 2013, just over 98% of households in Phnom Penh had improved toilets, compared with only 40% in rural areas. Open defecation remains common among 56% of rural households (Table 3.6). Toilet facilities are accessible to only 29% of people in the poorest income quintile versus 79% in the richest quintile. Male-headed households are more likely to have access to improved sanitation than households headed by women. Sanitation coverage also varies across provinces (Figure 3.30).
3.3. Leveling the Playing FieldLeveling the playing field entails ensuring that people in all geographic localities and socio-economic groups have equal access to economic opportunities. This requires equitable provision of infrastructure facilities, productive assets, and credit.
3.3.1. InfrastructureAccess to Electricity. Access to electricity is highly uneven, with 94% of households in urban areas having access, but only 38% in rural areas (Figure 3.31). In 2013, about 80% of households in the top income quintile had electricity access versus only 28% of those in the lowest income quintile.
In Phnom Penh, all households have access to electricity, but in 14 of the country’s 22 provinces
ASEAN = Association of Southeast Asian Nations, Lao PDR = Lao People’s Democratic Republic.Note: Excludes Brunei Darussalam.Source: WHO and UNICEF database, accessed July 2014.
Figure 3.29. Improved Water Source and Sanitation Facilities in ASEAN, 2012 (% with access)
Urban Rural
Sing
apor
e
Mal
aysia
Viet
Nam
Thai
land
Mya
nmar
Indo
nesia
Philip
pine
s
Cam
bodi
a
Lao
PDR
0
605040302010
708090
100
Improved water source
Sing
apor
e
Mal
aysia
Viet
Nam
Thai
land
Lao
PDR
Mya
nmar
Philip
pine
s
Cam
bodi
a
Indo
nesia
0
605040302010
708090
100
Improved sanitation

93
3. Critical Constraints to Inclusiveness
(excluding Phnom Penh) less than 50% of households do. The reasons include limited electricity supply and grid connection, and high cost. The richest households, which have 15 times the per capita disposable income of the poorest quintile, had almost three times greater electricity access.32 Proximity to major grid areas also impacts electricity access and tariff rates, and thus poor households 32 Data on per capita monthly disposable income are from NIS,
CSES Tables 2013.
in areas with limited or no grid connection have poor quality electricity service that is also supplied at higher prices. Isolated distribution systems supply only 0.4% of total energy input and serve 2.6% of consumers, while the national grid, which supplies 84.3% of total energy to the system, serves 84.0% of total consumers (Electricity Authority of Cambodia 2013).
Figure 3.30. Improved Water Source (Wet Season) and Sanitation Facilities, 2013 (%)
HH = household.Note: Household income quintile is assigned based on the new methodology of computing consumption aggregate, which the government started applying in April 2013. Source: Calculations based on data from NIS, CSES Tables 2013.
AreaHH
head Income quintile Province
Cam
bodi
aU
rban
Rura
lM
ale
Fem
ale
Poor
est
Seco
ndTh
irdFo
urth
Rich
est
Bant
eay M
eanc
hey
Batta
mba
ng
Kam
pong
Chh
nang
Kam
pong
Cha
m
Kam
pong
Spe
uKa
mpo
ng T
hom
Kam
pot
Kand
alKe
pKo
h Ko
ngKr
atie
Mon
dulk
iriO
ddar
Mea
nche
yPh
nom
Pen
hPr
eah
Vihe
arPr
ey V
eng
Purs
atRa
ttana
kiri
Siem
reap
Siha
nouk
ville
Stun
g Tre
ngSv
ay R
ieng
Take
o
0
50
7060
40302010
8090
100
Improved water source Improved sanitation facilities
Table 3.6. Sanitation Facilities, 2013 (% of households)
Note: “Other Urban” and “Other Rural” exclude Phnom Penh.Source: NIS, CSES Tables, accessed July 2014.
Toilet Type Cambodia Phnom Penh Other Urban Other RuralImproved Toilets 51.7 98.4 86.4 40.2Pour flush/flush connected to sewerage 11.3 73.9 12.9 1.8Pour flush/flush connected to septic tank 39.9 24.5 72.4 37.8Pit latrine with slab 0.5 0.0 1.2 0.5Unimproved Toilets 48.3 1.6 13.6 57.8Pit latrine without slab/open pit 0.4 0.0 0.3 0.5Latrine overhanging field/water 1.6 0.1 2.3 1.8Public toilet (pit latrine/latrine) 1.1 0.0 1.6 1.2Open land 44.9 1.5 9.2 56.0Other unimproved 0.2 0.0 0.2 0.3

94
Cambodia: Diversifying Beyond Garments and Tourism Country Diagnostic Study
Figure 3.32. Access to Telecommunications in Cambodia and the Rest ofASEAN, 2000–2013 (subscriptions per 100 people)
ASEAN = Association of Southeast Asian Nations.Source: World Bank, WDI database, accessed July 2014.
2000 2001 2002 2003 2004 2005 2006 2007 2008 2009 2011 2013201220100
40
20
60
80
100
120
140
160
Cambodia landline accessCambodia mobile phone access Average ASEAN phone access (ex-Cambodia)
Access to Telecommunications Services. Access to telecommunications services is skewed toward urban areas and rich households. Telecommunications access has vastly improved. In 2000, Cambodia had only 1.3 phone subscriptions per 100 people, compared with the ASEAN average of 28 (Figure 3.32). Digital technology has helped widen the reach of telecommunications, and mobile and landline subscriptions have risen rapidly to 137 per 100 people in 2013, higher than
the ASEAN average; the increase is mainly due to widespread mobile phone use. Among rural households, 72% have mobile access, while 65% of the poorest households have mobile access (Figure 3.33). Landline infrastructure lags behind mobile infrastructure, so that even in the province of Kratie, where landline telephone density is highest, a landline telephone is accessible to only 19% of households. Households in Koh Kong, Rattanakiri, and Stung Treng have no landline
Figure 3.31. Access to Electricity, by Area, Province, and Income Quintile, 2013 (% of households)
HH = household.Note: Income quintiles are based on expenditures data and use the new methodology of computing consumption aggregate, which the government started applying in April 2013.Source: Calculations based on data from NIS, CSES Tables 2013.
AreaHH
Head Income Quintile Province
Cam
bodi
aU
rban
Rura
lM
ale
Fem
ale
Poor
est
Seco
ndTh
irdFo
urth
Rich
est
Bant
eay M
eanc
hey
Batta
mba
ng
Kam
pong
Chh
nang
Kam
pong
Cha
m
Kam
pong
Spe
uKa
mpo
ng T
hom
Kam
pot
Kand
alKe
pKo
h Ko
ngKr
atie
Mon
dulk
iriO
ddar
Mea
nche
yPh
nom
Pen
hPr
eah
Vihe
arPr
ey V
eng
Purs
atRa
ttana
kiri
Siem
reap
Siha
nouk
ville
Svay
Rie
ngTa
keo
0
50
7060
40302010
8090
100

95
3. Critical Constraints to Inclusiveness
access. Mobile phone density by contrast, is quite high. In Phnom Penh, 96% of households have mobile phone access. Outside the capital, mobile access is highest in Koh Kong (93%) and lowest in Stung Treng (20%).
3.3.2. LandBecause agriculture employs the majority of the labor force, access to productive land is important for poverty alleviation and economic growth. Of households in Cambodia, 64% own or farm land, with the share higher for households headed by men (66%) than by women (57%). The average size of land farmed is 1.6 hectares, with larger average sizes for households headed by men, at 1.7 hectares, than women, at 1.1 hectares (Figure 3.34). The average size of land owned by urban households is 1.6 times that of rural households.
Land Use and Land Tenure. Problems related to accessing land and securing land tenure stem from the destruction of all land title documents and the abolition of private property during the Khmer Rouge period. A collectivized land system was adopted during the Vietnamese-backed
administration in the 1980s. In 1989, the government allowed formal private land ownership, and introduced the concept of legal ownership in the Land Law (1992), which was updated in the 2001 Land Law. Legal owners of land have the right to request a title of ownership which, in theory, the government can grant in a fairly straightforward manner. However, “there is repeated evidence of the Government denying land titles to those with valid possession rights” (Land and Housing Working Group 2009, 21).
The Cambodia Socio-Economic Survey 2013 shows that about 45% of land was obtained through family inheritance or acquired from a relative, and 34% from the government (Figure 3.35).
The updated Land Law provides for the redistribution of land. In 2009, the Gini coefficient of land distribution was 0.6997, a relatively equitable level.33 Ownership of land, however, is no guarantee of security. The legal and regulatory infrastructure for land titling and settlement of land disputes should be strengthened. In 2012, 70 land dispute cases were reported, affecting 101,408 hectares and 10,689
33 Calculation based on data from NIS, CSES 2009.
Figure 3.33. Access to Telecommunications, by Area, Province, and Income Quintile, 2013 (% of households)
Note: Income quintiles are based on expenditures data and use the new methodology of computing consumption aggregate, which the government started applying in April 2013.Source: Calculations based on data from NIS, CSES Tables 2013.
Area Income quintile Province
Cam
bodi
aU
rban
Rura
l
Poor
est
Seco
nd
Third
Four
th
Rich
est
Bant
eay M
eanc
hey
Batta
mba
ng
Kam
pong
Chh
nang
Kam
pong
Cha
m
Kam
pong
Spe
u
Kam
pong
Tho
m
Kam
pot
Kand
al
Kep
Koh
Kong
Krat
ie
Mon
dulk
iri
Odd
ar M
eanc
hey
Phno
m P
enh
Prea
h Vi
hear
Prey
Ven
g
Purs
at
Ratta
naki
ri
Siem
reap
Siha
nouk
ville
Stun
g Tre
ng
Svay
Rie
ng
Take
o
0
604020
80100120
Cellphone Telephone

96
Cambodia: Diversifying Beyond Garments and Tourism Country Diagnostic Study
Figure 3.35. Source of Land, by Major Geographic Domain and Income Quintile, 2013 (% of households)
Note: Income quintiles are based on expenditures data and use the new methodology of computing consumption aggregate, which the government started applying in April 2013.Source: Calculations based on data from NIS, CSES Tables 2013.
Area Income quintile
Cambodia Urban Rural Poorest Second Third Fourth Richest0
40
6050
2030
708090
10
100
Given by the governmentor local authority By inheritance/gift/donated by relatives Bought from relative/friend
Cleared land/occupied land for free Other
families, in addition to cases pending from previous years (ADHOC 2013). The Land Management and Administration Project has been unable to provide security to many vulnerable households, with the influx of foreign investment and rapid urbanization and commercialization endangering the land tenure of many households. As of December 2012, the government had reserved or allocated about
2.7 million hectares of land under the Economic Land Concession scheme, despite announcing a moratorium on granting land concessions under the scheme. Many land concessions that have been granted affect protected areas. The government also granted 38 social land concessions (which provide land to poor, landless families, including those displaced by economic land concessions, and
Figure 3.34. Households Owning or Farming Land, 2013
HH = household.Note: Household expenditure quintile is assigned based on the new methodology of computing consumption aggregate in Cambodia, which the government started applying in April 2013.Source: Calculations based on data from NIS, CSES Tables 2013.
Area Sex Income quintile Province
Cam
bodi
aU
rban
Rura
lM
ale
Fem
ale
Poor
est
Seco
ndTh
irdFo
urth
Rich
est
Bant
eay M
eanc
hey
Batta
mba
ng
Kam
pong
Chh
nang
Kam
pong
Cha
m
Kam
pong
Spe
uKa
mpo
ng T
hom
Kam
pot
Kand
alKe
pKo
h Ko
ngKr
atie
Mon
dulk
iriO
ddar
Mea
nche
yPa
ilinPh
nom
Pen
hPr
eah
Vihe
arPr
ey V
eng
Purs
atRa
ttana
kiri
Siem
reap
Siha
nouk
ville
Stun
g Tre
ngSv
ay R
ieng
Take
o
0
50
7060
40302010
8090
100
0
5
76
4321
8910
Households that own or operate land Average area
% of
hou
seho
lds t
hat o
wn
or o
pera
te la
nd
Hec
tare
s

97
3. Critical Constraints to Inclusiveness
to veterans of the Cambodian Armed Forces and the National Police Force), covering 101,000 hectares in 16 provinces—a negligible figure compared with the amount of land granted to the private sector under other concession schemes (ADHOC 2013).
Access to Irrigation Facilities. Although Cambodia has ample natural water resources, in 2013, less than 50% of the land was irrigated; of that, 42% was irrigated only seasonally, and only 6% was irrigated year-round (Figure 3.36). Land cultivated by male-headed households is more likely to be irrigated than land cultivated by female-headed households. Because irrigation raises agricultural productivity, the low level of irrigation limits the income-earning potential of most farm households.
3.3.3. Credit Financial access is a critical component of inclusive growth and development. Access to credit enables households to smooth consumption during economic adversity and to engage in opportunities to raise their income and welfare during periods of growth.
Financial development reforms have helped pave the way for greater access to credit from formal institutions. But Cambodians still rely significantly
on informal sources, including family, friends, and moneylenders. About 34% of households borrowed money in 2013.34 Households in the poorest quintile are at least twice as likely to borrow as wealthier households (Figure 3.37). Poor households access two-thirds of their loans from banks and nongovernmental organizations (NGOs) and about one-third from moneylenders and relatives and friends. These shares are very similar for the population as a whole (Figure 3.38). Female-headed households tend to rely more on relatives and friends and moneylenders than male-headed households and less on NGOs.
NGOs charge marginally higher interest rates to the poor, at 3% per month, than banks, at 2.8% (Figure 3.39). As expected, moneylenders charge the highest rates, at over 5% per month (over 60% per year).
The rapid development of microfinance in the last 10 years has helped minimize the unserviced need for financial services, but people in poorer regions still face limited access to microcredit services. Further developing credit mechanisms in rural areas will be needed to help poor rural households engage in economic activities more intensively and to promote financial inclusion.
34 Calculation based on NIS, CSES Tables.
Figure 3.36. Land with Access to Irrigation, 2013 (%)
HH = household.Note: Income quintiles are based on expenditures data and use the new methodology of computing consumption aggregate, which the government started applying in April 2013.Source: Calculations based on data from NIS, CSES Tables 2013.
Area HH head Income quintile
Cambodia Urban Rural Male Female Poorest Second Third Fourth Richest0
30
5040
1020
6070
Irrigated during dry season only Irrigated during wet season only Irrigated during dry and wet seasons

98
Cambodia: Diversifying Beyond Garments and Tourism Country Diagnostic Study
Figure 3.37. Access to Loans, 2013 (% of households)
HH = household.Notes: Income quintiles are based on expenditures data and use the new methodology of computing consumption aggregate, which the government started applying in April 2013.Source: Calculations based on data from NIS, CSES Tables 2013.
Figure 3.38. Household Loans by Source, 2013 (% of total number of loans)
NGO = nongovernment organization.Note: Income quintiles are based on expenditures data and use the new methodology of computing consumption aggregate, which the government started applying in April 2013.Source: Calculations based on data from NIS, CSES Tables 2013.
Figure 3.39. Average Monthly Interest Rate on Loans to the Poorest Quintile, by Source of Loan, 2013 (%)
NGO = nongovernment organization.Note: Income quintiles are based on expenditures data and use the new methodology of computing consumption aggregate, which the government started applying in April 2013.Source: Calculations based on data from NIS, CSES Tables 2013.
Area HH head Income quintile
Cambodia Urban Rural Male Female Poorest Second Third Fourth Richest0
40
6050
2030
708090
10
100
Cambodia Male-headed household Female-headed household Poorest income quintile05
1510
2025
3530
40
Relatives/friends (in Cambodia/abroad) Moneylender Employer/landlord
Bank NGO Other
Trader
Relatives/friends(in Cambodia/abroad)
Moneylender BankTrader NGO OtherEmployer/landlord0
2
1
3
4
5
6

99
3. Critical Constraints to Inclusiveness
3.4. Social Safety NetsCoverage of social safety nets is very low. Social protection in Cambodia covers only 3.2% of the population, according to the World Bank—far behind the world average of 43%. Only 1.7% of households in the lowest income quintile are covered.35
Cambodia’s social protection landscape consists of social security entitlements as provided by law, national social protection programs, and donor-funded programs and projects. The Labor Law (1997) provides the legal framework for the protection of wage employees in the private sector and mandates that employers provide employees with social security benefits in the form of employment injury benefits, maternity leave, sick leave, and severance pay. The Law on Social Security Schemes for Persons Defined by the Labor Law (2002) provides a social security scheme for private sector employees under the National Social Security Fund, a mandatory employment-based social insurance scheme intended to provide occupational injury coverage, medical insurance, and pension benefits to private sector employees. This fund and the National Social Security Fund for Civil Servants are the two main benefit programs. In addition, the Council for Agricultural and Rural Development, supported by line ministries, stakeholders, and development partners, launched the National Social Protection Strategy for the Poor and Vulnerable in 2011. It aims to help attain Cambodia’s Millennium Development Goals by protecting poor and disadvantaged groups in the face of economic shocks and vulnerable situations, and by expanding opportunities to build human capital to move people out of poverty (RGC 2011c). The strategy is still in the early stages of implementation.
Other legal measures relevant to social protection include the following:
� the Common Statute of Civil Servants (1994);
35 World Bank, Atlas of Social Protection Indicators of Resilience and Equity database, accessed August 2014.
� Prakas No. 012: on The Instructions to Implement the Retirement and Disability Pension Regime of Career Soldiers of the Both Sexes of the Royal Cambodian Armed Forces (2007) and Establishment of the National Fund for Veterans via Sub-Decree No. 79 (2010);
� Establishment of the National Fund for Veterans via Sub-Decree No. 79 (2010);
� the Law on the Protection and the Promotion of the Rights of Persons with Disabilities (2009);
� the Law on Suppression of Kidnapping and Trafficking of Human Persons and Exploitation of Human Persons (1994);
� the Law on the Prevention of Domestic Violence and the Protection of Victims (2005), which was used to develop the National Action Plan to Combat Violence against Women; and
� the Insurance Law (2000).
With these laws in place—and government spending on social security and welfare increased—from KR159 billion in 2008 to KR238 in 2010—the share of the labor force covered by some type of social protection increased from 49% to 60% in 2008–2010, according to the Asian Development Bank (Table 3.7).
The government established the National Social Security Fund for Civil Servants in 2008 to centralize the administration and disbursement of social security benefits and establish a contributory and financially sustainable social insurance scheme for retired civil servants, soldiers, and police; disabled people; and dependents of soldiers and military heroes. Benefits cover sickness, work injuries, maternity leave, retirement, invalidity, death, and family allowances for spouses and children. About 703,000 civil servants, civil service pensioners, and their dependents were covered by the scheme in 2010 (Figure 3.40).

100
Cambodia: Diversifying Beyond Garments and Tourism Country Diagnostic Study
expenditures of the National Social Security Fund totaling KR2.4 billion (excluding administration costs) in that year.37 Two additional components are targeted for inclusion—health insurance from mid-2014 and a pension scheme in 2015. The health insurance component includes employees and their dependents (spouses and children); 11% of the population is targeted for membership. Since benefits will be channeled through the public health care system, the insurance scheme could be a vehicle for funding improved medical services. The pension scheme covers retirement, invalidity, and survivors. Given the current demography of the workforce, the scheme, once launched, is in a good
37 Administration costs raise the total to KR5 billion (International Labour Organization 2012).
Figure 3.40. Coverage of the National Social Security Fund for Civil Servants, 2010
Source: International Labour Organization (2012).
Civil servants
Civil service pensioners
Dependents of civil servants
Dependents of pensioners
25%
62%
5%
8%
Benefit expenditures totaled KR245 billion during 2007–2009 (Figure 3.41). There are about 17 pensioners for every 100 active civil servants, and this ratio is expected to rise with more civil servants retiring relative to new hiring. The Treasury—through the Ministry of Social Affairs, Veterans, and Youth—finances Rehabilitation National Social Security Fund for Civil Servants benefits, although a regulation has been prepared stipulating financing from joint contributions of the government as the employer (18%) and civil servants as employees (6%). However, the salary base on which contributions will be levied has not yet been established. A social health insurance component to protect civil servants and their dependents (about 5% of the total population) against heavy health expenditures has been proposed to be added to the benefits envelope of the National Social Security Fund for Civil Servants, but this is not yet in operation.
Under the National Social Security Fund, all private sector firms with more than seven employees are covered; employees of smaller enterprises are to be included later. As of December 2011, the fund had about 700,000 members,36 approximately 10% of the labor force. About 80% of members were women, the majority employed in the garment sector. Since 2008, occupational risk insurance has been in place for employees. Benefits include medical care, nursing cash allowance, temporary disability benefits, permanent disability and caretaker benefits, survivor benefits, and rehabilitation benefits. In 2010, 83% of beneficiaries received payments for temporary disability, with benefit
36 See the CAMFEBA website. Laws and Regulations Research Center. National Social Security Fund. http://www.camfeba.com/en/services/hr-and-labour-practice-consultation/nssf-law-and-regulations-.html
Table 3.7. Social Protection Coverage, 2008–2010
KR = riel.Sources: ADB (2012c); ADB Social Protection Index Database website; NIS, CSES website; both accessed May 2013.
YearNumber of
Beneficiaries Covered Labor Force
Ratio of Beneficiaries to Labor Force (%)
Government Spending on Social Security and Welfare (KR billion)
2008 3,345,856 6,854,000 48.8 159.0
2009 4,133,402 7,480,000 55.3 195.9
2010 4,620,867 7,720,000 60.0 237.7

101
3. Critical Constraints to Inclusiveness
position to accumulate funds during the next 2–3 decades, as its first generation of contributors are young and not expected to retire before 2035.
The benefits of the National Fund for Veterans, created in 2010, are similar to those of the National Social Security Fund for Civil Servants, with the addition of a marriage allowance (a cash allowance payable on a first marriage). In 2010, expenditures on veteran pension benefits totaled KR77 billion, with over three-quarters of that amount going to survivors. Because the average pension is only $35 per month, the scheme does not effectively reduce poverty (using a $2-a-day threshold). Survivors of veterans receive even less.
There are several forms of ad hoc government-originated and donor-dependent social safety nets managed by various line ministries. These include food distribution; health equity funds; community-based health insurance; public work programs; scholarships; as well as social welfare services for vulnerable groups such as the elderly, orphans, and people with disabilities. Although Cambodia’s constitution enshrines the protection of the poor, the reality is that, because the country’s social safety
nets are inadequate, many disenfranchised groups rely on informal arrangements to tide them through crises, typically by securing financial and in-kind assistance from family and the community.
A formal social protection system will need to be developed quickly as the economy rapidly modernizes and evolves into one in which the importance of traditional social protection recedes as a source of assistance and insurance against health and income shocks. Despite increased central government spending on social benefits (from KR27 billion in 2000 to KR411 billion in 2013), its share of total government spending still accounts for a small part of the total budget at 5.9%, in 2013 (ADB 2014a).
The attainment of short-term targets for social development takes precedence over creating a long-term vision. The bias toward achieving short-term targets is reflected in the reach of the three main types of social protection programs. In 2009, social assistance, which accounted for 57% of total social protection spending, reached 39% of the target population of 7.5 million. Social insurance, which accounted for 25% of total spending, reached only 5.3% of its 9.1 million target population, while the labor market program, which could have had the biggest effect on employment and productivity, reached only 13% of the 1.8 million targeted population (ADB 2012d).
3.5. ConclusionThe diagnosis of key socioeconomic issues identified the following as critical constraints to the inclusiveness of Cambodia's growth (Table 3.8):
� limited opportunities for productive and decent employment;
� poor quality of education and low levels of access to secondary and higher education;
� inadequate nutrition and health services; � limited (but improving) access to electricity;
and� limited coverage of social protection.
Figure 3.41. Total Expenditures on National Social Security Fund Benefits, 2007–2009 (KR billion)
KR = reil.Source: International Labour Organization (2012).
2007 2008 2009
Survivor pensionsRetirement pensions Invalidity pensions
Work injury pensionsDeath grants
Maternity grants
0
40
6050
2030
70
9080
10
100

102
Cambodia: Diversifying Beyond Garments and Tourism Country Diagnostic Study
Table 3.8. Summary of Diagnosis of Constraints to Reducing Poverty and Inequality
Source: ADB.
Broad Determinants of Poverty and
InequalityFactors Affecting Poverty and
InequalityHow the Factor Affects Poverty and Inequality
Is It a Critical Constraint?
Productive and Decent Employment Opportunities
Employment opportunities �� Rising employment opportunities in the formal sector
�� Still high informal employment, especially among female, older, and rural workers
�
Access to Opportunities Human capabilities
Education �� Low educational attainment of workforce due to limited access to and low quality of education
�� High opportunity cost of education among women and rural people
�� Nascent stage of technical and vocational education and training
�� Low public expenditure on education resulting in poor school facilities
�
Health �� Prevalence of malnutrition particularly in rural areas
�� Prevalence of waterborne or water-related diseases, particularly among children
�� Too few medical workers�� Limited coverage of health
care benefits
�
Other social services
�� Insufficient access to improved water and sanitation in rural areas and towns
Uneven access to infrastructure and productive assets
Infrastructure �� Half of households still do not have access to electricity
�
Land �� Poor people have access to land
�� Limited access to irrigationCredit �� Limited financial products
offered by formal financial services that might cater to the needs of poor households
Social Safety Nets Social safety nets �� Several social protection programs in place but scope is limited
�� National Social Protection Strategy launched in 2011
�

103
4. Diversification and Upgrading
4. DIVERSIFICATION AND UPGRADING
seek to rely less on preferential trade agreements and more on competitiveness.
The process of diversification could also be developed in a manner to ensure that it contributes to growth that is inclusive. Developing sectors that are employment intensive will ensure that the gains from investments are shared more widely through job creation and wage income. A diverse spatial distribution of new investments will spread growth more evenly to include border and inland areas that are still lacking economic opportunities.
4.1. Patterns of Specialization and DiversificationCambodia’s export structure has evolved considerably since the early 1990s, from resources-based products to manufactured goods. The top five exports in 1990 were rubber, scrap metals, sawlogs and wood, soya beans, and leather and skins. In 2013, they were garments, bicycles, rice, electronics, and rubber (Table 4.1). Rubber and wood products dominated in the early 1990s, with rubber accounting for more than a third of all exports in 1990 and wood accounting for nearly two-thirds, with a surge in demand during 1992–1995 (Figure 4.1). The contribution of manufactured goods was marginal, with garments making up a mere 3% of total exports in 1990. Rice exports were also low, generating no more than $1 million in revenues in that year, but by mid-decade had risen to $3 million. Because the economy was emerging from foreign military occupation and undergoing reconstruction, the overall level of export of goods and services was low—equal to about 30% of gross domestic product during the 1990s. In 2013, total exports reached 66% of gross domestic product.
Four sectors—rice, garments, tourism, and construction—have been Cambodia’s major drivers of growth in the past 2 decades. Although they will likely continue to be important for the country’s medium-term growth prospects, their success masks a structural weakness in the economy—lack of diversification. Specialization in a few sectors leaves the economy vulnerable to single-sector price and demand shocks from changes in market conditions, trade access, and new competitors.
This vulnerability became apparent in the 2000s when garments dominated industrial output and exports, which were hit hard by the 2008–2009 global financial crisis. Cambodia’s narrow production and export bases are a significant risk to the sustainability of its current pattern of economic growth. With a heavy concentration of exports to Western countries, the expectation of slow longer-term growth in advanced markets suggests weaker demand for Cambodia’s exports in the long run. Without diversifying into higher value products and services, the country also risks being caught in low-wage, low-technology production.
The need to diversify and upgrade is made more urgent by the changing global trading environment. Cambodia currently benefits from tariff preferences with developed regions. The Everything-But-Arms arrangement gives the country duty-free access to the European Union, while other agreements offer low barriers to access to Canada and the United States. These tariff preferences have helped the country increase exports of rice, garments, and other products, and to establish a bicycle assembly industry (Box 4.1). But by the end of the decade, Cambodia will likely cease to be eligible for many tariff preferences as income rises and it loses least-developed-country status. Although new arrangements may be developed, Cambodia should

104
Cambodia: Diversifying Beyond Garments and Tourism Country Diagnostic Study
Cambodia began producing and exporting bicycles in large numbers in 2006. The addition of new factories resulted in bicycle exports increasing nearly 10 times in 2013, just 8 years after the start of these exports (Figure B4.1). Cambodia is now the second largest bicycle exporter to Europe. Production is driven by Taipei,China manufacturers, which operate five of the six production facilities in the country, and a US firm.
Tariff preferences, largely, have driven the industry's rise. Taipei,China producers relocated factories from Viet Nam to Cambodia after the European Union imposed antidumping duties in 2005. Cambodia enjoys quota-free and tariff-free access to the European Union under the Everything But Arms arrangement, which means all exports are exempt from the standard 14% tariff on imported goods. Cambodia’s proximity to Viet Nam also helped. Bicycle factories in Svay Rieng are just 90 minutes from Ho Chi Minh City, which is important because parts are still produced in Viet Nam for shipment to Cambodian manufacturers. Cambodia’s low wages were also a major factor in Taipei,China bicycle producers moving production there.
Bicycles assembled in Cambodia are mostly simple models sold at low prices. The Taipei,China plants are expanding while trying to keep a low profile to avoid a repeat of the anti-dumping duties experienced in Viet Nam. Cambodian trade officials hope that bike manufacturers from Taipei,China will consider Cambodia as part of a long-term investment strategy and establish a bicycle manufacturing cluster. Infrastructure and labor-related factors that could hold back the bicycle industry’s development should be resolved to improve the country’s competitiveness as a production platform. Power supply issues need resolving to reduce production costs, as bicycle factories currently have installed their own generators to ensure adequate supply. Improvements in road transport and logistics would facilitate the import of parts and the export of completed products. The industry would also benefit from sector-specific skills training to reduce the defect rate and improve product quality. Cambodia has also recently experienced frequent labor strikes that disrupt production and cause costly delays in shipments.
Source: Ruan (2013).
Box 4.1. Tariff Preferences Aid Diversification: Cambodia’s Bicycle Industry
Figure B4.1. Bicycle Exports, 2005–2013 ($ million)
2005
0.044.4 55.3 71.2 68.8 76.1
96.0
293.1
423.7
2006 2007 2008 2009 2010 2012 201320110
100
200
300
400
500

105
4. Diversification and Upgrading
This all changed with the emergence of the garment sector. Political stability brought new confidence, with garment manufacturers looking for a low-cost production platform that had quota access to advanced markets. Cambodia filled this requirement and a predominantly foreign-owned garment sector developed, albeit one without design capability, domestic fabric producers, or supporting industries (zippers and buttons, for example). The industry focused on low-value, labor-intensive cut-make-trim activities. Investment grew rapidly and, with it, employment and exports. Total garment exports breached $1 billion in 1999 and have accounted for over 80% of all exports since.
Cambodia’s export concentration is the third highest in the Association of Southeast Asian Nations (ASEAN), as measured by the Herfindahl-Hirschmann Index (Figure 4.2).38 This heavy focus on
38 The Herfindahl-Hirschmann Index is calculated as follows:
where Xij is country j’s exports of product i, Xj is country j’s total exports, and n is the total number of products. The higher the index, which is bounded between 0 and 1, the more a country relies on fewer products for export earnings.
Table 4.1. Top Five Exports, 1990–2013 (% of total)
Note: Garments include footwear.Source: Calculations based on datasets from UN Comtrade, accessed June 2014.
Figure 4.1. Composition of Cambodia’s Exports, 1990–2013 ($ billion)
Note: Garments include footwear.Source: Estimates based on datasets from UN Comtrade, accessed June 2014.
Rank 1990 1995 2000 2005 2010 20131 Rubber (37%) Sawlogs and
wood (56%)Garments (88%) Garments (88%) Garments (82%) Garments (82%)
2 Scrap metals (20%) Garments (20%) Sawlogs and wood (5%)
Sawlogs and wood (2%)
Rubber (4%) Bicycles (4%)
3 Sawlogs and wood (19%)
Rubber (14%) Rubber (3%) Rubber (2%) Bicycles (1%) Rice (3%)
4 Soya beans (7%) Cotton (3%) Seafood (1%) Gold and jewelry (1%)
Sawlogs and wood (1%)
Electronics (1%)
5 Leather and skins (3%)
Seafood (2%) Textile and yarn (0.7%)
Textile and yarn (1%)
Gold and jewelry (1%)
Rubber (1%)
1990
2000
1991
1992
1993
1994
1995
1996
1997
1998
1999
2010
2011
2012
2013
2001
2002
2003
2004
2005
2006
2007
2008
2009
010
40
2030
5060708090
100
%
Sawlogs and wood
Electronics
Rubber SandsElectric wire, cable
Bicycles RiceGarments
Hij = 100 *1
2Xij
Xj1n
1n
�i( )

106
Cambodia: Diversifying Beyond Garments and Tourism Country Diagnostic Study
garments leaves the economy vulnerable to single-sector demand and supply shocks. Its vulnerability was evident during the global financial crisis, when export demand slumped, pushing the economy to near zero growth. Although the economy recovered quickly, the experience underlined the importance of developing other industries and a broader range of export destinations. Moreover, the reliance on tariff preferences makes Cambodia vulnerable should it cease to be eligible for them, raising the specter of quickly losing competitiveness with other exporting countries. The experiences of Fiji, Mauritius, and some Caribbean countries offer valuable lessons in this regard. These countries lost market access for garments (and other products including sugar) due to reduced tariff preferences, resulting in a significant decline in their exports and the need to expand other sectors, such as tourism, and to develop new ones.
Although garments continue to dominate Cambodia’s exports, production and exports have diversified somewhat in recent years, led by primary commodities, such as rice and rubber, and light manufactured goods, including automobile and electronics components. For example, bicycles are now Cambodia’s second largest export item. One factor contributing to this diversification is
Cambodia’s location next to Thailand, a major producer of trucks, cars, disk drives, and other electronic components. Cambodia exported 467 products in 2013, up from 386 a decade earlier.
Another measure of product diversification and export competitiveness is revealed comparative advantage (RCA).39 Cambodia’s RCA indicates a positive outlook. The number of goods with an RCA greater than 1, indicating a comparative advantage in the product, rose from 52 to 63 in the decade to 2013 (Figure 4.3). A little less than half (25) of these products are in the garment sector, 11 are agriculture-based, and 4 are wood-based. Cambodia is specialized in only eight “core products” (salts of inorganic acids; lead alloys; electric generators and metal foundry equipment; electric wire; ships, boats and other vessels; optical instruments; and bicycles) despite the recent progress. Core products are defined as those in the general product groups of machinery, metal, and chemicals, and are based on production capabilities that are similar to those needed to produce a wide range of other products.
Cambodia’s short, sharp slump in 2009 is attributable in part to the lack of diversification in its export markets. Nearly 80% of exports were bound for Canada, the European Union, and the United States in 2011 (Table 4.2). Although these regions offer preferential trade access, they are also among the slowest growing markets in the world, with their long-term growth prospects slower than Asia’s. A rebalancing of trade toward Asia will provide more stability for Cambodia if demand slumps in these markets.
Cambodia is already starting to diversify away from these markets and is doing so fairly rapidly. The 80% share of exports to Canada, the European Union, and the United States in 2011 was down from 92% only 4 years earlier. Much of this is due to a shift to Asia—exports to the People’s Republic of China (PRC), Japan, the Republic of Korea, and
39 The RCA is the ratio of a product’s share in a country’s total exports relative to the share of that country’s total exports in global exports. An RCA above 1 suggests that the country has a comparative advantage in that product. See Appendix 4.2 for further discussion on RCA.
Figure 4.2. Index of Export Concentration in ASEAN Countries, 2013
ASEAN = Association of Southeast Asian Nations, Lao PDR = Lao People’s Democratic Republic.Note: The ASEAN figure excludes Brunei Darussalam and Singapore.Source: Estimates based on datasets from UN Comtrade, accessed April 2013.
0 5 10 15 302520 35 40
Cambodia
Philippines
Malaysia
Viet Nam
Indonesia
Thailand
ASEAN
Lao PDR
Myanmar

107
4. Diversification and Upgrading
notably through the creation of the ASEAN Economic Community by 2015, are also supporting intensification of intraregional trade.
4.1.1. Tourism and Other SectorsThe economy remains heavily specialized in the four pillars of garments, tourism, rice, and construction. There is, however, evidence of some diversification in goods production and exports, and some diversification in market destinations, with increased shipments to Asian markets and reduced reliance on Western countries and tourists. Growth in tourism, rice production, and construction is helping reduce reliance on garments. However, a closer look reveals a general lack of diversification within these nonmanufacturing subsectors.
In tourism, Cambodia’s main attraction is Angkor Wat. Direct international flights connect Siem Reap to other countries in the region and a dense tourism industry with hotels, restaurants, tours, cultural sites, and crafts has developed around the temple complex. Although Angkor Wat is by far the country’s biggest tourist draw, which also highlights the sector’s lack of diversification, other areas are starting to develop. The three other main tourist zones are Phnom Penh; the beach and island leisure areas of Kampot, Koh Kong, and Sihanoukville to
the 10 ASEAN countries increased from 7% to 15% of total exports in the same period. The increased intraregional trade is explained in part by rising agriculture exports to neighboring countries and by an increase in trade through regional production networks. Lower barriers to trade and investment and increased connectivity within the subregion,
Figure 4.3. Number of Products with Revealed Comparative Advantage, 1991–2013 (%)
RCA = revealed comparative advantage.Note: Core products include machinery, metals, and chemicals.Source: Calculations based datasets from UN Comtrade, accessed June 2014.
Table 4.2. Destinations of Cambodia’s Exports, 2007 and 2011
ASEAN = Association of Southeast Asian Nations.Note: “All other” are mainly shipments to European destinations that are not members of the European Union and to Latin America.Source: Ministry of Commerce (2014).
500 150100 200 250 300 350 400 450
20138 63
4044 61
583
4
3
4
2
49
52
60
3688
265
334
353
407
4252012
2011
2006
2001
1996
1991
Core products Exported products with RCA>1 Exported products with RCA<1
Destination Destination as % of Total2007 2011
United States 64 41European Union 23 30ASEAN 5 8 (of which: Thailand and Viet Nam)
(3) (6)
Canada 5 8Japan 1 3China, People’s Republic of <1 3Korea, Republic of <1 1Other Asia and Pacific <1 <1All other 3 6
Total Goods Exports$ million 2,962 5,122

108
Cambodia: Diversifying Beyond Garments and Tourism Country Diagnostic Study
the southwest; and the mountainous northeast provinces of Mondulkiri and Rattanakiri, which are being promoted for ecotourism. The focus on developing these destinations is to make their attractions more accessible and increase the quality of local services. A fifth area of development is Tonle Sap, the largest lake in Southeast Asia and an environmentally attractive area for both domestic tourists and international ecotourists.
Siem Reap drew 53% of the 4.2 million international tourists in 2013 (Ministry of Tourism 2013), up from 46% just 4 years earlier, indicating an increased focus on the Angkor Wat temple site rather than diversification to other destinations. And the country of origin of arriving visitors is increasingly concentrated, with the top five accounting for 57% of total arrivals in 2013, up from 43% in 2007. Japan and the United States have slipped out of the top five, which now includes only Asian countries: the PRC, the Republic of Korea, the Lao People’s Democratic Republic, Thailand, and Viet Nam. An expanding Asian middle class with more money and leisure time to travel is driving this trend.
As noted earlier, rice dominates farming and its share of the agriculture sector is expanding, from just above 40% in 1995 to 54% in 2010, with reduced shares for the three other subsectors (forestry and logging, fisheries, and livestock and poultry). Within the farm subsector, output of paddy (unmilled rice) has continued to rise, but its share in total crop output is declining gradually as production of other crops, notably cassava, increases at a faster rate. The share of rice in total crop output fell from 66% in 2006 to 57% in 2006–2010.
4.1.2. Sophistication of ProductionAlthough production volumes and revenues have increased across all sectors since the mid-1990s, sophistication of production has shown only minimal development. Cambodia has grown at the extensive margin (producing more of the same goods and services) rather than the intensive margin (producing higher value goods and services).
More garment factories, increased rice and cassava production, and more tourists to Siem Reap have added to output. But the economy’s productive capabilities—based on an efficient combination of adapted technology, advanced workforce skills, and improved management techniques—have grown less rapidly. There has been limited movement up the value chain. Nevertheless, new investments in making more complex goods have increased somewhat, as Cambodia begins its integration in nongarment value chains.
Gauging the overall sophistication of an economy is not easy and cannot be done through one simple indicator. However, the recent development of techniques based on detailed export data has helped to provide aggregate indicators that proxy for underlying productive capabilities. Briefly explained, these techniques gauge the sophistication of individual products based on the income level of countries that are successful in exporting them. The assumption is that higher-income countries export the more sophisticated goods. These scores (known as PRODY) for individual goods are then applied to the export basket of a particular country to generate an aggregate sophistication score (called EXPY). A higher score indicates a more sophisticated export basket and greater productive capabilities40 (see Appendix 4.1 for further discussion of PRODY and EXPY).
Based on this measure, Cambodia’s overall export sophistication is slightly above the Lao People’s Democratic Republic’s and Myanmar’s (the export baskets of which are more resource based), but lower than Viet Nam’s (Figure 4.4). This may not be surprising given that other Southeast Asian countries—for example, Singapore, Thailand,
40 See Hausmann et al. (2007). In more technical terms, a product’s sophistication can be measured by the PRODY index, which is the average exporting countries’ gross domestic product per capita weighted by each country’s revealed comparative advantage for the exported commodity. The sophistication of a country’s export basket can then be measured by EXPY, which is the weighted sum of the PRODY values of all the products that a country exports, with the weights being the share of each commodity in the country’s total exports. Sophistication captures the income content of a country’s export basket. A higher value of EXPY indicates that the country has acquired complex capabilities that make it easier to export sophisticated products.

109
4. Diversification and Upgrading
and even Viet Nam—are known to export a range of more complex goods. More revealing—and a greater concern—is that Cambodia’s overall score has been virtually constant since 1999. In contrast, Viet Nam’s score has been rising as a result of its movement into more complex products, including synthetic fabrics, electronics, and light machinery.
Exports can be further broken down into five levels (or quintiles) of sophistication. This reveals that about 98% of Cambodian exports are in the two lowest quintiles (Figure 4.5). However, the share of
products in the lowest quintile has decreased since the late 1990s, and the number of products in the second-lowest quintile has increased, suggesting that upgrading is occurring.
About 97% of Cambodian exports belong to PRODY groups 4 and 5 (products that are least sophisticated), comparable to the Lao People’s Democratic Republic’s and Myanmar’s, while the rest of Southeast Asia’s exports are more concentrated in the upper levels of sophistication (Figure 4.6). For example, in Viet Nam only about
Figure 4.4. Trend in Export Sophistication (EXPY), Selected ASEAN Countries, 1990–2013
ASEAN = Association of Southeast Asian Nations, Lao PDR = Lao People’s Democratic Republic.Source: Estimates based on datasets from UN Comtrade, accessed June 2014.
Figure 4.5. Disaggregation of Cambodia’s Exports by PRODY Group, 1989–2013 (% of total)
Note: Groups 1–5 refer to the quintiles of the PRODY distribution. Group 1 refers to the topmost quintile and Group 5 to the bottommost quintile. For each period, average shares are shown.Source: Estimates based on datasets from UN Comtrade, accessed April 2013.
Cambodia Lao PDR
1990 1993 1996 1999 2002 2005 2008 2011 20134,000
8,000
6,000
10,000
12,000
14,000
16,000
Myanmar Viet NamEX
PY
Group 4: 12,800 > PRODY � 8,200
Group 1: PRODY > 21,500
0% 10% 20% 30% 60%50%40% 70% 80% 90% 100%
2010–2013
2005–2009
2000–2004
1995–1999
1990–1994
Group 5: PRODY < 8,200
Group 2: 21,500 > PRODY � 17,300 Group 3: 17,300 > PRODY � 12,800

110
Cambodia: Diversifying Beyond Garments and Tourism Country Diagnostic Study
half of export products (52%) are within the two lower quintiles, and in the Philippines the share is even lower, at 26%.
4.2. Into Which Products Can Cambodia Diversify?
The Cambodian economy would clearly benefit from diversification, but into which new products and services should it expand? This question is best answered on the basis of three guiding principles—set out in the following section—supported by detailed product analysis.
4.2.1. Principles for Product DiversificationThe first principle is that government should be wary of picking winners because it may not provide good information about which products can become competitive. The private sector normally has better information and will ultimately make
the investments. This might seem obvious, but the developing world is littered with industrial “white elephants” in which governments have pushed a vision of industrialization (for example, steel mills and vehicles) that is out of sync with productive capabilities. Governments have created state-owned firms that are uncompetitive and maintained trade protection or production subsidies to keep inefficient local firms and industries afloat. The best approach is to ensure that goals are realistic, based on sound information, and chosen in consultation with the private sector.
The second principle is that an increase in diversification requires the accumulation of new capabilities. These capabilities might include labor with sector-specific skills; transport and logistics services versed in moving specific types of goods, such as bulk and refrigerated commodities; government regulation, such as phytosanitary standards and testing for food products; and clusters of suppliers and supporting businesses. When a country has a fairly large set of capabilities, it can quite easily add new sectors to its product portfolio by adapting existing capabilities.
Figure 4.6. Disaggregation of Exports by PRODY Group, Selected ASEAN Countries, Average 2010–2013 (% of total)
ASEAN = Association of Southeast Asian Nations, Lao PDR = Lao People’s Democratic Republic.Note: Groups 1–5 refer to the quintiles of the PRODY distribution. Group 1 refers to the topmost quintile and Group 5 to the bottommost quintile. Source: Estimates based on datasets from UN Comtrade, accessed June 2014.
Group 4: 12,800 > PRODY � 8,200
Group 1: PRODY > 21,500
0 10 20 30 605040 70 80 90 100
Cambodia
Indonesia
Lao PDR
Myanmar
Philippines
Thailand
Viet Nam
Group 5: PRODY < 8,200
Group 2: 21,500 > PRODY � 17,300 Group 3: 17,300 > PRODY � 12,800

111
4. Diversification and Upgrading
The third principle is that goods differ in their value addition and in the extent to which they are connected to other goods. Goods that are closely connected to a greater number of other goods are more likely to generate further diversification than those that are not. Research based on “product space” analysis suggests that higher-value goods tend to be “closer” to the range of other goods than lower-value goods, thus allowing for further diversification.
Product space analysis can provide governments with pointers to the goods to promote as part of diversification. Product space is based on export data but, unfortunately, does not cover services. Figure 4.7 shows Cambodia’s product space map, along with Viet Nam’s. Both countries have similar endowments but their manufacturing and exports
followed different paths. The bold dots indicate the 53 goods in which Cambodia had an RCA greater than 1 in 2011. The grey dots represent the full range of all goods produced in the world. The concentration of red dots in the central-left space is the garment and footwear cluster; the other red dots are scattered on the periphery of the product space. This arrangement implies three things. First, there is no second cluster that might serve as the basis for further development. Second, the nongarment products in which Cambodia does have a comparative advantage are not well connected—that is, “close”—to other potential products. This implies that the capabilities needed for Cambodia’s current group of competitive goods are not those needed for most other goods. Diversification will therefore be difficult. Third, the country has no competitive products in the central
Figure 4.7. Product Space Cambodia and Viet Nam
Source: ADB estimates.
Cambodia
Cambodia is not very diversified, with a thinly populated product space map. The garments grouping on the left side is the only densely populated area.
Viet Nam
Viet Nam’s populated product space map shows greater diversification and reflects greater export capacity. Viet Nam exports a number of products that have higher value added, have more dense linkages, and are closer to the center of the product space.

112
Cambodia: Diversifying Beyond Garments and Tourism Country Diagnostic Study
dense area of the map where there are many close-by products that tend to be of higher value than goods at the periphery. This implies that not only will diversification be difficult but so, too, will be moving into higher-value goods.
The comparison with Viet Nam is instructive. Viet Nam not only has more goods with RCA > 1, but also more goods closer to the central space of high-value, well-connected goods. Like Cambodia, Viet Nam has a competitive garments cluster (blue dots in the central-left space), but it also has emerging clusters in electronics (lower right), textiles (below garments), and wood and furniture (above right of the central space). Viet Nam has a more diverse product range and greater opportunities for further diversification.
4.2.2. Products of Rising, Declining, and Stable Revealed Comparative Advantage The foregoing product space analysis provides some idea of the difficulty Cambodia faces in diversifying, but little information on which areas to diversify into. To determine this, the goods that Cambodia exports and the changes in the pattern of exports over 2 decades are analyzed.
Cambodia exported 587 products during 1992–2011. Many of these products were exported briefly or intermittently, and their values were low; thus, goods with annual exports below $200,000 were excluded from the analysis.41 This reduced the number of products to 147. These were grouped into four categories based on their RCA and change between the periods 1992–1995 and 2009–2011. Two of the categories included strong performers: “classics” that have sustained competitiveness, with RCA > 1 in both periods, and “emerging” products, which show increasing competitiveness from an RCA < 1 in the first period to RCA > 1 in the second period. The two other categories of products were
41 The criterion is imposed on classic, emerging, and marginal products for 2009–2011 and on disappearing products for 1992–1995.
less competitive. “Disappearing” products lost competitiveness, with the RCA falling from greater than 1 in the first period to less than 1 in the second period, whereas “marginal” products had an RCA < 1 in both periods (Figure 4.8). The full list of products and their categorization is provided in Appendix 4.2. The analysis shows, first, that Cambodia has 27 classic products, of which more than half (15) are types of garments and the others include rice, rubber, and wood (four products); cashews; and sesame seeds. These products are competitive internationally and generate export earnings, and are hence important for the economy.
In addition, Cambodia has 29 emerging products, several of which have been at the forefront of the recent diversification. These include bicycles, footwear, plywood, maize, vegetables, sand, sugar, palm oil, and 11 types of garments. All have become competitive and provide opportunities for future growth and diversification. Bicycles in particular are shaping up to be an important growth industry (Box 4.1, p. 104). This presents the prospects of developing a cluster around which the parts and supporting industries can develop. Footwear is a natural companion industry to garments, providing for a fairly easy transfer of skills and related production capabilities.
Eight products are classified as disappearing. Several of them have not fully disappeared and are still produced and exported, but have slipped from having an RCA > 1 to < 1. One example is soybeans: the RCA fell below 1 but exports have increased, which might be explained by the sharp rise in world demand for soybeans. The other disappearances are a mixed bag and include mostly agricultural products, including two types of fish, certain cereals, and raw cotton. Except for the product “fresh or chilled fish (excluding fillets),” export values of the disappearing group in the early 1990s were fairly small. The 83 marginals are the most interesting and varied. Most of these products fall under light manufacturing and include machinery, metallurgy, chemicals, and furniture (Appendix 4.2). These are the products that Cambodia can develop to

113
4. Diversification and Upgrading
supplement its traditional garments and farm-based products. Many of the marginal products exhibit three characteristics that are important to the discussion of diversification and upgrading. First, they are not close to the classic products in Cambodia’s export basket. The capabilities needed to produce these products may not be readily transferred from the garments and agriculture sectors. Figure 4.8 well illustrates the disconnect between classics and marginals. This shows garment sector products clustered in a small area at the left of the product space, whereas the marginals are scattered in the center of the product space. This presents a challenge and requires extra effort to build capabilities in the marginal products’ areas.
However, the same product space maps in Figure 4.9 illustrate the second key characteristic of the marginals—their concentration in the main area of the product space implies a closer relationship to
a broader array of other products and to products of higher value. More centrally located in the product space, marginals could become strategic bets. If Cambodia could strengthen its capability to produce these marginal products, it could diversify even more, creating a diversification snowball effect. This is in contrast to the garments sector, which is a more self-contained cluster without close links to other product groups (excluding footwear).
The third characteristic of the marginals is that they exhibit higher sophistication than the current export basket. This strengthens the case for their strategic value. Because diversification is often viewed as path-dependent (meaning that technological innovation is subject to the accumulation of capabilities), building capacity in these products would not only help diversify the economy, but also raise the value of output. Producing goods that are located in a densely
Figure 4.8. Cambodia‘s Classic, Disappearing, Marginal, and Emerging Products
RCA = revealed comparative advantage.Notes: RCA = 0 implies either no exports or very low exports. Products that have potential may have RCA < 1, particularly if the product is in the marginal group. However, RCA analysis is insufficient for determining whether a product has potential for export.Source: Record and Nghardsaysone (2010).
Classic products—RCA in the starting and end periods were high
Policy implication: long-term competitiveness, strong export performance that should be maintained
1992–1995: RCA � 12009–2011: RCA � 1
Disappearing products—RCA was high in the starting period but low in the end period Policy implication: declining competitiveness, leave such products alone
1992–1995: RCA � 12009–2011: RCA < 1
Marginal products—RCA in the starting and end periods were low
Policy implication: such products may have potential and may be encouraged
1992–1995: RCA < 12009–2011: RCA < 1
Emerging products—RCA was low in the starting period but high in the end period
Policy implication: build on these new product discoveries, which show emerging competitiveness
1992–1995: RCA < 12009–2011: RCA � 1

114
Cambodia: Diversifying Beyond Garments and Tourism Country Diagnostic Study
Figure 4.9. Cambodia’s Product Space Map: Classic, Emerging, Disappearing, and Marginal Products
Source: ADB estimates.
Classic productsWood products Cashew nutsRice GarmentsRubber
Emerging productsWood products MaizeLight manufacturing CassavaFootwear Garments
Disappearing productsFisherySoya beans
Marginal prioductsLight manufacturing VegetablesWood products GarmentsFishery Rice

115
4. Diversification and Upgrading
distributed area of the product space—in other words, there are many nearby products—offers a better chance of diversification. To gauge this potential, “path” can be measured based on the sum of a product’s proximity to all other products (see Appendix 4.1 for further discussion of proximity and path). In Figure 4.10, the marginals are represented by triangles and located mostly in the top three quintiles of production sophistication (Groups 1–3). This contrasts with the classics, which are represented as circles and concentrated in the two lowest quintiles (Groups 4–5). Figure 4.10 also shows that a number of marginal products fall in the “high path” area, which means they have close connections to a large number of other products that are or might be produced. Twenty-two products have high paths and are in the top two groups of product sophistication. These products are varied and include plastic and metal packing containers; switches and relays; nuts, bolts, and nails; other metal products; paper; tires; and candles. They are products that Cambodia is currently producing and could gain a comparative advantage in. Similarly, Figure 4.11 illustrates how Cambodia’s products are
distributed across different levels of sophistication and diversification paths, using products weighted by their export volumes. Many of Cambodia exports are in the middle path and have lower levels of product sophistication, as shown by the large red circles.
4.3. Policies for Diversification and UpgradingThe government is well aware of the need to diversify and upgrade the country’s exports. As a result, the policy emphasis has shifted to the more strategic question of how the government can encourage product diversification and value addition through policy instruments and programs, working with the private sector, and amid increased regional integration. An equally important question is: Which new subsectors should be encouraged and which current products and services have the greatest potential for upgrading?
Figure 4.10. Unweighted Plots of Product Technological Sophistication (PRODY) against the Path, 2009–2011
Note: Groupings are the PRODY quintiles. Groups 1–5 refer to the quintiles of the PRODY distribution. Group 1 refers to the topmost quintile and Group 5 refers to the bottommost quintile. Low, middle and high path are the path’s tercile. Source: Estimates based on datasets from UN Comtrade, accessed April 2013.
Classics
Group 1
Low path Middle path High path
Group 2
Group 3
Group 4
Group 5
Disappearances Marginals Emerging EXPY
0 10050 150 200
40,000
30,000
20,000
10,000
0
PRO
DY
Path

116
Cambodia: Diversifying Beyond Garments and Tourism Country Diagnostic Study
The development of specific product sectors should be consistent with both the economy’s strengths and potential. The product space analysis suggests that Cambodia reveals strengths mainly in its classic and emerging products. But it is interesting to see many of its marginal products also show good potential for future diversification. These lie at the core of the product space and therefore once Cambodia establishes capabilities in these products, even greater diversification is likely. In addition, these products exhibit greater sophistication and value addition than the country’s current basket of products. Developing marginal products can help Cambodia move beyond low-wage, low-value production.
The challenge is how to develop capabilities to fully support the development of these emerging and marginal products. New sectors require new skill sets, which require dynamic coordination by government and industry to upgrade the workforce so that it has
the specific skills needed to make emerging sectors successful. The development of capabilities in other areas is also needed, including a more reliable and low-cost power supply, and improvements in logistics and transport networks to move supplies, components, and finished goods between firms and into and out of the country. Effective testing and certification facilities, for precision metal, plastics, and electronics production, and for high-value food products, are also an important requirement.
4.3.1. Recognition of Importance
The Rectangular Strategy for Growth, Employment, Equity, and Efficiency Phase III, approved in 2013, notes that “economic diversification remains limited” and the country should focus on “promoting investments in modern and high-value-added industrial sectors aimed at upgrading the
Figure 4.11. Weighted Plots of Product Technological Sophistication (PRODY) against the Scope for Further Diversification, 2009–2011
Note: Products are weighted by the average export value in $ million during 2009–2011. Groups 1–5 refer to the quintiles of the PRODY distribution. Group 1 refers to the topmost quintile and Group 5 refers to the bottommost quintile. Low, middle and high path are the path’s tercile.Source: Estimates based on datasets from UN Comtrade Database, accessed April 2013.
Classics
Group 1
Low path Middle path High path
Group 2
Group 3
Group 4
Group 5
Disappearances Marginals Emerging
0 10050 150 200
40,000
30,000
20,000
10,000
0
PRO
DY
Path
EXPY

117
4. Diversification and Upgrading
diversification of the manufacturing base” (RGC n.d.b). The strategy also recognizes the need for higher value and a more diverse range of products in agriculture, focusing on increased processing, such as milling paddy into rice, and raising the output of other products, including rubber, cashew nuts, maize, and beans.
Aside from statements in planning documents, Cambodia does not have an approved industrial policy, master plan, or strategic plan (and the Industrial Development Action Plan 1998–2003, has lapsed). There are, however, policies and plans for the development of specific sectors. The most notable is the Policy on the Promotion of Paddy Production and Rice Exports, an industrial policy to promote production, processing, and export of rice (discussed in Chapter 1, section 1.8.1). The Tourism Master Plan is the other main example of sector strategic planning.
In 2011, the Supreme National Economic Council issued a working paper titled Enhancing Fiscal Reform and the Counter Cyclical Aspects of Fiscal Policy in Cambodia to stimulate thinking on the development of such an industrial policy (RGC 2011b). The paper generated considerable interest and was the basis for discussions and seminars with stakeholders, including development partners. It discusses possibilities for industrialization and the role of the government in that process, and it explores developing forward linkages in agriculture (processing), backward linkages in garments and footwear, and further diversification of tourism. The paper recognizes the economic potential of a number of emerging or revitalized industries, including furniture, paper, handicrafts and creative industries, construction materials, household appliances, and oil and gas. It also envisions the government encouraging diversification by deepening the financial sector, improving public finance, promoting savings, and providing key public goods in human resource development and infrastructure. Other pro-industry policies that could aid diversification include procurement and tax policies, the trade regime, the development of special economic zones (SEZs), and standards setting.
In late 2013, the government prepared the Industrial Development Policy 2014–2018, but has not released it for public circulation.42 The policy maps out an industrial policy strategy and includes key areas for support, targets for investment and exports, and an institutional structure with implementation arrangements to promote the policy.43 With this document, the government is moving toward a single, codified industrial policy and supporting institutional arrangements.
4.3.2. Institutional StructureEven without a specific industrial policy in place, the government has sought to promote industrial development through various institutional arrangements and promotion programs. Combined, these constitute a de facto industrial policy and industrial policy setting apparatus.
This process is headed by the Private Sector Development Steering Committee, chaired by the Minister for Economy and Finance, with the Minister of Commerce as vice-chair and other line ministries as members. The committee has subcommittees on the development of small and medium-sized enterprises (SMEs), public–private infrastructure and investment, and trade facilitation and development. The committee provides a forum for donors and development agencies to discuss development policies and reforms with the government. Similarly, the Government–Private Sector Forum enables the private sector to provide inputs on government policy through semiannual meetings chaired by the prime minister and through more regular meetings of eight working groups. This forum provides some level of accountability to policy because it links government with the private sector.
Specific responsibility for industrial policy lies with the General Department of Industry within 42 It is referred to in the Rectangular Strategy Phase III as one of the
policies, along with Vision 2030, set for approval in the coming term of the fifth National Assembly covering 2014–2018.
43 Because the document is not for public circulation, we are prevented from further discussion of its contents.

118
Cambodia: Diversifying Beyond Garments and Tourism Country Diagnostic Study
the Ministry of Industry, Mines, and Energy. The department is responsible for regulating manufacturing, developing industrial strategies, and formulating and implementing policy. Because many of Cambodia’s industrial firms are small, the department also has a role in policies supporting SMEs and provides the secretariat to the government’s SME subcommittee. A draft concept paper outlines the department’s Strategic Framework for 2010–2015, but this is for internal use and not part of official policy. It states that the General Department of Industry “will focus all its activities and operation on two key strategic plans for industry sector development: Cambodia’s comparative advantages and human development with industry growth, and eco-friendly and socially responsible industry growth.” However, there appears to be very little in the way of specific actionable plans.
The ministry’s ability to promote industry is limited by its budget, which is one of the smallest within the government (Smiddy 2012).44 Similarly, capital expenditure for industry policies is small. Industry policies and programs fall under the “manufacturing, mining, and trade” component of the government capital expenditure budget—one of the economic sectors of government spending. This component accounts for less than 5% of total spending (equivalent to $50 million per year over 5 years).
Another important body is the Council for the Development of Cambodia (CDC) and its operational bodies, the Cambodian Investment Board (CIB) and the Cambodian Special Economic Zones Board. These promote investment, including foreign investment, and oversee and implement the government’s key investment incentive scheme—the Qualified Investment Projects (QIPs)—and oversee SEZs and incentives related to them (discussed in section 4.3.4 on specific policies and programs). The CDC, chaired by the prime minister with the vice-chairs comprising the minister of the 44 For example, its 2009 recurrent budget of approximately $4 million
was only larger than the budgets for the Civil Service Secretariat, Council for the Development of Cambodia, Relations Assembly and Inspections, National Election Committee, National Audit Authority, Ministry for Public Worship and Religion, and Civil Aviation Secretariat.
economy and finance and the minister of commerce, has access to the highest levels of government.
Cambodia relies on development partners to fund much of its capital expenditure, including a number of programs relating to industrial policy. Donor programs work with the government and many are implemented by line ministries. Given that industrial policy cuts across sectors and issues, support for diversification and upgrading is implemented by other ministries touching on areas such as commerce, infrastructure, tourism, health, education, rural development, planning, and customs and taxation.
4.3.3. De Facto Policy Cambodia’s de facto policy for diversification and upgrading is contained in the specific measures and programs that the government has put in place. The development of new industries, especially in higher-value market segments, is inherently risky. Entrepreneurs and investors may be reluctant to move into these areas for fear of not becoming competitive. The purpose of industrial policy is to support and encourage investors to make those investments by reducing some of the risk, providing information about markets, helping to manage the cost structure, and securing the necessary inputs.
The experiences of advanced economies, including those in Asia that have recently industrialized, suggest a number of things that government can do. At the center, effective promotion requires leadership and sustained commitment at the highest levels of government (Box 4.2). As noted in Table 4.3, assistance could be provided in seven areas—from fiscal and financial incentives and building basic infrastructure and human capital, to facilitating trade and advancing technology and research and development (R&D). Cambodia’s key incentive is a fiscal one (a profit tax exemption) and its main supporting mechanisms are export processing zones and improved trade facilitation. Infrastructure and human capital improvements are part of the government’s more generic

119
4. Diversification and Upgrading
development policies but remain weak, as noted in Chapters 2 and 3. Human capital has not been particularly aligned with industrial development and diversification. Furthermore, there is little in the way of financial programs to support advances in competitiveness, such as the low-cost credit given to successful exporters by the Republic of Korea and Taipei,China. Cambodia does not have an industrial development bank or a public SME bank, and it lacks credit guarantee mechanisms. Support for the development of technology and the promotion of R&D is at a rudimentary stage. Thus, Cambodia has some of the basic components of an effective industrial policy but not a full structure. Furthermore, as Cambodia adds programs, it could consider the merits of having a monitoring and assessment framework to see that its mechanisms are effective. The rice policy is a good example of an area in which Cambodia has attempted to
provide broad, balanced, and concerted support for a target industry. That policy and some of the other programs are discussed in the following section.
4.3.4. Specific Policies and ProgramsPolicy on the Promotion of Paddy Production and Rice Exports. This is a frontrunner in sectoral industrial policy. As rice is a major crop, the government is picking a known winner and seeking to expand production and exports of milled rice. Cambodia is starting to become a rice basket and a key exporter in the global market. The government has focused on a particular commodity instead of the agriculture sector as a whole because “working on too many products at the same time will overstretch our limited resources and capacity,
Cambodia needs a high-level body or steering committee to provide direction and support for the components of industrial policy, particularly for fiscal incentives, infrastructure, export promotion and facilitation, financial support and incentives, public procurement, human capital, technology, and research and development. Figure B4.2. shows a possible structure for a high-level body to undertake these tasks.
Progress toward achieving these aims needs to be monitored, impacts assessed, and the results fed back into the program processes.
Box 4.2. Institutional Mechanisms for Industrial Policy
Figure B4.2. Leadership and Coordination: High-Level Body or Steering Committee
Source: ADB.
Components of Industrial Policy
1. Fiscal incentives2. Infrastructure3. Export promotion and facilitation4. Financial support and incentives5. Public procurement6. Human capital7. Technology and research and development
Monitoring, assessment, and evaluation

120
Cambodia: Diversifying Beyond Garments and Tourism Country Diagnostic Study
Source: ADB assessment.
Policy Component Mechanisms and ExamplesGeneral Cambodia
Fiscal Incentives Tax exemptions or reduced rates are used to encourage foreign or domestic investment, especially if targeted to new or “pioneer” sectors. They are easy to administer because no money changes hands, but it is important to screen legitimate applications. They can be wasteful to the treasury if firms would invest without this incentive.
Profit tax exemption up to 6 years is the main industrial policy mechanism.
Infrastructure Moving goods, people, data, and information efficiently is critical for market development, connecting suppliers, factories, and customers. Rapid expansion of infrastructure helped countries in East Asia, but poor infrastructure constrains South Asia. Facilities may be sector specific, such as refrigerated storage.
Developing all areas, with weaknesses remaining. Not sector specific.
Export Promotion and Trade Facilitation
Export promotion encourages producers to break into new markets by understanding quality and price standards and procedures, and behind-the-border barriers. Specific goods will have unique barriers in customs procedures, so that trade associations have a role in advising governments.
Recent programs funded by donors. Reforms have improved procedures in main sectors (rice, garments).
Financial Support and Incentives
Credit constraints may hamper enterprise development. Governments provide access and/or subsidize credit directly through state banks or indirectly through private banks. Credit guarantees can be effective. Linking access to performance criteria, such as exports, was used effectively in East Asia. Public industrial and small and medium-sized enterprise (SME) development banks should be managed on commercial principles to avoid loan losses. The promotion of a venture capital market can provide finance for innovative startups.
Lack of financial programs or institutions for industry. Rural Development Bank provides some support to SMEs.
Public Procurement Advanced economies continue to use public procurement to encourage innovation, including contracts to the defense sector. Procurement is also used to develop SMEs. Competitive bidding domestically is needed to reward efficiency.
No specific program.
Human Capital Strong basic education and market-relevant technical and professional education are key ingredients of success in all countries. Some models stress apprenticeships; others, on-the-job training and/or pre-employment education. To avoid skills mismatch, training should target employers’ needs.
Improved enrollment and quality at secondary level needed. No sector-specific training (for example, no training institute for garment subsectors).
Technology and Research and Development
Investing in basic and applied research through universities and public institutions will raise the country’s technology level. But, without strong links to business, the results might not lead to commercialization. Research by firms can be encouraged through matching grants and fiscal incentives. Low barriers to importing machinery and licensing foreign technology can help firms to move to the global technological frontier. Encouraging technological spillover from large foreign firms to domestic SMEs is difficult.
No specific program.
Table 4.3. Industrial Policy Components: Mechanisms and Examples

121
4. Diversification and Upgrading
which could lead ultimately to ineffectiveness and inefficiency” (RGC n.d.a). Other crops are to be the subject of similar focused policies in the future.
The rice policy provides a coordinated approach to the sector with involvement at the highest level of government. All ministries and agencies involved in implementing the policy report their activities to the Prime Minister. The Agricultural Produce Export Promotion Committee, led by the Ministry of Agriculture, Forestry, and Fisheries and the Ministry of Commerce, is responsible for overall coordination and serves as a secretariat to the Prime Minister in implementing the policy. The Ministry of Economy and Finance and the National Bank of Cambodia also have a role in key aspects of the policy involving financing. In particular, millers need working capital to pay farmers for paddy before generating revenues from the sale of rice. The main elements of the policy are provided in Box 4.3.
The government intends to provide the same special treatment to the National Cambodian Rice Millers Association, the main industry body, as it has to the Garment Manufacturers Association of
Cambodia. The latter was effective in its dialogue with the government on regulatory improvements to facilitate the expansion of the garments industry. The government has indicated that it will give top priority to facilitating the export of milled rice, and that it aims to minimize informal payments and reduce the time required for exporting. There is anecdotal evidence that customs clearance for rice exports has improved significantly since the policy was announced in 2010.
The full benefit of the rice policy has yet to be realized, although the coordinated approach of understanding and tackling bottlenecks in the supply chain seems appropriate. Early export figures are also positive. Exports of milled rice increased dramatically, from 44,000 tons in 2010, the year the policy was implemented, to just below 200,000 tons by 2012 (UN Comtrade Database). This increase is partly the result of favorable international trading arrangements. Both the European Union and the Russian Federation permit duty-free rice imports from Cambodia, but not from its primary competitors. The European Union’s Everything-But-Arms system of tariff preferences was fully
The 17 key elements of the Policy on the Promotion of Paddy Production and Rice Exports (2010) are as follows:
� Increasing investment in and expansion of irrigation facilities
� Promoting the use of water, seed, fertilizers, and appropriate technologies
� Supporting provision of microcredit to rice producers
� Encouraging provision of credit to rice millers� Providing trade finance through the
recapitalization of state-owned financial institutions
� Providing incentives to commercial banks to increase agriculture loan portfolios, including the development of credit guarantee schemes and a risk-sharing facility
� Encouraging construction of bonded warehouses and promoting the use of Phnom Penh Port
� Encouraging private sector investment in paddy processing and milled rice exports
� Streamlining rice export procedures (implementing a single-stop service)
� Improving transport� Eliminating informal fees� Establishing a sound sanitary and phytosanitary
certification system� Establishing a rice market intelligence unit to
explore market opportunities and share market information
� Promoting production technology� Managing soil fertility� Managing water, seeds, and fertilizers � Developing farmer associations
Box 4.3. Key Elements of the Rice Policy
Source: RGC (n.d.a).

122
Cambodia: Diversifying Beyond Garments and Tourism Country Diagnostic Study
applied to rice starting in late 2009. To meet the government target of 1 million tons of rice exports by 2015, improvements are needed in infrastructure, including transit access to Saigon Port via the Mekong River for uncontainerized milled rice, more and bigger mills, an expanded trucking fleet to handle containers efficiently, sufficient “food quality” containers, and adequate port facilities.
Special Economic Zones. Another key government policy is the promotion of SEZs for manufacturers. SEZs have been used successfully in the PRC and elsewhere to attract foreign investment. SEZs provide serviced industrial plots, fiscal incentives, and trade facilitation. In Cambodia, SEZs also provide the services necessary to compensate for investment infrastructure that might be lacking. In particular, SEZs can offer a secure supply of electricity, decent roads within the zone and access to the transport network, and services that help investors process government documents and approval, and facilitate export.
Although 22 SEZs have been approved, only 11 are operating.45 Of the 92 investments in SEZs, most are concentrated in the four main ones—Phnom Penh, Manhattan, Sihanoukville 2, and Tai Seng. Investors in these zones are predominately from the PRC (including Hong Kong, China); Japan; and Taipei,China. Most of these SEZs are owned by investors from these economies, with each zone tending to target tenants from the home economies of investors.
Qualified Investment Projects. Cambodia’s key investment incentive program is the QIP scheme, administered by the CIB. The scheme applies to new investment projects. The main incentive is an exemption from the 20% profit tax for several years (6 years is typically granted). A firm may forego the exemption and elect to use a special depreciation allowance, which is attractive for capital-intensive projects. This allows a deduction of 40% of the value of tangible assets used in production in their year of purchase or the first year of use.
45 The operational SEZs are Dragon King, Goldfame Pak Shun, Kampot, Manhattan (Svay Reing), Neang Kok Koh Kong, Phnom Penh, Poi Pet O’Neang, Sihanoukville Port, Sihanoukville 1, Sihanoukville 2, and Tai Seng Bavet.
The program also promotes exports, as QIPs are exempt from import taxes on inputs used in exports. Production equipment and construction materials are also exempt from import taxes. Export tax exemptions also apply. Furthermore, QIPs receive an investment guarantee involving equal treatment of investors regardless of nationality, protection from nationalization, a guarantee against price controls on the investors’ particular product or service, and no restrictions on remitting foreign exchange abroad.
Trade and Export Market Promotion. The government has sought to promote industrial development by improving trade procedures and promoting exports. Trade procedures have been reformed as part of the country's commitments in joining the World Trade Organization in 2004 and supporting the creation of the ASEAN Economic Community. Cambodia’s trade and export production programs have received significant support from development partners, with two key programs supported by the Asian Development Bank and the World Bank.
The Trade Facilitation and Competitiveness Project, 2005–2012 was implemented by the Ministry of Commerce, other key ministries, and the CDC, with funding from the World Bank. Components of the project helped to strengthen trade facilitation, private participation in infrastructure, the environment for foreign investment, and legal transparency. The trade facilitation component focused on establishing an electronic single window integrating all trade facilitation agencies. This included automating customs functions and improving the systems for product clearance. Support was also provided to the CDC and CIB to streamline the approval process for foreign direct investment and enhance the attractiveness of Cambodia as an investment destination by improving the regulatory environment and factor markets. The project supported a range of infrastructure regulatory bodies and line ministries to manage and deliver private–public infrastructure transactions in a fair, transparent, and competitive manner.

123
4. Diversification and Upgrading
The project included the creation of the Export Market Access Fund implemented by the Ministry of Commerce. The fund provides grants and technical advice to help Cambodian companies to increase exports by improving the capacity and knowledge of exporters. The focus is on producing “new results” in export volume to diversify Cambodia’s exports. Matching grants cover 50% of expenditures for companies within the framework of a company-specific export development plan. Beneficiary companies are mainly micro and small enterprises that are first-time exporters and from a range of industries, including agriculture and food processing, fashion, handicrafts, tourism, and information technology.
The Ministry of Commerce, working with other ministries and agencies and with support from the Asian Development Bank, implemented the Promoting Economic Diversification Program in 2008 to improve the investment climate and trade facilitation, along with domestic competition and regulation. With continued improvements in trade policy and customs reforms, the program improved sanitary and phytosanitary systems (SPS) to bring Cambodia up to international standards. The improved SPS system helps food producers to overcome nontariff barriers related to SPS standards. A matching grant component of the program gives companies direct assistance to adopt technology to meet SPS standards, enabling the firms to better penetrate export markets.
4.3.5. Cambodia and the 10 Principles for Industrial PolicyAn effective industrial policy could support Cambodia’s continued structural transformation and diversification into higher value activities—and, as noted, a number of policies and mechanisms are already in place. This section assesses whether the country’s industrial policy apparatus conforms to Rodrik’s (2004) 10 design principles for industrial policy.
(1) Incentives should be provided only to new activities. New is defined as investments in
products or services that are new to a country and have not been previously produced there. Incentives should not be given to traditional sectors because this does not induce diversification.
Cambodia’s main incentive scheme is the corporate tax exemption under the QIP. This applies to all investments, ones that are new in the sense of introducing new products or services to the country as well as “old” activities such as garments and rice. Thus, the QIP scheme does not satisfy this principle and may be wasteful in terms of lost tax revenue and not inducing new industries to establish operations in Cambodia. The scheme could be revised to give the incentive only to new investments or to differentiate the size of the exemption (full or partial) between new and old investments. Some countries, such as Malaysia, have specified a list of frontier industries that are offered special incentives.
(2) Provide clear benchmarks and criteria for success and failure. These criteria are set at the firm level and are the basis for receiving or continuing to receive incentives. Criteria are needed so that such incentives have the intended effect of encouraging performance and ensuring that subsidies are not just a free ride for firms.
Cambodia sets targets at the aggregate level for some sectors (for example, rice exports and tourist arrivals), but has no programs that set benchmarks at the firm level. The QIP scheme sets no criteria for performance. Some economies (such as Chile, the Republic of Korea, and Taipei,China) have tied incentives such as subsidized credit to a firm’s export performance (a good measure of a firm’s competitiveness). Cambodia could consider a similar performance-based scheme, especially targeting nontraditional exports.
(3) A built-in sunset clause is essential. A sunset clause is needed to ensure that firms do not become dependent on incentives, but

124
Cambodia: Diversifying Beyond Garments and Tourism Country Diagnostic Study
wean themselves away from support through improved performance.
The QIP scheme has a built-in sunset clause with its time limit of 3 years, which is normally renewed for an additional 3 years. Therefore, it satisfies the principle. However, an investor can continue to benefit from a QIP by closing down and restarting the same activity as a new investment. The authorities need to ensure that firms are not manipulating the system in this manner. Donors play an important role in financing some of the main QIP schemes. Given that donor programs are for set periods, they have built-in sunset criteria if programs are not renewed by adding phases. The Export Market Access Fund is a case in point, having limited funds and therefore a set timeframe to disperse. The Asian Development Bank’s support for SPS procedures also has limited funds.
(4) Public support must target activities not sectors. Industrial policy support should help overcome market failures. Activities that do so should be the focus of specific programs rather than generally supporting sectors such as tourism or agriculture. If logistics are a problem, infrastructure can be improved; if low technological standards are a bottleneck, incentives to acquire and adapt global technologies would help.
Cambodia has used a mix of approaches. Through the rice policy and the Tourism Master Plan, the government has taken a sector approach, although it has sought to identify barriers into those sectors. At the same time, efforts to improve trade facilitation are activity-focused and broadly benefit a range of sectors. The government has tended to address some market failures, such as infrastructure and trade facilitation, but not others, such as R&D and technology adoption and adaptation.
(5) Activities that are subsidized must have the clear potential of providing spillovers and demonstration effects. The idea is that government efforts should crowd in
complementary investments or generate spillovers in terms of technology or information on what can be a competitive industry in the country. The benefits should not be captured by a single firm. Government support to new R&D and to new industries that have a demonstration effect are examples.
Cambodia might not have any specific examples of this taking place; however, the framework that it put in place to encourage the establishment of SEZs has drawn investment into nontraditional products. These investments have created a substantial information spillover by indicating to other foreign investors that Cambodia can be a profitable place to engage in types of light manufacturing in addition to garments.
(6) The authority for carrying out industrial policies must be vested in agencies with demonstrated competence. The Asian tigers had competent agencies that designed, coordinated, and implemented policy. In Japan, for example, the lead agency was the Ministry of International Trade and Industry; the Republic of Korea and Taipei,China employed a similar developmental state model guided by key agencies.
In Cambodia, such a powerful and central agency has yet to emerge. The Ministry of Industry, Mines, and Energy’s small budget constrains its scope for action. The announcement in late 2013 that the ministry would be split into a Ministry of Industries and Handicraft and a Ministry of Mines and Energy might provide more focus on industrial promotion with specific programs. The CDC (with the CIB and the Cambodian Special Economic Zones Board) is managing the QIP and SEZ promotion programs. It might be useful for the various ministries and councils to be organized with clear focus of responsibilities.
(7) The implementing agencies must be monitored closely by a principal with a clear stake in the outcomes and who has political authority at the highest level. In the Republic

125
4. Diversification and Upgrading
of Korea and other high-growth Asian countries, senior government officials, including the prime minister, took an intense and active interest and involvement in the industrialization process, holding regular, often weekly, meetings.
In Cambodia, the bodies responsible for implementing policy are headed by public officials at the highest levels. The Private Sector Steering Committee is chaired by the Minister of Economy and Finance. The General Department of Industry is accountable to the minister of the Ministry of Industry, Mines, and Energy. Economic development, as a government priority, receives considerable attention.
(8) The agencies carrying out industrial promotion must maintain channels of communication with the private sector. The government needs to understand the business environment and markets to provide realistic support to and coordination with business. The best way to keep in touch is through frequent meetings with the private sector. Countries that have successfully industrialized used such forums, often focused on specific sectors—e.g., automobiles, electronics, and steelmaking—to encourage firms to share information (when possible) about recent developments in products and markets.
Cambodia’s chief vehicle for this is the Government–Private Sector Forum, which is a model for dialogue between public and private sectors in the subregion. The forum holds regular working group meetings of the private sectors and joint public–private meetings, and is thus an effective channel for cooperation and has led to reforms. The government also interacts frequently with the main sectoral business associations, such as the Garment Manufacturers Association of Cambodia. In sum, the channels of public–private communications appear to be well established.
(9) Optimally, mistakes that result in “picking the losers” will occur. Trying to pick winning
sectors means getting it wrong sometimes, with some sectors never able to develop and become competitive. This may cost the government resources, but it is the price to pay for trying. If no losers are picked, the government may be too conservative in its approach.
Cambodia’s limited policy mechanism means that it has not taken much risk in trying to select winners. Instead, it has relied mainly on promoting established sectors. The real challenge will come when and if it attempts to target and promote other light manufacturing activities or processed agricultural products.
(10)Promotion activities need to have the capacity to reinvent themselves, so that the cycle of discovery becomes an ongoing one. The types of interventions that are effective will change over time as a country develops. The private sector becomes stronger—in part by being better able to attract bright minds—and more able to assess market opportunities. The structure of incentives needs to evolve and change. This is the case with developed countries that continue to promote industry, but do so with a more nuanced policy such as credit guarantees, venture capital, and the use of public procurement to encourage innovation (for example, in the defense sector).
Cambodia is in the initial stages of developing an effective industrial policy, which requires a regular assessment of what works, what doesn’t, and what methods can be adopted from successful cases of industrialization elsewhere in the region and the world.
4.4. ConclusionThe economy has diversified somewhat recently, but remains heavily concentrated in four activities—rice, garments, tourism, and construction. Although its intersectoral balance is reasonable, the lack of diversity within manufacturing and services leaves the economy vulnerable to global demand conditions and changes in policy (for example, a

126
Cambodia: Diversifying Beyond Garments and Tourism Country Diagnostic Study
withdrawal of preferential trade access for its main export products).
Diversification is happening to some degree, notably in the last few years, with foreign investors establishing factories to produce products other than garments and farmers growing crops other than rice. The product space analysis revealed 29 emerging products that have become competitive, including bicycles and footwear, the latter being a natural offshoot of the garments sector. Eleven types of garment products also emerged from the analysis, suggesting diversification within the subsector. Other products have developed in the farm and forestry subsectors, including maize, vegetables, sugar, palm oil, and plywood.
Cambodia also produces and exports 83 products classified as “marginal” products. Although they are exported in small quantities, they hold great potential, both because they are at the core of the product space—and therefore require capabilities that can lead to even more diversification—and because they have higher value than the current basket of major exports. The products in this group fall mostly under light manufacturing and include machinery, metallurgy, chemicals, and furniture.
Cambodia faces enormous challenges in upgrading and diversifying its production structure. To attract foreign investment, fiscal incentives can help, but they need to be supported by ongoing improvements in trade facilitation and production facilities (for example, in SEZs). Investors also require access to a skilled workforce, which makes efforts to improve human capital and create vital workplace-relevant skills. The establishment of just a few foreign investments in key subsectors could help not only create a specialized cluster (as Thailand did in automobiles and disk drives), but also provide a signal to other potential investors that Cambodia can be an efficient platform for doing business.
Domestic investors also have an important role to play in the diversification process. Many of them are engaged in the production of marginal products that offer great potential to upgrade into higher value production. These investors require the same support that foreign investors do in trade facilitation, logistics, infrastructure, and human capital. Assistance for accessing improved technology, understanding market opportunities, and meeting standards and certifications is also important to achieving competitiveness against imports and in the export market. Overall, a focused industrial policy and programs for nontraditional production and exports would enhance the diversification and upgrading process.

127
4. Diversification and Upgrading
1. Product Sophistication (PRODY)Sophistication of a product (PRODY) is the income level associated with the products that a country exports. Following, Hausmann, Hwang, and Rodrik (2007), PRODY is calculated as follows:
where xvalci is the export value of product i by country c and GDPPCc the gross domestic product (GDP) per capita of country c. GDP per capita, and therefore PRODY, is measured in 2005 purchasing power parity dollars (PPP$).
2. Export Sophistication (EXPY)The measure of sophistication of a country’s export basket (EXPY) is from Hausmann, Hwang, and Rodrik (2007). It is a weighted average of the sophistication level of the products that a country exports, weights being share in the country’s exports. It is is calculated as follows:
where xvalci is the export value of product i by country c. EXPY is measured in 2005 PPP$.
3. Revealed Comparative Advantage (RCA)Revealed comparative advantage (RCA) is defined, based on Balassa (1965), as:
where xvalci is the value of the exports of country c in the product i. A country c is said to have RCA in export of product i if RCA is larger than one.
4. Proximity and PathProximity: Based on the idea that if every country that exports a product with RCA also exports another product with RCA then these two products must involve similar capabilities. Hidalgo et al. (2007) construct a measure of distance between products based on this outcome measure, which they call the “proximity”. On the other hand, if every country that exports a product does not export another product, then these two products must involve different capabilities. This led to the use of conditional probabilities to measure the similarity between the two products. “Proximity” is measured as the minimum between the probability that countries export product i with RCA given that they already export product j with RCA; and the probability that countries export product j with RCA given that they already export product i with RCA. The reason for taking the minimum of the two probabilities is to create a symmetric measure of distance for a pair of products. Formally, the proximity between products i and j is defined as:
PROXIMITY, �i,j = min {RCAi|RCAj), (RCAj|RCAi)}
where RCA is defined above.
Path: For each product, the strength of the linkages with other products is measured by simply adding up the proximities leading to that product. This index, called “path”, shows which products are in a dense part of the product space, and which are on the periphery. The path of product i is defined as:
Path i = ���ij
i
RCAci = ,
xvalci� xvalci
� xvalci� xvalci
i
ci,c
xvalci� xvalci
� xvalci� xvalci
i
ci,c
PRODYi = GDPPCc X�c
EXPYci = PRODYi Xxvalci
� xvalci
�
i,c
i
Appendix 4.1. Product Sophistication, Revealed Comparative Advantage, and Proximity and Path

128
Cambodia: Diversifying Beyond Garments and Tourism Country Diagnostic Study
Appendix 4.2. Priority Export Products
SITC Description Priority PRODY PathClassics
1 2820 Waste and scrap metal of iron or steel Metal ores 10,492 1282 6341 Wood sawn lengthwise, veneer sheets, etc.,
up to 5 mm in thicknessCork and wood 9,292 158
3 2690 Old clothing and other old textile articles; rags Textile fibers 7,697 1494 2450 Fuel wood and wood charcoal Cork and wood 5,767 1455 0422 Rice, semimilled or wholly milled Cereals 5,642 1056 2483 Wood, nonconiferous species, sawn, planed, tongued,
grooved, etc.Cork and wood 4,851 125
7 2923 Vegetable plaiting materials Crude materials 3,552 1478 2472 Sawlogs and veneer logs, of nonconiferous species Cork and wood 3,123 1019 2320 Natural rubber latex; natural rubber and gums Crude rubber 2,889 5310 0577 Nuts: edible, fresh, or dried Vegetables 2,414 11711 2922 Natural gums, resins, lacs, and balsams Crude materials 1,630 10812 2225 Sesame seeds Oleaginous fruit 1,358 9913–27 15 commodities Garments 8,361 143
Disappearances 1 6210 Materials of rubber Rubber 17,580 1852 0350 Fish: dried, salted or in brine, smoked Fishery 15,258 1173 0481 Cereal grains: worked or prepared, not elsewhere specified Cereals 13,265 1634 0341 Fish: fresh or chilled, excluding fillets Fishery 11,560 1125 2222 Soybeans Oleaginous fruit 8,353 716 2924 Plants and parts of trees used in perfumery, pharmacy; etc. Crude materials 4,621 1207 4243 Coconut (copra) oil Oils and fats 4,005 488 2631 Raw cotton, excluding linters, not carded or combed Textile fibers 2,013 89
Emerging 1 2511 Waste paper and paperboard, etc. Pulp paper 24,028 1512 8960 Works of art, collectors' pieces, and antiques Other Mfg. 21,968 1313 6583 Travelling rugs, blankets (nonelectric), not knitted or
crochetedTextile 14,963 123
4 2460 Pulpwood (including chips and wood waste) Cork and wood 12,341 1395 2882 Other nonferrous base metal waste and scrap, not elsewhere
specifiedMetal ores 12,216 144
6 7852 Cycles: not motorized Transportation 10,173 1467 0440 Maize: unmilled Cereals 9,277 1238 2733 Sands: excluding metal-bearing sands Fertilizer 8,414 1389 7938 Tugs, special purpose vessels, and floating structures Transportation 8,254 10210 1211 Tobacco: not stripped Tobacco 6,708 12111 9710 Gold: nonmonetary (excluding gold ores and concentrates) Gold, non-
monetary 6,369 101
12 4242 Palm oil Oils and fats 5,876 80
continued

129
4. Diversification and Upgrading
SITC Description Priority PRODY Path13 6584 Linens and furnishing articles of textile, not knitted or
crochetedTextile 5,862 134
14 0611 Sugars: beet and cane, raw, solid Sugar 5,388 10315 0548 Vegetable products: roots and tubers, not elsewhere
specified, fresh, driedVegetables 5,130 116
16 7933 Ships, boats, and other vessels for breaking up Transportation 5,069 13617 6581 Bags, sacks of textile materials, for the packing of goods Textile 4,262 14218 9410 Animals, live, not elsewhere specified, (including zoo
animals, pets, insects, etc.)Animals, live 3,583 118
19-28 10 commodities Garments 7,409 14829 Footwear Footwear 10,153 148
Marginals 1 7284 Machinery for specialized industries and parts thereof, not
elsewhere specifiedMachinery 36,279 144
2 5417 Medicaments (including veterinary medicaments) Chemical 28,360 1873 7442 Lifting, handling, loading machinery, telphers, and conveyors Machinery 26,299 1794 5839 Other polymerization and copolymarization products Chemical 25,536 1565 6531 Fabrics, woven, of continuous synthetic textile materials Textile 24,712 1676 8928 Printed matter, not elsewhere specified Other Mfg. 24,483 1857 8942 Children's toys, indoor games, etc. Other Mfg. 23,150 488 7648 Telecommunications equipment, not elsewhere specified Machinery 22,326 1209 0488 Malt extract; cereals preparations with less 50% of cocoa Cereals 21,937 16410 7371 Metallurgy and metal foundry equipment, and parts thereof,
not elsewhere specifiedMachinery 21,854 132
11 7643 Television, radio broadcasting, transmitters, etc. Machinery 21,155 9012 6415 Paper and paperboard, in rolls or sheets, not elsewhere
specifiedPaper products 21,139 164
13 7721 Switches, relays, fuses, etc; switchboards and control panels, not elsewhere specified
Machinery 20,675 177
14 5121 Acyclic alcohols and their derivatives Chemical 20,629 11715 5419 Pharmaceutical goods, other than medicaments Chemical 20,512 14716 2482 Wood of coniferous species: sawn, planed, tongued, grooved,
etc.Cork and wood 20,348 132
17 7234 Construction and mining machinery, not elsewhere specified Machinery 20,221 13118 8939 Miscellaneous articles of plastic Other Mfg. 20,136 19619 8993 Candles, matches, combustible products, etc. Other Mfg. 19,504 16220 6997 Articles of iron or steel, not elsewhere specified Metallurgy 19,288 19421 6428 Articles of paper pulp, paper, paperboard, or cellulose
wadding, not elsewhere specifiedPaper products 19,109 185
22 6251 Tires: pneumatic, new, for motor cars Rubber 18,952 18023 7649 Parts, not elsewhere specified, of and accessories for
apparatus falling in heading 76Machinery 18,885 110
24 8931 Plastic packing containers, lids, stoppers, and other closures Other Mfg. 18,261 18725 6573 Coated or impregnated textile fabrics and products, not
elsewhere specifiedTextile 18,223 188
continued

130
Cambodia: Diversifying Beyond Garments and Tourism Country Diagnostic Study
SITC Description Priority PRODY Path26 0819 Food waste and prepared animal feed, not elsewhere
specifiedAnimal feeds 18,215 163
27 6996 Miscellaneous articles of base metal Metallurgy 18,206 18428 6940 Nails, screws, nuts, bolts, rivets, etc, of iron, steel, or copper Metallurgy 17,937 16429 6911 Structures and parts of iron, steel: plates, rods, and the like Metallurgy 17,851 19930 8998 Small-wares and toilet articles, not elsewhere specified;
sieves; tailors' dummies, etc.Other Mfg. 17,806 154
31 6960 Cutlery Metallurgy 17,804 14032 7169 Parts, not elsewhere specified, of rotating electric plant Machinery 17,730 18033 6552 Knitted items, not elastic nor rubberized, of
fibers other than syntheticTextile 17,500 129
34 6924 Cask, drums, etc, of iron, steel, aluminum, for packing goods Metallurgy 17,416 19535 8973 Precious jewelry, goldsmiths' or silversmiths' wares Other Mfg. 17,014 13036 7239 Parts, not elsewhere specified, of machinery and equipment
of headings 72341 to 72346Machinery 17,006 172
37 7599 Parts, not elsewhere specified, of and accessories for machines of headings 7512 and 752
Machinery 16,886 84
38 1222 Cigarettes Tobacco 16,775 15239 7162 Electric motors, generators (not direct current); generating
setsMachinery 16,464 183
40 7821 Motor vehicles for the transport of goods or materials Machinery 16,352 16941 8219 Other furniture and parts thereof, not elsewhere specified Furniture 16,178 18042 5921 Starches, insulin, and wheat gluten Chemical 15,827 15043 6998 Articles, not elsewhere specified, of copper, nickel,
aluminum, lead, zinc, and tinMetallurgy 15,445 183
44 6560 Tulle, lace, embroidery, ribbons, trimmings, and other small wares
Textile 15,385 171
45 7244 Machines for extruding manmade textile; other textile machinery
Machinery 15,137 100
46 8212 Furniture for medical, surgical, dental, or veterinary practice Furniture 15,053 17447 8310 Travel goods, handbags, etc, of leather, plastic, textile, others Travel goods 14,619 9848 0344 Fish fillets, frozen Fishery 14,592 12049 8211 Chairs and other seats; and parts thereof, not elsewhere
specifiedFurniture 14,392 161
50 6532 Fabrics, woven, 85% plus of discontinuous synthetic fibers Textile 14,319 15451 6421 Packing containers, box files, etc, of paper, used in offices Paper products 13,907 18452 6994 Springs and leaves for springs, of iron, steel, or copper Metallurgy 13,599 18153 7245 Weaving, knitting, etc, machines; machines for preparing
yarns, etc.Machinery 13,483 110
54 8972 Imitation jewelry Other Mfg. 12,680 10455 7932 Ships, boats, and other vessels Machinery 12,615 11956 6353 Builders` carpentry and joinery (including prefabricated) Cork and wood 11,367 16757 8947 Other sporting goods and fairground amusements, etc. Other Mfg. 11,171 12258 6522 Cotton fabrics, woven, bleached, dyed, etc, or otherwise
finishedTextile 10,370 122
59 1110 Nonalcoholic beverages, not elsewhere specified Beverages 10,349 153
continued

131
4. Diversification and Upgrading
SITC Description Priority PRODY Path60 2731 Building and monumental (dimension) stone, roughly
squared, splitFertilizer 10,189 132
61 7243 Sewing machines, furniture, needles etc, and parts thereof, not elsewhere specified
Machinery 10,058 103
62 8997 Basketwork, wickerwork; brooms, paint rollers, etc. Other Mfg. 9,996 14363 0813 Oilcake and other residues (except dregs) Animal feeds 8,822 11064 2111 Bovine and equine hides, raw, whether or not split Raw hides 8,694 15165 6122 Saddlery and harness, of any material, for any kind of animal Leather 8,109 10966 6114 Leather of other bovine cattle and equine leather Leather 8,081 13867 6534 Fabrics, woven, less than 85% of discontinuous synthetic
fibersTextile 7,934 148
68 6123 Parts of footwear of any material except metal and asbestos Leather 7,838 16269 6673 Precious and semiprecious stones, not mounted, set, or
strungMineral 6,932 110
70 8482 Articles of apparel, clothing accessories of plastic or rubber Garments 6,681 9471 0360 Crustaceans and mollusks, fresh, chilled, frozen, salted, etc Fishery 6,438 11172 6589 Other made-up articles of textile materials, not elsewhere
specifiedTextile 6,361 143
73 0615 Molasses Sugar 5,581 13374 2871 Copper ore and concentrates; copper matte; cement copper Metalliferous ores 5,558 9875 0421 Rice in the husk or husked, but not farther prepared Cereals 5,073 12776 6978 Household appliances, decorative articles, etc, of base metal,
not elsewhere specifiedMetallurgy 4,720 113
77 0751 Pepper of "piper"; pimento of "capsicum or pimenta" Spices 4,652 11978 2713 Natural calcium phosphates, natural aluminum, etc. Fertilizer 4,224 6179 2221 Groundnuts, green Oleaginous fruit 3,941 10680 0542 Beans, peas, other leguminous vegetables, dried, shelled Vegetables 3,329 11381 5513 Essential oil, resinoid, etc. Oils and perfume 2,552 14482 6521 Cotton fabrics, woven, unbleached, not mercerized Textile 2,230 11783 1212 Tobacco, wholly or partly stripped Tobacco 1,778 139
mfg = manufacturing, mm = millimeter, PRODY = a measure of technological sophistication, SITC = Standard International Trade Classification.Source: Estimates based on UN Comtrade Database, accessed April 2013.


133
5. Summary and Policy Recommendations
5. SUMMARY AND POLICY RECOMMENDATIONS
Current projections suggest Cambodia can continue to grow at 7% or more for the rest of the current decade and into the 2020s (IMF 2014). This expansion will be supported by the creation of the Association of Southeast Asian Nations (ASEAN) Economic Community in 2015 and other regional integration schemes.
To sustain high growth, however, the country needs to (1) strengthen weak supporting factors—infrastructure, skills and education, and governance; (2) avoid the low-wage production trap; and (3) maintain a stable political environment conducive to investment and commerce. These three conditions are strongly linked, in that moving beyond low-wage goods and services will require sustained improvements in growth-supporting factors and a stable environment for investment.
This Country Diagnostic Study is constructed based on an inclusive growth framework that combines analytical structures, investigating barriers to both growth and socioeconomic inclusiveness. The four key constraints are:
(1) Weaknesses in human capital. Cambodia’s workforce remains in-sufficiently skilled and educated to generate growth in emerging sectors, and limited access to education, health care, and nutrition hampers progress in improving the quality of human capital.
(2) Deficits in infrastructure provision. This raises the costs of production and significantly limits access to electricity, rural road transport, and water and sanitation.
(3) Weaknesses in governance. Corruption and weak public sector management are persistent problems.
(4) Limited fiscal space. The government has insufficient funds to invest in the main growth-supporting factors and in social services.
The government is addressing weaknesses in all these areas. The following sections offer policy recommendations in the four areas to support the reform efforts. The chapter concludes with recommendations for the way forward, including how to overcome the “special challenge” of helping Cambodia move beyond low-wage, low-value production.
5.1. Human Capital and Access to Decent Employment A healthy, skilled, and educated workforce is essential for attracting investment and generating a high level of productivity throughout the private and the public sectors. Such a workforce is especially important for Cambodia, which is seeking to move into higher-value products and services. Good health and nutrition provide a solid base for human capital development. In education, marked improvements in the take-up of primary education are encouraging, but low completion rates in secondary education remain a concern. Raising the quality of education requires substantial investment in learning materials and equipment, and teacher qualifications.
Reducing a broad skills mismatch is an important part of the human capital challenge. The technical skills needed in all aspects of society—farming, manufacturing, services, and public administration—can be better aligned with the needs of the job market. Skills training institutions

134
Cambodia: Critical Development Constraints Country Diagnostic Studies
should be linked with employers’ needs so that graduates have market-ready and market-relevant skill sets.
Strengthen Health Care and Nutrition Short-Term Measures
� Expand health care provision.
� Ensure health centers have adequate resources for regular health education and outreach services. Strengthen the links between health service providers, community practitioners, local authorities, nongovernment organizations, and communities. Provide mobile services for populations far from medical centers.
� Strengthen public awareness of the importance of good nutrition. Maximize resources to expand school-based midday meal programs in poor areas in order to improve nutrition and motivate parents to send their children to school.
� Ensure adequate nutrition and health care in the first 1,000 days of life, from conception to 2 years. Strengthen prenatal and postnatal care by primary health centers and provide support and funding for reproductive, maternal, newborn, and child health services. Promote breastfeeding and complementary feeding practices.
Medium-Term Measures
Increase the number of physicians and other health care professionals. Expand health care access across the country. Ensure effective implementation and financial management of the new health insurance program under the National Social Security Fund.
Provide adequate funding, logistical, and institutional support to scale up health care access and coverage. Achieve this through mechanisms such as health equity funds, health insurance, and fee exemptions for the poor.
Establish a planning and surveillance system to conduct regular health mapping and microplanning. The system should focus on disease and on detecting health risks and health inequities, specifically for childhood immunization, primary school retention, anthropometric assessment, food security, and environmental health.
Increase the Quality of and Completion Rates of Primary and Secondary EducationShort-Term Measures
Fully implement the National Policy on Early Childhood Care and Development to improve access to early childhood education and reduce repetition and dropout rates at all levels.
To improve learning outcomes, provide resources adequate to implement a breakfast provision and scholarship program.
Decrease the number of students per teacher from over 40 in many schools to a maximum of 30 in primary schools and 25 in secondary schools. This will increase teacher time per student and improve learning outcomes. Recruit additional teachers to meet these targets.
Create a mapping system for school-age children that includes out-of-school children and children with disabilities.

135
5. Summary and Policy Recommendations
Promote an inclusive education program that will provide teachers with the means to identify and help children with disabilities.
Improve the quality of pre-service and in-service teacher training and enhance the quality of instruction. Review the curriculum and pedagogy to ensure that education and skills provided in secondary schools meet the needs of the job market and entry to higher education.
Medium-Term measures
Continue investing in education by building more classrooms and providing additional facilities to secondary schools that need them. Finance recruitment of teachers and improve pre-service and in-service teacher development to effectively respond to the shortage of lower- and upper-secondary school teachers.
Reduce the share of secondary school teachers who have not completed upper-secondary education from over 15% currently to 10% by 2017 and to zero by 2020. Provide appropriate in-service and distance learning opportunities to enable teachers to complete their upper-secondary education.
Secure the cooperation of relevant ministries, agencies, local authorities, and development partners for expanding the provision of preschool classes in primary schools, of community preschool classes, and of home-based and house-group-based programs.
Strengthen ties with development partners to secure support for institutionalizing a program to increase the number of scholarships to priority students. The scholarship program could also be used as a vehicle to promote fields of study that are in demand (for example, engineering and sciences); accumulate knowledge; and improve the country’s human capital base.
Provide the Accreditation and Certification Framework for Technical and Vocational Education and Training
Short-Term Measures
Finalize the Policy on Technical Education and Guidelines on Vocational Education. Develop a management structure for technical and vocational education and training (TVET) and capacity development for TVET staff at all levels.
Incorporate aspects of vocational education in general education to help students develop a combination of academic and vocational skills and increase their awareness of career options after secondary school.
The quality and relevance of TVET can be improved through better understanding of and links with the needs of employers. This understanding can be achieved through links and dialogue between educators and employers. Develop the National Employment Agency’s role in furnishing better information about skills to the National Training Board. Establish channels for employers to communicate their skills needs to education and training institutions.
Improve the social status accorded to TVET programs through information and motivation campaigns in media, exhibitions, competitions, and so on. This will spread awareness of skills and employability, disseminate success stories, and introduce role models.
Support standards in TVET programs by focusing on securing an adequate quantity and quality of TVET teachers and trainers. This may be achieved by upgrading learning facilities for instructors and promoting professional development.

136
Cambodia: Critical Development Constraints Country Diagnostic Studies
Promote entrepreneurship training for the large part of the workforce that is self-employed, thereby improving the management and sustainability of micro and small enterprises.
Medium-Term Measures
Promote private sector participation in the provision and management of TVET through an enhanced role in policymaking, training design, standards setting, assessment, and accreditation.
Secure private sector commitment and investment in setting up sector-specific centers of excellence, which will be located close to the relevant industry and linked with reputable industry-specific training facilities. Such centers of excellence could also be vehicles for an apprenticeship training program.
5.2. Infrastructure: Electricity, Rural Roads, and Rural Water and SanitationCambodia suffers from major infrastructure deficits. Reducing these would help attract greater urban investment, improve productivity in the farm sector, and make growth more inclusive. The main challenges are increasing domestic power generation and distribution, improving the quality of rural roads, and completing the rehabilitation of the railway. In addition, upgrading and expanding water and sanitation infrastructure outside of Phnom Penh would support the productivity of the rural workforce by improving conditions for good health.
Complete the Planned Expansion of Electricity Generation Capacity and Reduce Energy Imports
Short-Term Measures
Revisit development plans for the national power sector to clearly identify progress and milestones against the investment needed to reach minimum self-sufficiency in power generation.
Realign power sector development strategies based on the government’s ability to fast-track projects involving repairing and upgrading generation, transmission, and distribution infrastructure.
Ensure that Electricité du Cambodge and private sector entities have the capacity to implement the current plans for expanding the grid.
Support the integration of regional grids into a national network; this will be a critical step in supplying electricity throughout the country and distributing the new generation capacity coming on stream in the next few years.
Medium-Term Measures
Give high priority to providing all villages with access to electricity by 2020 through combined improvements in generation, transmission, and distribution.
Promote energy efficiency to accommodate the country’s limited generation capacity and increasing energy demand.
Focus on providing the government support necessary to complete the new power generation capacity coming on stream through 2020. This added capacity should

137
5. Summary and Policy Recommendations
substantially reduce the share of imported electricity and help provide for the increase in electricity demand in the coming years.
Alongside an increase in generating capacity, the creation of a national grid, and improved rural energy supply, review the tariff structure to determine how to lower tariffs overall and reduce the large gap between rural and urban electricity prices.
Design a tariff structure model that defines the appropriate tariff level for all types of customers and that promotes the delivery of electricity to rural areas. Include a transition process for amending the tariffs and ensure government commitment to it.
Strengthen Rural Electrical Enterprises and Provide Incentives to Expand Coverage Short-Term Measures
Designate the Rural Electrification Fund as the central coordination agency for pooling funds from development partners for rural electrification. Ensure regular consultations with development partners to plan the strategy for electrification and for implementing projects. The approach could be modeled on the role played by similar agencies in countries where rural electrification was successful, including Bangladesh and India.
Support the investment climate for private rural electricity enterprises by assessing the possibility of issuing longer-term permits to reduce the uncertainty associated with their investment and enable them to plot their business operations using a reasonably long time frame. Simultaneously enforce performance standards to promote a culture of efficiency, and eventually help bring down production costs and tariff rates.
Medium-Term Measures
Provide additional resources to the Rural Electrification Fund so that it can channel incentives and subsidies to rural enterprises. This is crucial for increasing electrification in rural areas.
Enhance the investment environment by clarifying rules for standalone generation, mini-grid operations, and future large-grid connections to encourage greater investment in electricity by domestic private sources.
Widen private electricity enterprises’ access to finance to enable them to secure capital at affordable rates.
Explore energy options and consider developing large-scale alternative and clean fuel sources to supply energy to the provinces.
Develop Transport Infrastructure by Expanding the Network of Paved Rural Roads
Short-Term Measures
Review and assess transport infrastructure models for urban and rural areas and link them more systematically to the country’s growth sectors, given increasing rural-to-urban migration, population growth, and the rapid development of urban centers. Based on this assessment, consolidate government leadership on policy to ensure clearly defined roles and minimum overlap among sector coordinators, area planners, and national decision-making entities.
Prioritize road development in areas where major businesses and markets congregate. Study the business and employment

138
Cambodia: Critical Development Constraints Country Diagnostic Studies
impact of high priority roads by estimating how many new businesses and work opportunities will be created, and by how much existing businesses can grow with increased road connectivity.
Ensure the Ministry of Public Works and Transport has adequate funding for its road development projects. Target a significant increase in road density and expand the share of paved roads.
Finish rehabilitating the rail network to move bulk goods off the roads and reduce the heavy wear and tear on the road system. Ensure connection at the rail ends to ports and to Thailand.
Medium-Term Measures
Develop and maintain for rural infrastructure an inventory that includes information on all transport channels to enable adequate tracking of rural transport development projects. This information will enable ministries to identify provinces that lack sufficient transport infrastructure and, by gauging investment and maintenance needs, develop strategies to address the problem. Reinforce plans to encourage wider participation of the private sector (through public–private partnerships) in financing transport projects that will have considerable economic impact by generating incomes and employment.
Support the revival of the railway system by modernizing major links (such as Phnom Penh–Poi Pet, Phnom Penh–Kampot–Sihanoukville, and Sosiphon–Poipet). Sponsor railway promotion, highlighting its efficiency and viability as an alternative to road transport.
Upgrade water transport facilities and provide support facilities to encourage more foreign direct investment. Assess the additional investment required to
develop Sihanoukville Autonomous Port to international standards in the medium- to long-term, enabling Cambodia to end shipment through Singapore and Viet Nam to access international markets.
Forge ties with private sector providers of infrastructure for information and communication technology, for improved management and operations. Leverage regional ties within ASEAN countries to create new cross-border connectivity channels and intensify existing ones.
Provide farm-related infrastructure to support agriculture. Provide more farm-to-market roads and establish storage, warehousing, and refrigeration facilities that ensure farm and fishery output is fresh when delivered to the market.
Improve Water, Sanitation, and Flood Management Outside Phnom Penh Short-Term Measures
Adapt water supply management techniques used with great success in Phnom Penh to develop urban water supply in other cities and towns.
Invest in upgrading, extending, and maintaining sewerage and drainage infrastructure in rural areas and in cities and towns outside the capital to reduce disease and expand social inclusion.
Improve river, lake, and coastal embankments to protect commercial and residential land from erosion and flooding. Develop effective flood management, environmental protection, and disaster readiness systems to mitigate climate change and extreme weather impact.

139
5. Summary and Policy Recommendations
Develop effective solid waste management systems for urban areas outside the capital.
Medium-Term Measures
Invest in water supply in rural areas, from under 50% of households in 2013 (wet season) to 70% by 2020. Also, increase access in urban areas outside the capital from 67% in 2013 to 75% of households by 2020.
Improve the disposal of household sewage through better toilets and connection to sewerage and septic tanks. Reduce open defecation in rural areas from nearly two-thirds of households to much lower levels by 2020.
5.3. Governance In the last 2 decades, Cambodia has developed a governance framework—comprising the rule of law, public administration and finance, and the regulation of market activity. Continued strengthening of governance systems is essential.
Investment surveys make clear that informal payments dominate public–private sector arrangements, a major weakness that is distorting and interfering with the conduct of legitimate business. Recent reforms to combat corruption and improve governance, such as the Anti-Corruption Law in 2010 and the Public Financial Management Reform Program, appear to have slightly reduced perceptions of corruption in recent years. Governance could be strengthened by the following measures:
Short-Term Measures
Encourage other ministries to follow the practice in some government agencies of publishing their schedule of fees for permits, licenses, and regulation in
public offices and on official websites to increase transparency. The Ministry of Economy and Finance and the Council for the Development of Cambodia jointly published their fees in December 2012, and the Ministry of Commerce did the same in early 2013.
Continue to strengthen the Anti- Corruption Unit and allow for full implementation of the Anti-Corruption Law. Strengthen education on corruption and its prevention and enforcement. Maintain adequate funding for the Anti-Corruption Unit and seek to reach a full complement of staff. Ensure that violators are prosecuted and that penalties are sufficient to act as a deterrent.
Formulate and implement a system for standard procedures, requirements, and payment schedules to reduce processing time and costs. Establish benchmarks and one-stop windows in government agencies to improve operational efficiency. Promote the “best practice” paradigm in various media to help engender a culture of competence and timeliness.
Medium-Term Measures
Explore ways to institutionalize electronic processing of business-related transactions such as registrations, applications, and permits; and electronic payment of fees, fines, duties, and other levies related to establishing a business, importing and exporting, and liquidating and closing an enterprise.
Support reforms connected with the Anti-Corruption Law, the Law on Public Finance System, and the Public Financial Management Reform Program. Promote the representation of civil society in the sphere of public contracts by introducing, institutionalizing, and promoting digital

140
Cambodia: Critical Development Constraints Country Diagnostic Studies
processes of bidding, procurement, and disclosure at the national and local government levels.
Strengthen the information drive to establish national awareness of transparency and accountability. Minimize opportunities for government employees to handle cash transactions by mandating that some transactions be paid directly to banks. Start a nationwide campaign warning against unofficial payments and stipulate the penalties for soliciting or offering bribes. Introduce a nationwide witness protection system.
With the support of development partners, continue moving forward on the four main reform programs in public sector management—the National Program for Administrative Reform, the Legal and Judicial Reform Program, the Decentralization and Deconcentration Reform Program, and the Public Financial Management Reform Program.
Empower key agencies in the legal–judicial areas to strengthen mechanisms to better guarantee and protect property rights, enforce contracts, and settle disputes. Increase the resources and capacity of courts. Amend the institutional framework governing the relationship between the executive and judicial branches of government to promote independence between them and eventually extinguish the patronage system that leads to corruption.
Ensure the clarity, consistency, and enforcement of laws, regulations, and decrees relating to business to reduce ambiguity and promote transparency. Ensure laws, regulations, and decrees that apply to foreign investors are officially translated and printed in English as well as Khmer.
5.4. Fiscal ResourcesThe country has vast demand for strengthening hard and soft infrastructure and increasing social service provision. But low revenue generation stemming from a narrow tax base and weak tax administration constrains the government’s capacity to meet the public expenditure requirements necessary for such a development agenda.
Government revenues have not increased alongside expenditure growth, severely limiting the government’s ability to finance physical and social infrastructure to promote inclusive growth and sustainable development. Revenue mobilization is imperative to rebuild fiscal buffers and support fiscal sustainability in the medium term. Suggested measures include the following:
Prioritize the implementation of strategies to improve revenue generation from 15% of gross domestic product in 2013 to 17% by 2018. Concentrate on enhancing measures for compliance with tax payments and improved governance in tax collection agencies.
Improve tax administration through the greater use of information and communication technology and better recruitment and management of human resources. Offer a broader range of options for tax payment by embracing information and communication technology and electronic banking services.
Reduce tax arrears through a focused strategy and a dedicated arrears collection team; this would boost revenues significantly.
Assess the effectiveness of the profit tax exemption in attracting new investment (Qualified Investment Projects) to make the incentive less generous and more focused on enticing investments in nontraditional products and services.

141
5. Summary and Policy Recommendations
Widen the direct tax base by including more individuals and small firms in the tax net, without lessening the important efforts of the Large Taxpayers Department. Reduce exemptions on specific products such as electricity, financial services, and petroleum. Generate additional revenue through broader application of excise taxes and, in some cases, higher rates on tobacco and diesel, among other products.
Strengthen the evaluation, contracting, and monitoring of public–private partnership transactions. Promote transparency in this area by establishing a central monitoring unit as an information portal with the power to evaluate and approve projects. Improve coordination capabilities among agencies and private sector counterparts.
Strengthen resource mobilization to meet the growing public expenditure demand for improved social services and broader coverage of social protection over the medium term. Establish a comprehensive and sustainable national social protection system with a long-term vision and concrete implementation plans. Consolidate various ad-hoc social programs and support the systematic implementation of the national social protection scheme.
5.5. The Way Forward and a Special Challenge
Through the Rectangular Strategy for Growth, Employment, Equity, and Efficiency, Phase III, the government is pursuing its vision of a society based on rapid economic growth, full employment, the equitable distribution of the gains from growth, and effective management of public institutions.
Cambodia has achieved much since it began economic reconstruction and rehabilitation, and established itself as a promising market economy in
the early 1990s. In synchrony with Cambodia Vision 2030, a new industrial policy, and the continued implementation of the Rectangular Strategy, the country can continue its progress and expand inclusive growth. Moving forward, Cambodia faces the special challenge of diversifying and upgrading its productive capabilities to improve its economic resilience and growth potential. The economy is currently driven by a few sectors narrowly focusing on low-skill segments in garments, rice, tourism, and construction. The narrow industrial and export base unnecessarily exposes the economy to volatile sector demand and price shocks. The latest global financial crisis highlighted these risks. Compounding such risks is the concentration of exports to just a few countries; about 80% of merchandise exports go to Canada, Europe, and the United States, where long-term growth prospects remain constrained by the crisis hangover. Furthermore, Cambodia exports largely unsophisticated products concentrated in a limited number of sectors that are poorly connected in the product space. Diversifying into higher-value products and services would help the country avoid being caught in low-wage, low-technology equilibrium. It is equally important that the process of diversification and upgrading be developed in a manner that it contributes to skills upgrading and creation of quality jobs.
To diversify the economy and produce higher-value output, the government could pursue both generic and sector-specific policies. Generic policies improve the business environment for all kinds of investors and enterprises and are detailed in other parts of this report. Sector-specific policies target sectors that hold potential for expansion. Determining what can be achieved will depend on the resources, knowledge, and expertise the government is able to allocate for industrialization. For example, the government has chosen a sectoral approach to rice, knowing that it is important for the economy but is hampered by sector-specific bottlenecks. Understanding a nascent sector is crucial for building it up and allowing for diversification. When using a sectoral approach, the focus of sectoral industrial policies should be

142
Cambodia: Critical Development Constraints Country Diagnostic Studies
knowledge and not subsidies. The following may help in considering government strategies and options to support the target sectors:
Use knowledge gained from consultation with industry to address business environment problems. Such knowledge can help determine how to address structural bottlenecks and other problems in the business environment. Sectoral expertise must be fed back to various line ministries to affect change.
Use detailed production and trade data to select sectors that can be supported. Cambodia can focus on products that are closely related to the goods it currently produces and exports because such products require the use of capabilities similar to the current national capabilities and therefore will facilitate product diversification and upgrading. Light manufacturing and agro-processing are the key candidates.
Build technocratic expertise about specific sectors. This requires the government to have experts with sector knowledge, but it will have difficulty securing expertise in a large number of sectors given its limited human and financial resources. As a result, the choice of sectors must be focused and selective.
Consult with industry. The needed expertise can be developed by close and frequent consultation with industry, an approach the government is using through its Government–Private Sector Forum and other consultation forums with industry associations. Industry associations must be actively involved in the effort.
Establish a knowledge sharing platform aimed at providing essential and timely market information to promote understanding about the changing nature of markets in the region and globally. Wider awareness that Cambodia has better quota access to advanced markets could attract investment into sectors that have recently lost market access elsewhere. An example is the recent growth of bicycle assembly. Cambodia’s duty-free export status with the European Union and its comparatively low wages persuaded bicycle manufacturers to move from other countries to set up operations in Cambodia.
Leverage existing foreign investment. Try to build clusters around foreign investment by targeting and attracting firms that specialize in "nearby" products that are better connected to Cambodia’s core competencies and capabilities. Products that have close links to a large number of other products (implying that they are closely connected to a core competency) can help generate greater diversification than those that are not.

143
References
REFERENCES
ADHOC. 2013. A Turning Point? Land, Housing and Natural Resources Rights in Cambodia in 2012. http://www.adhoc-cambodia.org/wp-content/uploads/2013/02/ADHOC-A-Turning-Point-Land-Housing-and-Natural-Resources-Rights-in-2012.pdf
Agrifood Consulting International and CamConsult. 2006. Diagnostic Study, Phase 1 of Design, Agricultural Program, Cambodia, 2007–12—Program Concept Document Final Report. Prepared for AusAID by Agrifood Consulting International. Bethesda, MD: Camconsult. http://aid.dfat.gov.au/Publications/Documents/cambodia/agriculture_report.pdf
Ali, I., and H. Son. 2007. Measuring Inclusive Growth. Asian Development Review. 24 (1). pp. 11–31.
Ali, I., and J. Zhuang. 2007. Inclusive Growth toward a Prosperous Asia: Policy Implications. ADB Economics and Research Department Working Paper Series No. 97. Manila: Asian Development Bank. http://www.adb.org/sites/default/files/pub/2007/WP097.pdf
Annear, P., D. Wilkinson, M. Chean, and M. van Pelt. 2006. Study of Financial Access to Health Services for the Poor in Cambodia. Prepared for the Ministry of Health, AusAID, World Health Organization, and RMIT University. Phnom Penh. http://www.who.int/health_financing/countries/cam-healthaccess.pdf
Araki, S., and I. Claus. 2014. A Comparative Analysis of Tax Administration in Asia and the Pacific. Mandaluyong City.
Asian Development Bank (ADB). 2007. Philippines: Critical Development Constraints. Mandaluyong City: ADB. http://www.adb.org/publications/philippines-critical-development-constraints
______. 2011a. Cambodia: Country Partnership Strategy 2011–2013. Mandaluyong City.
______. 2011b. Cambodia: Energy Sector Assessment, Strategy, and Road Map, 2011–2013. Mandaluyong City.
______. 2011c. Cambodia Greater Mekong Subregion Tourism Sector Assessment and Roadmap, ADB Southeast Asia Department Working Paper, April. Mandaluyong City.
______. 2011d. Cambodia Transport Sector Assessment, Strategy and Road Map. Mandaluyong City.
______. 2011e. CPS: Cambodia 2011–2013, Sector Assessment (Summary): Education and Training. Mandaluyong City.
______. 2012a. Cambodia Country Governance Risk Assessment and Risk Management Plan. Mandaluyong City.
______. 2012b. Framework of Inclusive Growth Indicators. Mandaluyong City.
______. 2012c. Key Indicators for Asia and the Pacific 2012. Mandaluyong City.
______. 2012d. The Kingdom of Cambodia: Updating and Improving the Social Protection Index. Mandaluyong City.
______. 2013a. Asian Development Outlook 2013. Mandaluyong City.
______. 2013b. Key Indicators for Asia and the Pacific 2013. Mandaluyong City.
______. 2014a. Key Indicators for Asia and the Pacific 2014. Mandaluyong City.
______. 2014b. Statistical Database System (SDBS) website. http://sdbs.asiandevbank.org:8030/sdbs/index.jsp
______. Social Protection Database. http://spi/asiandevbank.org:8080/spi.index.jsp
______. Statistical Database System (SDBS). https://sdbs.adb.org/sdbs/index.jsp

144
Cambodia: Critical Development Constraints Country Diagnostic Studies
BDLink Cambodia Ltd. 2008. Youth and Employment: Bridging the Gap. Cambodian Federation of Employers and Business Federations (CAMFEBA) and the International Labour Organization. http://www.ilo.org/public/english/dialogue/actemp/downloads/projects/youth/cambodia_surveyreport2008_en.pdf?bcsi_scan_dab5294b144736b1=0&bcsi_scan_filename=cambodia_surveyreport2008_en.pdf
Cambodia Airports. Our Business, Traffic Data. http : / /cambodia- ai rports .aero/our-business/traffic-data#anchor
Cambodia Federation of Employers and Business Associations (CAMFEBA). Government–Private Sector Forum. http://camfeba.com/en/gpsf.html
______. Laws and Regulations Resource Center: National Social Security Fund. http://www.camfeba.com/en/services/hr-and-labour-practice-consultation/nssf-law-and-regulations-.html
Cambodia Forestry Administration. 2010. Cambodia Forestry Outlook Study. Working Paper No. APFSOS II/WP/2010/32. Bangkok: Food and Agriculture Organization of the United Nations Regional Office for Asia and the Pacific. http://www.fao.org/docrep/014/am627e/am627e00.pdf
Cambodia Microfinance Association. 2012. Annual Report 2012. http://cma-network.org/drupal/download/Annual_Report/Annual_Report_2012.zip
Cambodia National Petroleum Authority. History of CNPA. http://www.cnpa.gov.kh/index.php?Id=00009
CEIC Data Company Ltd. Global Database. https://www.ceicdata.com
Chantana, N. 2007. Cambodia’s Financial Sector Development and Policies. Phnom Penh: National Bank of Cambodia. http://www.acledabank.com.kh/kh/assets/pdf_zip/Conference2007_05.pdf
Chene, M. 2009. Overview of Corruption in Cambodia. U4 Anti-Corruption Resource Center. Bergen. http://www.u4.no/publications/overview-of-corruption-in-cambodia
Chheang, V., and S. Hamanaka. 2011. Impediments to Growth of the Garment and Food Industries in Cambodia: Exploring Potential Benefits of the ASEAN_PRC FTA. ADB Working Paper Series on Regional Economic Integration No. 86. Muntinlupa City: ADB. http://aric.adb.org/pdf/workingpaper/WP86_Chheang_Hamanaka_Impediments_to_Growth.pdf
Council for the Development of Cambodia (CDC), Cambodian Investment Board (CIB), and Cambodian Special Economic Zone Board (CSEZB). www.cambodiainvestment.org.kh
______. Investors Information: Infrastructure: Electricity. http://www.cambodiainvestment.gov. kh/investors-information/infrastructure/electricity.html
______. Investors Information: Infrastructure: Railways. http://www.cambodiainvestment.g o v . k h / i n v e s t o r s - i n f o r m a t i o n /infrastructure/railways.html
Cunningham, G. 2011. Gradually Gaining Traction: Overview of the Cambodian Economy. Cambodia Capital Research. http://radiuscambodia.files.wordpress.com/2012/04/cambodia-market-overview-researched-by-sbi-royal-securities.pdf
Duma, N. 2011. Dollarization in Cambodia: Causes and Policy Implications. IMF Working Paper WP/11/49. Washington, DC: International Monetary Fund.
Electricity Authority of Cambodia. 2012. Report on Power Sector of the Kingdom of Cambodia: 2012 Edition. Phnom Penh. h t t p : / / w w w. e a c . g o v. k h / p d f / r e p o r t /Annual%20report%202011.en.pdf?bcsi_scan_e41ddc73166bc1eb=0&bcsi_scan_filename=Annual%20report%202011.en.pdf
______. 2013. Report on Power Sector of the Kingdom of Cambodia: 2013 Edition. Phnom Penh. http://www.eac.gov.kh/pdf/report/report%202012%20(en).pdf?bcsi_scan_e41ddc73166bc1eb=0&bcsi_scan_filename=report%202012%20(en).pdf
Energy Business Review. 2013. Operations Commence at 18MW Kirirom III Hydro Power Plant in Cambodia. 26 February. http://hydro.energy-business-review.com/news/operations-commence-at-18mw-kirirom-iii-hydro-power-plant-in-cambodia-260213

145
References
Filmer, D., and N. Schady. 2006. Getting Girls into School: Evidence from a Scholarship Program in Cambodia. Impact Evaluation Series No.1. World Bank Policy Research Working Paper 3910. Washington, DC: World Bank. http://elibrary.worldbank.org/doi/pdf/10.1596/1813-9450-3910
Fong-Sam, Y. 2012. The Mineral Industry of Cambodia. In U.S. Geological Survey Minerals Yearbook—2010. Washington, DC: US Geological Survey. http://minerals.usgs.gov/minerals/pubs/country/2010/myb3-2010-cb.pdf
Food and Agriculture Organization of the United Nations. 2011. National Fishery Sector Overview—Cambodia. ftp://ftp.fao.org/fi/document/fcp/en/FI_CP_KH.pdf
______. Food Security Indicators. http://www.fao.org/economic/ess/ess-fs/ess-fadata/en/#.Uw79cOPjWSo
Garment Manufacturers Association in Cambodia (GMAC). www.gmac-cambodia.org
Hausmann, R., J. Hwang, and D. Rodrik. 2007. What You Export Matters. Journal of Economic Growth. 12 (1). pp. 1–25.
Hausmann, R., D. Rodrik, and A. Velasco. 2005. Growth Diagnostics. Cambridge, MA: John F. Kennedy School of Government, Harvard University.
Henderson, S., and S. Mesa. 2013. Powerless Phnom Penh Struggles with Hot Season. Cambodia Daily. 25 March. http://www.cambodiadaily.com/archive/powerless-phnom-penh-struggles-with-hot-season-15655
HR Inc. Cambodia. 2009. Higher Education and Technical Vocational and Education Training in Cambodia. Phnom Penh: HR Inc. Cambodia.
International Finance Corporation (IFC). n.d. Impact Assessment of the Public–Private Dialogue Initiatives in Cambodia, Lao PDR, Vietnam: Executive Summary. Washington, DC. http://www.publicprivatedialogue.o r g /c a s e _ s t u d i e s / E X E C U T I V E % 2 0SUMMARY%20-%20PPD%20Impact%20A s s e s s m e n t % 2 0 - % 2 0 V i e t n a m % 2 0Cambodia%20Laos%20.pdf
International Finance Corporation and European Union. 2010. Understanding Cambodian Small and Medium Enterprise Needs for Financial Services and Products. Phnom Penh: IFC. http://www.ifc.org/w p s / w c m /c o n n e c t / 7 0 8 5 8 8 8 0 4 74 d ce 1 5 9 5 0 6 9 f 1 1 d 5 7 e 6 c 6 3 / C a m + S M E -Fi n a n c i a l + S e r v i c e s + a n d + P ro d u c t s .pdf?MOD=AJPERES
International Finance Corporation and World Bank. 2007. Enterprise Surveys. Cambodia (2007). Washington, D.C. http://www.enterprisesurveys.org/Data/ExploreEconomies/2007/cambodia
International Labour Organization. 2012. Cambodia Social Protection Expenditure and Performance Review. Geneva. http://www.ilo.org/wcmsp5/groups/public/---ed_protect/---secsoc/documents/publication/wcms_secsoc_34870.pdf
International Monetary Fund. 1986. A Manual on Government Financial Statistics. Washington, DC. http://www.imf.org/external/pubs/ft/gfs/manual/1986/eng/
______. 2009. Cambodia: 2009 Article IV Consultation—Staff Report; Staff Supplement; Public Information Notice on the Executive Board Discussion; and Statement by the Executive Director. IMF Country Report No. 09/325. http://www.imf.org/external/pubs/ft/scr/2009/cr09325.pdf
______. 2012. Cambodia 2011 Article IV Consultation. IMF Country Report No. 12/46. Washington, DC. http://www.imf.org/external/pubs/ft/scr/2012/cr1246.pdf
______. 2013. Cambodia 2012 Article IV Consultation. IMF Country Report No. 13/2. Washington, DC. http://www.imf.org/external/pubs/ft/scr/2013/cr1302.pdf
______. 2014. Cambodia 2013 Article IV Consultation. IMF Country Report No. 14/33. Washington DC. http://www.imf.org/external/pubs/ft/scr/2014/cr1433.pdf
______. IMF elibrary website. Cambodia Balance of Payments Analytic Presentation. http://elibrary-data.imf.org/DataReport.aspx?c=7179283&d=33060&e=161859

146
Cambodia: Critical Development Constraints Country Diagnostic Studies
______. Financial Access Survey. http://fas.imf.org/Itakura, K. 2012. Impact of Liberalization and
Improved Connectivity and Facilitation in ASEAN for the ASEAN Community Mid Term Review. Mimeo. Jakarta: Economic Research Institute for ASEAN and East Asia (ERIA).
Land and Housing Working Group, Cambodia. 2009. Land and Housing Rights in Cambodia Parallel Report 2009. http://www2.ohchr.org/english/bodies/cescr/docs/ngos/CHRE_Cambodia_CESCR42.pdf
Menon, J. 2008. Cambodia’s Persistent Dollarization: Causes and Policy Options. Working Paper Series on Regional Economic Integration, No. 19. Mandaluyong City: Asian Development Bank.
Ministry of Agriculture, Fisheries, and Forestry. n.d. www.maff.gov.kh
Ministry of Commerce. 2014. Cambodia’s Diagnostic Trade Integration Strategy and Trade Swap Roadmap 2014–2018. Phnom Penh. http://www.moc.gov.kh/TradeSWAp/userfiles/Media/file/Projects/EIF/DTIS%20Update%202013/Cambodia's%20DTIS%20Full%20Report%202014-2018%20-%20Jan%202014.pdf
Ministry of Economy and Finance. 2014. Table of Financial and Economic Operations (TOFE). Phnom Penh.
Ministry of Education, Youth and Sport (MOEYS). 2003. Education for All National Plan: 2003–2015. Phnom Penh.
______. 2006. Education Statistics and Indicators 2005/2006. Phnom Penh. http://www.moeys.gov.kh
______. 2007. Education Statistics and Indicators 2006/2007. Phnom Penh. http://www.moeys.gov.kh
______. 2008. Education Statistics and Indicators 2007/2008. Phnom Penh. http://www.moeys.gov.kh
______. 2009. Education Statistics and Indicators 2008/2009. Phnom Penh. http://www.moeys.gov.kh
______. 2010a. Education Statistics and Indicators 2009/2010. Phnom Penh. http://www.moeys.gov.kh
______. 2010b. Education Strategic Plan 2009–2013. Phnom Penh. http://www.moeys.gov.kh/en/policies-and-strategies/73-policies/89-2012-08-22-08-22-12.html
______. 2011. Education Statistics and Indicators 2010/2011. Phnom Penh. http://www.moeys.gov.kh
______. 2012. Education Statistics and Indicators 2011/2012. Phnom Penh. http://www.moeys.gov.kh
______. 2013. Education Statistics and Indicators 2012/2013 . http://www.moeys.gov.kh
______. 2014. Education Statistics and Indicators 2013/2014. http://www.moeys.gov.kh/images/moeys/indicator-and-statistic/577/577-kh.pdf
______. n.d. Education for All National Plan 2003–2015. Phnom Penh. http://sokheounpang.files.wordpress.com/2008/02/education-for-all-national-plan-2003-2015.pdf
Ministry of Industry, Mines, and Energy. 2011. PowerPoint presentation at the Training and Workshop on Small Hydro Power for Developing Countries. Hangzhou. 26 May–6 July. http://nrec.mn/data/uploads/Nom%20setguul%20xicheel/Water/badrakh%20china/Cambodia.pdf
______. 2012. Cambodia's Rural Electrification Mini-Grid Systems, Standard and Regulation. PowerPoint Presentation. Presented during the Regional Workshop on GMS Country Experience in Achieving Performance Target. 09–10 August. Chiang Mai, Thailand. http://www.gms-sef.org/docs/workshops/Regional/REGIONAL_presentations_chiang_mai/S4.4%20CAMBODIA.pdf.
Ministry of Planning. 2009. National Strategic Development Plan Update 2009–2013. Phnom Penh. http://www.mop.gov.kh/Home/NSDP/NSDPUPDATE20092013/tabid/206/Default.aspx
______. 2013. Poverty in Cambodia–A New Approach: Redefining the Poverty Line. Phnom Penh.
Ministry of Public Works and Transport (MPWT), Infrastructure and Regional Technical Working Group. 2012. Overview on Transport Infrastructure Sectors of the Kingdom of Cambodia (4th Edition).

147
References
Phnom Penh: Ministry of Public Works and Transport and Japan International Cooperation Agency. http://www.mpwt.gov.kh/wp-content/uploads/2012/04/2010-Overview-on-Transport-Infrastructure-S e c t o r s - i n - K i n g d o m - of - C a m b o d i a .pdf?bcsi_scan_dab5294b144736b1=0&bcsi_scan_fi lename=2010- Overview-on-Transport-Infrastructure-Sectors-in-Kingdom-of-Cambodia.pdf
Ministry of Rural Development. 2007a. Strategic Plan for Rural Roads (final draft). Phnom Penh. http://r4d.dfid.gov.uk/PDF/Outputs/SeaCap/Seacap6-Strategy.pdf
______. 2007b. Strategic Plan for Rural Roads. Data presented at the Ministry of Rural Development (based on data collected by the provincial departments of rural development). June 2007.
Ministry of Tourism (MOT). www.tourismcambodia.org
______. 2013. Cambodia Tourism Statistics Report 2013. http://www.tourismcambodia.org/images/mot/statistic_reports/tourism_statistics_annual_report_2013.pdf
______. 2014. Cambodia Tourism Statistics Report January 2014. http://www.nagacorp.com/eng/ir/tourism/tourism_statistics_201401.pdf
Nam, S., and T. Bunthang. 2011. Fisheries Resources in Cambodia: Implications for Food Security, Human Nutrition and Conservation. Paper submitted for the International Conference on Asian Food Security. Singapore. 10–12 August. http://www.rsis.edu.sg/nts/events/docs/ICAFS-So_Nam.pdf
National Bank of Cambodia (NBC). 2009. Banking Supervision Annual Report 2008. Phnom Penh. http://www.nbc.org.kh/download_files/supervision/sup_an_rep_eng/BSD_Report2008_EN.pdf
______. 2013. Balance of Payments Statistics Bulletin. Series No. 4. Phnom Penh.
______. various issues. Economic and Monetary Statistics. Phnom Penh. http://www.nbc.org.kh/english/publications/economic_and_monetary_statistics.php
National Center for Parasitology, Entomology and Malaria Control: Dengue Control Programme. http://www.cnm.gov.kh/userf i les/f i le/Annual%20Report%202 0 1 2 / 1 9 _ D e n g u e _ C N M _ % 2 0Situation_2012.pdf
National Institute of Statistics (NIS). Cambodia Socio-Economic Survey (CSES) Tables. Phnom Penh. http://www.nis.gov.kh/index.php/social-statistics/cses/cses-tables
______. 2009. Cambodia Socio-Economic Survey (CSES) CD-ROM for 2009. Phnom Penh.
______. n.d.a. Cambodia Statistical Yearbook 2003. Phnom Penh. http://www.nis.gov.kh/nis/yearbooks/Yearbook06.htm
______. n.d.b. Cambodia Statistical Yearbook 2006. Phnom Penh. http://www.nis.gov.kh/nis/yearbooks/Yearbook06.htm
National Institute of Statistics (NIS), Directorate General for Health (DGH), and ICF Macro. 2011. Cambodia Demographic and Health Survey 2010. Phnom Penh and Calverton, MD.
Poch, K., and S. Tuy. 2012. Cambodia’s Electricity Sector in the Context of Regional Electricity Market Integration. In Y. Wu, X. Shi, and F. Kimura, eds. Energy Market Integration in East Asia: Theories, Electricity Sector and Subsidies. Jakarta: Economic Research Institute for ASEAN and East Asia.
Port Autonome de Sihanoukville. http://www.pas.gov.kh/beta/site/en_front
Record, R., and K. Nghardsaysone. 2010. Export Dynamics and Diversification in Lao PDR: An Analysis of Product Space. In The Lao PDR Development Report 2010. Washington, DC: World Bank. http://siteresources.w o r l d b a n k . o r g / L A O P R D E X T N /Re s o u rc e s / 2 93 6 8 3 - 1 3 0 1 0 8 4 8 74 0 9 8 /L D R 2 0 1 0 _ E x p o r t _ D y n a m i c s _ a n d _Diversification.pdf
Reegle. Cambodia 2012. http://www.reegle.info/policy-and-regulatory-overviews/KH
Robinson, A. 2010. Sanitation Finance in Rural Cambodia: Review and Recommendations. Asian Development Bank and the Water Sanitation Program. http://www.wsscc.org/sites/default/f i les/publ ications/wsp_adb_sanitation_finance_rural_cambodia_2010.pdf

148
Cambodia: Critical Development Constraints Country Diagnostic Studies
Rodrik, D. 2004. Industrial Policy for the Twenty-First Century. KSG Working Paper No. RWP04-047. Cambridge, MA: Harvard Kennedy School. http://myweb.rollins.edu/tlairson/pek/rodrikindpolicy.pdf
Royal Government of Cambodia (RGC). 2009. National Strategic Development Plan Update 2009–2013. Phnom Penh: RGC, Ministry of Planning. file:///C:/Users/C70/Downloads/NSDP%20Update%202009-2013-English.pdf
______. 2011a. Diversifying the Cambodian Economy: The Role of Industrial Development. SNEC Working Paper. Phnom Penh: Supreme National Economic Council.
______. 2011b. Enhancing Fiscal Reform and the Counter Cyclical Aspects of Fiscal Policy in Cambodia. Phnom Penh. Supreme National Economic Council.
______. 2011c. National Social Protection Strategy for the Poor and Vulnerable. Phnom Penh. http://www.socialprotection.gov.kh/documents/publication/executive%20summary%20nsps%20en.pdf
______. 2012. The Cambodian Government's Achievements and Future Direction in Sustainable Development. National Report for Rio+20, United Nations Conference on Sustainable Development. http://sustainabledevelopment.un.org/content/documents/1022cambodia.pdf
______. n.d.a. Policy Document on Promotion of Paddy Rice Production and Export of Milled Rice. Phnom Penh. http://www.foodsecurity.gov.kh/sites/default/files/Rice-Policy-Eng.pdf
______.n.d.b. Rectangular Strategy Phase III. Phnom Penh. http://www.cambodiainvestment.gov.kh/content/uploads/2013/11/2013-Rectangular-Strategy-III-En8.pdf
Royal Government of Cambodia (RGC) Ministry of Public Works and Transport and Belgian Technical Cooperation (BTC). 2006. Master Plan for Waterborne Transport on the Mekong River System in Cambodia. http://www.ciwn.mpwt.gov.kh/images/stor ies/Pdf_f i les/17a%20FINAL%20REPORT_DRAFT.pdf
Ruan, G. 2013. Cambodia: Focusing on Exports. BMU 2013 Spring.
Sihanoukville Infrastructure and Real Estate. 2009. Sihanoukville Cambodia. May 2009. Still Going Strong. http://blog2.sihanoukville-cambodia.com/2009/05/sihanoukville-cambodia-may-2009-still.html
Smiddy, M. 2012. Economic Diversification in Cambodia: Firm-Level Barriers and the Role of Policy. Paper prepared for the Study on Cambodia Critical Development Constraints, under TA 7686 Diagnosing Critical Constraints to Growth and Structural Transformation in Selected Developing Member Countries. Manila: Asian Development Bank.
Soto-Viruet, Y., and Y. Fong-Sam. 2013. The Mineral Industry of Cambodia. Advance release, U.S. Geological Survey. 2011. http://minerals.usgs.gov/minerals/pubs/country/2011/myb3-2011-cb.pdf
State Secretariat of Civil Aviation website. http://www.civilaviation.gov.kh/
Supreme National Economic Council (SNEC). 2011. Cambodia Tourism Sector Development: Resiliency and Linkages: Post Crisis Assessment. SNEC Working Paper. Phnom Penh.
Transparency International. 2013a. Corruption Perceptions Index 2013. http://cpi.transparency.org/cpi2013/results/
______. 2013b. Global Corruption Barometer. 2013. http://www.transparencia.o r g . e s / B A R O M E T R O _ G L O B A L /Bar%C3%B3metro_Global_2013/Global_Corruption_Barometer_2013.pdf?bcsi_s c a n _ d a b 5 2 9 4 b 1 4 4 7 3 6 b 1 = 0 & b c s i _scan_filename=Global_Corruption_Barometer_2013.pdf
United Nations Commodity Trade Statistics Database (UN Comtrade). http://comtrade.un.org/
United Nations Development Programme (UNDP). 2011. Human Capital Implications of Future Economic Growth in Cambodia: Elements of a Suggested Roadmap. Phnom Penh: UNDP Cambodia and Supreme National Economic Council. http://library.ncdd.gov.kh/DocumentId/14109360571

149
References
United Nations and Kingdom of Cambodia (UN and Kingdom of Cambodia). 2010. United Nations Development Assistance Framework 2011–2015. Phnom Penh. http://www.un.org.kh/undp/media/files/Cambodia%20UNDAF%202011-2015.pdf
UNESCO Institute for Statistics. Cambodia UIS Statistics in Brief. http://stats.uis.unesco.org/unesco/TableViewer/d o c u m e n t . a s p x ? R e p o r t I d = 1 2 1 & I F _Language=eng&BR_Country=4060&BR_Region=40515
World Bank. 2004. Cambodia Seizing the Global Opportunity: Investment Climate Assessment and Reform Strategy. Report No. 27925-KH. Washington, DC. http://www-wds.worldbank.org/external/default/WDSContentServer/WDSP/IB/2004/08/16/000160016_20040816105431/Rendered/PDF/279250KH.pdf
______. 2009. Sustaining Rapid Growth in a Challenging Environment. Cambodia Country Economic Memorandum. Washington, DC. http://www.hks.harvard.edu/fs/drodrik/Growth%20diagnostics%20papers/Cambodia.pdf?bcsi_scan_dab5294b144736b1=qWbhmXBZjxGheaLJvtSXKTuZriwpAAAAmDHJOw==&bcsi_scan_filename=Cambodia.pdf
______. 2010. Providing Skills for Equity and Growth: Preparing Cambodia’s Youth for the Labor Market. Washington, DC. http://www-wds.worldbank.org/external/default/WDSContentServer/WDSP/IB/2011/03/08/000356161_20110308022818/Rendered/PDF/599890Replacement0Box358305B01PUBLIC100.pdf?bcsi_scan_dab5294b144736b1=zhgg3qOLNK+1SCrXle08p7DXaukpAAAAEUDrOw==:1
______. 2012. Matching Aspirations: Skills for Implementing Cambodia’s Growth Strategy. Washington, DC. http://www-wds.worldbank.org/external/default/WDSContentServer/WDSP/IB/2012/03/27/000356161_20120327004645/Rendered/PDF/673490SR0P11740lish021Mar120preview.pdf?bcsi_scan_dab5294b144736b1=wu
UnlV2gv4JzrDF1hoayxNkaq6kpAAAAjprqOw==&bcsi_scan_filename=673490SR0P11740lish021Mar120preview.pdf
______. 2014. Doing Business 2015: Going Beyond Efficiency. Economy Profile 2015: Cambodia. Washington DC. http://www.doingbusiness.org/~/media/GIAWB/Doing%20Business/Documents/Annual-Reports/English/DB15-Full-Report.pdf
______. Atlas of Social Protection: Indicators of Resilience and Equity database. http://data.worldbank.org/data-catalog/atlas_social_protection accessed August 2014.
______. Enterprise Surveys. http://www.enterprisesurveys.org
______. Global Partnership for Education Database. www.globalpartnership.org
______. Global Social Protection Database. http://datatopics.worldbank.org/aspire/
______. World Development Indicators (WDI) database. http://data.worldbank.org/data-catalog/world-development-indicators
______. Worldwide Governance Indicators. http://data.worldbank.org/data-catalog/worldwide-governance-indicators
World Bank and Asian Development Bank (ADB). 2012. Cambodia Investment Climate Assessment. Phnom Penh. Unpublished survey data.
World Bank and AusAID. 2012. Cambodia Water Supply and Sanitation Sector Review.
World Bank and International Finance Corporation (IFC). 2009. Cambodia—A Better Investment Climate to Sustain Growth: Second Investment Climate Assessment. Washington, DC. http://documents.worldbank.org/curated/en/2009/04/11415135/cambodia-better-investment-climate-sustain-growth-second-investment-climate-assessment-cambodia-better-investment-climate-sustain-growth-second-investment-climate-assessment
______. 2007. Doing Business 2008. Washington, DC. http://www.doingbusiness.org/reports/global-reports/doing-business-2008
______. 2013a. Doing Business, website. http://www.doingbusiness.org

150
Cambodia: Critical Development Constraints Country Diagnostic Studies
______. 2013b. Doing Business 2013: Smarter Regulations for Small and Medium Size Enterprises. Washington, DC. http://www.doingbusiness.org/~/media/GIAWB/Doing%20Business/Documents/Annual-Reports/English/DB13-full-report.pdf?bcsi_scan_dab5294b144736b1=1&bcsi_scan_e 4 1 d d c 7 3 1 6 6 b c 1 e b = 0 & b c s i _ s c a n _filename=DB13-full-report.pdf
______. 2013c. Doing Business 2014—Economy Profile: Brunei Darussalam. Washington, DC. http://www.doingbusiness.org/data/exploreeconomies/~/media/giawb/doing%20business/documents/profiles/country/BRN.pdf?ver=2
______. 2013d. Doing Business 2014—Economy Profile: Cambodia. Washington, DC. http://www.doingbusiness.org/data/e x p l o re e c o n o m i e s / ~ / m e d i a /g i aw b /doing%20business/documents/profiles/country/KHM.pdf?ver=2
______. 2013e. Doing Business 2014—Economy Profile: Indonesia. Washington, DC. http://www.doingbusiness.org/data/e x p l o re e c o n o m i e s / ~ / m e d i a /g i aw b /doing%20business/documents/profiles/country/IDN.pdf?ver=2
______. 2013f. Doing Business 2014—Economy Profile: Lao PDR. Washington, DC. http://www.doingbusiness.org/data/e x p l o re e c o n o m i e s / ~ / m e d i a /g i aw b /doing%20business/documents/profiles/country/LAO.pdf
______. 2013g. Doing Business 2014—Economy Profile: Malaysia. Washington, DC. http://www.doingbusiness.org/data/e x p l o re e c o n o m i e s / ~ / m e d i a /g i aw b /doing%20business/documents/profiles/country/MYS.pdf
______. 2013h. Doing Business 2014—Economy Profile: Myanmar. Washington, DC. http://www.doingbusiness.org/data/e x p l o re e c o n o m i e s / ~ / m e d i a /g i aw b /doing%20business/documents/profiles/country/MMR.pdf
______. 2013i. Doing Business 2014—Economy Profile: Philippines. Washington, DC. http://www.doingbusiness.org/data/e x p l o re e c o n o m i e s / ~ / m e d i a /g i aw b /doing%20business/documents/profiles/country/PHL.pdf
______. 2013j. Doing Business 2014—Economy Profile: Singapore. Washington, DC. http://www.doingbusiness.org/data/e x p l o re e c o n o m i e s / ~ / m e d i a /g i aw b /doing%20business/documents/profiles/country/SGP.pdf
______. 2013k. Doing Business 2014—Economy Profile: Thailand. Washington, DC. http://www.doingbusiness.org/data/e x p l o re e c o n o m i e s / ~ / m e d i a /g i aw b /doing%20business/documents/profiles/country/THA.pdf
______. 2013l. Doing Business 2014—Economy Profile: Vietnam. Washington, DC. http://www.doingbusiness.org/data/e x p l o re e c o n o m i e s / ~ / m e d i a /g i aw b /doing%20business/documents/profiles/country/VNM.pdf
______. 2013m. Doing Business 2014: Understanding Regulations for Small and Medium-Size Enterprises. Washington, DC. http://www.doingbusiness.org/reports/global-reports/doing-business-2014
World Economic Forum (WEF). 2008a. Global Competitiveness Report 2008–2009. Geneva. http://www.weforum.org/pdf/GCR08/GCR08.pdf
______. 2008b. Travel and Tourism Competitiveness Report. Geneva. http://www.weforum.org/pdf/Global_Competitiveness_Reports/TTReport/TTfullreport.pdf
______. 2013a. Global Competitiveness Report 2013–2014. Geneva. http://w w w 3 . w e f o r u m . o r g / d o c s / W E F _GlobalCompetitivenessReport_2013-14.pdf
______. 2013b. Travel and Tourism Competitiveness Report. Geneva. http://reports.weforum.org/travel-and-tourism-competitiveness-report-2013/

151
References
World Health Organization (WHO). 2011. Western Pacific Country Health Information Profiles: 2011 Revision. http://www.wpro.who.int/health_information_evidence/documents/CHIPS2011.pdf
______. 2014. Western Pacific Regional Office Dengue Situation Update as of 15 January 2014. http://www.wpro.who.int/emerging_diseases/Dengue.Biweekly.15Jan2014.pdf?ua=1
World Health Organization and Ministry of Health, Cambodia. 2012. Cambodia Health Service Delivery Profile 2012. http://www.wpro.who.int/health_services/service_delivery_profile_cambodia.pdf
World Health Organization and United Nations Children’s Fund (WHO and UNICEF). Joint Monitoring Program for Water Supply and Sanitation Database. http://www.wssinfo.org/data-estimates
World Travel and Tourism Council website. http://www.wttc.org/research
Zhuang, J. ed. 2010. Poverty, Inequality, and Inclusive Growth in Asia: Measurement, Policy Issues, and Country Studies. Mandaluyong City: Asian Development Bank.


Cambodia: Diversifying Beyond Garments and TourismCountry Diagnostic Study
Cambodia has enjoyed over 2 decades of robust growth, with rising foreign investment and deepening integration into global and regional value chains. The country—once riven by civil war and conflict—is now politically stable and increasingly making its mark as the world’s eighth-largest rice producer, Asia’s 10th-largest garment exporter, and a rising tourist destination. Yet Cambodia faces considerable challenges. It suffers from major infrastructure deficits; limited skills development and education quality; and weaknesses in governance. Fiscal resources are also stretched. Moreover, for a successful transition to a modern industrialized economy, Cambodia needs to diversify and upgrade its productive capabilities. This publication examines the opportunities and the challenges, and offers recommendations for long-term socioeconomic strategy.
About the Asian Development Bank
ADB’s vision is an Asia and Pacific region free of poverty. Its mission is to help its developing member countries reduce poverty and improve the quality of life of their people. Despite the region’s many successes, it remains home to approximately two-thirds of the world’s poor: 1.6 billion people who live on less than $2 a day, with 733 million struggling on less than $1.25 a day. ADB is committed to reducing poverty through inclusive economic growth, environmentally sustainable growth, and regional integration.
Based in Manila, ADB is owned by 67 members, including 48 from the region. Its main instruments for helping its developing member countries are policy dialogue, loans, equity investments, guarantees, grants, and technical assistance.
ASIAN DEVELOPMENT BANK6 ADB Avenue, Mandaluyong City1550 Metro Manila, Philippineswww.adb.org