Adaptive Variation in Desiccation Resistance in Rhagoletis
75
Western Washington University Western Washington University Western CEDAR Western CEDAR WWU Graduate School Collection WWU Graduate and Undergraduate Scholarship Winter 2016 Adaptive Variation in Desiccation Resistance in Rhagoletis Adaptive Variation in Desiccation Resistance in Rhagoletis Jennifer L. (Jennifer Lynn) Hill Western Washington University, [email protected] Follow this and additional works at: https://cedar.wwu.edu/wwuet Part of the Biology Commons Recommended Citation Recommended Citation Hill, Jennifer L. (Jennifer Lynn), "Adaptive Variation in Desiccation Resistance in Rhagoletis" (2016). WWU Graduate School Collection. 473. https://cedar.wwu.edu/wwuet/473 This Masters Thesis is brought to you for free and open access by the WWU Graduate and Undergraduate Scholarship at Western CEDAR. It has been accepted for inclusion in WWU Graduate School Collection by an authorized administrator of Western CEDAR. For more information, please contact [email protected].
Transcript of Adaptive Variation in Desiccation Resistance in Rhagoletis

Western Washington University Western Washington University
Western CEDAR Western CEDAR
WWU Graduate School Collection WWU Graduate and Undergraduate Scholarship
Winter 2016
Adaptive Variation in Desiccation Resistance in Rhagoletis Adaptive Variation in Desiccation Resistance in Rhagoletis
Jennifer L. (Jennifer Lynn) Hill Western Washington University, [email protected]
Follow this and additional works at: https://cedar.wwu.edu/wwuet
Part of the Biology Commons
Recommended Citation Recommended Citation Hill, Jennifer L. (Jennifer Lynn), "Adaptive Variation in Desiccation Resistance in Rhagoletis" (2016). WWU Graduate School Collection. 473. https://cedar.wwu.edu/wwuet/473
This Masters Thesis is brought to you for free and open access by the WWU Graduate and Undergraduate Scholarship at Western CEDAR. It has been accepted for inclusion in WWU Graduate School Collection by an authorized administrator of Western CEDAR. For more information, please contact [email protected].
ADAPTIVE VARIATION IN DESICCATION RESISTANCE IN RHAGOLETIS
By
Jennifer Lynn Hill
Accepted in Partial Completion
of the Requirements for the Degree
Master of Science
Kathleen L. Kitto, Dean of the Graduate School
ADVISORY COMMITTEE
Chair: Dr. Dietmar Schwarz
Dr. Merrill Peterson
Dr. Robin Kodner

MASTERʼS THESIS
In presenting this thesis in partial fulfillment of the requirements for a masterʼs degree at Western Washington University, I grant to Western Washington University the non-exclusive royalty-free right to archive, reproduce, distribute, and display the thesis in any and all forms, including electronic format, via any digital library mechanisms maintained by WWU.
I represent and warrant this is my original work, and does not infringe or violate any rights of others. I warrant that I have obtained written permissions from the owner of any third party copyrighted material included in these files.
I acknowledge that I retain ownership rights to the copyright of this work, including but not limited to the right to use all or part of this work in future works, such as articles or books.
Library users are granted permission for individual, research and non-commercial reproduction of this work for educational purposes only. Any further digital posting of this document requires specific permission from the author.
Any copying or publication of this thesis for commercial purposes, or for financial gain, is not allowed without my written permission.
Jennifer Hill
January 14, 2016

ADAPTIVE VARIATION IN DESICCATION RESISTANCE IN RHAGOLETIS
A Thesis
Presented to
The Faculty of
Western Washington University
In Partial Fulfillment
Of the Requirements for the Degree
Master of Science
By
Jennifer Lynn Hill
January 2016

iv
ABSTRACT
Despite the ever-present challenges associated with invasive species, many
environmental barriers exist that limit the spread of exotics. However, there is a growing
number of examples of species overcoming these constraints via adaptive evolution years or
decades after their initial introduction. The necessary genetic variation stems either from
hybridization with a closely related species, or from shifting allele frequencies from standing
variation in the population. Since its introduction to the Pacific Northwest, the apple maggot
fly, Rhagoletis pomonella (Walsh 1867), has invaded all of coastal Washington, but has only
small, isolated populations in the central and eastern parts of the state. The Cascade
Mountains form a rain shadow that restricts the amount of precipitation in these regions,
making it much drier than the western parts of Washington. I investigated aridity as an
environmental constraint for the spread of R. pomonella, as well as potential sources of
genetic variation for desiccation resistance in sympatric populations. First, I tested the
potential for dry conditions, like those in the interior of Washington, to influence fitness in
Rhagoletis flies, and act as a factor limiting their distribution. I found that individuals from a
wetter part of Washington did not survive as well in dry conditions, but that individuals from a
drier location were unaffected by desiccation treatment. The percent of weight that each
pupa had remaining after treatment was the best predictor of survival. Second, I examined
the variation in desiccation resistance in R. pomonellaʼs native sister-species, R. zephyria
across a finer environmental gradient, to look at possible adaptive variation within the
species. I found that R. zephyria pupae from west of the Cascade Range show less
desiccation resistance than those east of the Range, and that this pattern is indicative of
local adaptation. Average annual precipitation and elevation of each transect site were the
best predictors of how much weight each pupa would retain after desiccation treatment.
v
Finally, I measured desiccation resistance between apple-infesting R. pomonella, and
hawthorn-infesting R. pomonella to begin to gauge the possible standing variation present in
the speciesʼ genome. I found that the hawthorn host-race shows significantly more
desiccation resistance than the apple host-race. This could be because the hawthorn host-
race must endure a longer pre-winter diapause period, when conditions would be less
favorable for water-balance strategies. The factors limiting the spread of R. pomonella are
complex, but variation exists in both a native sister species and a sympatric host race.
Determining whether there is a genetic factor associated with resistance would allow us to
begin to gauge the relative importance of introgression and standing variation in the invasion
of R. pomonella into the Pacific Northwest.

vi
ACKNOWLEDGEMENTS
This thesis would not have been possible without the help and support of many
dedicated individuals. First, I thank my adviser, Dietmar Schwarz, for knowing when to step
in and when to hang back, for giving me the freedom to find my own research path and the
support to follow it. Huge thanks also go to Keely Hausken and Neal Shaffer, for being my
best students, amazing friends, and irreplaceable assistants through this entire process. I
am so grateful to my committee members, Merrill Peterson and Robin Kodner, who helped
me find the story of my thesis and for their expertise and feedback. I am grateful also to all
those working in the Biology Stockroom and to Mary Ann Merrill: their help with supplies and
procedures was invaluable through these years. I would also like to thank Meredith
Doellman and Klara Schwarz for their help with my many samples, and all my lab mates for
providing a space for me to talk through the issues surrounding this work. To all of my fellow
graduate students: it has been a joy to share an office, a life, and a passion for science with
you, thank you so much for keeping it from being a chore. I also thank my parents for always
supporting my adventures, even when they pull me so far away. I would never have been
able to complete this thesis without Tyler Spillane, who went through this whole process
alongside me and who helped make each step more exciting. Thank you to all of my funding
sources: WWU RSP, the Hodgson and Thon families, and the USDA.

vii
TABLE OF CONTENTS
ABSTRACT ………………………………………………………………………………………….iv
ACKNOWLEDGEMENTS ………………………………………………………………………….vi
LIST OF FIGURES ………………………………………………………………………………….ix
LIST OF TABLES ……………………………………………………………………………………x
INTRODUCTION ....................................................................................................................1
METHODS …………………………………………………………………………………………...9
Collection and desiccation treatment for all experiments ……………………….10
Survival Experiment – Does desiccation resistance enhance fitness under drought conditions? …………………………………………………………………….14
Cascade Transect – Is there adaptive variation in desiccation resistance in Rhagoletis zephyria? ……………………………………………………………………15
Host Comparison – Is there variation between different host races of Rhagoletis pomonella? …………………………………………………………………16
RESULTS …………………………………………………………………………………………...17
Survival Experiment – Does desiccation resistance enhance fitness under drought conditions? …………………………………………………………………….17
Cascade Transect – Is there adaptive variation in desiccation resistance in Rhagoletis zephyria? ……………………………………………………………………23
Host Comparison – Is there variation between different host races of Rhagoletis pomonella? …………………………………………………………………27
viii
DISCUSSION ……………………………………………………………………………………….29
Survival Experiment – Does desiccation resistance enhance fitness under drought conditions? …………………………………………………………………….29
Cascade Transect – Is there adaptive variation in desiccation resistance in Rhagoletis zephyria? ……………………………………………………………………31
Host Comparison – Is there variation between different host races of Rhagoletis pomonella? …………………………………………………………………34
Potential Mechanisms of Desiccation Resistance ………………………………...35
Introgression or standing variation? ……………................................……………40
Conclusions ………………………………………………………………………………41
LITERATURE CITED ...........................................................................................................43
APPENDIX ...........................................................................................................................50

ix
LIST OF FIGURES
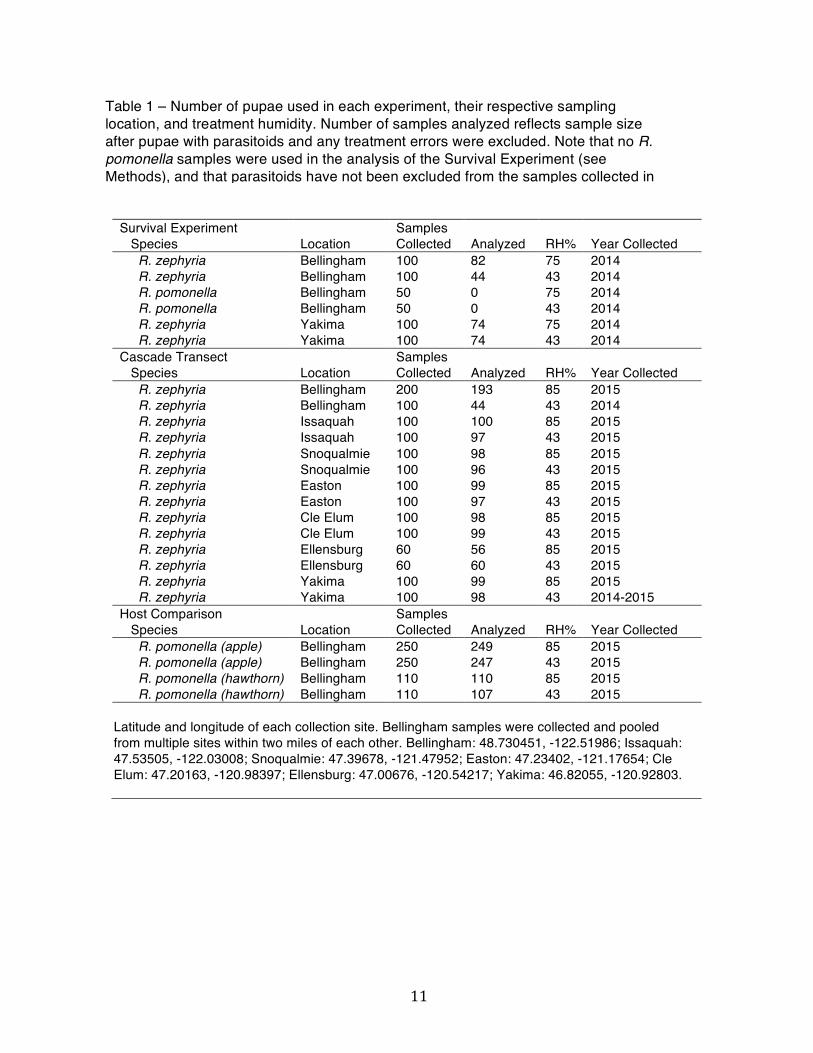
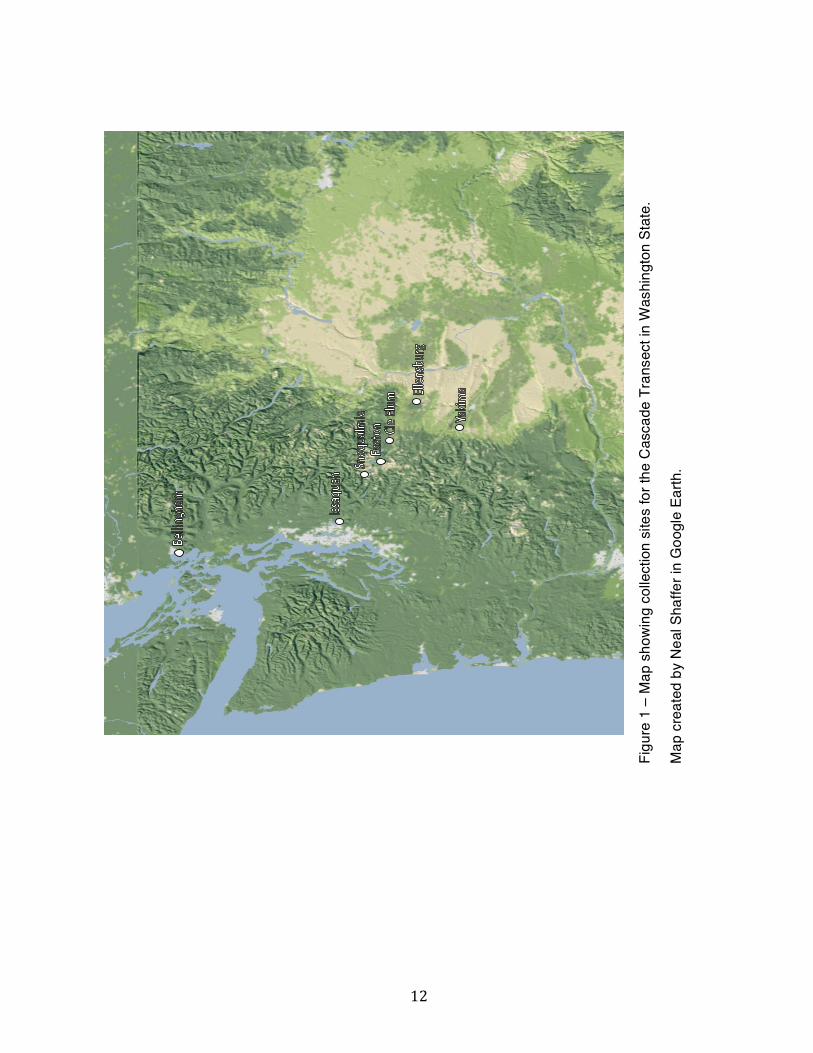
Figure 1 – Map showing collection sites for the Cascade Transect in Washington State. ...12
Figure 2 – Percentage of successfully eclosing flies in each treatment group, shown by location and treatment relative humidity. …..…..………………………………………………..18
Figure 3 – Percent weight remaining for two populations of R. zephyria (Bellingham or Yakima) after treatment at high (75%) or low (43%) relative humidity for eight days. ..........19
Figure 4 – Scatterplots representing the factors (Percent Weight Remaining and Initial Weight) included in the best fitting logistic regression model that predicts survival in R. zephyria populations in both high and low relative humidities. ……………....................…...22
Figure 5 – Initial weight for different populations of Rhagoletis zephyria flies collected across a Cascade transect before relative humidity treatment. ………....................………………...24
Figure 6 – Percent weight remaining for different populations of Rhagoletis zephyria flies collected along a Cascade transect and kept at either high humidity (85%) or low humidity (43%) for eight days. ……………………………………..........................................................25
Figure 7 – Percent weight remaining for different host races of Rhagoletis flies collected in Bellingham and kept at either high humidity (85%) or low humidity (43%) for eight days. ...28

x
LIST OF TABLES
Table 1 – Number of pupae used in each experiment their respective sampling location and treatment humidity. ...............................................................................................................11
Table 2 – Table of AIC values for logistic regressions of factors predicting survival to eclosion of each pupa. …………………………………………………………..................…….21
Table 3 – Table of AIC values for linear regressions of mean PWR against environmental factors for populations forming the Cascade Transect. ........................................................26
Appendix Table 1 – Table of Genome Association samples, showing the individual identifier, initial pupal weight, and percent weight remaining after treatment for each sample. ...........52
INTRODUCTION
Invasions by exotic species have been of great interest to ecologists and
evolutionary biologists for decades. As our world has become ever more globalized, humans
have carried new species into virtually every environment on earth. Invasives provide
unintended experimental systems for the study of interspecies interactions, but often have
drastic negative effects as well (Ellstrand & Schierenbeck 2000). These species can deplete
biodiversity by outcompeting or preying upon native species (Thompson 1991; Elliott et al.
2001; Inoue et al. 2007; Karatayev et al. 2014). They can also cause problems for humans,
increasing health risks through the introduction of new disease vectors, as well as
endangering cultural heritage through the extinction of native species (Manachini et al. 2013;
Montarsi et al. 2013). Invasive species also pose a serious threat as agricultural pests, and
can cost billions of dollars in control measures and damaged crops (Pimentel et al. 2001;
Oliveira et al. 2013).
Despite the nearly ubiquitous presence of exotic species, there are nevertheless
many limitations to invasions, and the vast majority of introduced species never spread
aggressively (Williamson 1993). Even those that do spread often experience a lag of years
or decades after initial introduction and before their subsequent invasion of surrounding
habitats (Ewel et al. 1999). Competition with an already well-established community can
pose a serious obstacle to a species trying to gain a foothold in a new environment. For
example, Eskelinen and Harrison (2014) found that benefits to invasive grasses from
experimentally increased rainfall and nutrients were reduced or completely offset by
competition from native species. Similarly, Argentine ants decreased in number in the
presence of a native species of ant, unless their colony was at least 5-10 times larger than
that of the natives (Walters & Mackay 2005). Another problem, for invasive parasites or
2
parasitoids, is host compatibility. Some exotics are host generalists, like Drosophila
simulans, a human commensal that has been spread all over the world and that will mate on
a wide variety of fruits and vegetables (Matute & Ayroles 2014). Others are more specialized,
and must find a suitable host for feeding or mating upon arrival to the new location. This can
be accomplished through the introduction of the original host prior to the exotic insectʼs
arrival, or through the expansion of the insectʼs niche breadth to include other hosts
(Mattson et al. 2007).
Equally important limitations to invasion can arise simply from the abiotic factors
present at the site of introduction. Regional differences in temperature, soil nutrients, or
rainfall amount and frequency can have important effects on a speciesʼ range, particularly
one recently introduced into the environment. For example, though Argentine ants are
successful invaders in many habitats, they have a high level of cuticular permeability
compared to native Californian species, and are therefore susceptible to desiccation stress
(Schilman et al. 2005). This is likely what has limited their invasions into hotter, drier
locations, even on a relatively fine spatial scale (Schilman et al. 2007). Likewise, Lantana
camara, a highly successful invasive shrub from tropical America, has a distribution in the
Galapagos that is limited by its drought stress strategy. The plant relies on its deep root
system to avoid the effects of dry conditions, however, in areas that receive less than
500mm of rainfall each year, the water table is too low even for L. camara, and it has failed
to colonize the driest parts of the islands where its more drought-tolerant relative, L.
peduncularis thrives (Castillo et al. 2006). It may actually be very common for certain
environments to have a decreased susceptibility to invasions. Sites that have harsher abiotic
conditions often have fewer invasions and while there are likely a number of limiting factors

3
at work in these environments, abiotic stressors play a central role (reviewed in Zefferman et
al. 2015).
It is, however, possible for an invasive species to overcome such constraints. There
is increasing evidence that certain species have evolved to be more invasive after their initial
introduction into an environment (Ellstrand & Schierenbeck 2000). Two major sources of
genetic variation are available to these exotic species that could help them relieve the abiotic
stress of a potential habitat: hybridization with a locally adapted species, and standing
genetic variation within their own population.
Hybridization between an invasive species and its native relative can be a difficult
phenomenon to study, particularly in animals, as it is often a rapid evolutionary event and is
viewed as relatively rare in animals (Mallet 2005). Baseline data from before an invasion can
be difficult to obtain, and until recently, backcrossed individuals could be difficult to identify
with certainty (Rhymer & Simberloff 1996). Scientists also disagree on what constitutes a
separate species, as hybridization events producing fertile offspring violate the Biological
Species Concept. In extreme cases, hybridization can fuse populations to create a new,
separate population, or hybrids may replace one or both of the parental groups (Rhymer &
Simberloff 1996; Grant & Grant 2014). At other times, hybridization does not have as
dramatic an outcome, and introgression via fertile hybrids backcrossing with parental
species can spread novel alleles into one or both parental populations (Lee 2002; Currat et
al. 2008; Excoffier et al. 2009; Pardo-Diaz et al. 2012). When this introgression passes traits
that increase the fitness of an organism in an unfamiliar habitat, it can help exotic species
become more aggressive in their spread into new environments (Abbott 1992; Perry et al.
2001). There are many examples of exotic species hybridizing with one another to create
enhanced invasiveness, but situations in which a potential invasive interbreeds with a native

4
species are comparatively rare (Ellstrand & Schierenbeck 2000). One likely example of this
phenomenon in animals is hybridization between Neanderthals (Homo neanderthalensis)
and modern humans (H. sapiens). As Homo sapiens first began their migration into Europe
and Asia from Africa, they encountered and interbred with H. neanderthalensis to the point
that people originating from places other than sub-Saharan Africa today can attribute 1-4%
of their genomes to Neanderthal ancestors (Lowery et al. 2013). Neanderthal genes
introgressed into the H. sapiens populations, and were incorporated into our early ancestorsʼ
genome, affecting traits from metabolism to cognitive development (Green et al. 2014).
Some of these were detrimental to the fitness of the resulting generations, but many were
selected for, including alleles that would have helped make early H. sapiens more fit to live
in a non-African environment (Sankararaman et al. 2014). This introgression may have been
part of what allowed our predecessors to spread so successfully across the globe.
Another major source of genetic variation is the standing variation that may already
be present in a populationʼs gene pool. If a species finds itself in a new environment where
one previously uncommon allele increases fitness in those individuals, that allele can quickly
become much more common in the population. Indeed, adaptation arising from standing
variation in the gene pool could be the most rapid way a species can respond to new
environmental challenges (Barrett & Schluter 2008). The potential speed of such adaptation
is evident in the case of the invasive copepod, Eurytemora affinis. This coastal species has
invaded freshwater ecosystems in multiple independent instances, showing extreme
adaptability between saline and freshwater environments (Lee 1999). One possible
explanation for this is standing variation in the genes controlling relevant physiological traits,
such as ion transport, in the original populations (Lee et al. 2012). If some individuals within
the introduced population possess a genotype that positively influences their fitness in the

5
new environment, those genes will be disproportionately passed to the next generation. In
the case of Eurytemora affinis, this shift to survival in a freshwater environment and an
intolerance for a saline one can take place in as little as 12 generations in a lab setting, and
over just a few decades in the wild (Lee et al. 2011).
Another notable example of adaptation through standing variation is in the
Rhagoletis fruit fly complex. An ancestral host race of Rhagoletis pomonella (Walsh)
infested hawthorn (Crataegus spp.) in the eastern United States, but a subset shifted hosts
~170 years ago to the introduced apple (Malus pumila), a tree that fruits earlier than
hawthorn (Feder et al. 1997). Genomic inversions arose in a population of these flies in
Mexico about 1.5 million years ago that are strongly associated with the duration of pupal
diapause, and were then introduced into eastern populations through gene flow (Michel et al.
2007). That variation in diapause length allowed R. pomonella to colonize this novel fruit
environment through adaptation to the earlier fruiting schedule (Feder et al. 2003).
Populations also show variation in diapause length in latitudinal clines, with individuals in
more southern locations having longer diapause durations (Dambroski & Feder 2007). This
means that, though there will be warmer temperatures for a longer period of time before the
southern fliesʼ hosts become available, their emergence will still align with fruiting time.
Further, variation in diapause length is present within single populations, allowing R.
pomonella to colonize host plants that fruit at different times (Feder et al. 2003). Here, I
investigate the potential for that same species to overcome climatic constraints and invade
the major apple-growing regions in the arid part of Washington State.
Rhagoletis fruit flies in the pomonella species group depend completely on their
specific fruit hosts. They live their entire larval stage feeding inside the fruit until they are
developed enough to pupariate and overwinter. In addition, the adult flies forage on the
6
surface of the plantsʼ leaves, oviposit eggs into the fruit, and mate on the host plant (Bush
1966). Each species infests a different host plant species, or small group of species, and
while the flies show strong host loyalty, they do occasionally explore other hosts
(Huddleston 2013). Historical host shifts have led to sympatric speciation events within the
species group, and resulted in very closely related, but genetically distinct populations living
on separate hosts, sometimes in close proximity to one another (Bush, 1969; Prokopy &
Bush 1972; Schwarz et al. 2007).
In the Pacific Northwest, the invasive Rhagoletis pomonella infests the fruits of apple
trees (Malus sp.) and native and ornamental hawthorn bushes (Crataegus douglasii and
Crataegus suchsdorfii [both native], Crataegus monogyna [introduced ornamental]) almost
exclusively in the coastal parts of Washington and Oregon. Its native relative, R. zephyria
Snow, infests snowberry fruits (Symphoricarpos albus laevigatus) throughout the region
(Hood et al. 2013). Rhagoletis pomonella was likely introduced to the western part of North
America via infested apples brought into Portland, Oregon in the late 1970s, and has
expanded its range north to British Columbia and south to California (AliNiazee & Wescott
1987). So far, R. pomonella has been found only in small populations living on hawthorn in
the central and eastern parts of Washington, and not in the large commercial orchards in the
same region (Hood et al. 2013).
Climatically, central and eastern Washington are very different from the western third
of the state due to the rain shadow formed by Cascade Mountains (Siler et al. 2013). For
example, on the western side, Bellingham receives 90cm of rain annually on average, while
Yakima, on the eastern side, only receives 22cm (Arguez et al. 2010). This results in a
vastly different environment with which flies undergoing diapause must contend. It is

7
possible that the harsher drought-like conditions in the interior of Washington act as a
limiting factor for R. pomonella that keeps them largely bounded west of the Cascade Range.
Variation in climatic and geographic factors can be a major challenge for univoltine
insects like Rhagoletis flies that spend the majority of their lives as pupae in diapause (Hahn
& Denlinger 2007; Ragland et al. 2012; Kleynhans et al. 2014). During the first days of
pupariation, Rhagoletis pupae lose much of their water weight in preparation for diapause
(Bush 1966). Because the flies are in an immobile stage for many months, they are largely
at the mercy of the environmental conditions surrounding them, particularly initially when
sclerotization of the puparium is not complete (Neilson 1964; Ashley et al. 1976; Hulthen &
Clarke 2006; Yee 2013b). Pupae are unable to augment their surroundings behaviorally or
relocate to more favorable locations, so the water they do retain is due in large part to the
moisture level in their environment at this time (Fitt 1981). They tend to have small body
sizes and therefore large surface area/volume ratios that result in increased exchanges with
the surroundings (Gibbs 2011). Pupae that undergo a long overwintering period also must
keep enough body moisture to last throughout this time and too much desiccation can cause
mortality during this stage, or influence adult fitness upon eclosion (Hahn & Denlinger 2007).
Other species of insect have shown preference for a certain moisture level in which to enter
diapause as a strategy to resist desiccation. In its larval stage, Bactrocera tryoni, the
Queensland fruit fly, chooses soil of 75% moisture over both 0% and 100% moisture in
which to pupariate, and shows a much higher mortality rate when pupariating at either
extreme (Hulthen & Clarke 2006).
The impact of dry conditions on survival can be a limiting factor for the distributions
of insects. Glossina pallidipes, a tsetse fly, has a distribution in eastern Africa that is likely
limited by the intensity and duration of the weather patterns it experiences during pupariation.

8
The species exhibits enough phenotypic plasticity to withstand a fairly wide range of
temperatures and relative humidity, but still shows significant changes in survival in hotter,
dryer conditions (Kleynhans et al. 2014). If Rhagoletis fruit flies are affected in a similar way,
a difference in desiccation resistance could be integral to a speciesʼ ability to live in a much
drier environment, like that on the lee side of the Cascade Range. If R. zephyria has a more
robust desiccation resistance than R. pomonella, it could help to explain the wide distribution
of the former, and the limited distribution of the latter (Gibbs 2011).
While these two sister species remain ecologically distinct, they are capable of
hybridizing and producing fertile offspring in the wild (Feder et al. 1999; Green et al. 2013;
Arcella et al. 2015). Through these hybrids and subsequent backcrossing events, genetic
introgression is possible, and has been demonstrated to happen disproportionately in certain
genomic locations (Green et al. 2013). If the genomic regions correlate to regions that are
associated with resistance to environmental stressors, such as drought conditions, R.
pomonella may be able to gain favorable traits from its sister species, R. zephyria, that
would allow it to expand its range further into Washington. This possibility presents a serious
hazard for the apple industry of the state, which ranks as the most valuable agricultural
commodity produced in Washington, a value of $2.25 billion in 2012 (Mertz et al. 2013).
Currently, there is a zero-tolerance policy for apple flies in commercial orchards, and any
detection of R. pomonella could lead to intense quarantine measures (WSDA 2014).
Despite the economic threat, few have sought to determine experimentally which
environmental factors limit the range of the apple fly in Washington, or to what extent those
environmental barriers might hold in light of hybridization and standing variation. To begin
addressing this complex of questions, I examined desiccation resistance in the early pupal
stage of Rhagoletis development. Immediately after pupariation, flies are highly vulnerable

9
to desiccation, making it more likely to see differences in desiccation resistance during this
time (Boller & Prokopy 1976). My study was composed of three separate experiments. First,
I sought to test whether dry conditions and resistance to water loss under those conditions
influence survival in Rhagoletis flies by testing for desiccation resistance and examining the
relationship between water loss and survival probability (Survival Experiment). Second, I
examined the hypothesis that R. zephyria has adaptive variation in desiccation resistance
across an environmental gradient. If such variation exists, R. pomonella may be able to
access these adaptive traits via hybridization and introgression (Cascade Transect). Third, I
compared the relative desiccation resistance of the black hawthorn- and apple-infesting
populations of R. pomonella, to explore whether there is already standing variation within the
species. Such variation could increase their invasion potential through gene flow between
host races (Host Comparison). And finally, I have laid the groundwork for a genome-wide
association study that would allow examination of whether specific genomic regions are
associated with desiccation resistance, and if those regions show disproportionate
introgression (see Appendix).
METHODS
I conducted three experiments in order to assess whether dry conditions like those in
central Washington could be a limiting factor to R. pomonella and examine the sources of
variation in desiccation resistance that may be available to these invasive populations. I
used the Survival Experiment to gauge aridity as a limiting factor, the Cascade Transect to
explore geographic variation in R. zephyria desiccation resistance, and the Host
Comparison to look at standing variation already present within R. pomonellaʼs host races.
10
Collection and desiccation treatment for all experiments
I collected all Rhagoletis fly individuals from snowberry bushes and apple and
hawthorn trees in Washington State during August and September 2014-2015 (Table 1).
Although parasitization rates of R. pomonella flies are extremely low in the Pacific Northwest
(<1% in a single sample, [D. Schwarz, personal communication]), R. zephyria are commonly
infested with parasitoid wasps (mainly Opius lectoides and Opius downesi [Braconidae])
which, to my knowledge, are undetectable during diapause without dissection of the
puparium (AliNiazee 1985). I collected more snowberry flies than apple and hawthorn flies
when relevant to account for this phenomenon. I haphazardly picked ripe or overripe fruits
and spread the berries or apples into screens so that larvae would egress and fall into
plastic dishes below. I collected all egressed individuals daily between 10am and 2pm for
use in the desiccation experiments. During this time, most individuals pupariated and the
remaining individuals pupariated shortly after they were collected. Thus, these collection
procedures ensured that I used only pupae that had been in that stage for less than 24
hours. I collected the samples used in the Survival Experiment from Bellingham and Yakima,
while those for the Host Comparison were all from Bellingham. Pupae for the Cascade
Transect I collected from Bellingham and Yakima, as well as five sites between them (from
west to east): Issaquah, Snoqualmie, Easton, Cle Elum, and Ellensburg (Table 1 and Figure
1).
Pupae in all three experiments were haphazardly assigned in equal numbers to
either a high or low relative humidity (rh). The conditions were chosen to be representations
of the respective humidities in both the western and central parts of Washington. The
humidity chambers were kept constant through the use of saturated salt solutions, NaCl
(~75% rh) and K2CO3 (~43% rh) for the Survival Experiment, and KCl (~85% rh) and K2CO3
11
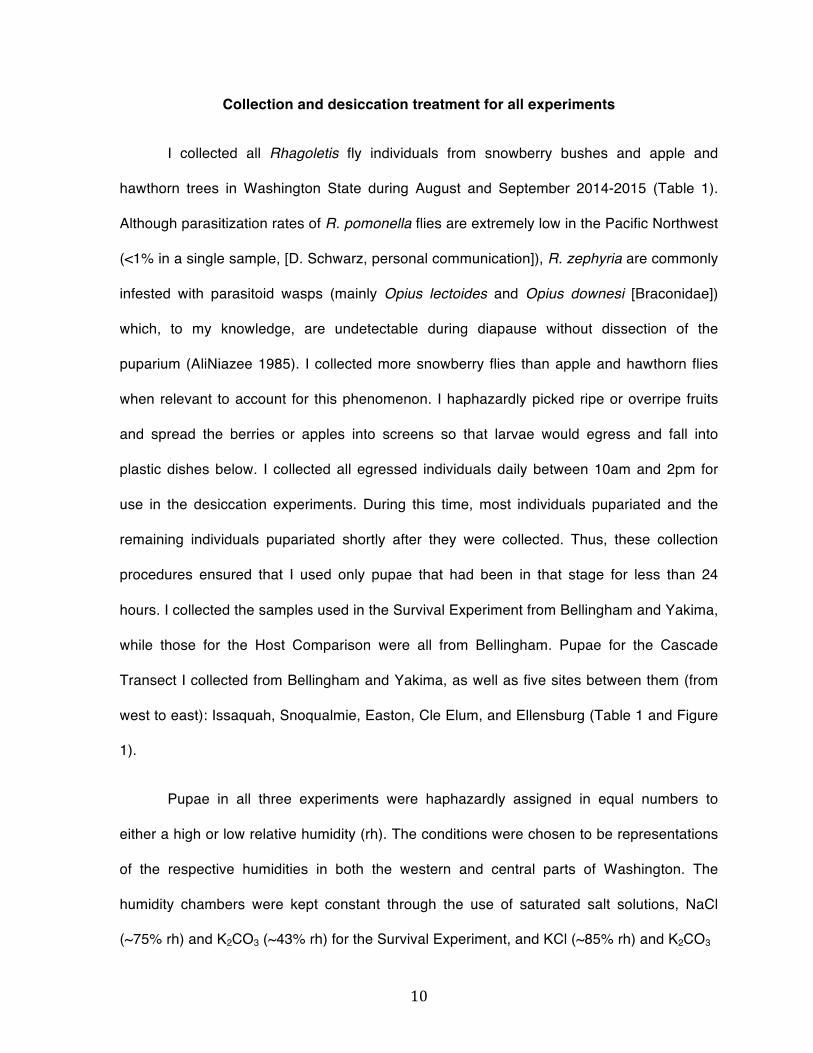
Survival Experiment Samples Species Location Collected Analyzed RH% Year Collected R. zephyria Bellingham 100 82 75 2014 R. zephyria Bellingham 100 44 43 2014 R. pomonella Bellingham 50 0 75 2014 R. pomonella Bellingham 50 0 43 2014 R. zephyria Yakima 100 74 75 2014 R. zephyria Yakima 100 74 43 2014 Cascade Transect Samples Species Location Collected Analyzed RH% Year Collected R. zephyria Bellingham 200 193 85 2015 R. zephyria Bellingham 100 44 43 2014 R. zephyria Issaquah 100 100 85 2015 R. zephyria Issaquah 100 97 43 2015 R. zephyria Snoqualmie 100 98 85 2015 R. zephyria Snoqualmie 100 96 43 2015 R. zephyria Easton 100 99 85 2015 R. zephyria Easton 100 97 43 2015 R. zephyria Cle Elum 100 98 85 2015 R. zephyria Cle Elum 100 99 43 2015 R. zephyria Ellensburg 60 56 85 2015 R. zephyria Ellensburg 60 60 43 2015 R. zephyria Yakima 100 99 85 2015 R. zephyria Yakima 100 98 43 2014-2015 Host Comparison Samples Species Location Collected Analyzed RH% Year Collected R. pomonella (apple) Bellingham 250 249 85 2015 R. pomonella (apple) Bellingham 250 247 43 2015 R. pomonella (hawthorn) Bellingham 110 110 85 2015 R. pomonella (hawthorn) Bellingham 110 107 43 2015
Latitude and longitude of each collection site. Bellingham samples were collected and pooled from multiple sites within two miles of each other. Bellingham: 48.730451, -122.51986; Issaquah: 47.53505, -122.03008; Snoqualmie: 47.39678, -121.47952; Easton: 47.23402, -121.17654; Cle Elum: 47.20163, -120.98397; Ellensburg: 47.00676, -120.54217; Yakima: 46.82055, -120.92803.
Table 1 – Number of pupae used in each experiment, their respective sampling location, and treatment humidity. Number of samples analyzed reflects sample size after pupae with parasitoids and any treatment errors were excluded. Note that no R. pomonella samples were used in the analysis of the Survival Experiment (see Methods), and that parasitoids have not been excluded from the samples collected in
12
Figu
re 1
– M
ap s
how
ing
colle
ctio
n si
tes
for t
he C
asca
de T
rans
ect i
n W
ashi
ngto
n St
ate.
Map
cre
ated
by
Nea
l Sha
ffer i
n G
oogl
e Ea
rth.
13
(~43% rh) for the Cascade Transect and Host Comparison (Carotenuto & DellIsola 1996;
Ragland et al. 2012). The chambers were monitored for humidity fluctuations using iButtons
(Maxim Integrated, San Jose, CA) set to record humidity every half hour throughout
treatment, and were opened everyday to weigh pupae, but were kept closed otherwise. After
opening, the high humidity tended to be lower (~7%) and the low humidity tended to be
higher (~5%) than prescribed levels, however they generally returned to treatment humidity
within three hours. The chambers were kept at 22° C in a 16:8 light:dark cycle throughout
the treatment. I placed each pupa into an open 0.67mL microfuge tube, in which they
remained for the duration of the experiment, and weighed them to 0.01 mg on the initial day
they were collected, and again once they had been in treatment for eight full days. Pupae
were not kept in soil (as they would live under natural conditions) so that I could better
control the humidity of the treatment. It was necessary to run the experiments using cohorts
of flies, as the necessary numbers for the entire study did not emerge from the fruit in a
single day. As soon as the pupae had been weighed the second time, I placed them all,
regardless of treatment, into a chamber held at their respective high humidity treatments and
4° C for five months to overwinter.
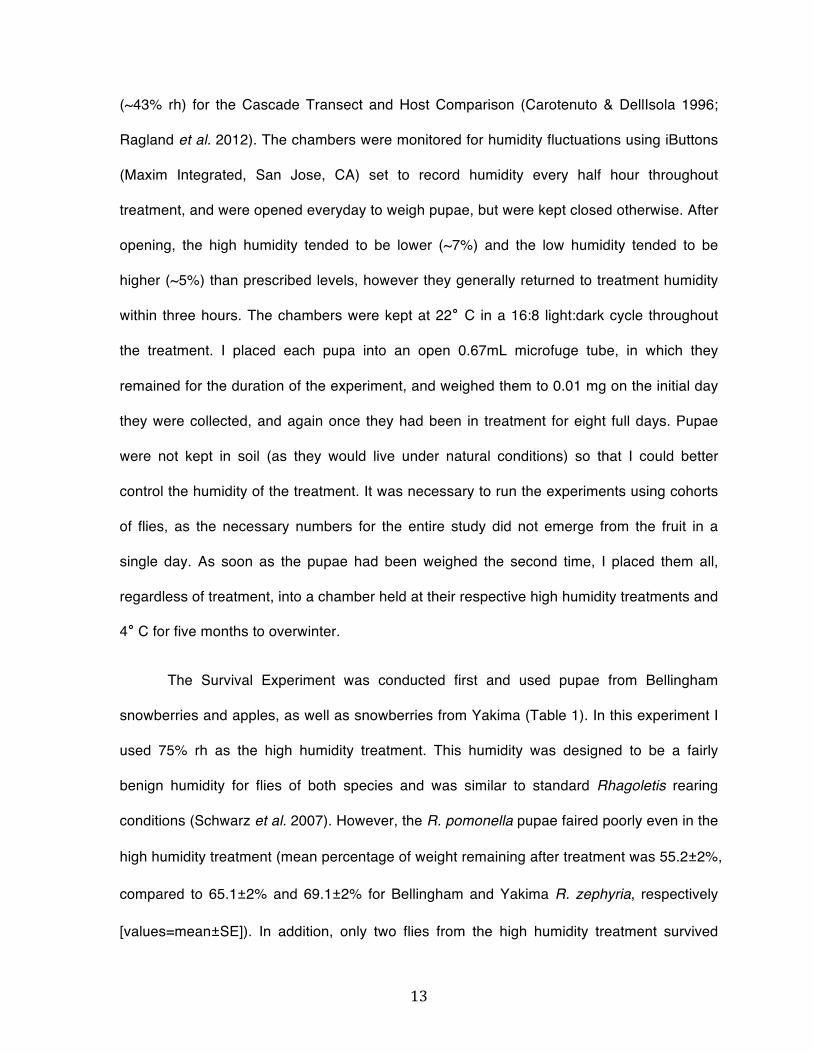
The Survival Experiment was conducted first and used pupae from Bellingham
snowberries and apples, as well as snowberries from Yakima (Table 1). In this experiment I
used 75% rh as the high humidity treatment. This humidity was designed to be a fairly
benign humidity for flies of both species and was similar to standard Rhagoletis rearing
conditions (Schwarz et al. 2007). However, the R. pomonella pupae faired poorly even in the
high humidity treatment (mean percentage of weight remaining after treatment was 55.2±2%,
compared to 65.1±2% and 69.1±2% for Bellingham and Yakima R. zephyria, respectively
[values=mean±SE]). In addition, only two flies from the high humidity treatment survived

14
through diapause and emerged in the spring even though the same rearing conditions
normally result in substantially higher overwinter survival (D. Schwarz, personal
communication). It is possible that these pupae were injured during collection, as they can
occasionally get trapped in the residue from the apples. Given the uncertainty regarding the
treatment of R. pomonella, I excluded these flies from the rest of the analysis. In the host
comparison that I conducted in 2015, I took extra precautions to avoid any fruit residue in the
collection dishes, and to collect individuals as gently as possible. I also adjusted the high
humidity treatment to a 85% rh for the Cascade Transect and Host Comparison (Table 1) to
make sure the higher humidity treatment was more benign.
Survival Experiment – Does desiccation resistance enhance fitness under drought
conditions?
This first experiment aimed to test whether dry conditions and resistance to those
conditions influence fitness in Rhagoletis flies, using overwintering survival as a proxy for
fitness. I split the Bellingham and Yakima R. zephyria populations into two groups and
placed one group into a chamber held at high relative humidity conditions (~75% rh, 22° C),
and one into a chamber with low humidity conditions (~43% rh, 22° C). After eight days, I
placed these samples into 75% rh (4° C) and allowed them to overwinter for five months. I
then removed the pupae from their overwintering conditions and placed them back into
incubation at 22° C with an 16:8 light:dark cycle. They began to eclose as adult flies starting
four weeks after this removal, and had finished emerging by seven weeks afterward. I then
measured the length and width of all pupal cases, and dissected those pupae that had not
emerged in order to verify that they had not been parasitized by wasps. Samples that were

15
parasitized were excluded. I also calculated the percentage of weight each pupa had
remaining (PWR) at the end of the desiccation or higher humidity treatment.
I tested for differences in emergence for each population and treatment from the
2014 sampling season using a Chi square test, and then ran three post-hoc Chi square tests
with a Bonferroni correction to further explore the pattern after the initial null hypothesis had
been rejected. I also ran Analyses of Variance (ANOVAs) on the initial weights, surface
area/volume ratios, and PWR of the various populations. I used logistic regression to identify
factors that determine survival of all flies in the study, as well as those with a high PWR after
treatment. I included length, initial weight of each pupa, treatment (high or low humidity),
population (Bellingham or Yakima), and PWR as potential factors. I completed all statistical
analyses, for this and the following experiments, in R, with “car”, “MASS” and “ape”
packages (Venables & Ripley 2002; Paradis et al. 2004; Fox & Weisberg 2011; Team 2015).
Cascade Transect – Is there adaptive variation in desiccation resistance in R.
zephyria?
The goal of the Cascade Transect was to explore the possibility of adaptive variation
in desiccation resistance in R. zephyria that might be beneficial to R. pomonella through
introgression. I treated half of the samples from each of the seven transect sites (Table 1,
Figure 1) at high humidity (85% rh) and half at low humidity (43% rh). After treatment, these
samples were placed into 85% rh and were overwintering at the time this thesis was written.
I calculated their PWR and compared them using an Analysis of Covariance (ANCOVA) with
initial weight as a covariate. I also compared them using Tukeyʼs HSD contrasts to look at
more specific differences in the R. zephyria populations. These data violate the assumption

16
of equal variances, so I adopted a stricter alpha value (0.025) to make up for artificial
inflation (Gamst et al. 2008). For each sampling site along the transect, I calculated the
mean initial weight of the pupae, and gathered data on mean annual precipitation, elevation,
and mean daily average August/September temperature (MAST) from other sources
(Arguez et al. 2010). I ran exploratory pairwise correlations between all of these potential
factors to determine whether they could be used in a regression. I then performed linear
regressions on both the high and low humidity data to identify predictors of PWR. Finally, I
tested the regression residuals for spatial autocorrelation using Moranʼs I (Grant & Little
1992).
Host Comparison – Is there variation between different host races of R. pomonella?
In the Host Comparison I was interested in standing variation in desiccation
resistance within R. pomonella that might provide adaptive potential for this species. I used
populations of R. pomonella from Bellingham that I collected from apples, and those I
collected from black hawthorns. I divided samples from both populations into two groups and
subjected one to high humidity (85% rh, 22° C) and one to low (43% rh, 22° C). These
samples were also placed into 85% rh (4° C) after treatment to overwinter. I calculated PWR
and I compared the initial weights of the pupae using an ANOVA. I ran an ANCOVA on the
PWR of the pupae using their initial weight as a covariate. These PWR data also violate the
assumption of equal variances, so I again adopted a stricter alpha value (0.025) to account
for artificial inflation (Gamst et al. 2008).

17
RESULTS
Survival Experiment – Does desiccation resistance enhance fitness under drought
conditions?
The initial Chi square test showed significant differences in survival among the
treatment groups (p<<0.0001, χ2=40.5, df=3). The pupae from the Bellingham population
that were kept in 43% rh had a percentage of emergence less than a third of those in all
other treatment groups, which was significantly less than the 75% rh treatment in the same
population (p<0.001, χ2=11.9, df=1). Though the high humidity Bellingham population had
slightly lower percent emergence compared with both treatment groups in Yakima, none of
these three were significantly different after correction (p=0.03, χ2=4.9, df=1 between
Bellingham 75% rh and Yakima; p=0.82, χ2=0.05, df=1 between Yakima 75% and 43% rh)
(Figure 2). The PWR was also significantly different between treatment groups (F3, 271=14.24,
p<<0.001). Tukeyʼs HSD contrasts showed that the PWR of the Bellingham 43% rh group
was significantly lower compared to all other treatment groups, while the Yakima 43% rh
group showed no difference from the 75% rh treatments from both locations (Figure 3).
Initial puparial weights did not differ between Bellingham and Yakima populations
(although they neared significance, F1, 273=3.15, p=0.077), but their surface area/volume
ratios did (F1, 273=11.60, p<0.001). However, surface area/volume ratios were based on
length and width measurements taken after desiccation treatment (see above). To test for
distortions of pupal shape during treatment, I calculated surface area/volume ratios for 40
untreated samples from each population, and found that the distributions were statistically
indistinguishable from one another (F1, 78=1.25, p=0.27). Thus, the differences in the surface
area/volume of the pupae following treatment was likely due to the puparia shrinking to

18
Figure 2 – Percentage of successfully eclosing flies in each treatment group, shown by location and treatment relative humidity. Emergence in different treatment groups differs significantly (p<<0.0001; χ2=40.5; df=3; see Results; Bellingham 75% n=82, Bellingham 43% n=44, Yakima 75% n=74, Yakima 43% n=74).

19
Figure 3 – Percent weight remaining for two populations of R. zephyria (Bellingham or Yakima) after treatment at high (75%) or low (43%) relative humidity for eight days. Treatment groups with the same letter (below boxes) have no significant difference, while those with different letters vary significantly from one another (according to Tukeyʼs HSD contrasts, see Methods). Bellingham 75% n=82, Bellingham 43% n=44, Yakima 75% n=74, Yakima 43% n=74
20
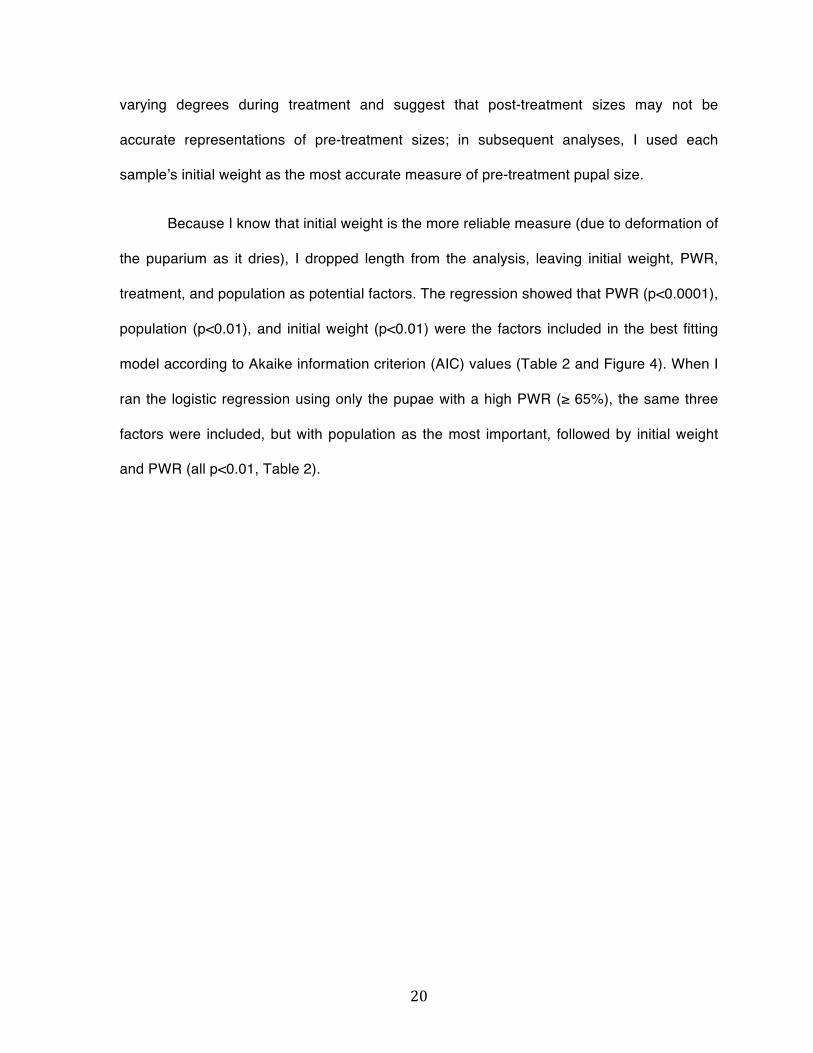
varying degrees during treatment and suggest that post-treatment sizes may not be
accurate representations of pre-treatment sizes; in subsequent analyses, I used each
sampleʼs initial weight as the most accurate measure of pre-treatment pupal size.
Because I know that initial weight is the more reliable measure (due to deformation of
the puparium as it dries), I dropped length from the analysis, leaving initial weight, PWR,
treatment, and population as potential factors. The regression showed that PWR (p<0.0001),
population (p<0.01), and initial weight (p<0.01) were the factors included in the best fitting
model according to Akaike information criterion (AIC) values (Table 2 and Figure 4). When I
ran the logistic regression using only the pupae with a high PWR (≥ 65%), the same three
factors were included, but with population as the most important, followed by initial weight
and PWR (all p<0.01, Table 2).

21
Model for all Survival Experiment samples AIC value Survival ~ 1 380.96 Survival ~ PWR 159.86*** Survival ~ PWR + Population 152.48** Survival ~ PWR + Population + Initial Weight 145.52** Model for high-PWR Survival Experiment samples Survival ~ 1 132.71 Survival ~ Population 123.46** Survival ~ Population + Initial Weight 120.37** Survival ~ Population + Initial Weight + PWR 113.40**
Table 2 – AIC values for logistic regressions of factors predicting survival to eclosion of each pupa. The first table shows model selection for all samples, while the second shows model selection for only the high-PWR (>65%, see Methods). Asterisks show significant drops in AIC values when factors were added to the model (** denotes p<0.01 and *** denotes p<0.001).

22
Figure 4 – Scatterplots representing the factors (Percent Weight Remaining and Initial Weight) included in the best fitting logistic regression model that predicts survival in R. zephyria populations in both high (panel a) and low (panel b) relative humidities.

23
Cascade Transect – Is there adaptive variation in desiccation resistance in R.
zephyria?
Initial puparial weights of the populations were significantly different (Figure 5), so I
used initial weights of each individual as a covariate in the ANCOVA to examine difference
in PWR among all transect locations. For both high and low humidity treatments, the PWR
was significantly different (high humidity: F1, 732=53.65, p<<0.001; low humidity: F1, 601=25.88,
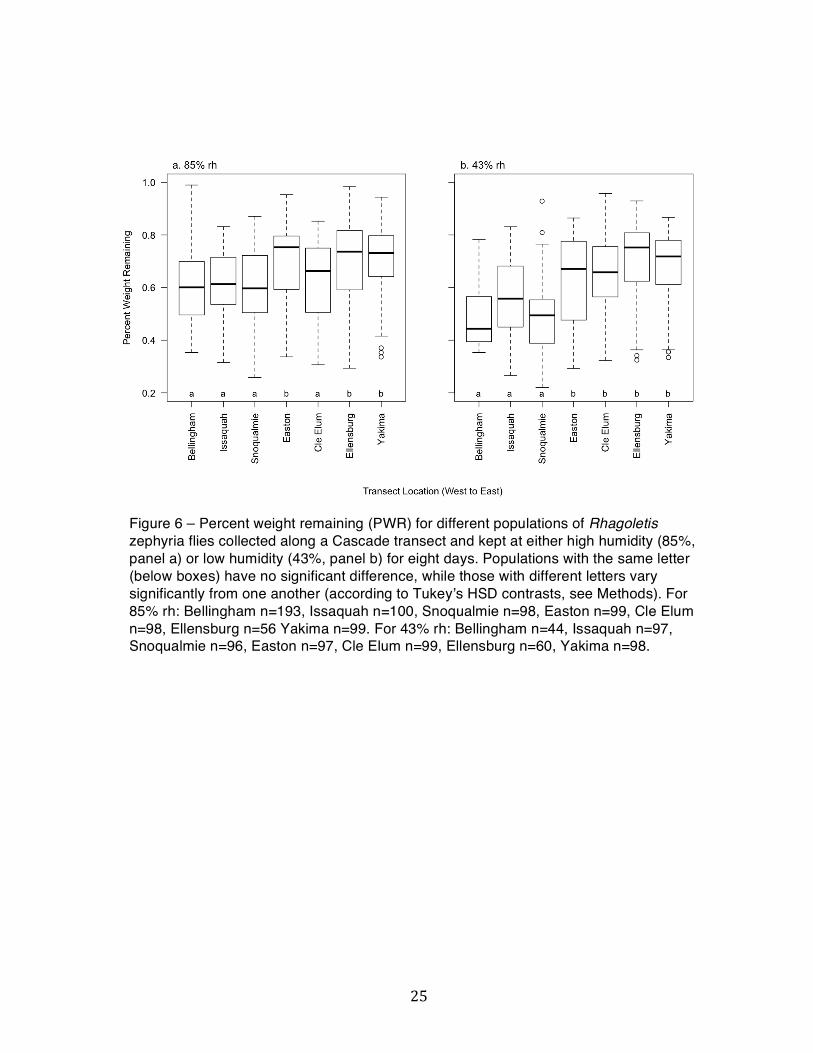
p<<0.001) among locations. Tukeyʼs HSD contrasts show the PWR distributions falling into
two distinct groups: Bellingham, Issaquah, Snoqualmie, and Cle Elum, opposite Easton,
Ellensburg, and Yakima for high humidity (Figure 6a); Bellingham, Issaquah, and
Snoqualmie opposite Easton, Cle Elum, Ellensburg, and Yakima for low humidity (Figure 6b).
In contrast to the ANCOVA where I included initial puparial weight as a covariate, I
chose to include mean initial weight as an independent variable in the linear regression to
gauge its importance as a predictor of mean PWR. Since I cannot include highly correlated
factors in the same regression, I ran correlations on all of the potential factors. I found that
precipitation correlated significantly with both initial weight (r=-0.8, p<0.05) and MAST (r=-
0.79, p<0.05). Thus, I removed initial weight and MAST from the regression, leaving only
precipitation and elevation. I chose to keep precipitation because it is one of the most useful
factors for looking at desiccation potential in these transect sites. In the high humidity
treatment, none of the factors tested decreased the AIC values significantly. However in the
low humidity treatment, both elevation and precipitation (p<0.05 and p<0.01, respectively)
were included in the best fitting model (Table 3).

24
Figure 5 – Initial weight for different populations of Rhagoletis zephyria flies collected across a Cascade transect before relative humidity treatment. Populations with the same letter (above boxes) have no significant difference in initial weight, while those with different letters vary significantly from one another (according to Tukeyʼs HSD contrasts, see Methods). Bellingham n=237, Issaquah n=197, Snoqualmie n=194, Easton n=196, Cle Elum n=197, Ellensburg n=116 Yakima n=197.
25
Figure 6 – Percent weight remaining (PWR) for different populations of Rhagoletis zephyria flies collected along a Cascade transect and kept at either high humidity (85%, panel a) or low humidity (43%, panel b) for eight days. Populations with the same letter (below boxes) have no significant difference, while those with different letters vary significantly from one another (according to Tukeyʼs HSD contrasts, see Methods). For 85% rh: Bellingham n=193, Issaquah n=100, Snoqualmie n=98, Easton n=99, Cle Elum n=98, Ellensburg n=56 Yakima n=99. For 43% rh: Bellingham n=44, Issaquah n=97, Snoqualmie n=96, Easton n=97, Cle Elum n=99, Ellensburg n=60, Yakima n=98.

26
Model for 85% rh treatment Transect samples AIC value PWR ~ 1 -41.92 PWR ~ Precipitation -44.03 PWR ~ Precipitation + Elevation -45.66 Model for 43% rh treatment Transect samples PWR ~ 1 -33.74 PWR ~ Precipitation -37.73** PWR ~ Precipitation + Elevation -46.28*
Table 3 – Table of AIC values for linear regressions of mean PWR against environmental factors for populations forming the Cascade Transect. Asterisks show significant drops in AIC values when factors were added to the model (* denotes p<0.05 and ** denotes p<0.01).

27
Because there is a spatial component to this experiment, I calculated Moranʼs I using
the regression residuals to determine if the data showed spatial autocorrelation. If they did,
the pattern in PWR would suggest that the differences in desiccation resistance were
consistent with genetic isolation by distance of alleles conferring desiccation resistance. For
both high and low humidity treatments, this was not significant (p>0.4 for both).
Host Comparison – Is there variation between different host races of R. pomonella?
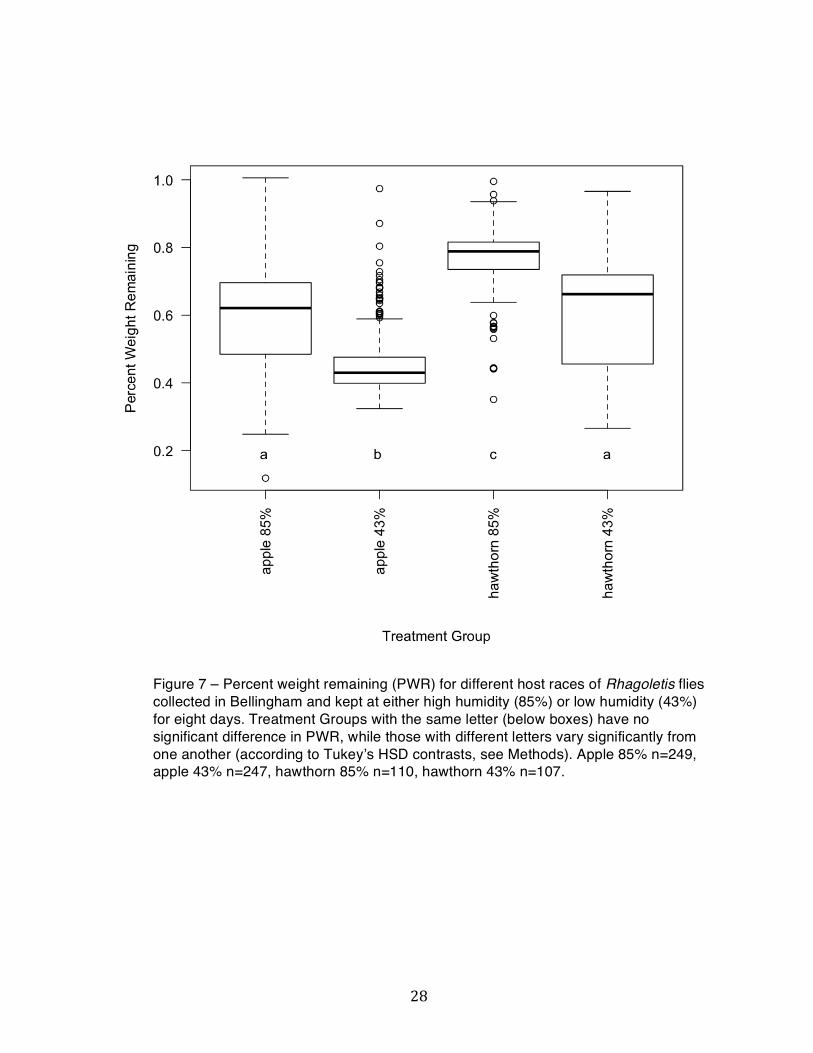
The initial weights of the pupae were consistent within each host race, but different
across host races, with apples yielding the largest pupae (9.9±0.15mg), and hawthorns
producing pupae ~75% as large (7.4±0.23mg [values=mean±SE). The ANCOVA of their
PWR (with initial puparial weight as a covariate) shows that host and treatment (but not the
interaction between the two) both affect how much weight each pupa will have at the end of
the experiment (host: F1, 711=132.40, p<<0.001; treatment: F1, 711=308.39, p<<0.001). Both
host races had similar differences between their PWR in high and low humidity treatments.
Pupae that came from hawthorn however, had ~15.6% higher PWR on average in the high
humidity treatment, and ~14.2% higher PWR on average in the low humidity treatment
compared to the apple host race (Figure 7).
28
Figure 7 – Percent weight remaining (PWR) for different host races of Rhagoletis flies collected in Bellingham and kept at either high humidity (85%) or low humidity (43%) for eight days. Treatment Groups with the same letter (below boxes) have no significant difference in PWR, while those with different letters vary significantly from one another (according to Tukeyʼs HSD contrasts, see Methods). Apple 85% n=249, apple 43% n=247, hawthorn 85% n=110, hawthorn 43% n=107.

29
DISCUSSION
My experiments show key differences in early pupal desiccation resistance among
different populations and host races of Rhagoletis flies. Dry conditions negatively impact R.
zephyria and the apple-infesting population of R. pomonella from the wet coastal regions of
Washington, but do not affect R. zephyria from the arid interior of the state. Similarly, R.
pomonella from early-fruiting black hawthorn shows greater desiccation resistance than R.
pomonella from later-fruiting apple. As described below, these patterns collectively suggest
an interaction between resistance to dry conditions and diapause that may cause flies with a
longer pre-winter period to exhibit the same desiccation resistance as those that live in an
arid climate.
Survival Experiment – Does desiccation resistance enhance fitness under drought
conditions?
Rhagoletis zephyria flies, which are native to the Pacific Northwest, are able to
survive a wide variety of environmental conditions, as demonstrated by their extensive range
in Washington State. They have robust populations in the cool, wet climate of the coast, as
well as the hotter, arid interior of the state. As evidenced by among-population differences in
puparial water loss, populations from the two different climates differ drastically in their
ability to withstand desiccation; individuals collected from Yakima are better able to resist
desiccation in a low humidity treatment than their Bellingham counterparts. This variable
desiccation resistance affects an individualʼs ability to survive successfully after treatment
and eclose as an adult the following season. Survival is, in fact, most accurately predicted
by the percentage of weight that each fly had remaining after being treated in one of the

30
humidity conditions, with population and initial weight also playing a role. This is unsurprising,
as pupae in preliminary studies that showed PWR below ~50% after eight days were visibly
dried out and dead upon dissection of the puparium (data not shown). I later eliminated low-
weight flies from the analysis, to gauge whether an increasing PWR would still have an
effect amongst individuals who were most likely alive at the end of desiccation treatment.
Percent weight remaining was still a significant factor, suggesting that although flies need to
be above a certain threshold to have a chance at survival, the likelihood of eclosion goes up
with higher PWR. A better predictor of survival in this group of flies is the initial weight of
each pupa. Larger, heavier pupae tended to survive more often than those that were smaller.
Both of these factors can predict survival in high-weight individuals due to the extended
amount of time pupae still have before eclosion, when their metabolism is slowed but not
ceased.
Treatment (high or low humidity) did not appear in the best fitting model for these
emergence data. This is because flies from Yakima were very successful regardless of the
relative humidity. By contrast, survival of flies from Bellingham was very dependent on high
or low treatments and only ~23% of individuals in the low humidity treatment had PWR of
over 65% (see results). This leaves them at a drastic disadvantage in dry conditions
compared with the Yakima flies, which must tolerate low humidities more often. My data
show that each of these populations of Rhagoletis zephyria is well adapted to the typical
climatic conditions in its home range, and while those from Bellingham are detrimentally
affected by placement in a more Yakima-like condition, those from Yakima are unaffected
when placed in a more Bellingham-like condition. These patterns are consistent with those
found in desiccation experiments in other systems (Schilman et al. 2005; Terblanche &
Kleynhans 2009; Nyamukondiwa et al. 2010; Chown et al. 2011; Hidalgo et al. 2014;

31
Kleynhans et al. 2014). Because the humidity treatments in this study represent an initial
test under artificial conditions, a study in which pupae from each location are transplanted
into the opposite environment would be a more realistic test of these patterns.
Cascade Transect – Is there adaptive variation in desiccation resistance in R.
zephyria?
Through the Cascade Transect I was able to examine similar patterns with finer
geographic resolution. Precipitation at the source location was the strongest predictor of
PWR at the end of treatment in low humidity, and elevation was also included as a
significant factor. Pupae from locations with lower precipitation and higher elevation lost less
weight in desiccation treatment than those from wetter, lower sites (Figure 7). Together
these factors can account for approximately 86% of the variation in PWR. It is important to
remember, however, that precipitation, MAST, and initial weight all correlate, and that
precipitation as a factor stands for all three variables in this analysis. It may be that initial
weight varies according to environmental conditions, and that this forms part of the
mechanism of desiccation resistance in the more central populations of R. zephyria. In
addition to having a higher ending weight, pupae from Yakima are also better able to survive
and eclose in the spring than those in Bellingham after being exposed to desiccating
conditions (see Survival Experiment, Figure 2). The results from the Cascade Transect imply
that there is local adaptation in populations that must routinely deal with harsher drought
conditions. This explanation best accounts for the patterns in the varying levels of
desiccation resistance, both in the extreme eastern and western sites and in the
intermediate ones along the transect.

32
One alternative explanation for the pattern in PWR after low humidity treatment could
be a simple geographic gradient that is not an adaptation to different abiotic conditions, but
the result of isolation by distance due to limited dispersal of flies. This is unlikely however,
because the PWR from each of the seven sites shows a gradual longitudinal cline except at
and just east of Snoqualmie Pass where there is instead an abrupt shift in phenotype. If the
response was due to isolation by distance, the cline should extend uninterrupted. The
second alternative explanation is the complete absence of gene flow, resulting in two
separate populations of R. zephyria. If the Cascade Mountains act as a barrier to gene flow,
the two populations on either side of the mountains may vary from one another
phenotypically because of genetic drift, and not as the result of ecological adaptation. This is
also unlikely due to the ubiquitous distribution of snowberries across the Cascade Transect,
including at the top of the mountain pass and along the Columbia River Gorge, providing a
corridor to facilitate at least some gene flow between the sides (Arcella et al. 2015). In the
absence of selection for local adaptation, the expected gene flow would likely be sufficient to
counteract the effect of genetic drift. The data currently available are not sufficient to test for
the degree to which the Cascade Range acts as a barrier to gene flow (Green et al. 2013).
With genomic data for the transect sites we would be able to better understand potential
interactions between natural selection and gene flow.
Finally, the observed pattern along the transect may be due purely to phenotypic
plasticity. Rhagoletis zephyria may simply be able to regulate its desiccation resistance in
response to a dry pupariation environment. In this case, the differing PWR on either side of
the transect would be explained by the beneficial acclimation hypothesis, which asserts that
organisms that have had a chance to acclimate to harsh conditions will perform better than
those who have not (Terblanche & Kleynhans 2009). If those flies from dry regions have

33
acclimated to that level of moisture prior to collection, then they might be at an advantage
over flies collected from wetter areas. After collection, flies from all populations were treated
in a standardized lab environment in a common garden experiment, so phenotypic plasticity
would not have arisen in separate populations based on experimental conditions unless the
response occurred prior to collection (Pelini et al. 2012). Important to remember is that
Rhagoletis flies spend their early lives entirely inside their fruit hosts, so the fruit growing in a
dry region would need to be somehow different internally from one growing elsewhere in
order for this acclimation response to take effect. The phenotypic plasticity could also take
the form of a maternal effect, as appears to be the case with Stator limbatus, the seed
beetle. Fox et al. (1997) found that by rearing the parental population on a certain plant, they
could increase larval survival on a different plant, and further, that these differences were
plastic responses and not genetic effects. However, others have shown that maternal gene
transcripts decreased significantly by a few hours after egg deposition (Arbeitman et al.
2002). Because I examined a pupal phenotype, maternal effects may be less likely to
explain the observed differences.
Given the available information, local adaptation is the most probable explanation of
the observed pattern in PWR across the Cascade Transect. Rhagoletis flies have shown
local adaptation in previous studies. Dambroski and Feder (2007) showed that Rhagoletis
pupae from different host races emerged in the order that their host fruits would ripen, even
when reared in standardized conditions. They hypothesized that an unknown genetic
element must be responsible for this local adaptation to fruiting time (Dambroski & Feder
2007). Similarly, a genetic element for desiccation resistance may be common in the eastern
populations, but may only exist at low levels in the west where it is not under as much
selective pressure. To determine which explanation reflects the pattern in this transect most

34
definitively, future studies should include a full transplant experiment between sites spanning
multiple generations (Dambroski et al. 2005).
Unfortunately, because I lack emergence data for the Cascade Transect and Host
Comparison, there are two caveats when interpreting these results. The first is the unknown
level of parasitization by parasitoid wasps. In the Survival Experiment I found approximately
equal rates of parasitoids between the Bellingham and Yakima populations upon dissection,
but I do not yet know if the rate will remain consistent between sampling seasons or across
the entire transect. I tested the distributions of the survival experiment samples against
those same samples before I excluded parasitoids, and they showed no significant
difference (p>0.4, data not shown). The second is that I cannot say with certainty that a high
percent weight remaining in a given population leads to high survival and eclosion in the
following season. If other populations respond similarly to those in the Survival Experiment,
then this is likely to be the case, but it is also possible that there are other factors that are
more important indicators of success than PWR. Nevertheless, it seems likely that the
patterns I have found through these experiments will hold when I am able to gauge survival
and parasitization percentages in the Cascade Transect and Host Comparison.
Host Comparison – Is there variation between different host races of R. pomonella?
Pupae that came from hawthorn, though they are 25% smaller than apple fly pupae,
retain more of their weight in both humidity treatments. Unlike the R. zephyria from Yakima,
these hawthorn-infesting R. pomonella show a significant difference in their response to high
and low humidity. Their response to humidity is similar to that of the apple host race
population, though the hawthorn pupae maintain higher weight in both treatments. A

35
possible explanation for the increase in desiccation resistance is that hawthorn-infesting R.
pomonella flies have adapted to their host plantʼs earlier fruiting time, and therefore spend
longer times in diapause in pre-winter conditions. Ragland et al. (2012) explored the
relationship between host fruit and seasonal shifts in Midwestern R. pomonella, where
hawthorns fruit approximately three weeks later than apples, and found that flies feeding in
apples were able to accumulate greater lipid content. This lipid accumulation helped to
mitigate some of the harsher conditions the pupae experienced as a result of a longer pre-
winter diapause period (Ragland et al. 2012). Interestingly, hawthorns in the Pacific
Northwest fruit approximately three weeks earlier than apples, and the local hawthorn
speciesʼ fruit is much smaller than those in the Eastern United States (Sim et al. 2012), so
the potential trade-off may not be as favorable in this region. This suggests that the western
hawthorn host race is using some other mechanism to alleviate the harsher pre-winter
conditions.
Potential Mechanisms of Desiccation Resistance
Insect desiccation and desiccation resistance have been extensively studied,
although very little is know about the actual mechanism of desiccation resistance in
Rhagoletis (Hulthen & Clarke 2006; Terblanche & Kleynhans 2009; Kawano et al. 2010;
Chown et al. 2011; Parkash et al. 2011; Yee 2013a; Hidalgo et al. 2014; Kleynhans et al.
2014). All else being equal, flies with smaller SA/V ratios should lose less water to the
surrounding environment than those with larger SA/V ratios. In the Host Comparison, this is
clearly not the case. Hawthorn-infesting R. pomonella are ~75% the size of the apple host-
race, yet retain a much higher percent weight remaining at the end of desiccation treatment

36
(Figure 5). However a difference in size may explain the differences in PWR in R. zephyria
across the Cascade Transect. In this species, populations that had higher initial weight also
retained a higher percentage of weight after treatment (Figure 6, 7). The more favorable
SA/V ratio of bigger pupae will by itself increase desiccation resistance, but higher initial
weight may also suggest increased water weight as a mechanism used to resist desiccation.
Drosophila melanogaster adults that have been selected for desiccation resistance contain
approximately 30% more body water than non-selected flies (Gibbs et al. 1997). Variation of
this kind may account for the difference in initial weight among the R. zephyria populations
as well. This study did not test, however, the nature of the weight the flies lost. If the percent
loss was due mainly to water weight, then the higher survival of the flies from Yakima and in
higher humidity conditions in the Survival Experiment may be due to those individuals
containing a greater amount of water at the beginning of treatment. If the percent loss was
due instead to dry weight, then resisting desiccation may be a very costly response to
adverse conditions and the flies with greater energy reserves may be the more successful
group. When I looked at factors that best predict survival in only the high PWR individuals
from the Survival Experiment, I found that those flies with higher initial weight and higher
PWR were more likely to survive to eclosion. Treatment still did not appear as a significant
factor, showing that at least in the Yakima sample, resisting desiccation does not appear to
be a particularly costly response. A study examining differences in dry weight of populations
with different desiccation resistances would help to clarify this issue.
Regardless of the type of weight loss, all pupae in these experiments lost weight to
some degree because of their current developmental stage. Just after Rhagoletis flies
pupariate, they begin to drastically reduce their metabolic rate (measured in daily CO2
production) to conserve resources as they overwinter. It takes approximately five days of

37
steady decline before the decrease in metabolic rate begins to level out, and at around
seven days after pupariation, the flies are at diapause levels (Ragland et al. 2009). This
means that the treatments in this study extended throughout the descent into diapause for
typical Rhagoletis fruit flies, and that they were in a very different state at the beginning and
end of the experiments. These differences can have vast implications for how the pupae
might be resisting desiccation.
In quiescent insects, cuticular transpiration accounts for around 80% of the total
water loss (Gibbs 2011). In this case, all mechanisms associated with desiccation resistance
would need to be passive, to slow or stop cuticular transpiration or spiracular evaporation,
though these strategies are also useful and common in active insects (Quinlan & Gibbs
2006; Gibbs 2011). Parkash et al. (2011) explored the various mechanisms of water balance
in adults of Drosophila species in the Himalayan Mountains and found that while D.
melanogaster uses an increased melanization to minimize water loss, the sympatric D.
busckii uses instead an increased amount of cuticular lipids to achieve the same end. Both
of these mechanisms work by limiting diffusion through the epicuticle, either with more
melanin granules, or with more lipid content in the epicuticle, respectively (Parkash et al.
2011). These substances are hydrophobic, and so water passes through them less readily
than through other tissues (Gibbs 2011). Though a difference in melanization is unlikely due
to the lack of visible color variation of the Rhagoletis puparia used in this study, the different
populations or host races may employ other hydrophobic compounds to decrease cuticular
permeability. An analysis of the cuticular composition would be useful in determining if lipids
in the epicuticle contribute to desiccation resistance.
Because Rhagoletis take approximately seven days to enter diapause, active
mechanisms of water balance, associated with active respiration and metabolism, will also

38
be important (Gibbs 2011). In addition, since Rhagoletisʼ diapause is facultative, it is likely
that a subset of pupae did not go into diapause, or entered only a shallow diapause (Boller &
Prokopy 1976; Dambroski & Feder 2007; Ragland et al. 2009). In these cases, those pupae
would have to rely even more heavily on additional methods of desiccation resistance.
Females of an Anopheles mosquito measured at the onset of the dry season tended to
increase the expression of enzymes associated with the breakdown of glycogen, suggesting
increased energetic demands associated with desiccation resistance. However they also
adjusted their cuticular permeability with changes in expression of cuticular proteins,
suggesting that a combination of responses to desiccation may be important for survival
(Hidalgo et al. 2014). It is likely that if Rhagoletis flies that do not go into diapause exhibit
desiccation resistance, they do it through multiple physiological changes.
Active mechanisms of water balance would be less helpful to the pupae in this study,
as they have no way of taking in more nutrients or water after pupariation (Boller & Prokopy
1976). More probable is that any flies that did not go into diapause died before the end of
the desiccation treatment, and that the patterns seen in these experiments, particularly the
Host Comparison, were actually due to an interaction between desiccation resistance and
diapause regulation. Ragland et al. (2009) found that about 12% of an eastern population of
hawthorn-infesting Rhagoletis pomonella did not go into diapause at all, but continued their
development in a way that mimicked normal diapause termination and adult eclosion.
Dambroski and Feder (2007) found latitudinal differences in percentages of the population of
flies that would forego diapause when placed into warmer, summer-like conditions. Flies
from lower latitudes nearly always diapaused, even in warm conditions, while those from
farther north had larger subsets that would continue development and emerge ~30 days
after pupariation. They also found that flies infesting fruit that ripened earlier (because of
39
latitudinal changes or simply from different fruit phenology) had a lessened tendency to
forego diapause than populations infesting later-season fruits. (Dambroski & Feder 2007).
Though the proportions of flies foregoing diapause are unknown in the Pacific Northwest, the
fact that hawthorns fruit before apples do suggests that the hawthorn host-race of R.
pomonella may have a smaller percentage of non-diapausing individuals than the apple
host-race.
The physiological choice to enter diapause or not could actually be a mechanism of
desiccation resistance. Pupae will be able to survive dry and warm pre-winter conditions
much more easily in a quiescent state (Guppy & Withers 1999; Irwin & Lee Jr 2003; Hahn &
Denlinger 2007), so those that enter diapause sooner after pupariation, despite a long pre-
winter period, will be at an advantage compared to those that retain active levels of
respiration and metabolism. The latitudinal and host-related differences in the percentage of
individuals that do not go into diapause could reflect a population-wide strategy to resist
harsh, desiccating pre-winter conditions. The hawthorn host-race of R. pomonella may have
higher mean desiccation resistance than the apple host-race because a smaller subset of
hawthorn-infesting flies will forego diapause when placed in warm conditions. This would
mean that they would reach inactive levels of respiration and metabolism more quickly,
conserving resources that could be vital during the overwintering process.
Diapause cannot, however, be the only mechanism at work in these populations, as
variation still exists within populations and between treatments. The interaction between
diapause and desiccation resistance is likely a complex and nuanced one, and will require
careful testing to discover the relative effects of each one.
40
Introgression or standing variation?
To assess whether the invasive apple fly could gain beneficial traits that would allow
it to invade the drier regions of Washington, all sources of genetic variation must be taken
into account. It is possible that the desiccation resistance in the hawthorn host race of R.
pomonella is due to a higher rate of hybridization with R. zephyria, and that hawthorn flies
have gained this trait as a result of genetic backcrosses. The fruit hosts of these two
populations occur sympatrically both geographically and temporally, and hybridization
occurs between them at an estimated rate of 1.44% per generation (Arcella et al. 2015).
Because snowberry flies have an increased desiccation resistance in certain regions of
Washington, hybridization with these neighbors may be conferring an adaptive advantage.
While R. zephyria flies in central Washington show greater desiccation resistance than those
in western Washington, they are not isolated populations. Though the central populations
may have higher frequencies of alleles associated with desiccation resistance than those in
the west, the western populations would likely still possess those beneficial alleles in lower
frequencies. This means that although hybridization with R. zephyria in central Washington
may move the alleles more efficiently into the R. pomonella population, the increased
resistance would still be accessible were introgression limited to the western populations.
Despite the proximity and hybridization in the Pacific Northwest however, Arcella et
al. (2015) have also shown that most of the alleles that are more “R. zephyria-like” in the
hawthorn populations are present in R. pomonella populations in the Midwestern United
States, making it more likely that the alleles have existed in low frequencies within the
species since its introduction into the Pacific Northwest. This would mean that the variation
in desiccation resistance in R. pomonella is actually the result of standing variation providing
a low-frequency allele that became more widespread in the hawthorn population. Important

41
to remember is that the dichotomy between these two phenomena could be considered a
false one. The entire R. pomonella species group is closely related, and while the
divergence of R. pomonella and R. zephyria was certainly before the divergence of the two
R. pomonella host races in this study, they still fall along a continuum of genetic differences
(Bush & Smith 1998; Feder et al. 1999). Thus, hybridization with R. zephyria could be
considered by some to constitute adaptation from standing variation in a slightly more
removed population (Barrett & Schluter 2008). Also, at this time we do not know which
genetic loci are associated with desiccation resistance traits, so it is impossible to say in
which populations these alleles exist, or in which species they originated.
Conclusions
Both R. zephyria and R. pomonella have varying resistances to desiccation in
different environments within Washington State. The native R. zephyria shows variation
between sites that have different pupariation conditions, with flies originating from harsher
habitats performing better under the drier experimentally induced conditions. Rhagoletis
pomonella reacts differently to desiccation stress depending on fruit host and diapause
length, with the early-pupating hawthorn host race retaining more weight than the apple race
in both high and low humidity treatments. Previous studies of genetic variation in these two
species have confirmed that they are hybridizing at low but significant levels and have
speculated as to the contribution such hybridization has on the spread of the invasive R.
pomonella in Washington (Green et al. 2013; Hood et al. 2013; Arcella et al. 2015; Ragland
et al. 2015). Here, I examined the desiccation resistances of each species in conditions like
those where snowberry flies are widespread and apple flies are absent. My results suggest

42
that variation in desiccation resistance is already present within the R. pomonella genome,
either from hybridization with R. zephyria or from standing variation that has increased in
response to a host shift to hawthorn fruit. I also found that R. zephyria flies likely have
adapted to local conditions and that desiccation resistance is not universal across the
populations. More work is needed to determine if there is indeed a genetic factor
determining resistance, and the regions of the genome with which this factor is associated.
This research, in turn, would allow us to begin to gauge the relative importance of
introgression in the invasion of R. pomonella into the Pacific Northwest.

43
LITERATURE CITED
Abbott RJ (1992) Plant invasions, interspecific hybridization and the evolution of new plant taxa. Trends in Ecology & Evolution, 7, 401–405.
AliNiazee MT (1985) Opiine parasitoids (Hymenoptera, Braconidae) of Rhagoletis pomonella and Rhagoletis zephyria (Diptera, Tephritidae) in the Willamette Valley, Oregon. The Canadian Entomologist, 117, 163–166.
AliNiazee MT, Wescott RL (1987) Flight period and seasonal development of the apple maggot, Rhagoletis pomonella (Walsh) (Diptera: Tephritidae), in Oregon. Annals of the Entomological Society of America, 80, 823–828.
Arbeitman MN, Furlong EEM, Imam F, Johnson E, Null BH, Baker BS, Krasnow MA Scott MP, Davis RW, White KP (2002) Gene expression during the life cycle of Drosophila melanogaster. Science, 297, 2270–2275.
Arcella T, Hood GR, Powell THQ, Sim SB, Yee WL, Schwarz D, Egan SP, Goughnour RB, Smith JJ, Feder JL (2015) Hybridization and the spread of the apple maggot fly, Rhagoletis pomonella (Diptera: Tephritidae), in the northwestern United States. Evolutionary Applications, 8, 834–846.
Arguez A, Durre I, Applequist S, Squires M, Vose R, Yin X, Bilota R (2010) NOAAʼs U.S. Climate Normals (1981-2010). [monthly normals].
Ashley TR, Greany PD, Chambers DL (1976) Adult emergence in Biosteres (Opius)
longicaudatus and Anastrepha suspensa in relation to the temperature and moisture concentration of the pupation medium. The Florida Entomologist, 59, 391–396.
Barrett RDH, Schluter D (2008) Adaptation from standing genetic variation. Trends in Ecology & Evolution, 23, 38–44.
Boller EF, Prokopy RJ (1976) Bionomics and management of Rhagoletis. Annual Review of Entomology, 21, 223–246.
Bush GL (1966) The taxonomy, cytology, and evolution of the genus Rhagoletis in North America (Diptera, Tephritidae). Museum of Comparative Zoology, 134, 431–562.
Bush G (1969) Mating behavior, host specificity, and the ecological significance of sibling species in fruigivorous flies of the genus Rhagoletis (Diptera-tephritidae). The American Naturalist, 103, 669–672.
Bush GL, Smith JJ (1998) The genetics and ecology of sympatric speciation: A case study. Researches on Population Ecology, 40, 175–187.
Carotenuto A, DellIsola M (1996) An experimental verification of saturated salt solution-based humidity fixed points. International Journal of Thermophysics, 17, 1423–1439.
Castillo JM, Leira-Doce P, Carrión-Tacuri J, Munoz-Guacho E, Arroyo-Solis A, Curado G, Doblas D, Rubio-Casal AE, Alvares-Lopes A, Redondo-Gomez S, Berjano R, Guerrero G, De Cires A, Figueroa E, Tye A (2006) Contrasting strategies to cope with drought by invasive and endemic species of Lantana in Galapagos. Biodiversity and Conservation, 16, 2123–2136.
Chown SL, Sørensen JG, Terblanche JS (2011) Water loss in insects: An environmental

44
change perspective. Journal of Insect Physiology, 57, 1070–1084.
Currat M, Ruedi M, Petit RJ, Excoffier L (2008) The hidden side of invasions: massive introgression by local genes. Evolution, 62, 1908–1920.
Dambroski HR, Feder JL (2007) Host plant and latitude-related diapause variation in Rhagoletis pomonella: A test for multifaceted life history adaptation on different stages of diapause development. Journal of Evolutionary Biology, 20, 2101–2112.
Dambroski HR, Linn C, Berlocher SH, Forbes AA, Roelofs W, Feder JL (2005) The genetic basis for fruit odor discrimination in Rhagoletis flies and its significance for sympatric host shifts. Evolution, 59, 1953–64.
Elliott GP, Merton D V., Jansen PW (2001) Intensive management of a critically endangered species: The kakapo. Biological Conservation, 99, 121–133.
Ellstrand NC, Schierenbeck KA (2000) Hybridization as a stimulus for the evolution of invasiveness in plants ? Proceedings of the National Academy of Sciences of the United States of America, 97, 7043–7050.
Ewel JJ, O'Dowd DJ, Bergelson J, Daehler CC, D'Antonio CM, Gomez Ld, Gordon DR, Hobbs RJ, Holt A, Hopper KR, Hughes CE, LaHart M, Leakey RRB, Lee WG, Loope LL, Lorence DH, Louda SM, Lugo AE, McEvoy PB, Richardson DM, Vitousek PM (1999) Introductions of Species : Research needs - Benefits can be reaped, but risks are high. BioScience, 49, 619–630.
Excoffier L, Foll M, Petit RJ (2009) Genetic consequences of range expansions. The Annual Review of Ecology, Evolution, and Systematics, 40, 481–501.
Feder JL, Berlocher SH, Roethele JB, Dambroski H, Smith JJ, Perry WL, Gavrilovic V, Filchak KE, Rull J, Aluja M (2003) Allopatric genetic origins for sympatric host-plant shifts and race formation in Rhagoletis. Proceedings of the National Academy of Sciences of the United States of America, 100, 10314–10319.
Feder JL, Roethele JB, Wlazlo B, Berlocher SH (1997) Selective maintenance of allozyme differences among sympatric host races of the apple maggot fly. Proceedings of the National Academy of Sciences of the United States of America, 94, 11417–11421.
Feder JL, Williams SM, Berlocher SH, Mcpheron BA, Bush GL (1999) The population genetics of the apple maggot fly , Rhagoletis pomonella and the snowberry maggot , R . zephyria: implications for models of sympatric speciation. Entomologia Experimentalis et Applicata, 90, 9–24.
Fitt GP (1981) Pupal survival of two northern australian tephritid species and its relationship to soil-conditions. Journal of the Australian Entomological Society, 20, 139–144.
Fox J, Weisberg S (2011) An {R} Companion to Applied Regression. Sage, Thousand Oaks, CA.
Gamst G, Meyers LS, Guarino AJ (2008) Analysis of Variance Designs. Cambridge University Press.
Gibbs AG (2011) Thermodynamics of cuticular transpiration. Journal of Insect Physiology, 57, 1066–9.
Gibbs AG, Chippendale AK, Rose MR (1997) Physiological mechanisms of evolved

45
desiccation resistance in Drosophila melanogaster. The Journal of Experimental Biology, 200, 1821–1832.
GoogleImageLandsat Washington. GOOGLE EARTH.
Grant PR, Grant BR (2014) Synergism of natural selection and introgression in the origin of a new species. The American Naturalist, 183, 671–681.
Grant WS, Little RM (1992) How sedentary are greywing francolins (Francolinus africanus)? Evolution, 46, 1477–1491.
Green E, Almskaar K, Sim SB, Arcella T, Yee WL, Feder JL, Schwarz D (2013) Molecular species identification of cryptic apple and snowberry maggots (Diptera: Tephritidae) in Western and Central Washington. Environmental Entomology, 42, 1100–1109.
Green RE, Krause J, Briggs AW, Maricic T, Stenzel U, Kircher M, Petterson N, Li H, Zhai W, Fritz MH, Hansen NF, Durand EY, Malaspinas A, Jensen JD, Marques-Bonet T, Alkan C, Prufer K, Meyer M, Burbano HA, Good JM, Schultz R, Aximu-Petri A, Butthof A, Hober B, Hoffner B, Siegemund M, Weihmann A, Nusbaum C, Lander ES, Russ C, Novod N, Affourtit J, Egholm M, Verna C, Rudan P, Brajkovic D, Kucan Z, Gusic I, Doronichev VB, Golovanova LV, Lalueza-Fox C, de la Rasilla M, Fortea J, Rosas A, Schmitz RW, Johnson PLF Eichler EE, Falush D, Birney E, Mullikin JC, Slatkin M, Nielsen R, Kelso J, Lachmann M, Reich D, Paabo S (2014) A Draft Sequence of the Neandertal Genome. Science, 328, 710–722.
Guppy M, Withers P (1999) Metabolic depression in animals: physiological perspectives and biochemical generalizations. Biological reviews of the Cambridge Philosophical Society, 74, 1–40.
Hahn DA, Denlinger DL (2007) Meeting the energetic demands of insect diapause: Nutrient storage and utilization. Journal of Insect Physiology, 53, 760–773.
Hidalgo K, Mouline K, Mamai W, Foucreau N, Dabire KR, Bouchereau A, Simard F, Renault D (2014) Novel insights into the metabolic and biochemical underpinnings assisting dry-season survival in female malaria mosquitoes of the Anopheles gambiae complex. Journal of Insect Physiology, 70, 102–16.
Hood GR, Yee W, Goughnour RB, Sim SB, Egan SP, Arcella T, Saint-Jean G, Powell THQ, XU CCY, Feder JL (2013) The geographic distribution of Rhagoletis pomonella (Diptera: Tephritidae) in the Western United States: Introduced species or native population? Annals of the Entomological Society of America, 106, 59–65.
Huddleston JL (2013) Short-range host preference in snowberry maggot flies depends on life history stage [master's thesis]. Western Washington University, 46 p.
Hulthen AD, Clarke AR (2006) The influence of soil type and moisture on pupal survival of Bactrocera tryoni (Froggatt) (Diptera: Tephritidae). Australian Journal of Entomology, 45, 16–19.
Inoue MN, Yokoyama J, Washitani I (2007) Displacement of Japanese native bumblebees by the recently introduced Bombus terrestris (L.) (Hymenoptera: Apidae). Journal of Insect Conservation, 12, 135–146.
Irwin J, Lee Jr R (2003) Cold winter microenvironments conserve energy and improve overwintering survival and potential fecundity of the goldenrod gall fly, Eurosta

46
solidaginis. Oikos, 100, 71–78.
Karatayev AY, Burlakova LE, Padilla DK (2014) Zebra versus quagga mussels: a review of their spread, population dynamics, and ecosystem impacts. Hydrobiologia, 746, 97–112.
Kawano T, Shimoda M, Matsumoto H, Ryuda M, Tsuzuki S, Hayakawa Y (2010) Identification of a gene, Desiccate, contributing to desiccation resistance in Drosophila melanogaster. The Journal of Biological Chemistry, 285, 38889–97.
Kleynhans E, Clusella-Trullas S, Terblanche JS (2014) Impacts of environmental variability on desiccation rate, plastic responses and population dynamics of Glossina pallidipes. Journal of Evolutionary Biology, 27, 337–48.
Lee CE (1999) Rapid and repeated invasions of fresh water by the copepod Eurytemora affinis. Evolution, 53, 1423–1434.
Lee CE (2002) Evolutionary genetics of invasive species. Trends in Ecology & Evolution, 17, 386–391.
Lee CE, Kiergaard M, Gelembiuk GW, Eads BD, Posavi M (2011) Pumping Ions: Rapid parallel evolution of ionic regulation following habitat invasions. Evolution, 65, 2229–2244.
Lee CE, Posavi M, Charmantier G (2012) Rapid evolution of body fluid regulation following independent invasions into freshwater habitats. Journal of Evolutionary Biology, 25, 625–633.
Lowery RK, Uribe G, Jimenez EB, Weiss MA, Herrera KJ, Regueiro M, Herrera RJ (2013) Neanderthal and Denisova genetic affinities with contemporary humans: Introgression versus common ancestral polymorphisms. Gene, 530, 83–94.
Mallet J (2005) Hybridization as an invasion of the genome. Trends in Ecology and Evolution, 20, 229–237.
Manachini B, Billeci N, Palla F (2013) Exotic insect pests: The impact of the Red Palm Weevil on natural and cultural heritage in Palermo (Italy). Journal of Cultural Heritage, 14, 177–182.
Mattson W, Vanhanen H, Veteli T, Sivonen S, Niemelä P (2007) Few immigrant phytophagous insects on woody plants in Europe: Legacy of the European crucible? Biological Invasions, 9, 957–974.
Matute DR, Ayroles JF (2014) Hybridization occurs between Drosophila simulans and D. sechellia in the Seychelles archipelago. Journal of Evolutionary Biology, 27, 1057–1068.
Mertz C, Koong D, Anderson S (2013) 2013 Washington Annual Agriculture Bulletin. Olympia, WA.
Michel AP, Rull J, Aluja M, Feder JL (2007) The genetic structure of hawthorn-infesting Rhagoletis pomonella populations in Mexico: Implications for sympatric host race formation. Molecular Ecology, 16, 2867–2878.
Montarsi F, Martini S, Dal Pont M, Delai N, Milone NF, Mazzucato M, Soppelsa F, Cazzola L, Cazzin S, Ravagnan S, Ciocchetta S, Russo F, Capelli G (2013) Distribution and

47
habitat characterization of the recently introduced invasive mosquito Aedes koreicus [Hulecoeteomyia koreica], a new potential vector and pest in north-eastern Italy. Parasites & Vectors, 6, 292.
Neilson WTA (1964) Some effects of relative humidity on development of pupae of the apple maggot, Rhagoletis pomonella (Walsh). The Canadian Entomologist, 96, 810–811.
Nyamukondiwa C, Kleynhans E, Terblanche JS (2010) Phenotypic plasticity of thermal tolerance contributes to the invasion potential of Mediterranean fruit flies (Ceratitis capitata). Ecological Entomology, 35, 565–575.
Oliveira CM, Auad a. M, Mendes SM, Frizzas MR (2013) Economic impact of exotic insect pests in Brazilian agriculture. Journal of Applied Entomology, 137, 1–15.
Paradis E, Claude J, Strimmer K (2004) APE: Analysis of phylogenetics and evolution in R language. Bioinformatics, 20, 289–290.
Pardo-Diaz C, Salazar C, Baxter SW, Merot C, Figueiredo-Ready W, Joron M, McMillian WO, Jiggins CD (2012) Adaptive introgression across species boundaries in Heliconius butterflies. PLoS GENETICS, 8, e1002752.
Parkash R, Aggarwal DD, Kalra B, Ranga P (2011) Divergence of water balance mechanisms in two melanic Drosophila species from the western Himalayas. Comparative Biochemistry and Physiology - A Molecular and Integrative Physiology, 158, 531–541.
Pelini SL, Diamond SE, Maclean H, Ellison AM, Gotelli NJ, Sanders NJ, Dunn RR (2012) Common garden experiments reveal uncommon responses across temperatures, locations, and species of ants. Ecology and Evolution, 2, 3009–15.
Perry WL, Feder JL, Dwyer G, Lodge DM (2001) Hybrid zone dynamics and species replacement between orconectes crayfishes in a northern Wisconsin lake. Evolution, 55, 1153–1166.
Pimentel D, McNair S, Janecka J, Wightman J, Simmonds C, O'Connell C, Wong E, Russel L, Zern J, Aquino T, Tsomondo T (2001) Economic and environmental threats of alien plant, animal, and microbe invasions. Agriculture, Ecosystems and Environment, 84, 1–20.
Prokopy RJ, Bush GL (1972) Apple maggot infestation of pear. Journal of Economic Entomology, 65, 597.
Quinlan MC, Gibbs AG (2006) Discontinuous gas exchange in insects. Respiratory Physiology & Neurobiology, 154, 18–29.
Ragland GJ, Almskaar K, Vertacnik KL, Gough HM, Feder JL, Hahn DA, Schwarz D (2015) Differences in performance and transcriptome-wide gene expression associated with Rhagoletis (Diptera: Tephritidae) larvae feeding in alternate host fruit environments. Molecular Ecology, 24, 2759–76.
Ragland GJ, Fuller J, Feder JL, Hahn DA (2009) Biphasic metabolic rate trajectory of pupal diapause termination and post-diapause development in a tephritid fly. Journal of Insect Physiology, 55, 344–350.
Ragland GJ, Sim SB, Goudarzi S, Feder JL, Hahn DA (2012) Environmental interactions

48
during host race formation: host fruit environment moderates a seasonal shift in phenology in host races of Rhagoletis pomonella. Functional Ecology, 26, 921–931.
Rhymer JM, Simberloff D (1996) Extinction by hybridization and introgression. Annual Review of Ecology and Systematics, 27, 83–109.
Sankararaman S, Mallick S, Dannemann M, Prufer K, Kelso J, Paabo S, Patterson N, Reich D (2014) The genomic landscape of Neanderthal ancestry in present-day humans. Nature-Research Letter, 507, 354-357.
Schilman PE, Lighton JRB, Holway DA (2005) Respiratory and cuticular water loss in insects with continuous gas exchange: Comparison across five ant species. Journal of Insect Physiology, 51, 1295–1305.
Schilman PE, Lighton JRB, Holway DA (2007) Water balance in the Argentine ant (Linepithema humile) compared with five common native ant species from southern California. Physiological Entomology, 32, 1–7.
Schwarz D, Shoemaker KD, Botteri NL, McPheron BA (2007) A novel preference for an invasive plant as a mechanism for animal hybrid speciation. Evolution, 61, 245–56.
Siler N, Roe G, Durran D (2013) On the dynamical causes of variability in the rain-shadow effect: A case study of the Washington Cascades. Journal of Hydrometeorology, 14, 122–139.
Sim SB, Mattsson M, Feder JL, CHA DH, Yee WL, Goughnour RB, Linn Jr. CE, Feder JL (2012) A field test for host fruit odour discrimination and avoidance behaviour for Rhagoletis pomonella flies in the western United States. Journal of Evolutionary Biology, 25, 961–971.
Team RC (2015) R: A language and environment for statistical computing.
Terblanche JS, Kleynhans E (2009) Phenotypic plasticity of desiccation resistance in Glossina puparia: are there ecotype constraints on acclimation responses? Journal of Evolutionary Biology, 22, 1636–1648.
Thompson JD (1991) the Biology of an invasive plant - What makes spartina-anglica so successful. Bioscience, 41, 393–401.
Venables WN, Ripley BD (2002) Modern Applied Statistics with S. Springer, New York.
Walsh B (1867) The apple-worm and the apple maggot. Journal of Horticulture, 338–343.
Walters AC, Mackay DA (2005) Importance of large colony size for successful invasion by Argentine ants (Hymenoptera: Formicidae): Evidence for biotic resistance by native ants. Austral Ecology, 30, 395–406.
Williamson M (1993) Invaders, weeds and the risk from genetically manipulated organisms. Experientia, 49, 219–224.
WSDA (2014) Proposed Rule Making. WSDA.
Yee WL (2013a) Influence of media type and moisture on adult development in Rhagoletis indifferens (Diptera: Tephritidae). Environmental Entomology, 42, 595–604.
Yee WL (2013b) Soil moisture and relative humidity effects during postdiapause on the emergence of western cherry fruit fly (Diptera: Tephritidae). The Canadian

49
Entomologist, 145, 317–326.
Zefferman E, Stevens JT, Charles GK, Dunbar-Irwin M, Emam T, Fick S, Morales LV, Wolf KM, Young DJN, Young TP (2015) Plant communities in harsh sites are less invaded: a summary of observations and proposed explanations. AoB PLANTS, 7, plv056.

50
APPENDIX
Genome Association Study
In order to provide evidence for a genetic element associated with desiccation
resistance in Rhagoletis flies, I laid the groundwork for a genome-wide association study.
The aim of such a study is to discover which genomic regions are associated with
desiccation resistance and also whether those regions correlate with those of
disproportionate introgression between the species (Green et al. 2013).
For this larger-scale study, I collected Rhagoletis zephyria pupae in the same way as
before, and collected R. pomonella pupae from apples fallen from infested trees. The larvae
were allowed to mature and egress from the fruit just as before (see methods). I collected
1600 R. zephyria pupae and 800 R. pomonella pupae during September 2014, all from
Bellingham, Washington. All pupae were placed into 0.67mL microcentrifuge tubes, weighed
initially, and then subjected to 43.16% rh at 22° C in a chamber with an 16:8 light:dark cycle
for eight days. I weighed all of the pupae again on the last day of treatment, and immediately
froze them for further analysis. For this study I used 15 cohorts total.
After freezing, I measured the length and width of each pupal case, and dissected all
of the R. zephyria pupae, discarding any parasitoid wasps found. I calculated the
percentage of weight each pupa had remaining at the end of the treatment, and then
randomly selected 200 R. zephyria individuals with 65%-85% weight remaining, and 200
with 25%-45% weight remaining. Too few pupae fell into the 65%-85% category in the R.
pomonella samples, so I randomly selected 200 individuals with 55%-75% weight remaining
and 200 with 25%-45% weight remaining.

51
I extracted DNA from all of these selected samples using a standard Qiagen DNeasy
Blood and Tissue kit (Qiagen, Valencia, California).

52
Rhagoletis zephyria – low weight Rhagoletis pomonella – low weight
Sample ID Initial Weight PWR Sample ID Initial Weight PWR
F414 0.42967 26.36% C162 0.44023 32.85%
F411 0.42948 29.86% C151 0.43211 33.80%
F688 0.42587 30.00% C39 0.43143 34.43%
F225 0.42335 31.19% C538 0.43666 34.45%
F196 0.42927 32.08% C337 0.43557 35.06%
F707 0.42128 32.08% C161 0.43472 35.12%
F716 0.42714 32.90% C30 0.43288 35.12%
F353 0.43193 33.67% C182 0.43704 35.17%
F421 0.43013 34.03% C138 0.43763 35.28%
F1436 0.42809 34.36% C287 0.43028 35.30%
F202 0.43407 34.55% C140 0.43402 35.58%
F213 0.42944 34.80% C511 0.42626 35.91%
F215 0.43223 34.82% C753 0.42937 36.16%
F212 0.42677 34.85% C322 0.43518 36.19%
F705 0.42366 34.97% C775 0.42999 36.21%
F1177 0.42907 35.02% C701 0.42531 36.59%
F1007 0.43061 35.23% C29 0.43665 36.65%
F564 0.42735 35.24% C99 0.43290 36.78%
F329 0.42372 35.25% C57 0.43830 36.79%
F578 0.42897 35.41% C4 0.43111 36.83%
F306 0.42729 35.44% C641 0.43114 36.86%
F217 0.42857 35.48% C241 0.43364 36.92%
F1219 0.42490 35.51% C190 0.43588 36.93%
F338 0.42922 35.56% C521 0.42730 36.94%
F1453 0.43087 35.61% C66 0.43524 37.04%
F239 0.43139 35.67% C46 0.43477 37.10%
F257 0.42678 35.73% C547 0.42842 37.24%
Appendix Table 1 – Table of Genome Association samples, showing the individual identifier, initial pupal weight, and percent weight remaining after treatment for each sample.

53
F1508 0.42555 35.79% C512 0.43047 37.39%
F437 0.43156 35.82% C87 0.43397 37.52%
F315 0.43392 35.86% C751 0.42937 37.56%
F1113 0.42563 35.86% C157 0.42881 37.63%
F712 0.42514 35.92% C673 0.43001 37.66%
F503 0.42157 35.94% C129 0.43766 37.74%
F203 0.43131 36.01% C770 0.44019 37.82%
F630 0.42925 36.02% C394 0.43220 37.86%
F1492 0.42435 36.02% C54 0.43727 37.86%
F389 0.43045 36.13% C164 0.43194 37.89%
F760 0.43349 36.18% C764 0.43447 37.98%
F221 0.43014 36.19% C108 0.43755 37.99%
F1137 0.42481 36.19% C68 0.42925 38.10%
F835 0.42667 36.19% C536 0.43058 38.12%
F344 0.42459 36.33% C629 0.43172 38.16%
F1252 0.43377 36.34% C11 0.43712 38.21%
F301 0.42527 36.35% C59 0.43305 38.27%
F457 0.42360 36.36% C3 0.42963 38.29%
F726 0.42577 36.44% C74 0.43488 38.30%
F349 0.43189 36.53% C85 0.43623 38.37%
F393 0.42788 36.58% C651 0.43335 38.60%
F333 0.43007 36.67% C53 0.43564 38.65%
F206 0.42839 36.75% C383 0.43412 38.76%
F1490 0.42235 36.75% C694 0.43092 38.77%
F214 0.42144 36.75% C44 0.43631 38.81%
F385 0.42227 36.79% C369 0.43013 38.83%
F384 0.42862 36.80% C95 0.42838 38.91%
F235 0.42773 36.89% C532 0.43366 38.97%
F228 0.42421 36.93% C329 0.44285 39.00%
F300 0.42486 36.94% C685 0.42752 39.09%
F381 0.43058 36.97% C77 0.44074 39.14%
F1524 0.43293 37.00% C67 0.43689 39.19%
F455 0.42341 37.03% C346 0.43521 39.25%

54
F1019 0.42197 37.12% C545 0.43701 39.29%
F331 0.42471 37.19% C305 0.43914 39.33%
F334 0.42636 37.25% C194 0.43389 39.54%
F87 0.42565 37.26% C635 0.42488 39.55%
F693 0.42428 37.33% C69 0.43241 39.61%
F219 0.42709 37.41% C568 0.44242 39.72%
F1363 0.42379 37.46% C463 0.43910 39.83%
F369 0.42918 37.48% C163 0.43938 39.86%
F445 0.42572 37.54% C231 0.43954 39.93%
F1243 0.43236 37.56% C627 0.43277 39.93%
F930 0.43251 37.63% C144 0.43614 39.95%
F1462 0.42977 37.66% C776 0.43311 39.96%
F1370 0.42478 37.82% C779 0.43343 39.96%
F1067 0.42423 37.86% C767 0.43282 40.02%
F752 0.42467 37.88% C331 0.43161 40.03%
F439 0.42407 37.90% C131 0.44341 40.06%
F1329 0.42618 37.94% C90 0.43203 40.12%
F1115 0.42501 37.95% C613 0.42840 40.15%
F490 0.42940 38.00% C430 0.42817 40.24%
F1189 0.42832 38.01% C768 0.43925 40.29%
F157 0.42439 38.03% C193 0.42896 40.39%
F1400 0.42836 38.04% C32 0.42946 40.42%
F1481 0.42569 38.08% C732 0.43562 40.44%
F511 0.43516 38.12% C577 0.43072 40.45%
F604 0.42783 38.24% C741 0.43649 40.52%
F224 0.42605 38.29% C415 0.43545 40.59%
F526 0.43627 38.32% C65 0.43540 40.65%
F447 0.42798 38.32% C52 0.43328 40.66%
F1449 0.43030 38.35% C201 0.43189 40.82%
F1473 0.43013 38.36% C666 0.43544 40.94%
F750 0.42605 38.36% C469 0.43761 40.98%
F226 0.42704 38.41% C509 0.42882 41.05%
F1451 0.42916 38.43% C128 0.43434 41.08%

55
F701 0.43728 38.44% C619 0.43029 41.09%
F867 0.42732 38.51% C5 0.43409 41.12%
F263 0.42635 38.52% C648 0.43386 41.12%
F825 0.42644 38.54% C143 0.43892 41.14%
F1487 0.42695 38.54% C609 0.43072 41.18%
F368 0.42295 38.58% C2 0.43277 41.18%
F999 0.42722 38.64% C323 0.43238 41.24%
F264 0.42478 38.67% C119 0.43497 41.36%
F287 0.42682 38.71% C206 0.43605 41.43%
F1466 0.42598 38.71% C342 0.44178 41.47%
F1173 0.42343 38.72% C79 0.43370 41.57%
F1494 0.42458 38.73% C252 0.43872 41.59%
F768 0.42985 38.75% C167 0.44039 41.69%
F773 0.42423 38.79% C467 0.43211 41.69%
F277 0.42580 38.80% C630 0.43061 41.86%
F122 0.43086 38.87% C738 0.42618 41.96%
F836 0.43543 38.88% C220 0.43021 41.99%
F1477 0.42436 38.95% C616 0.42977 42.00%
F390 0.42963 38.99% C624 0.42778 42.05%
F1270 0.42603 39.03% C437 0.42887 42.05%
F1392 0.42424 39.12% C12 0.42837 42.06%
F1457 0.42517 39.22% C458 0.44183 42.16%
F1165 0.43115 39.24% C606 0.42864 42.20%
F153 0.42619 39.31% C93 0.43481 42.24%
F1397 0.42854 39.32% C543 0.43200 42.26%
F508 0.43092 39.37% C433 0.44116 42.31%
F1513 0.42800 39.38% C598 0.43940 42.31%
F878 0.43041 39.41% C513 0.42741 42.32%
F1378 0.42377 39.43% C145 0.44010 42.33%
F233 0.43402 39.52% C522 0.43452 42.34%
F1206 0.42856 39.53% C372 0.42827 42.34%
F435 0.43107 39.55% C381 0.42787 42.39%
F1139 0.43252 39.66% C755 0.43600 42.44%

56
F440 0.42940 39.73% C626 0.42812 42.45%
F967 0.43014 39.87% C183 0.43176 42.46%
F872 0.42526 39.96% C793 0.42700 42.48%
F298 0.43146 39.96% C97 0.43764 42.51%
F1204 0.42486 40.26% C554 0.42670 42.59%
F271 0.42940 40.27% C604 0.43447 42.60%
F559 0.42925 40.32% C291 0.43631 42.61%
F567 0.42267 40.33% C796 0.43504 42.65%
F1256 0.42284 40.36% C794 0.43693 42.73%
F391 0.42425 40.45% C279 0.43638 42.78%
F730 0.42380 40.45% C175 0.42909 42.84%
F1008 0.42336 40.50% C155 0.43334 42.86%
F471 0.42455 40.50% C621 0.44706 42.93%
F1216 0.43464 40.53% C740 0.43261 42.97%
F399 0.42537 40.58% C243 0.43346 43.00%
F409 0.42935 40.63% C385 0.43145 43.04%
F1398 0.42765 40.69% C476 0.43858 43.07%
F561 0.42274 40.69% C450 0.43006 43.08%
F232 0.42844 40.70% C98 0.42928 43.08%
F1182 0.43372 40.79% C103 0.42747 43.08%
F755 0.42101 40.86% C750 0.43412 43.10%
F297 0.42695 40.87% C640 0.43868 43.18%
F1450 0.42725 40.92% C245 0.43301 43.20%
F261 0.42432 40.95% C16 0.43900 43.21%
F1377 0.42992 40.96% C8 0.42353 43.26%
F1414 0.42259 41.02% C533 0.42947 43.27%
F781 0.42188 41.07% C551 0.42967 43.33%
F103 0.42967 41.13% C445 0.43479 43.40%
F589 0.43281 41.22% C112 0.43203 43.43%
F1495 0.42246 41.28% C165 0.43241 43.53%
F283 0.42321 41.36% C781 0.43141 43.57%
F229 0.42953 41.38% C211 0.43080 43.59%
F736 0.42291 41.52% C303 0.42976 43.62%

57
F998 0.42844 41.53% C31 0.42935 43.63%
F208 0.42891 41.58% C217 0.42693 43.64%
F234 0.42989 41.71% C307 0.42882 43.76%
F351 0.42571 41.76% C153 0.43147 43.76%
F127 0.42855 42.00% C360 0.42915 43.79%
F1376 0.42323 42.06% C362 0.42937 43.79%
F318 0.42313 42.15% C209 0.44064 43.80%
F325 0.43075 42.22% C498 0.43094 43.86%
F373 0.42416 42.29% C50 0.42734 43.90%
F1516 0.42132 42.34% C202 0.44416 43.91%
F565 0.42642 42.38% C136 0.43413 43.92%
F303 0.42812 42.42% C443 0.43042 43.94%
F407 0.42922 42.57% C330 0.42935 44.00%
F1558 0.43165 42.68% C601 0.44368 44.01%
F345 0.42925 42.68% C608 0.42823 44.01%
F434 0.42492 42.69% C72 0.43629 44.10%
F802 0.42781 42.74% C58 0.43579 44.17%
F348 0.42628 42.86% C527 0.43071 44.19%
F290 0.42356 42.99% C124 0.43636 44.25%
F310 0.43056 43.02% C91 0.43223 44.25%
F327 0.42630 43.05% C324 0.43122 44.30%
F171 0.42567 43.11% C127 0.42822 44.30%
F1426 0.42477 43.11% C152 0.43392 44.32%
F400 0.42424 43.23% C524 0.43713 44.38%
F324 0.42868 43.26% C37 0.42617 44.40%
F342 0.43158 43.47% C747 0.43165 44.44%
F987 0.42181 43.60% C370 0.44064 44.45%
F458 0.43171 43.62% C709 0.43551 44.50%
F227 0.42260 43.68% C457 0.42911 44.51%
F816 0.42156 43.69% C646 0.42951 44.55%
F1283 0.42418 43.74% C599 0.44090 44.57%
F995 0.43720 44.12% C528 0.43097 44.62%
F319 0.42384 44.16% C356 0.43006 44.66%

58
F763 0.42224 44.38% C149 0.43191 44.68%
F352 0.43030 44.39% C421 0.42929 44.69%
F363 0.42415 44.41% C758 0.43067 44.71%
F475 0.42268 44.53% C605 0.42924 44.73%
F1087 0.42602 44.54% C82 0.43661 44.78%
F574 0.42260 44.83% C683 0.43515 44.88%
F1464 0.43016 44.88% C196 0.44179 44.89%
F764 0.42960 44.91% C546 0.43048 44.91%
Rhagoletis zephyria – high weight Rhagoletis pomonella – high weight
Sample ID Initial Weight PWR Sample ID Initial Weight PWR
F1187 0.42563 65.21% C413 0.42414 55.11%
F218 0.43213 65.27% C462 0.43066 55.20%
F744 0.42489 65.29% C23 0.43320 55.31%
F442 0.42689 65.32% C508 0.43795 55.35%
F92 0.42645 65.55% C625 0.43202 55.50%
F1446 0.43619 65.59% C432 0.43200 55.57%
F1432 0.43383 66.06% C663 0.44038 55.70%
F1437 0.43124 66.22% C708 0.44089 55.91%
F1503 0.42754 66.23% C264 0.43620 55.93%
F1214 0.42607 66.23% C607 0.43378 56.05%
F992 0.42519 66.28% C237 0.43526 56.12%
F572 0.42466 66.38% C657 0.42894 56.20%
F1248 0.42228 66.38% C268 0.42678 56.34%
F111 0.43405 66.50% C774 0.43325 56.35%
F1468 0.42760 66.57% C670 0.43279 56.35%
F204 0.42825 66.60% C18 0.43605 56.39%
F1476 0.42664 66.90% C471 0.43789 56.40%
F147 0.43518 66.94% C419 0.43123 56.42%
F216 0.43240 66.96% C137 0.43039 56.44%
F1027 0.42650 67.09% C130 0.42483 56.44%
F1285 0.43066 67.14% C60 0.43392 56.47%
F374 0.42255 67.24% C168 0.43410 56.48%

59
F1510 0.42314 67.39% C288 0.43331 56.56%
F1234 0.42707 67.57% C240 0.43201 56.57%
F1266 0.43386 67.73% C744 0.43233 56.57%
F1458 0.42443 68.02% C280 0.42822 56.61%
F1131 0.42660 68.17% C251 0.43194 56.65%
F1514 0.43588 68.18% C478 0.43058 56.69%
F1343 0.42318 68.26% C361 0.44182 56.77%
F1318 0.42444 68.27% C120 0.43711 56.79%
F723 0.42524 68.32% C414 0.42712 57.06%
F571 0.42722 68.35% C38 0.43331 57.10%
F1103 0.42636 68.42% C392 0.42718 57.18%
F1515 0.42970 68.42% C126 0.43504 57.23%
F460 0.42845 68.50% C671 0.42978 57.55%
F1156 0.43138 68.53% C766 0.44157 57.59%
F230 0.42977 68.56% C9 0.44048 57.60%
F916 0.42769 68.57% C797 0.42467 57.61%
F799 0.43582 68.65% C587 0.42899 57.69%
F388 0.42616 68.75% C431 0.43258 57.81%
F1518 0.42937 68.80% C302 0.43315 57.86%
F1250 0.42562 68.91% C632 0.42622 57.99%
F943 0.42290 68.92% C636 0.43270 58.10%
F174 0.43090 68.97% C173 0.43526 58.14%
F118 0.43041 69.04% C212 0.43551 58.55%
F154 0.43373 69.06% C583 0.42840 58.59%
F1459 0.43190 69.08% C200 0.43266 58.60%
F983 0.43716 69.11% C345 0.42339 58.62%
F713 0.42737 69.16% C222 0.43049 58.62%
F1482 0.42833 69.17% C51 0.43244 58.65%
F155 0.42863 69.35% C572 0.43651 58.72%
F117 0.43147 69.40% C523 0.42282 58.80%
F900 0.42446 69.57% C725 0.43408 58.97%
F1465 0.42671 69.90% C763 0.43486 59.06%
F977 0.42482 69.96% C489 0.44608 59.13%
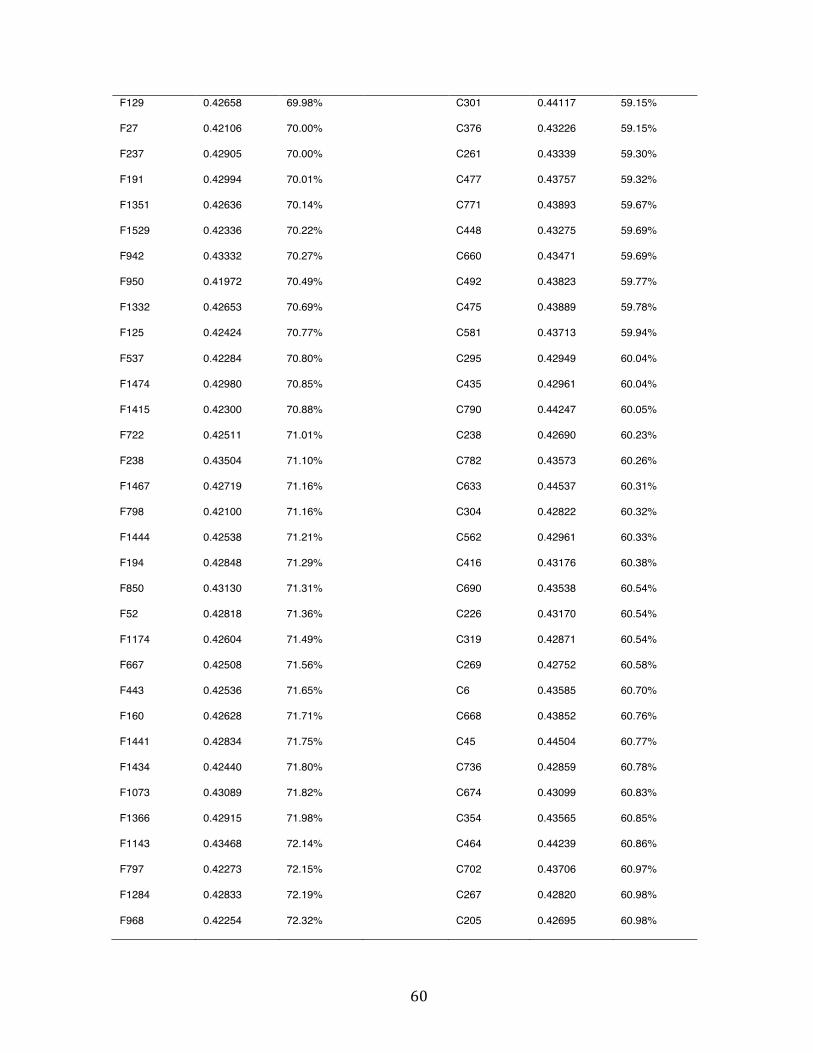
60
F129 0.42658 69.98% C301 0.44117 59.15%
F27 0.42106 70.00% C376 0.43226 59.15%
F237 0.42905 70.00% C261 0.43339 59.30%
F191 0.42994 70.01% C477 0.43757 59.32%
F1351 0.42636 70.14% C771 0.43893 59.67%
F1529 0.42336 70.22% C448 0.43275 59.69%
F942 0.43332 70.27% C660 0.43471 59.69%
F950 0.41972 70.49% C492 0.43823 59.77%
F1332 0.42653 70.69% C475 0.43889 59.78%
F125 0.42424 70.77% C581 0.43713 59.94%
F537 0.42284 70.80% C295 0.42949 60.04%
F1474 0.42980 70.85% C435 0.42961 60.04%
F1415 0.42300 70.88% C790 0.44247 60.05%
F722 0.42511 71.01% C238 0.42690 60.23%
F238 0.43504 71.10% C782 0.43573 60.26%
F1467 0.42719 71.16% C633 0.44537 60.31%
F798 0.42100 71.16% C304 0.42822 60.32%
F1444 0.42538 71.21% C562 0.42961 60.33%
F194 0.42848 71.29% C416 0.43176 60.38%
F850 0.43130 71.31% C690 0.43538 60.54%
F52 0.42818 71.36% C226 0.43170 60.54%
F1174 0.42604 71.49% C319 0.42871 60.54%
F667 0.42508 71.56% C269 0.42752 60.58%
F443 0.42536 71.65% C6 0.43585 60.70%
F160 0.42628 71.71% C668 0.43852 60.76%
F1441 0.42834 71.75% C45 0.44504 60.77%
F1434 0.42440 71.80% C736 0.42859 60.78%
F1073 0.43089 71.82% C674 0.43099 60.83%
F1366 0.42915 71.98% C354 0.43565 60.85%
F1143 0.43468 72.14% C464 0.44239 60.86%
F797 0.42273 72.15% C702 0.43706 60.97%
F1284 0.42833 72.19% C267 0.42820 60.98%
F968 0.42254 72.32% C205 0.42695 60.98%
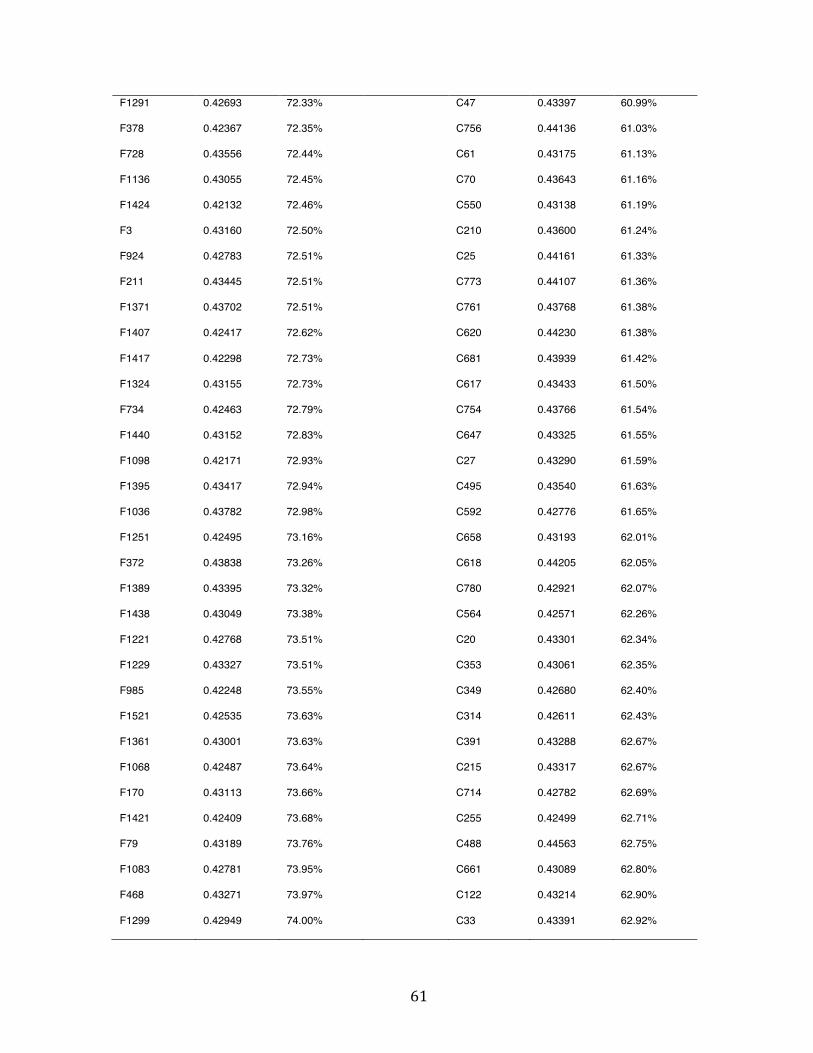
61
F1291 0.42693 72.33% C47 0.43397 60.99%
F378 0.42367 72.35% C756 0.44136 61.03%
F728 0.43556 72.44% C61 0.43175 61.13%
F1136 0.43055 72.45% C70 0.43643 61.16%
F1424 0.42132 72.46% C550 0.43138 61.19%
F3 0.43160 72.50% C210 0.43600 61.24%
F924 0.42783 72.51% C25 0.44161 61.33%
F211 0.43445 72.51% C773 0.44107 61.36%
F1371 0.43702 72.51% C761 0.43768 61.38%
F1407 0.42417 72.62% C620 0.44230 61.38%
F1417 0.42298 72.73% C681 0.43939 61.42%
F1324 0.43155 72.73% C617 0.43433 61.50%
F734 0.42463 72.79% C754 0.43766 61.54%
F1440 0.43152 72.83% C647 0.43325 61.55%
F1098 0.42171 72.93% C27 0.43290 61.59%
F1395 0.43417 72.94% C495 0.43540 61.63%
F1036 0.43782 72.98% C592 0.42776 61.65%
F1251 0.42495 73.16% C658 0.43193 62.01%
F372 0.43838 73.26% C618 0.44205 62.05%
F1389 0.43395 73.32% C780 0.42921 62.07%
F1438 0.43049 73.38% C564 0.42571 62.26%
F1221 0.42768 73.51% C20 0.43301 62.34%
F1229 0.43327 73.51% C353 0.43061 62.35%
F985 0.42248 73.55% C349 0.42680 62.40%
F1521 0.42535 73.63% C314 0.42611 62.43%
F1361 0.43001 73.63% C391 0.43288 62.67%
F1068 0.42487 73.64% C215 0.43317 62.67%
F170 0.43113 73.66% C714 0.42782 62.69%
F1421 0.42409 73.68% C255 0.42499 62.71%
F79 0.43189 73.76% C488 0.44563 62.75%
F1083 0.42781 73.95% C661 0.43089 62.80%
F468 0.43271 73.97% C122 0.43214 62.90%
F1299 0.42949 74.00% C33 0.43391 62.92%

62
F138 0.43279 74.01% C586 0.43419 63.06%
F732 0.42602 74.01% C272 0.43127 63.23%
F1443 0.42841 74.04% C672 0.42962 63.29%
F491 0.42441 74.11% C100 0.43799 63.55%
F90 0.42461 74.12% C700 0.44105 63.57%
F162 0.42839 74.13% C344 0.42783 63.65%
F1472 0.43394 74.20% C313 0.42763 63.74%
F383 0.42188 74.22% C216 0.43113 63.76%
F1517 0.43209 74.27% C440 0.43429 63.93%
F463 0.43160 74.29% C246 0.42691 63.96%
F1489 0.42174 74.32% C503 0.42591 63.98%
F1280 0.43119 74.35% C299 0.43291 64.03%
F824 0.42962 74.37% C306 0.42668 64.29%
F1099 0.43322 74.39% C585 0.42454 64.39%
F149 0.43316 74.41% C612 0.44869 64.49%
F912 0.43259 74.52% C176 0.43293 64.60%
F179 0.43143 74.54% C717 0.44213 64.73%
F1138 0.42441 74.55% C772 0.43622 64.74%
F777 0.42415 74.68% C340 0.43686 64.77%
F1427 0.42403 74.73% C712 0.44531 64.80%
F1 0.42438 74.77% C271 0.43063 65.06%
F151 0.42458 74.83% C470 0.42986 65.18%
F546 0.42465 74.87% C223 0.43728 65.19%
F1298 0.42334 74.89% C593 0.43040 65.26%
F1306 0.42440 75.00% C227 0.43177 65.60%
F974 0.43128 75.19% C310 0.42774 65.69%
F438 0.42410 75.20% C762 0.43519 65.89%
F624 0.42307 75.21% C684 0.42970 65.90%
F623 0.42858 75.24% C36 0.42975 65.92%
F1319 0.43671 75.25% C214 0.42690 66.04%
F986 0.42756 75.35% C682 0.44095 66.05%
F163 0.42968 75.36% C567 0.44108 66.08%
F962 0.42810 75.45% C233 0.43354 66.11%
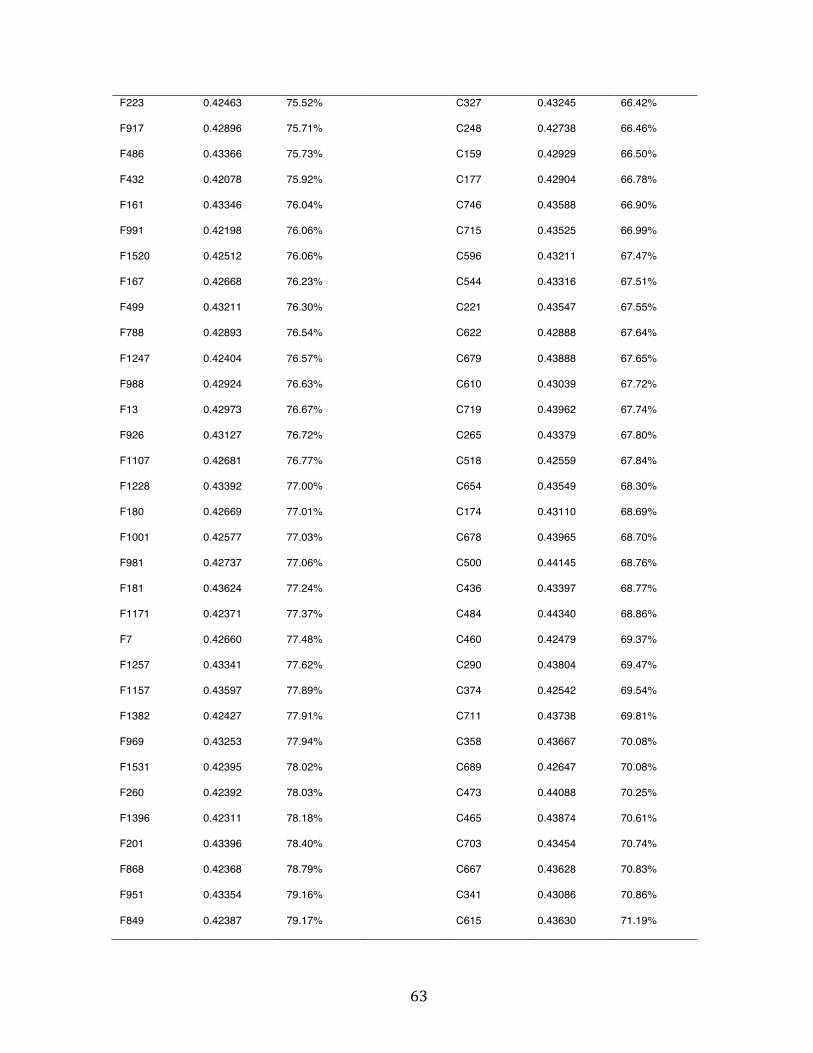
63
F223 0.42463 75.52% C327 0.43245 66.42%
F917 0.42896 75.71% C248 0.42738 66.46%
F486 0.43366 75.73% C159 0.42929 66.50%
F432 0.42078 75.92% C177 0.42904 66.78%
F161 0.43346 76.04% C746 0.43588 66.90%
F991 0.42198 76.06% C715 0.43525 66.99%
F1520 0.42512 76.06% C596 0.43211 67.47%
F167 0.42668 76.23% C544 0.43316 67.51%
F499 0.43211 76.30% C221 0.43547 67.55%
F788 0.42893 76.54% C622 0.42888 67.64%
F1247 0.42404 76.57% C679 0.43888 67.65%
F988 0.42924 76.63% C610 0.43039 67.72%
F13 0.42973 76.67% C719 0.43962 67.74%
F926 0.43127 76.72% C265 0.43379 67.80%
F1107 0.42681 76.77% C518 0.42559 67.84%
F1228 0.43392 77.00% C654 0.43549 68.30%
F180 0.42669 77.01% C174 0.43110 68.69%
F1001 0.42577 77.03% C678 0.43965 68.70%
F981 0.42737 77.06% C500 0.44145 68.76%
F181 0.43624 77.24% C436 0.43397 68.77%
F1171 0.42371 77.37% C484 0.44340 68.86%
F7 0.42660 77.48% C460 0.42479 69.37%
F1257 0.43341 77.62% C290 0.43804 69.47%
F1157 0.43597 77.89% C374 0.42542 69.54%
F1382 0.42427 77.91% C711 0.43738 69.81%
F969 0.43253 77.94% C358 0.43667 70.08%
F1531 0.42395 78.02% C689 0.42647 70.08%
F260 0.42392 78.03% C473 0.44088 70.25%
F1396 0.42311 78.18% C465 0.43874 70.61%
F201 0.43396 78.40% C703 0.43454 70.74%
F868 0.42368 78.79% C667 0.43628 70.83%
F951 0.43354 79.16% C341 0.43086 70.86%
F849 0.42387 79.17% C615 0.43630 71.19%

64
F970 0.42508 79.31% C28 0.43351 71.26%
F148 0.42741 79.55% C692 0.43897 71.58%
F1002 0.42294 79.85% C499 0.44057 71.74%
F1112 0.42514 80.00% C800 0.44684 72.85%
F1144 0.43110 80.26% C257 0.42544 73.23%
F1419 0.42786 80.31% C491 0.43355 73.42%
F1152 0.42976 80.56% C286 0.42233 73.47%
F804 0.42957 80.62% C502 0.42563 73.81%
F534 0.42458 80.73% C298 0.43423 73.96%
F724 0.42553 81.37% C281 0.43455 74.02%
F1272 0.42187 82.63% C644 0.44867 74.05%
F854 0.42889 83.25% C707 0.43104 74.35%
F1295 0.42562 83.49% C114 0.43521 74.79%