Adaptive Landing Gear: optimum control strategy and...
26
Adaptive Landing Gear: optimum control strategy and potential for improvement * Grzegorz Mikuˆlowski ˆ Lukasz Jankowski † Smart-Tech Centre Institute of Fundamental Technological Research Swietokrzyska 21, 00-049 Warszawa, Poland Abstract An adaptive landing gear is a landing gear (LG) capable of active adaptation to particular landing conditions by means of controlled hydraulic force. The objective of the adaptive control is to mitigate the peak force transferred to the aircraft structure during touch-down, and thus to limit the structural fatigue factor. This paper inves- tigates the ultimate limits for improvement due to various strategies of active control. Five strategies are proposed and investigated numerically using a validated model of a real, passive landing gear as a reference. Potential for improvement is estimated sta- tistically in terms of the mean and median (significant) peak strut forces as well as in terms of the extended safe sinking velocity range. Three control strategies are verified experimentally using a laboratory test stand. Keywords: adaptive landing gear, adaptive impact absorption, shock absorber, load mitigation * Shock and Vibration 16(2), 2009, pp. 175–194, doi: 10.3233/SAV-2009-0460. † [email protected] 1
Transcript of Adaptive Landing Gear: optimum control strategy and...
Adaptive Landing Gear:
optimum control strategy
and potential for improvement∗
Grzegorz MikuÃlowski ÃLukasz Jankowski†
Smart-Tech CentreInstitute of Fundamental Technological Research
Swietokrzyska 21, 00-049 Warszawa, Poland
Abstract
An adaptive landing gear is a landing gear (LG) capable of active adaptation toparticular landing conditions by means of controlled hydraulic force. The objective ofthe adaptive control is to mitigate the peak force transferred to the aircraft structureduring touch-down, and thus to limit the structural fatigue factor. This paper inves-tigates the ultimate limits for improvement due to various strategies of active control.Five strategies are proposed and investigated numerically using a validated model ofa real, passive landing gear as a reference. Potential for improvement is estimated sta-tistically in terms of the mean and median (significant) peak strut forces as well as interms of the extended safe sinking velocity range. Three control strategies are verifiedexperimentally using a laboratory test stand.
Keywords: adaptive landing gear, adaptive impact absorption, shock absorber, loadmitigation
∗Shock and Vibration 16(2), 2009, pp. 175–194, doi: 10.3233/SAV-2009-0460.†[email protected]
1
1 Introduction
A typical, most often occurring landing scenario of an aircraft involves a relatively low sink-ing velocity of approx. 0.5 m/s. However, the maximum design velocity, as specified by theregulations, is usually much higher (seven to ten knots [1]) and consequently landing gears(LGs) should be designed to dissipate optimally both low-energy and high-energy landings.This is virtually impossible for a standard passive LG and thus it is optimized for the mostdangerous, highest-energy landing scenario only. Therefore, in a typical landing the standardLG operates unoptimized, although well below the maximum design peak force, which never-theless results in unnecessary high fatigue of the involved structures and shortening of theirservice life. The structural fatigue factor could be greatly reduced [2], if a LG was capableof adaptation to each particular landing scenario [3]. It would be then possible to optimallyreduce the peak strut force in the typical low-energy landing scenarios, but also preserve thecapability to dissipate rare, high-energy impacts. Such adaptive landing gear (ALG) was thegoal of the project ADLAND (Adaptive Landing Gears for Improved Impact Absorption [4]),funded within the EU 6th Framework Programme.
Intensive development of landing gears started in the United States in 1950s when oleo-pneumatic design became popular and widely employed. These shock absorbers were com-posed of a gas spring and two hydraulic chambers separated by an orifice, which provided theresistant reaction of the hydraulic fluid. This type of shock absorber was reported to havethe highest efficiency in relation to the weight [5]; however, its properties were not tunableto the wide demands of the touchdown operation. The strut reacting forces are awaited tovary in particular phases of the landing loading. Additionally, the same landing gear mustalso perform satisfactorily during taxi operations. Hydraulic orifices of constant geometriesresult in constant quadratic relation of the reaction to the velocity of the piston. It wassoon determined to be beneficial to allow the hydraulic reaction to be adjustable during theoperation of the strut. The first innovation to the oleo-pneumatic shock absorbers was themetering pin, which modulated the cross-section of the orifice in dependence on the positionof the piston [5]. Extensive research on the behavior of oleo-pneumatic landing gears was con-ducted in 1950s by NACA researchers with the objective of developing analytical modelingmethods and appropriate design tools. The studies were usually conducted numerically withlaboratory validation [6,7]. In parallel, the landing gears were investigated experimentally inflight tests [8]. One of the first methods to calculate the proper profile of the metering pinwas proposed in [9].
Development of supersonic airplanes in 1960s introduced a new class of problems. Theground-induced dynamic and vibration problems were magnified because of increased struc-tural flexibility of the slender bodies, thin-wing designs and higher takeoff and landing speeds.During investigations of particular designs, extremely high vibration levels of fuselages duringtakeoffs were reported [10]. The objectives of researches on landing gears were extended toinclude the effective mitigation of ground-induced vibrations. From the beginning of 1970s,an active landing gear began to be considered to be a possible solution to the vibrationproblems [11].
An active landing gear was defined as a shock strut with actively controlled dampingforce. The control amounted to increasing or decreasing the internal hydraulic pressure bymeans of an external reservoir of compressed medium. Initially, the researches were focusedon recognition of the character of the phenomenon, analytical modelling and assessing thefeasibility [2, 12]. The first results were promising but technological problems were reportedsince the estimated flow rates of the hydraulic fluid were predicted to be as high as 1000liters per minute [12]. At the beginning of 1980s the concept matured to a prototype systemdesigned in accordance with all aeronautical regulations [13,14], which was tested in impact
2

and roll-out operations [15,16]. The tests showed that the device is effective in reducing thedynamics effects but also a significant bending of the landing gear during the spin-up phaseof the touchdown was reported. In 1990s active landing gears were adapted for employmentin military aircrafts as reported in [17–19]. Actively controlled landing gears were analyzedfor military aviation also in Europe [20].
These widely studied active solutions have two important disadvantages. They are charac-terized by high energy consumption due to the necessity of delivering high pressures. More-over, a fail-safe active LG is hard to realize, since characteristics of the strut air springdepends on the instantaneous amount of the oil inside the strut and, in the case of a failure,the resulting passive landing gear may be not tuned for the actual impact landing scenario.In 1990s, a new less invasive solution became to be discussed [21, 22]: application of anadaptive, semi-active approach to landing gears. The hydraulic force was assumed to be con-trolled directly by alterations of characteristics of the main orifice of the strut. The significantadvantages of the new concept are lower energy consumption (no external compressed reser-voirs, no need to add hydraulic energy to the system) and better fail-safe properties. Theresearches were focused on optimum control development and analysis of possible actuationsystems [21, 23, 24]. After the year 2000, reports on experimental tests of non-flying modelsof adaptive landing gears become available [25, 26]. The reported solutions were based onquick electric servovalves controlling the flow of the hydraulic fluid between the chambers.
Other technical solutions were proposed within the ADLAND project [4], which pursuedan adaptive LG implemented using smart technologies: piezo-driven valves and magnetorhe-ological (MR) fluids. Both approaches require a dedicated active LG head only and preservethe time-tested general design of landing gears. Piezoelectric materials are characterizedby a very low power consumption, high actuation accuracy and short response time; theseadvantages make them perfectly suitable for a piezo-valve system for controlling the flow ofhydraulic fluid in a LG. Low power consumption, mechanical reliability and simplicity of thedesign were important advantages of the other solution, which was based on MR fluids: anMR-based LG head is free of complicated mechanical systems and quickly moving parts, asthe damping effect can be controlled directly by the magnetic flux density. In both cases,power-failure fail-safe characteristics can be easily designed by including a proper passiveposition of the piezo-valve or a system of magnets for the proper passive intensity of themagnetic field. The project ended in 2006 with flight test of the developed adaptive LG.Part of the design problems were presented in [27–29].
In the first stages of the ADLAND project a systematic comparison and evaluation ofdifferent control strategies was necessary, since available researches focused on a single chosencontrol scheme only and assumed full knowledge about the landing conditions [2, 23, 25, 26].This paper reports on the corresponding systematic investigation of the performance and theultimate limits for improvement of a standard LG due to five basic strategies of adaptivecontrol, ranging from passive to active, with and without the full information about thelanding mass. As a reference, a standard oleopneumatic one-stage cantilever-type [5, 30,31] passive nose LG of an I-23 light aircraft [32] is used, with no structural modificationsassumed besides the possibility of an instantaneous active control. Comparison of numericalsimulations with drop-tests of the reference LG confirms the accuracy of the model used forsimulations. Moreover, three of the five investigated strategies are verified experimentally ona laboratory-scale drop testing stand; details of the effective real-time feedback control usedin the active control schemes are reported in [27].
Optimum adaptation requires pre-touchdown recognition, at least partial, of the immi-nent landing scenario (mass, velocity, etc.) to trigger the adaptation in advance. This hasbeen studied and proven feasible in [33,34]. In numerical computations, the hydraulic force isassumed here to be controlled directly by the main orifice area, which in practical implemen-
3
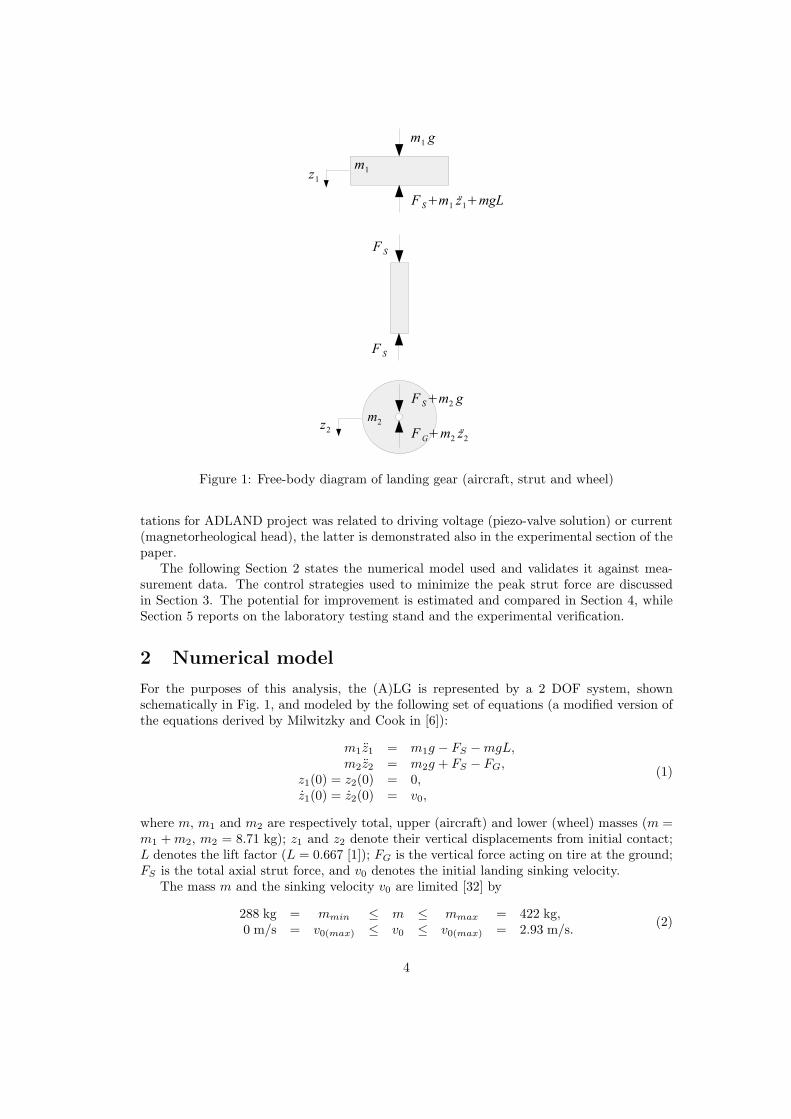
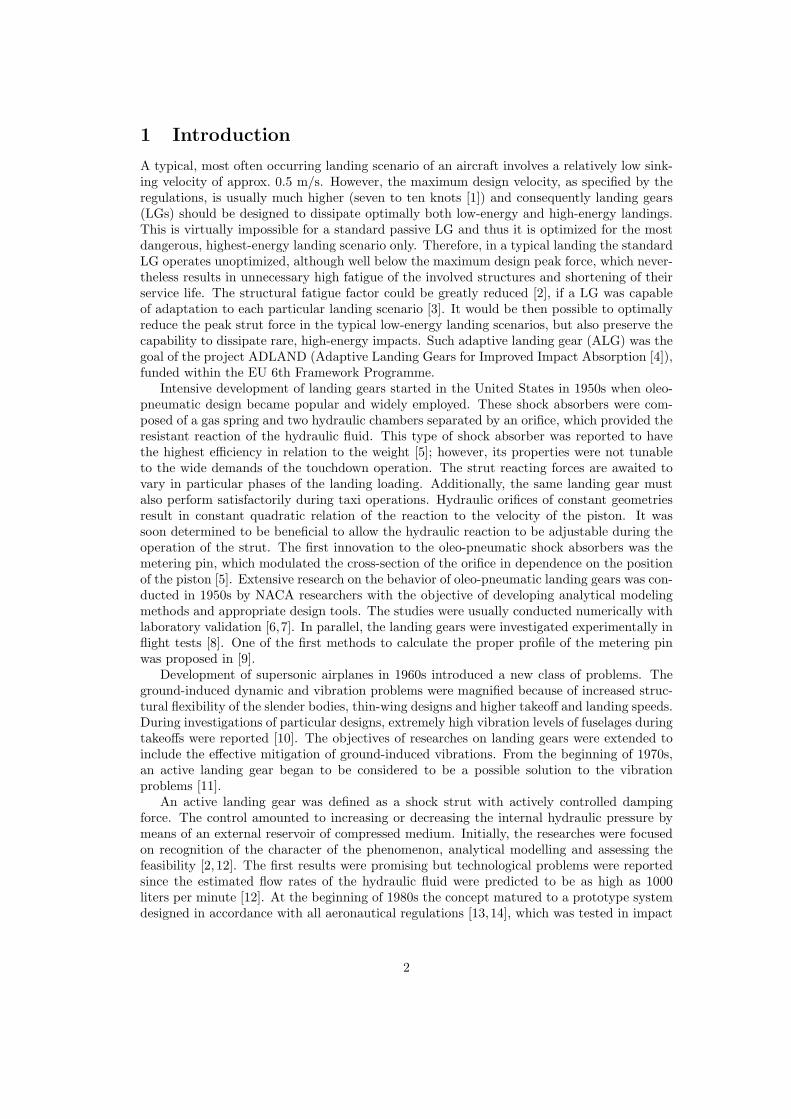
Figure 1: Free-body diagram of landing gear (aircraft, strut and wheel)
tations for ADLAND project was related to driving voltage (piezo-valve solution) or current(magnetorheological head), the latter is demonstrated also in the experimental section of thepaper.
The following Section 2 states the numerical model used and validates it against mea-surement data. The control strategies used to minimize the peak strut force are discussedin Section 3. The potential for improvement is estimated and compared in Section 4, whileSection 5 reports on the laboratory testing stand and the experimental verification.
2 Numerical model
For the purposes of this analysis, the (A)LG is represented by a 2 DOF system, shownschematically in Fig. 1, and modeled by the following set of equations (a modified version ofthe equations derived by Milwitzky and Cook in [6]):
m1z1 = m1g − FS −mgL,m2z2 = m2g + FS − FG,
z1(0) = z2(0) = 0,z1(0) = z2(0) = v0,
(1)
where m, m1 and m2 are respectively total, upper (aircraft) and lower (wheel) masses (m =m1 + m2, m2 = 8.71 kg); z1 and z2 denote their vertical displacements from initial contact;L denotes the lift factor (L = 0.667 [1]); FG is the vertical force acting on tire at the ground;FS is the total axial strut force, and v0 denotes the initial landing sinking velocity.
The mass m and the sinking velocity v0 are limited [32] by
288 kg = mmin ≤ m ≤ mmax = 422 kg,0 m/s = v0(max) ≤ v0 ≤ v0(max) = 2.93 m/s. (2)
4
0
5
10
15
20
25
0 10 20 30 40 50 60 70 80 90
tire
forc
e F
G [k
N]
tire deflection z2 [mm]
measuredfitted
Figure 2: Measured and fitted tire force–deflection characteristics (I-23 nose LG)
For the assumed detailed statistics of the landing mass m and the sinking velocity v0, seeSection 4.2. The mass m is the reduced mass (mass per landing gear) and is less than the totallanding mass of the aircraft. The upper bound of 422 kg corresponds to the maximum I-23design landing mass of 1117 kg and the lower bound of 288 kg was chosen to be proportionalto the mass of an empty aircraft with a pilot [32].
The dynamic tire force–deflection characteristics of the I-23 nose LG, denoted in Eq. (1)by FG, has been obtained by fitting experimental data measured in three dynamic tests (seeFig. 2). The least squares fit is a fourth-order polynomial:
FG(z2) ≈ (7.3 104 + 5.4 106z2 − 8.6 107z22 + 6.4 108z3
2)max(z2, 0),
where the last multiplier denotes symbolically that FG vanishes when the tire hovers abovethe ground.
The total axial strut force FS is modeled as a sum of four forces:
FS = Fa + Fh + Ff + Fd, (3)
which are respectively strut pneumatic, hydraulic and friction forces, denoted by Fa, Fh
and Ff , and the delimiting force Fd, which prevents excessive strut elongation. Notice thatintroduction of the actually occurring delimiting force Fd greatly simplifies modeling of thelanding process, as compared to the approach of Milwitzky and Cook [6], since the LG canbe uniformly modeled as a 2 DOF system throughout the whole landing, including its initialstage and — if necessary — rebounds. The total strut force and the component forces dependdirectly on the strut axial stroke s,
s = z1 − z2.
The pneumatic force Fa in Eq. (3) is modeled in accordance with the polytropic law forcompression of gases,
Fa(s) = p0Aa
(V0
V0 − sAa
)n
, (4)
while the hydraulic force Fh is modeled in the standard way [6] as
Fh(s) = sign(s)12
ρA3h
C2dA2
o
s2. (5)
5
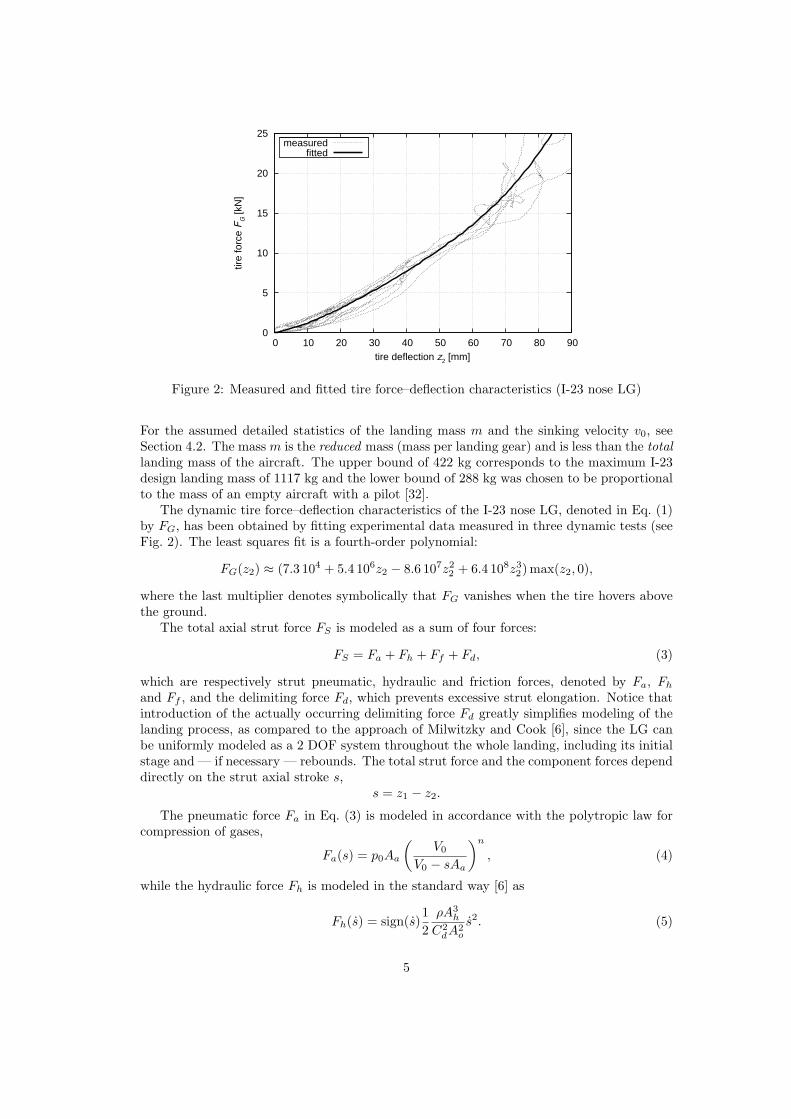
symbol numerical value explanationAa 1.385 10−3 m2 pneumatic areap0 1.028 MPa initial air pressure in the upper chamberV0 171 10−6 m3 initial air volume in the upper chambern 1.1 polytropic exponent for the air compression
processρ 872.6 kg/m3 density of hydraulic fluid (Aeroshell 41)Ah 1.018 10−3 m2 hydraulic areaAo Ao(min) ≤ Ao
Ao ≤ Ao(max)
cross-sectional area of the discharge orifice
Ao(min) 5 mm2 technological lower bound on Ao
Ao(max) 40 mm2 technological upper bound on Ao
Cd 0.6 orifice discharge coefficientCf 559 N dry friction coefficientld 500 10−6 m delimiting force acting interval
Table 1: Symbols used in Eq. (4) to Eq. (7) [6, 32,35]
The friction occurring in the strut is assumed to be dry friction only [6] and is modeled by
Ff (s) = Cf2π
arctan(104s), (6)
where the inverse tangent function was used to assure smooth variations of the friction forceat the turning points and to enable numerical integrations of the equations of motion. Thedelimiting force Fd prevents excessive elongation of the strut and attempts to model theactual force occurring on the strut delimiter. It acts within the last ld of the fully elongatedstrut and is modeled by a simple spring force as
Fd(s) = p0Aa min(
s− ldld
, 0)
, (7)
where the coefficient p0Aa has been chosen to obtain equilibrium at full elongation: Fd(0) +Fa(0) = 0. Possible oscillations of a fully elongated strut are damped directly by the hydraulicforce Fh.
The symbols used in Eq. (4) to Eq. (7) are explained in Table 1. The numerical valuesof p0, V0 and of the dry friction coefficient Cf have been obtained by numerical fitting ofLG quasi-static compression data. The trimming bounds on Ao, which is the controllingparameter, are chosen arbitrarily to model real technological constraints. Notice that thefollowing simplifying assumptions concerning the friction have been made:
• The dynamic friction equals the quasi-static friction.
• The strut friction is not considerably affected by the normal loading occurring due totire friction in the first milliseconds of the landing process at the wheel axle. This isan oversimplification in the case of a cantilever-type LG but can be legitimate in thecase of levered trailing arm gears.
Accuracy of the model can be partly verified by comparison of calculated forces anddisplacements with the forces and displacements measured in tests of a real I-23 nose LG,passive version. Institute of Aviation (Warsaw, Poland) has made available two sets ofmeasurement data suitable for the comparison:
6
0
5
10
15
20
25
0 50 100 150 200
tire
forc
e F
G [k
N]
time [ms]
measured case 1computed case 1measured case 2computed case 2
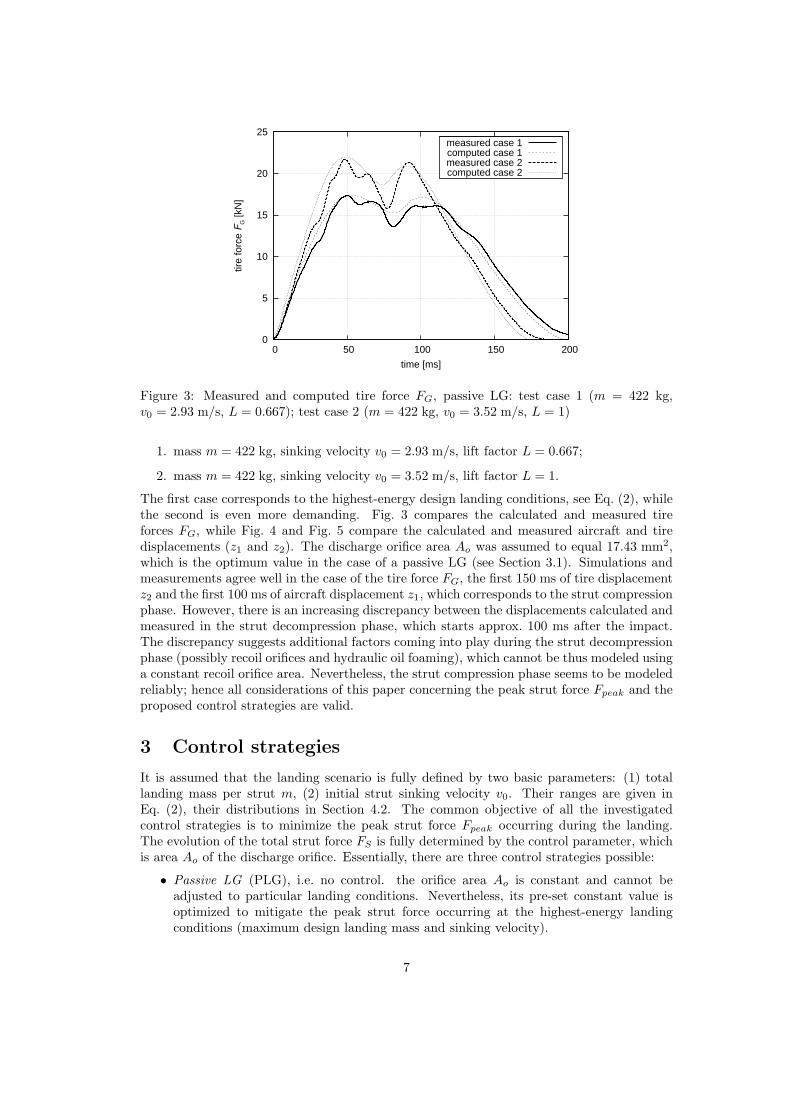
Figure 3: Measured and computed tire force FG, passive LG: test case 1 (m = 422 kg,v0 = 2.93 m/s, L = 0.667); test case 2 (m = 422 kg, v0 = 3.52 m/s, L = 1)
1. mass m = 422 kg, sinking velocity v0 = 2.93 m/s, lift factor L = 0.667;
2. mass m = 422 kg, sinking velocity v0 = 3.52 m/s, lift factor L = 1.
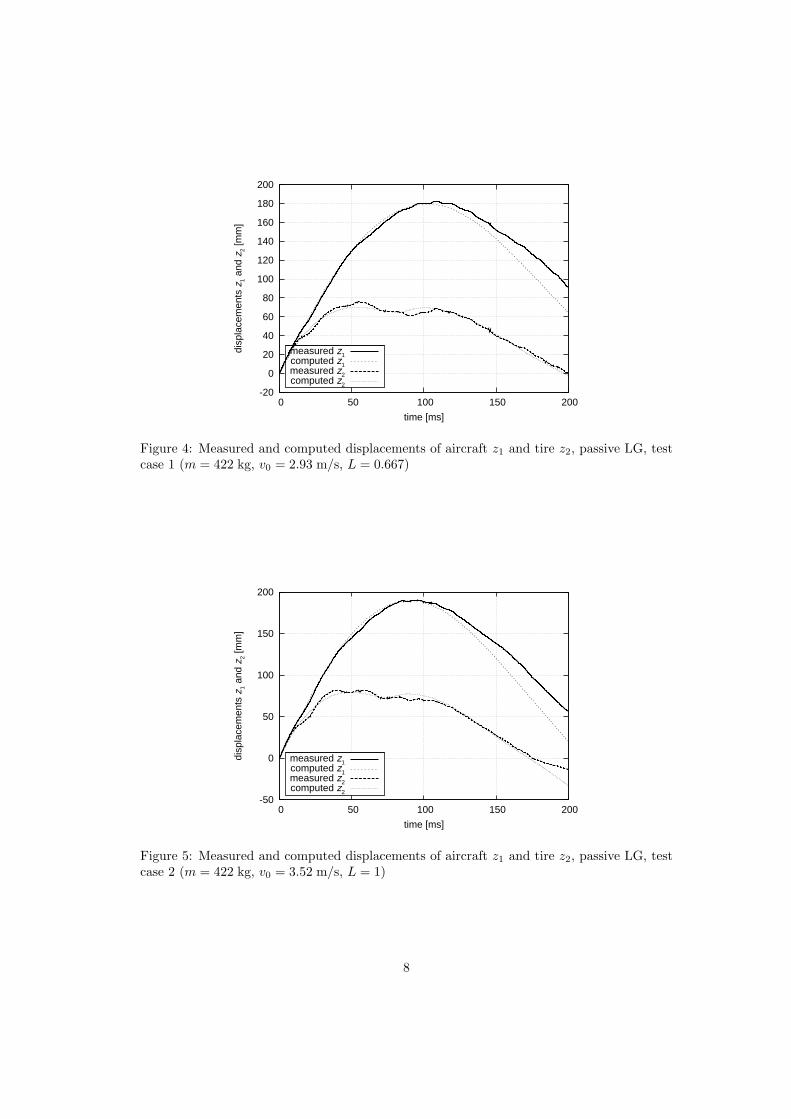
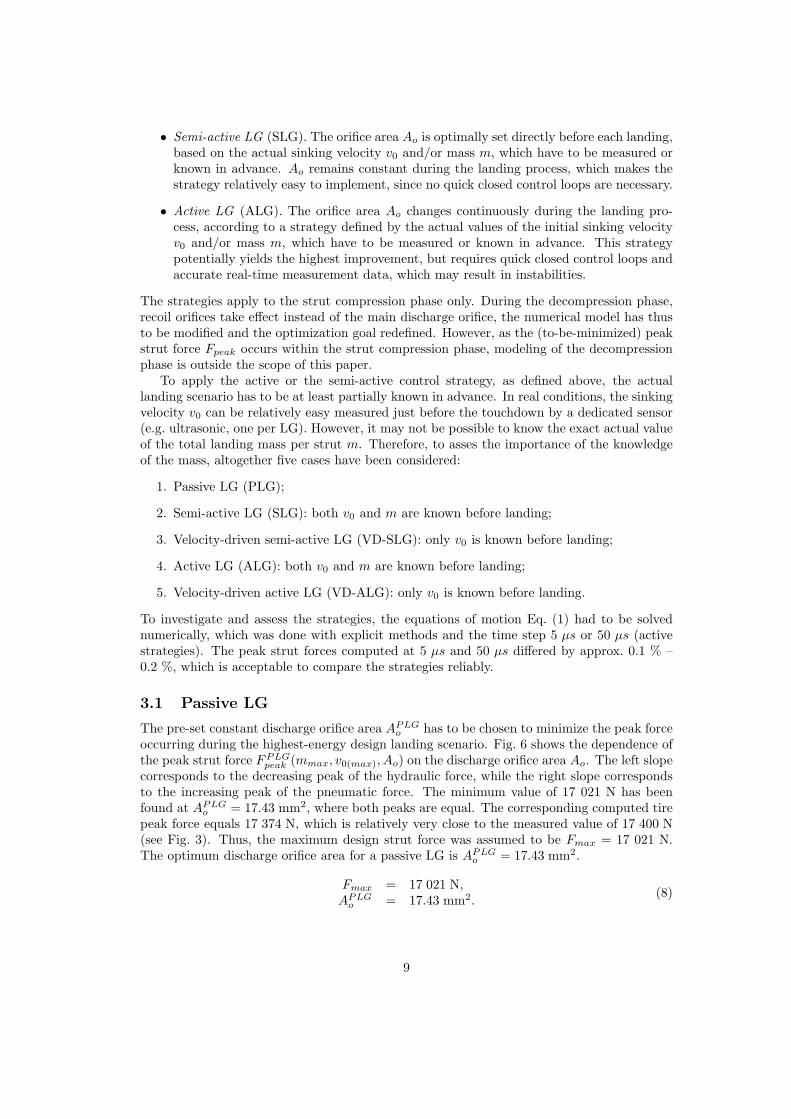
The first case corresponds to the highest-energy design landing conditions, see Eq. (2), whilethe second is even more demanding. Fig. 3 compares the calculated and measured tireforces FG, while Fig. 4 and Fig. 5 compare the calculated and measured aircraft and tiredisplacements (z1 and z2). The discharge orifice area Ao was assumed to equal 17.43 mm2,which is the optimum value in the case of a passive LG (see Section 3.1). Simulations andmeasurements agree well in the case of the tire force FG, the first 150 ms of tire displacementz2 and the first 100 ms of aircraft displacement z1, which corresponds to the strut compressionphase. However, there is an increasing discrepancy between the displacements calculated andmeasured in the strut decompression phase, which starts approx. 100 ms after the impact.The discrepancy suggests additional factors coming into play during the strut decompressionphase (possibly recoil orifices and hydraulic oil foaming), which cannot be thus modeled usinga constant recoil orifice area. Nevertheless, the strut compression phase seems to be modeledreliably; hence all considerations of this paper concerning the peak strut force Fpeak and theproposed control strategies are valid.
3 Control strategies
It is assumed that the landing scenario is fully defined by two basic parameters: (1) totallanding mass per strut m, (2) initial strut sinking velocity v0. Their ranges are given inEq. (2), their distributions in Section 4.2. The common objective of all the investigatedcontrol strategies is to minimize the peak strut force Fpeak occurring during the landing.The evolution of the total strut force FS is fully determined by the control parameter, whichis area Ao of the discharge orifice. Essentially, there are three control strategies possible:
• Passive LG (PLG), i.e. no control. the orifice area Ao is constant and cannot beadjusted to particular landing conditions. Nevertheless, its pre-set constant value isoptimized to mitigate the peak strut force occurring at the highest-energy landingconditions (maximum design landing mass and sinking velocity).
7
-20
0
20
40
60
80
100
120
140
160
180
200
0 50 100 150 200
disp
lace
men
ts z
1 an
d z
2 [m
m]
time [ms]
measured z1computed z1measured z2computed z2
Figure 4: Measured and computed displacements of aircraft z1 and tire z2, passive LG, testcase 1 (m = 422 kg, v0 = 2.93 m/s, L = 0.667)
-50
0
50
100
150
200
0 50 100 150 200
disp
lace
men
ts z
1 an
d z
2 [m
m]
time [ms]
measured z1computed z1measured z2computed z2
Figure 5: Measured and computed displacements of aircraft z1 and tire z2, passive LG, testcase 2 (m = 422 kg, v0 = 3.52 m/s, L = 1)
8
• Semi-active LG (SLG). The orifice area Ao is optimally set directly before each landing,based on the actual sinking velocity v0 and/or mass m, which have to be measured orknown in advance. Ao remains constant during the landing process, which makes thestrategy relatively easy to implement, since no quick closed control loops are necessary.
• Active LG (ALG). The orifice area Ao changes continuously during the landing pro-cess, according to a strategy defined by the actual values of the initial sinking velocityv0 and/or mass m, which have to be measured or known in advance. This strategypotentially yields the highest improvement, but requires quick closed control loops andaccurate real-time measurement data, which may result in instabilities.
The strategies apply to the strut compression phase only. During the decompression phase,recoil orifices take effect instead of the main discharge orifice, the numerical model has thusto be modified and the optimization goal redefined. However, as the (to-be-minimized) peakstrut force Fpeak occurs within the strut compression phase, modeling of the decompressionphase is outside the scope of this paper.
To apply the active or the semi-active control strategy, as defined above, the actuallanding scenario has to be at least partially known in advance. In real conditions, the sinkingvelocity v0 can be relatively easy measured just before the touchdown by a dedicated sensor(e.g. ultrasonic, one per LG). However, it may not be possible to know the exact actual valueof the total landing mass per strut m. Therefore, to asses the importance of the knowledgeof the mass, altogether five cases have been considered:
1. Passive LG (PLG);
2. Semi-active LG (SLG): both v0 and m are known before landing;
3. Velocity-driven semi-active LG (VD-SLG): only v0 is known before landing;
4. Active LG (ALG): both v0 and m are known before landing;
5. Velocity-driven active LG (VD-ALG): only v0 is known before landing.
To investigate and assess the strategies, the equations of motion Eq. (1) had to be solvednumerically, which was done with explicit methods and the time step 5 µs or 50 µs (activestrategies). The peak strut forces computed at 5 µs and 50 µs differed by approx. 0.1 % –0.2 %, which is acceptable to compare the strategies reliably.
3.1 Passive LG
The pre-set constant discharge orifice area APLGo has to be chosen to minimize the peak force
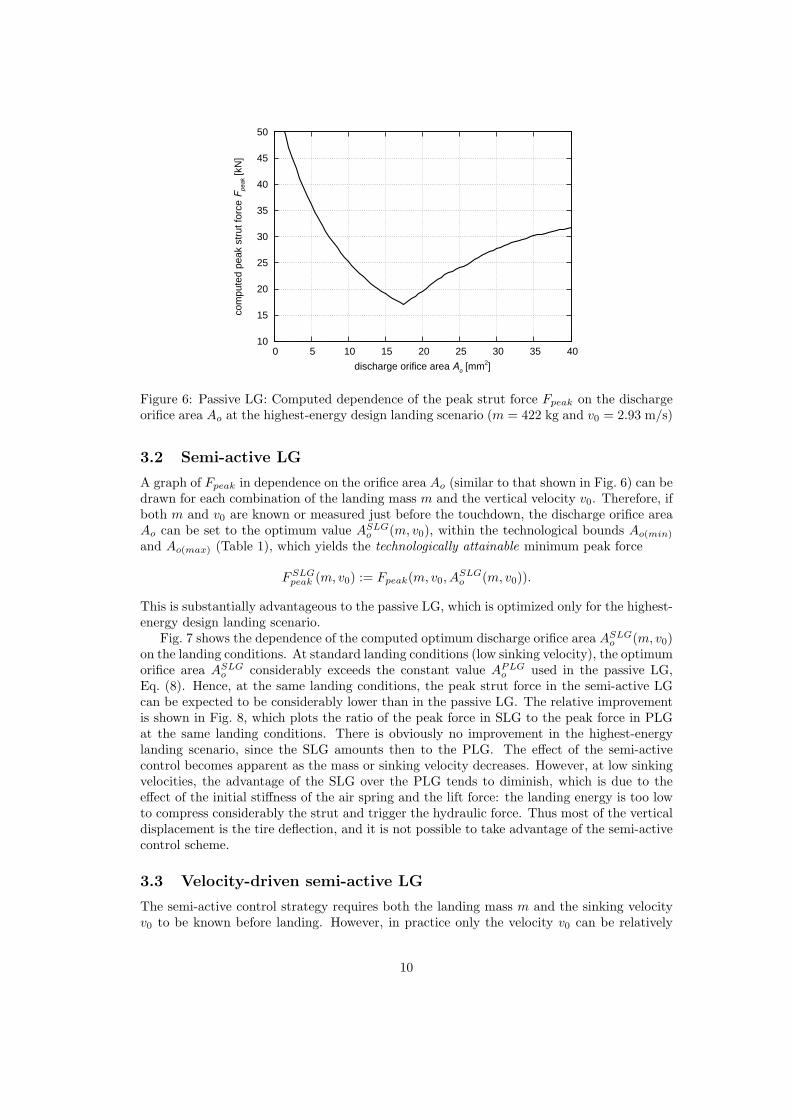
occurring during the highest-energy design landing scenario. Fig. 6 shows the dependence ofthe peak strut force FPLG
peak (mmax, v0(max), Ao) on the discharge orifice area Ao. The left slopecorresponds to the decreasing peak of the hydraulic force, while the right slope correspondsto the increasing peak of the pneumatic force. The minimum value of 17 021 N has beenfound at APLG
o = 17.43 mm2, where both peaks are equal. The corresponding computed tirepeak force equals 17 374 N, which is relatively very close to the measured value of 17 400 N(see Fig. 3). Thus, the maximum design strut force was assumed to be Fmax = 17 021 N.The optimum discharge orifice area for a passive LG is APLG
o = 17.43 mm2.
Fmax = 17 021 N,APLG
o = 17.43 mm2.(8)
9
10
15
20
25
30
35
40
45
50
0 5 10 15 20 25 30 35 40
com
pute
d pe
ak s
trut
forc
e F
peak [k
N]
discharge orifice area Ao [mm2]
Figure 6: Passive LG: Computed dependence of the peak strut force Fpeak on the dischargeorifice area Ao at the highest-energy design landing scenario (m = 422 kg and v0 = 2.93 m/s)
3.2 Semi-active LG
A graph of Fpeak in dependence on the orifice area Ao (similar to that shown in Fig. 6) can bedrawn for each combination of the landing mass m and the vertical velocity v0. Therefore, ifboth m and v0 are known or measured just before the touchdown, the discharge orifice areaAo can be set to the optimum value ASLG
o (m, v0), within the technological bounds Ao(min)
and Ao(max) (Table 1), which yields the technologically attainable minimum peak force
FSLGpeak (m, v0) := Fpeak(m, v0, A
SLGo (m, v0)).
This is substantially advantageous to the passive LG, which is optimized only for the highest-energy design landing scenario.
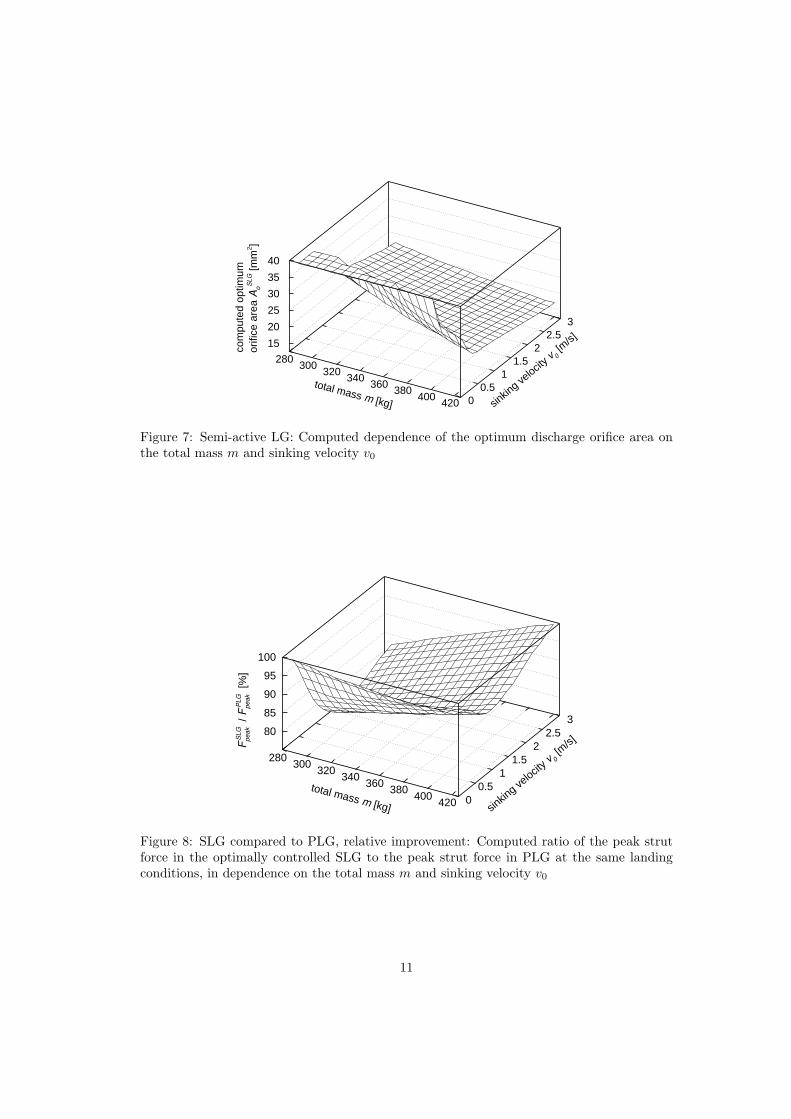
Fig. 7 shows the dependence of the computed optimum discharge orifice area ASLGo (m, v0)
on the landing conditions. At standard landing conditions (low sinking velocity), the optimumorifice area ASLG
o considerably exceeds the constant value APLGo used in the passive LG,
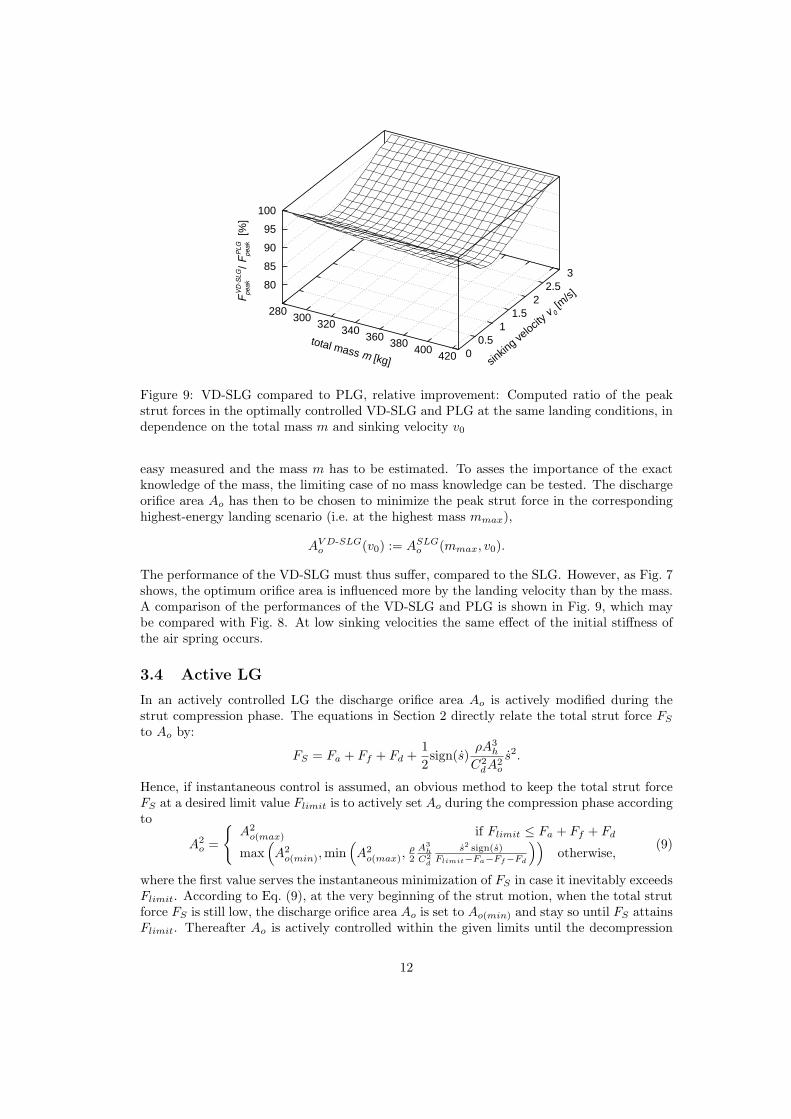
Eq. (8). Hence, at the same landing conditions, the peak strut force in the semi-active LGcan be expected to be considerably lower than in the passive LG. The relative improvementis shown in Fig. 8, which plots the ratio of the peak force in SLG to the peak force in PLGat the same landing conditions. There is obviously no improvement in the highest-energylanding scenario, since the SLG amounts then to the PLG. The effect of the semi-activecontrol becomes apparent as the mass or sinking velocity decreases. However, at low sinkingvelocities, the advantage of the SLG over the PLG tends to diminish, which is due to theeffect of the initial stiffness of the air spring and the lift force: the landing energy is too lowto compress considerably the strut and trigger the hydraulic force. Thus most of the verticaldisplacement is the tire deflection, and it is not possible to take advantage of the semi-activecontrol scheme.
3.3 Velocity-driven semi-active LG
The semi-active control strategy requires both the landing mass m and the sinking velocityv0 to be known before landing. However, in practice only the velocity v0 can be relatively
10
total mass m [kg] sinkin
g velocit
y v0 [m
/s]
com
pute
d op
timum
orifi
ce a
rea
Ao
SL
G [m
m2 ]
280 300
320 340
360 380
400 420 0
0.5 1
1.5 2
2.5 3
15
20
25
30
35
40
Figure 7: Semi-active LG: Computed dependence of the optimum discharge orifice area onthe total mass m and sinking velocity v0
total mass m [kg] sinkin
g velocit
y v0 [m
/s]FS
LG
peak /
Fpeak
PLG [
%]
280 300
320 340
360 380
400 420 0
0.5 1
1.5 2
2.5 3
80
85
90
95
100
Figure 8: SLG compared to PLG, relative improvement: Computed ratio of the peak strutforce in the optimally controlled SLG to the peak strut force in PLG at the same landingconditions, in dependence on the total mass m and sinking velocity v0
11
total mass m [kg] sinkin
g velocit
y v0 [m
/s]FV
D-S
LG
peak
/ F
peak
PLG [
%]
280 300
320 340
360 380
400 420 0
0.5 1
1.5 2
2.5 3
80
85
90
95
100
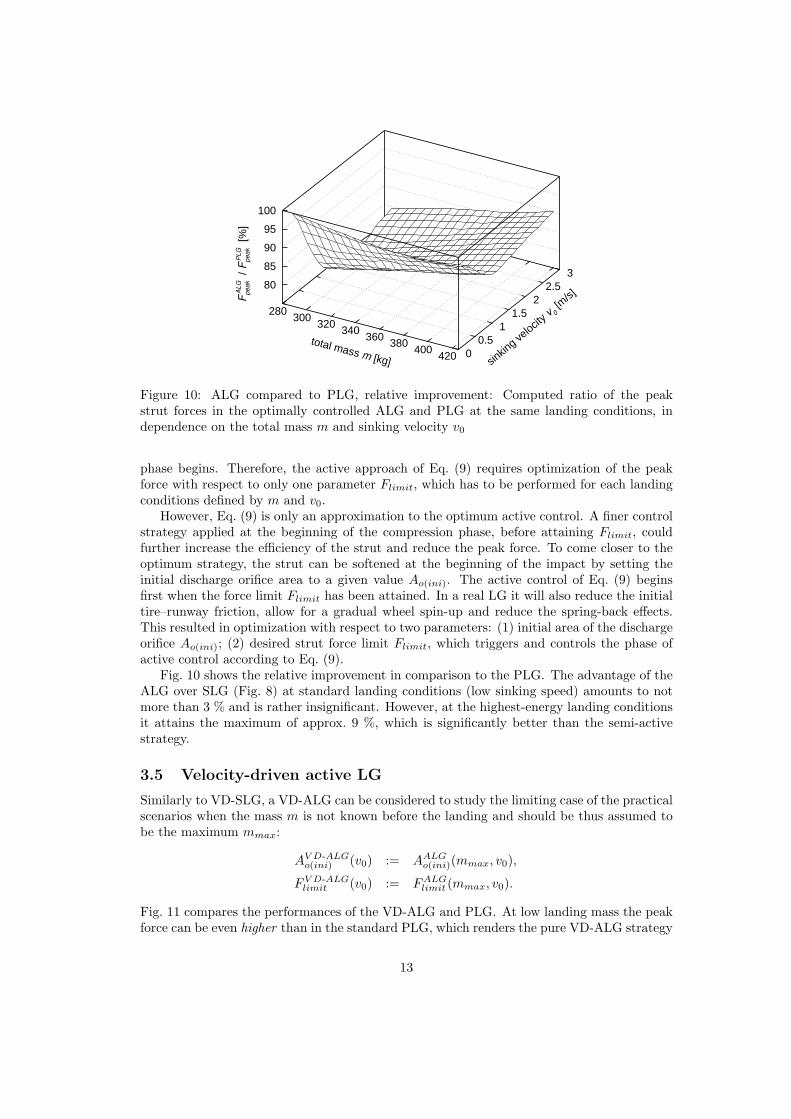
Figure 9: VD-SLG compared to PLG, relative improvement: Computed ratio of the peakstrut forces in the optimally controlled VD-SLG and PLG at the same landing conditions, independence on the total mass m and sinking velocity v0
easy measured and the mass m has to be estimated. To asses the importance of the exactknowledge of the mass, the limiting case of no mass knowledge can be tested. The dischargeorifice area Ao has then to be chosen to minimize the peak strut force in the correspondinghighest-energy landing scenario (i.e. at the highest mass mmax),
AV D-SLGo (v0) := ASLG
o (mmax, v0).
The performance of the VD-SLG must thus suffer, compared to the SLG. However, as Fig. 7shows, the optimum orifice area is influenced more by the landing velocity than by the mass.A comparison of the performances of the VD-SLG and PLG is shown in Fig. 9, which maybe compared with Fig. 8. At low sinking velocities the same effect of the initial stiffness ofthe air spring occurs.
3.4 Active LG
In an actively controlled LG the discharge orifice area Ao is actively modified during thestrut compression phase. The equations in Section 2 directly relate the total strut force FS
to Ao by:
FS = Fa + Ff + Fd +12sign(s)
ρA3h
C2dA2
o
s2.
Hence, if instantaneous control is assumed, an obvious method to keep the total strut forceFS at a desired limit value Flimit is to actively set Ao during the compression phase accordingto
A2o =
{A2
o(max) if Flimit ≤ Fa + Ff + Fd
max(A2
o(min),min(A2
o(max),ρ2
A3h
C2d
s2 sign(s)Flimit−Fa−Ff−Fd
))otherwise,
(9)
where the first value serves the instantaneous minimization of FS in case it inevitably exceedsFlimit. According to Eq. (9), at the very beginning of the strut motion, when the total strutforce FS is still low, the discharge orifice area Ao is set to Ao(min) and stay so until FS attainsFlimit. Thereafter Ao is actively controlled within the given limits until the decompression
12
total mass m [kg] sinkin
g velocit
y v0 [m
/s]FA
LG
peak /
Fpeak
PLG [
%]
280 300
320 340
360 380
400 420 0
0.5 1
1.5 2
2.5 3
80
85
90
95
100
Figure 10: ALG compared to PLG, relative improvement: Computed ratio of the peakstrut forces in the optimally controlled ALG and PLG at the same landing conditions, independence on the total mass m and sinking velocity v0
phase begins. Therefore, the active approach of Eq. (9) requires optimization of the peakforce with respect to only one parameter Flimit, which has to be performed for each landingconditions defined by m and v0.
However, Eq. (9) is only an approximation to the optimum active control. A finer controlstrategy applied at the beginning of the compression phase, before attaining Flimit, couldfurther increase the efficiency of the strut and reduce the peak force. To come closer to theoptimum strategy, the strut can be softened at the beginning of the impact by setting theinitial discharge orifice area to a given value Ao(ini). The active control of Eq. (9) beginsfirst when the force limit Flimit has been attained. In a real LG it will also reduce the initialtire–runway friction, allow for a gradual wheel spin-up and reduce the spring-back effects.This resulted in optimization with respect to two parameters: (1) initial area of the dischargeorifice Ao(ini); (2) desired strut force limit Flimit, which triggers and controls the phase ofactive control according to Eq. (9).
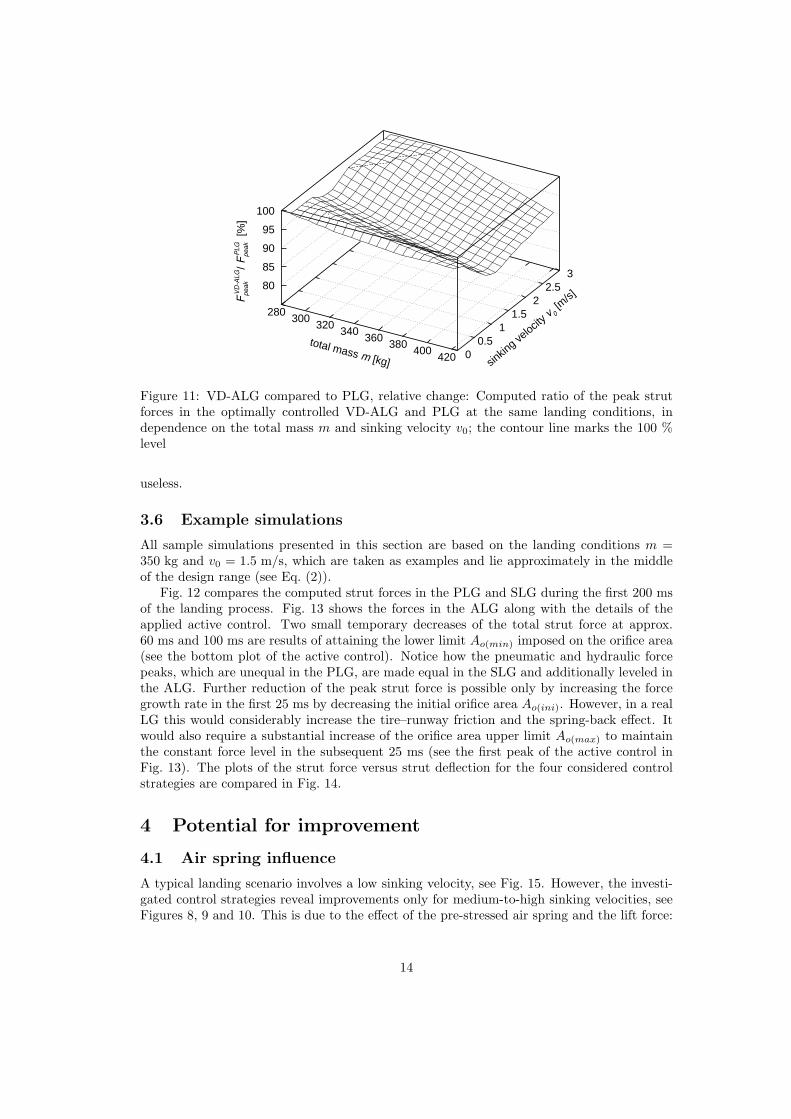
Fig. 10 shows the relative improvement in comparison to the PLG. The advantage of theALG over SLG (Fig. 8) at standard landing conditions (low sinking speed) amounts to notmore than 3 % and is rather insignificant. However, at the highest-energy landing conditionsit attains the maximum of approx. 9 %, which is significantly better than the semi-activestrategy.
3.5 Velocity-driven active LG
Similarly to VD-SLG, a VD-ALG can be considered to study the limiting case of the practicalscenarios when the mass m is not known before the landing and should be thus assumed tobe the maximum mmax:
AV D-ALGo(ini) (v0) := AALG
o(ini)(mmax, v0),
FV D-ALGlimit (v0) := FALG
limit (mmax, v0).
Fig. 11 compares the performances of the VD-ALG and PLG. At low landing mass the peakforce can be even higher than in the standard PLG, which renders the pure VD-ALG strategy
13
total mass m [kg] sinkin
g velocit
y v0 [m
/s]FV
D-A
LG
pe
ak
/ F
pe
ak
PL
G [
%]
280 300
320 340
360 380
400 420 0
0.5 1
1.5 2
2.5 3
80
85
90
95
100
Figure 11: VD-ALG compared to PLG, relative change: Computed ratio of the peak strutforces in the optimally controlled VD-ALG and PLG at the same landing conditions, independence on the total mass m and sinking velocity v0; the contour line marks the 100 %level
useless.
3.6 Example simulations
All sample simulations presented in this section are based on the landing conditions m =350 kg and v0 = 1.5 m/s, which are taken as examples and lie approximately in the middleof the design range (see Eq. (2)).
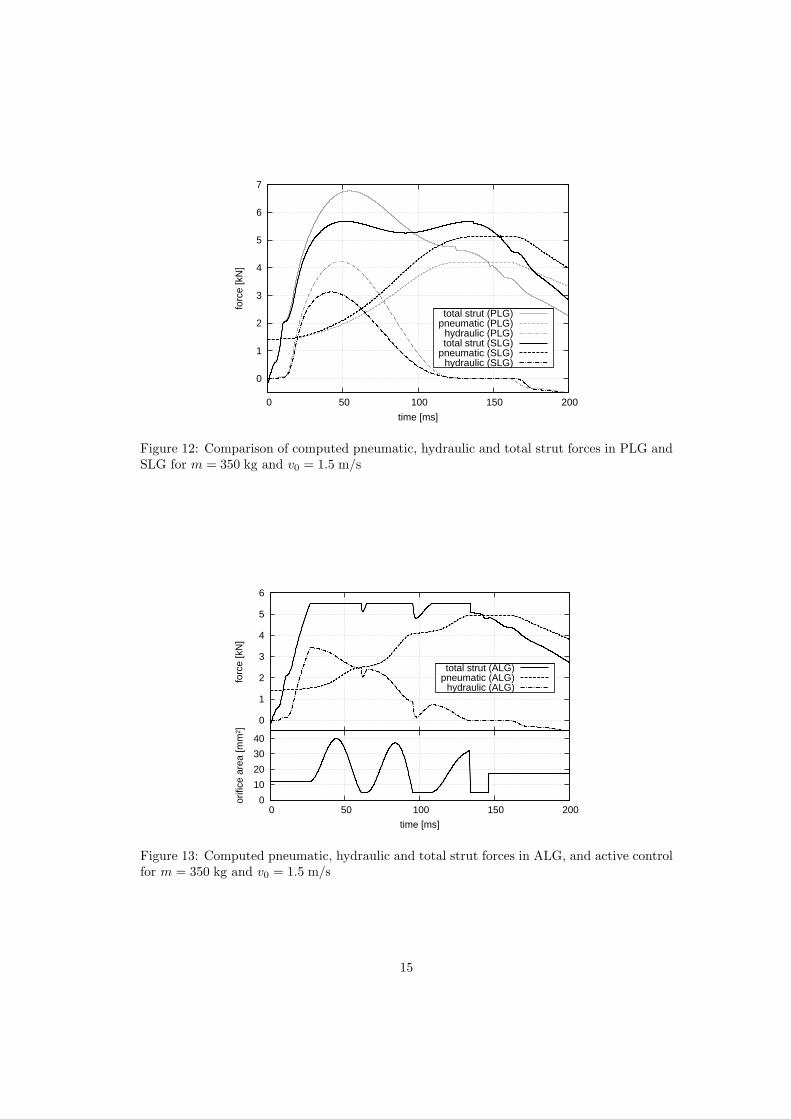
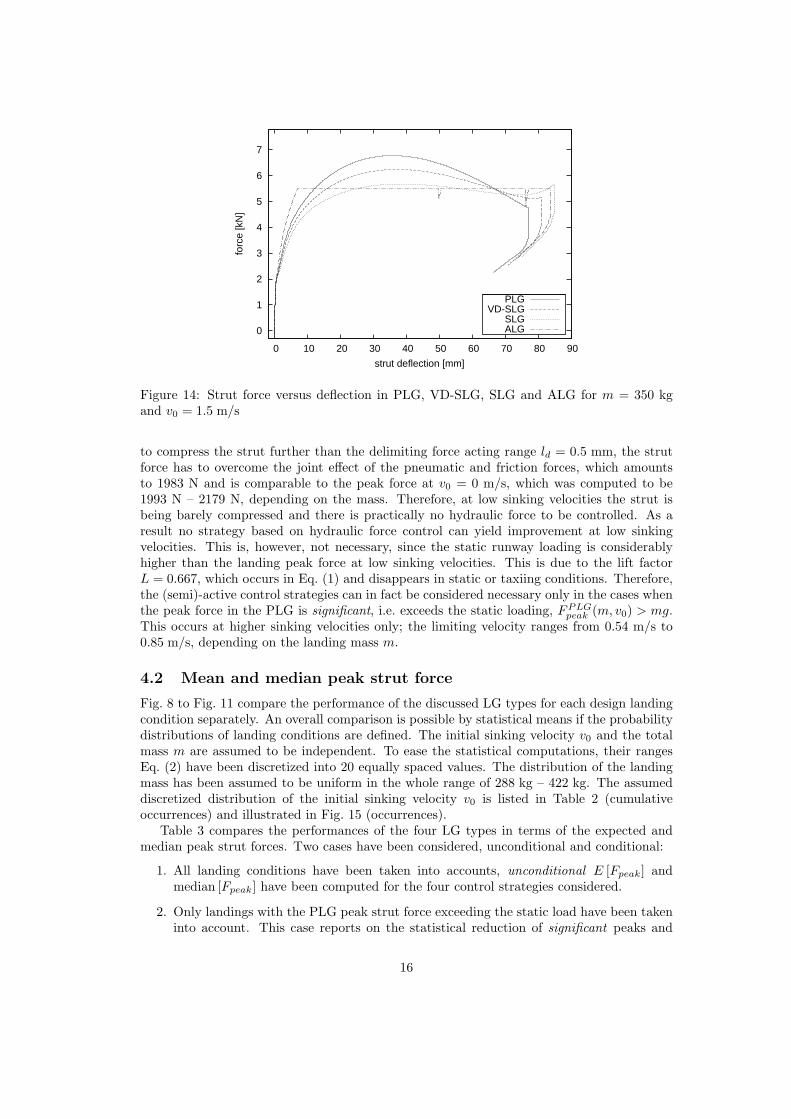
Fig. 12 compares the computed strut forces in the PLG and SLG during the first 200 msof the landing process. Fig. 13 shows the forces in the ALG along with the details of theapplied active control. Two small temporary decreases of the total strut force at approx.60 ms and 100 ms are results of attaining the lower limit Ao(min) imposed on the orifice area(see the bottom plot of the active control). Notice how the pneumatic and hydraulic forcepeaks, which are unequal in the PLG, are made equal in the SLG and additionally leveled inthe ALG. Further reduction of the peak strut force is possible only by increasing the forcegrowth rate in the first 25 ms by decreasing the initial orifice area Ao(ini). However, in a realLG this would considerably increase the tire–runway friction and the spring-back effect. Itwould also require a substantial increase of the orifice area upper limit Ao(max) to maintainthe constant force level in the subsequent 25 ms (see the first peak of the active control inFig. 13). The plots of the strut force versus strut deflection for the four considered controlstrategies are compared in Fig. 14.
4 Potential for improvement
4.1 Air spring influence
A typical landing scenario involves a low sinking velocity, see Fig. 15. However, the investi-gated control strategies reveal improvements only for medium-to-high sinking velocities, seeFigures 8, 9 and 10. This is due to the effect of the pre-stressed air spring and the lift force:
14
0
1
2
3
4
5
6
7
0 50 100 150 200
forc
e [k
N]
time [ms]
total strut (PLG)pneumatic (PLG)
hydraulic (PLG)total strut (SLG)
pneumatic (SLG)hydraulic (SLG)
Figure 12: Comparison of computed pneumatic, hydraulic and total strut forces in PLG andSLG for m = 350 kg and v0 = 1.5 m/s
0
10
20
30
40
0 50 100 150 200
orifi
ce a
rea
[mm
2 ]
time [ms]
0
1
2
3
4
5
6
forc
e [k
N]
total strut (ALG)pneumatic (ALG)
hydraulic (ALG)
Figure 13: Computed pneumatic, hydraulic and total strut forces in ALG, and active controlfor m = 350 kg and v0 = 1.5 m/s
15
0
1
2
3
4
5
6
7
0 10 20 30 40 50 60 70 80 90
forc
e [k
N]
strut deflection [mm]
PLGVD-SLG
SLGALG
Figure 14: Strut force versus deflection in PLG, VD-SLG, SLG and ALG for m = 350 kgand v0 = 1.5 m/s
to compress the strut further than the delimiting force acting range ld = 0.5 mm, the strutforce has to overcome the joint effect of the pneumatic and friction forces, which amountsto 1983 N and is comparable to the peak force at v0 = 0 m/s, which was computed to be1993 N – 2179 N, depending on the mass. Therefore, at low sinking velocities the strut isbeing barely compressed and there is practically no hydraulic force to be controlled. As aresult no strategy based on hydraulic force control can yield improvement at low sinkingvelocities. This is, however, not necessary, since the static runway loading is considerablyhigher than the landing peak force at low sinking velocities. This is due to the lift factorL = 0.667, which occurs in Eq. (1) and disappears in static or taxiing conditions. Therefore,the (semi)-active control strategies can in fact be considered necessary only in the cases whenthe peak force in the PLG is significant, i.e. exceeds the static loading, FPLG
peak (m, v0) > mg.This occurs at higher sinking velocities only; the limiting velocity ranges from 0.54 m/s to0.85 m/s, depending on the landing mass m.
4.2 Mean and median peak strut force
Fig. 8 to Fig. 11 compare the performance of the discussed LG types for each design landingcondition separately. An overall comparison is possible by statistical means if the probabilitydistributions of landing conditions are defined. The initial sinking velocity v0 and the totalmass m are assumed to be independent. To ease the statistical computations, their rangesEq. (2) have been discretized into 20 equally spaced values. The distribution of the landingmass has been assumed to be uniform in the whole range of 288 kg – 422 kg. The assumeddiscretized distribution of the initial sinking velocity v0 is listed in Table 2 (cumulativeoccurrences) and illustrated in Fig. 15 (occurrences).
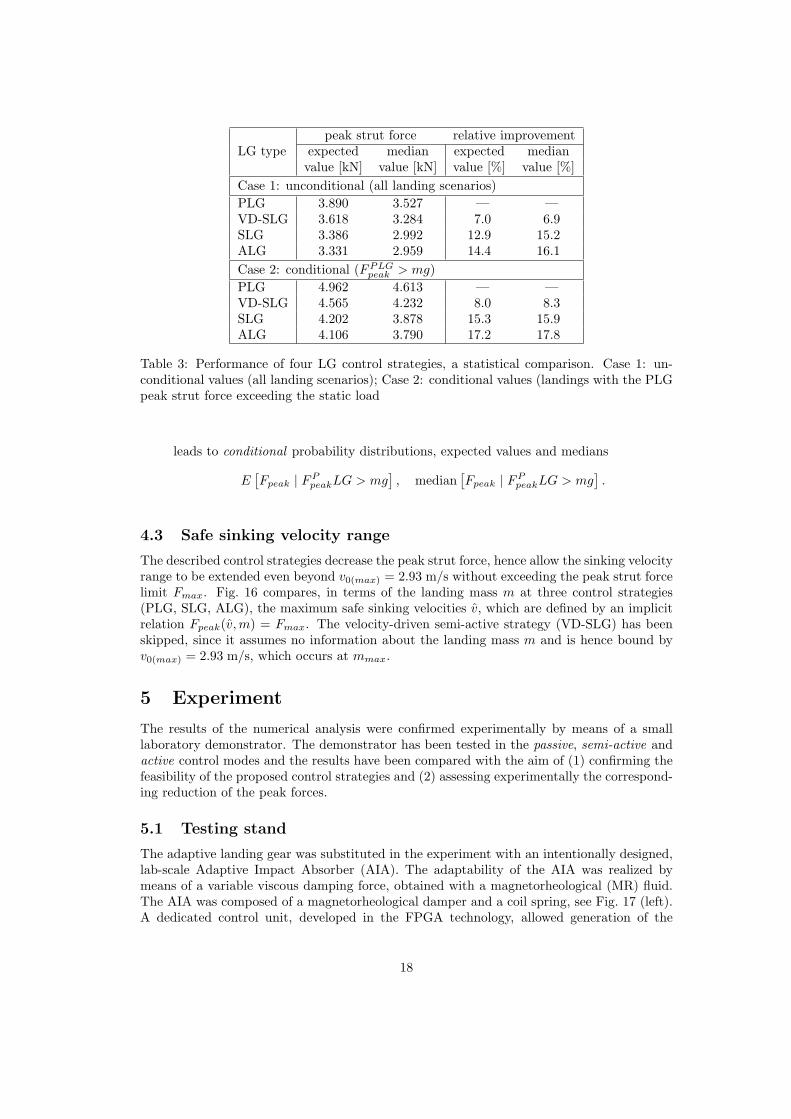
Table 3 compares the performances of the four LG types in terms of the expected andmedian peak strut forces. Two cases have been considered, unconditional and conditional:
1. All landing conditions have been taken into accounts, unconditional E [Fpeak] andmedian [Fpeak] have been computed for the four control strategies considered.
2. Only landings with the PLG peak strut force exceeding the static load have been takeninto account. This case reports on the statistical reduction of significant peaks and
16
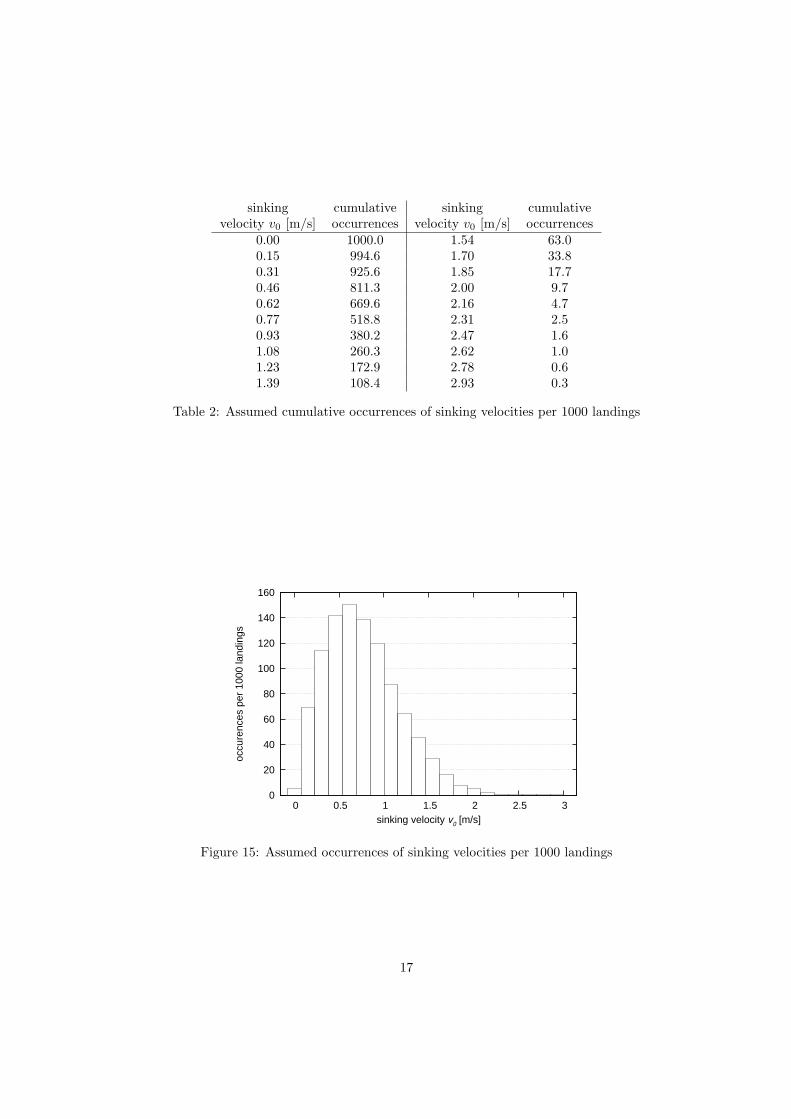
sinking cumulative sinking cumulativevelocity v0 [m/s] occurrences velocity v0 [m/s] occurrences
0.00 1000.0 1.54 63.00.15 994.6 1.70 33.80.31 925.6 1.85 17.70.46 811.3 2.00 9.70.62 669.6 2.16 4.70.77 518.8 2.31 2.50.93 380.2 2.47 1.61.08 260.3 2.62 1.01.23 172.9 2.78 0.61.39 108.4 2.93 0.3
Table 2: Assumed cumulative occurrences of sinking velocities per 1000 landings
0
20
40
60
80
100
120
140
160
0 0.5 1 1.5 2 2.5 3
occu
renc
es p
er 1
000
land
ings
sinking velocity v0 [m/s]
Figure 15: Assumed occurrences of sinking velocities per 1000 landings
17
peak strut force relative improvementLG type expected median expected median
value [kN] value [kN] value [%] value [%]Case 1: unconditional (all landing scenarios)PLG 3.890 3.527 — —VD-SLG 3.618 3.284 7.0 6.9SLG 3.386 2.992 12.9 15.2ALG 3.331 2.959 14.4 16.1Case 2: conditional (FPLG
peak > mg)PLG 4.962 4.613 — —VD-SLG 4.565 4.232 8.0 8.3SLG 4.202 3.878 15.3 15.9ALG 4.106 3.790 17.2 17.8
Table 3: Performance of four LG control strategies, a statistical comparison. Case 1: un-conditional values (all landing scenarios); Case 2: conditional values (landings with the PLGpeak strut force exceeding the static load
leads to conditional probability distributions, expected values and medians
E[Fpeak | FP
peakLG > mg], median
[Fpeak | FP
peakLG > mg].
4.3 Safe sinking velocity range
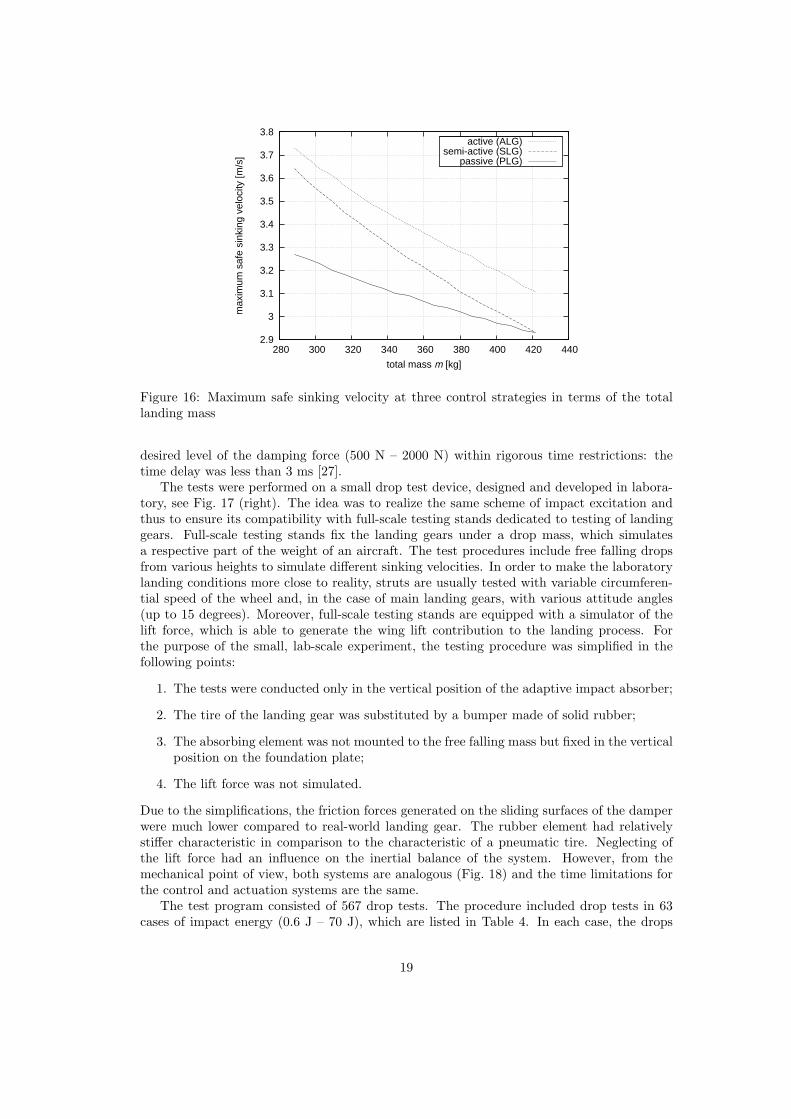
The described control strategies decrease the peak strut force, hence allow the sinking velocityrange to be extended even beyond v0(max) = 2.93 m/s without exceeding the peak strut forcelimit Fmax. Fig. 16 compares, in terms of the landing mass m at three control strategies(PLG, SLG, ALG), the maximum safe sinking velocities v, which are defined by an implicitrelation Fpeak(v, m) = Fmax. The velocity-driven semi-active strategy (VD-SLG) has beenskipped, since it assumes no information about the landing mass m and is hence bound byv0(max) = 2.93 m/s, which occurs at mmax.
5 Experiment
The results of the numerical analysis were confirmed experimentally by means of a smalllaboratory demonstrator. The demonstrator has been tested in the passive, semi-active andactive control modes and the results have been compared with the aim of (1) confirming thefeasibility of the proposed control strategies and (2) assessing experimentally the correspond-ing reduction of the peak forces.
5.1 Testing stand
The adaptive landing gear was substituted in the experiment with an intentionally designed,lab-scale Adaptive Impact Absorber (AIA). The adaptability of the AIA was realized bymeans of a variable viscous damping force, obtained with a magnetorheological (MR) fluid.The AIA was composed of a magnetorheological damper and a coil spring, see Fig. 17 (left).A dedicated control unit, developed in the FPGA technology, allowed generation of the
18
2.9
3
3.1
3.2
3.3
3.4
3.5
3.6
3.7
3.8
280 300 320 340 360 380 400 420 440
max
imum
saf
e si
nkin
g ve
loci
ty [m
/s]
total mass m [kg]
passive (PLG)semi-active (SLG)
active (ALG)
Figure 16: Maximum safe sinking velocity at three control strategies in terms of the totallanding mass
desired level of the damping force (500 N – 2000 N) within rigorous time restrictions: thetime delay was less than 3 ms [27].
The tests were performed on a small drop test device, designed and developed in labora-tory, see Fig. 17 (right). The idea was to realize the same scheme of impact excitation andthus to ensure its compatibility with full-scale testing stands dedicated to testing of landinggears. Full-scale testing stands fix the landing gears under a drop mass, which simulatesa respective part of the weight of an aircraft. The test procedures include free falling dropsfrom various heights to simulate different sinking velocities. In order to make the laboratorylanding conditions more close to reality, struts are usually tested with variable circumferen-tial speed of the wheel and, in the case of main landing gears, with various attitude angles(up to 15 degrees). Moreover, full-scale testing stands are equipped with a simulator of thelift force, which is able to generate the wing lift contribution to the landing process. Forthe purpose of the small, lab-scale experiment, the testing procedure was simplified in thefollowing points:
1. The tests were conducted only in the vertical position of the adaptive impact absorber;
2. The tire of the landing gear was substituted by a bumper made of solid rubber;
3. The absorbing element was not mounted to the free falling mass but fixed in the verticalposition on the foundation plate;
4. The lift force was not simulated.
Due to the simplifications, the friction forces generated on the sliding surfaces of the damperwere much lower compared to real-world landing gear. The rubber element had relativelystiffer characteristic in comparison to the characteristic of a pneumatic tire. Neglecting ofthe lift force had an influence on the inertial balance of the system. However, from themechanical point of view, both systems are analogous (Fig. 18) and the time limitations forthe control and actuation systems are the same.
The test program consisted of 567 drop tests. The procedure included drop tests in 63cases of impact energy (0.6 J – 70 J), which are listed in Table 4. In each case, the drops
19
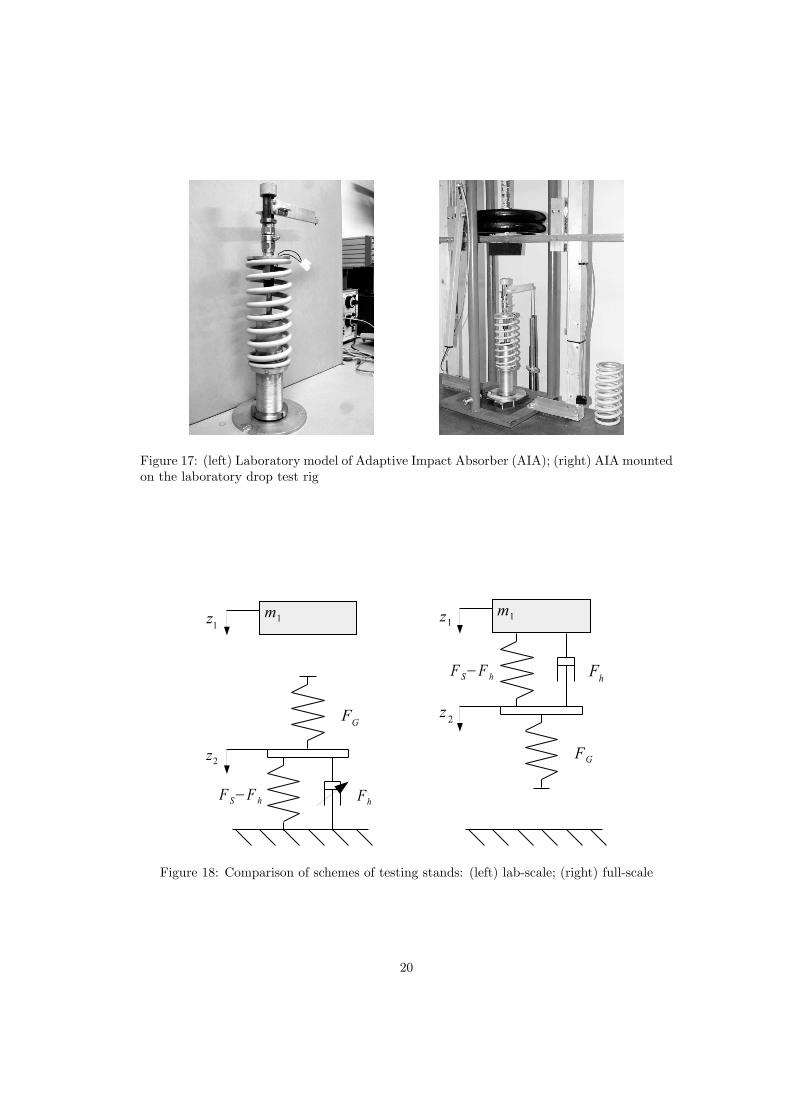
Figure 17: (left) Laboratory model of Adaptive Impact Absorber (AIA); (right) AIA mountedon the laboratory drop test rig
Figure 18: Comparison of schemes of testing stands: (left) lab-scale; (right) full-scale
20
kinetic sinking velocity [m/s]energy [J] 1.46 1.30 1.10 1.00 0.95 0.85 0.79 0.58 0.40
67 71.41 56.62 40.54 33.50 30.23 24.20 20.91 11.27 5.3657 60.75 48.17 34.49 28.50 25.72 20.59 17.79 9.59 4.56
mass 47 50.09 39.72 28.44 23.50 21.21 16.98 14.67 7.91 3.76[kg] 37 39.43 31.27 22.39 18.50 16.70 13.37 11.55 6.22 2.96
27 28.78 22.82 16.34 13.50 12.18 9.75 8.43 4.54 2.1617 18.12 14.37 10.29 8.50 7.67 6.14 5.30 2.86 1.367 7.46 5.92 4.24 3.50 3.16 2.53 2.18 1.18 0.56
Table 4: Kinetic energies used in tests
were conducted for three tested modes of operation and repeated three times to guaranteethe proper repeatability.
5.2 Control strategies
To test the passive control strategy, the AIA was assumed to behave as a conventional,passive landing gear, and optimized to operate properly under the maximum consideredimpact energy. A constant level of the control signal was determined, which allowed thepeak dynamic force to be minimized without reaching the full piston stroke. Further on, thetests were conducted for the full range of the impact energies with the determined level ofthe damping characteristics. The peak dynamic force was measured and stored to serve asa reference for assessment of the effectiveness of the proposed adaptive control strategies.
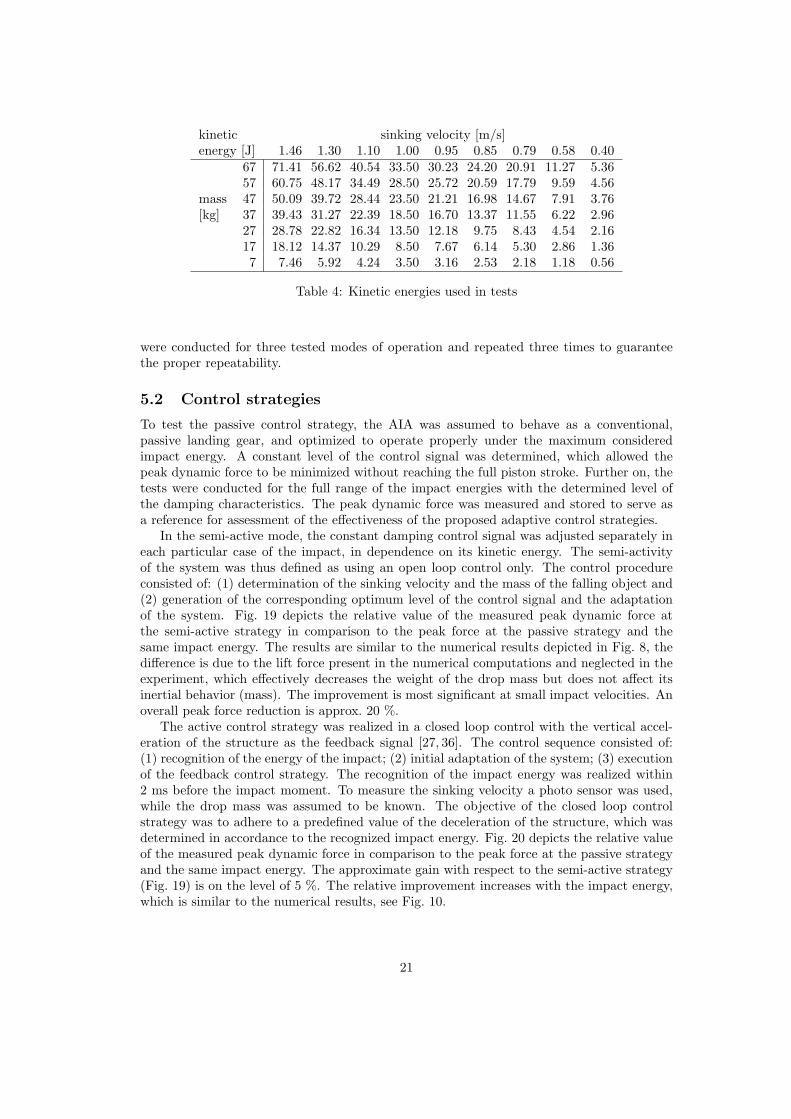
In the semi-active mode, the constant damping control signal was adjusted separately ineach particular case of the impact, in dependence on its kinetic energy. The semi-activityof the system was thus defined as using an open loop control only. The control procedureconsisted of: (1) determination of the sinking velocity and the mass of the falling object and(2) generation of the corresponding optimum level of the control signal and the adaptationof the system. Fig. 19 depicts the relative value of the measured peak dynamic force atthe semi-active strategy in comparison to the peak force at the passive strategy and thesame impact energy. The results are similar to the numerical results depicted in Fig. 8, thedifference is due to the lift force present in the numerical computations and neglected in theexperiment, which effectively decreases the weight of the drop mass but does not affect itsinertial behavior (mass). The improvement is most significant at small impact velocities. Anoverall peak force reduction is approx. 20 %.
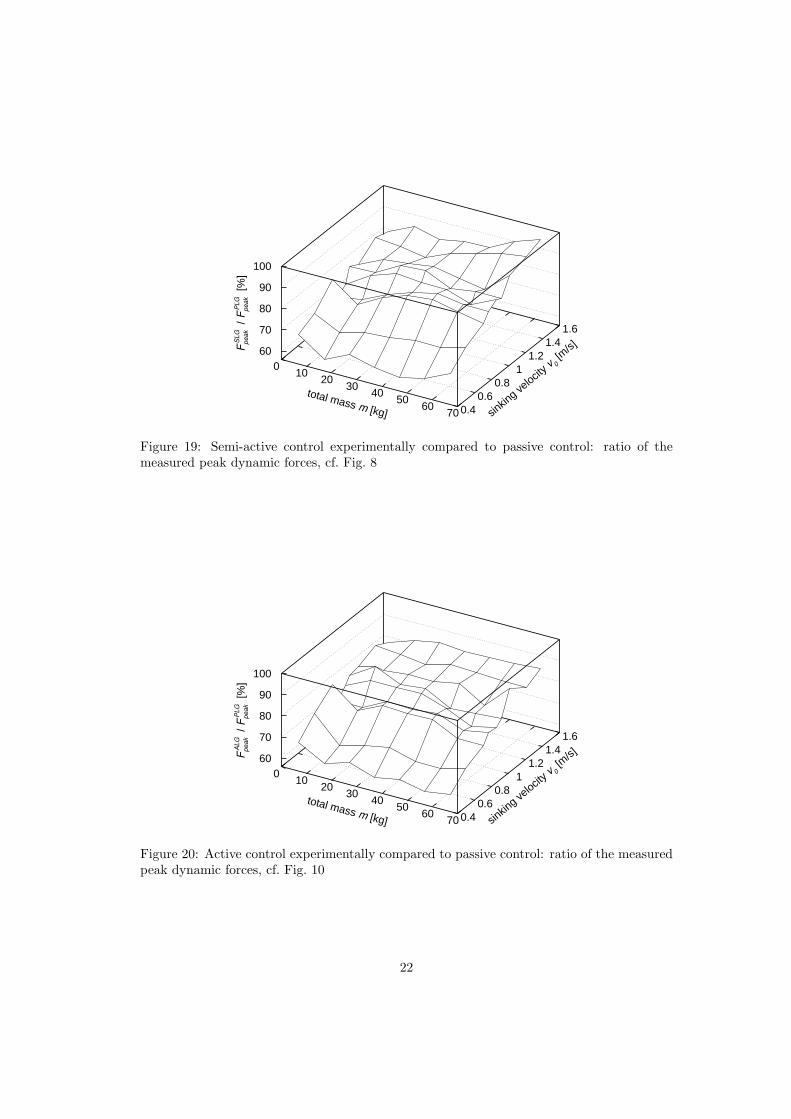
The active control strategy was realized in a closed loop control with the vertical accel-eration of the structure as the feedback signal [27, 36]. The control sequence consisted of:(1) recognition of the energy of the impact; (2) initial adaptation of the system; (3) executionof the feedback control strategy. The recognition of the impact energy was realized within2 ms before the impact moment. To measure the sinking velocity a photo sensor was used,while the drop mass was assumed to be known. The objective of the closed loop controlstrategy was to adhere to a predefined value of the deceleration of the structure, which wasdetermined in accordance to the recognized impact energy. Fig. 20 depicts the relative valueof the measured peak dynamic force in comparison to the peak force at the passive strategyand the same impact energy. The approximate gain with respect to the semi-active strategy(Fig. 19) is on the level of 5 %. The relative improvement increases with the impact energy,which is similar to the numerical results, see Fig. 10.
21
total mass m [kg] sinkin
g velocit
y v0 [m
/s]FS
LG
pea
k /
Fp
ea
k
PLG [
%]
0 10
20 30
40 50
60 70 0.4
0.6 0.8
1 1.2
1.4 1.6
60
70
80
90
100
Figure 19: Semi-active control experimentally compared to passive control: ratio of themeasured peak dynamic forces, cf. Fig. 8
total mass m [kg] sinkin
g velocit
y v0 [m
/s]FA
LG
pe
ak /
Fp
ea
k
PL
G [
%]
0 10
20 30
40 50
60 70 0.4
0.6 0.8
1 1.2
1.4 1.6
60
70
80
90
100
Figure 20: Active control experimentally compared to passive control: ratio of the measuredpeak dynamic forces, cf. Fig. 10
22
0.0
0.2
0.4
0.6
0.8
1.0
0 5 10 15 20 25
forc
e [k
N]
strut deflection [mm]
passivesemi-active
active
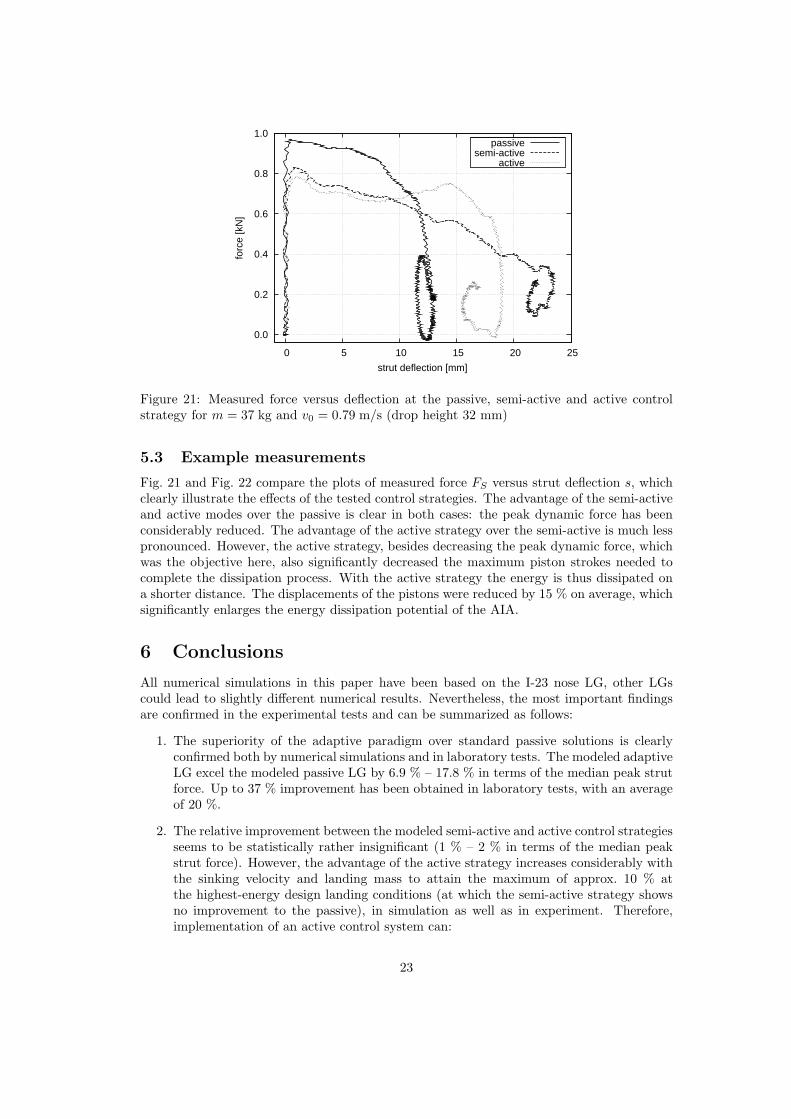
Figure 21: Measured force versus deflection at the passive, semi-active and active controlstrategy for m = 37 kg and v0 = 0.79 m/s (drop height 32 mm)
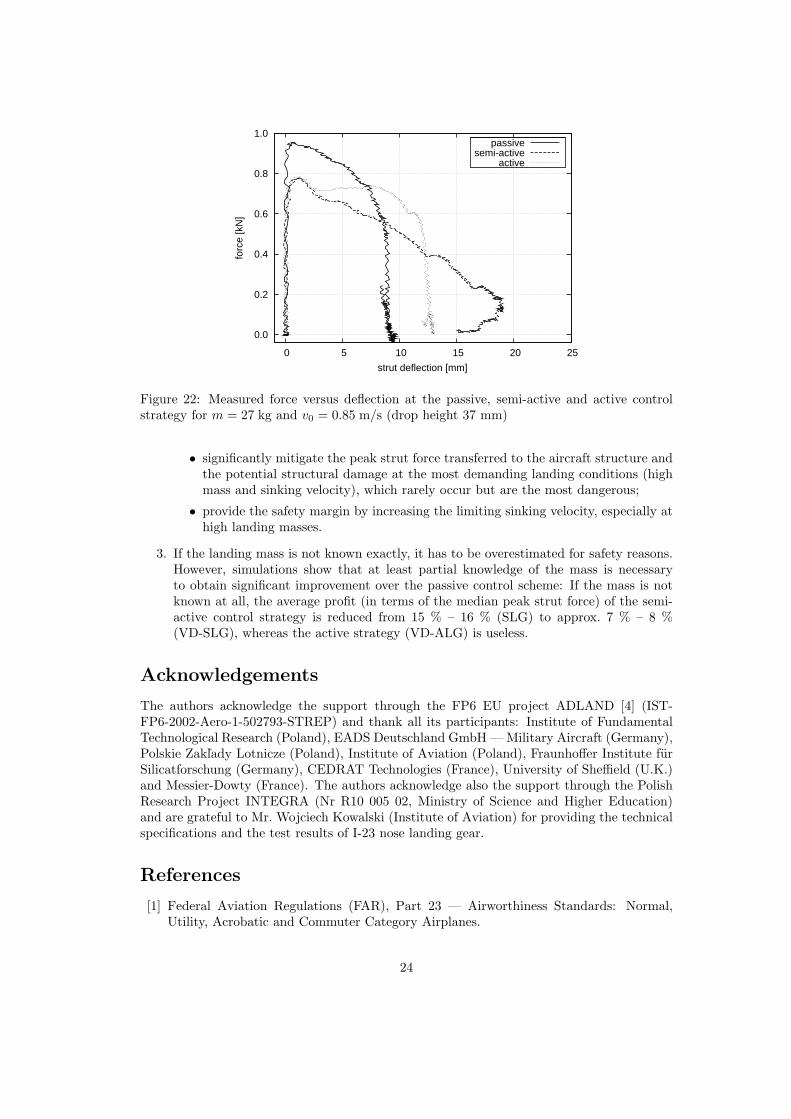
5.3 Example measurements
Fig. 21 and Fig. 22 compare the plots of measured force FS versus strut deflection s, whichclearly illustrate the effects of the tested control strategies. The advantage of the semi-activeand active modes over the passive is clear in both cases: the peak dynamic force has beenconsiderably reduced. The advantage of the active strategy over the semi-active is much lesspronounced. However, the active strategy, besides decreasing the peak dynamic force, whichwas the objective here, also significantly decreased the maximum piston strokes needed tocomplete the dissipation process. With the active strategy the energy is thus dissipated ona shorter distance. The displacements of the pistons were reduced by 15 % on average, whichsignificantly enlarges the energy dissipation potential of the AIA.
6 Conclusions
All numerical simulations in this paper have been based on the I-23 nose LG, other LGscould lead to slightly different numerical results. Nevertheless, the most important findingsare confirmed in the experimental tests and can be summarized as follows:
1. The superiority of the adaptive paradigm over standard passive solutions is clearlyconfirmed both by numerical simulations and in laboratory tests. The modeled adaptiveLG excel the modeled passive LG by 6.9 % – 17.8 % in terms of the median peak strutforce. Up to 37 % improvement has been obtained in laboratory tests, with an averageof 20 %.
2. The relative improvement between the modeled semi-active and active control strategiesseems to be statistically rather insignificant (1 % – 2 % in terms of the median peakstrut force). However, the advantage of the active strategy increases considerably withthe sinking velocity and landing mass to attain the maximum of approx. 10 % atthe highest-energy design landing conditions (at which the semi-active strategy showsno improvement to the passive), in simulation as well as in experiment. Therefore,implementation of an active control system can:
23
0.0
0.2
0.4
0.6
0.8
1.0
0 5 10 15 20 25
forc
e [k
N]
strut deflection [mm]
passivesemi-active
active
Figure 22: Measured force versus deflection at the passive, semi-active and active controlstrategy for m = 27 kg and v0 = 0.85 m/s (drop height 37 mm)
• significantly mitigate the peak strut force transferred to the aircraft structure andthe potential structural damage at the most demanding landing conditions (highmass and sinking velocity), which rarely occur but are the most dangerous;
• provide the safety margin by increasing the limiting sinking velocity, especially athigh landing masses.
3. If the landing mass is not known exactly, it has to be overestimated for safety reasons.However, simulations show that at least partial knowledge of the mass is necessaryto obtain significant improvement over the passive control scheme: If the mass is notknown at all, the average profit (in terms of the median peak strut force) of the semi-active control strategy is reduced from 15 % – 16 % (SLG) to approx. 7 % – 8 %(VD-SLG), whereas the active strategy (VD-ALG) is useless.
Acknowledgements
The authors acknowledge the support through the FP6 EU project ADLAND [4] (IST-FP6-2002-Aero-1-502793-STREP) and thank all its participants: Institute of FundamentalTechnological Research (Poland), EADS Deutschland GmbH — Military Aircraft (Germany),Polskie ZakÃlady Lotnicze (Poland), Institute of Aviation (Poland), Fraunhoffer Institute furSilicatforschung (Germany), CEDRAT Technologies (France), University of Sheffield (U.K.)and Messier-Dowty (France). The authors acknowledge also the support through the PolishResearch Project INTEGRA (Nr R10 005 02, Ministry of Science and Higher Education)and are grateful to Mr. Wojciech Kowalski (Institute of Aviation) for providing the technicalspecifications and the test results of I-23 nose landing gear.
References
[1] Federal Aviation Regulations (FAR), Part 23 — Airworthiness Standards: Normal,Utility, Acrobatic and Commuter Category Airplanes.
24
[2] J. R. McGehee and H. D. Carden. Analytical investigation of the landing dynamics ofa large airplane with a load-control system in the main landing gear. Technical Report1555, NASA, 1979.
[3] G. MikuÃlowski and J. Holnicki-Szulc. Adaptive aircraft shock absorbers. In 3rd EuropeanConference on Structural Control, 3ECSC, July 2004.
[4] Adaptive Landing Gears for Improved Impact Absorption, ADLAND, EU FP6 projectIST-FP6-2002-Aero-1-502793-STREP. http://smart.ippt.gov.pl/adland.
[5] N. S. Currey. Aircraft landing gear design: principles and pratices. AIAA, 1988.
[6] B. Milwitzky and F. E. Cook. Analysis of landing gear behaviour. Technical Report1154, NACA, 1953.
[7] J. H. Walls. An experimental study of orifice coefficents, internal strut pressures, andloads on a small oleo-pneumatic shock strut. Technical note 3426, National AdvisoryComittee for Aeroanutics, 1955.
[8] A. W. Hall, R. H. Sawyer, and J. M. McKay. Study of groud-reaction forces measuredduring landing impacts of a large airplane. Technical note 4247, National AdvisoryCommittee for Aeronautics, May 1958.
[9] W. Flugge. Landing-gear impact. Technical note 2743, National Advisory Committeefor Aeronautics, October 1952.
[10] J. E. Wignot, P. C. Durup, and M. A. Gamon. Design formulation and analysis of anactive landing gear. AFFDL-TR-71-80 Vol. I, U.S. Air Force, 1971.
[11] E. K. Bender, E. F. Berkman, and M. Bieber. A feasibility study of active landing gear.AFFDL-TR-70-126, U.S. Air Force, 1971.
[12] J. R. McGehee and H. D. Carden. A mathematical model of an active control landinggear for load control during impact and roll-out. Technical Note NASA TN D-8080,NASA Langley Research Center, February 1976.
[13] I. Ross. Flightworthy active control landing gear system for a supersonic aircraft. Tech-nical report, Hydraulic Research Textron, 1980.
[14] I. Ross and R. Edson. An electronic control for an elecrtrohydraulic active controllanding gear for the F-4 aircraft. Technical report, Hydraulic Research Textron, Inc,1982.
[15] J. R. McGehee and R. C. Dreher. Experimental investigation of active loads control foraircraft landing gear. NASA Technical Paper 2042, Langley Research Centre, 1982.
[16] J. R. McGehee and D. L. Morris. Active control landing gear for ground load alleviation.In AGARD Conf. Proc. 384, FMP Symposium, 1984. Toronto.
[17] W. E. Howell, J. R. McGehee, R. H. Daaugherty, and W. A. Vogler. F-106b airplane ac-tive control landing gear drop test performance. NASA Technical Memorandum 102741,Langley Research Centre, November 1990.
[18] L. G. Horta, R. H. Daugherty, and V. J. Martinson. Modeling and validation of a NavyA6-Intruder actively controlled landing gear system. Technical Report TP-1999-209124,NASA, 1999.
25
[19] L. G. Horta, R. H. Daugherty, and V. J. Martinson. Actively controlled landing gearfor aircraft vibration reduction. Tecnical Paper NASA-99-ceas-lgh, NASA, 1999.
[20] R. Freymann. Actively damped landing gear system. In AGARD CP-484 Ref. 20, Proc.of the 71st Meeting of the AGARD Structures and Materials Panel, October 1990.
[21] Z. Lou, R. D. Ervin, C. B. Winkler, and F. E. Filisko. An electrorheologically controlledsemi-active landing gear. SAE paper 931403, Langley Research Centre, January 1993.
[22] H. Wentscher, W. Kortum, and W. R. Kruger. Fuselage vibration control using semi-active front gear. In Proceedings of the 81st meeting of the AGARD SMP Panel on ”Thedesign, Qualification and Maintenance of Vibration-Free Landing Gears”, 1995.
[23] X. Wang and U. Carl. Fuzzy control of aircraft semi-active landing gear system. InProc. of the 37th AIAA Aerospace Sciences Meeting and Exhibit, January 1999.
[24] W. Kruger. Integrated Design Process for the Development of Semi-Active Landing Gearsfor Transport Aircraft. PhD thesis, University of Stuttgart, December 2000.
[25] G. L. Ghiringhelli. Testing of semiactive landing gear control for a general aviationaircraft. AIAA Journal of Aircraft, 37(4):606–616, 2000.
[26] G. L. Ghiringhelli and S. Gualdi. Evaluation of a landing gear semi-active control systemfor complete aircraft landing. Aerotecnica Missili e Spazio, 83:21–31, January 2004.
[27] G. MikuÃlowski and J. Holnicki-Szulc. Adaptive landing gear concept — feedback controlvalidation. Smart Materials and Structures, 16(6):2146–2158, 2007.
[28] D. C. Batterbee, N. D. Sims, R. Staway, and Z. WoÃlejsza. Magnetorheological landinggear: 1. a design methodology. Smart Material and Structures, 16:2429–2440, 2007.
[29] D. C. Batterbee, N. D. Sims, R. Staway, and M. Rennison. Magnetorheological landinggear: 2. validation using experimental data. Smart Materials and Structures, 16:2441–2452, 2007.
[30] D. P. Raymer. Aircraft Design: A Conceptual Approach. AIAA education series, 1989.
[31] S. T. Chai and W. H. Mason. Landing gear integration in aircraft conceptual design.Technical Report MAD 96-09-01, MAD Center, 1996.
[32] I-23 technical specification. Institute of Aviation, Warsaw, Poland.
[33] K. SekuÃla and J. Holnicki-Szulc. On-line impact load identification. submitted to Inter-national Journal of Impact Engineering, 2008.
[34] J. Holnicki-Szulc, G. MikuÃlowski, J. Motylewski, P. PawÃlowski, and Z. WoÃlejsza. Adap-tive system for energy dissipation in landing gears (in Polish: Adaptacyjny system dyssy-pacji energii w podwoziu lotniczym). XXXIV Polish Symposium on Machine Diagnostics,Wegierska Gorka, March 2007.
[35] D. Batterbee, N. D. Sims, and R. Stanway. ADLAND report: Annex USFD-1(a): Oleo-pneumatic shock absorber modelling and initial MR device sizing. Technical report,University of Sheffield, 2004.
[36] G. MikuÃlowski and J. Holnicki-Szulc. Fast controller and control algorithms for MRbased adaptive impact absorbers — force based control. Machine Dynamics Problems,30(2):113–122, 2006.
26


![Landing Gear Accessories - goldlinequalityparts.com€¦ · 12 Landing Gear Accessories Landing Gear Accessories 13 [254.0mm] 10.00" [254.0mm] 10.00" [111.3mm] 4.38" [304.8mm] 12.00"](https://static.fdocuments.in/doc/165x107/5f42201687106b11477aac9b/landing-gear-accessories-12-landing-gear-accessories-landing-gear-accessories.jpg)