
ADAPTIVE HARVEST MANAGEMENT FOR THE SVALBARD … · Utility (i.e., stakeholder satisfaction)...
19
Doc. AEWA/EGMIWG/4.7 11 June 2019 AEWA EUROPEAN GOOSE MANAGEMENT PLATFORM 4 th MEETING OF THE AEWA EUROPEAN GOOSE MANAGEMENT INTERNATIONAL WORKING GROUP 18-20 June 2019, Perth, Scotland, United Kingdom The 4 th Meeting of the AEWA European Goose Management International Working Group is being hosted by Scottish Natural Heritage. ADAPTIVE HARVEST MANAGEMENT FOR THE SVALBARD POPULATION OF PINK‐FOOTED GEESE 2019 PROGRESS SUMMARY 1 Report prepared by the AEWA European Goose Management Platform Data Centre Fred A. Johnson 2 , Henning Heldbjerg 3 , Kevin K. Clausen 3 and Jesper Madsen 3 Summary This report describes an Adaptive Harvest Management (AHM) program designed to maintain the Svalbard population of Pink-footed Geese (Anser brachyrhynchus ) near their target level (60,000) by providing sustainable harvests in Norway and Denmark. Specifically, this report provides recent monitoring and assessment results and their implications for the 2019 hunting season. In this report we provide results for both the set of nine discrete population models used since 2013 and for a recently developed Integrated Population Model (IPM). Updating model weights (set of nine models) and model parameters (IPM) use the most recent monitoring information available (i.e. through spring 2019). We also compare optimal harvest strategies based on the two modeling approaches. Of growing concern, however, has been the observation that the predictive ability of the original population models has declined over time. Going forward, we suggest that use of the IPM is a superior modeling approach for setting hunting seasons for Pink-footed Geese. Population sizes in May as estimated by the IPM are in general agreement with counts and capture-mark- recapture estimates but are more precise. Estimates of survival from natural causes were relatively constant over time with a mean of 0.93 and estimates of adult kill rate ranged from 0.04 to 0.13. Estimates of country- specific kill rates suggest that most of the overall increase in kill rate in recent years is attributed to increasing harvest pressure in Denmark. With respect to productivity, the IPM produced estimates of preseason age ratio that were variable over time, but on average suggested that young constituted about 18% of the population just prior to the hunting season. Estimates of the preseason age ratio correlated well with the number of days above freezing in May in Svalbard. Our results suggest that population size has stabilized because of declining survival rates that have accompanied an increase in kill rates. Adoption of the IPM this year would result in a 1 This draft report is distributed solely for purposes of courtesy review and comments received will be addressed and treated as appropriate to ensure there is no conflict of interest. Its content is deliberative and pre-decisional, so it must not be disclosed or released by reviewers. Because the report has not yet been approved for publication by the U.S. Geological Survey (USGS), it does not represent any official USGS finding or policy. 2 U.S. Geological Survey, Wetland and Aquatic Research Center, Gainesville, Florida USA. 3 Aarhus University, Department of Bioscience, Rønde, Denmark.
Transcript of ADAPTIVE HARVEST MANAGEMENT FOR THE SVALBARD … · Utility (i.e., stakeholder satisfaction)...
Doc. AEWA/EGMIWG/4.7
11 June 2019
AEWA EUROPEAN GOOSE MANAGEMENT PLATFORM
4th MEETING OF THE
AEWA EUROPEAN GOOSE MANAGEMENT
INTERNATIONAL WORKING GROUP
18-20 June 2019, Perth, Scotland, United Kingdom
The 4th Meeting of the AEWA European Goose Management International Working Group is being
hosted by Scottish Natural Heritage.
ADAPTIVE HARVEST MANAGEMENT FOR THE SVALBARD POPULATION OF
PINK‐FOOTED GEESE
2019 PROGRESS SUMMARY1
Report prepared by the AEWA European Goose Management Platform Data Centre
Fred A. Johnson2, Henning Heldbjerg3, Kevin K. Clausen3 and Jesper Madsen3
Summary
This report describes an Adaptive Harvest Management (AHM) program designed to maintain the Svalbard
population of Pink-footed Geese (Anser brachyrhynchus) near their target level (60,000) by providing
sustainable harvests in Norway and Denmark. Specifically, this report provides recent monitoring and
assessment results and their implications for the 2019 hunting season.
In this report we provide results for both the set of nine discrete population models used since 2013 and for a
recently developed Integrated Population Model (IPM). Updating model weights (set of nine models) and
model parameters (IPM) use the most recent monitoring information available (i.e. through spring 2019). We
also compare optimal harvest strategies based on the two modeling approaches. Of growing concern, however,
has been the observation that the predictive ability of the original population models has declined over time.
Going forward, we suggest that use of the IPM is a superior modeling approach for setting hunting seasons for
Pink-footed Geese.
Population sizes in May as estimated by the IPM are in general agreement with counts and capture-mark-
recapture estimates but are more precise. Estimates of survival from natural causes were relatively constant
over time with a mean of 0.93 and estimates of adult kill rate ranged from 0.04 to 0.13. Estimates of country-
specific kill rates suggest that most of the overall increase in kill rate in recent years is attributed to increasing
harvest pressure in Denmark. With respect to productivity, the IPM produced estimates of preseason age ratio
that were variable over time, but on average suggested that young constituted about 18% of the population just
prior to the hunting season. Estimates of the preseason age ratio correlated well with the number of days above
freezing in May in Svalbard. Our results suggest that population size has stabilized because of declining
survival rates that have accompanied an increase in kill rates. Adoption of the IPM this year would result in a
1 This draft report is distributed solely for purposes of courtesy review and comments received will be addressed and
treated as appropriate to ensure there is no conflict of interest. Its content is deliberative and pre -decisional, so it must
not be disclosed or released by reviewers. Because the report has not yet been approved for publication by the U.S.
Geological Survey (USGS), it does not represent any official USGS finding or policy. 2 U.S. Geological Survey, Wetland and Aquatic Research Center, Gainesville, Florida USA. 3 Aarhus University, Department of Bioscience, Rønde, Denmark.
Adaptive Harvest Management for the Svalbard Population of Pink‐Footed Geese. 2019 Progress Summary
2
harvest quota for the 2019 hunting season of 22,000, based on a May population estimate of 76,500 (95% CI:
66,800 – 86,600) and 8 days above freezing in Svalbard. Using the agreed upon allocation of the total allowable
harvest, the quotas are 6,600 for Norway and 15,400 for Denmark. Assuming the total quota is met, the IPM
predicts a population size in May 2020 of 64,900 (95% CI: 50,300 – 83,700).
We note that the updated set of original models used since 2013 suggests an allowable harvest of 40,000 in
2019 based on a November 2018 count of 91,900 geese (comprised of 12,900 young and 79,000 adults). We
are skeptical of this large quota, however. Using all available demographic data suggests that the November
2018 population size was lower than that indicated by the count and that the winter population experienced
more natural mortality than expected. These insights demonstrate the inherent risk of basing a harvest quota
on a single population count, irrespective of other demographic data.
Introduction
The Svalbard population of Pink-footed Geese has increased from about 10,000 individuals in the early 1960’s
to around 80,000 today. Although these geese are a highly valued resource, the growing numbers of geese are
causing agricultural conflicts in wintering and staging areas, as well as tundra degradation in Svalbard. The
African-Eurasian Waterbird Agreement (AEWA; http://www.unep-aewa.org/) calls for means to manage
populations which cause conflicts with certain human economic activities. This document describes progress
on the implementation of an AHM program for maintaining Pink-footed Goose abundance near their target
level (60,000) by providing sustainable harvests in Norway and Denmark (Madsen and Williams 2012). This
report also provides relevant information for establishing the 2019 hunting seasons.
Johnson et al. (2014) described the compilation of relevant demographic and weather data and specified an
annual-cycle model for Pink-footed Geese. By combining varying hypotheses about survival and reproduction,
a suite of nine discrete models was developed, representing a range of possibilities concerning the extent to
which demographic rates are density dependent, and the extent to which spring temperatures influence survival
and reproduction. These nine models vary significantly in their predictions of the harvests required to maintain
the population near the goal of 60,000.
These models are used with the passive form of adaptive management (Johnson and Williams 2015) to
formulate an optimal harvest strategy for Pink-footed Geese. In passive adaptive management, alternative
population models (or model parameterizations) and their associated weights are explicitly considered in the
development of an optimal harvest strategy. Model-specific weights represent the relative credibility of the
alternative models and are based on a comparison of predicted and observed population sizes. Models that are
better predictors of observed population size gain probability mass (weight) according to Bayes’ theorem.
Models with higher weights have more influence on the optimal harvest strategy. Model weights are updated
each year based on information from the monitoring program; thus, the harvest strategy evolves over time as
uncertainty about population dynamics is reduced.
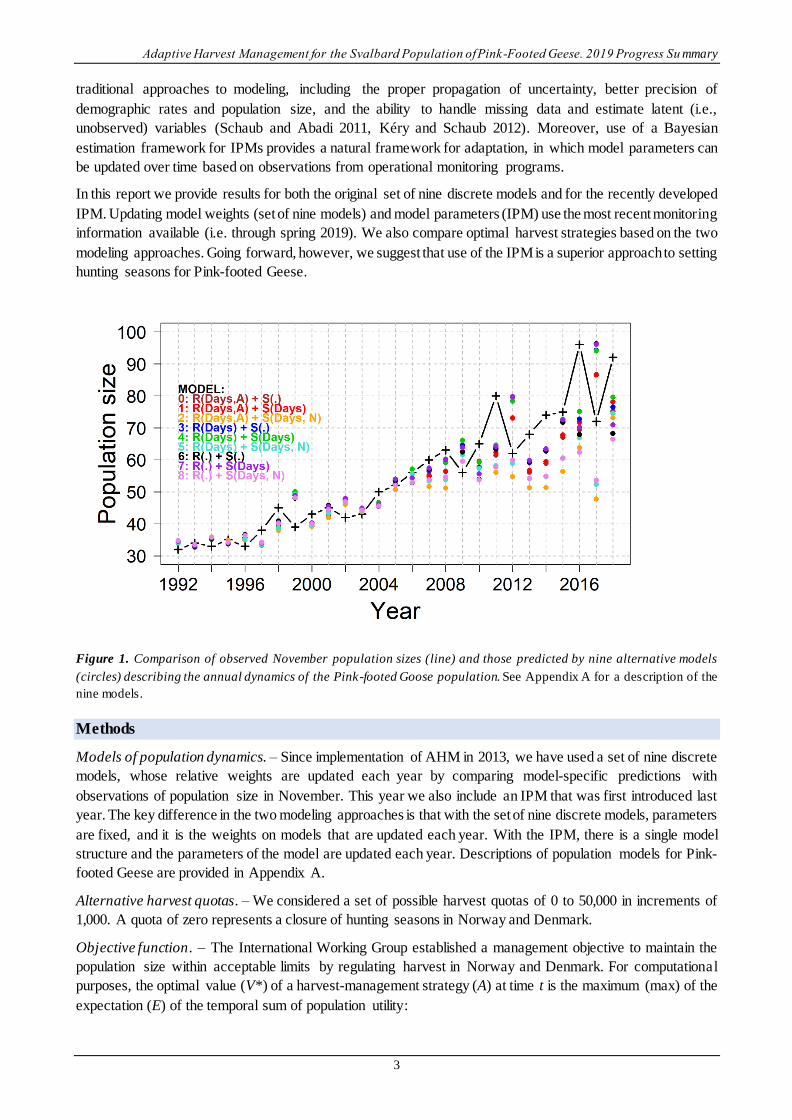
Of growing concern, however, has been the observation that the predictive ability of the original population
models has declined over time (Figure 1). Over the period in which comparisons can be made (1992-2018),
November population counts are generally higher than model-predicted population sizes from about 2007
onward. The reasons for these discrepancies are unknown. Moreover, calculation of an annual harvest quota
has been based on a single population count, which may be biased in any given year due to birds that are
missed or counted on more than one occasion. This can lead to erroneous management decisions concerning
the setting of hunting seasons, as was the case in Denmark in 2015 (Madsen et al. 2017). For these reasons,
development of an IPM for Svalbard Pink-footed Geese has been a high priority.
Integrated population models are increasingly being used to better understand the size and demography of
wildlife populations (Freeman and Crick 2003, Schaub et al. 2007, Schaub and Abadi 2011, Kéry and Schaub
2012, Tempel et al. 2014, Mosnier et al. 2015). IPMs represent an advanced approach to modeling, in which
all available demographic data are incorporated into a single analysis. IPMs have many advantages over
Adaptive Harvest Management for the Svalbard Population of Pink‐Footed Geese. 2019 Progress Su mmary
3
traditional approaches to modeling, including the proper propagation of uncertainty, better precision of
demographic rates and population size, and the ability to handle missing data and estimate latent (i.e.,
unobserved) variables (Schaub and Abadi 2011, Kéry and Schaub 2012). Moreover, use of a Bayesian
estimation framework for IPMs provides a natural framework for adaptation, in which model parameters can
be updated over time based on observations from operational monitoring programs.
In this report we provide results for both the original set of nine discrete models and for the recently developed
IPM. Updating model weights (set of nine models) and model parameters (IPM) use the most recent monitoring
information available (i.e. through spring 2019). We also compare optimal harvest strategies based on the two
modeling approaches. Going forward, however, we suggest that use of the IPM is a superior approach to setting
hunting seasons for Pink-footed Geese.
Figure 1. Comparison of observed November population sizes (line) and those predicted by nine alternative models
(circles) describing the annual dynamics of the Pink-footed Goose population. See Appendix A for a description of the
nine models.
Methods
Models of population dynamics. – Since implementation of AHM in 2013, we have used a set of nine discrete
models, whose relative weights are updated each year by comparing model-specific predictions with
observations of population size in November. This year we also include an IPM that was first introduced last
year. The key difference in the two modeling approaches is that with the set of nine discrete models, parameters
are fixed, and it is the weights on models that are updated each year. With the IPM, there is a single model
structure and the parameters of the model are updated each year. Descriptions of population models for Pink-
footed Geese are provided in Appendix A.
Alternative harvest quotas. – We considered a set of possible harvest quotas of 0 to 50,000 in increments of
1,000. A quota of zero represents a closure of hunting seasons in Norway and Denmark.
Objective function. – The International Working Group established a management objective to maintain the
population size within acceptable limits by regulating harvest in Norway and Denmark. For computational
purposes, the optimal value (V*) of a harvest-management strategy (A) at time t is the maximum (max) of the
expectation (E) of the temporal sum of population utility:
Adaptive Harvest Management for the Svalbard Population of Pink‐Footed Geese. 2019 Progress Summary
4
𝑉∗(𝐴𝑡|𝑥𝑡) = max(𝐴𝑡|𝑥𝑡)
𝐸 [∑𝑢(𝑎𝜏 |𝑥𝜏)|𝑥𝑡
∞
𝜏=𝑡
],
where population utility 𝑢(𝑎𝜏|𝑥𝜏) is action (𝑎𝜏) and resource-dependent (𝑥𝜏). Population utility is defined as
a function of a time-dependent action conditioned on system state:
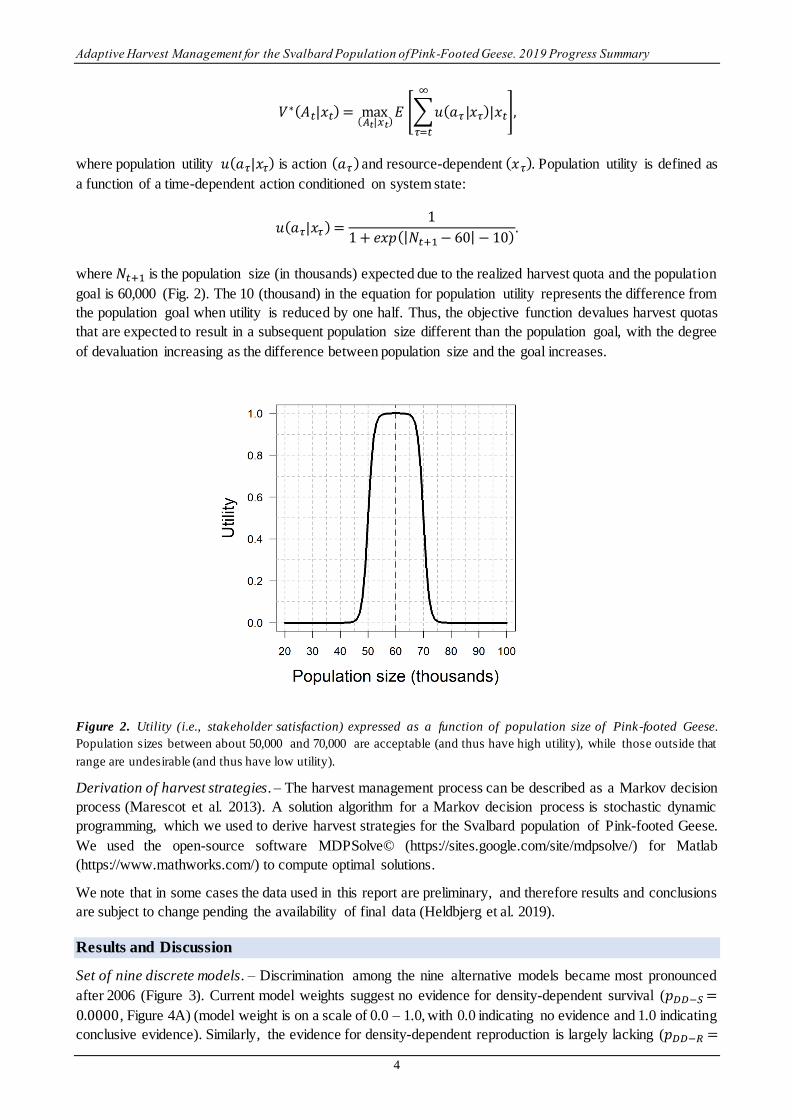
𝑢(𝑎𝜏|𝑥𝜏) =1
1 + 𝑒𝑥𝑝(|𝑁𝑡+1 − 60| − 10).
where 𝑁𝑡+1 is the population size (in thousands) expected due to the realized harvest quota and the population
goal is 60,000 (Fig. 2). The 10 (thousand) in the equation for population utility represents the difference from
the population goal when utility is reduced by one half. Thus, the objective function devalues harvest quotas
that are expected to result in a subsequent population size different than the population goal, with the degree
of devaluation increasing as the difference between population size and the goal increases.
Figure 2. Utility (i.e., stakeholder satisfaction) expressed as a function of population size of Pink-footed Geese.
Population sizes between about 50,000 and 70,000 are acceptable (and thus have high utility), while those outside that
range are undesirable (and thus have low utility).
Derivation of harvest strategies. – The harvest management process can be described as a Markov decision
process (Marescot et al. 2013). A solution algorithm for a Markov decision process is stochastic dynamic
programming, which we used to derive harvest strategies for the Svalbard population of Pink-footed Geese.
We used the open-source software MDPSolve© (https://sites.google.com/site/mdpsolve/) for Matlab
(https://www.mathworks.com/) to compute optimal solutions.
We note that in some cases the data used in this report are preliminary, and therefore results and conclusions
are subject to change pending the availability of final data (Heldbjerg et al. 2019).
Results and Discussion
Set of nine discrete models. – Discrimination among the nine alternative models became most pronounced
after 2006 (Figure 3). Current model weights suggest no evidence for density-dependent survival (𝑝𝐷𝐷−𝑆 =
0.0000, Figure 4A) (model weight is on a scale of 0.0 – 1.0, with 0.0 indicating no evidence and 1.0 indicating
conclusive evidence). Similarly, the evidence for density-dependent reproduction is largely lacking (𝑝𝐷𝐷−𝑅 =
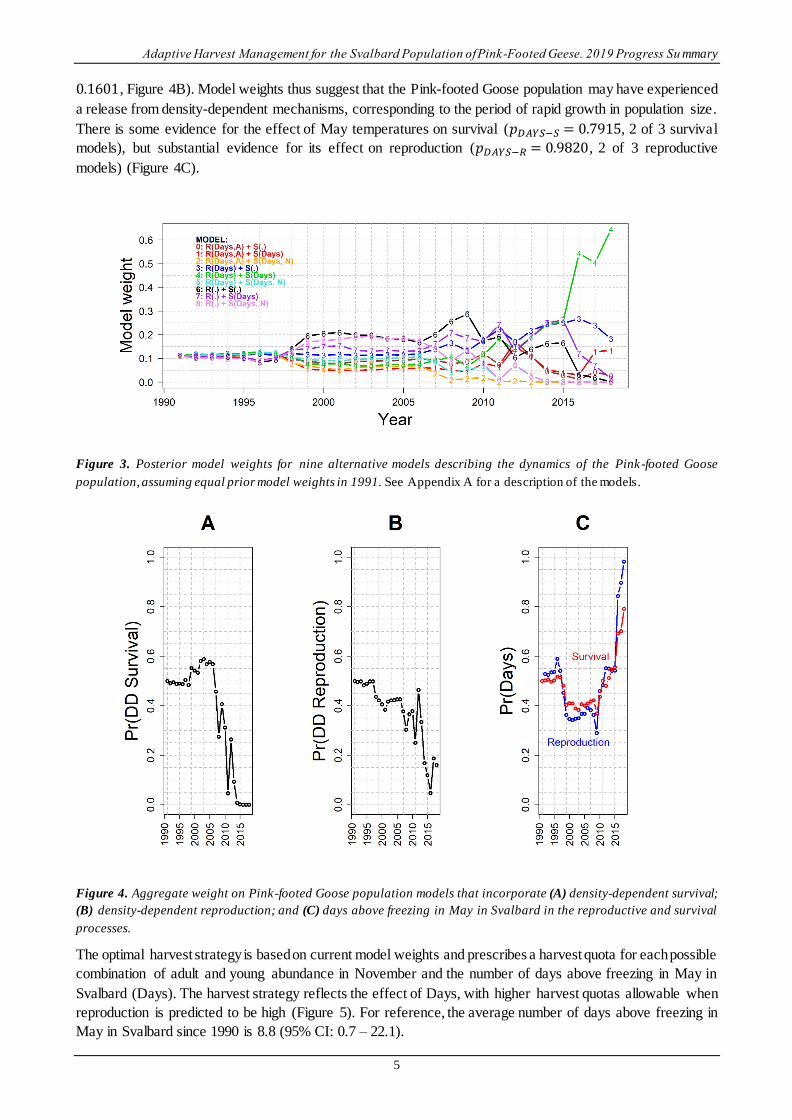
Adaptive Harvest Management for the Svalbard Population of Pink‐Footed Geese. 2019 Progress Su mmary
5
0.1601, Figure 4B). Model weights thus suggest that the Pink-footed Goose population may have experienced
a release from density-dependent mechanisms, corresponding to the period of rapid growth in population size.
There is some evidence for the effect of May temperatures on survival (𝑝𝐷𝐴𝑌𝑆−𝑆 = 0.7915, 2 of 3 survival
models), but substantial evidence for its effect on reproduction (𝑝𝐷𝐴𝑌𝑆−𝑅 = 0.9820, 2 of 3 reproductive
models) (Figure 4C).
Figure 3. Posterior model weights for nine alternative models describing the dynamics of the Pink-footed Goose
population, assuming equal prior model weights in 1991. See Appendix A for a description of the models.
Figure 4. Aggregate weight on Pink-footed Goose population models that incorporate (A) density-dependent survival;
(B) density-dependent reproduction; and (C) days above freezing in May in Svalbard in the reproductive and survival
processes.
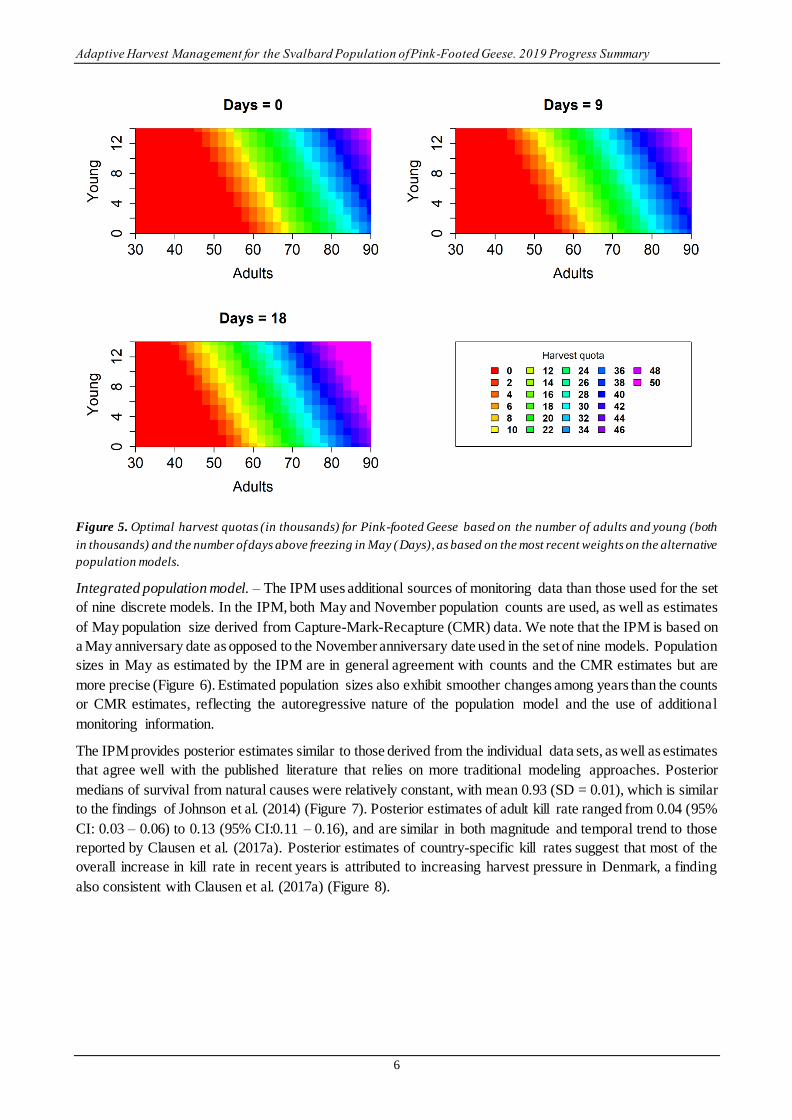
The optimal harvest strategy is based on current model weights and prescribes a harvest quota for each possible
combination of adult and young abundance in November and the number of days above freezing in May in
Svalbard (Days). The harvest strategy reflects the effect of Days, with higher harvest quotas allowable when
reproduction is predicted to be high (Figure 5). For reference, the average number of days above freezing in
May in Svalbard since 1990 is 8.8 (95% CI: 0.7 – 22.1).
Adaptive Harvest Management for the Svalbard Population of Pink‐Footed Geese. 2019 Progress Summary
6
Figure 5. Optimal harvest quotas (in thousands) for Pink-footed Geese based on the number of adults and young (both
in thousands) and the number of days above freezing in May (Days), as based on the most recent weights on the alternative
population models.
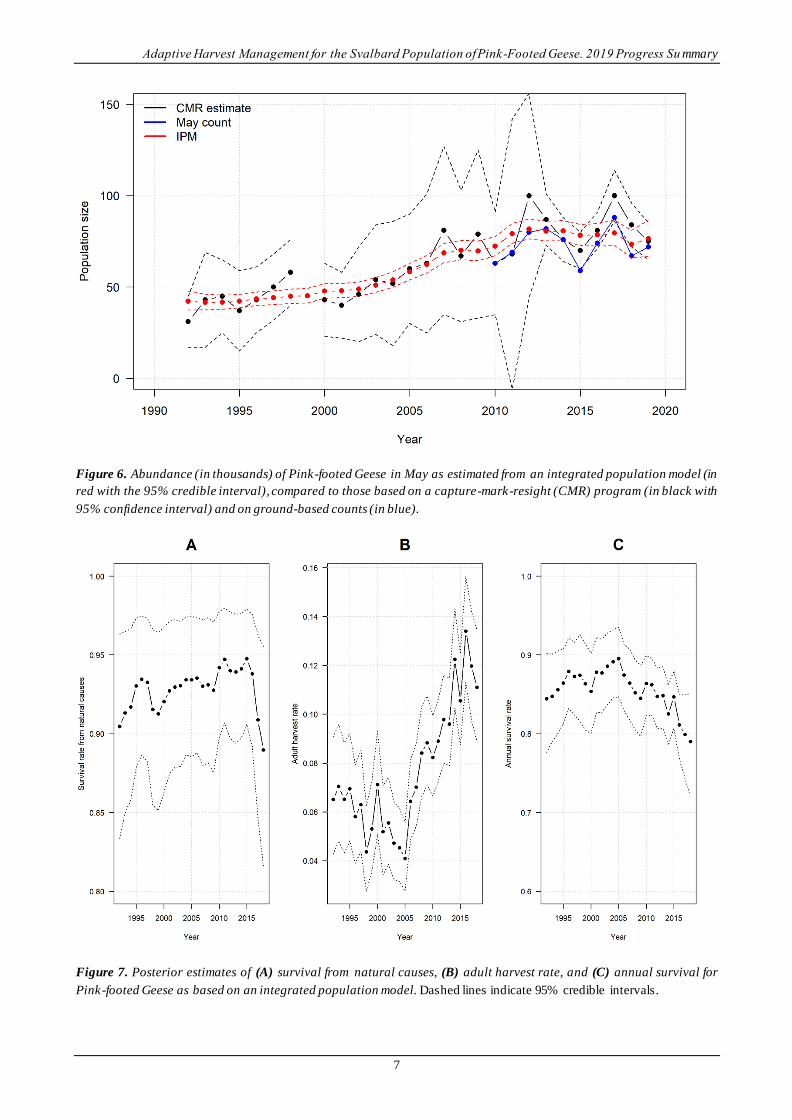
Integrated population model. – The IPM uses additional sources of monitoring data than those used for the set
of nine discrete models. In the IPM, both May and November population counts are used, as well as estimates
of May population size derived from Capture-Mark-Recapture (CMR) data. We note that the IPM is based on
a May anniversary date as opposed to the November anniversary date used in the set of nine models. Population
sizes in May as estimated by the IPM are in general agreement with counts and the CMR estimates but are
more precise (Figure 6). Estimated population sizes also exhibit smoother changes among years than the counts
or CMR estimates, reflecting the autoregressive nature of the population model and the use of additional
monitoring information.
The IPM provides posterior estimates similar to those derived from the individual data sets, as well as estimates
that agree well with the published literature that relies on more traditional modeling approaches. Posterior
medians of survival from natural causes were relatively constant, with mean 0.93 (SD = 0.01), which is similar
to the findings of Johnson et al. (2014) (Figure 7). Posterior estimates of adult kill rate ranged from 0.04 (95%
CI: 0.03 – 0.06) to 0.13 (95% CI:0.11 – 0.16), and are similar in both magnitude and temporal trend to those
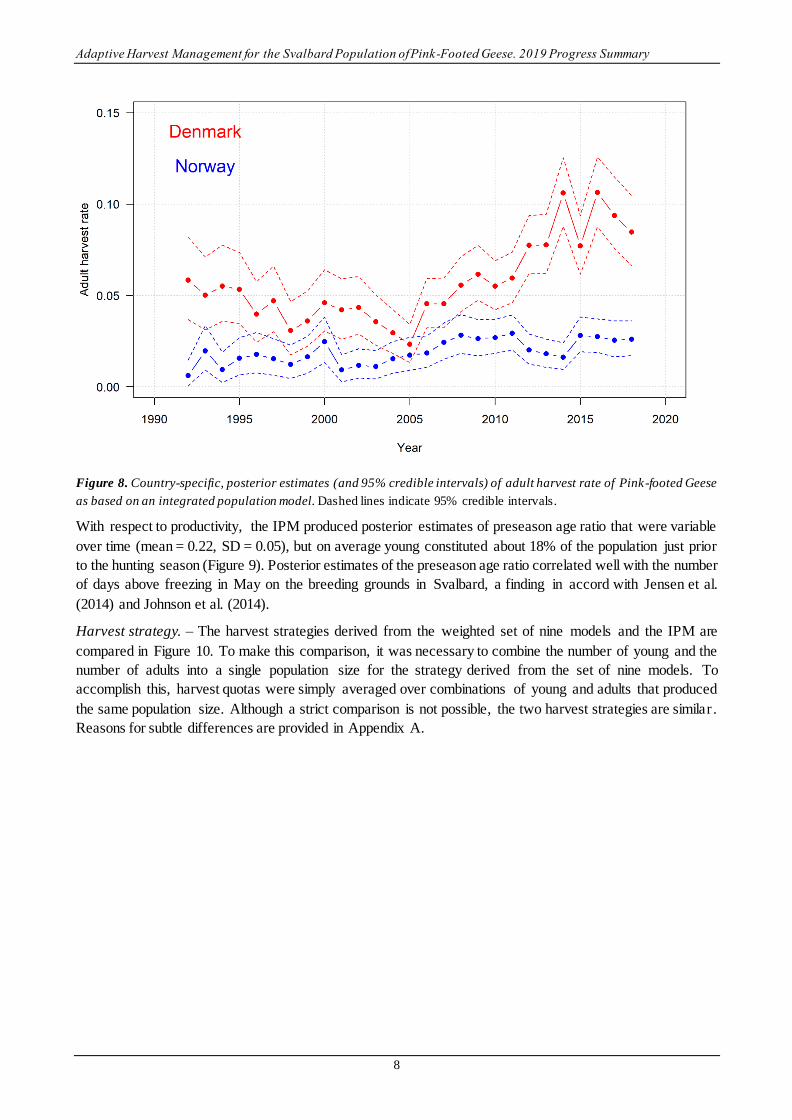
reported by Clausen et al. (2017a). Posterior estimates of country-specific kill rates suggest that most of the
overall increase in kill rate in recent years is attributed to increasing harvest pressure in Denmark, a finding
also consistent with Clausen et al. (2017a) (Figure 8).
Adaptive Harvest Management for the Svalbard Population of Pink‐Footed Geese. 2019 Progress Su mmary
7
Figure 6. Abundance (in thousands) of Pink-footed Geese in May as estimated from an integrated population model (in
red with the 95% credible interval), compared to those based on a capture-mark-resight (CMR) program (in black with
95% confidence interval) and on ground-based counts (in blue).
Figure 7. Posterior estimates of (A) survival from natural causes, (B) adult harvest rate, and (C) annual survival for
Pink-footed Geese as based on an integrated population model. Dashed lines indicate 95% credible intervals.
Adaptive Harvest Management for the Svalbard Population of Pink‐Footed Geese. 2019 Progress Summary
8
Figure 8. Country-specific, posterior estimates (and 95% credible intervals) of adult harvest rate of Pink-footed Geese
as based on an integrated population model. Dashed lines indicate 95% credible intervals.
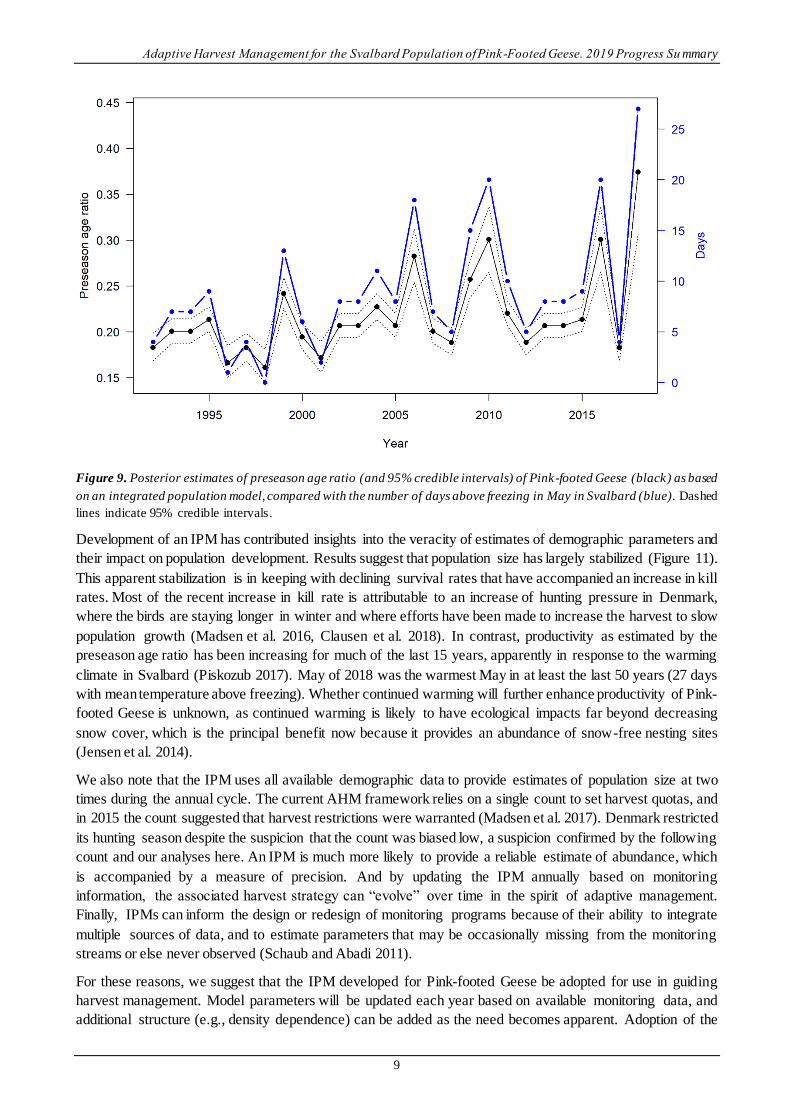
With respect to productivity, the IPM produced posterior estimates of preseason age ratio that were variable
over time (mean = 0.22, SD = 0.05), but on average young constituted about 18% of the population just prior
to the hunting season (Figure 9). Posterior estimates of the preseason age ratio correlated well with the number
of days above freezing in May on the breeding grounds in Svalbard, a finding in accord with Jensen et al.
(2014) and Johnson et al. (2014).
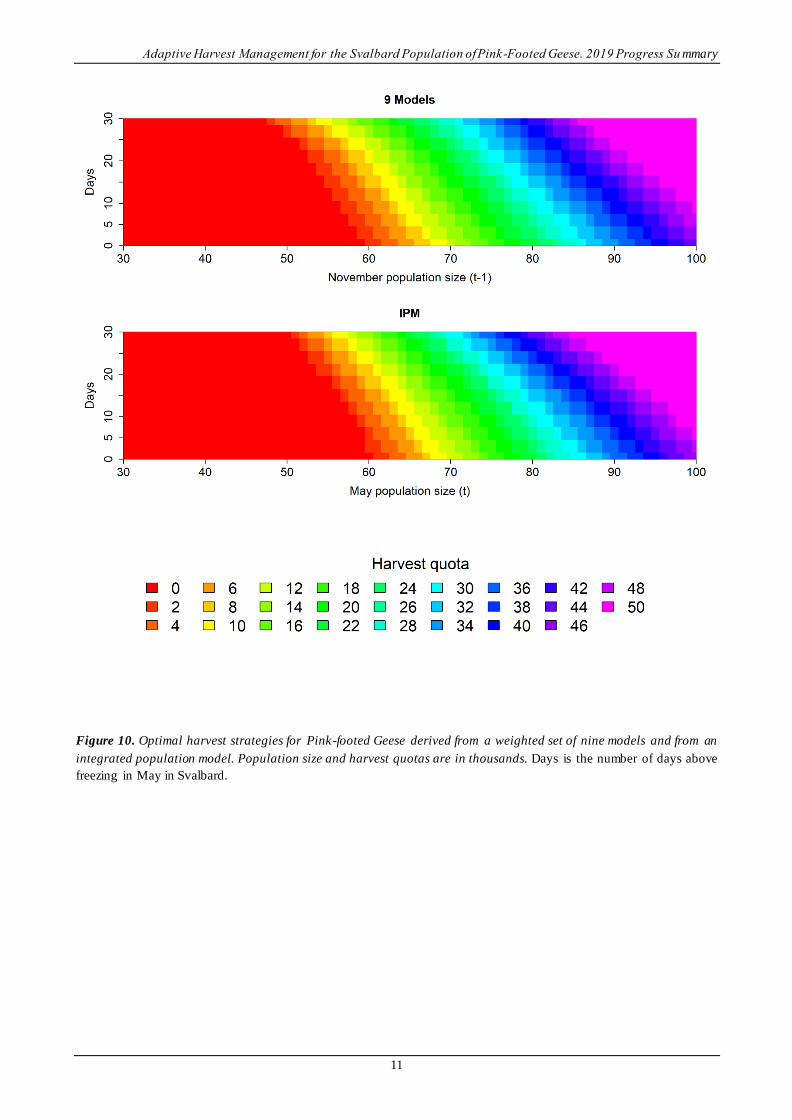
Harvest strategy. – The harvest strategies derived from the weighted set of nine models and the IPM are
compared in Figure 10. To make this comparison, it was necessary to combine the number of young and the
number of adults into a single population size for the strategy derived from the set of nine models. To
accomplish this, harvest quotas were simply averaged over combinations of young and adults that produced
the same population size. Although a strict comparison is not possible, the two harvest strategies are similar .
Reasons for subtle differences are provided in Appendix A.
Adaptive Harvest Management for the Svalbard Population of Pink‐Footed Geese. 2019 Progress Su mmary
9
Figure 9. Posterior estimates of preseason age ratio (and 95% credible intervals) of Pink-footed Geese (black) as based
on an integrated population model, compared with the number of days above freezing in May in Svalbard (blue). Dashed
lines indicate 95% credible intervals.
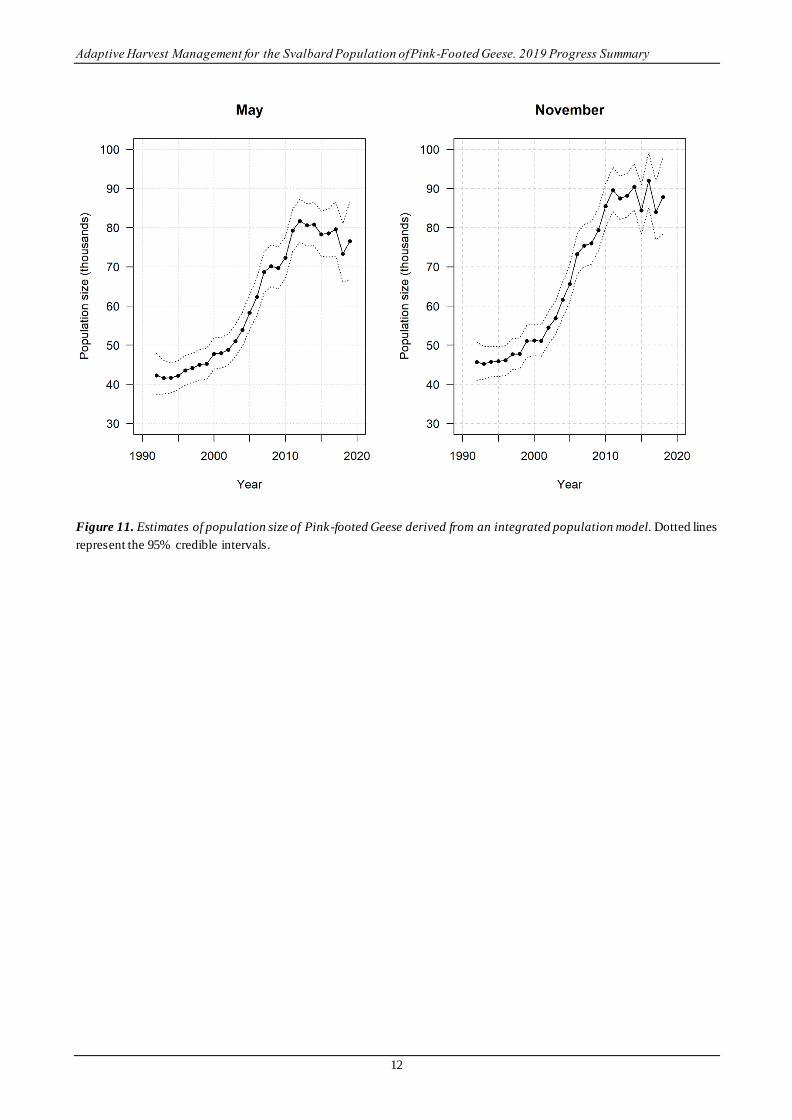
Development of an IPM has contributed insights into the veracity of estimates of demographic parameters and
their impact on population development. Results suggest that population size has largely stabilized (Figure 11).
This apparent stabilization is in keeping with declining survival rates that have accompanied an increase in kill
rates. Most of the recent increase in kill rate is attributable to an increase of hunting pressure in Denmark,
where the birds are staying longer in winter and where efforts have been made to increase the harvest to slow
population growth (Madsen et al. 2016, Clausen et al. 2018). In contrast, productivity as estimated by the
preseason age ratio has been increasing for much of the last 15 years, apparently in response to the warming
climate in Svalbard (Piskozub 2017). May of 2018 was the warmest May in at least the last 50 years (27 days
with mean temperature above freezing). Whether continued warming will further enhance productivity of Pink-
footed Geese is unknown, as continued warming is likely to have ecological impacts far beyond decreasing
snow cover, which is the principal benefit now because it provides an abundance of snow-free nesting sites
(Jensen et al. 2014).
We also note that the IPM uses all available demographic data to provide estimates of population size at two
times during the annual cycle. The current AHM framework relies on a single count to set harvest quotas, and
in 2015 the count suggested that harvest restrictions were warranted (Madsen et al. 2017). Denmark restricted
its hunting season despite the suspicion that the count was biased low, a suspicion confirmed by the following
count and our analyses here. An IPM is much more likely to provide a reliable estimate of abundance, which
is accompanied by a measure of precision. And by updating the IPM annually based on monitoring
information, the associated harvest strategy can “evolve” over time in the spirit of adaptive management.
Finally, IPMs can inform the design or redesign of monitoring programs because of their ability to integrate
multiple sources of data, and to estimate parameters that may be occasionally missing from the monitoring
streams or else never observed (Schaub and Abadi 2011).
For these reasons, we suggest that the IPM developed for Pink-footed Geese be adopted for use in guiding
harvest management. Model parameters will be updated each year based on available monitoring data, and
additional structure (e.g., density dependence) can be added as the need becomes apparent. Adoption of the
Adaptive Harvest Management for the Svalbard Population of Pink‐Footed Geese. 2019 Progress Summary
10
IPM this year would result in a harvest quota for the 2019 hunting season of 22,000, based on a May population
estimate of 76,500 (95% CI: 66,800 – 86,600) and 8 days above freezing in Svalbard. Using the agreed upon
allocation of the total allowable harvest, the quotas are 6,600 for Norway and 15,400 for Denmark. Assuming
the total quota is met, the IPM predicts a population size in May 2020 of 64,900 (95% CI: 50,300 – 83,700).
We note that the updated set of original models used since 2013 suggests an allowable harvest of 40,000 in
2019 based on a November 2018 population count of 91,900 (comprised of 12,900 young and 79,000 adults).
We are skeptical of this large quota, however. The November count was unexpectedly high; using all available
demographic data, the IPM suggests that the November 2018 population size was 87,800 (95%CI: 78,300 –
90,000) (i.e., suggesting there may have been individual birds counted on more than one occasion). Accounting
for a lower November population size, we would have expected a May 2019 population size of about 81,000.
The May count, the CMR estimate, and IPM are all in close agreement and suggest a May 2019 population
size of 72,400, 75,300 (95% CI: 64,500 – 86,000), and 76,500 (95% CI: 66,800 – 86,600), respectively,
suggesting that the winter population experienced more natural mortality than expected (as is indicated by the
IPM estimates of natural mortality). These insights demonstrate the inherent risk of basing a harvest quota on
a single population count, irrespective of other demographic data.
Adaptive Harvest Management for the Svalbard Population of Pink‐Footed Geese. 2019 Progress Su mmary
11
Figure 10. Optimal harvest strategies for Pink-footed Geese derived from a weighted set of nine models and from an
integrated population model. Population size and harvest quotas are in thousands. Days is the number of days above
freezing in May in Svalbard.
Adaptive Harvest Management for the Svalbard Population of Pink‐Footed Geese. 2019 Progress Summary
12
Figure 11. Estimates of population size of Pink-footed Geese derived from an integrated population model. Dotted lines
represent the 95% credible intervals.
Adaptive Harvest Management for the Svalbard Population of Pink‐Footed Geese. 2019 Progress Su mmary
13
References
Clausen, K. K., Christensen, T. K., Gundersen, O. M., and Madsen, J., 2017a. Impact of hunting along the migration corridor of Pink-footed Geese Anser brachyrhynchus - implications for sustainable harvest management. Journal of Applied Ecology 54:1563–1570.
Clausen, K. K., Holm, T. E., Haugaard, L., and Madsen J., 2017b. Crippling ratio: A novel approach to assess hunting-induced wounding of wild animals. Ecological Indicators 80:242–246.
Clausen, K. K., Madsen, J., Cottaar, F., Kuijken, E., and Verscheure, C., 2018. Highly dynamic wintering strategies in migratory geese: Coping with environmental change. Global Change Biology 24:3214–3225.
Denwood, M. J., 2016. runjags : An R package providing interface utilities, model templates, parallel computing methods and additional distributions for MCMC models in JAGS. Journal of Statistical Software 71:1–25.
Francis, C. M., Richards, M. H., Cooke, F., and Rockwell, R. F., 1992. Changes in survival rates of lesser snow geese with age and breeding Status. The Auk 109:731–747.
Freeman, S. N., and Crick, H. Q. P., 2003. The decline of the Spotted Flycatcher Muscicapa striata in the UK: an integrated population model. Ibis 145:400–412.
Gelman, A., and Hill. J., 2006. Data analysis using regression and multilevel/hierarchical models. Cambridge university press.
Gelman, A., and Rubin, D. B., 1992. Inference from iterative simulation using multiple sequences. Statistical Science 7:457–472.
Heldbjerg, H., Madsen, J., Amstrup, O., Bakken, J., Balsby, T., Christensen, T., et al., 2019. Pink-footed Goose Svalbard Population: Status Report 2018-2019. AEWA EGMP Technical Report. Bonn, Germany.
Jensen, G. H., Madsen, J., Johnson, F. A., and Tamstorf, M., 2014. Snow conditions as an estimator of the breeding output in high-Arctic Pink-footed Geese Anser brachyrhynchus. Polar Biology 37:1–14.
Johnson, F. A., Jensen, G. H., Madsen, J., and Williams, B. K., 2014. Uncertainty, robustness, and the value of information in managing an expanding Arctic goose population. Ecological Modelling 273:186–199.
Johnson, F. A., and Williams, B. K., 2015. A decision-analytic approach to adaptive resource management. Pages 61–84 in C. R. Allen and A. S. Garmestani, editors. Adaptive Management of Social-Ecological Systems. Springer Netherlands.
Kéry, M., and Schaub, M., 2012. Bayesian Population Analysis Using WinBUGS: A Hierarchical Perspective. Academic Press.
Madsen, J., Clausen, K. K., Christensen, T. K., and Johnson, F. A., 2016. Regulation of the hunting season as a tool for adaptive harvest management — first results for Pink-footed Geese Anser brachyrhynchus. Wildlife Biology 22:204–208.
Madsen, J., Frederiksen, M., and Ganter, B., 2002. Trends in annual and seasonal survival of Pink-footed Geese Anser brachyrhynchus. Ibis 144:218–226.
Madsen, J., Williams, J. H., Johnson, F. A., Tombre, I. M., Dereliev, S., and Kuijken, E., 2017. Implementation of the first adaptive management plan for a European migratory waterbird population: The case of the Svalbard Pink-footed Goose Anser brachyrhynchus. Ambio 46:275–289.
Marescot, L., Chapron, G., Chadès, I., Fackler, P. L., Duchamp, C., Marboutin, E., and Gimenez, O.,
2013. Complex decisions made simple: a primer on stochastic dynamic programming. Methods in Ecology and Evolution 4:872–884.
Mosnier, A., Doniol-Valcroze, T., Gosselin, J.-F., Lesage, V., Measures, L. N., and Hammill, M. O., 2015. Insights into processes of population decline using an integrated population model: The case of the St. Lawrence Estuary beluga (Delphinapterus leucas). Ecological Modelling 314:15–31.
Piskozub, J. 2017. Svalbard as a study model of future High Arctic coastal environments in a warming world. Oceanologia 59:612–619.
Adaptive Harvest Management for the Svalbard Population of Pink‐Footed Geese. 2019 Progress Summary
14
Plummer, M. 2003. JAGS: A program for analysis of Bayesian graphical models using Gibbs sampling. R Core Team. 2018. R: A Language and Environment for Statistical Computing. Vienna, Austria.
Schaub, M., and Abadi, F., 2011. Integrated population models: a novel analysis framework for deeper insights into population dynamics. Journal of Ornithology 152:227–237.
Schaub, M., Gimenez, O., Sierro, A., and Arlettaz, R., 2007. Use of integrated modeling to enhance estimates of population dynamics obtained from limited data. Conservation Biology 21:945–955.
Tempel, D. J., Peery, M. Z., and Gutiérrez, R. J., 2014. Using integrated population models to improve conservation monitoring: California spotted owls as a case study. Ecological Modelling 289:86–95.
Appendix A Models of population dynamics for the Svalbard population of Pink -footed Geese
15
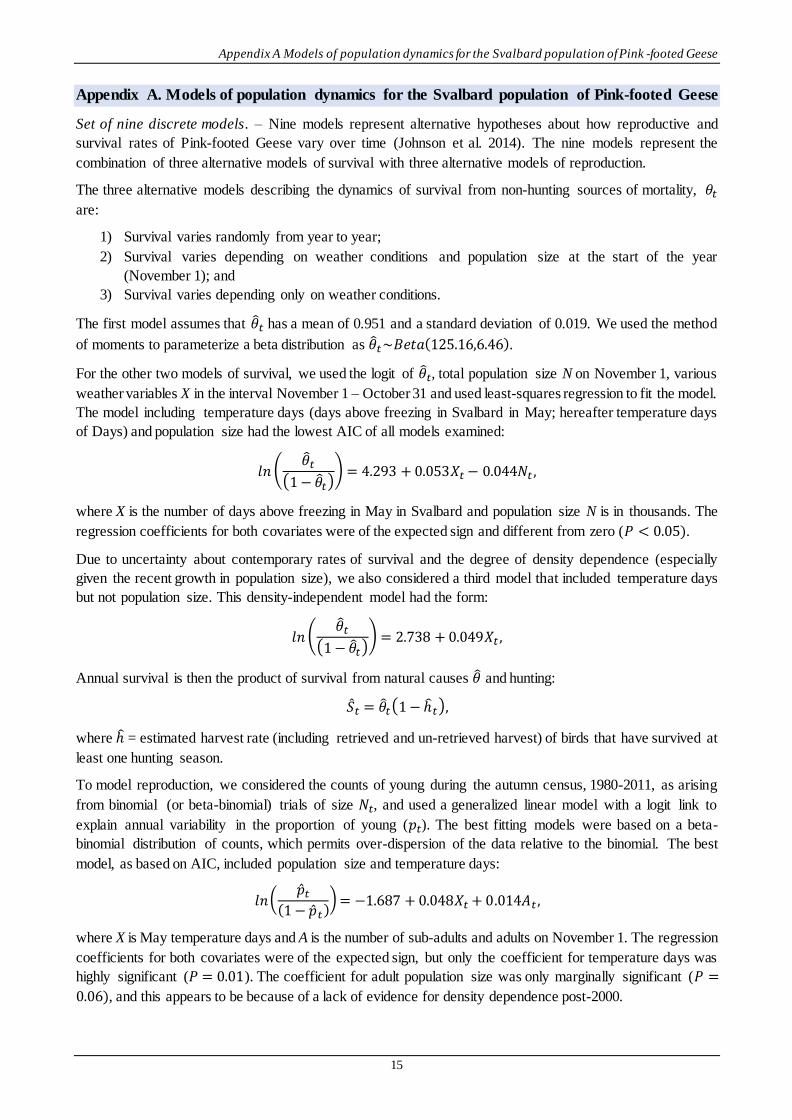
Appendix A. Models of population dynamics for the Svalbard population of Pink-footed Geese
Set of nine discrete models. – Nine models represent alternative hypotheses about how reproductive and
survival rates of Pink-footed Geese vary over time (Johnson et al. 2014). The nine models represent the
combination of three alternative models of survival with three alternative models of reproduction.
The three alternative models describing the dynamics of survival from non-hunting sources of mortality, 𝜃𝑡
are:
1) Survival varies randomly from year to year;
2) Survival varies depending on weather conditions and population size at the start of the year
(November 1); and
3) Survival varies depending only on weather conditions.
The first model assumes that �̂�𝑡 has a mean of 0.951 and a standard deviation of 0.019. We used the method
of moments to parameterize a beta distribution as �̂�𝑡~𝐵𝑒𝑡𝑎(125.16,6.46).
For the other two models of survival, we used the logit of �̂�𝑡, total population size N on November 1, various
weather variables X in the interval November 1 – October 31 and used least-squares regression to fit the model.
The model including temperature days (days above freezing in Svalbard in May; hereafter temperature days
of Days) and population size had the lowest AIC of all models examined:
𝑙𝑛 (�̂�𝑡
(1 − �̂�𝑡)) = 4.293 + 0.053𝑋𝑡 − 0.044𝑁𝑡 ,
where X is the number of days above freezing in May in Svalbard and population size N is in thousands. The
regression coefficients for both covariates were of the expected sign and different from zero (𝑃 < 0.05).
Due to uncertainty about contemporary rates of survival and the degree of density dependence (especially
given the recent growth in population size), we also considered a third model that included temperature days
but not population size. This density-independent model had the form:
𝑙𝑛 (�̂�𝑡
(1 − �̂�𝑡)) = 2.738 + 0.049𝑋𝑡 ,
Annual survival is then the product of survival from natural causes �̂� and hunting:
�̂�𝑡 = �̂�𝑡(1 − ℎ̂𝑡),
where ℎ̂ = estimated harvest rate (including retrieved and un-retrieved harvest) of birds that have survived at
least one hunting season.
To model reproduction, we considered the counts of young during the autumn census, 1980-2011, as arising
from binomial (or beta-binomial) trials of size 𝑁𝑡, and used a generalized linear model with a logit link to
explain annual variability in the proportion of young (𝑝𝑡). The best fitting models were based on a beta-
binomial distribution of counts, which permits over-dispersion of the data relative to the binomial. The best
model, as based on AIC, included population size and temperature days:
𝑙𝑛(�̂�𝑡
(1 − �̂�𝑡)) = −1.687 + 0.048𝑋𝑡 + 0.014𝐴𝑡 ,
where X is May temperature days and A is the number of sub-adults and adults on November 1. The regression
coefficients for both covariates were of the expected sign, but only the coefficient for temperature days was
highly significant (𝑃 = 0.01). The coefficient for adult population size was only marginally significant (𝑃 =
0.06), and this appears to be because of a lack of evidence for density dependence post-2000.
Appendix A Models of population dynamics for the Svalbard population of Pink -footed Geese
16
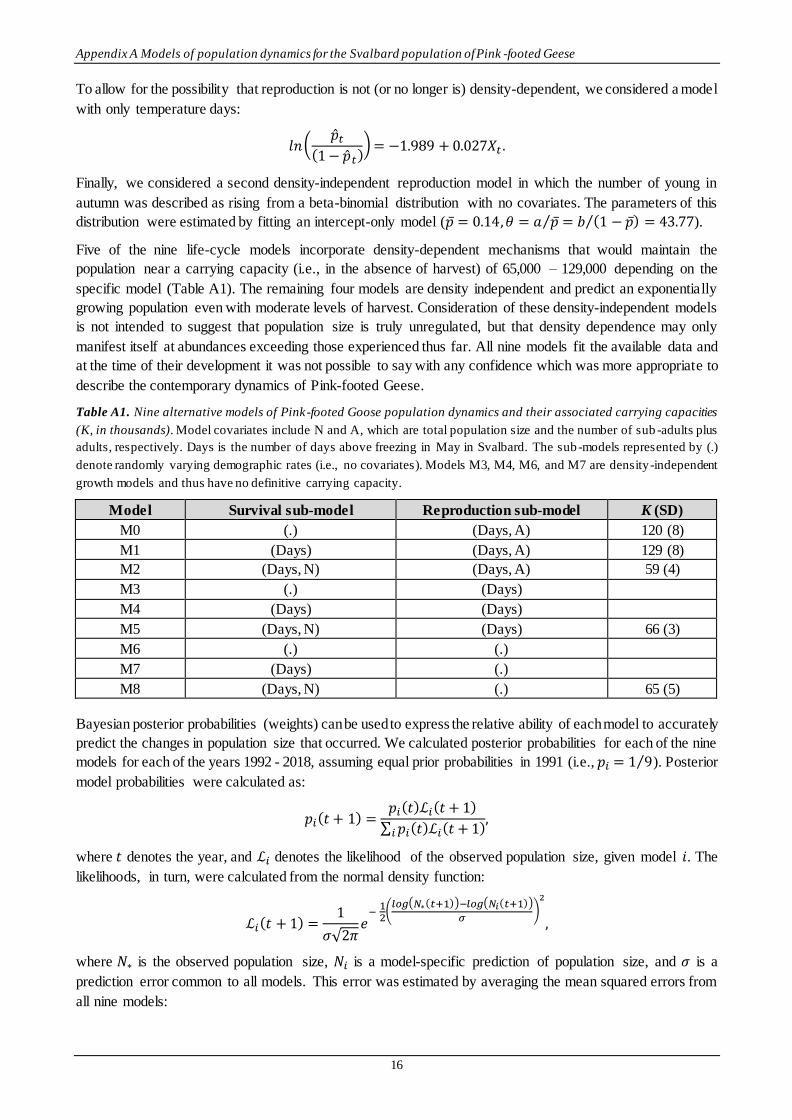
To allow for the possibility that reproduction is not (or no longer is) density-dependent, we considered a model
with only temperature days:
𝑙𝑛(�̂�𝑡
(1 − �̂�𝑡)) = −1.989 + 0.027𝑋𝑡 .
Finally, we considered a second density-independent reproduction model in which the number of young in
autumn was described as rising from a beta-binomial distribution with no covariates. The parameters of this
distribution were estimated by fitting an intercept-only model (�̅� = 0.14, 𝜃 = 𝑎 �̅�⁄ = 𝑏 (1 − �̅�)⁄ = 43.77).
Five of the nine life-cycle models incorporate density-dependent mechanisms that would maintain the
population near a carrying capacity (i.e., in the absence of harvest) of 65,000 – 129,000 depending on the
specific model (Table A1). The remaining four models are density independent and predict an exponentially
growing population even with moderate levels of harvest. Consideration of these density-independent models
is not intended to suggest that population size is truly unregulated, but that density dependence may only
manifest itself at abundances exceeding those experienced thus far. All nine models fit the available data and
at the time of their development it was not possible to say with any confidence which was more appropriate to
describe the contemporary dynamics of Pink-footed Geese.
Table A1. Nine alternative models of Pink-footed Goose population dynamics and their associated carrying capacities
(K, in thousands). Model covariates include N and A, which are total population size and the number of sub -adults plus
adults, respectively. Days is the number of days above freezing in May in Svalbard. The sub-models represented by (.)
denote randomly varying demographic rates (i.e., no covariates). Models M3, M4, M6, and M7 are density-independent
growth models and thus have no definitive carrying capacity.
Model Survival sub-model Reproduction sub-model K (SD)
M0 (.) (Days, A) 120 (8)
M1 (Days) (Days, A) 129 (8)
M2 (Days, N) (Days, A) 59 (4)
M3 (.) (Days)
M4 (Days) (Days)
M5 (Days, N) (Days) 66 (3)
M6 (.) (.)
M7 (Days) (.)
M8 (Days, N) (.) 65 (5)
Bayesian posterior probabilities (weights) can be used to express the relative ability of each model to accurately
predict the changes in population size that occurred. We calculated posterior probabilities for each of the nine
models for each of the years 1992 - 2018, assuming equal prior probabilities in 1991 (i.e., 𝑝𝑖 = 1 9⁄ ). Posterior
model probabilities were calculated as:
𝑝𝑖(𝑡 + 1) =𝑝𝑖(𝑡)ℒ𝑖(𝑡 + 1)
∑ 𝑝𝑖(𝑡)ℒ𝑖(𝑡 + 1)𝑖,
where 𝑡 denotes the year, and ℒ𝑖 denotes the likelihood of the observed population size, given model 𝑖. The
likelihoods, in turn, were calculated from the normal density function:
ℒ𝑖(𝑡 + 1) =1
𝜎√2𝜋𝑒
− 12
(𝑙𝑜𝑔(𝑁∗(𝑡+1))−𝑙𝑜𝑔(𝑁𝑖(𝑡+1))
𝜎)
2
,
where 𝑁∗ is the observed population size, 𝑁𝑖 is a model-specific prediction of population size, and 𝜎 is a
prediction error common to all models. This error was estimated by averaging the mean squared errors from
all nine models:
Appendix A Models of population dynamics for the Svalbard population of Pink -footed Geese
17
𝜎 = √∑∑ (𝑙𝑜𝑔(𝑁∗(𝑡 + 1)) − 𝑙𝑜𝑔(𝑁𝑖(𝑡 + 1)))𝑡
2
𝑚𝑛
𝑚
𝑖
= 0.11116,
where 𝑚 = 9 models and sample size for yearly comparisons at the time models were formulated was 𝑛 = 12.
This error reflects so-called process error, which is the variation in population size not explained by the models.
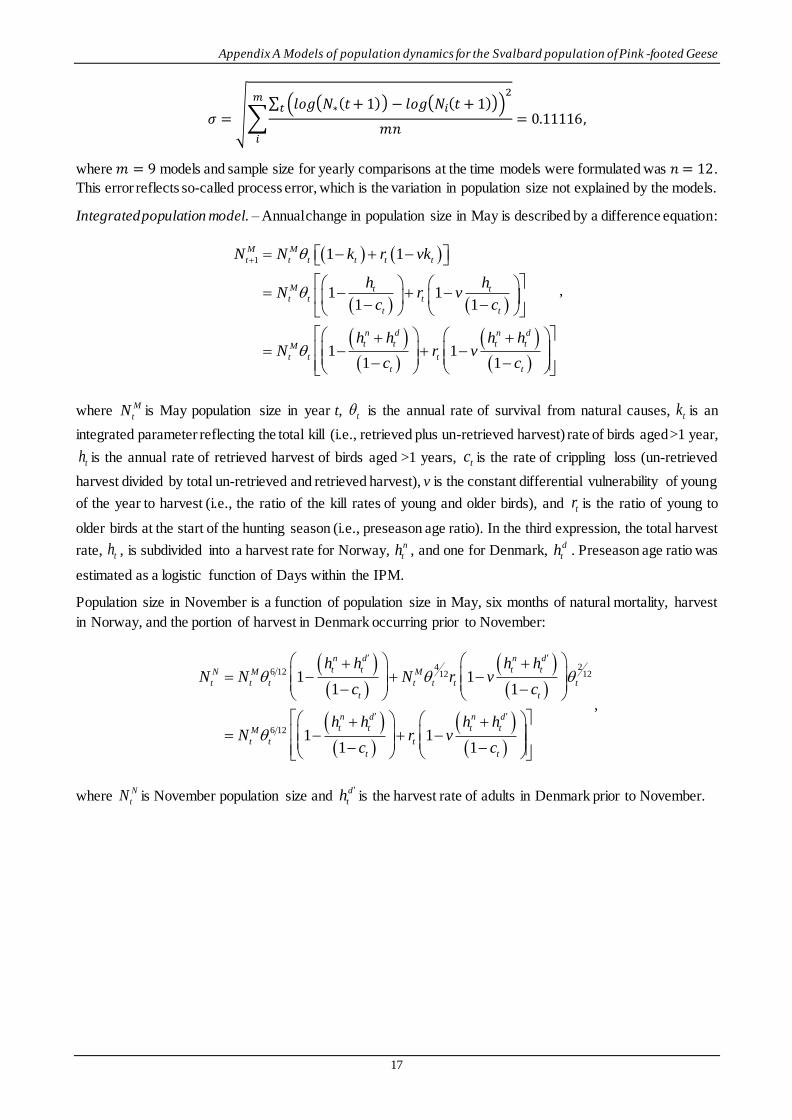
Integrated population model. – Annual change in population size in May is described by a difference equation:
( ) ( )
( ) ( )
( )( )
( )( )
1 1 1
1 11 1
1 11 1
M M
t t t t t t
M t tt t t
t t
n d n d
t t t tM
t t t
t t
N N k r vk
h hN r v
c c
h h h hN r v
c c
+ = − + −
= − + − − −
+ + = − + − − −
,
where M
tN is May population size in year t, t is the annual rate of survival from natural causes, tk is an
integrated parameter reflecting the total kill (i.e., retrieved plus un-retrieved harvest) rate of birds aged >1 year,
th is the annual rate of retrieved harvest of birds aged >1 years, tc is the rate of crippling loss (un-retrieved
harvest divided by total un-retrieved and retrieved harvest), v is the constant differential vulnerability of young
of the year to harvest (i.e., the ratio of the kill rates of young and older birds), and tr is the ratio of young to
older birds at the start of the hunting season (i.e., preseason age ratio). In the third expression, the total harvest
rate, th , is subdivided into a harvest rate for Norway, n
th , and one for Denmark, d
th . Preseason age ratio was
estimated as a logistic function of Days within the IPM.
Population size in November is a function of population size in May, six months of natural mortality, harvest
in Norway, and the portion of harvest in Denmark occurring prior to November:
( )( )
( )( )
( )( )
( )( )
4 26 12 12 12
6 12
1 11 1
1 11 1
n d n d
t t t tN M M
t t t t t t t
t t
n d n d
t t t tM
t t t
t t
h h h hN N N r v
c c
h h h hN r v
c c
+ + = − + − − −
+ + = − + − − −
,
where N
tN is November population size and d
this the harvest rate of adults in Denmark prior to November.
Appendix A Models of population dynamics for the Svalbard population of Pink -footed Geese
18
The set of difference equations for May and November population size are based on the following assumptions:
1) Natural mortality and reproduction are time-dependent;
2) Natural mortality is evenly distributed throughout the year, in spite of evidence that there may be
some minor seasonal differences (Madsen et al. 2002), and natural mortality is the same for all birds
that have survived at least one hunting season (Francis et al. 1992);
3) Hunting seasons in September and October in Norway and Denmark expose a common group of birds
to harvest (i.e., harvest does not occur sequentially, but simultaneously);
4) Young are more vulnerable to harvest than older birds and this rate of differential vulnerability is
constant;
5) The rate of crippling loss has changed over time, as reflected in the number of young carrying
embedded shot (Clausen et al. 2017b);
6) Hunters report only retrieved harvest; and
7) Harvest mortality is additive to natural mortality.
To fit the IPM we exploited the following sources of monitoring data:
1) Population count in May;
2) May population estimate based on capture-mark-recapture data;
3) Proportion of wings submitted by Danish hunters prior to the November count;
4) Proportion of young in the autumn population;
5) Total harvest in Norway, September – January;
6) Total harvest in Denmark, September – January;
7) Population count in November.
We fit the IPM using JAGS 4.3.0 (Plummer 2003), run in the R computing environment (R Core Team 2018)
using runjags (Denwood 2016). For each model we used three chains of 120,000 iterations each and retained
the last 20,000 samples from each chain for analysis. We assessed parameter convergence using the potential
scale reduction factor, psrf (Gelman and Rubin 1992), and assumed values of psrf < 1.1 indicated parameter
convergence (Gelman and Hill 2006). Full details of the IPM are provided by Johnson et al. (Ecological
Modelling, in review) and the draft manuscript is available upon request from the senior author.
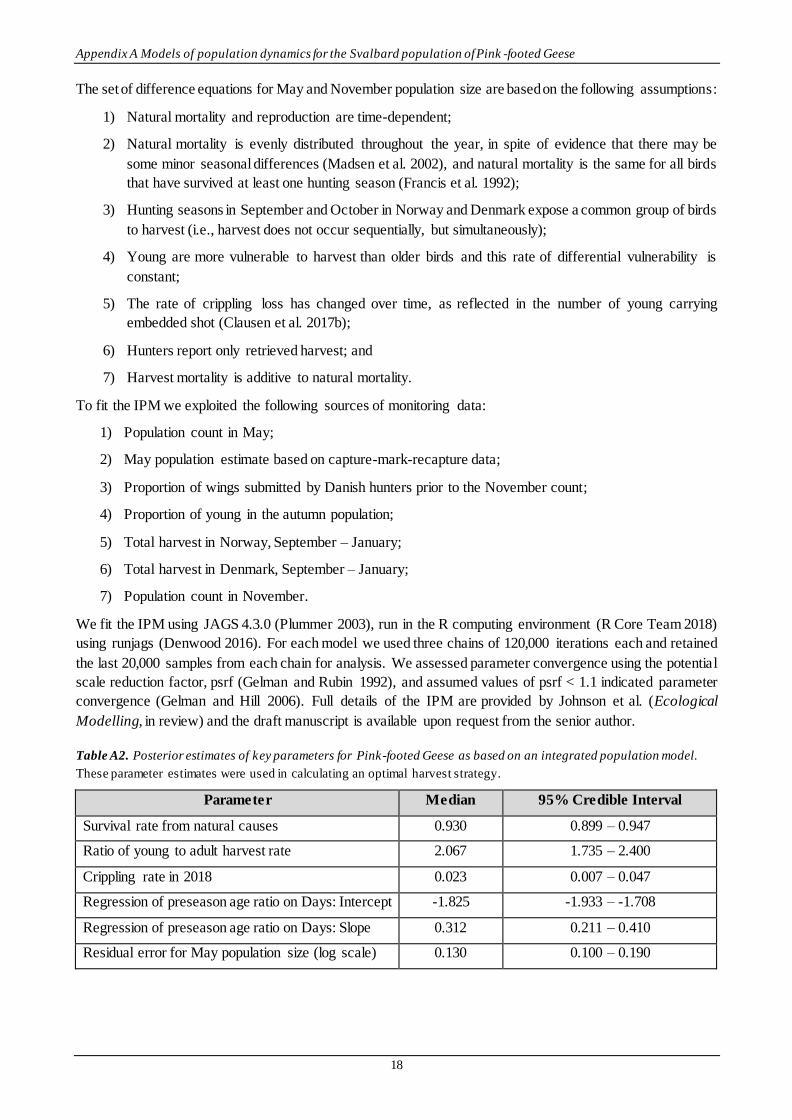
Table A2. Posterior estimates of key parameters for Pink-footed Geese as based on an integrated population model.
These parameter estimates were used in calculating an optimal harvest strategy.
Parameter Median 95% Credible Interval
Survival rate from natural causes 0.930 0.899 – 0.947
Ratio of young to adult harvest rate 2.067 1.735 – 2.400
Crippling rate in 2018 0.023 0.007 – 0.047
Regression of preseason age ratio on Days: Intercept -1.825 -1.933 – -1.708
Regression of preseason age ratio on Days: Slope 0.312 0.211 – 0.410
Residual error for May population size (log scale) 0.130 0.100 – 0.190
Appendix A Models of population dynamics for the Svalbard population of Pink -footed Geese
19
There are several reasons that there are subtle differences in the harvest strategies based on the IPM and the
original model set:
1) The 9-model set uses a goal of 60,000 for the November population and the IPM uses the same goal
for May, yet the population is at its maximum in autumn and at its minimum in spring (i.e. suggesting
that a goal for May should be lower than 60,000 for November).
2) The 9-model set assumes that the November count occurs after all the current season's harvest, an
assumption that has been increasingly violated over the period of record (P < 0.001), seriously so in
recent years.
3) The 9-model set assumes that there is a constant relationship between the preseason age ratio and the
proportion of young that are observed in autumn. This assumption breaks down for adult harvest rates
>8%, suggesting that harvest of young is higher than it is (which allows the strategy to be more liberal
because population growth is less sensitive to the number of young than the number of adults).
4) The 9-model set uses an average survival from natural causes of 0.95, which is predicted to be higher
in years with warm springs (whereas it is a constant 0.93 in the IPM).
5) The weighted average of the nine models includes some density dependence in reproduction, which
makes the strategy more liberal.
6) In the 9-model set, differential vulnerability of young is assumed to be 2. It is 2.07 in the IPM.
7) Finally, optimization of the IPM includes both observation and process error in May population size,
and this error is larger (but more accurate) than in the 9-model set; this results in a more risk-averse
harvest strategy.