Adaptive discrete choice designs Presentation held at 2008 · Adaptive discrete choice designs...
22
Adaptive discrete choice designs Presentation held at 2008 Boris Vaillant www.quantitative-consulting.eu
Transcript of Adaptive discrete choice designs Presentation held at 2008 · Adaptive discrete choice designs...

Adaptive discrete choice designs
Presentation held at 2008
Boris Vaillantwww.quantitative-consulting.eu

www.quantitative-consulting.eu 2
Product attributes
The goal of discrete choice analysis in marketing is to assess the influence of product- and service-attributes on customers’ choice behaviour
Brand
Engine
Price Consumption
HP
Transmission... Flexibility
Insulation Shielding
Control fibres
Fibres
Brand
Cross-section
Mechanical resistance
Price
Marking
Packaging
...
Efficacy
Brand
Price Application
Dosage
Side effects
Treatment duration
...

www.quantitative-consulting.eu 3
Product comparisons
In product comparison questionnaires, respondents indicate their preferred choice or purchase pattern in a series of ‘choice tasks’
Typical example:Doctors are asked to
indicate the prescription share for each of the shown treatments (e.g. for the last
10 patients with the corresponding indication)

www.quantitative-consulting.eu 4
The preference of individual customers or customer groups for the different product elements is parametrised and can be used to calculate the preference for existing or new products
Car example:
Sedan segment
Utility parameters
MB
BMW
Audi
Brand
20
0
10Utility model 1Utility model 1
-10 0 10 20 30 40 50 60
Total
Tiptronic
Medium
7 L
130 HP
34 KEUR
Audi
51
7
4
18
0
12
10
10 L
9 L
8 L
7 L
Consumption
0
7
14
18
42 KEUR
38 KEUR
34 KEUR
30 KEUR
Price
0
4
12
24
High
Medium
Base
Equipment
10
4
0
Tiptronic
Manual
Gearshift
7
0
190 HP
170 HP
150 HP
130 HP
HP
7
6
3
0
Utility model 2Utility model 2
-10 0 10 20 30 40 50 60
Total
Manual
Base
9 L
150 HP
42 KEUR
MB
30
0
0
7
3
0
20

www.quantitative-consulting.eu 5
In the marketing practice, discrete choice data often feeds larger market models in which companies can test the outcome of different strategies
Customer preferences
Demand curve and profit-optimal price
Product information● Target segments● Description of existing and
future products
Price information● Most important
products in the market● Changes in time
Market information● Market size● Market shares
Market simulationSimulation of customers
choice in scenarios Price changes New products Competitive reaction
● Customer preferences as measured via the discrete choice questionnaire
● Either individual or group preferences
● Group-wise results or aggregation of individual results
● Obtain market effects e.g. for a price change
● Determine optimal new price
Additional information from the survey
● Price barriers● Brand value● Strengths and weaknesses
Market simulation

www.quantitative-consulting.eu 6
Marketing applications: Example of a simulation tool

www.quantitative-consulting.eu 7
● Substitution effects strongly influence the optimal price decision
● Complexity of substitution decisions is best captured by models based on individual choice data
One practical challenge is the estimation of substitution (or portfolio-) effects. This often requires that the parameters of the model be estimated for each individual customer
Marketing applications: Substitution effects
50 100 150 200
050
100
150
Demand including substitutes
Price index
Dem
and
inde
x
Sales new product aloneEffects from substitute AEffects from substitute BEffects from substitute C
50 100 150 200
6080
100
120
Profit including substitutes
Price indexP
rofit
inde
x
Profit new product aloneEffects from substitute AEffects from substitute BEffects from substitute CProfit effect portfolio

www.quantitative-consulting.eu 8
Creating optimal bundles is another area which requires knowledge of the individual preferences
● Testing of bundling scenarios leads to the best bundles to sell and their optimal price
● Individual preferences and WTP for the different products are estimated in a discrete choice study
● From this, one can estimate which products customers will purchase and in which combination
Marketing applications: Bundling
Demand for equipment X and Y
WTP equipment X
WTP
equ
ipm
ent Y
Effect of bundlingPrice of XPrice of YPrice of bundle (X+Y)
Customer buys moreCustomer buys lessNo change
0 2000 4000 6000 8000
050
010
0015
00
Profit of equipment bundle
Price of bundle
Pro
fit o
f bun
dle
Profit equipment XProfit equipment YPrice X + Price YPrice of bundle (X+Y)

www.quantitative-consulting.eu 9
Goals of optimal discrete choice design
The goal of discrete choice design is to minimise the error of parameter estimates while keeping respondent burden at a minimum
Respondents● Reduce task complexity● Reduce number of choice
tasks● Avoid respondent fatigue
Consultant Obtain reliable and valid results Have a variety of design options
Study sponsor Reduce cost and
obtain reliable and valid results

www.quantitative-consulting.eu 10
Discrete choice modelling

www.quantitative-consulting.eu 11
Classical design criteria (1)

www.quantitative-consulting.eu 12
Classical design criteria (2)

www.quantitative-consulting.eu 13
Bayesian adaptive design (1)
www.quantitative-consulting.eu 14
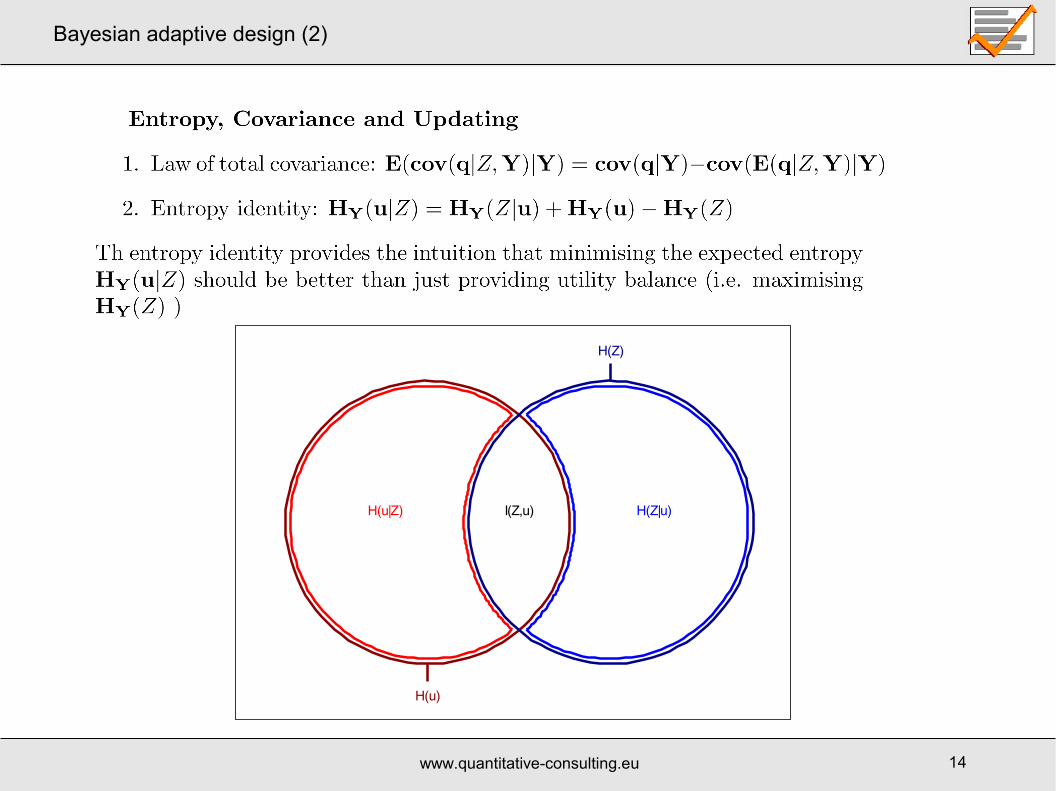
Bayesian adaptive design (2)
H(u)
H(u|Z)
H(Z)
H(Z|u)I(Z,u)

www.quantitative-consulting.eu 15
Sequential Monte Carlo (1)
www.quantitative-consulting.eu 16
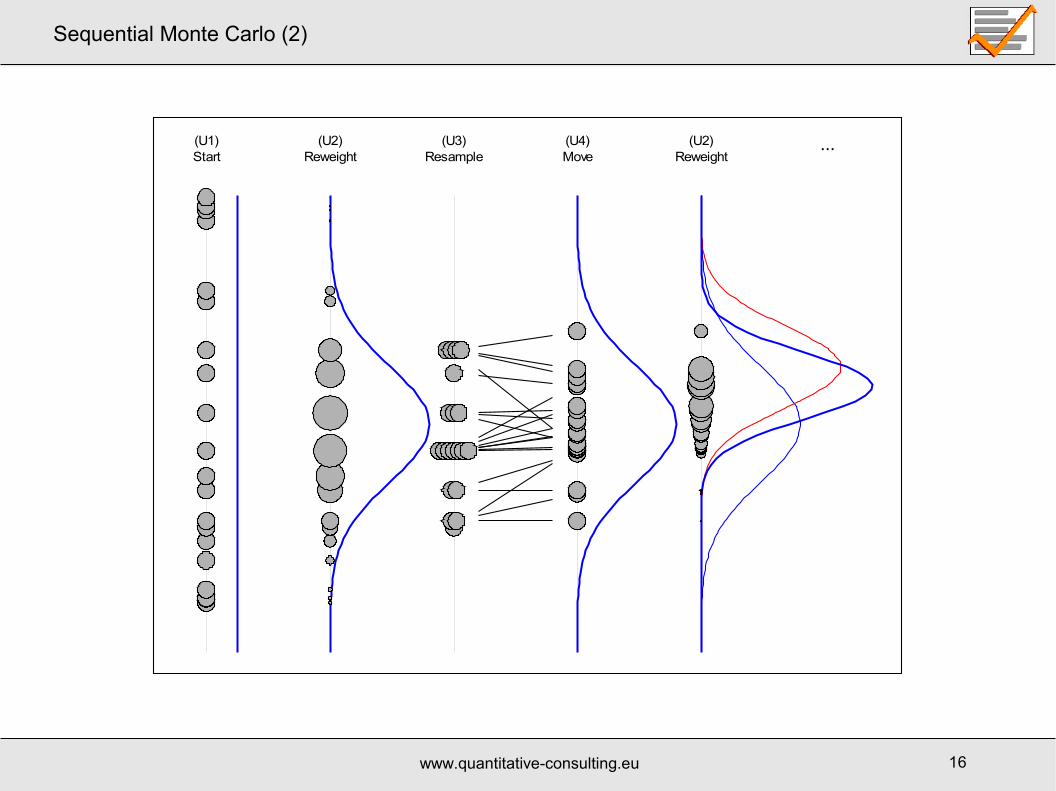
Sequential Monte Carlo (2)
(U1)Start
(U2)Reweight
(U3)Resample
(U4)Move
(U2)Reweight
...

www.quantitative-consulting.eu 17
R-implementation
We created a test-suite in R to compare the different design strategies in simulations. Our tests are based on a typical scenario from pharmaceutical market research
This is a typical scenario from pharmaceutical market research. Here, doctors are asked to estimate the prescription share of each of the presented treatments. Compared to simple choice questions, this provides sufficient information for individual-level estimation

www.quantitative-consulting.eu 18
Results (1)
B1 Det B2 Max B3 Ent B5 Simple Fixed Random
0.0
0.1
0.2
0.3
0.4
0.5
RMSE for Utilities
M=0.248P=2e-04
M=0.254P=0.002
M=0.253P=0.001
M=0.269P=0.2
M=0.282P=NA
M=0.32P=3e-05
5 10 15 20
0.3
0.4
0.5
0.6
0.7
0.8
RMSE vs. # questions
# of questions
RM
SE
B1 DetB2 MaxB3 EntB5 SimpleFixedRandom

www.quantitative-consulting.eu 19
Results (2)
Det Max Ent Sim Fix Rnd
0.10
0.15
0.20
0.25
0.30
0.35
0.40
ML D-criterion: Avg SE
-2 -1 0 1 2
-3
-2
-1
0
1
2
3Bias of estimates
'True' values
Est
imat
ed v
alue
s
Bias factorsB1 Det : 1.108B2 Max : 1.088B3 Ent : 1.102B5 Simple : 1.102Fixed : 1.067Random : 1.016

www.quantitative-consulting.eu 20
Performance
1000 5000 10000 20000 40000
0.0
0.1
0.2
0.3
0.4
0.5
0.6
0.7
RMSE vs. MC sample size and processing time
MC sample size
RM
SE
Update=0.45 s Select=0.51 s
Update=2.5 s Select=2.7 s
Update=5.2 s Select=5.8 s
Update=11 s Select=13 s
Update=22 s Select=24 s
M=0.278P=NA
M=0.248P=0.002
M=0.263P=0.1
M=0.241P=1e-04
M=0.242P=2e-04

www.quantitative-consulting.eu 21
References (1)

www.quantitative-consulting.eu 22
References (2)


![Building Adaptive Designs Now [UI17]](https://static.fdocuments.in/doc/165x107/54c70c5b4a79593f288b4653/building-adaptive-designs-now-ui17.jpg)