ADAPTIVE DESIGNS FOR PHASE III STUDIES - ars … · ars statistica: adaptive phase iii trials 1...
17
ARS STATISTICA: ADAPTIVE PHASE III TRIALS 1 ADAPTIVE DESIGNS FOR PHASE III STUDIES : A BRIEF INTRODUCTION Ars Statistica S.P.R.L. - Fils Jean-François Boulevard des Archers, 40 1400 Nivelles Tel: 0476/316.048 E-Mail: [email protected]
Transcript of ADAPTIVE DESIGNS FOR PHASE III STUDIES - ars … · ars statistica: adaptive phase iii trials 1...

ARS STATISTICA: ADAPTIVE PHASE III TRIALS 1
ADAPTIVE DESIGNS FOR PHASE III STUDIES : A BRIEF INTRODUCTION
Ars Statistica S.P.R.L. - Fils Jean-François
Boulevard des Archers, 40
1400 Nivelles
Tel: 0476/316.048
E-Mail: [email protected]

ARS STATISTICA: ADAPTIVE PHASE III TRIALS 2
Table of Contents
1. Introduction ..................................................................................................................... 3
2. Definition, Rationale and allowed modifications ............................................................ 3
2.1. Definition ........................................................................................................................ 3
2.2. Rationale .......................................................................................................................... 3
2.3. Most common modifications ........................................................................................... 4
3. Basics of Group Sequential Design Theory .................................................................... 4
3.1. Alpha, Beta and Power .................................................................................................... 4
3.2. Distributional assumptions .............................................................................................. 5
3.3. Hypotheses testing, alpha, beta and theta: example of a superiority trial ....................... 5
4. Choices to be made for the design of the adaptive trial .................................................. 5
4.1. Non-inferiority or superiority .......................................................................................... 5
4.2. Number of interim analyses ............................................................................................ 6
4.3. Stopping boundaries ........................................................................................................ 6
4.4. Early Boundary ............................................................................................................... 6
4.5. Stopping rules – sample size ........................................................................................... 7
4.5.1. Haybittle-Peto test .................................................................................................... 7
4.5.2. Pocock’s test ............................................................................................................ 7
4.5.3. O’Brien and Fleming test ......................................................................................... 8
4.5.4. Wang and Tsiatis test ............................................................................................... 8
4.5.1. Which test to choose? .............................................................................................. 9
4.6. Alpha and Beta Spending Functions ............................................................................. 11
4.6.1. Alpha Spending Functions (efficacy) .................................................................... 11
4.6.2. Beta Spending Functions (futility) ......................................................................... 12
5. During the adaptive trial: at interim analysis ................................................................ 14
5.1. Recalculate the sample size ........................................................................................... 14
5.2. Conditional/Predictive power ........................................................................................ 14
5.3. Switch between superiority/non-inferiority................................................................... 15
6. Bibliography .................................................................................................................. 16

ARS STATISTICA: ADAPTIVE PHASE III TRIALS 3
1. Introduction
An adaptive design is a clinical study design that uses accumulating data to decide on how to
modify aspects of the study as it continues, without undermining the validity and integrity of
the trial (Chow & Chang, 2011). Such methodology is available for phase I (e.g.: continual
reassessment method for dose-finding clinical trials), phase II (e.g.: Simon’s two-stage design),
phase II/III (e.g.: adaptive seamless phase II/III designs) and phase III designs (e.g.: group
sequential methods). The aim of this report is to present an overview of adaptive designs in
clinical trials with a focus on phase III adaptive designs.
2. Definition, Rationale and allowed modifications
2.1. Definition
An adaptive design is a clinical study design that uses accumulating data to decide how to
modify aspects of the study as it continues, without undermining the validity and integrity of
the trial. The goal of adaptive designs is to learn from the accumulating data and to apply what
is learned as quickly as possible. In such trials, changes are made “by design,” and not on an ad
hoc basis; therefore, adaptation is a design feature aimed to enhance the trial, not a remedy for
inadequate planning (Galo et al., 2006).
2.2. Rationale
Adaptive designs allow also to change the study hypotheses, such as (1) switching for
superiority to non-inferiority; (2) switch from a single hypothesis to a multiple hypothesis or a
combined outcome; (3) changing hypotheses due to the switch in study endpoints; (4) dropping
ineffective treatment arms; (5) interchange between the null and the alternative hypothesis; (6)
stop the trial earlier for futility or efficacy (Chow & Chang, 2011). Indeed, at the beginning of
the clinical trial, the investigator may not have adequate information about the effect size of the
treatment, and rather than to continue to conduct an inappropriate powered trial, the sponsor
may wish to modify the sample size or stop the clinical trial when there is enough convincing
evidence of benefit (=efficacy) or harm (=futility) (Friedman, Fureberg & DeMets, 2010).
Moreover, adaptive designs are well suited for economical purposes: they allow an earlier
termination of the trial. If the results are positive, the compound/treatment may be exploited
sooner and if the results are negative, the resources are not wasted (Chow & Chang, 2011).

ARS STATISTICA: ADAPTIVE PHASE III TRIALS 4
2.3. Most common modifications
Adaptations or modifications of on-going clinical trials that are commonly made to trial
procedures include eligibility criteria, study dose or regimen, treatment duration, study
endpoints, laboratory testing procedures, diagnostic procedures, criteria for evaluability,
assessment of clinical responses, deletion/addition of treatment groups, and safety parameters.
In practice, during the conduct of the clinical trial, statistical procedures including
randomization procedure in treatment allocation, study objectives/hypotheses, sample size
reassessment, study design, data monitoring and interim analysis procedure, statistical analysis
plan, and/or methods for data analysis are often adjusted in order to increase the probability of
success of the trial by controlling the pre-specified type I error.
3. Basics of Group Sequential Design Theory
3.1. Alpha, Beta and Power
The remaining of the report will use notions of Type I error (= alpha), Type-II error (beta) and
power. It is therefore time to formally define these concepts. We define H0 as the null hypothesis
of no treatment differences between two treatments groups on a proportion, continuous
variables or time to event.
H0 true H0 false
Reject H0 Type I error (α)
False positive
Correct outcome
True positive
Fail to reject H0 Correct outcome
True negative
Type II error (β)
False negative
Based on the above table, we define (on the left) and depict graphically (on the right) the
concepts of alpha, beta and power as:
α: rejection of H0 when it is true
β: accept H0 when H0 is false
power (1-β): Probability to reject
H0 when H0 is false

ARS STATISTICA: ADAPTIVE PHASE III TRIALS 5
3.2. Distributional assumptions
Mathematically, group sequential design is defined as such: let X1, X2,… be independent and
identically distributed random variables with mean θ and variance 1. For some positive integer,
let n1< n2… nk represent fixed sample size where data will be analysed and inference surrounding
𝜃 = (�̅�𝐴𝑖 − �̅�𝐵𝑖) will be examined. The first k-1 analyses are the interim analyses and the kth
analysis corresponds to the final analysis. For i=1,2,…,k, consider the following statistics:
𝑍𝑖 = (�̅�𝐴𝑖 − �̅�𝐵𝑖) ∗ (𝑛𝑖/2𝜎2)
3.3. Hypotheses testing, alpha, beta and theta: example of a superiority
trial
We take example of a superiority trial. The primary hypothesis is:
- H0: θ ≤0 vs H1: θ >0
- α=0.025; β=0.10 at a fixed θ
- Upper bounds stop the trial for
efficacy
- Lower bounds stop the trial for
futility
The figure on the right identifies for a given θ the critical values at which, for each interim
analyses (here 4) and final analysis the null hypothesis of no difference on the primary outcome
between the treatment groups.
4. Choices to be made for the design of the adaptive trial
4.1. Non-inferiority or superiority
Group sequential methods are available to test non-inferiority or superiority (=equality)
hypotheses. Moreover, as already indicated, switch between superiority and non-inferiority
during the trial is possible (Chow & Chang, 2011; Lai, Shih & Zhu, 2004) but the choice of the
non-inferiority margin is crucial in this context (Chow & Chang, 2011).

ARS STATISTICA: ADAPTIVE PHASE III TRIALS 6
4.2. Number of interim analyses
The number of interim analyses has to be determined by the sponsor and the statistical tests are
performed based on accrued data at some pre-specified interval rather than after every new
observation is obtained. The higher the number of interim analyses, the higher the final sample
size. However, there is little advantage to plan a large number of interim analyses (the sample
sizes are small, certainly at the beginning of the trial, and the variability of the data high, making
decision based on only a few interim data extremely difficult). As a general rule of thumb,
Pocock (1988) recommends never to plan more than 5 interim analysis but at least 1, in order
to warrant scientific and ethical validity of the trial.
4.3. Stopping boundaries
Stopping boundaries consist of a set of critical values that the test statistics calculated from
actual data will be compared with to determine whether the trial should be terminated or
continue. In other words, if the observed sample mean at a given stage falls outside the
boundaries, we will terminate the trial; otherwise the trial continues.
4.4. Early Boundary
Four commonly used boundary scales are used to construct the stopping boundaries: the
standardized z-statistic (presented in 3.2), the sample-mean scale, the error-spending scale and
the sum-mean scale. The z-statistics is commonly used by statistical programs such as the
gsDesign R Package (Anderson, 2011).

ARS STATISTICA: ADAPTIVE PHASE III TRIALS 7
4.5. Stopping rules – sample size
Several stopping rules have been developed. We present four of them, appearing the most in
the statistical and medical literature on group sequential designs: the Peto, Pocock, O’Brien &
Fleming and Wang & Tsiatis test.
4.5.1. Haybittle-Peto test
The test developed by Haybittle (1971) and Peto et al. (1976) uses a very large critical value to
stop the clinical trial earlier: stop if an interim analysis indicates probability of 0.001 (=Type I
error) that the treatment are different.
The Haybittle-Peto’s test may be expressed as:
1) After group k=1,…,K-1,
a. If |Zk| > 3 then stop, reject H0;
b. Otherwise continue to group k+1.
2) After group K,
a. If |ZK| > CHP(K,α) then stop, reject H0;
b. Otherwise stop, accept H0.
4.5.2. Pocock’s test
The test developed by Pocock (1977) is done at a same nominal level of alpha over the course
of the clinical trial. If CP(K,α) denotes the critical value for having an overall type I error of rate
α, the Pocock’s test may be expressed as:
1) After group k=1,…,K-1,
a. If |Zk| > CP(K,α) then stop, reject H0;
b. Otherwise continue to group k+1.
2) After group K,
a. If |ZK| > CP(K,α) then stop, reject H0;
b. Otherwise stop, accept H0.
The critical value CP(K,α) depends only of the pre-specified type I error (α) and the number of
interim analyses. The power of the above test procedure can be determined by the number of
planned interim analyses (K), the type I error (α), the type II error (β) and the proportion
between σ² and δ² (i.e., σ²/δ²), where δ is |µ1- µ2|.

ARS STATISTICA: ADAPTIVE PHASE III TRIALS 8
4.5.3. O’Brien and Fleming test
If the Pocock’s test is straightforward and simple, it is performed at a constant nominal level.
O’Brien and Fleming (1979) proposed a test, also based on the standardized statistics Zk, where
it is more difficult to reject the null H0 at earlier stages of the analysis. This test increases the
nominal significance for rejecting H0 at each analysis as the study progresses and is defined as:
1) After group k=1,…,K-1,
a. If |Zk| > CB(K,α)√𝐾/𝑘 then stop, reject H0;
b. Otherwise continue to group k+1.
2) After group K,
a. If |ZK| > CB(K,α) then stop, reject H0;
b. Otherwise stop, accept H0.
The value of CB(K,α) is chosen to ensure that the over type I error is α.
4.5.4. Wang and Tsiatis test
Wang and Tsiatis’s test includes the Pocock and O’Brien and Fleming as special cases. The
procedure may be summarized as follows:
1) After group k=1,…,K-1,
a. If |Zk| > CW(K,α,Δ)(k/K)Δ-1/2 then stop, reject H0;
b. Otherwise continue to group k+1.
2) After group K,
a. If |ZK| > CW(K,α,Δ) then stop, reject H0;
b. Otherwise stop, accept H0.
The Wang-Tsiatis’s test reduces to Pocock’s test when Δ=0.5 and to the O’Brien and Fleming
test when Δ=0.

ARS STATISTICA: ADAPTIVE PHASE III TRIALS 9
4.5.1. Which test to choose?
Here is a comparison table presenting the advantages and disadvantage of each design seen in
the above section (Wang and Tsiatis is between O’Brien & Fleming and Pocock)
Advantages Disadvantages
Haybittle-Peto 1) Simple to use
2) Results in final critical
values close to critical
values for fixed-sample
test
1) Impossible to find CHP
achieving the desired Type-
I error rate for some
combinations of α and K
(when α is small and K
large)
O’Brien &
Fleming
1) Final critical value is close
to critical value for a
fixed-sample design
2) More powerful than
Pocock, requiring then a
smaller maximum sample
size
1) Less likely to stop early
than Pocock boundaries,
which implies a larger
expected sample size
Pocock 1) Simple to use
2) Lower probability to stop
early, which implies a
smaller expected sample
size
1) Substantial reduction in
power
The O’Brien and Fleming test is unlikely to lead to stop for efficacy in early stages of the
clinical trial. Later on, it leads to a higher chance of stopping for efficacy than the other two
designs. The O’Brien and Fleming boundaries avoid the awkward situation of accepting the
null hypothesis when the observed statistic at the end of the clinical trial is much larger than the
conventional critical value (i.e., 1.96 for a two-sided 5% significance level). As seen earlier,
the large critical value for the O’Brien and Fleming boundary can be adjusted to a lower value
(e.g., 3.5) by means of the Wang-Tsiatis boundary without noticeably changing the critical
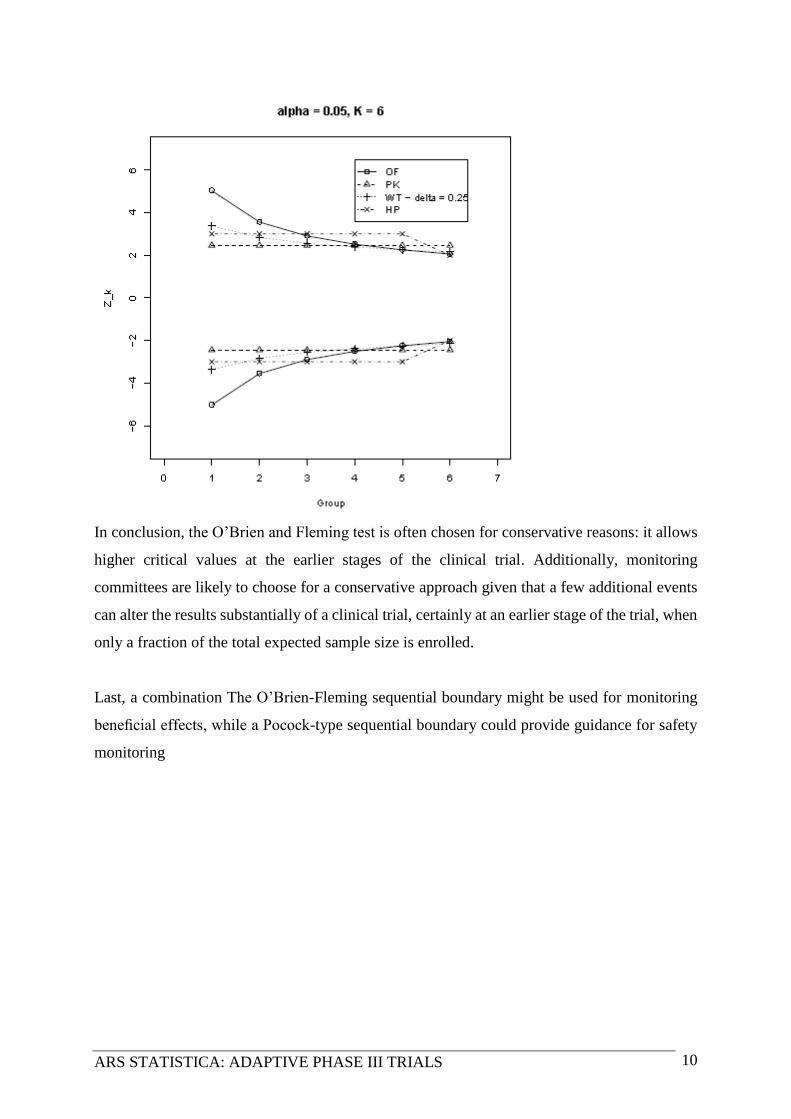
values used later on, including the final value. Last, the O’Brien and Fleming design requires
the lower sample size. The next graph presents the N and upper bounds for a fictitious clinical
trial for a same nominal level of type I error (α) and 5 interim analyses and a final analysis.
ARS STATISTICA: ADAPTIVE PHASE III TRIALS 10
In conclusion, the O’Brien and Fleming test is often chosen for conservative reasons: it allows
higher critical values at the earlier stages of the clinical trial. Additionally, monitoring
committees are likely to choose for a conservative approach given that a few additional events
can alter the results substantially of a clinical trial, certainly at an earlier stage of the trial, when
only a fraction of the total expected sample size is enrolled.
Last, a combination The O’Brien-Fleming sequential boundary might be used for monitoring
beneficial effects, while a Pocock-type sequential boundary could provide guidance for safety
monitoring

ARS STATISTICA: ADAPTIVE PHASE III TRIALS 11
4.6. Alpha and Beta Spending Functions
4.6.1. Alpha Spending Functions (efficacy)
A major disadvantage of group sequential methods is that they are designed for a fixed number
of equally spaced interim analyses. However, in practice, it is common to plan interim analyses
based on calendar and, as a consequence, interim analyses may not be equally spaced.
Therefore, the overall type I error (α) may be far away from the target value.
To overcome this problem, Lan & DeMets (1983; 1995) proposed to distribute (or spend) the
total probability of false positive risk (= type I error = α) as a continuous function of the
information time in group sequential procedures for interim analyses. If the total information
scheduled to accumulate over the maximum duration T is known, the boundaries can be
computed as a continuous function of the information time, which is referred as the alpha
spending function, denoted by α(s). The alpha spending function is an increasing function of
information time: it equals 0 when information time is 0 and it equals the overall significance
level when information time is 1. In other words, α(0)=0 and α(1)= α. Let s1 and s2 be two
information times, 0< s1< s2 ≤1 and denote α(s1) and α(s2) be their corresponding value of alpha
spending function at information time s1 and s2. Then, 0< α(s1)< α(s2) ≤1 is the probability of
type I error (alpha) one wishes to spend at information time s1.
Here are the alpha spending functions proposed by Lan & DeMets (1983)
α1(s) = 2{1-Φ(zα/2/√2)} O’Brien-Fleming
α2(s) = α log[1+(e-1)s] Pocock
α3(s) = αsρ, ρ>0 Lan-DeMets-Kim
α4(s) = α[(1-eζs)/(1-eζ)], ζ≠0 Hwang-Shih
Sample size calculation for Lan-DeMets’s alpha spending function are also available and ,
although alpha spending function does not require a fixed maximum number and equally spaced
interim analyses, it is necessary to make those assumptions in order to calculate the sample size
under the alternative hypothesis.
ARS STATISTICA: ADAPTIVE PHASE III TRIALS 12
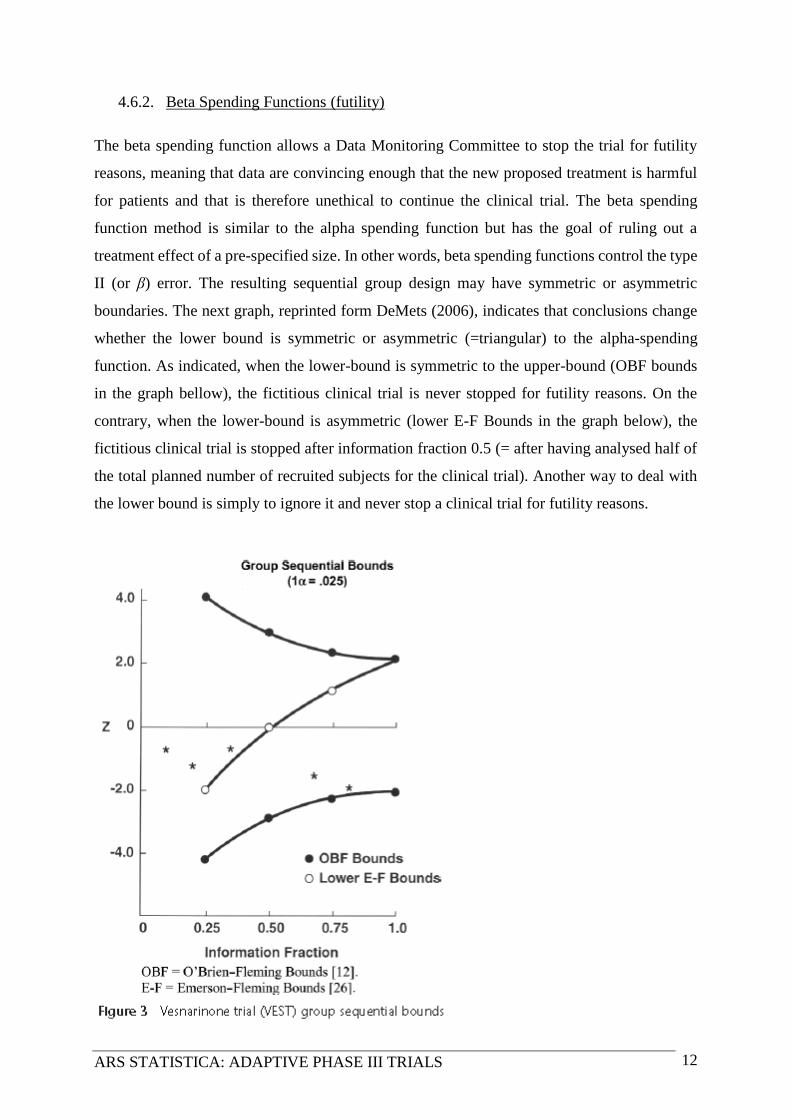
4.6.2. Beta Spending Functions (futility)
The beta spending function allows a Data Monitoring Committee to stop the trial for futility
reasons, meaning that data are convincing enough that the new proposed treatment is harmful
for patients and that is therefore unethical to continue the clinical trial. The beta spending
function method is similar to the alpha spending function but has the goal of ruling out a
treatment effect of a pre-specified size. In other words, beta spending functions control the type
II (or β) error. The resulting sequential group design may have symmetric or asymmetric
boundaries. The next graph, reprinted form DeMets (2006), indicates that conclusions change
whether the lower bound is symmetric or asymmetric (=triangular) to the alpha-spending
function. As indicated, when the lower-bound is symmetric to the upper-bound (OBF bounds
in the graph bellow), the fictitious clinical trial is never stopped for futility reasons. On the
contrary, when the lower-bound is asymmetric (lower E-F Bounds in the graph below), the
fictitious clinical trial is stopped after information fraction 0.5 (= after having analysed half of
the total planned number of recruited subjects for the clinical trial). Another way to deal with
the lower bound is simply to ignore it and never stop a clinical trial for futility reasons.

ARS STATISTICA: ADAPTIVE PHASE III TRIALS 13
Therefore, 6 possibilities exist to cross the alpha and beta spending boundaries:
1) A one-sided design: this design ignores the lower-bound
2) A two-sided, symmetric design: this design has symmetric upper and lower bounds
3) A two-sided, asymmetric, beta-spending with bending lower bound
4) A two-sided, asymmetric, beta-spending with non-bending lower bound
5) A two-sided, asymmetric, lower bound spending under the null hypothesis with bending
lower bound
6) A two-sided, asymmetric, lower bound spending under the null hypothesis with non-
bending lower bound
The beta-spending function controls the incremental amount of the Type-II error at each
analysis. Under the null hypothesis, the lower bounds are lower, allowing a larger indecision
region. The left graph presents a beta-spending lower bound and the right one depicts a lower
bound under the null hypothesis.
For possibilities 1, 2 and 5, boundaries can be computed in a single step just by knowing the
cumulative proportion of the final planned statistical information (sample size/number of
events) at each analysis that is specified using the timing input variable. For possibility 6, the
upper and lower boundaries are computed separately and independently using these same

ARS STATISTICA: ADAPTIVE PHASE III TRIALS 14
methods. For possibilities 1, 2, 5 or 6 the total sample size is then set to obtain the desired power
under the alternative hypothesis by using a root finding algorithm.
For possibilities 3 and 4 sample size and bounds are set simultaneously using an iterative
algorithm which makes the computation slightly more complex than the above.
5. During the adaptive trial: at interim analysis
5.1. Recalculate the sample size
Recalculation of the sample size at interim analyses is desirable in order to determine whether
the selected sample size is justifiable based on clinical data accumulated up to the time point of
interim analysis. Note that the FDA will not accept to decrease the sample size in the course of
the trial for safety data reasons (CDER, 2010). Unblinding the treatment codes for sample size
re-estimation may introduce bias in the clinical trial. Shih (1993) and Shih & Zhao (1997)
proposed a methodology without unblinding the treatment codes for interim data where at least
50% of the planned sample size complete the trial for double-blind clinical trials with binary
outcomes. The procedure is in X steps:
1) Within each center, assign randomly each subject to a dummy stratum (e.g.: A or B),
and the randomization is not done on baseline characteristics of subjects
2) Subjects within each stratum are the randomly assigned to a treatment group with a
probability π or to the control group with the probability 1- π (π Є (0, 0.5).
3) Based on the pooled event rates, evaluate p1 and p2 without unblinding the treatment
codes
5.2. Conditional/Predictive power
Conditional/Predictive power at an interim analysis – the first is frequentist and the second
Bayesian - is defined as the power of rejecting the null hypothesis at the end of the trial
conditional on the observed data accumulated up to the time point of the planned interim
analysis. Indeed, if the data at interim analysis indicate a strong evidence of futility, it is
unethical to continue the trial and therefore, the trial may be stopped under the null hypothesis.
Most repeated significance tests (Pocock, O’Brien and Fleming and Wang and Tsiatis) are
designed for early stop under the alternative hypothesis, and, for them, the analysis of
conditional power can be used as a quantitative method for determining whether the trial should
be terminated prematurely.

ARS STATISTICA: ADAPTIVE PHASE III TRIALS 15
5.3. Switch between superiority/non-inferiority
In order to increase the probability of success of the trial, it is not uncommon to switch from
superiority to non-inferiority (Chow & Chang, 2011) and one of the major consideration is
therefore the choice of the non-inferiority margin which should be based on sound clinical
reasoning and statistical judgment (ICH E10 guideline). As indicated in Chow & Chang, 2011,
pp. 78-79:
“According to the ICH E10 Guideline, a non-inferiority margin may be selected based on past
experience in placebo control trials with valid design under conditions similar to those planned
for the new trial, and the determination of a non-inferiority margin should not only reflect
uncertainties in the evidence on which the choice is based, but also be suitably conservative.
Furthermore, as a basic frequentist statistical principle, the hypothesis of non-inferiority should
be formulated with population parameters, not estimates from historical trials. Along these
lines, Chow and Shao (2006) proposed a method of selecting non-inferiority margins with some
statistical justification. Chow and Shao proposed non-inferiority margin depends on population
parameters including parameters related to the placebo control if it were not replaced by the
active control. Unless a fixed (constant) non-inferiority margin can be chosen based on clinical
judgment, a fixed non-inferiority margin not depending on population parameters is rarely
suitable. Intuitively, the non-inferiority margin should be small when the effect of the active
control agent relative to placebo is small or the variation in the population under investigation
is large. Chow and Shao’s approach ensures that the efficacy of the test therapy is superior to
placebo when non-inferiority is concluded. When it is necessary/desired, their approach can
produce a non-inferiority margin that ensures that the efficacy of the test therapy relative to
placebo can be established with great confidence.”

ARS STATISTICA: ADAPTIVE PHASE III TRIALS 16
6. Bibliography
Anderson, K. M. (2011). gsDesign: an R package for designing group sequential clinical trials.
Version 2.3 Manual. 1-108.
Center for Drug Evaluation and Research (CDER); Center for Biologics Evaluation and
Research (CBER) (February 2010). Adaptive Design Clinical Trials for Drugs and Biologics.
Food and Drug Administration.
Chow, S-C & Chang, M. (2011). Adaptive Design Methods in Clinical Trials. Chapman &
Hall/Crc Biostatistics Series.
Chow, S-C, Shao, J. & Wang, H. (2008). Sample Size Calculations in Clinical Research, Second
Edition. Chapman & Hall/Crc Biostatistics Series.
DeMets, D.L. (2006). Futility approaches to interim monitoring by data monitoring committees.
Clinical Trials, 3, 522-526.
DeMets, D.L. & Lan, K.K.L. (1995). The alpha spending function approach to interim data
analyses. Recent Advances in Clinical Trial Design and Analysis Cancer Treatment and
Research, 75, 1-27.
Friedman, L. M., Fureberg, C. D. & DeMets, D. L. (2010). Fundamentals of Clinical Trials.
Fourth Edition. New York, NY: Springer.
Gallo, P., Chuang-Stein, C., Dragalin, V., Gaydos, B., Krams, M. & Pinheiro, J. (2006)
Adaptive designs in clinical drug development: An executive summary of the PhRMA working
group. Journal of Biopharmaceutical Statistics, 16, 275–283.
Haybittle J.L. (1971). Repeated assessments of results in clinical trials of cancer treatment. British
Journal of Radiology, 44, 793-797.

ARS STATISTICA: ADAPTIVE PHASE III TRIALS 17
Lan, K.K.G. & DeMets, D.L. (1983). Discrete sequential boundaries for clinical trials.
Biometrika, 70, 659-663.
Lai, T.L., Shih, M.-C. & Shu, G. (2004). Efficient group sequential tests for superiority and
non-inferiority hypotheses in clinical trials. Standford University, Departement of Statistics:
Technical report N° 2004-22.
O’Brien, P.C. & Fleming, T.R. (1979). A multiple testing procedure for clinical trials.
Bimoetrics, 35, 549-556.
Peto, R., Pike, M.C., Armitage, P., et al. (1976). Design and analysis of randomized clinical
trials requiring prolonged observation of each patient. I. Introduction and design. British Journal
of Cancer, 34, 585-612.
Pocock, S. J. (1977). Group sequential methods in the design and analysis of clinical trials.
Biometrika, 64, 191-199.
Pocock S. J. (1988). Clinical Trials. A Practical Approach. New York, Wiley
R Core Team (2013). R: A language and environment for statistical computing. R Foundation
for Statistical Computing, Vienna, Austria. ISBN 3-900051-07-0, URL http://www.R-
project.org/.
Shih, J.H. (1993). Sample size re-estimation for triple blind clinical trials. Drug Information
Journal, 27, 761-764.
Shih, J.H. & Zhao, P.L. (1997). Design for sample size re-estimation with interim data for
double-blind clinical trials with binary outcomes. Statistics in Medicine, 16, 1913-1923.