Adapting infrastructure to climate change
63
Adapting infrastructure to climate change James Hughes
Transcript of Adapting infrastructure to climate change
Adapting infrastructure to climate change
James Hughes
Agenda
• Background
• Emerging policy and a focus on climate risk in NZ
• Approaches to assessing and managing climate risk
• Sector examples

Background
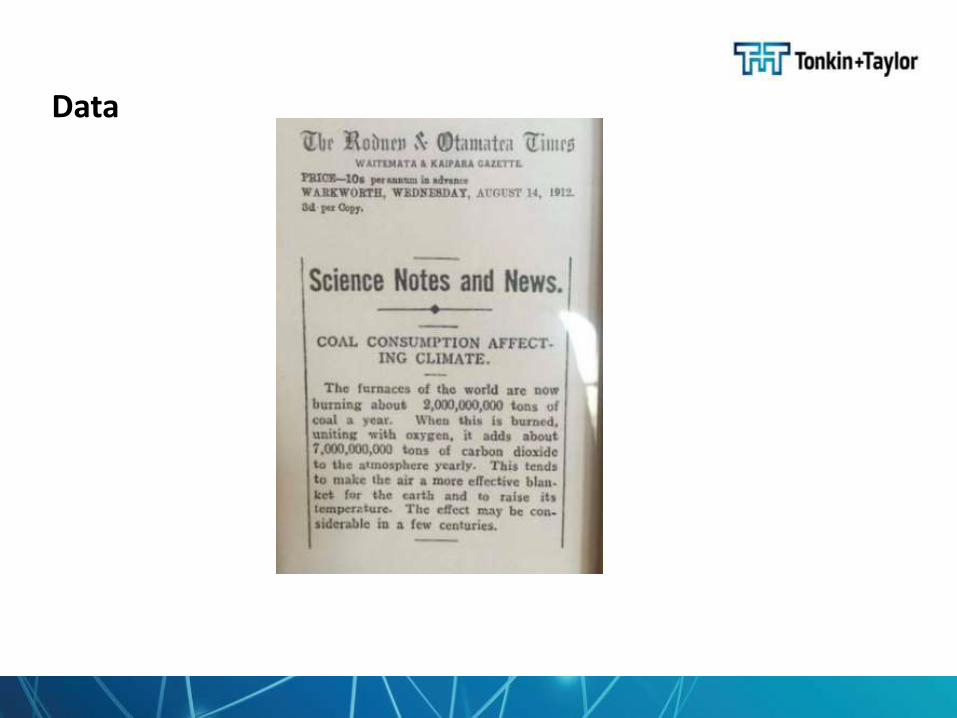
Data
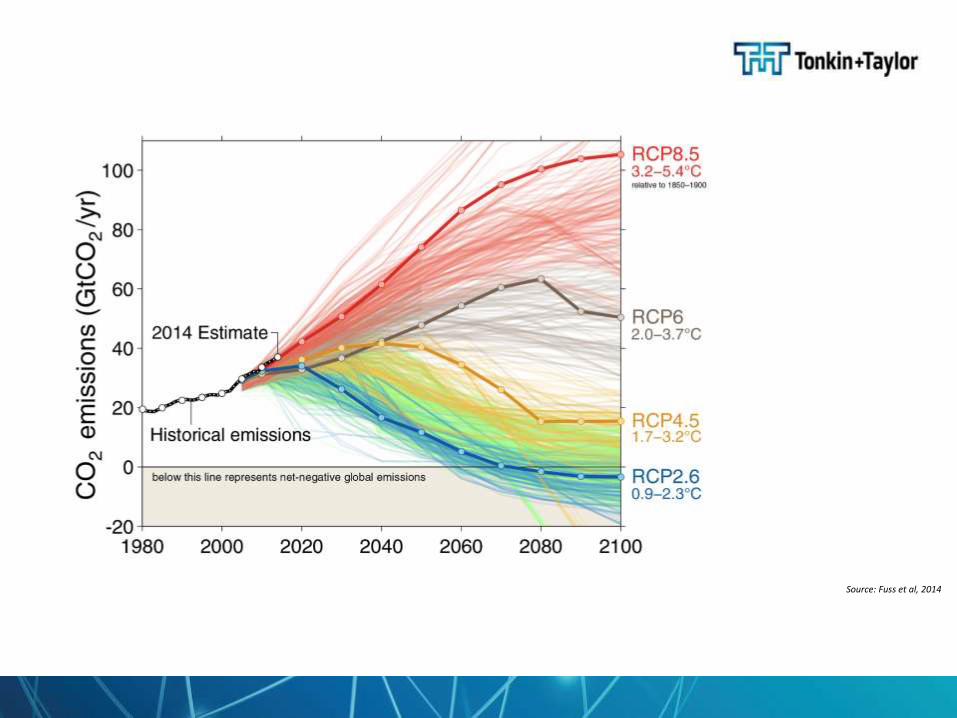
Source: Fuss et al, 2014
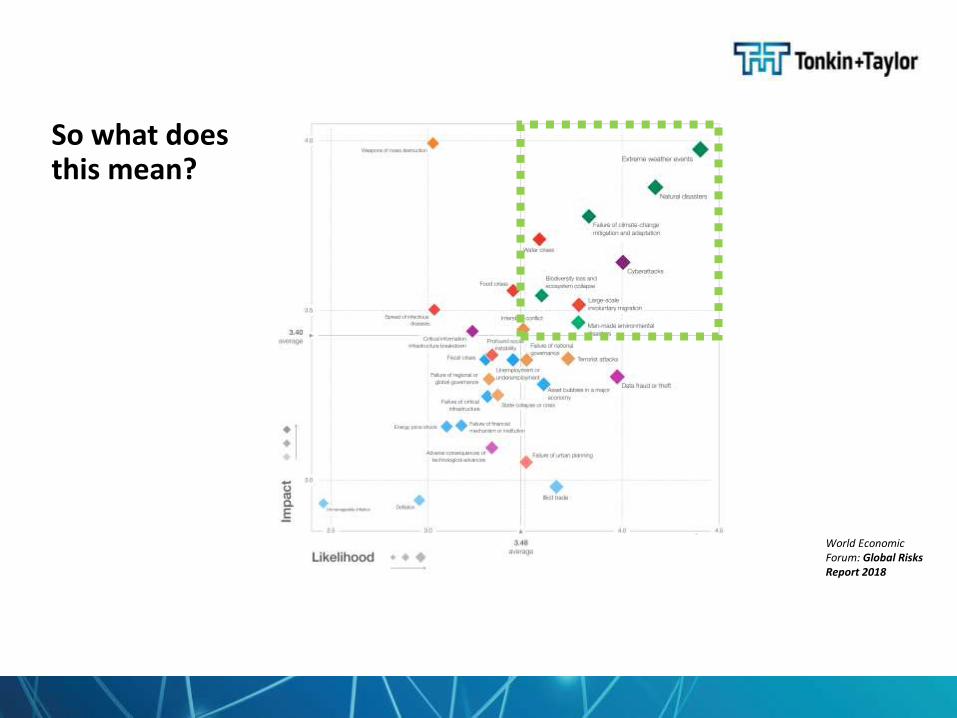
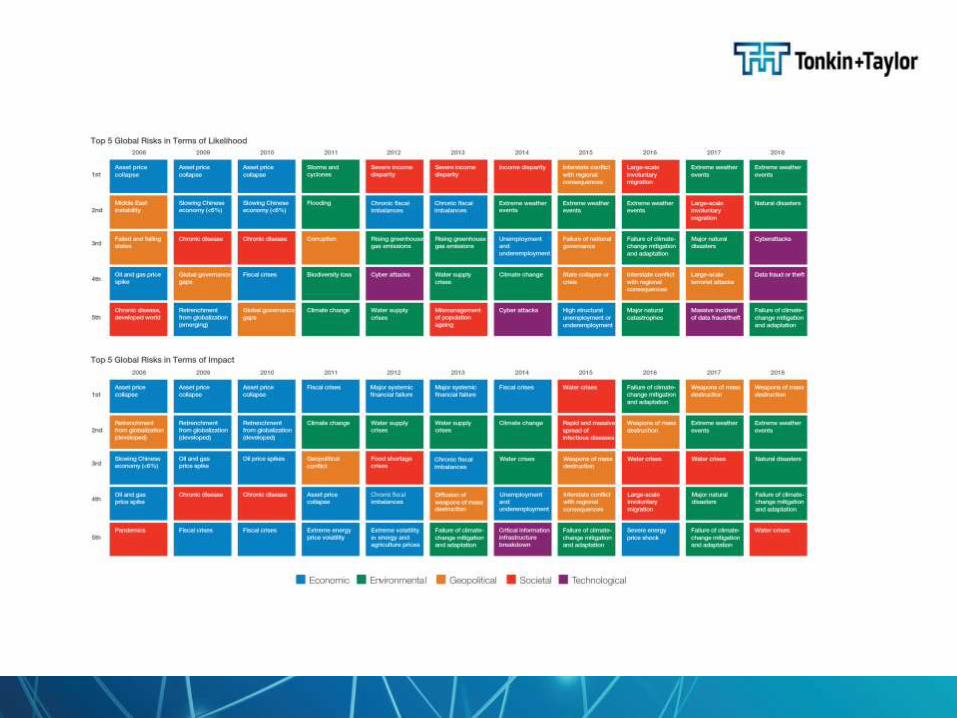
World Economic Forum: Global Risks Report 2018
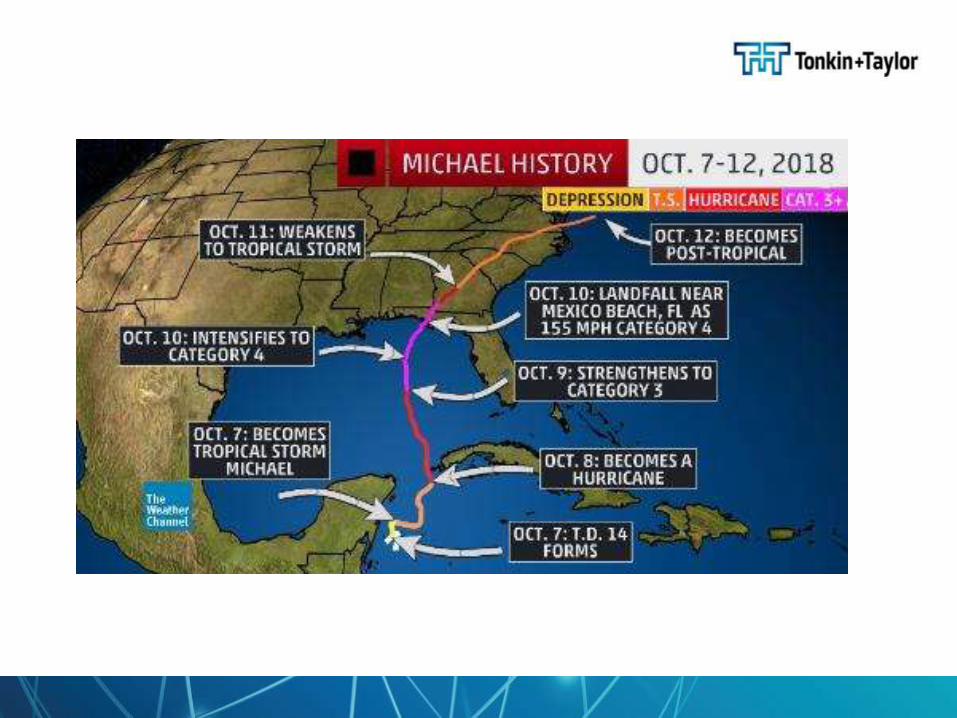
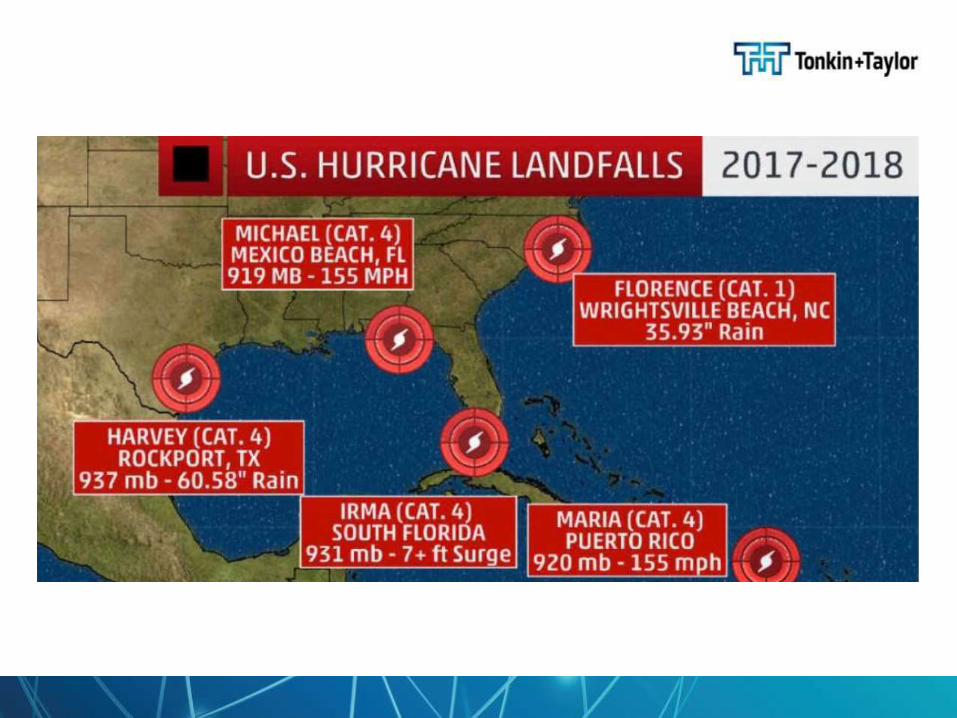
So what does this mean?
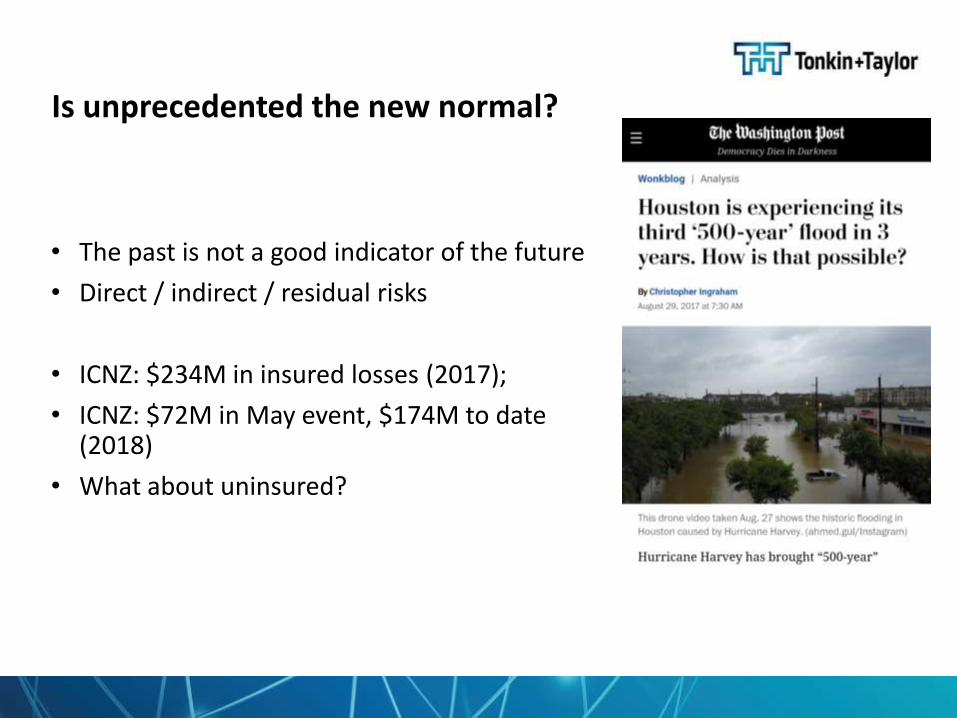
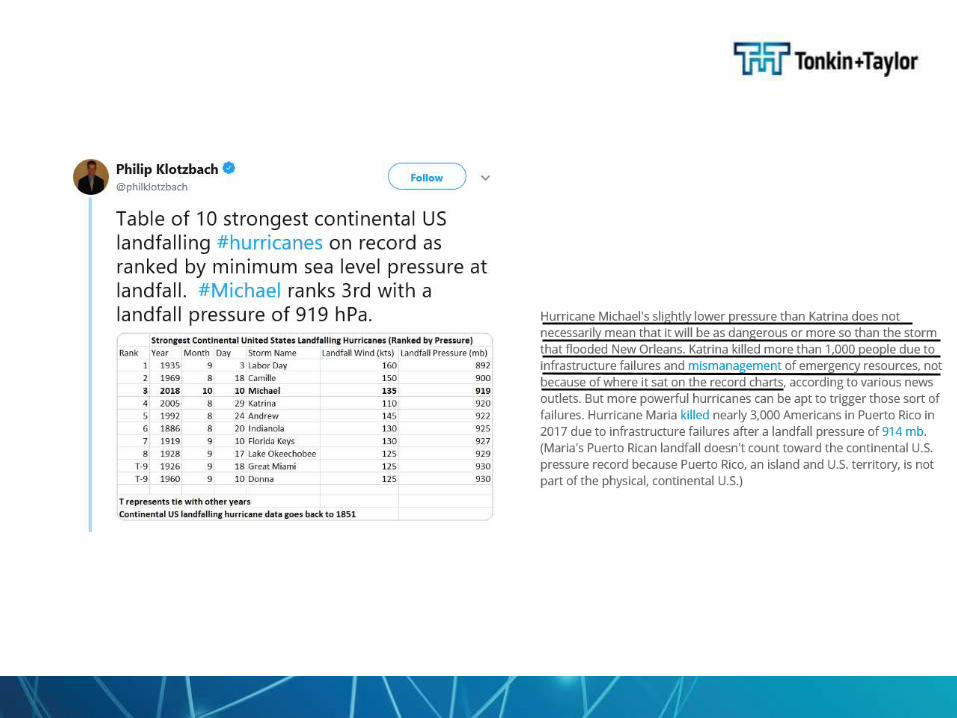
Is unprecedented the new normal?
• The past is not a good indicator of the future
• Direct / indirect / residual risks
• ICNZ: $234M in insured losses (2017);
• ICNZ: $72M in May event, $174M to date (2018)
• What about uninsured?
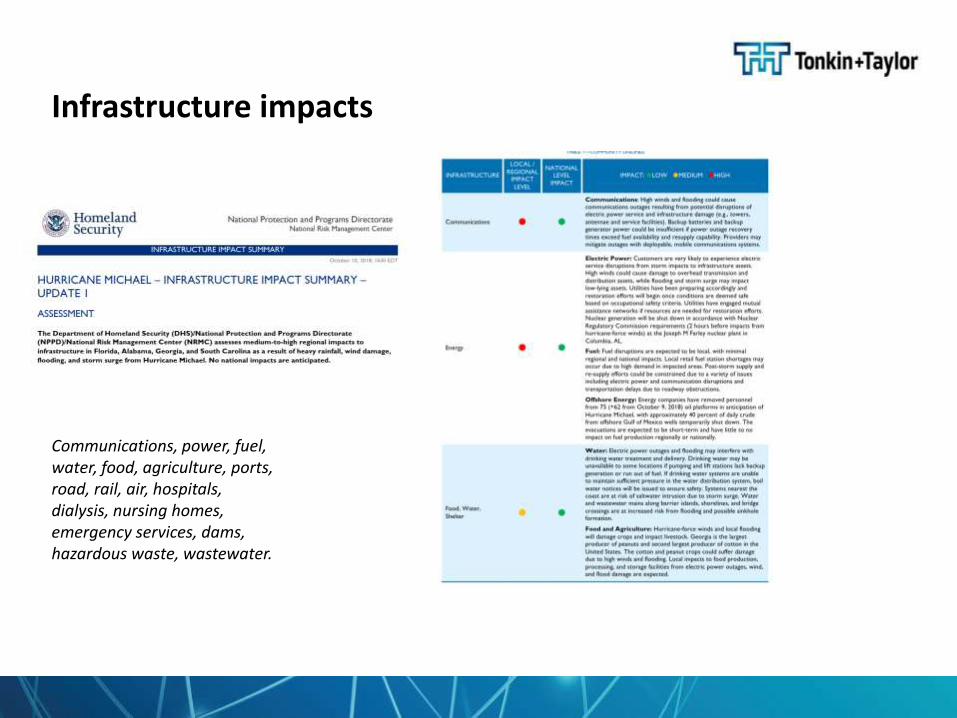
Infrastructure impacts
Communications, power, fuel, water, food, agriculture, ports, road, rail, air, hospitals, dialysis, nursing homes, emergency services, dams, hazardous waste, wastewater.
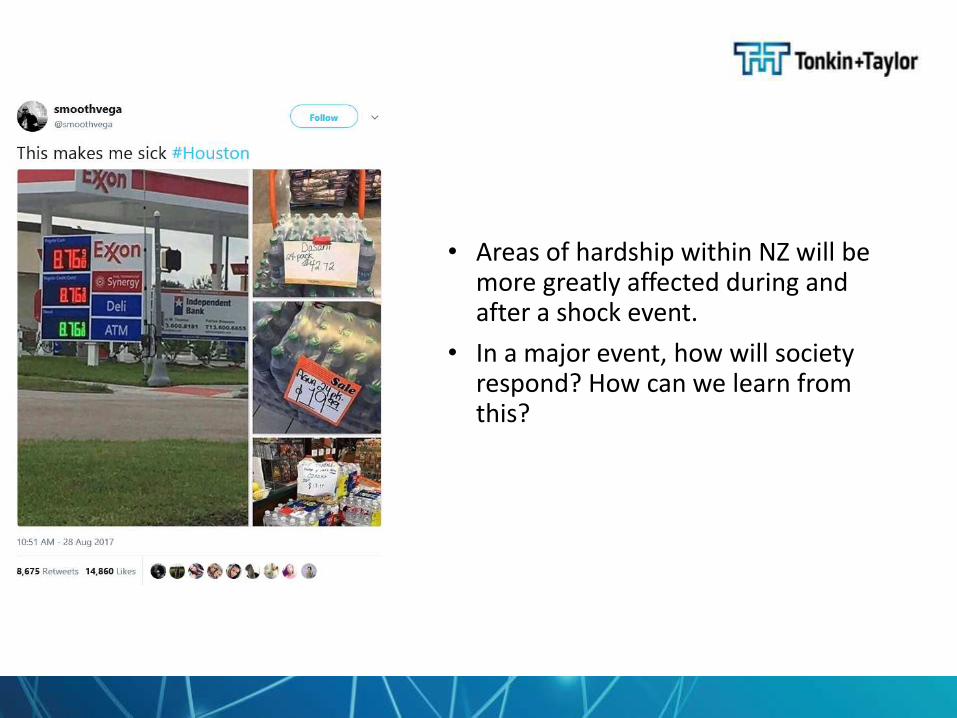
• Areas of hardship within NZ will be more greatly affected during and after a shock event.
• In a major event, how will society respond? How can we learn from this?
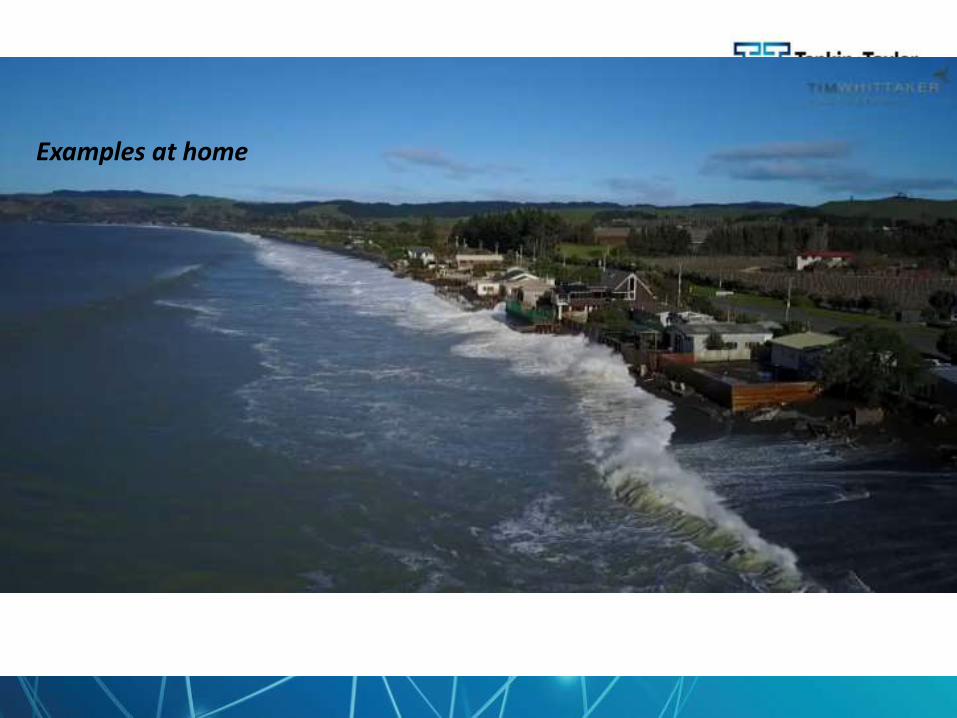
Examples at home
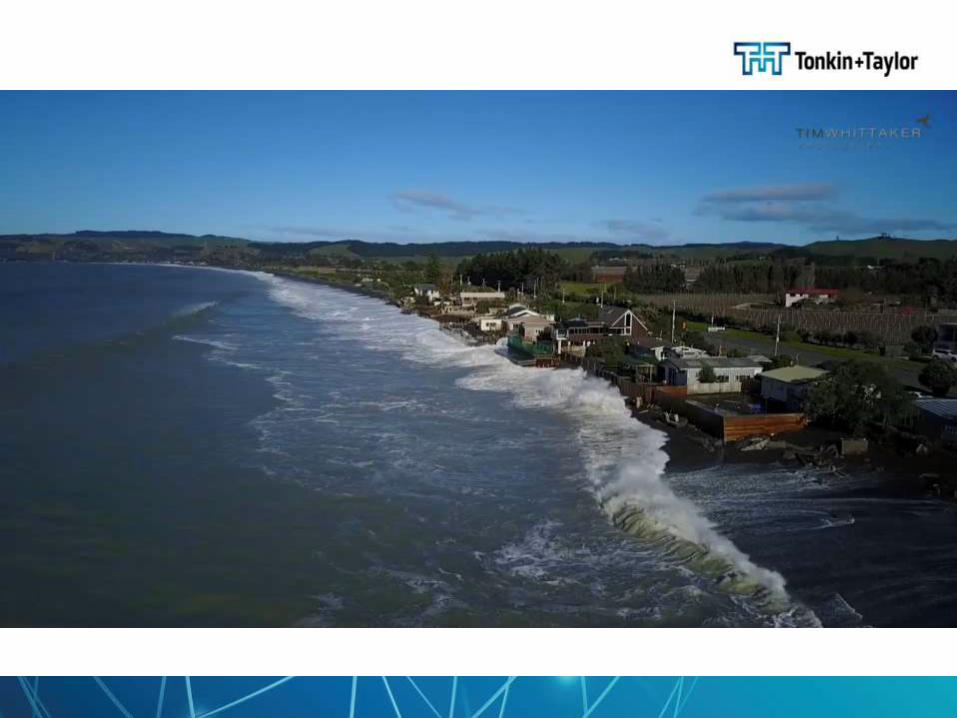
• Start with haumoana and come back to it later?
• Complexity ?
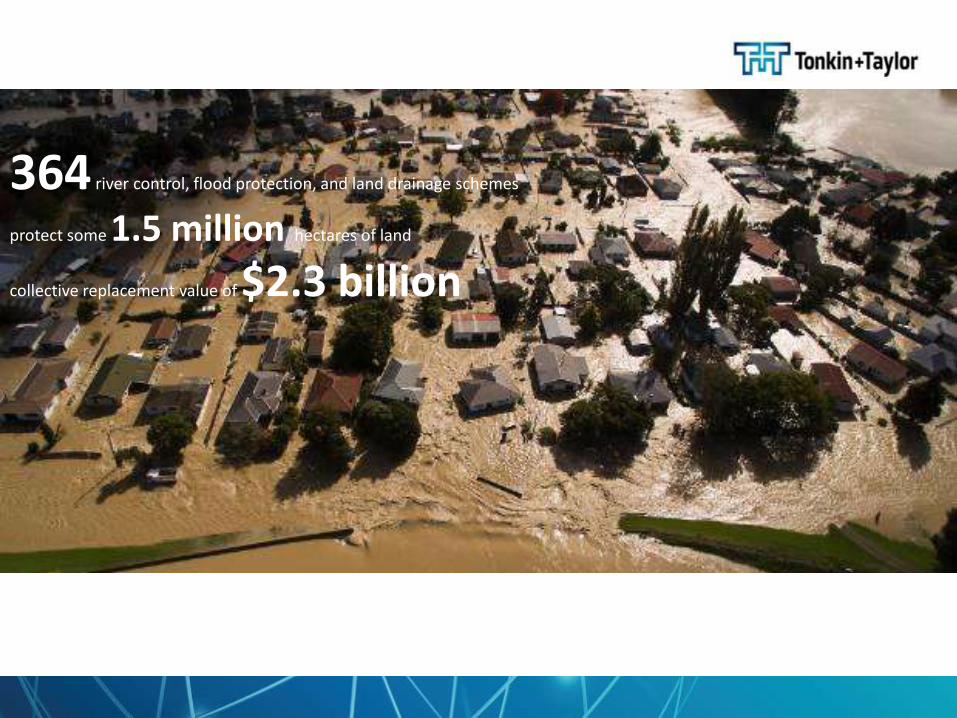
364 river control, flood protection, and land drainage schemes
protect some 1.5 million hectares of land
collective replacement value of $2.3 billion
Increased focus on climate risk, resilience and adaptation in NZ
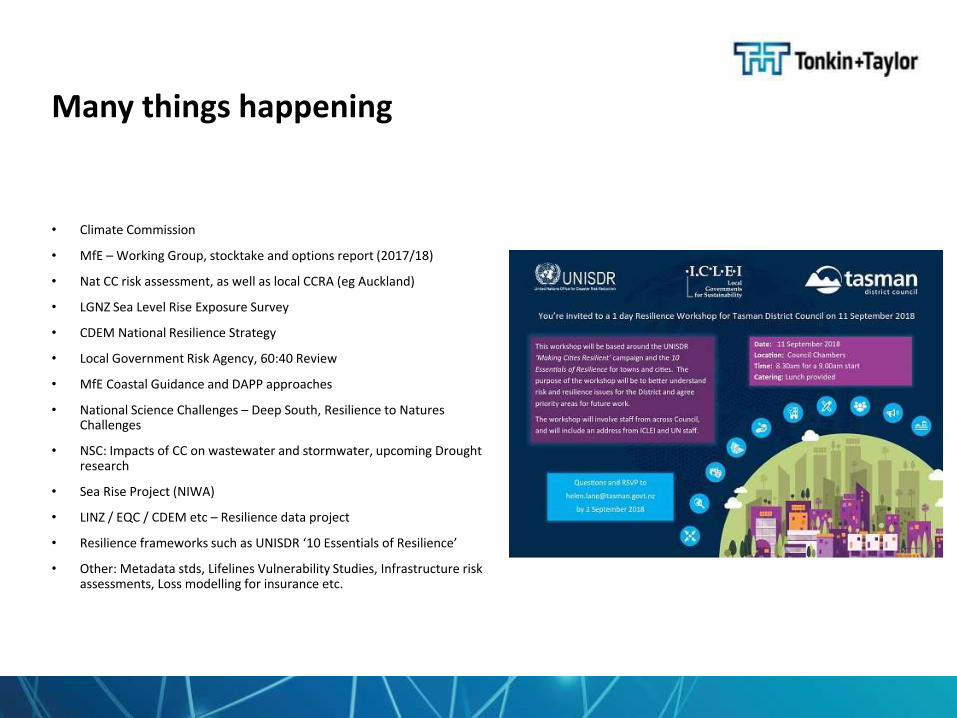
Many things happening
• Climate Commission
• MfE – Working Group, stocktake and options report (2017/18)
• Nat CC risk assessment, as well as local CCRA (eg Auckland)
• LGNZ Sea Level Rise Exposure Survey
• CDEM National Resilience Strategy
• Local Government Risk Agency, 60:40 Review
• MfE Coastal Guidance and DAPP approaches
• National Science Challenges – Deep South, Resilience to Natures Challenges
• NSC: Impacts of CC on wastewater and stormwater, upcoming Drought research
• Sea Rise Project (NIWA)
• LINZ / EQC / CDEM etc – Resilience data project
• Resilience frameworks such as UNISDR ‘10 Essentials of Resilience’
• Other: Metadata stds, Lifelines Vulnerability Studies, Infrastructure risk assessments, Loss modelling for insurance etc.
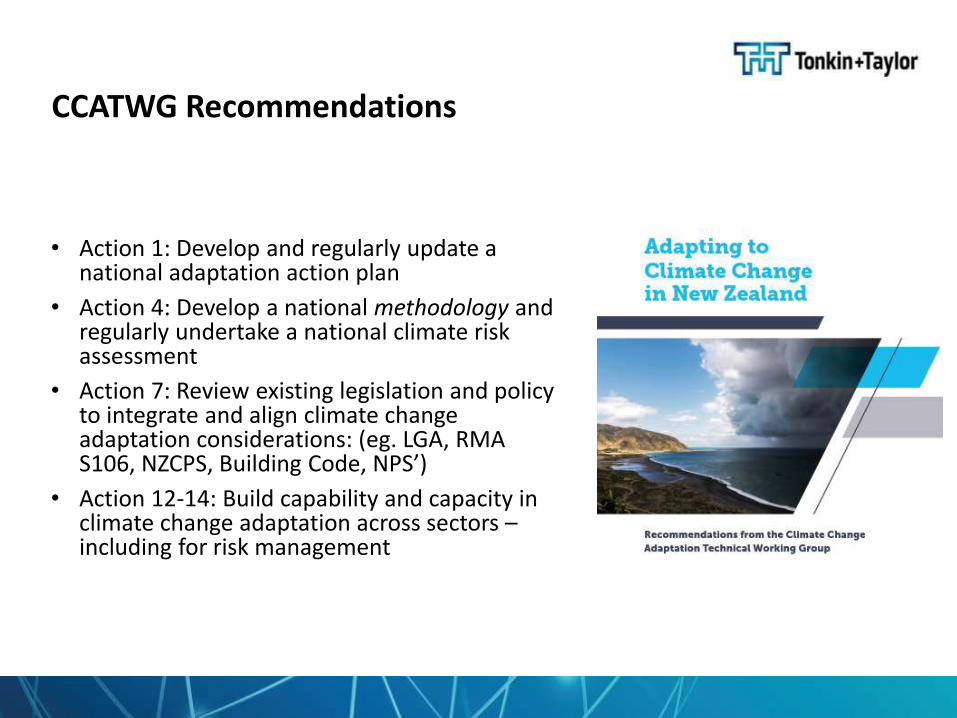
CCATWG Recommendations
• Action 1: Develop and regularly update a national adaptation action plan
• Action 4: Develop a national methodology and regularly undertake a national climate risk assessment
• Action 7: Review existing legislation and policy to integrate and align climate change adaptation considerations: (eg. LGA, RMA S106, NZCPS, Building Code, NPS’)
• Action 12-14: Build capability and capacity in climate change adaptation across sectors –including for risk management
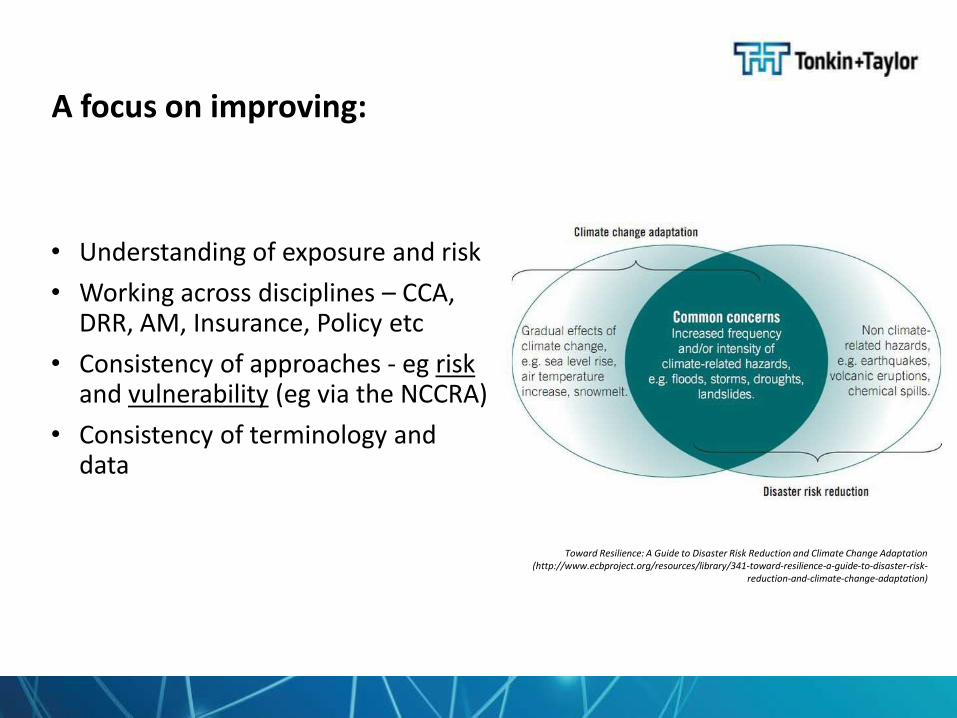
A focus on improving:
• Understanding of exposure and risk
• Working across disciplines – CCA, DRR, AM, Insurance, Policy etc
• Consistency of approaches - eg riskand vulnerability (eg via the NCCRA)
• Consistency of terminology and data
Toward Resilience: A Guide to Disaster Risk Reduction and Climate Change Adaptation (http://www.ecbproject.org/resources/library/341-toward-resilience-a-guide-to-disaster-risk-
reduction-and-climate-change-adaptation)
Approaches to assessing and reporting on climate risk
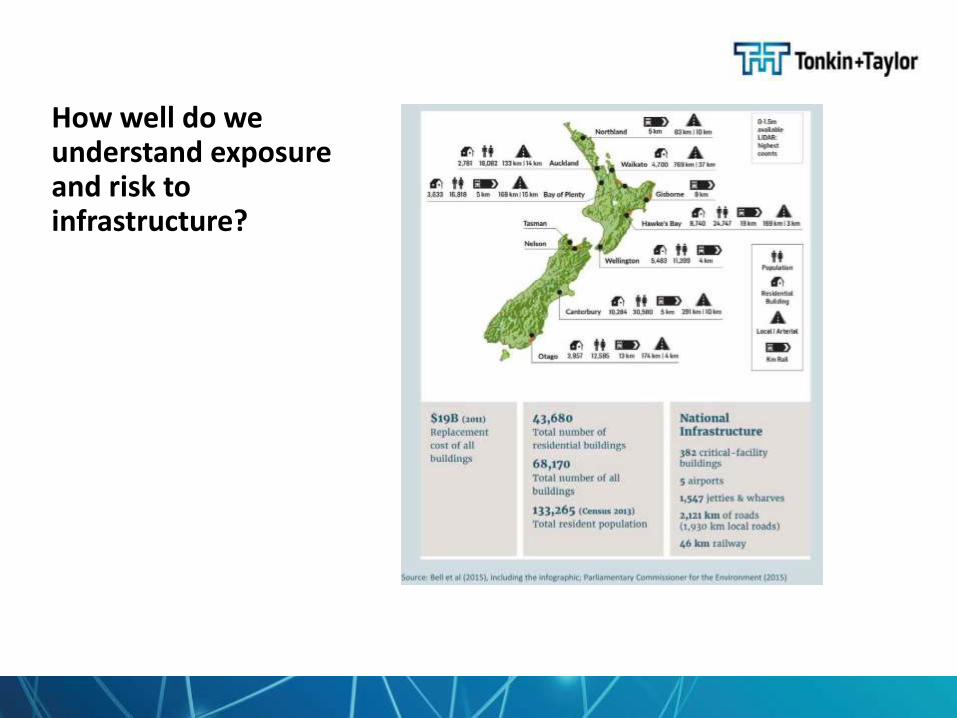
How well do we understand exposure and risk to infrastructure?
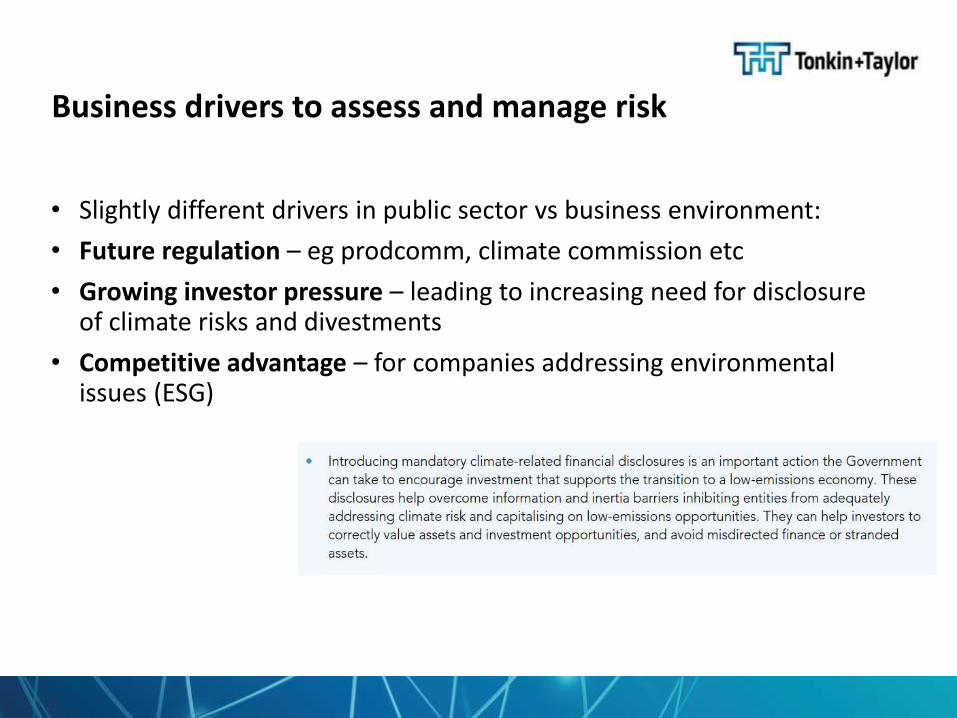
Business drivers to assess and manage risk
• Slightly different drivers in public sector vs business environment:
• Future regulation – eg prodcomm, climate commission etc
• Growing investor pressure – leading to increasing need for disclosure of climate risks and divestments
• Competitive advantage – for companies addressing environmental issues (ESG)
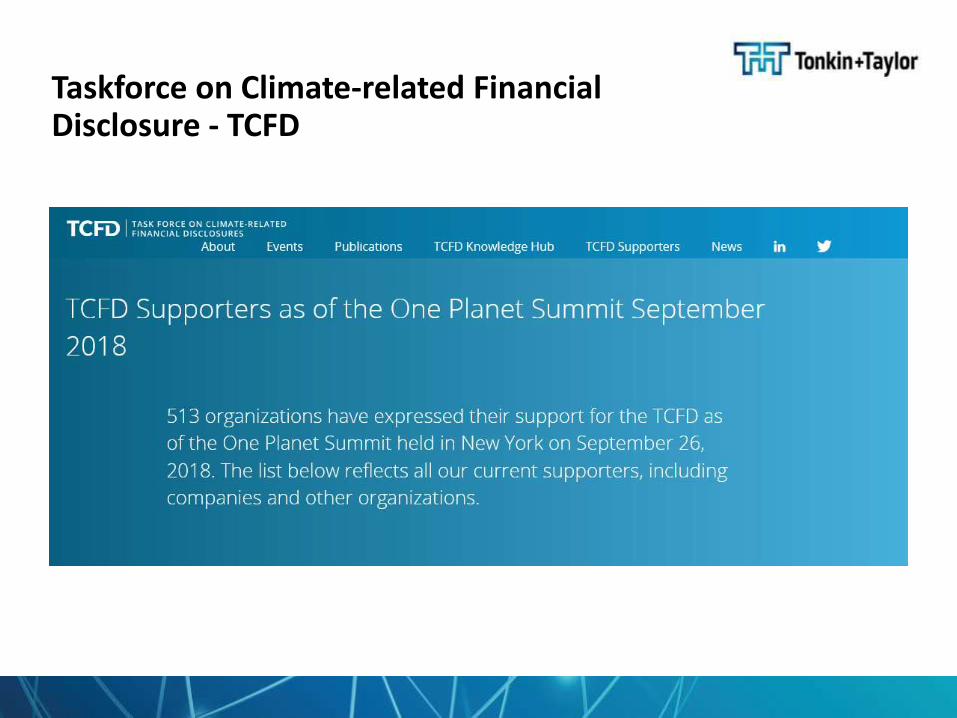
Taskforce on Climate-related Financial Disclosure - TCFD
Larry Fink, chief executive of the world's largest fund manager, BlackRock, which manages more than US$6 trillion of assets:
Fink's annual letter to the boards of thousands of companies warned that BlackRock would be exploring climate change in interviews with non-executive directors over the coming year.
He would be looking for "demonstrable fluency" on climate change and, where it was lacking, disinvestment was likely to follow.
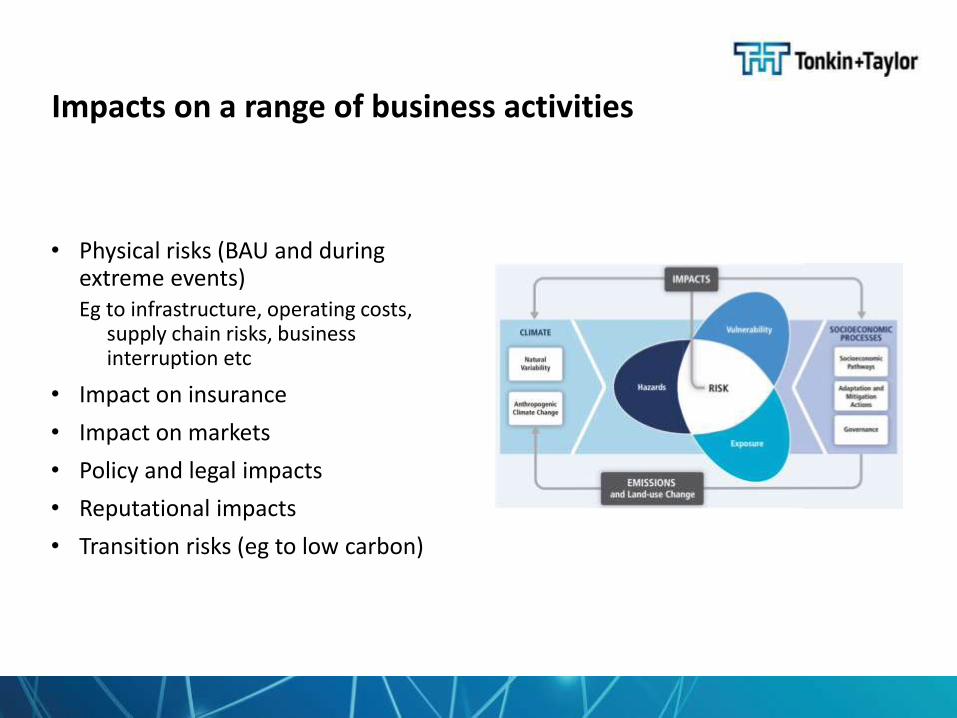
Impacts on a range of business activities
• Physical risks (BAU and during extreme events)Eg to infrastructure, operating costs,
supply chain risks, business interruption etc
• Impact on insurance
• Impact on markets
• Policy and legal impacts
• Reputational impacts
• Transition risks (eg to low carbon)
A risk and adaptation framework for infrastructure
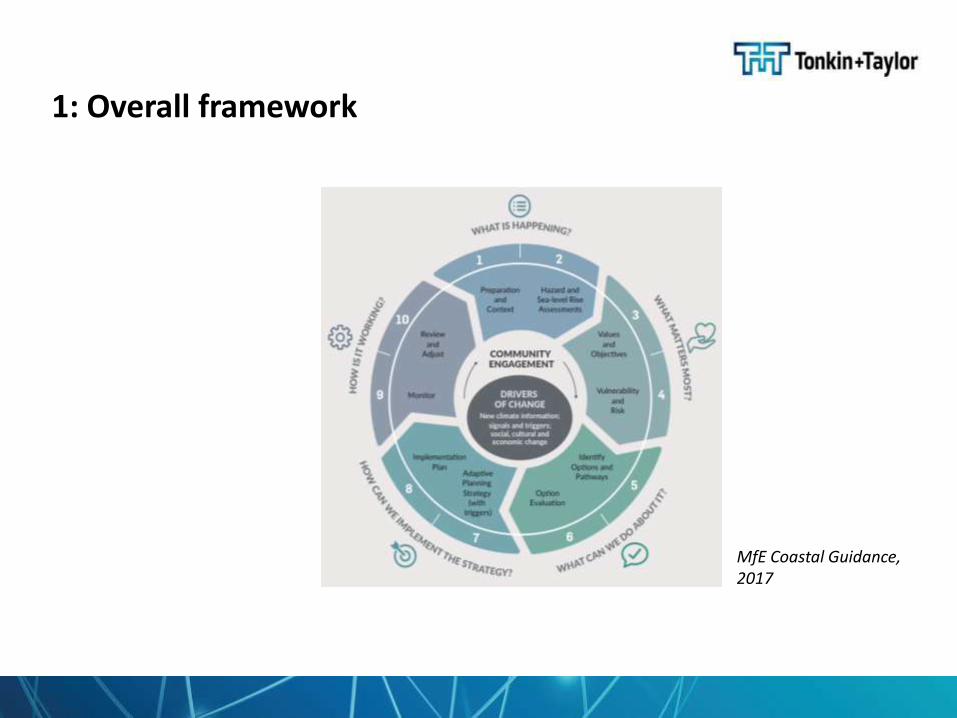
1: Overall framework
MfE Coastal Guidance, 2017
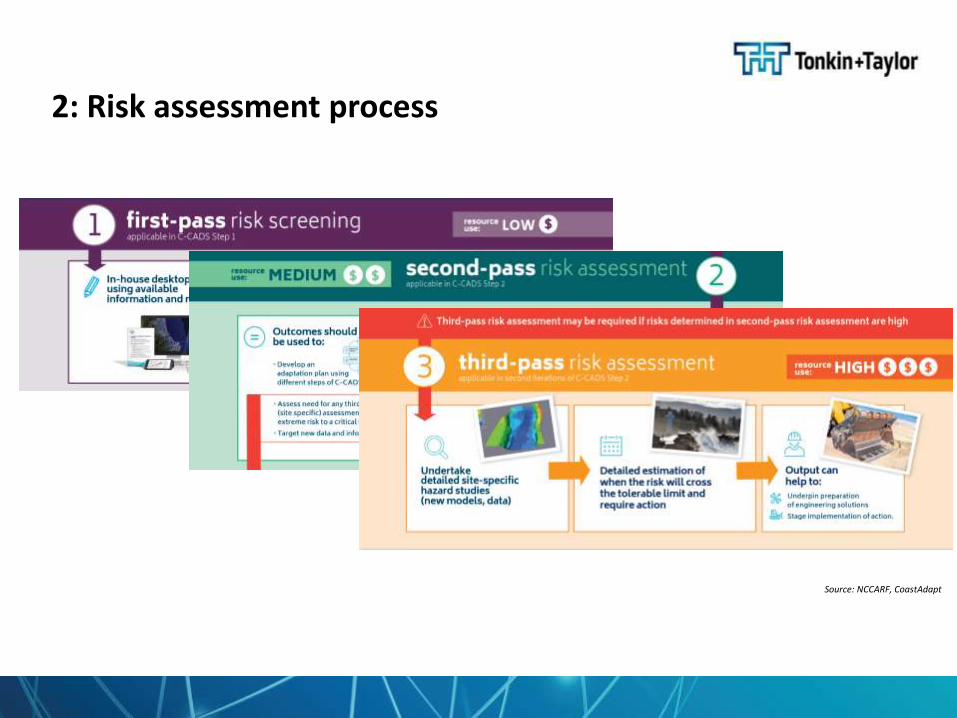
2: Risk assessment process
Source: NCCARF, CoastAdapt
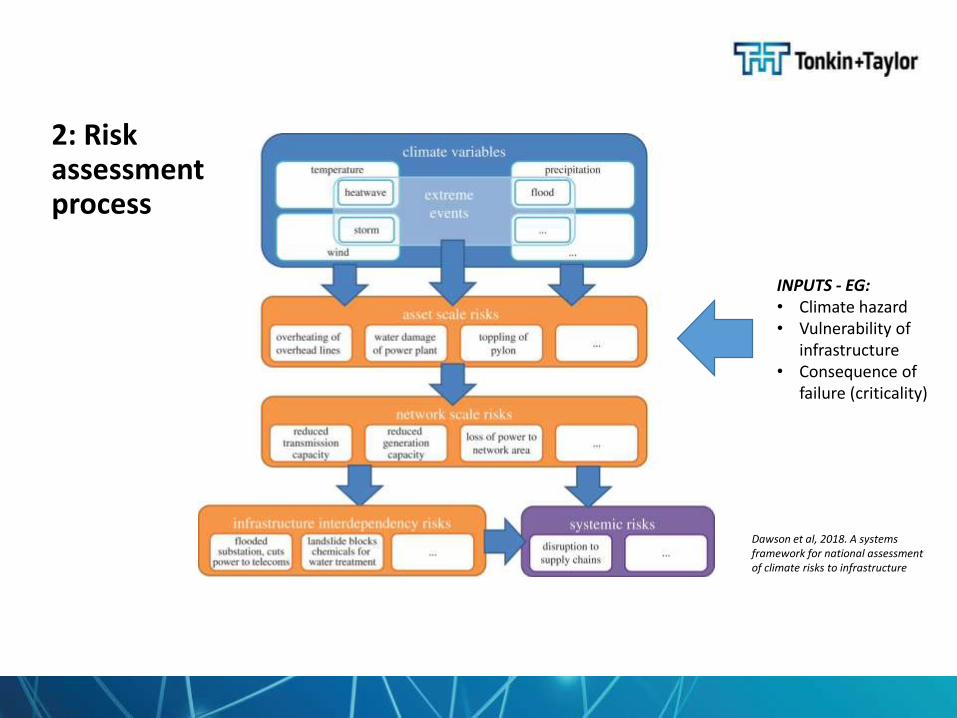
Dawson et al, 2018. A systems framework for national assessment of climate risks to infrastructure
2: Risk assessment process
INPUTS - EG:• Climate hazard• Vulnerability of
infrastructure• Consequence of
failure (criticality)
2: Risk assessment notes
• Climate risk varies with time
• Approaches (such as AS5334) encourage an assessment across a range of time horizons
• Assumptions required around RCP scenarios
• This assessment will allow:o Timing for commencing adaptation planning, decision-making and development of possible
adaptation ‘pathways’,
o Setting of triggers and thresholds for transition to agreed pathways,
o Decision-making around opportunistic investment ahead of time (eg when assets are renewed, or when co-beneficial projects are identified).
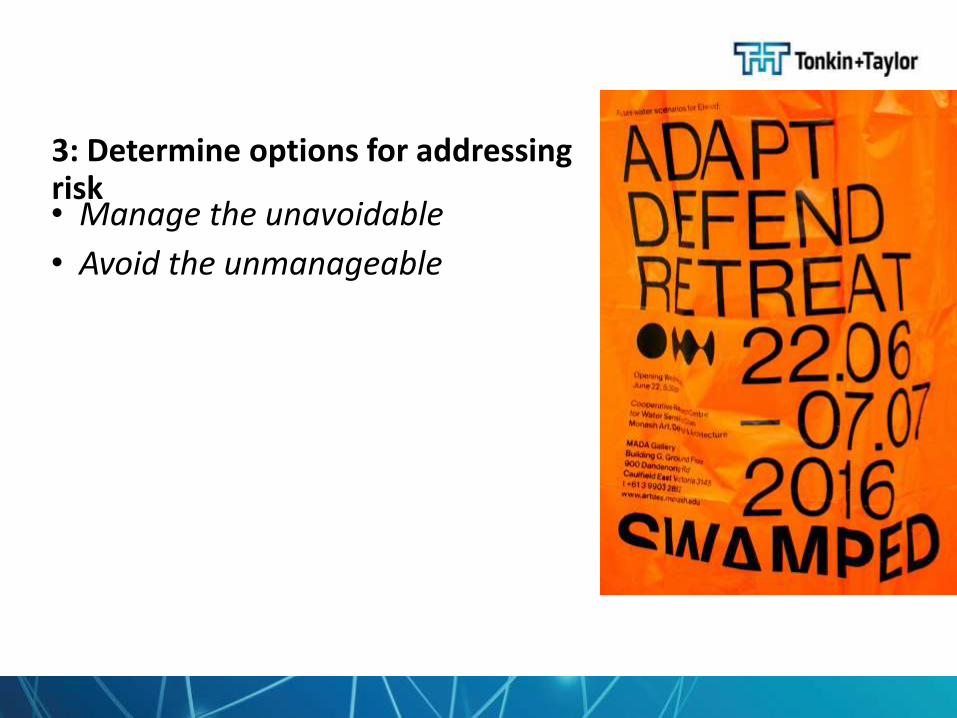
3: Determine options for addressing risk• Manage the unavoidable
• Avoid the unmanageable
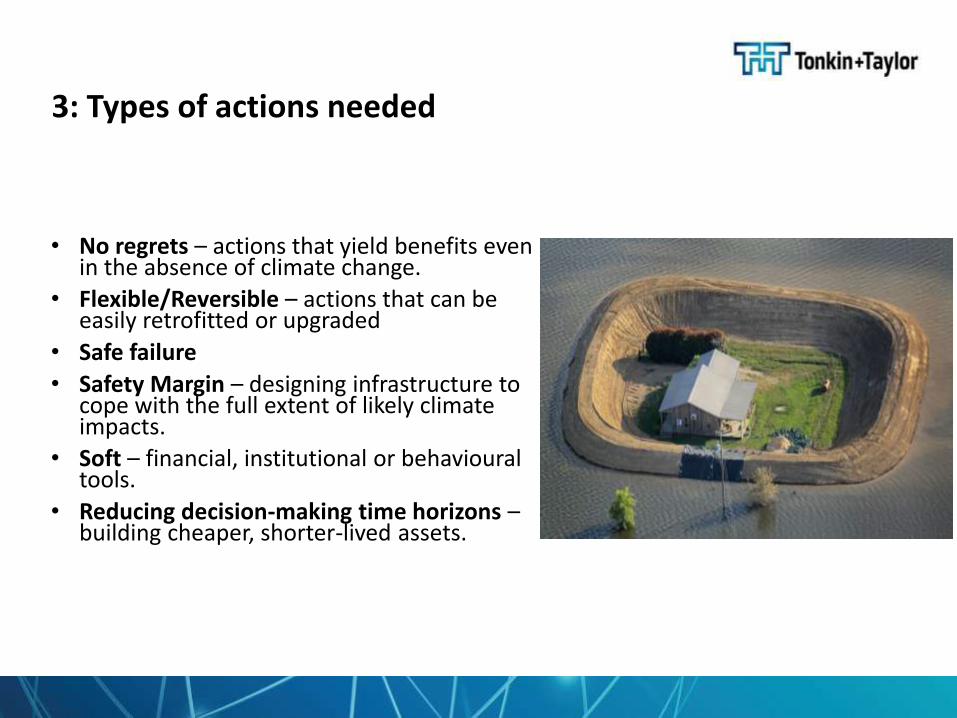
3: Types of actions needed
• No regrets – actions that yield benefits even in the absence of climate change.
• Flexible/Reversible – actions that can be easily retrofitted or upgraded
• Safe failure
• Safety Margin – designing infrastructure to cope with the full extent of likely climate impacts.
• Soft – financial, institutional or behavioural tools.
• Reducing decision-making time horizons –building cheaper, shorter-lived assets.
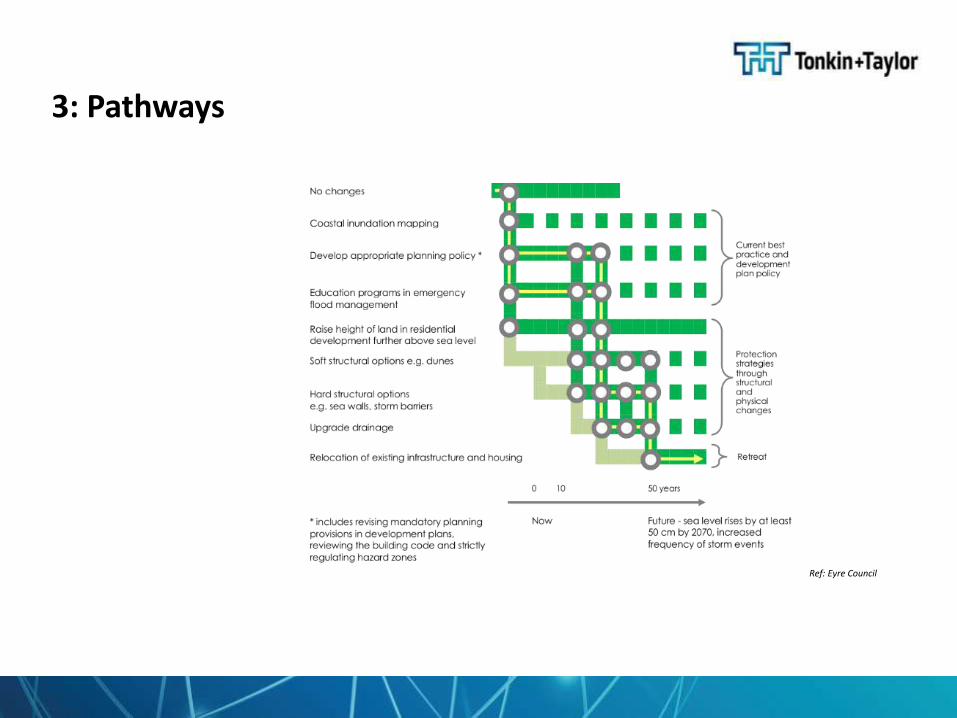
3: Pathways
Ref: Eyre Council
Sector examples of approaches to assessing risk and adaptation
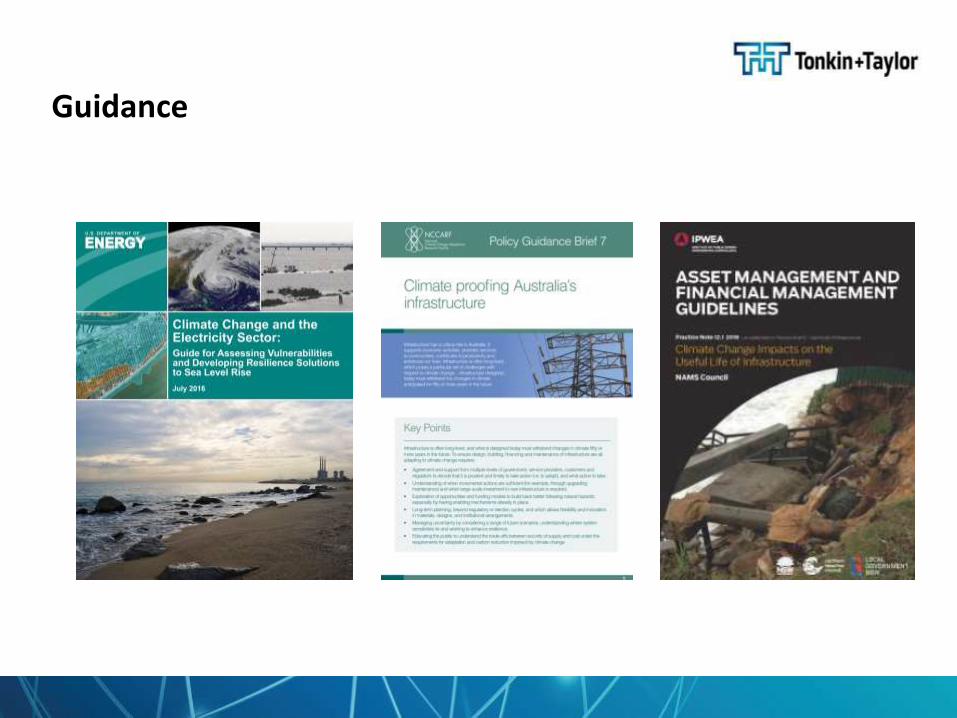
Guidance
LGNZ Exposure study – interim findings
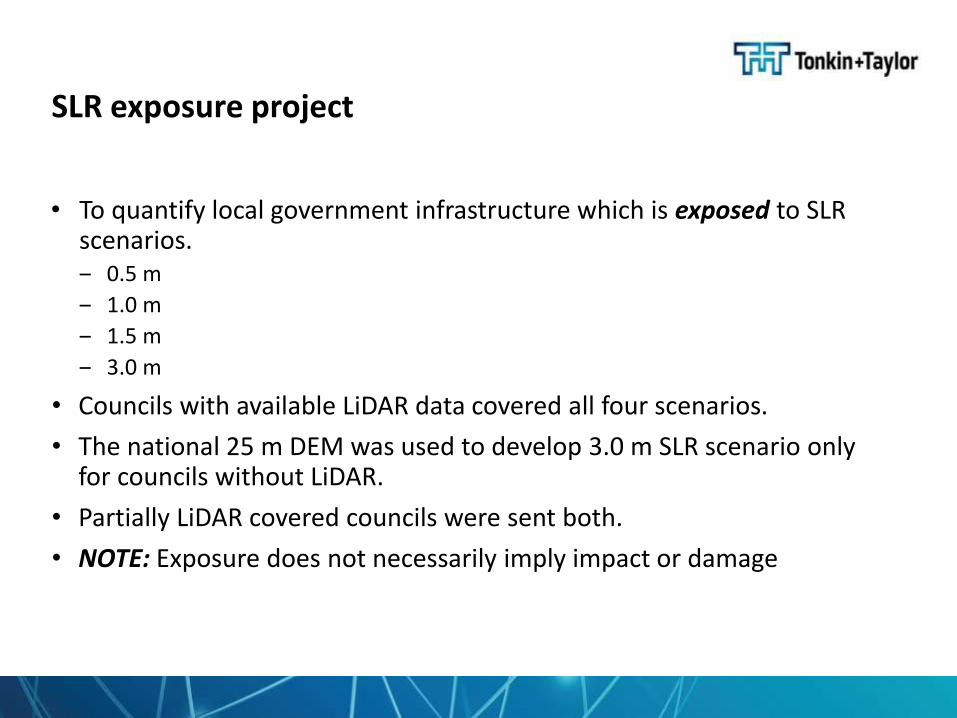
SLR exposure project
• To quantify local government infrastructure which is exposed to SLR scenarios. ‒ 0.5 m
‒ 1.0 m
‒ 1.5 m
‒ 3.0 m
• Councils with available LiDAR data covered all four scenarios.
• The national 25 m DEM was used to develop 3.0 m SLR scenario only for councils without LiDAR.
• Partially LiDAR covered councils were sent both.
• NOTE: Exposure does not necessarily imply impact or damage
Wastewater and stormwater sector: impacts & implications
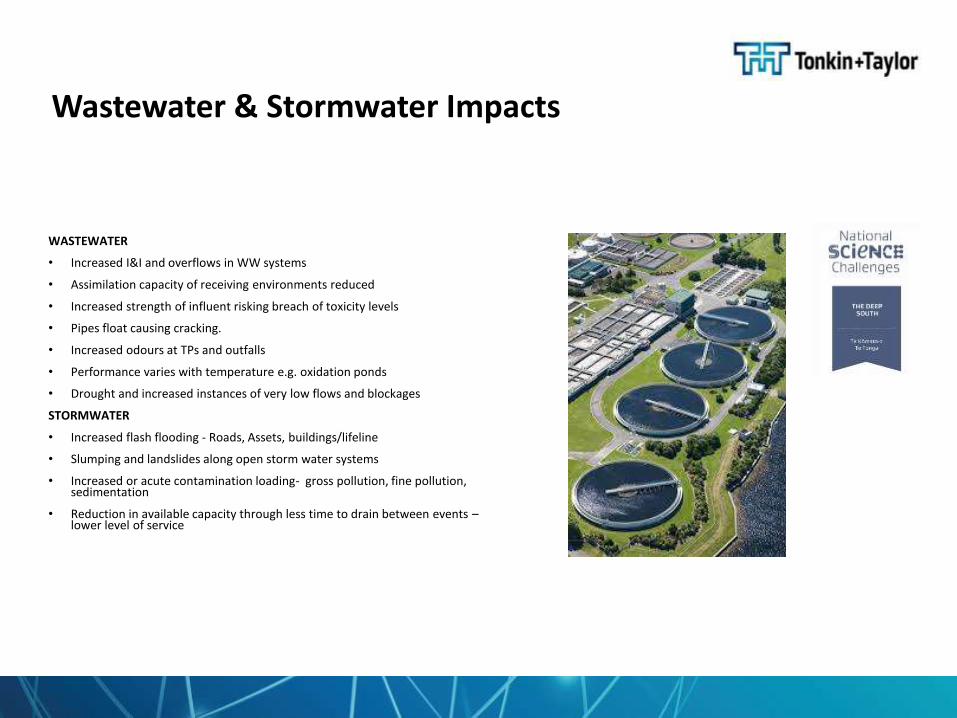
Wastewater & Stormwater Impacts
WASTEWATER
• Increased I&I and overflows in WW systems
• Assimilation capacity of receiving environments reduced
• Increased strength of influent risking breach of toxicity levels
• Pipes float causing cracking.
• Increased odours at TPs and outfalls
• Performance varies with temperature e.g. oxidation ponds
• Drought and increased instances of very low flows and blockages
STORMWATER
• Increased flash flooding - Roads, Assets, buildings/lifeline
• Slumping and landslides along open storm water systems
• Increased or acute contamination loading- gross pollution, fine pollution, sedimentation
• Reduction in available capacity through less time to drain between events –lower level of service

Telco sector
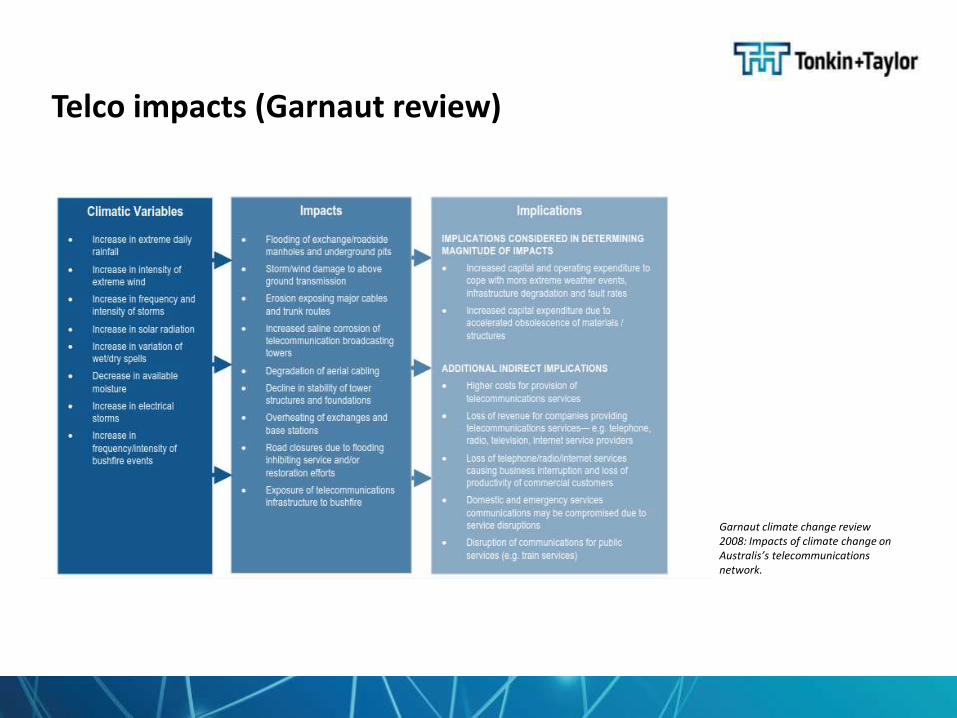
Telco impacts (Garnaut review)
Garnaut climate change review 2008: Impacts of climate change on Australis’s telecommunications network.

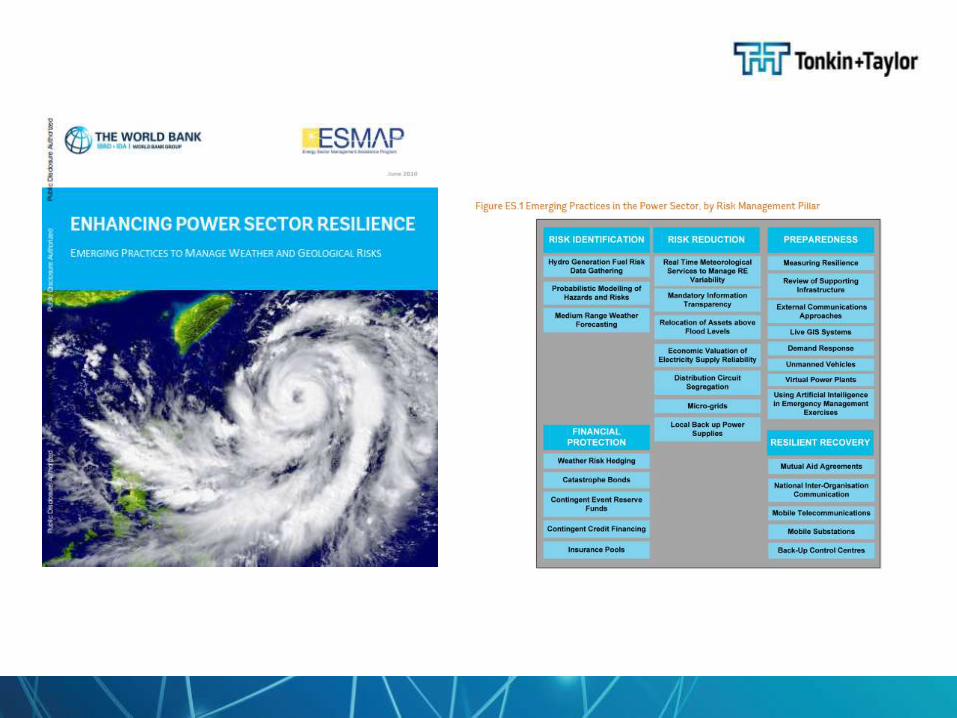
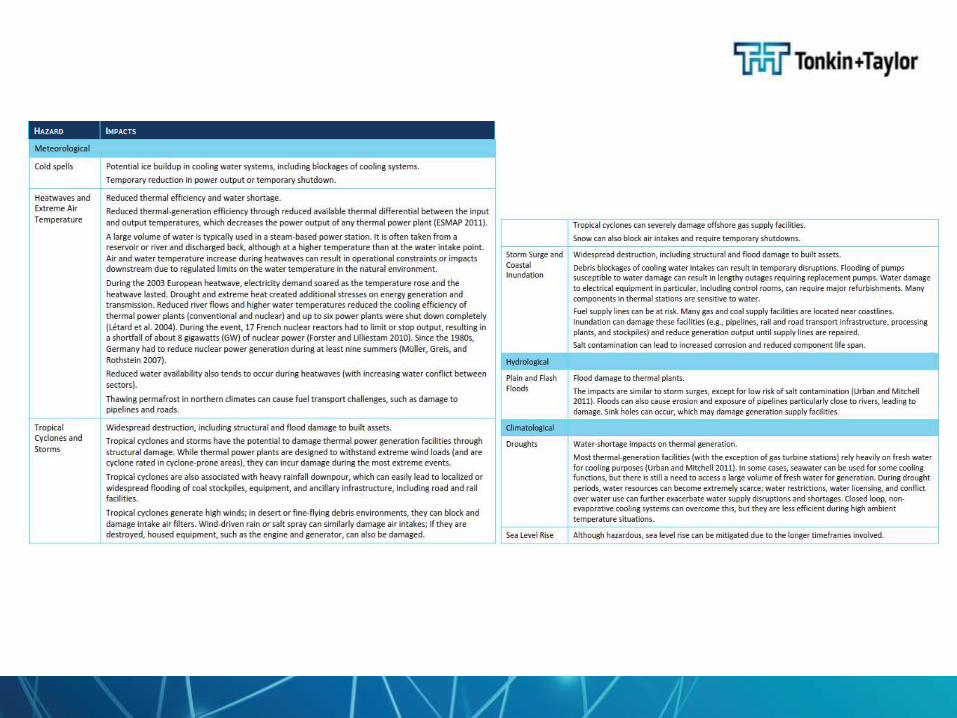
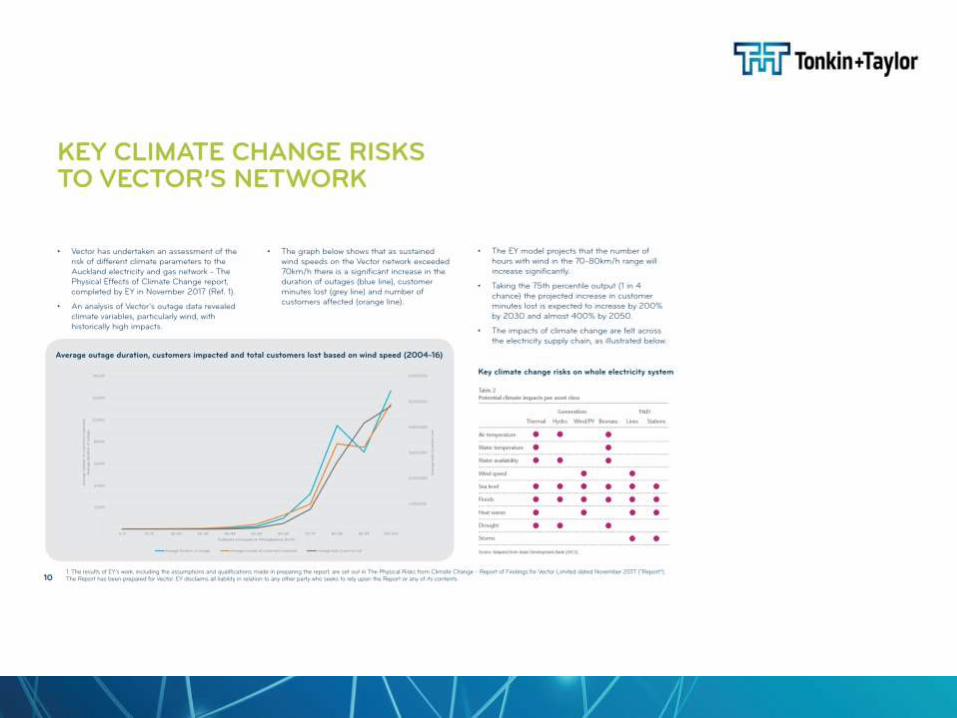
Power sector
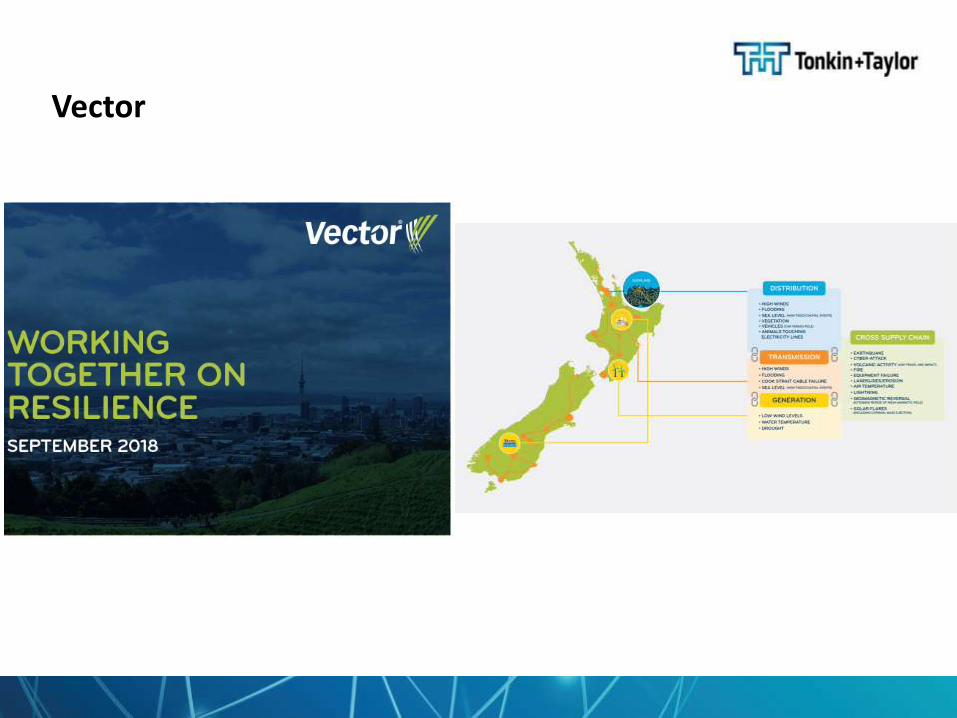
Vector
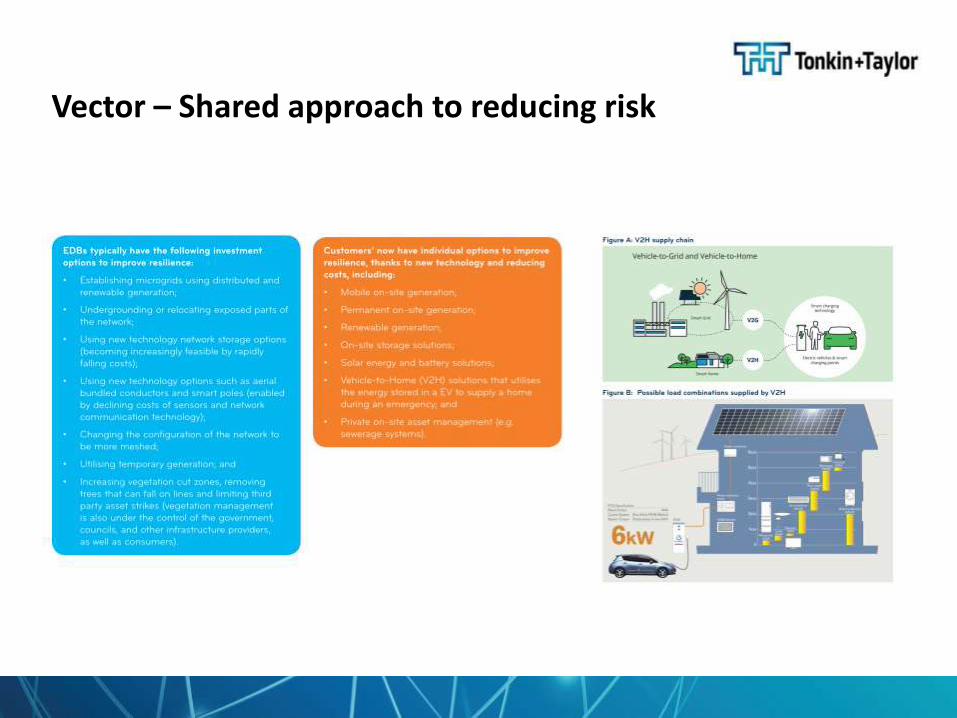
Vector – Shared approach to reducing risk

Closing comments
Closing comments
• Problems are complex & dynamic – we need new ways of working together to manage the significant climate risks we face
• Expect more guidance and consistency in approaches at national and regional levels. Including a joined up approach to DRR and CCA
• Consistent and aligned policy and institutional arrangements
• Risk assessment across all sectors: Communities, infrastructure, natural environments, business and industry, health sectors, international dimensions etc
• Options and pathways which consider defend-adapt-retreat, policy interventions, hard and soft solutions etc
• Engagement and working together to build a common vision and long term view
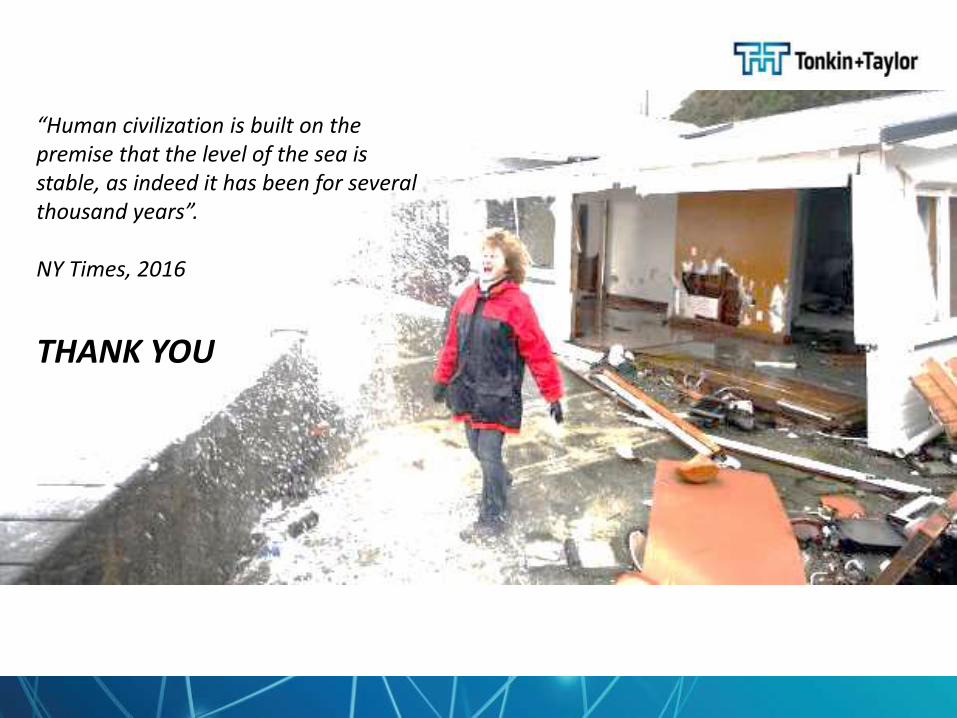
“Human civilization is built on the premise that the level of the sea is stable, as indeed it has been for several thousand years”.
NY Times, 2016
THANK YOU
REDUCING RISKBUILDING RESILIENCE
EQC’S RESILIENCE STRATEGY
DR RICHARD SMITH – MANAGER RESEARCH STRATEGY AND INVESTMENT
NATIONAL LIFELINE UTILITIES FORUM 2018
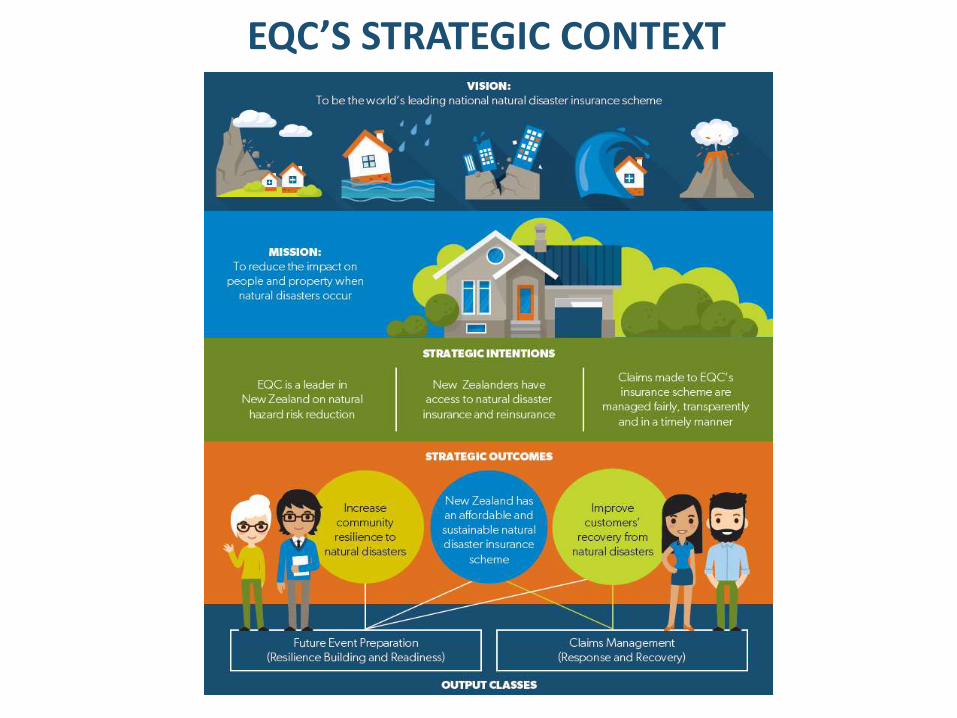
EQC’S STRATEGIC CONTEXT
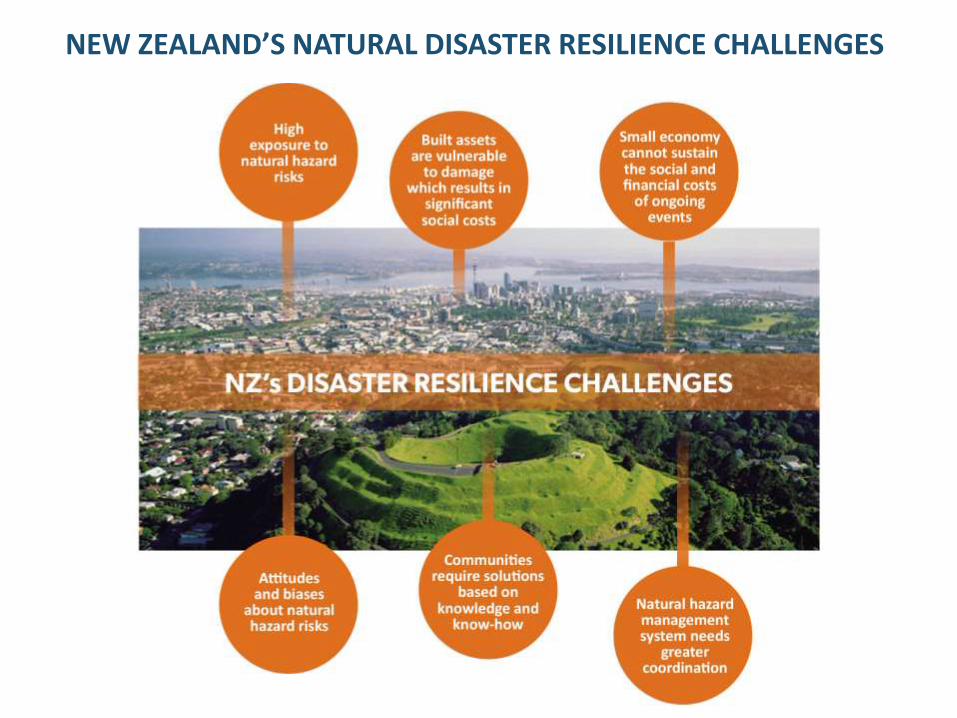
NEW ZEALAND’S NATURAL DISASTER RESILIENCE CHALLENGES
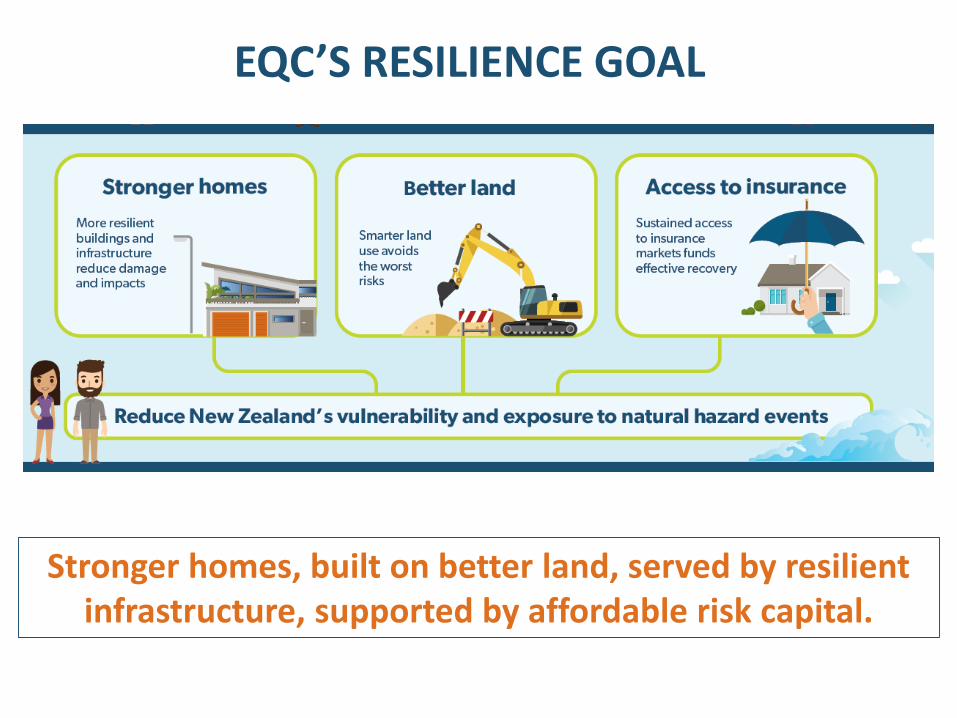
EQC’S RESILIENCE GOAL
Stronger homes, built on better land, served by resilient infrastructure, supported by affordable risk capital.
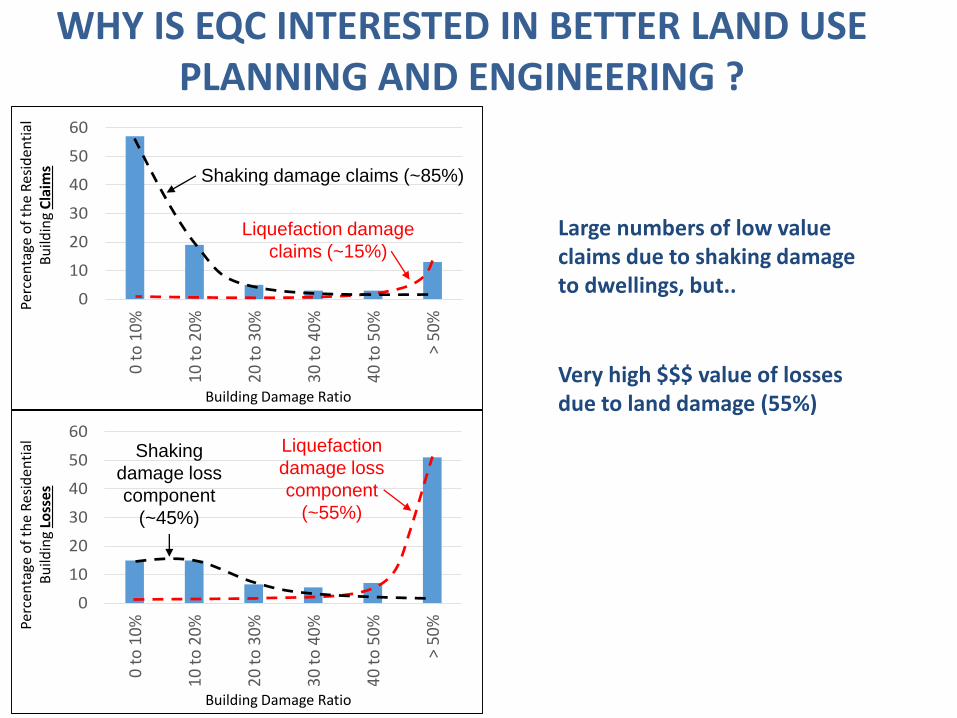
WHY IS EQC INTERESTED IN BETTER LAND USE PLANNING AND ENGINEERING ?
0
10
20
30
40
50
600
to 1
0%
10 t
o 2
0%
20 t
o 3
0%
30 t
o 4
0%
40 t
o 5
0%
> 50
%
Perc
enta
ge o
f th
e R
esid
enti
al
Bu
ildin
g C
laim
s
0
10
20
30
40
50
60
0 to
10%
10 t
o 2
0%
20 t
o 3
0%
30 t
o 4
0%
40 t
o 5
0%
> 50
%Perc
enta
ge o
f th
e R
esid
enti
al
Bu
ildin
g Lo
sse
s
Building Damage Ratio
Building Damage Ratio
Large numbers of low value claims due to shaking damage to dwellings, but..
Very high $$$ value of losses due to land damage (55%)
Liquefaction damage
claims (~15%)
Shaking damage claims (~85%)
Liquefaction
damage loss
component
(~55%)
Shaking
damage loss
component
(~45%)
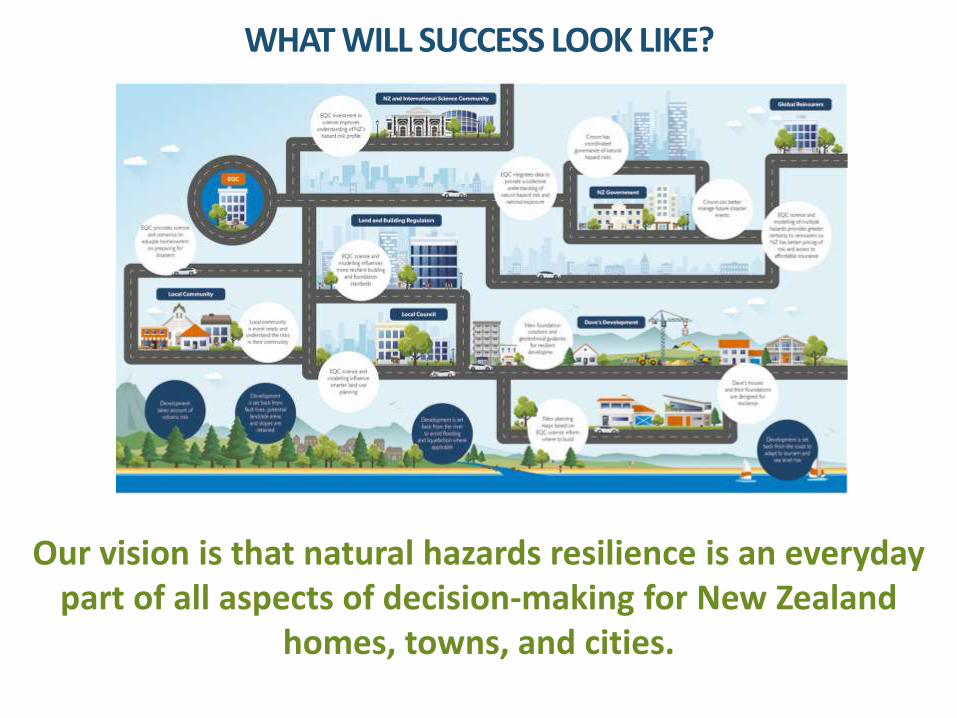
Our vision is that natural hazards resilience is an everyday part of all aspects of decision-making for New Zealand
homes, towns, and cities.
WHAT WILL SUCCESS LOOK LIKE?
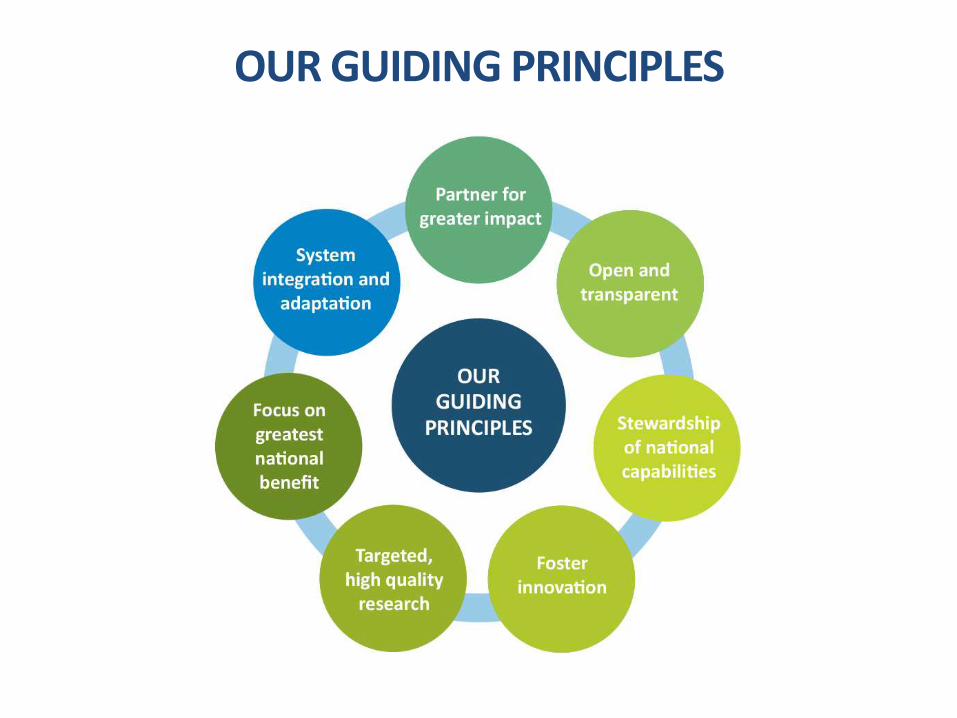
OUR GUIDING PRINCIPLES
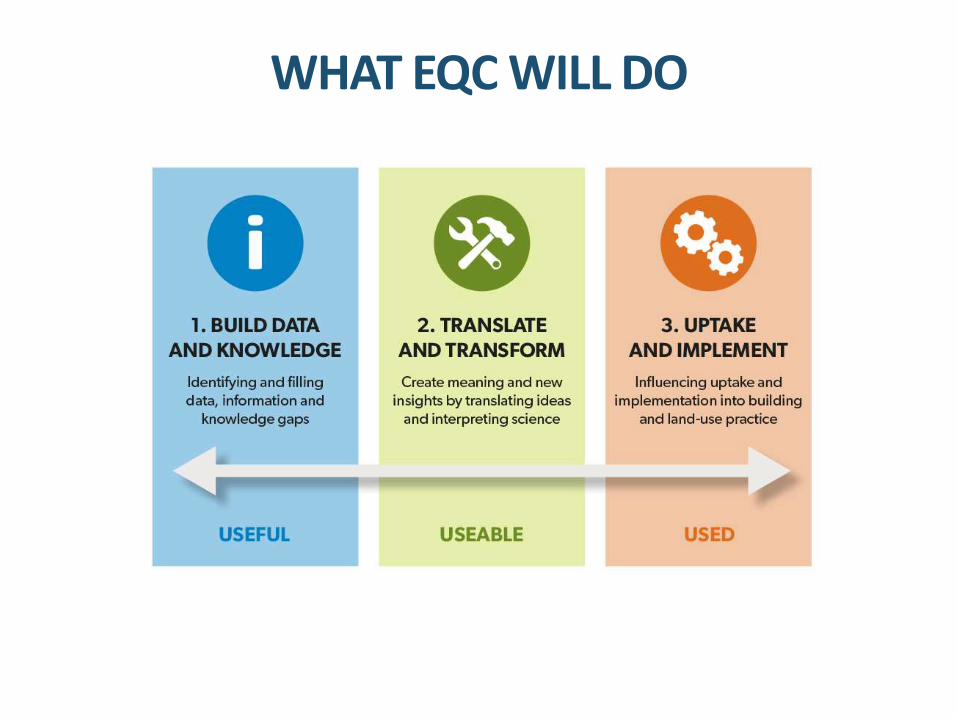
WHAT EQC WILL DO
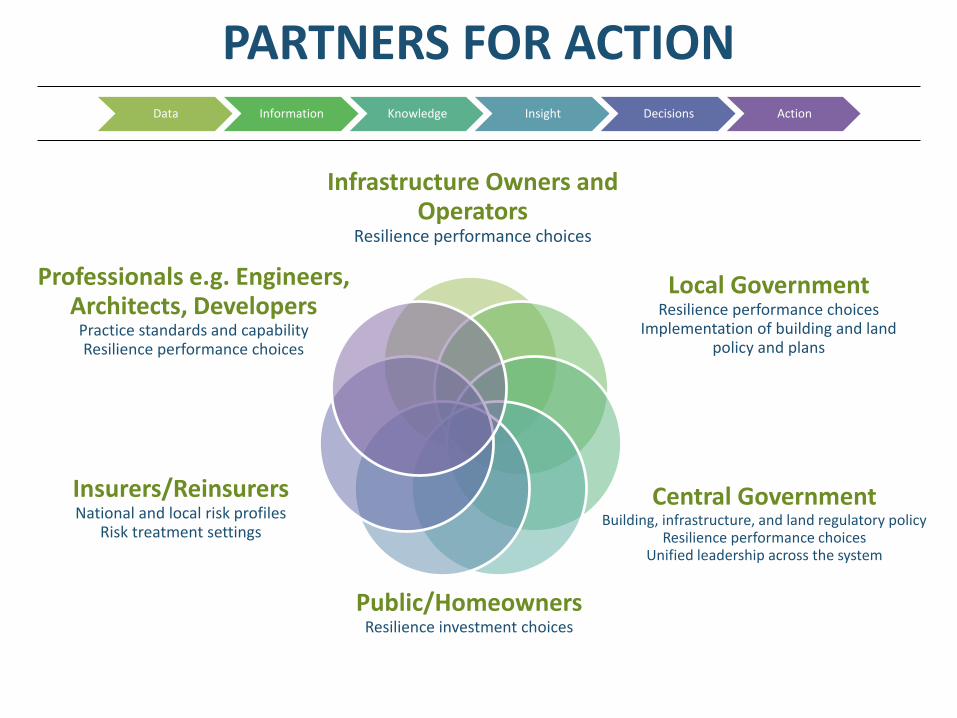
PARTNERS FOR ACTIONData Information Knowledge Insight Decisions Action
Infrastructure Owners and Operators
Resilience performance choices
Central GovernmentBuilding, infrastructure, and land regulatory policy
Resilience performance choicesUnified leadership across the system
Local GovernmentResilience performance choices
Implementation of building and land policy and plans
Professionals e.g. Engineers, Architects, Developers
Practice standards and capabilityResilience performance choices
Public/HomeownersResilience investment choices
Insurers/ReinsurersNational and local risk profiles
Risk treatment settings
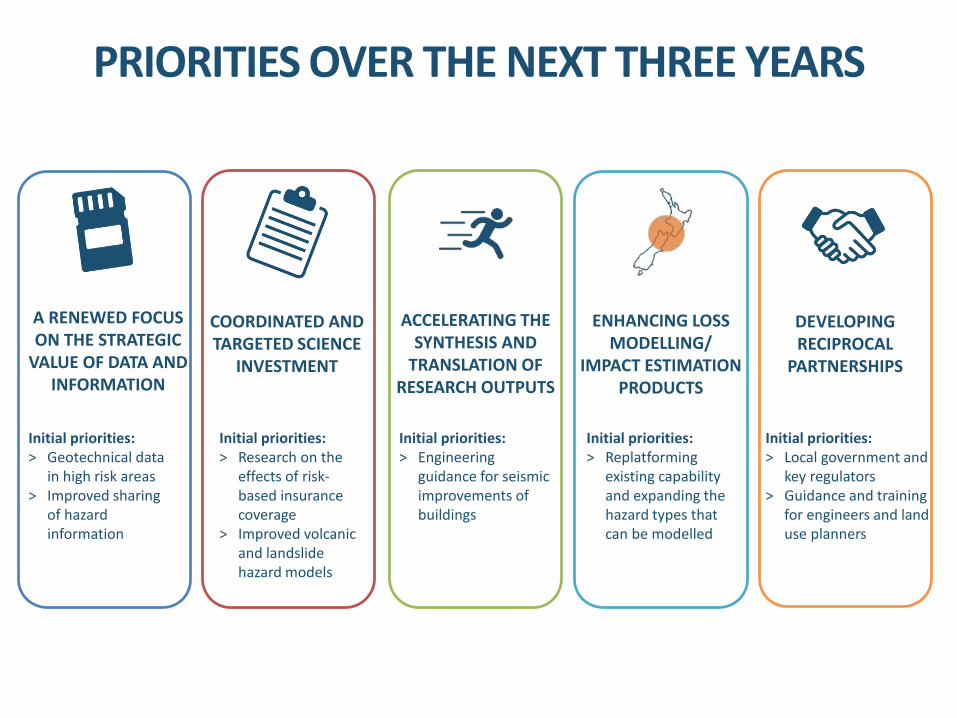
PRIORITIES OVER THE NEXT THREE YEARS
A RENEWED FOCUS ON THE STRATEGIC
VALUE OF DATA AND INFORMATION
Initial priorities:˃ Geotechnical data
in high risk areas˃ Improved sharing
of hazard information
COORDINATED AND TARGETED SCIENCE
INVESTMENT
Initial priorities:˃ Research on the
effects of risk-based insurance coverage
˃ Improved volcanic and landslide hazard models
ACCELERATING THE SYNTHESIS AND
TRANSLATION OF RESEARCH OUTPUTS
Initial priorities:˃ Engineering
guidance for seismic improvements of buildings
ENHANCING LOSS MODELLING/
IMPACT ESTIMATION PRODUCTS
Initial priorities:˃ Replatforming
existing capability and expanding the hazard types that can be modelled
DEVELOPING RECIPROCAL
PARTNERSHIPS
Initial priorities:˃ Local government and
key regulators˃ Guidance and training
for engineers and land use planners
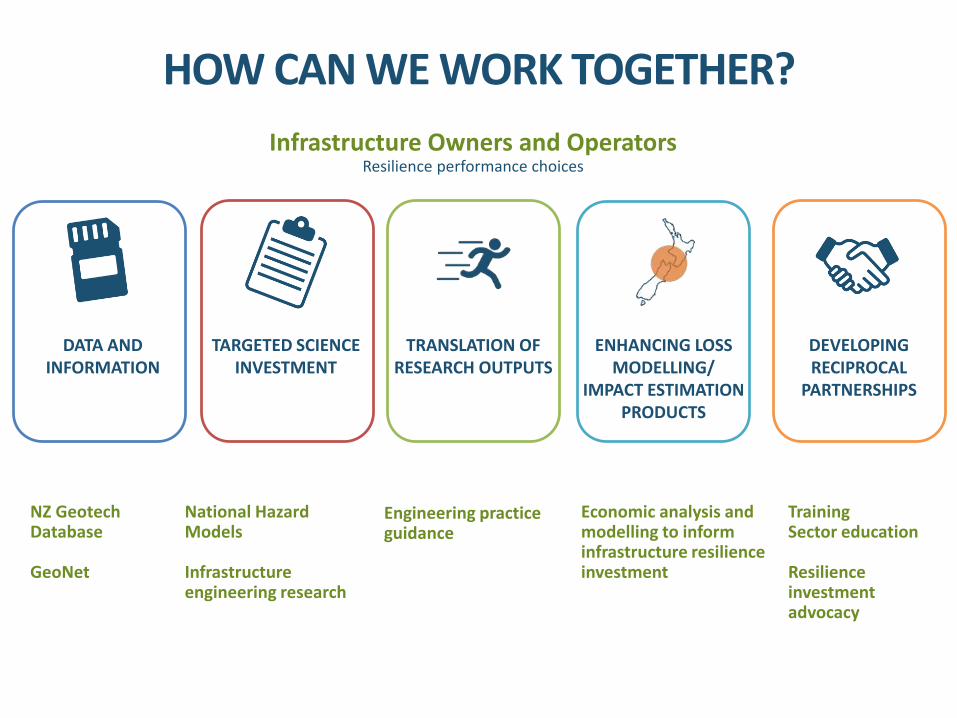
HOW CAN WE WORK TOGETHER?
Infrastructure Owners and OperatorsResilience performance choices
DATA AND INFORMATION
TARGETED SCIENCE INVESTMENT
TRANSLATION OF RESEARCH OUTPUTS
ENHANCING LOSS MODELLING/
IMPACT ESTIMATION PRODUCTS
DEVELOPING RECIPROCAL
PARTNERSHIPS
NZ GeotechDatabase
GeoNet
National Hazard Models
Infrastructure engineering research
Engineering practice guidance
Economic analysis and modelling to inform infrastructure resilience investment
TrainingSector education
Resilience investment advocacy
THANK YOU