
Adaptation of tropical and subtropical pine plantation forestry to climate change
22
Title: Adaptation of tropical and subtropical pine plantation forestry to climate change: realignment of Pinus patula and Pinus tecunumanii genotypes to 2020 planting site climates. Running headline: Tropical pine plantations and climate change Corresponding author Mr. Christoph Leibing Zentrum Holzwirtschaft, Universität Hamburg, Leuschnerstrasse 91, D‐21031, Hamburg, Germany Fax: +494030031770 Telephone: +494030031770 E‐mail: [email protected] Co‐authors Mr. Maarten van Zonneveld Bioversity International, Americas office, km 17 recta Cali/ Palmira, PO 6713, Cali, Colombia. Dr. Andrew Jarvis International Centre of Tropical Agriculture (CIAT) and Bioversity International, km 17 recta Cali/ Palmira, PO 6713, Cali, Colombia. Dr. William Dvorak Central America and Mexico Coniferous Resources Cooperative (CAMCORE), North Carolina State University, 2720 Faucette Drive, 3229 Jordan Hall Addition, Raleigh, North Carolina 12 27695‐8008 Suggested Reviewers (1) Cuauhtemoc Saenz Romero, Universidad Michoacana de San Nicolás de Hidalgo [email protected] Dr. Saenz‐Romero has a large list of references of research on Mexican pine species, and has also carried out research about the impact of climate change on these species. He was referred to two times in the manuscript. (2) Robert Hijmans, IRRI [email protected] Dr. Hijmans is an expert in GIS and published many articles about modeling species’ climatic niches. He is referred to in the article and is also the principal developer of the DIVA‐GIS program. (3) David L. Spittlehouse, British Columbia Ministry of Forests and Range [email protected] David Spittlehouse published many articles on forest management adaptation to climate change. He is referred to three times in this article. (4) Erik Dahl Kjær, Forest and Landscape, Denmark [email protected] Professor Kjaer is an expert in the field of sustainable forest and landscape management in the face of climate change. He has a long history of working with multisite provenance trials. (5) Michael Köhl, World Forestry, Hamburg [email protected] Professor Michael Köhl is a specialist for quantitative methods and published many articles in this field. His active research areas are forests and climate change and forest growth modeling. 1
Transcript of Adaptation of tropical and subtropical pine plantation forestry to climate change

Title: Adaptation of tropical and subtropical pine plantation forestry to climate change: realignment of Pinus patula and Pinus tecunumanii genotypes to 2020 planting site climates. Running headline: Tropical pine plantations and climate change Corresponding author Mr. Christoph Leibing Zentrum Holzwirtschaft, Universität Hamburg, Leuschnerstrasse 91, D‐21031, Hamburg, Germany Fax: +494030031770 Telephone: +494030031770 E‐mail: [email protected] Co‐authors Mr. Maarten van Zonneveld Bioversity International, Americas office, km 17 recta Cali/ Palmira, PO 6713, Cali, Colombia. Dr. Andrew Jarvis International Centre of Tropical Agriculture (CIAT) and Bioversity International, km 17 recta Cali/ Palmira, PO 6713, Cali, Colombia. Dr. William Dvorak Central America and Mexico Coniferous Resources Cooperative (CAMCORE), North Carolina State University, 2720 Faucette Drive, 3229 Jordan Hall Addition, Raleigh, North Carolina 12 27695‐8008 Suggested Reviewers (1) Cuauhtemoc Saenz Romero, Universidad Michoacana de San Nicolás de Hidalgo [email protected] Dr. Saenz‐Romero has a large list of references of research on Mexican pine species, and has also carried out research about the impact of climate change on these species. He was referred to two times in the manuscript. (2) Robert Hijmans, IRRI [email protected] Dr. Hijmans is an expert in GIS and published many articles about modeling species’ climatic niches. He is referred to in the article and is also the principal developer of the DIVA‐GIS program. (3) David L. Spittlehouse, British Columbia Ministry of Forests and Range [email protected] David Spittlehouse published many articles on forest management adaptation to climate change. He is referred to three times in this article. (4) Erik Dahl Kjær, Forest and Landscape, Denmark [email protected] Professor Kjaer is an expert in the field of sustainable forest and landscape management in the face of climate change. He has a long history of working with multisite provenance trials. (5) Michael Köhl, World Forestry, Hamburg [email protected] Professor Michael Köhl is a specialist for quantitative methods and published many articles in this field. His active research areas are forests and climate change and forest growth modeling.
1

2

3
1 2 3 4 5 6 7 8 9
10 11 12 13 14 15 16 17 18 19
Abstract Pinus patula and Pinus tecunumanii, two pines native from Mexico and Central America are important plantation species for the forestry sector in the (sub)tropics. In the last decades members of the International Tree Conservation & Domestication Program (CAMCORE), North Carolina State University, have established large multi site provenance trials for these pine species. The data provide valuable information about species and provenance choice for plantation establishment in many regions with different climates. However, since climate is changing rapidly, it might become increasingly difficult to choose the right species and provenance to plant. The aim of the study is to test the suitability of seed material under changing climate of two P. patula varieties, P. patula var. patula and P. patula var. longipedunculata, and two P. tecunumanii ecotypes (highland and lowland). For each variety and ecotype, a site growth model was developed that statistically relates growth with environmental factors and couples the predictions to the average 2020 climate prediction of four general circulation models. Three developed models were significant and robust. Provenances of P. tecunumanii from lowland areas in Central America are expected to be most productive in 2020 because of their promising performance under rather hot and wet climates. Keywords: climate change impact predictions, management decision support tools, provenance trials, site growth modeling, height growth

20 21 22 23 24 25 26 27 28 29 30 31 32 33 34 35 36 37 38 39 40 41 42 43 44 45 46 47 48 49 50 51 52 53 54 55 56 57 58 59 60 61 62 63 64 65 66 67 68 69 70 71
Introduction Global climate alterations will likely impact productivity of plantation forestry in the next decades. Forest growth models suggest substantial loss of production in the core area of current forestry if no appropriate actions are taken (Fairbanks, 1999; Spittlehouse & Stewart, 2003). At the same time planted forests become increasingly important to satisfy global wood demand (Carle & Holmgren, 2008). Planted forests may also indirectly reduce pressures in natural forests and are potential sources for carbon sequestration (Carle & Holmgren, 2008), and in that way contribute to the mitigation of climate change. To assure the supply of the expected products and services from planted forests in the next decades under changing climate, plantation forest management needs to be adapted accordingly. The selection of species and provenances that are most suitable to grow under the new climates that are expected to occur is an important aspect of a management plan that aims to adapt plantation forests (Spittlehouse & Stewart, 2003). It can be anticipated that seed material used in the past decades to establish new plantations will not be optimal under the changing climate in the next decades. New sources of seed will need to be found to optimize wood productivity. In the last decades multi‐site provenance trials have been established to identify which are most suitable species and provenances to plant in different climates (e.g. Dvorak et al. 1995; Hodge & Dvorak, 1999, Kanzler, 2002). Site growth modeling has proved to be a practical and accurate method to predict the performance of species and provenance in these experiments (Louw & Scholes, 2004). Support decision models that couple site growth modeling to future climate predictions based on General Circulation Models (GCMs) can be a useful tool for forest managers to choose which provenances and species to plant today in order to yield optimal growth during the rotations in the following decades. Significant areas of planted forests are grown in tropical and subtropical areas of Colombia, Brazil and South Africa (FAO, 2007). Pinus patula and Pinus tecunumanii, two pine species native to Mexico and Central America are important plantation species for the forestry sector in the tropics and austral regions. In the last decades the members of the International Tree conservation & domestication Program(CAMCORE) have established multi‐site provenance trials on a global level that include 74 trials and 79 trials of P. patula and P. tecunumanii, respectively, to identify the growth and survival of these species and provenances across different environments. The results from these trials represent a treasure trove of data suitable for understanding how trees are adapted to their abiotic environment, and how they adapt to different conditions. P. patula is one of the most important pine plantation species in tropical and subtropical regions with close to one million hectares established in plantation (Birks and Barnes, 1991). It is of primary importance in South Africa where the pine is the most commonly planted species accounting for 25% of the country’s entire forest plantation area (FAO, 2007). Lesser amounts of P. tecunumanii are used in plantations, but it is an important plantation species in Colombia, and due to its favourable growth characteristics and comparatively high resistance against pitch canker (Hodge & Dvorak, 2006) the species is also gaining importance in Brazil and southern Africa (Dvorak et al. 2000). P. patula, occurs naturally in the mountainous regions of eastern and southern Mexico. Two varieties can be distinguished: P. patula var. patula which occurs in the eastern mountain ranges of the Sierra Madre Oriental and P. patula var. longipendiculata which occurs in the southern Mexican states of Guerrero and Oaxaca in the Sierra Madre del Sur (Dvorak et al., 2000). The geographical distribution of P. patula var. longipendiculata borders with the western distribution range of P. tecunumanii. P. tecunumanii distribution extends from Chiapas, Mexico in the north to Honduras in the south and can be divided into two ecotypes based on altitude: a highland ecotype found in cloud
4

72 73 74 75 76 77 78 79 80 81 82 83 84 85 86 87
forests between altitudes of 1500–2900 m, and a lowland ecotype that occurs between altitudes of 450 and 1500 m (Dvorak et al., 1989). Site growth modeling has proved to be a practical and accurate method to predict the performance of species and provenance in these experiments (Louw & Scholes, 2004). Decision support models that couple site growth modeling to future climate predictions based on General Circulation Models (GCMs) can be a useful tool for forest managers to choose which provenances and species to plant today in order to yield optimal growth during the rotations in the following decades. This study aims to contribute to the development of management plans to adapt existing planted forests in Colombia, Brazil and South Africa to the expected climate changes in the next decades. It is hypothesized that in several areas, species and provenance choice of seed material has to be changed in order to sustain the productivity of these planted forests in the next decades. The objective of this study is to develop a decision support model that 1) predicts the impact of climate change on wood productivity for new rotation cycles that have an expected harvest time around 2025 and 2) identifies the most suitable variety and ecotype of respectively P. patula and P. tecunumanii to optimize wood productivity in the time period of these new rotation cycles.
5

88 89 90 91 92 93 94 95 96 97 98 99
100 101 102 103 104 105 106 107 108 109 110 111 112 113 114 115 116 117 118 119 120 121 122 123 124 125 126 127 128 129 130 131 132 133 134 135 136 137 138
Material and Methods To develop the decision support model we drew on eight‐year old P. patula and P. tecunumanii height growth data from a database of 153 provenances trials that were established by CAMCORE members in Colombia, Brazil and South‐Africa during 1981 and 1997 (Dvorak & Donahue, 1995; Dvorak et al. 2001). For each of the two P. patula varieties, P. patula var. patula and P. patula var. longipedunculata, and the two P. tecunumanii ecotypes, lowland and highland P. tecunumanii, three different site growth model types that examined relations between height growth and environmental conditions were developed. The models were cross‐validated with an independent set of test data as an indication of model robustness. The model types that scored best in the cross‐validation were used in the final growth prediction. Geographical Information Systems (GIS) were used to spatialize model predictions to other plantation areas and project them into the future. The average of 4 GCM climate projections for the year 2020 were used to calculate the expected impact of climate change on plantation’s growth performance in a time span that falls below the common rotation cycle of 17 years. Study area The study area comprises areas suitable for Pinus patula and Pinus tecunumanii plantations in contemporary and future (2020) climates in Colombia, Brazil and South Africa. The areas include a topographic range from 25 to 2850 m and diverse climates that range from tropical conditions in Colombian highlands where annual rainfall frequently exceeds 3000 mm to the dry subtropical conditions characterized by cold and dry winters in South Africa where maximum annual mean temperature exceeds 20 °C but temperature seasonality is more than ten times as high as in Colombia. In South Africa the coldest quarter of the year temperature drops below 1°C. The trials were planted in parts of the northern tropical Andes in Colombia, and in southern Brazil where trials are established in the states of Minas Gerais, Epirito Santo, Paraná and Santa Catarina. Trial sites in South Africa are located in the country’s eastern escarpment from the Eastern Cape Province to the Northern Province. Management (site preparation, spacing of trees, weed control, etc.) among trials was as similar as practical in the field. Data We aimed to predict average observed height growth at age eight years and select through stepwise regression the environmental variables that best explain height performance at trial sites. The pool of variables that were used as input consisted of grid‐based climate, soil and topography variables (Table 1). Data for the 153 provenance trial locations was extracted using ArcInfo (ESRI, 2006). The 19 Bioclim candidate variables (Busby, 1991) were chosen to describe the climate in the study area. The data is derived from the WorldClim database developed by Hijmans et al. (2005). Additionally two water balance variables, water availability and potential‐ to actual evapotranspiration were calculated using satellite‐based observation of rainfall from the Tropical Rainfall Measurement Mission. Soil conditions (topsoil) were described by variables of the Harmonized World Soil database (FAO, 2008). Topography variables were derived from the Shuttle Radar Topography Mission 90m Digital Elevation Data (Jarvis et al., 2008). All variable grids were scaled to the same spatial resolution of 30 arc‐seconds except the TRMM based variables data which have a resolution of 15 arc‐minutes. (Table 1) Model selection Single regression analyses showed that some environmental variables predicted height growth best following a linear relation while others did so through a quadratic relation (data not presented). Since it was not known before hand which type of relations would weigh more in a Multiple Linear Regression (MLR) model, three different types of MLR models were compared, all three using
6
139 140 141 142 143 144 145 146 147 148 149 150 151 152 153 154 155 156 157 158 159 160 161 162 163 164 165 166 167 168 169 170 171 172 173 174 175 176 177 178 179 180 181 182 183 184 185 186 187 188 189 190
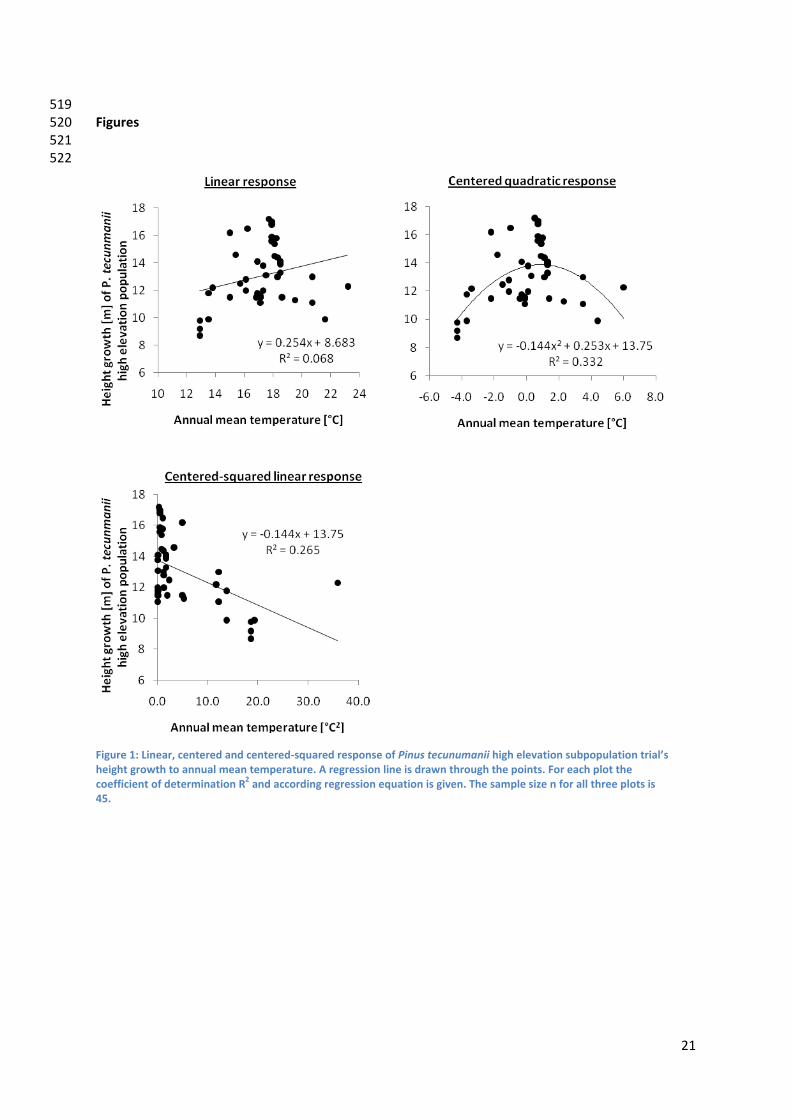
stepwise regression for the selection of model variables. The first model type “LINEAR” consisted of standard linear relations between height growth and environmental variables. The second model type “SQUARED” consisted of linear relations with centered‐squared variables. In the third model type “MIXED” the environmental predictors were either linear or centered‐squared dependent on which type of relation explained best height growth in a single regression analysis. The development of squared centered variables is a recommended method to improve linear regression models (Bedrick, 2000). The value of the original environmental variable is centered by subtracting the variable’s mean from each value and then squared. The transformed variables are then again related linearly to the dependent variable. Figure 1 exemplifies this variable transformation by showing P. tecunumanii high elevation population height growth linear, centered quadratic, and centered squared linear response to the annual mean temperature at trial sites. (Figure 1) For each variety and ecotype, cross validation of all three model types was carried out as an indicator of how the model could be extrapolated to larger areas. After Hurvich & Tsai (1990), we used 20%of the initial data set to validate the model types developed using the remaining 80% of data. As an indicator of robustness the coefficient of determination (R2) was calculated based on the comparison between observed and predicted height of the test data. For each of the two P. patula varieties and the two P. tecunumanii ecotypes, the model type that scored best in the cross validation was selected to do the definitive growth prediction of the respective variety and ecotype, using all data. Variable selection To find the subset of predictors that best explain height growth, the stepwise regression algorithm was used. This is a common method in variable selection for site growth models (Huston, 1980; Dise & Wright, 2000). The stepwise algorithm defines the best possible set of variables to explain the variability in height growth at age eight year. As variables are added during the model run there is continuous re‐appraisal of the existing set of included variables. If, in the light of the most recently added variable, an included variable no longer satisfies the retention criteria, it is deleted from the model (Mac Nally, 2000). The retention criterion of variables in our model runs was set on a probability value (p) of below 0.05. The coefficient of determination (R2) was used to express the model’s fit. To guard against the negative effect that multi‐colinearity has on the stability of regression coefficients and significance levels (Mac Nally, 2000) variance inflation (Vif) was calculated to indicate the rate of multi‐colinearity. Variables were taken out of the modeling process if their Vif‐ score exceeded 30, which is a common threshold to test for multi‐collinearity (O'Brien, 2007). Model spatialization In order to identify suitable seed material for plantation sites, Arcmap’s grid calculator (ESRI, 2006) was used to project spatially the developed multiple linear regression equation for each variety and ecotype. Height growth of the respective variety and ecotypes is calculated for each grid in the study
the v hose grids. The equations have the area based on values of the en ironmental variables in tgeneral form: pht8 βo β1xi1 β2xi2 … βnxin for i 1,2,…n where pht8 = predicted average height performance at age 8 βo = intercept β1 = Pearson’s correlation coefficient with the dependent of first environmental variable xi1 = value of first environmental variable […] βn = Pearson’s correlation coefficient with the dependent of n
th environmental variable and xin = value of n
th environmental variable Current and future climate projections
7
191 192 193 194 195 196 197 198 199 200 201 202 203 204 205 206 207 208 209 210 211 212 213 214 215
The study area for which the site growth prediction models were developed was restricted to the environments that resemble the actual environmental niche in which the provenance trials are established. This avoids an extrapolation of the regression functions to environments where no empirical information was available and impedes the prediction of unrealistic and impossible height growths. A mask grid was calculated that comprises only the study area that has a similar bioclimatic set‐up to the climatic niche in which the trials were established. The mask used the minimum and maximum values of the 19 BIOCLIM variables at trials sites. All model operations use this mask as a template for their predictions. By substituting the climate grids for current conditions with climate grids for the future we inferred climate change’s impact on the height performance of the plantings by 2020 under the emission scenarios A2a and B2a. Four 4th assessment GCM runs from the Canadian Centre for Climate Modeling and Analysis (CCCMA), Commonwealth Scientific & Industrial Research Organization (CSIRO), Hadley Centre Coupled Climate Model (HADCM) and National Institute for Environmental Studies (NIES) models were used for the future climate. To compare height growth of the three taxa under current climate and future climate by 2020 using the independent t‐tests were carried with the predicted values at the field trials. In order to address variation in projected climate brought about by GCM model uncertainty, the standard deviation of height growth for each variety and ecotype under the four GCM model projections was calculated. To see if and adapted planting decision results in a significant improvement of height growth an independent t‐test was carried out. The three taxa’s height growth under current and future climate by 2020 was calculated and changes in performance for the best seed choice under current and best seed choice under future climate conditions were tested for their significance.
8
216 217 218 219 220 221 222 223 224 225 226 227 228 229 230 231 232 233 234 235 236 237 238 239 240 241 242 243 244 245 246 247 248 249 250 251 252 253 254 255 256 257 258 259 260 261 262 263 264 265 266
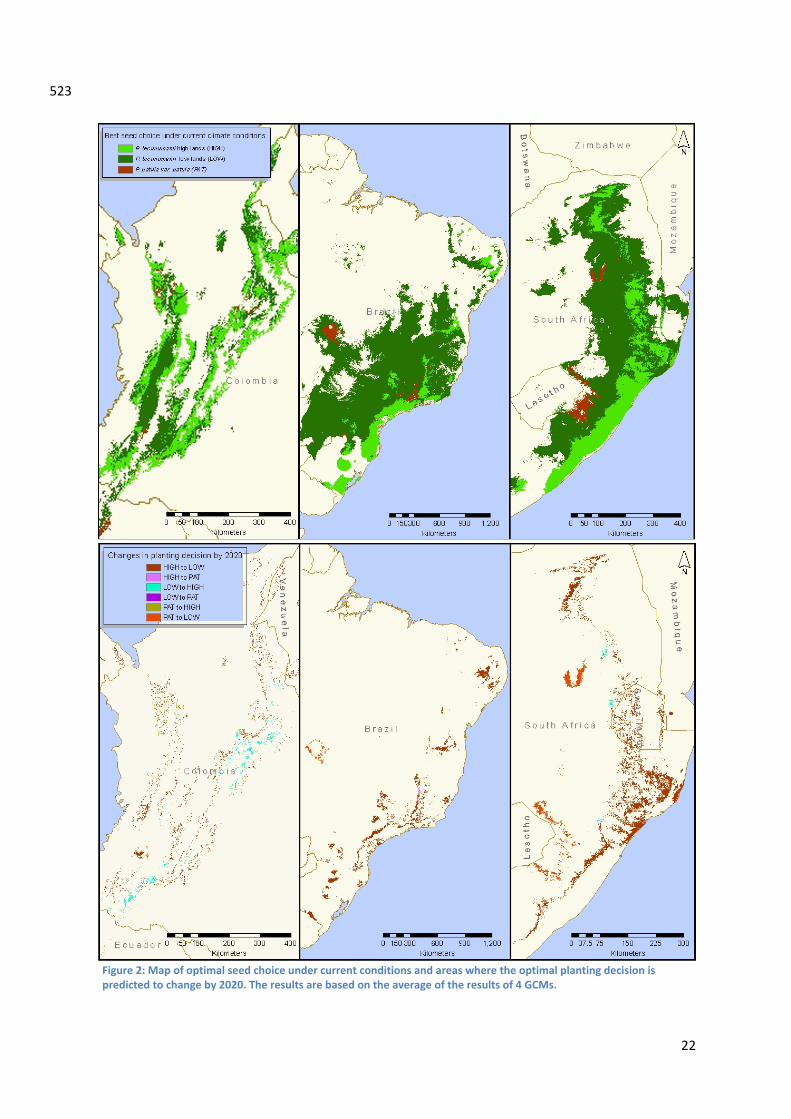
Results Model selection and performance Based on the results of the cross validation the most robust model types to predict height growth were selected (Table 2). The LINEAR model type is the most confident model type to predict height growth of P. patula var. patula and the P. tecunumanii lowland ecotype. The MIXED model type proved to be the most successful in predicting height growth of the P. tecunumanii highland ecotype. (Table 2) In none of the three models types a regression equation could be developed that significantly predicted 8 year old height growth of P. patula var. longipendiculata; Coefficient of determination scores (R2) were 0.22 or lower. Due to this fact no site growth predictions were made for this variety. The multiple regression equations for P. patula var. patula, the P. tecunumanii highland and lowland ecotypes yielded respectively a R2 score of 0.61, 0.62 and 0.56 (and p‐values of < 0.001, < 0.001 and 0.008 respectively). The equations are as follows: [predicted height of the P. tecunumanii highland ecotype at age 8] = 14.6690 ‐ 0.0012 * [annual mean temperature] ‐ 172.11) + [annual mean temperature] ‐ 172.11)) + 0.1179 * [cation exchange capacity of topsoil] ‐ 0.0021 * [elevation above sealevel] [predicted height of the P. tecunumanii highland ecotype at age 8] = ‐9.3600 + 0.0617 * [cation exchange capacity of topsoil] + 0.1399 * [mean diurnal temperature range] + 0.0502 * [annual mean temperature] ‐ 0.0545 * [precipitation seasonality] [predicted height of P. patula var. patula at age 8 ] = ‐19.0058 + 0.0046 * [annual precipitation] + 0.2054 * [mean diurnal temperature range] Expected impact of climate change on wood productivity and seed material choice Under current climate P. tecunumanii low elevation provenances are predicted to exhibit a superior growth performance in the majority of the study area (figure 2). In Colombia high elevation provenances of P. tecunumanii outperforms the other two seed choices at altitudes above 1800m. In southern Brazil in the coastal near areas of the southern Brazilian states Santa Catarina, Paraná, Sao Paula and Rio de Janeiro the high elevation seed sources of P. tecunumanii shows best height growth. P. patula var. patula is predicted to reach competitive growth rates in the interior of Brazil and South Africa and is able to surpass the fast growing provenances from the Pinus tecunumanii’s low and high elevation populations. In the overall study area eight‐year old height growth in all three countries is predicted not to change significantly by 2020 (t ‐ test, n = 94, m = 49, p = 0.4152). Still our models predict that in 7.3 % of the study area the choice of seed material today should be changed to adequately adapt plantation forestry by 2020. (Figure 2) In Colombia 9.3 % of the study area is subject to change whilst in South‐Africa 8.6 % and Brazil 7.4 % of the study area is subject to change. Height growth in year eight is predicted to decline by 0.39m if seed material is not changed. In those areas height at 8 year old plantations is predicted to be diminished with 0.39m if seed material will not be changed. A change to the best seed source under future climate will significantly improve this situation by minimizing height loss at year eight to only ‐0.04 m (t ‐ test, n = 14, m = 14 p < 0.0004). In 95% of the cases the new best choice of seed material is from provenances of the P. tecunumanii low ecotype. In Colombia for example the area where P. tecunumanii lowland ecotypes is predicted to perform best by 2020, moves 80 m higher in altitude. The height of the P. tecunumanii low
9

267 268 269 270 271 272 273 274 275 276 277 278 279 280 281
ecotype is predicted to increase by 0.28 cm in eight year‐old plantings by 2020. Provenances from high elevation seed sources are predicted to be most seriously affected by climate, reducing their average height growth by 1.16 m. Pinus patula var. patula exhibits comparatively stable growth responses to the environmental changes only losing an average of 0.14 m in the study area (table 3). (Table 3) Uncertainty in climate change projections The standard deviation (σ) of the predicted mean mapped values calculated for the 4 GCMs serves as an additional indicator for the variability between GCM predictions (Table 3). σ and therewith uncertainty of the GCM projections is highest for the site growth model of Pinus tecunumanii low elevation population. σ ranges for the studied ecotypes and variety from 0.25 to 0.4. The evaluation of uncertainty in climate change projections should also take the spatial variability in uncertainty into account. σ between GCM projections calculated for Brazil, Colombia and South Africa independently shows a homogenous σ of 0.32 for each country.
10
282 283 284 285 286 287 288 289 290 291 292 293 294 295 296 297 298 299 300 301 302 303 304 305 306 307 308 309 310 311 312 313 314 315 316 317 318 319 320 321 322 323 324 325 326 327 328 329 330 331 332
Discussion Demand for wood from planted forests is expected to increase in the next decades (Carle & Holmgren, 2008) while significant wood losses are expected if no appropriate actions are undertaken to adapt plantation forestry to climate change (Fairbanks, 1999; Spittlehouse & Stewart, 2003). The importance of selecting appropriate plantation seed material in the face climate change has been pointed out by Persson (1998) for Pinus silvestris in temperate and boreal plantation forestry. Optimal niches of Pinus silvestris provenances’ height growth are predicted to shift considerably during the next 90 years (Rehfeldt et al., 2002). ). Fairbanks (1999) points out that especially in Pinus patula and Pinus radiata plantation in South Africa a great loss of productivity will occur unless different seed sources are selected that are appropriate for future climate conditions. Through height growth models coupled with future climate scenarios we have shown that for 7‐10% of areas in the study a change in the most suitable seed source will occur to 2020 (less than one production cycle away from the present). Model performance The developed site growth models for the two P. tecunumanii ecotypes and P. patula var. patula were significant, especially the goodness to fit (R2 adj.) of the model for the P. tecunumanii highland ecotype was excellent. No problems are expected in the extrapolation of the model predictions to the whole the study area because this area is within the climate ranges where the field trials are established and cross validation for all three selected models was significant. The selected model for P. patula var. patula can be considered very robust since the cross validation resulted in a high coefficient of determination. The model for the P. tecunumanii lowland ecotype was still fairly robust according to the cross validation and the growth model predictions also coincided with indicated elevations for optimal growth of this ecotype. Cross validation of the model for the P. tecunumanii highland ecotype resulted in a moderate but still significant coefficient of determination. In Colombia under current climate conditions a distinct altitude range can be identified at which the height growth of P. tecunumanii highland ecotype surpasses the P. tecunumanii lowland ecotype growth performance. This threshold ranges from 1300 to 1700 m, coinciding with the altitude that separates the two subpopulations inside their natural distribution range in Honduras (Dvorak et al., 2000). This demonstrates that both ecotypes are best adapted to divergent environments that in each case resemble their respective native niche. This underlines two facts. First, provenances are indeed adapted to their specific environmental conditions and second, it is important to conserve a wide range of seed sources to sustain diversity’s value for plantation forestry in heterogeneous environments and in the face of a changing climate. For P. patula var. longipedunculata no significant site growth model could be developed. From the four different taxa studied, the least data was available for P. patula var. longipendiculata. To improve the prediction of the impact of climate change on height growth for this variety it is recommended to include height data from more field trials established over a wider climate range than we were able to access. Impact of climate change on wood productivity and choice of seed material In general terms no significant changes are predicted by 2020 across the whole the study area but some specific areas important for wood productivity do show significant changes. . At these sites a change in seed choice has been shown to adapt the existing planted forests to great effectiveness. Two trials in Santa Tereza, Brazil for instance were established using seeds from high elevation populations of P. tecunumanii. Observed and predicted heights on this site differ by just 0.05 m. The regression model predicts that on this site low elevation seed sources would yield the same height growth under current climate conditions. Height growth predictions for the 2020 projections suggest
11
333 334 335 336 337 338 339 340 341 342 343 344 345 346 347 348 349 350 351 352 353 354 355 356 357 358 359 360 361 362 363 364 365
366 367 368 369 370 371 372 373
374
375
376 377 378 379 380
that provenances from the low elevation population of Pinus tecunumanii will reach 13.7 m in height at eight years while the high elevation population will reach only 12.09 m. This is a significant difference and should be an important criteria used today in selecting seed sources for this site. P. tecunumanii lowland ecotype is expected to be the most suitable seed material to plant for the next rotation because of their promising performance under rather hot and wet climates. On sites in South Africa where P. patula var. patula is planted, seed material from P. tecunumanii lowland provenances is either already more suitable or becomes more suitable by 2020 (figure 2). This analysis concentrated on 2020 climates in order to capture the climate during rotations being planted today. However the impacts of climate change are expected to become more drastic in the second half of the 21st century. The results of this analysis could form the basis for exploring the longer term future of plantation forestry in tropical sites, and evaluate what seed materials are necessary to sustain plantation forestry in Colombia, Brazil and South Africa. Implications for the conservation of genetic resources In most plantation areas of Colombia, Brazil and South Africa, seed material of P. tecunumanii lowland ecotypes appears to be the best seed choice for wood productivity under current climate and becomes even more important in the next two decades. However, the analysis also shows the value of diversity, both at the genetic‐ and the species‐ level. Unfortunately, the lowland ecotypes of P. tecunumanii in the wild are most threatened by predicted climate change (van Zonneveld et al., 2009a). This coincides with studies about the impact of climate change on the natural distribution of other tropical pines that demonstrate that lowland provenances will be most negatively affected by climate change (Sáenz‐Romero et al., 2006; van Zonneveld et al., 2009b). Appropriate actions need to be taken to conserve these valuable genetic resources. Sáenz‐Romero et al. (2006) propose seed transfer of lowland P. oocarpa provenances in the wild to higher altitudes in the natural distribution of this species. Another possibility is conservation outside its natural distribution ranges in climate‐proofed conservation parks (van Zonneveld et al., 2009a). Currently CAMCORE members are establishing conservation parks to protect provenances of economically important tree species (CAMCORE, 2009). Further analyses could broaden the analysis to look at other factors, and link with economic models to evaluate the true cost of adaptation of plantation forestry, and support management plans. Evaluation criteria for tree performance
The site growth models in this study only incorporate height growth to assess site’s quality. This is one of the most important commercial characteristics but also other criteria are important when evaluation the potential of different provenances. These include stem form, aberrant growth appearances, disease tolerance, resin content and branching ‐ or rooting characteristics. Of particular importance is the issue of frequent stem breakage which is frequently observed in Pinus tecunumanii plantations where on the worst sites 30 to 40% of the trees are affected. The propensity for the main stem to break in its upper crown is thought to be the greatest limitation for using Pinus tecunumanii in the tropics and subtropics (Dvorak, et al., 2001).
Conclusions
In this study the need to change the currently used seed material of P. patula and P. tecunumanii in the existing plantation areas was evaluated to optimize wood productivity in the face of climate change in the next rotations. Overall no significant changes in wood productivity are predicted. Still several forestry areas are substantially impacted. In those areas a change to a better adapted seed material is expected to sustain wood products under changing climate. Provenances of P.
12

381 382 383 384 385 386
tecunumanii low elevation ecotypes are already important source s of seed material and are predicted to be become an even more important seed material by 2020 because of its good performance under the warmer and wetter climate condition predicted for the future. The models presented here form the basis for developing site‐specific decision support models for selecting planting material under a dynamic climate.
13

387
388 389 390 391 392 393 394 395 396 397
398
Acknowledgements
The corresponding author would like to express his gratitude towards the “Ausgleichsstiftung Landwirtschaft und Umwelt” whose financial support enabled his thesis. We would further like to thank the CAMCORE members in Brazil, Colombia and South Africa for establishing, maintaining and measuring the research field plantings of P. patula and P. tecunumanii. We would like to thank William Woodbridge, Camcore data manager, for his assistance in preparing the large data sets for analysis and for providing support and updates throughout the course of the study. We thank Arjan de Bruijn for his valuable advice in the development of the site growth models. Eventually we would like to thank Julian Ramirez Villegas, Edward Guevara and James Garcia from the agro‐ecosystems resilience office in CIAT for their help and advice on the computation and implementation of the regression functions.
14
399
400
401 402
403
404 405
406
407 408 409
410
411 412
413
414 415
416
417 418 419 420 421
422
423 424
425
426 427
428
429 430 431
432
433 434 435
References
Bedrick, E. J. (2000). Checking for Lack of Fit in Linear Models with Parametric Variance Functions. Technometrics 42 (3), 227‐236 .
Birks, J. S., Barnes, R. D. (1990). Provenance variation in Pinus caribaea, P. oocarpa and P. patula ssp P. tecunumanii. Tropical Forestry Papers , pp 40.
Busby, J.R., (1991). BIOCLIM—a bioclimatic analysis and prediction system. In: Margules, C.R., Austin, M.P. (Eds.), Nature Conservation: Cost Effective Biological Surveys and Data Analysis. CSIRO, Canberra, pp. 64–68.
Carle, J., Holmgren, P. (2008). Wood from Planted Forests: A Global Outlook 2005‐2030. Forest Products Journal 58 (12): 6–18.
Dise, N. B., Wright, R. F. (2000). Nitrogen leaching from European forests in relation to nitrogen deposition . Forest Ecology and Management 71: 153‐161.
Dvorak, W.S., Balocchi, C.E., Raymond, R.H., (1989). Performance and stability of provenances and families of Pinus tecunumanii in the tropics and subtropics. In: Gibson, G.L., Griffin, A.R., Matheson, A.C. (Eds.), Breeding tropical trees: Population structure and genetic improvement strategies in clonal and seedling forestry. Proceedings IUFRO conference, Pattaya, Thailand, November 1988, Oxford Forestry Institute, Oxford, UK, and Winrock International, Arlington, VA, USA, pp. 187–196.
Dvorak, W.S., Donahue J.H., Vásquez., J.A. (1995). Early Performance of CAMCORE Introductions of Pinus patula in Brazil, Colombia and South Africa. South African Forestry Journal 174: 23‐32.
Dvorak, W. S., Hodge, G. R., Romero, J. L. (2001). Results of twenty years of research on Pinus tecunumanii by the CAMCORE Cooperative. Forest Genetic Resources 29.
Dvorak, W.S., Hodge, G.R., Kietzka, J.E., Malan, F., Osorio, L.F., Stanger, T.K., (2000). Pinus patula. In: Conservation & Testing of Tropical & Subtropical Forest Tree Species by the CAMCORE Cooperative, College of Natural Resources, North Carolina State University, Raleigh, NC, USA, pp. 148–173.
Dvorak, W.S., Jordan, A.P., Romero, J.Lr., Hodge, G.R., Furman, B.J. (2001). Quantifying the geographic range of Pinus patula var longipedunculata in Southern Mexico using morphologic and RAPD marker data. Southern African Forestry Journal 192: 19‐30.
15
436
437
438
439 440
441
442 443
444
445 446
447
448 449 450
451
452 453
454
455 456
457
458 459
460
461 462
463
464 465 466
467
468 469
470
ESRI. (1982 ‐ 2006). Arc 9.2 Arc/Info. Environmental Systems Research Institute Inc .
Fairbanks, D. (1999). South African Country Study on Climate Change: Vulnerability and Adaptation Assessment for Plantation Forestry. Pretoria: National Research Foundation.
FAO. (2007). State of the world's forests 2007. Rome: Food and Agriculture Organization of the United Nations.
FAO/IIASA/ISRIC/ISSCAS/JRC, 2009. Harmonized World Soil Database (version 1.1). FAO, Rome, Italy and IIASA, Laxenburg, Austria.
Hijmans, R.J., Cameron, S.E., Parra, J.L., Jones, P.G., Jarvis, A. (2005). Very high resolution interpolated climate surfaces for global land areas. International Journal of Climatology 25: 1965–1978.
Hodge, G.R., Dvorak, W.S. (1999).Genetic Parameters and Provenance Variation of Pinus tecunumanii in 78 International Trials. Forest Genetics 6 (3): 157‐180.
Hurvich, C. M., & Tsai, C. L. (1990). The impact of model selection on inference in linear regression. American Statistician 44, 214‐217.
Huston, M. (1980). Soil nutrients and tree species richness in Costa Rican forests. Journal of Biogeography , 147‐157.
Jarvis A., H.I. Reuter, A. Nelson, E. Guevara, 2008, Hole‐filled seamless SRTM data V4, International Centre for Tropical Agriculture (CIAT), available from http://srtm.csi.cgiar.org.
Kanzler, A. (2002). Genotype x Environment Interaction in Pinus Patula and its Implications in South Africa. PhD dissertation. Department of Forestry, North Carolina State University, Raleigh, NC, USA, pp. 229.
Louw, J. H. (1999). A review of site‐growth studies in South Africa. South African Forestry Journal 185: 57‐65.
16
471 472
473
474 475 476
477
478 479
480
481 482
483
484 485 486 487 488 489 490 491 492 493 494 495 496
497
498 499
500 501
Louw, J. H., & Scholes, M. C. (2006). Site index functions using site descriptors for Pinus patula plantations in South Africa. Forest Ecology and Management 225, 94‐103.
Mac Nally, R. (2000). Regression and model‐building in conservation biology, biogeography and ecology: The distinction between – and reconciliation of – ‘predictive’ and ‘explanatory’ models. Biodiversity and Conservation 9 (5): 655–671.
O'Brien, R. M. (2007). A Caution Regarding Rules of Thumb for Variance Inflation Factors. Quality and Quantity 41 (5): 673‐690.
Persson, B. (1998). Will climate change affect the optimal choice of Pinus sylvestris Provenances? Silva Fennica 32 (2): 121‐128.
Rehfeldt, G.E., Tchebakova, N.M., Parfenova, Y.I., Wykoff, W.R., Kuzmina, N.A., Milyutin, L.I., (2002). Intraspecific responses to climate in Pinus sylvestris. Global Change Biology 8: 912–929. Saénz‐Romero, C., Guzmán‐Reyna, R.R., Rehfeldt, G.E., (2006). Altitudinal genetic variation among Pinus oocarpa populations in Michoacán, Mexico Implications for seed zoning, conservation, tree breeding and global warming. Forest Ecology and Management 229: 340–350 Spittlehouse, D. L., Stewart, R. B. (2003). Adaptation to climate change in forest management. BC Journal of Ecosystems and Management 4 (1), 1‐11. van Zonneveld, M. J., Jarvis, A., Dvorak, W., Lema, G., & Leibing, C. (2009a). Validation of climate change impact predictions on Mexican and Central American pine species. Forest Ecology and Management 257, 1566‐1576.
van Zonneveld, M., Koskela, J., Vinceti, B., Jarvis, A. (2009b). Impact of climate change on the distribution of tropical pines in Southeast Asia. Unasylva 231/232, 24‐29.
17
502 Tables
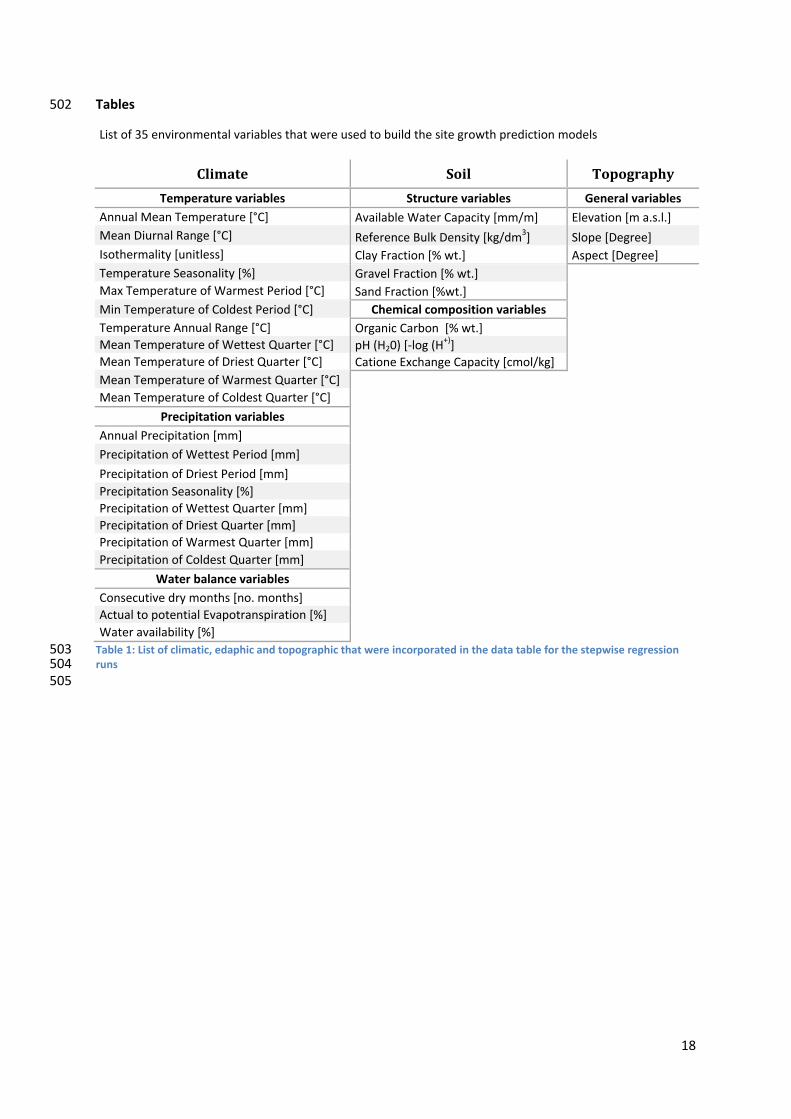
L ist of 35 environmental variables that were used to build the site growth prediction models
Climate Soil Topography
Temperature variables Structure variables General variables Annual Mean Temperature [°C] Available Water Capacity [mm/m] Elevation [m a.s.l.] Mean Diurnal Range [°C] Reference Bulk Density [kg/dm3] Slope [Degree] Isothermality [unitless] Clay Fraction [% wt.] Aspect [Degree] Temperature Seasonality [%] Gravel Fraction [% wt.] Max Temperature of Warmest Period [°C] Sand Fraction [%wt.] Min Temperature of Coldest Period [°C] Chemical composition variables Temperature Annual Range [°C] Organic Carbon [% wt.] Mean Temperature of Wettest Quarter [°C] pH (H20) [‐log (H
+)] Mean Temperature of Driest Quarter [°C] Catione Exchange Capacity [cmol/kg] Mean Temperature of Warmest Quarter [°C] Mean Temperature of Coldest Quarter [°C]
Precipitation variables Annual Precipitation [mm] Precipitation of Wettest Period [mm] Precipitation of Driest Period [mm] Precipitation Seasonality [%] Precipitation of Wettest Quarter [mm] Precipitation of Driest Quarter [mm] Precipitation of Warmest Quarter [mm] Precipitation of Coldest Quarter [mm]
Water balance variables Consecutive dry months [no. months] Actual to potential Evapotranspiration [%] Water availability [%]
503 504 505
Table 1: List of climatic, edaphic and topographic that were incorporated in the data table for the stepwise regression runs
18

506 Comparison of R2 scores of cross validation results for 3 stepwise regression runs
LINEAR R2 SQUARED R2 MIXED R2 HIGH 0.096 0.201 0.337
LOW 0.512 0.001 0.073
VARPAT 0.832 0.812 0.38 507 508 509 510
Table 2: Summary table of cross validation R2 scores for the relation between observed and predicted height of test set trials. The cross validation results are given for the three modeled genotypes HIGH (Pinus tecunumanii high elevation population), LOW (Pinus tecunumanii low elevation population) and VARPAT (Pinus patula var. patula).
19

511 Map mean values for growth prediction models dependent on underlying GCM and emission scenario
CCCMA CSIRO HADCM NIES
pht8 [m] current Δ A2a Δ B2a Δ A2a Δ B2a Δ A2a Δ B2a Δ A2a Δ B2a mean Δ StDev
HIGH 11.7 ‐0.88 ‐0.79 ‐1.04 ‐1.24 ‐1.30 ‐1.17 ‐1.39 ‐1.45 ‐1.16 0.25
LOW 14.83 ‐0.39 ‐0.24 0.48 0.43 0.50 0.51 0.53 0.43 0.28 0.4
VARPAT 11.63 ‐0.56 ‐0.51 0.05 0.11 0.08 0.08 ‐0.17 ‐0.23 ‐0.14 0.29
512 513 514 515 516 517 518
Table 3: Map mean values of predicted height growth at age 8 for the entire study area. The predicted height growth performance under current climate conditions is compared to the anticipated future height growth performance in 2020. Predictions are given for the three modeled genotypes HIGH (Pinus tecunumanii high elevation population), LOW (Pinus tecunumanii low elevation population) and VARPAT (Pinus patula var. patula). The table depicts the different outcomes of the regression models based on the results of 4 GCMs: CCCMA, CSIRO, HADCM and NIES for 2 emission scenarios each.
20
519 520 521 522
Figures
Figure 1: Linear, centered and centered‐squared response of Pinus tecunumanii high elevation subpopulation trial’s height growth to annual mean temperature. A regression line is drawn through the points. For each plot the coefficient of determination R2 and according regression equation is given. The sample size n for all three plots is 45.
21
523
Figure 2: Map of optimal seed choice under current conditions and areas where the optimal planting decision is predicted to change by 2020. The results are based on the average of the results of 4 GCMs.
22


![Imperata brasiliensis, I. cylindrica - InvasiveK115 Sand pine scrub K116 Subtropical pine forest SAF COVER TYPES [38]: 69 Sand pine 70 Longleaf pine 71 Longleaf pine-scrub oak 74 Cabbage](https://static.fdocuments.in/doc/165x107/5e50a01de48dec6cdb2ff813/imperata-brasiliensis-i-cylindrica-invasive-k115-sand-pine-scrub-k116-subtropical.jpg)