ADAM II 2008 Annual Report - hsdl.org
151
ADAM II 2008 annual report offIce of natIonal drug control polIcy eXecutIVe offIce of tHe preSIdent a r r e s t e e d r u g a b u s e m o n i t o r i n g p r o g r a m • II Arrestee Drug Abuse Monitoring Program
Transcript of ADAM II 2008 Annual Report - hsdl.org

ad
am
II • 2008 an
nu
al
re
po
rt
ADAM II 2 0 0 8 a n n u a l r e p o r t
o f f I c e o f n a t I o n a l d r u g c o n t r o l p o l I c ye X e c u t I V e o f f I c e o f t H e p r e S I d e n t
ar
r e s t e e dr
ug
a
bu
se
m
on
itoring
pr
og
ra
m •
IIA r r e s t e e D r u g A b u s e M o n i t o r i n g P r o g r a m


ADAM II2008 AN N U A L RE P O R T
ARRESTEE DRUG ABUSE MONITORING PROGRAM II
OFFICE OF NATIONAL DRUG CONTROL POLICY
EXECUTIVE OFFICE OF THE PRESIDENT
WASHINGTON, DC
April 2009


Acknowledgements
This report was prepared for the Office of National Drug Control Policy (ONDCP), Executive Office
of the President by Abt Associates Inc. Work by Abt Associates was performed under Contract No.
GS-10F-0086K. Contributors and reviewers at Abt Associates listed alphabetically include Meg
Chapman, Chris Flygare, Dana Hunt, Sarah Kuck Jalbert, Ryan Kling, Richard Kulka, William
Rhodes, and Kristen Wheeler. Contributors at ONDCP listed alphabetically include Maria Fe Caces,
Robert Cohen, and Terry Zobeck.


ADAM II 2008 Annual Report Contents i
Contents
Executive Summary ............................................................................................................................. v
Methodology ................................................................................................................................ v
Who Constitutes the ADAM II Sample? .................................................................................... vi
Drug Use and Drug Market Activity ........................................................................................... vi
Matching Self-report to Test Results. ............................................................................... vi
Test Results for the Presence of Any Drugs .................................................................... vii
Marijuana ......................................................................................................................... vii
Cocaine: Crack and Powder ........................................................................................... viii
Heroin ............................................................................................................................... ix
Methamphetamine ............................................................................................................. x
Other Drugs ....................................................................................................................... x
Report Format ............................................................................................................................. xi
1.0 The ADAM II Program: Overview and Methodology ........................................................... 1
Methodology ................................................................................................................................ 4
Drug Testing ...................................................................................................................... 4
Sampling ............................................................................................................................ 5
Case Weighting ................................................................................................................. 6
Imputation .......................................................................................................................... 6
Trend Estimates ................................................................................................................. 6
2.0 Who Constitutes the ADAM II Samples? ................................................................................ 9
Demographic Characteristics of Arrestees ................................................................................... 9
History with Criminal Justice System ........................................................................................ 10
Comparison of Arrestees Testing Positive for Any Drugs and All Other Arrestees .................. 10
Substance Abuse and Mental Health Treatment Experience ..................................................... 11
3.0 Drug Use and Drug Market Activity Among Arrestees ....................................................... 13
Are Arrestees Telling the Truth About Drug Use? .................................................................... 13
Congruence Between Self-Report and Test Results ........................................................ 13
Test Results for the Presence of Any Illicit Drugs ..................................................................... 15
Marijuana ................................................................................................................................... 17
Prevalence of Marijuana Use ........................................................................................... 17
Buying and Selling: Marijuana Markets ......................................................................... 20
Cocaine: Crack and Powder ....................................................................................................... 21
Prevalence of Use: Self-reported Crack Use ................................................................... 22
Buying and Selling: Crack Markets ................................................................................. 24
Prevalence of Use: Self-reported Powder Cocaine Use .................................................. 25
Buying and Selling: Cocaine Powder Markets ................................................................ 27
Heroin ........................................................................................................................................ 28
Prevalence of Use: Heroin .............................................................................................. 28
Buying and Selling: Heroin Markets ............................................................................... 31
Methamphetamine ...................................................................................................................... 32
Prevalence of Methamphetamine Use ............................................................................. 32
Buying and Selling: Methamphetamine Markets ............................................................ 34
Other Drugs ..................................................................................................................... 35
Summary and Conclusions ................................................................................................................ 36

ii Contents ADAM II 2008 Annual Report
Appendix A: Data Tables .................................................................................................................. 39
Table 2.1: ADAM II Characteristics of Adult Male Arrestees, 2007 and 2008 ................... 39
Table 2.2: Race/Ethnicity of Adult Male Arrestees, 2007 and 2008 .................................... 40
Table 2.3: Arrest History of Adult Male Arrestees, 2007 and 2008 ..................................... 41
Table 2.4: ADAM II Adult Male Arrestee Arrest Charges, 2007 and 2008......................... 42
Table 2.5: ADAM II Arrestee Characteristics for Arrestees Testing Positive for Any
Illicit Substance and Arrestees Testing Negative, 2008 .................................... 43
Table 2.6: ADAM II Employment and Housing for Arrestees Testing Positive for Any
Illicit Substance and Arrestees Testing Negative, 2008 .................................... 45
Table 2.7: Lifetime Drug, Alcohol, and Mental Health Treatment Status among All
Arrestees, 2007 and 2008 .................................................................................. 47
Table 2.8: Drug, Alcohol, and Mental Health Treatment Received in the Past 12 Months
Among Arrestees Reporting Prior 12 Month Drug Use, 2007 and 2008 .......... 48
Table 2.9: Past 12 Month Drug, Alcohol, and Mental Health Treatment Among
Arrestees Reporting Prior 12 Month Drug Use, 2007 and 2008 ....................... 49
Table 3.1a: Proportion of Arrestees with Agreement in Self-Report and Urine Test ............ 50
Table 3.1b: Proportion of Arrestees Testing Positive and Self-Reporting Use by Site,
2008 ................................................................................................................... 50
Table 3.2: Urine Test Results on Any or Multiple Drug among Adult Male Arrestees,
2000-2008 .......................................................................................................... 51
Table 3.3: Urine Test Results for Specific Drug Use Among Adult Male Arrestees,
2000-2008 .......................................................................................................... 52
Table 3.4: Self-Reported Use of Marijuana among Adult Male Arrestees, 2007
and 2008 ............................................................................................................ 53
Table 3.5: Average Age at First Use for Those Who Admit Use in Prior 30 Days .............. 54
Table 3.6: Acquisition of Selected Drugs by Adult Male Arrestees, 2007 and 2008 ........... 55
Table 3.7: Percent Reporting Cash Buys in Past 30 Days, 2007 and 2008 .......................... 56
Table 3.8: Percent Reporting Noncash Acquisitions in Past 30 Days, 2007 and 2008 ........ 57
Table 3.9: Percent Reporting Last Drug Buy was from Regular Source, 2007 and 2008 .... 58
Table 3.10: Percent Reporting Last Drug Buy was Directly from Dealer, 2007 and 2008 .... 59
Table 3.11: Percent Reporting Last Drug Buy with Cash was Outdoors, 2007 and 2008 ..... 60
Table 3.12: Average Number of Purchases in Past 30 Days, 2007 and 2008 ........................ 61
Table 3.13: Percent Reporting Any Failed Drug Buy in the Past 30 Days, 2007 and 2008 ... 62
Table 3.14: Percent Reporting Failed Drug Buy Due to Police Activity in Past 30 Days,
2007 and 2008 ................................................................................................... 63
Table 3.15: Percent Reporting Failed Drug Buy Due to Unavailability of Drug in Past
30 Days, 2007 and 2008 .................................................................................... 64
Table 3.16: Self-Reported Use of Crack Cocaine among Adult Male Arrestees, 2007
and 2008 ............................................................................................................ 65
Table 3.17: Self-Reported Use of Powder Cocaine among Adult Male Arrestees, 2007
and 2008 ............................................................................................................ 66
Table 3.18: Injected Drug Use at Most Recent Use (%), 2008 .............................................. 67
Table 3.19: Self-Reported Use of Heroin Among Adult Male Arrestees, 2007 and 2008 ..... 68
Table 3.20: Self-Reported Use of Methamphetamine Among Adult Male Arrestees,
2007 and 2008 ................................................................................................... 69
Table 3.21: Percent Testing Positive for Other Drugs, 2007 and 2008 .................................. 70
Table 3.22: Percent Admitting to Secondary Drug Use in the Past 3 Days, 2008 ................. 71

ADAM II 2008 Annual Report Contents iii
Appendix B: ADAM II Program Methodology .............................................................................. 73
Site Sampling ............................................................................................................................. 73
Weighting the ADAM II Data ................................................................................................... 77
Imputation of Missing Test Sample Data .................................................................................. 77
Estimating Trends ...................................................................................................................... 78
2008 Data Collection ................................................................................................................. 79
Sample Sizes .................................................................................................................... 79
Interview Completion Goals ............................................................................................ 79
Disposition of Sampled Arrestees ................................................................................... 79
Interview Response Rates ................................................................................................ 80
Urine Response Rates ...................................................................................................... 82
Indicators of Responding to the Survey .......................................................................... 83
Examination of the Congruence between Self-Reported Recent Drug Use and
a Positive or Negative Urine Test .................................................................................. 88
Determining Test Thresholds .......................................................................................... 90
Appendix C. Site Fact Sheets ............................................................................................................. 91
Atlanta, GA (Fulton County) ................................................................................................... 89
Charlotte, NC (Mecklenburg County) ..................................................................................... 93
Chicago, IL (Cook County) ..................................................................................................... 97
Denver, CO (Denver County)................................................................................................ 101
Indianapolis, IN (Marion County) ......................................................................................... 105
Minneapolis, MN (Hennepin County) ................................................................................... 109
New York, NY (Borough of Manhattan) .............................................................................. 113
Portland, OR (Multnomah County) ....................................................................................... 117
Sacramento, CA (Sacramento County) ................................................................................. 121
Washington DC (District of Columbia) ................................................................................ 125

iv Contents ADAM II 2008 Annual Report
List of Exhibits
Exhibit 1.1: ADAM II Sites .................................................................................................................. 3
Exhibit 1.2: ADAM II Drug Testing ..................................................................................................... 5
Exhibit B.1: ADAM II Drug Testing Cut-off Levels .......................................................................... 90
List of Figures
Figure 3.1: Rate of Congruence Between Self-reports and Urine Tests for Selected
Drug Use, 2008 .......................................................................................................... 14
Figure 3.2: Percent Admitting to use When Testing Positive, 2008 .............................................. 15
Figure 3.3 Percent Testing Positive for Any Drug........................................................................ 16
Figure 3.4: Percent Testing Positive for Multiple Drugs ............................................................... 17
Figure 3.5a: Percent Testing Positive for Marijuana—East and Midwest ....................................... 18
Figure 3.5b: Percent Testing Positive for Marijuana—Midwest and West ..................................... 18
Figure 3.6: Percent Self-Reporting Use of Marijuana, Past 30 Days ............................................. 19
Figure 3.7a: Percent Testing Positive for Cocaine—East and Midwest .......................................... 23
Figure 3.7b: Percent Testing Positive for Cocaine—Midwest and West ......................................... 23
Figure 3.8: Percent Self-Reporting Use of Crack Cocaine, Past 30 Days ..................................... 24
Figure 3.9: Percent Self-Reporting Use of Powder Cocaine, Past 30 days .................................... 26
Figure 3.10a: Percent Testing Positive for Opiates—East and Midwest ........................................... 29
Figure 3.10b: Percent Testing Positive for Opiates—Midwest and West.......................................... 29
Figure 3.11: Percent Self-Reporting Use of Heroin, Past 30 Days .................................................. 30
Figure 3.12a: Percent Testing Positive for Methamphetamine-East and Midwest ............................ 33
Figure 3.12b: Percent Testing Positive for Methamphetamine—Midwest and West ........................ 33
Figure 3.13: Percent Self-Reporting Use of Methamphetamine, Past 30 Days ............................... 34
ADAM II 2008 Annual Report Executive Summary v
Executive Summary
The Arrestee Drug Abuse Monitoring (ADAM II) program is a data collection program sponsored by
the Office of National Drug Control Policy and conducted by Abt Associates Inc. It is a program
designed to gather information on drug use and related issues from adult male offenders within 48
hours of arrest. ADAM II began data collection under ONDCP’s auspices in 2007 and is a
continuation of the former ADAM research program funded by the National Institute of Justice from
2000-2003.
ADAM II continues as a critical source of data for estimating trends in drug use in local areas,
understanding the relationship between drugs and crime, and describing drug market activity in the
adult male arrestee population. Data are collected within 48 hours of the respondent’s arrest in face-
to-face interviews in booking facilities during two 14-day periods (two back to back calendar quarters
from April 1 to September 30) each year, weighted appropriately to represent the county in which the
primary city sits and annualized to reflect the year’s arrests. The program offers a unique advantage
over many traditional surveys of drug use through its collection and testing1 of a urine sample from
respondents to verify answers about recent drug use.
Methodology
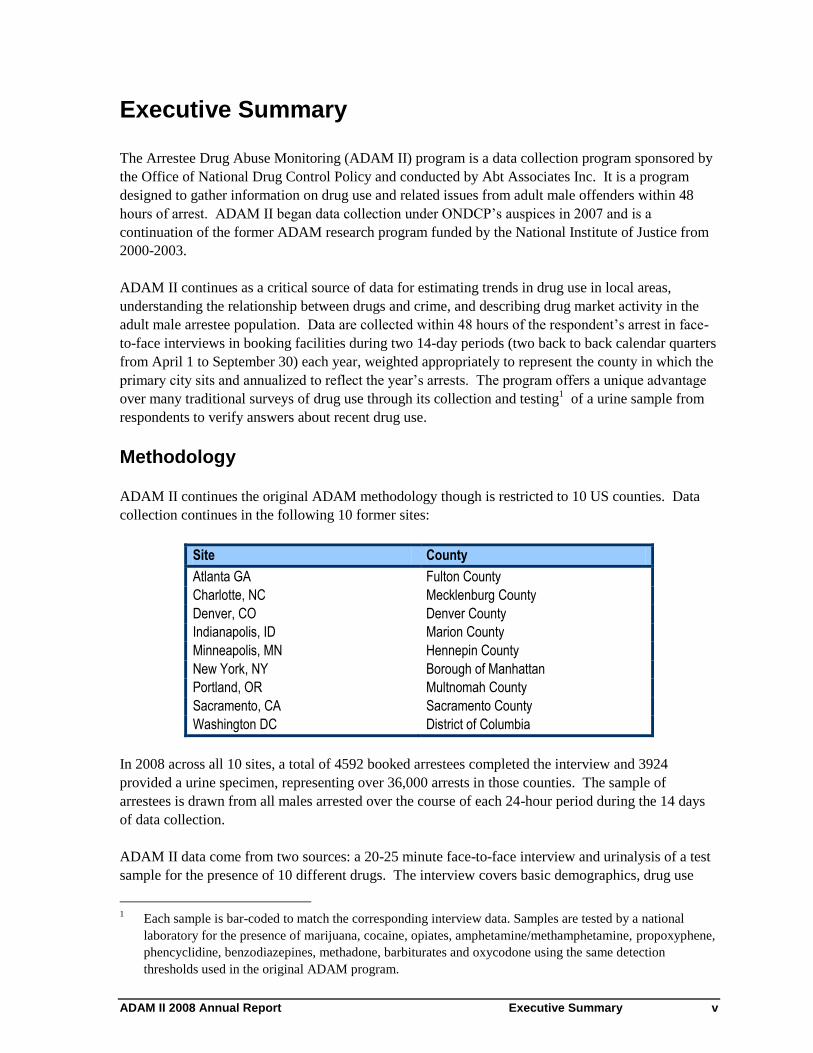
ADAM II continues the original ADAM methodology though is restricted to 10 US counties. Data
collection continues in the following 10 former sites:
Site County
Atlanta GA Fulton County
Charlotte, NC Mecklenburg County
Denver, CO Denver County
Indianapolis, ID Marion County
Minneapolis, MN Hennepin County
New York, NY Borough of Manhattan
Portland, OR Multnomah County
Sacramento, CA Sacramento County
Washington DC District of Columbia
In 2008 across all 10 sites, a total of 4592 booked arrestees completed the interview and 3924
provided a urine specimen, representing over 36,000 arrests in those counties. The sample of
arrestees is drawn from all males arrested over the course of each 24-hour period during the 14 days
of data collection.
ADAM II data come from two sources: a 20-25 minute face-to-face interview and urinalysis of a test
sample for the presence of 10 different drugs. The interview covers basic demographics, drug use
1 Each sample is bar-coded to match the corresponding interview data. Samples are tested by a national
laboratory for the presence of marijuana, cocaine, opiates, amphetamine/methamphetamine, propoxyphene,
phencyclidine, benzodiazepines, methadone, barbiturates and oxycodone using the same detection
thresholds used in the original ADAM program.
vi Executive Summary ADAM II 2008 Annual Report
history, current use, recent participation in buying and selling drugs, lifetime drug treatment and
mental health treatment, and, for those with any illegal drug use in the prior 12 months, detailed
information on arrests, treatment, housing, and drug and alcohol use for the last year. Participation in
both the interview and urine test is voluntary and confidential. In 2008 the overall response rate2 is 60
percent and the conditional response rate is 82 percent for consent to the interview. Of those who
consent to be interviewed, 86 percent provide a urine specimen for testing.
The ADAM II data comprise a non-probability sample of 10 US counties and a probability sample of
arrestees booked in those counties. Propensity scores are developed to weight each case using
detailed data on all arrests during the data collection period and are based on known factors that
influence the probability that a case is sampled—arrest charge, time of day and the flow of arrestees
through the week.
Who Constitutes the ADAM II Sample?
Despite broad geographic differences in the 10 counties participating in the ADAM II program,
arrestees across sites are similar in many respects. In 2008 the average age of arrestees is between 32
and 35 in all but two of the sites (in Atlanta and Washington DC it is slightly higher) and over 84
percent of arrestees in all sites are U.S. citizens. Over half of arrestees in 7 of the 10 sites report that
they are currently working, but in all but three sites (Minneapolis, New York and Washington DC)
less than half report having any form of health insurance. From 7 percent (Chicago) to 23 percent
(Portland and Atlanta) of arrestees are either living in institutional settings or are homeless.
The majority of arrestees (59% or more) in all sites have some prior experience with the criminal
justice system before the current arrest. Among those who report some drug use in the prior year,
anywhere from 8 percent (Denver) to 23 percent (Chicago) report two or more arrests just in that past
year.
All arrestees are asked if they have ever participated in drug or alcohol treatment (inpatient and
outpatient) or any inpatient mental health treatment. Prior outpatient drug treatment ranges from 9
percent of arrestees in Washington DC to 35 percent in Minneapolis. Prior experience with inpatient
stays for mental health treatment is somewhat less common, ranging from 3 percent of arrestees in
Washington DC to 13 percent in Minneapolis and Portland.
Drug Use and Drug Market Activity
Matching Self-report to Test Results.
A critical part of the utility of ADAM II information is the ability to verify self reported drug use of
respondents with a bioassay. Arrestees are asked about their prior 12-month and prior 30-, 7- and 3-
day use3 of marijuana, cocaine, crack, heroin, methamphetamine and other drugs they may specify.
2 The overall response rate includes arrestees who are sampled but not available, e.g., no longer in the
facility or too ill to be interviewed. The conditional response rate represents the number of interviews
completed with arrestees who are sampled and physically available.
3 The 30-, 7-, and 3-day windows are used both for an account of recent use and to match the window of
detection for different drugs in urinalysis.
ADAM II 2008 Annual Report Executive Summary vii
In this unique self-report setting there is a high degree of veracity regarding recent drug use (i.e.,
urine test results match responses) among all arrestees for each drug. Over 80 percent of all arrestees
report truthfully regarding recent use of marijuana and cocaine, and over 90 percent responded
truthfully about heroin and methamphetamine. But many arrestees are not using drugs and have little
to hide, so that the question remains about the truthfulness of those arrestees who are actually using
illegal drugs. For arrestees who are using each of the drugs (test positive), veracity varies by drug.
Cocaine (45% match) and heroin (48%) users are less likely to admit recent use than
methamphetamine (55%) and marijuana users (82%). These findings underscore the value of the test
confirmation to self-report data for accurate estimation of use from any self-report survey.
Test Results for the Presence of Any Drugs
In all 10 ADAM II sites from 49 percent (Washington DC) to 87 percent (Chicago) of all arrestees
interviewed test positive for at least one substance in their system at the time of arrest. This level of
use is consistent with what was found in 7 of the 10 sites in 2007 with a statistically significant
decrease in Atlanta, Portland, and Washington DC. Many test positive for multiple substances: from
15 to 40 percent of all arrestees in all sites test positive for multiple substances.
Marijuana
Marijuana continues to be the most commonly detected illegal substance among arrestees in all but
Atlanta where more arrestees test positive for cocaine use. In 2008 over 40 percent of arrestees in 8
of the 10 sites test positive for marijuana at the time of arrest, a proportion that has not changed
significantly in any site since 2007. When asked about marijuana use, 45 percent or more of arrestees
admit use the prior year in 9 of the 10 sites, over 40 percent in the prior 30 days and over 35 percent
in the prior week. While there have been fluctuations in sites from year to year, these trends have
also been remarkably stable since ADAM data collection began in 2000. Arrestees who are using
marijuana also use it frequently: in 7 of the sites, marijuana users used on average every other day of
the prior 30 days.
Given the prevalence of marijuana use among the ADAM II arrestees, it is not surprising that
marijuana is the drug reported as obtained most frequently in the prior 30 days. In only one site
(Portland) is there a statistically significant drop since 2007 in the proportion of arrestees who report
acquiring marijuana (from 44% to 38%). It is also a market that can involve non-cash transactions
(trade, share, exchange of services, gift) almost as frequently as those involving cash. In half of the
sites the marijuana market is roughly evenly split between cash and non-cash transactions. The
markets of 3 sites (Denver, Portland and Sacramento) have a somewhat greater proportion of arrestees
reporting non-cash transactions, while in two sites (Atlanta and Washington DC) more arrestees
report transactions involving cash.
Arrestees who obtained marijuana within the last 30 days also are asked about various other aspects
of the transaction, i.e., indoor versus outdoor sale, availability of product, regular versus new or
occasional source, frequency of purchase. In half of the sites the marijuana is as likely to be acquired
indoors as in an open air or public setting. In Indianapolis, Charlotte and Portland the market appears
to be less public.
While the proportion of arrestees who report a failed marijuana buy (they had the money but could
not get the drug) did not change significantly across any site from 2007, the availability of marijuana
viii Executive Summary ADAM II 2008 Annual Report
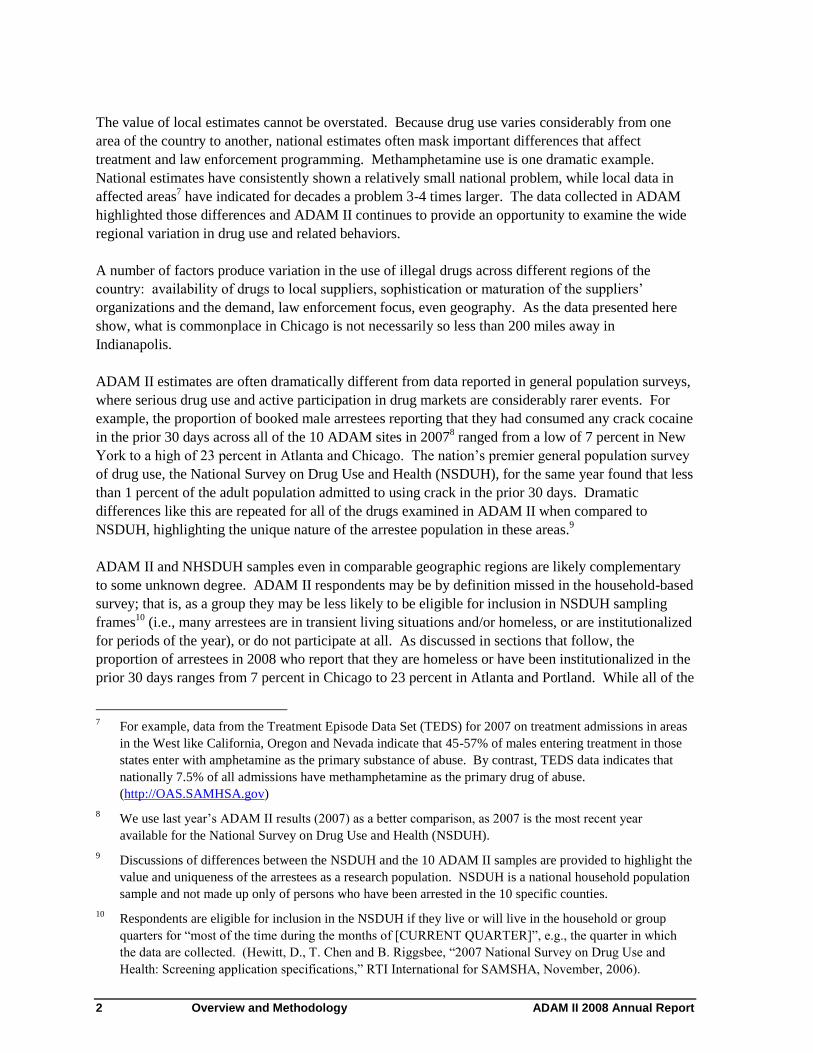
does differ across the 10 markets. In Denver only 25 percent of arrestees acquiring marijuana report a
failed buy in the last month; in New York, Atlanta, Indianapolis and Washington DC over 40 percent
report a failed buy. The most common reason cited across all sites is that the drug was not available
from the source.
Cocaine: Crack and Powder
Cocaine is the second most commonly detected substance among arrestees in 2008, except in Atlanta
where it is the most commonly detected drug. The proportion testing positive ranges from a low of
17 percent in Sacramento to 44 percent in Chicago. While these test results are high, the prevalence
of cocaine positives is stable or declining across most of the ADAM II sites. There are statistically
significant declines in the cocaine positive tests from 2007 to 2008 in Indianapolis and Washington
DC. In Chicago and Portland significant declines occurred from 2003 to 2007 and remained at the
lower level in 2007 and 2008. In New York over half of the arrestees tested positive for cocaine in
2000, then use declined significantly in 2001 and again in 2003, and remains at around 30 percent
into 2008.
Because the immunoassay test used in ADAM II urinalysis cannot differentiate cocaine as crack from
the drug in its powdered form, ADAM II uses self-report information about each form of the drug to
determine differences in use and market activity.
Crack
Self-report data on crack use indicate that use is stable or declining. The proportion of arrestees who
report that they used crack in the prior 30 days declines significantly in Portland and Charlotte and
remained the same in all other sites since 2007. It is highest in Atlanta and Chicago where 23 percent
of arrestees admit prior 30-day use and lowest in New York where 7 percent of arrestees admit to
prior 30-day use. The average number of days using of the prior 30 varies from 6 days of the last 30
in Washington DC to 20 days in Atlanta.
The crack cocaine market is the second most active drug market (behind marijuana) in all but three
sites.4 The proportion of arrestees who report they obtained crack in the prior 30 days ranges from 7
percent in New York to 26 percent in Chicago. The proportion of arrestees who report acquiring
crack declines significantly in three sites (Charlotte, New York and Portland) in 2008.
Crack remains primarily a cash market. In 2008 across all sites over 75 percent of arrestees who
obtained crack in the prior 30 days did so at least once via a cash transaction; in half of the sites 90
percent or more reported cash transactions. Crack is also often exchanged in an open air or more
public market; in 9 of 10 sites at least 40 percent of arrestees report that their crack purchases were
made in outdoor settings and in some sites (Atlanta, Washington DC, New York and Chicago) that
proportion is even higher (63-87% report outdoor sales). Seventy percent or more of arrestees in all
sites report the transaction is made directly with a dealer rather than through a third party or go-
between. Arrestees describe a retail market with users making frequent small purchases. The average
number of crack purchases made in the prior 30 days ranges from 8 (Washington DC) to 18 (Atlanta).
4 In New York more arrestees report acquiring cocaine powder than crack and in Portland and Sacramento
more arrestees reporting acquiring methamphetamine than crack.

ADAM II 2008 Annual Report Executive Summary ix
Though crack appears to be somewhat unavailable in 2008 in most sites that availability has not
changed significantly since 2007. In 7 of the 10 sites, 30 to 63 percent of arrestees who report trying
to buy crack in the prior 30 days fail to do so, most commonly due to lack of availability. The
exception is Portland where 23 percent of those who report a failed buy attribute it to police activity.
New York appears to be an area with a changing crack market. As the proportion of arrestees testing
positive for cocaine (either form) in New York has declined steadily since 2000, so has the number of
arrestees reporting recent crack use. This is paralleled by reports of more failed buys in that site.
Almost two-thirds of arrestees who acquired crack in the prior 30 days in New York report
experiencing failed buys—almost 30 percent higher than in most other sites.
Cocaine Powder
Like crack, although the popularity of cocaine powder varies considerably by site, the use of cocaine
powder in the last 30 days reported by arrestees remains stable or declines in all 10 ADAM II sites,
with significant reductions in two sites (Indianapolis and Denver). It is reported most commonly as
used in the prior 30 days in Charlotte (10%) and Denver (10%) and least commonly in Chicago,
Washington DC, and Indianapolis (3%).
Unlike crack cocaine, cocaine in powder form is often injected. Arrestees who report using cocaine
powder in the prior 30 days are asked if they injected at the most recent use. In Atlanta 59 percent of
cocaine powder users injected at last use, in New York 27 percent and in Portland 18 percent.
The drop in the number of arrestees testing positive for cocaine appears to be driven more by
reductions in powder use than cocaine as crack. The proportion of arrestees who report acquiring
powder cocaine in the prior 30 days is either stable or decreasing in all ADAM II sites in 2008; in
four of the sites (Charlotte, Denver, Indianapolis, Portland) the declines are statistically significant.
The market for cocaine powder is also somewhat less driven by cash transactions than is true for
crack. While over 75 percent of arrestees who obtained crack used cash, in only two sites is the
percentage of arrestees reporting cocaine powder cash transactions that high—New York and
Charlotte. Cash transactions dropped significantly in Atlanta and Chicago since 2007—lower by
approximately half or more in Chicago.
Availability as measured by failed attempts to buy varies considerably across the sites. The highest
percentage of arrestees reporting failed buys occurs in New York (63%) and the fewest in Sacramento
(15%), Minneapolis (18%) and Indianapolis (19%). Significantly more arrestees in New York in
2008 also attribute the failed buy to lack of available product than was true in 2007 (7% versus 42%).
By contrast in Denver 65 percent of arrestees attribute their failed buys in 2007 to lack of product
availability whereas in 2008 only 23 percent cite that reason.
Heroin
Chicago leads the 10 sites in the proportion of arrestees testing positive for opiates (29%) in 2008,
with more than twice the proportion of the next most prevalent site for opiates, Washington DC.
Chicago’s results also represent a statistically significant increase over 2007 bringing it closer to its
highest point in 2000 (36%). Fewer than 2 percent of arrestees test positive in the two southern sites
and 5 percent or less test positive in Denver, Indianapolis, and Sacramento. Six to 12 percent of
arrestees in Portland, New York, Minneapolis and Washington DC test positive. Trends in heroin use
remain relatively constant for most sites since 2000. However, there have been significant declines in
Portland, Denver and New York from high points in 2000-2003.

x Executive Summary ADAM II 2008 Annual Report
Self-report data on recent use show a consistently high frequency of use among arrestees who use
heroin. In 7 of the 10 sites arrestees who admit heroin use report that they use it 15 or more days out
of the month; in Chicago, heroin users are reporting almost daily use. Heroin is also the drug most
commonly reported as injected. Virtually all of those admitting heroin use in Charlotte report
injection at the last use and over 60 percent of heroin users injected in 3 of the other 10 sites. In
Chicago where 29 percent of arrestees test positive for opiates and 27 percent admit use in the prior
year, only 25 percent report they injected it at last use.
With the exception of Chicago the percentage of arrestees engaged in the heroin market is small.
However, within that small group participation is high—the average number of days arrestees report
buying heroin ranges from 7 to 22. In the most active heroin market sites (Chicago, New York and
Portland) arrestees report that purchases are most often made directly from the dealer. Heroin also
appears to be a more open-air market in these areas with over half or more of those reporting
purchases in 5 of the 10 sites saying the last purchase was made outdoors.
Heroin appears to be relatively more available in Chicago, Charlotte, Indianapolis, and Portland
where roughly a quarter or fewer of those who bought heroin reported a failed buy. By contrast, in
New York 53 percent of those obtaining heroin report a failed buy and 46 percent of them attribute it
to lack of available product.
Methamphetamine
Methamphetamine remains primarily a regional phenomenon. In Sacramento and Portland 35 and 15
percent of arrestees respectively test positive in 2008 for methamphetamine, though this represents a
continuing decline from 2003. Methamphetamine positives are lowest (less than 1%) in New York,
Atlanta, Chicago and Charlotte and only slightly higher (2-3%) in Denver, Indianapolis, Washington
DC and Minneapolis. Self-report of use in the prior 30 days, though slightly higher, mirrors the urine
test results. The practice of injecting methamphetamine is most common in Portland (32% injected at
last use), but less common elsewhere.
Only the two western ADAM II sites have appreciable methamphetamine market participation. In
Sacramento the proportion of arrestees involved in acquiring methamphetamine in the prior 30 days
remains high (26%), unchanged from 2007, but in Portland reported acquisition is significantly lower
(13%) than 2007 levels (23%). There are a similar number of arrestees reporting acquisitions made
through cash and non-cash for methamphetamine in both sites, though there is a significant decline in
arrestees reporting cash buys in Sacramento from 2007 to 2008. In both sites the majority of arrestees
report transactions as made indoors or in non-public places. The proportion of arrestees reporting
failed buys remains stable at between 40 and 50 percent.
Other Drugs
Arrestees are asked about other drugs (besides those discussed above) they have used and also are
tested for a panel of ten drugs. Phencyclidine (PCP) is detected in this population in 4 of the 10 sites
but is rare—1% or less. Oxycodone is detected in 7 of the 10 sites, but only in Sacramento (3%) is

ADAM II 2008 Annual Report Executive Summary xi
it above one percent. Arrestees self-report of drugs not specifically included in the test panel shows
the use of Ecstasy most commonly in Atlanta and Charlotte (3%), Sacramento, Minneapolis, and New
York (2%). It is unusually high in the small Washington DC sample (37%). Narcotic painkillers
(Dilaudid, Vicodin, Percocet) are also reported between 8 to 11 percent of arrestees in half of the
sites.
Report Format
The ADAM II 2008 Report is divided into three sections. Section 1 presents information on the
ADAM II program, comparing it to the earlier ADAM program funded by the National Institute of
Justice from 2000-2003 and providing a brief description of the program methodology. Section 2
provides a description of the ADAM II sample, including demographics, arrest histories, and
treatment experiences. Section 3 presents findings on drug use and drug market activity among
booked adult male arrestees, described by different drug types—marijuana, cocaine (in powder and
crack form), heroin, methamphetamine and selected other drugs.
Figures illustrating results are included in the main body of the report; all data tables are referenced in
text, but presented in Appendix A. Data in Appendix A are annualized and significance of year to
year trends is estimated using regression models. Appendix B presents more detailed information on
the program methodology, and Appendix C provides annualized results for 2008 and trends for each
site.
This report presents 2008 findings from all 10 ADAM II sites. The same sites participated in 2007
ADAM II data collection, the full results of which are reported in ONDCP’s ADAM II 2007 Annual
Report; some 2007 results are included in this report. As was the case in 2007, data are collected for
two calendar quarters and are then used to generate annualized estimates for each site. Data are not
aggregated across sites, but rather presented site by site. In general, the samples collected in each site
are more than adequate for reporting and data analysis. However, in some cases, depending on the
analysis, the number of cases falls below 10, e.g., methamphetamine market activity in some Eastern
sites. In these cases, no information is reported, as cases are too few to serve as the basis of reliable
estimates; the site is then excluded from cross-site comparisons, and an ―n/a‖ is noted for that site in
the relevant table.
Throughout the report, comparisons are made to results from 2007. In these cases, differences that
are statistically significant at the .10, .05 and .01 level are identified. Otherwise, comparisons
reported do not yield significant differences. The report includes the less stringent .10 significance
level to provide more flexibility when considering possible trends over time.
One of the primary goals of the ADAM II program is to provide trend information on how drug use
and related behavior among arrestees may have changed over time. The consistency in
methodologies between ADAM and ADAM II supports this goal. However, ensuring data remain
representative of the arrestee population requires continuous review and, if necessary, changes to
enhance the representativeness of the sample, which can result in some adjustments to the analysis
over time. There were no changes to the samples collected in 2007 and 2008 in any of the 10 ADAM
II sites. However, some changes took place between 2003 and 2007 that necessarily affect trend
analysis. These changes were discussed in more detail in the 2007 annual report and are not repeated
here.

xii Executive Summary ADAM II 2008 Annual Report

ADAM II 2008 Annual Report Overview and Methodology 1
1.0 The ADAM II Program: Overview and
Methodology
The Arrestee Drug Abuse Monitoring II (ADAM II) program is a unique data collection effort that
collects interview and bioassay data in 10 U.S. counties from a probability-based sample of males
within 48 hours of their arrest. All booked male arrestees who fit within this window during two 14-
day data collection periods (April 1 to September 30 each year) are included in the sample, regardless
of their arrest charge. The interview is voluntary and confidential with no identifying information
taken on any arrestee. In 2008 over 82 percent of those sampled and present in the facility consented
to be interviewed and over 86 percent provided a urine sample for laboratory testing. Cases are then
weighted to reflect all arrests in the time period in each county and annualized to represent the entire
year. In 2008 over 4,500 arrestees were interviewed, representing over 36,000 arrests in 10 counties.
The original ADAM program grew out of the need for better information on the extent of drug use
among persons involved in criminal activity. In 1988 the National Institute of Justice (NIJ) began a
multi-city data collection effort called the Drug Use Forecasting (DUF) program. Although DUF was
a landmark effort and the first national data collection program to include the collection of a
biological specimen (urine) to test for the presence of drugs in individuals at arrest, its reliance on a
convenience sample of cities, booking facilities within cities and respondents severely limited its
utility for estimation purposes.5 In an effort to overcome this weakness, Abt Associates and the NIJ
redesigned the program in 2000 to include probability-based sampling of arrestees, new
instrumentation and data collection protocols that support scientifically sound prevalence estimation.
The NIJ renamed DUF the Arrestee Drug Abuse Monitoring (ADAM) program.
From 2000-2003, the ADAM program provided estimates of drug use and drug market behaviors
among persons involved in the criminal justice system in 39 counties. The program was terminated
by NIJ in 2003 due to lack of funding. In 2007 ONDCP, recognizing the need for these unique data,
resumed data collection in 10 former ADAM sites as ADAM II.
Reestablishing the ADAM program was important for a number of reasons. ADAM II provides data
on the prevalence of drug use among booked male arrestees in 10 U.S. counties that were part of the
original ADAM sample, offering consistent data to support statistical trend analysis in those 10
counties.
It is important to bear in mind that ADAM II sites do not constitute a probability-based sample of all
US counties and, with 10 purposively selected sites, the program is not designed to provide a national
estimate.6 However, the program is designed to provide local prevalence estimates of drug use and
related behaviors among booked arrestees over time for each county represented by the 10 sites.
5 Government Accounting Office. Drug Use Management: Strengths, Limitations, and Recommendations for
Improvement. Washington, D.C. GAO/PEMD-93-19, June 1993.
6 When ADAM constituted 39 US counties, Abt investigators were able to develop a reasonable national
estimate of use by combining treatment and ADAM data in a model-based estimation procedure (see
Rhodes, W., Kling, R. and Johnston, P. ―Using Booking Data to Model Drug User Arrest Rates: A
Preliminary Step to Estimating the Prevalence of Chronic Drug Use‖ Journal of Quantitative Criminology,
March 2007).
2 Overview and Methodology ADAM II 2008 Annual Report
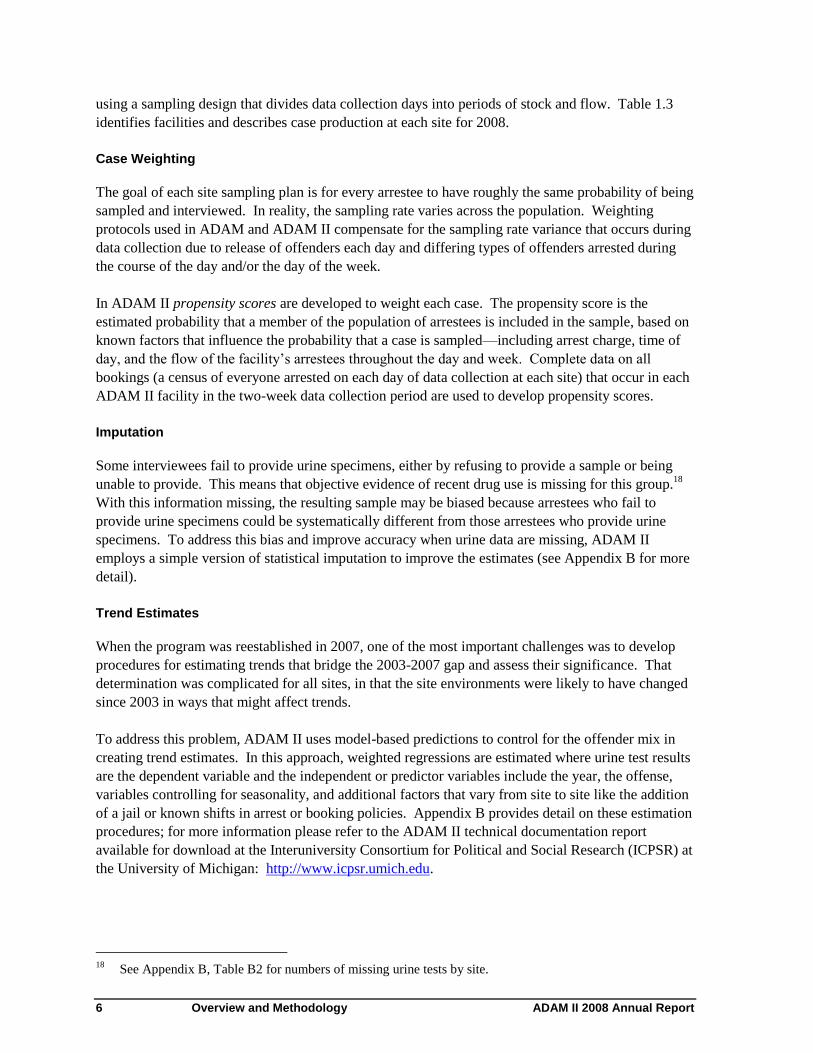
The value of local estimates cannot be overstated. Because drug use varies considerably from one
area of the country to another, national estimates often mask important differences that affect
treatment and law enforcement programming. Methamphetamine use is one dramatic example.
National estimates have consistently shown a relatively small national problem, while local data in
affected areas7 have indicated for decades a problem 3-4 times larger. The data collected in ADAM
highlighted those differences and ADAM II continues to provide an opportunity to examine the wide
regional variation in drug use and related behaviors.
A number of factors produce variation in the use of illegal drugs across different regions of the
country: availability of drugs to local suppliers, sophistication or maturation of the suppliers’
organizations and the demand, law enforcement focus, even geography. As the data presented here
show, what is commonplace in Chicago is not necessarily so less than 200 miles away in
Indianapolis.
ADAM II estimates are often dramatically different from data reported in general population surveys,
where serious drug use and active participation in drug markets are considerably rarer events. For
example, the proportion of booked male arrestees reporting that they had consumed any crack cocaine
in the prior 30 days across all of the 10 ADAM sites in 20078 ranged from a low of 7 percent in New
York to a high of 23 percent in Atlanta and Chicago. The nation’s premier general population survey
of drug use, the National Survey on Drug Use and Health (NSDUH), for the same year found that less
than 1 percent of the adult population admitted to using crack in the prior 30 days. Dramatic
differences like this are repeated for all of the drugs examined in ADAM II when compared to
NSDUH, highlighting the unique nature of the arrestee population in these areas.9
ADAM II and NHSDUH samples even in comparable geographic regions are likely complementary
to some unknown degree. ADAM II respondents may be by definition missed in the household-based
survey; that is, as a group they may be less likely to be eligible for inclusion in NSDUH sampling
frames10
(i.e., many arrestees are in transient living situations and/or homeless, or are institutionalized
for periods of the year), or do not participate at all. As discussed in sections that follow, the
proportion of arrestees in 2008 who report that they are homeless or have been institutionalized in the
prior 30 days ranges from 7 percent in Chicago to 23 percent in Atlanta and Portland. While all of the
7 For example, data from the Treatment Episode Data Set (TEDS) for 2007 on treatment admissions in areas
in the West like California, Oregon and Nevada indicate that 45-57% of males entering treatment in those
states enter with amphetamine as the primary substance of abuse. By contrast, TEDS data indicates that
nationally 7.5% of all admissions have methamphetamine as the primary drug of abuse.
(http://OAS.SAMHSA.gov)
8 We use last year’s ADAM II results (2007) as a better comparison, as 2007 is the most recent year
available for the National Survey on Drug Use and Health (NSDUH).
9 Discussions of differences between the NSDUH and the 10 ADAM II samples are provided to highlight the
value and uniqueness of the arrestees as a research population. NSDUH is a national household population
sample and not made up only of persons who have been arrested in the 10 specific counties.
10 Respondents are eligible for inclusion in the NSDUH if they live or will live in the household or group
quarters for ―most of the time during the months of [CURRENT QUARTER]‖, e.g., the quarter in which
the data are collected. (Hewitt, D., T. Chen and B. Riggsbee, ―2007 National Survey on Drug Use and
Health: Screening application specifications,‖ RTI International for SAMSHA, November, 2006).

ADAM II 2008 Annual Report Overview and Methodology 3
ADAM II sample by definition have been arrested in the past year, in 2008 anywhere from 59 percent
(Washington) to 94 percent (Chicago) had at least one prior arrest. Of those who in 2007 admit any
drug use in the past year, between 2 percent (Washington DC) and 23 percent (Portland) were
arrested two or more times in that prior 12 month period.
In short, ADAM II provides an important window into a segment of the population not readily
reflected in population based surveys, i.e., those who are both far more involved in the criminal
justice system and more heavily involved in substance use.
To achieve ADAM II’s objectives of providing accurate local trend estimates that are comparable to
earlier ADAM estimates all aspects of the ADAM methodology are replicated. This goal was
achieved in both 2007 and 2008 in 10 former ADAM sites selected from among the original 39 sites
that participated in the ADAM program (see Exhibit 1.1).11
Exhibit 1.1: ADAM II Sites
Primary City County Area
Atlanta, GA Fulton County and City of Atlanta
Charlotte, NC Mecklenburg County
Chicago, IL Cook County
Denver, CO Denver County
Indianapolis, IN Marion County
Minneapolis, MN Hennepin County
New York, NY Borough of Manhattan
Portland, OR Multnomah County
Sacramento, CA Sacramento County
Washington DC District of Columbia
11
In each case, the county in which the named city is located constitutes the ―site;‖ that is, the Portland site
sample is weighted to represent all arrests in Multnomah County; the Charlotte site sample is weighted to
represent all arrests in Mecklenburg County and so on.

4 Overview and Methodology ADAM II 2008 Annual Report
The ADAM II program follows the same protocols established in ADAM, refining analytic strategies
as needed. ADAM II:
Collects data about drug use, drug and alcohol dependency and treatment, and drug market
participation among booked male arrestees within 48 hours of arrest;12
Relies on a systematic sampling process to identify eligible arrestees that are approached for
voluntary participation;
Collects data through a confidential 20-25 minute face-to-face interview and collection of a
urine specimen;
Offers an incentive (e.g., candy, chips, water) for participation;
Ships urine specimens to a central laboratory to test for the presence of ten different drugs;
Collects data in each site for 14 consecutive days during two back-to-back quarters;13
and
Uses propensity scores to assign weights to each case.14
Uses a model-based procedure to examine trends in drug use and related activities in each site
over time.
Methodology
All sites implement sampling plans and weighting protocols that are designed and executed applying
the same principles as had been applied under ADAM.15
This section provides an overview of
ADAM II methodology, including brief descriptions of procedures used for testing, sampling,
weighting, imputation, and trend estimation. Appendix B provides a more detailed discussion of each
component.
Drug Testing
In ADAM and ADAM II all sampled arrestees are approached and asked to participate in an
interview and to provide a urine sample for later testing. The project is explained and consent for
both the interview and the sample collection is voluntary. While arrestees may be interviewed
without providing a test sample, no test samples are taken without an interview. In all but one site16
12
Minor revisions were made to the original ADAM instrument in 2007 for ADAM II to ensure consistency
with current Office of Management and Budget (OMB) guidelines on a few demographic categories
(ethnicity) and to add more specific information on the manufacture of methamphetamine.
13 Under the ADAM program, data collection began with collection across four quarters and evolved to two
or three (depending on the site) when it was terminated in 2003. ADAM II data are annualized to represent
the year and to adjust for seasonality (see Appendix B for details on the annualization of ADAM II data).
14 The use of propensity score weighting was new in 2007. In the past ADAM relied on case weights
developed through post-sampling stratification ( see Appendix B for more detail on this change).
15 In 2007, a number of years had passed since ADAM data were collected and in some sites jail operations
and even jails themselves changed. In some cases the scope of the populations captured through ADAM
was not ideal and some changes were needed to improve the sample collected in ADAM II while
maintaining trend analysis capability.
16 In New York, the arrestee moves to a urinal which is behind a concrete barrier in the cell.

ADAM II 2008 Annual Report Overview and Methodology 5
the urine specimen is given in a nearby lavatory. Samples are linked to the interview data by a
common barcode, but no identifying information is contained on the interview or the specimen at any
time. No arrestee level data are shared with the participating law enforcement agencies. Exhibit 1.2
describes the test collection and analysis conducted.
Sampling
ADAM II data comprise a purposive sample of 10 U.S. counties and a probability sample of arrestees
booked into jails within those counties. Data collection takes place in each site from a county-based
representative sample of approximately 250-300 arrestees per site per quarter.17
The 2008 10-site
interview total consists of 4,592 arrestees representing 36,387 arrests during the two data collection
periods. Data collection occurred in two cycles at each site to provide estimates for two back-to-back
calendar quarters in the time period from April 1, 2008 to September 30, 2008.
Sampling plans are created at the county and facility levels. County-level plans document the total
number of booking facilities and identify the facilities selected for data collection. In some cases,
regardless of arresting agency, all bookings in the county take place in a single jail, while in other
counties bookings may take place in multiple facilities across the county. Where there are multiple
jails (as in Atlanta and Washington DC), each jail is treated as a stratum, and ADAM II for that site
constitutes a stratified random sample. After identification and sampling of facilities within each
county, facility-level plans are created to identify the data collection shift, sample targets, and number
of assigned interviewers within each facility documented in the county-level plan. Within a facility,
cases are sampled to represent all arrestees in each 24-hour period over a consecutive 14-day period
17
The Washington DC site generates substantially fewer cases over the 14-day period due to the rapid release
or transfer of arrestees from the seven districts where they are booked.
Exhibit 1.2: ADAM II Drug Testing
ADAM II is the only U.S. survey of drug use that provides verification of
self-reported activity through testing a biological sample and linking it to
respondent’s answers. At the initiation of the ADAM II interview, arrestees are
asked if they will provide a urine sample at the end of the interview. While
arrestees may agree to the interview but not to providing a urine sample, no
urine samples are collected independent of an interview. Samples are taken
unobserved in a lavatory facility in the booking area. All specimens are
removed daily from the ADAM II site facilities and shipped via overnight mail
to the national testing laboratory. Bar-coded labels attached to both the
interview and the specimen link results. Interview questions are designed to
capture the time frames within which each drug should be detectable in a urine
sample (3 days, 7 days, 30 days).
ADAM II uses immunoassay testing that screens for the presence of drugs in
urine samples provided by each arrestee. Immunoassay tests are some of the most
consistently accurate drug screening methods available and are the most widely
used bioassay in government testing programs. The test screens for the presence
of drugs or their metabolites that have been excreted in a subject’s urine at a
level above or equal to a standard threshold or cutoff point. If the sample
tests negative for a drug it means either there is no drug in the sample or the
amount is below the threshold point (see Exhibit B.1 “ADAM II Drug Testing Cut-
off Levels” in Appendix B). A confirmatory test is used to determine the
presence of a specific drug within a broader drug class. For ADAM II, all
amphetamine positives are confirmed for methamphetamine using a second test,
gas chromatography/mass spectrometry (GC/MS).
ADAM II screens for 10 drugs, but the primary focus of the program is on
four of the first five drugs of what is termed the “NIDA-5”— marijuana,
cocaine, opiates, methamphetamine and phencyclidine (PCP). Phencyclidine (PCP),
while one of the NIDA-5 drugs, is not a focus of the ADAM II data collection or
report; positive tests for PCP are rare in the current ADAM II data collection
sites. The National Institute on Drug Abuse (NIDA) has identified these 5
drugs as the most commonly used illegal drugs and they are a standard test
panel. In ADAM II, screening is also conducted for barbiturates, methadone,
benzodiazepines, oxycodone, propoxyphene (Darvon), and amphetamines.
6 Overview and Methodology ADAM II 2008 Annual Report
using a sampling design that divides data collection days into periods of stock and flow. Table 1.3
identifies facilities and describes case production at each site for 2008.
Case Weighting
The goal of each site sampling plan is for every arrestee to have roughly the same probability of being
sampled and interviewed. In reality, the sampling rate varies across the population. Weighting
protocols used in ADAM and ADAM II compensate for the sampling rate variance that occurs during
data collection due to release of offenders each day and differing types of offenders arrested during
the course of the day and/or the day of the week.
In ADAM II propensity scores are developed to weight each case. The propensity score is the
estimated probability that a member of the population of arrestees is included in the sample, based on
known factors that influence the probability that a case is sampled—including arrest charge, time of
day, and the flow of the facility’s arrestees throughout the day and week. Complete data on all
bookings (a census of everyone arrested on each day of data collection at each site) that occur in each
ADAM II facility in the two-week data collection period are used to develop propensity scores.
Imputation
Some interviewees fail to provide urine specimens, either by refusing to provide a sample or being
unable to provide. This means that objective evidence of recent drug use is missing for this group.18
With this information missing, the resulting sample may be biased because arrestees who fail to
provide urine specimens could be systematically different from those arrestees who provide urine
specimens. To address this bias and improve accuracy when urine data are missing, ADAM II
employs a simple version of statistical imputation to improve the estimates (see Appendix B for more
detail).
Trend Estimates
When the program was reestablished in 2007, one of the most important challenges was to develop
procedures for estimating trends that bridge the 2003-2007 gap and assess their significance. That
determination was complicated for all sites, in that the site environments were likely to have changed
since 2003 in ways that might affect trends.
To address this problem, ADAM II uses model-based predictions to control for the offender mix in
creating trend estimates. In this approach, weighted regressions are estimated where urine test results
are the dependent variable and the independent or predictor variables include the year, the offense,
variables controlling for seasonality, and additional factors that vary from site to site like the addition
of a jail or known shifts in arrest or booking policies. Appendix B provides detail on these estimation
procedures; for more information please refer to the ADAM II technical documentation report
available for download at the Interuniversity Consortium for Political and Social Research (ICPSR) at
the University of Michigan: http://www.icpsr.umich.edu.
18
See Appendix B, Table B2 for numbers of missing urine tests by site.

AD
AM
II 200
8 A
nn
ua
l Rep
ort.
Ov
erv
iew
an
d M
eth
od
olo
gy
7
Table 1.3: ADAM Site Booking Facilities, Completed Interviews, Urine Specimens, and Weighted Case Numbers, 2008
Primary City Study Area
# of Booking Facilities
Completed
Interviews
Urine
Specimens
Weighted
Case
Numbersa Total
Data
Collected
From
Atlanta, GA Fulton County and City of Atlanta 2 2 419 354 1,994
Charlotte, NC Mecklenburg County 1 1 468 396 2,637
Chicago, IL Cook Countyb 36 1 485 426 6,697
Denver, CO Denver County 1 1 511 460 2,220
Indianapolis, IN Marion County 1 1 578 524 3,526
Minneapolis, MN Hennepin Countyb 18 1 433 383 1,996
New York, NY Borough of Manhattan 2 1 515 365 4,444
Portland, OR Multnomah County 1 1 526 453 1,450
Sacramento, CA Sacramento County 1 1 562 508 4,649
Washington, D.C. District of Columbia 7 7 95 55 6,774
Total 4,592 3,924 36,387
a Reflects all arrestees booked during both 14-day periods in the facilities.
b The Hennepin County and Cook County samples do not include the smaller suburban facilities, but instead are restricted to the large central jail where the majority of arrestees
are transferred and/or are initially booked. In both cases the included jail captures the overwhelming majority of county bookings.

8 Overview and Methodology ADAM II 2008 Annual Report
ADAM II 2008 Annual Report Who Constitutes the ADAM II Samples? 9
2.0 Who Constitutes the ADAM II Samples?
The ADAM II program collects information on a number of arrestee characteristics that together
provide a picture of the population entering the criminal justice system in each of the 10 sites. In
addition to drug use and drug market questions that are the primary focus of the ADAM II program,
arrestees are asked during the interview to provide information on demographics (age, education,
race, marital status), immigration status, employment, insurance coverage and housing. Arrestees
also are asked about lifetime and recent substance abuse and mental health treatment experiences. In
addition, the program collects information from official records on charges for which sample
respondents were booked. This section describes the overall characteristics of the sampled population
in each site and highlights differences in characteristics between arrestees who test positive for any
drugs and those who do not. It should be noted that demographic shifts in the ADAM II sample do
not necessarily reflect shifts in the demographics of those who commit crime; rather, some shifts may
be attributed to policing practices and strategies.
Demographic Characteristics of Arrestees
Although the ADAM II sites are concentrated east of the Mississippi, the 10 counties vary in terms of
size and demographics of their populations. Table 2.1 in Appendix A presents demographic
information on all arrestees in the 10 ADAM II counties in 2007 and 2008. In all sites, the average
age of arrestees in each site is between 32 and 37 in 2008. The majority of arrestees are single in all
sites, ranging from 58 percent (Denver) to 83 percent (Washington DC). Over 80 percent of arrestees
are U.S. citizens, though this percentage declined significantly in three sites in 2008 (Charlotte,
Indianapolis, and Portland).
In all ADAM II sites, 65 percent or more of arrestees have a high school diploma or its equivalency,
ranging from 65 percent (Chicago and Sacramento) to 78 percent (Washington DC). Half or more of
arrestees in 7 of the 10 sites report they are working at least part time. Despite these relatively high
rates of employment and educational attainment, in 7 of 10 sites roughly a third or less of all arrestees
have any form of health insurance, including state-sponsored programs such as Medicaid, Medicare,
employer-based, Veteran’s Affairs health coverage, union or other plans. In the three other sites
(Washington DC, New York and Minneapolis) half to almost two-thirds of arrestees are insured. In
two sites, significantly fewer arrestees are insured in 2008 (Atlanta and Charlotte) than was true in
2007. In Indianapolis, the number of insured arrestees increases significantly in 2008, though still
rising to only 36 percent.
While the number of arrestees with stable living arrangements (living in own or someone else’s
house, mobile home or apartment, in a residential hotel, dormitory or group home) in the prior 30
days is 77 percent or more in all sites, between 7 percent of arrestees (Chicago) and 23 percent
(Portland and Atlanta) are living either in institutional settings or are homeless (Table 2.1).
Given the diversity of geographic sites, it is not surprising to find that the racial/ ethnic makeup of
arrestees varies across geographic areas (Table 2.2). Less than a quarter of arrestees identify
themselves as Hispanic in 8 of the 10 sites in 2008. The exceptions are Denver (44% Hispanic) and
New York (46%). In New York, Charlotte, and Portland, the proportion of arrestees who identify
themselves as Hispanic rose significantly between 2007 and 2008. In 4 of the 10 sites, 60 percent or
more of arrestees identify themselves as African-American, ranging from 60 percent in Charlotte to

10 Who Constitutes the ADAM II Samples? ADAM II 2008 Annual Report
85 percent in Washington DC. The proportion of African American arrestees decreases significantly
in Sacramento and remains unchanged elsewhere. The proportion of arrestees that identify
themselves as White ranges from one percent in Washington DC to 47 percent in Portland.
History with Criminal Justice System
Experience with the criminal justice system prior to the current arrest is common among arrestees
across all sites. In 2008, at least 59 percent or more of arrestees in each site report at least one arrest
prior to the current one; in 8 of the 10 sites more than 80 percent of arrestees have a prior arrest. In
Atlanta and Sacramento there is also a significant increase in arrestees who report a prior arrest
between 2007 and 2008; in Portland this figure decreases significantly in 2008 (Table 2.3).
Interviewers record the three most serious charges for all arrestees from the official booking record of
each arrestee. The percentage of arrestees charged with violent crimes ranges from 8 percent of cases
in Washington DC to 26 percent in Minneapolis, and the proportion with drug crime charges ranges
from 23 percent (Portland) to 60 percent (Chicago). Property crimes constitute from 4 percent of
arrestees in Washington DC to 33 percent in Atlanta, while assorted ―other‖ crimes, including
probation/parole violations, disturbing the peace, traffic-related offenses, and other more minor
crimes, make up over half of charges in 5 of the 10 sites (Table 2.4).
There are some significant changes from 2007 to 2008 in the types of charges for which offenders are
arrested. While the proportion of arrestees with violent charges decreases significantly in only two
sites (Washington DC and Portland), drug violations decrease significantly in 4 sites—Atlanta,
Charlotte, Minneapolis, and Portland.
Comparison of Arrestees Testing Positive for Any Drugs and All
Other Arrestees
The above data represent all persons sampled and interviewed for ADAM II; that is, all males
arrested, not just those using drugs. An advantage of ADAM II data over more general statistics on
characteristics of offenders is the ability to compare persons involved in the criminal justice system
who test positive for any illicit drug with arrestees who do not test positive for any illicit drug.
Table 2.5 presents demographic information for persons testing positive for some illicit substance at
arrest and those testing negative. There are some significant differences between these two groups in
many sites. In 5 of the sites, users are significantly younger, and in 6 sites more likely to be single.
In 9 of the 10 sites users are significantly more likely to be US citizens and in 8 of the sites less likely
to be working. Compared to arrestees not using drugs, more users in 6 of the 10 sites also are
uninsured; and in Minneapolis, New York and Washington DC users also are less likely to be in a
stable living situation (Table 2.6).
Arrestees who test positive for drugs also are more likely to have been arrested in the past in half of
the 10 sites and more likely to have some prior arrest in 6 of the 10 sites (Table 2.6) than are non-
users. Anywhere from 8 percent (Denver) to 23 percent (Chicago) of arrestees who admit any drug
use in the past year also report that they were arrested two or more times in the past year (Table 2.3).

ADAM II 2008 Annual Report Who Constitutes the ADAM II Samples? 11
Substance Abuse and Mental Health Treatment Experience
Given the large number of drug users arrested, the criminal justice system is a potentially important
point of identification of the need for treatment among a hard to reach population. An advantage of
the ADAM II program is the ability to look at treatment experiences in a population of persons with
current or recent drug use. In the ADAM II interview, all arrestees are asked whether they have ever
been admitted to inpatient and outpatient treatment19
programs for drugs or alcohol, or a facility for
mental health treatment. Arrestees admitting to any drug use in the past year also are asked
specifically about types of drug and alcohol treatment (in-patient, out-patient) over the year, the
number of times they have been admitted to each type and the number of nights they have spent in
inpatient mental health treatment.
Across ADAM II sites in 2008 the proportion of all arrestees who report any prior outpatient drug or
alcohol treatment ranges from a low of 9 percent in Washington DC to a high of 35 percent in
Minneapolis (Table 2.7). Questions about more recent (prior 12 months) outpatient treatment are
asked of those arrestees who report using drugs in the past year. The percentage of arrestees with
prior year outpatient treatment ranges from less than one percent in Atlanta to 9 percent in New York
(Table 2.8). Recent utilization numbers have remained stable since 2007 in all sites except Portland
where there is a significant decrease in outpatient treatment reported. Similar numbers of arrestees
with drug use in the past year also report receiving inpatient drug or alcohol treatment in the past
year, ranging from less than one percent in Washington DC to 10 percent in Minneapolis (Table 2.8).
All arrestees are also asked whether they have ever stayed at least overnight for mental health
treatment at a psychiatric unit of a hospital or special mental health facility. Arrestees who report
drug use in the past 12 months also are asked about mental health treatment in the prior year. The
proportion of all arrestees who report any lifetime overnight stay in a mental health facility ranges
from 3 percent in Washington DC to 13 percent in Minneapolis and Portland (Table 2.7). Across all
sites, 3 percent or fewer arrestees who admit past year drug use say they received inpatient mental
health treatment in the past year.
19
Respondents are told not to include self-help outpatient programming such as Alcoholics Anonymous,
Narcotics Anonymous or Cocaine Anonymous.

12 Who Constitutes the ADAM II Samples? ADAM II 2008 Annual Report

ADAM II 2008 Annual Report Drug Use and Drug Market Activity Among Arrestees 13
3.0 Drug Use and Drug Market Activity Among
Arrestees
Are Arrestees Telling the Truth About Drug Use?
Congruence Between Self-Report and Test Results
The validity of self-report data on illegal activity like drug use has been debated for decades. Is the
population being surveyed telling the truth? Unlike other surveys, in ADAM II information about
drug use comes from two sources: a urine sample tested for a panel of drugs taken at the end of each
interview and the arrestee’s self report of use of a number of drugs over several different time frames
(3 days, 7 days, 30 days and 12 months). Combined, these two sources produce a picture of actual
use of illegal substances.
There is a remarkably high congruence between the self-report of drug use and test results in the
ADAM II samples, particularly given the nature of the behavior and the setting in which questions are
being asked. Given the nature of the behavior, we might expect first, a high rate of refusal to provide
a sample and second, less than truthful answers about recent use of illegal drugs. In fact, the ADAM
II data collection process produces high rates of consent to providing a sample as well as high
congruence between the arrestees’ reports and urine test results. With the exceptions of New York
(71%) and Washington DC (58%), from 85 to 91 percent of interviewed arrestees in the other 8 sites
provide a sample for testing.20
But are arrestees telling the truth about their drug use? Figure 3.1 indicates the percentage of overall
truthful answers on drug use by specific drug; that is, the total of arrestee who used a drug and
admitted it, and those who did not use and answered negatively.21
As reported in Table 3.1a, over 80
percent of arrestees respond truthfully regarding use of marijuana and cocaine in 9 of 10 sites; over 95
percent respond truthfully about heroin, and methamphetamine when compared to matched urinalysis
results.
20
The physical setting in the New York site may have some impact on the lowered agreement rate in that
there is far less privacy in the cell area for the arrestee.
21 Drugs have different windows of detection in urinalyses. Cocaine, heroin and stimulants in general pass out
of a reliable window of detection fairly quickly (within 2-3 days) while marijuana and many sedatives are
detectable up to 30 days, depending on the amount and frequency of use. When determining ―truth telling‖
we match the drug with the appropriate self-report time frames (last 3 days, last week, last month) to best
match test detection window.

14 Drug Use and Drug Market Activity Among Arrestees ADAM II 2008 Annual Report
Figure 3.1: Rate of Congruence Between Self-reports and Urine Tests for Selected Drug Use,
2008
0%
10%
20%
30%
40%
50%
60%
70%
80%
90%
100%
Marijuana Cocaine Heroin Methamphetamine
Pe
rce
nt
However, many arrestees in the ADAM II samples are not current users and do not test positive for an
illicit substance; thus the congruence rate shown above is driven by respondents who do not report
using drugs and do not test positive for any drug. The key question is whether arrestees who test
positive for drugs admit to using them. Figure 3.2 (Table 3.1b) indicates the percentage of arrestees
using each drug (test positive) and admitting it. There are interesting differences by drug. Cocaine
(45%) and heroin (48%) users are less likely to report accurately than methamphetamine (55%) and
marijuana (82%) users, underscoring the value of the bioassay in accurately assessing drug use. As
these data highlight, without test results, estimates of use of some drugs derived from self report alone
can be substantially underestimated. Given that other drug use surveys do not use a bioassay
confirmation, it is impossible to compare the size of that under-representation of use with ADAM II
respondents.
It is likely that other self-report data on drug use are not similar to the data obtained in this unique
situation. In ADAM II, the respondent is told at the beginning of the interview that he will be asked
to voluntarily provide a specimen, perhaps making deception less attractive than in settings where
there is no apparent validation. In addition, in ADAM II interviews no information regarding who the
individual is or where he lives is taken with the perhaps incriminating or embarrassing answers. It
also may be true that the arrestee population is simply more drug-experienced and the behavior is
seen as more normative. Whatever the reason, ADAM II respondents appear both willing to provide
a urine sample for testing and, even when using, are telling the truth about that drug use about half the
time.
83% 84%
96% 97%

ADAM II 2008 Annual Report Drug Use and Drug Market Activity Among Arrestees 15
Figure 3.2: Percent Admitting to use When Testing Positive, 2008
0%
10%
20%
30%
40%
50%
60%
70%
80%
90%
100%
Marijuana Cocaine Heroin Methamphetamine
Perc
en
t
The sections that follow present data on the drug use and drug market participation of arrestees from
the 10 ADAM II sites for 2008. It first presents data on the prevalence of any illegal drug in
interviewed arrestees and then examines drug and market use information across sites, focusing on
each of the major drugs of interest one at a time.
Test Results for the Presence of Any Illicit Drugs
Many in the ADAM II population are consumers of illegal drugs. While some are arrested for direct
involvement in use (possession or distribution of drugs, driving under the influence), the majority is
arrested on a wide range of non-drug charges. Nonetheless, a large percentage of arrestees in all sites
test positive for at least one substance in their system at the time of arrest, and many for more than
one.
Figure 3.3 shows the results of urinalysis indicating the presence of any substance for male arrestees
for 2007 and 2008 (Table 3.2 in Appendix A displays all years 2000-2003; 2007-2008). As this
indicates, in 2008, anywhere from 49 percent (Washington DC) to 87 percent (Chicago) of arrestees
across sites test positive for the presence of some substance in their system at the time of arrest; in 9
out of the 10 sites 60 percent or more test positive. This proportion has remained relatively stable
across sites since 2007, declining significantly only in Portland, Atlanta, and Washington DC.
82%
45% 48%
55%
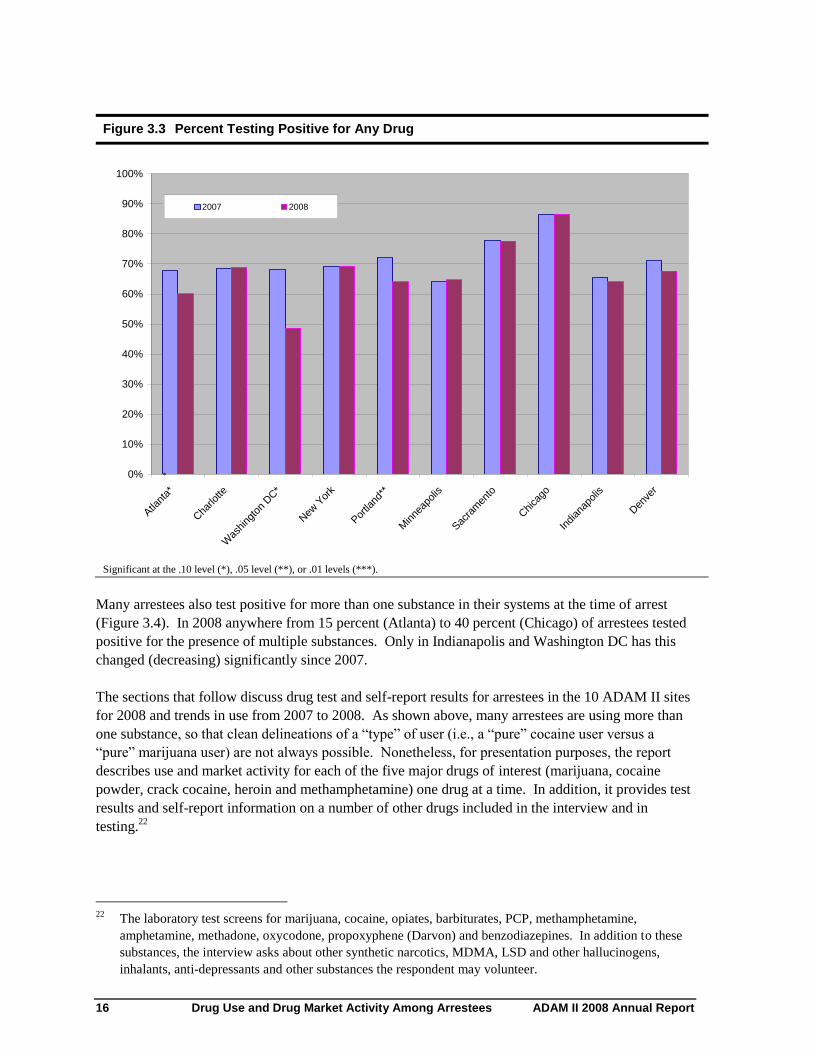
16 Drug Use and Drug Market Activity Among Arrestees ADAM II 2008 Annual Report
Figure 3.3 Percent Testing Positive for Any Drug
0%
10%
20%
30%
40%
50%
60%
70%
80%
90%
100%
Atla
nta*
Cha
rlotte
Was
hing
ton
DC*
New
Yor
k
Por
tland
**
Minne
apolis
Sac
ram
ento
Chica
go
Indian
apolis
Den
ver
2007 2008
Significant at the .10 level (*), .05 level (**), or .01 levels (***).
Many arrestees also test positive for more than one substance in their systems at the time of arrest
(Figure 3.4). In 2008 anywhere from 15 percent (Atlanta) to 40 percent (Chicago) of arrestees tested
positive for the presence of multiple substances. Only in Indianapolis and Washington DC has this
changed (decreasing) significantly since 2007.
The sections that follow discuss drug test and self-report results for arrestees in the 10 ADAM II sites
for 2008 and trends in use from 2007 to 2008. As shown above, many arrestees are using more than
one substance, so that clean delineations of a ―type‖ of user (i.e., a ―pure‖ cocaine user versus a
―pure‖ marijuana user) are not always possible. Nonetheless, for presentation purposes, the report
describes use and market activity for each of the five major drugs of interest (marijuana, cocaine
powder, crack cocaine, heroin and methamphetamine) one drug at a time. In addition, it provides test
results and self-report information on a number of other drugs included in the interview and in
testing.22
22
The laboratory test screens for marijuana, cocaine, opiates, barbiturates, PCP, methamphetamine,
amphetamine, methadone, oxycodone, propoxyphene (Darvon) and benzodiazepines. In addition to these
substances, the interview asks about other synthetic narcotics, MDMA, LSD and other hallucinogens,
inhalants, anti-depressants and other substances the respondent may volunteer.
*
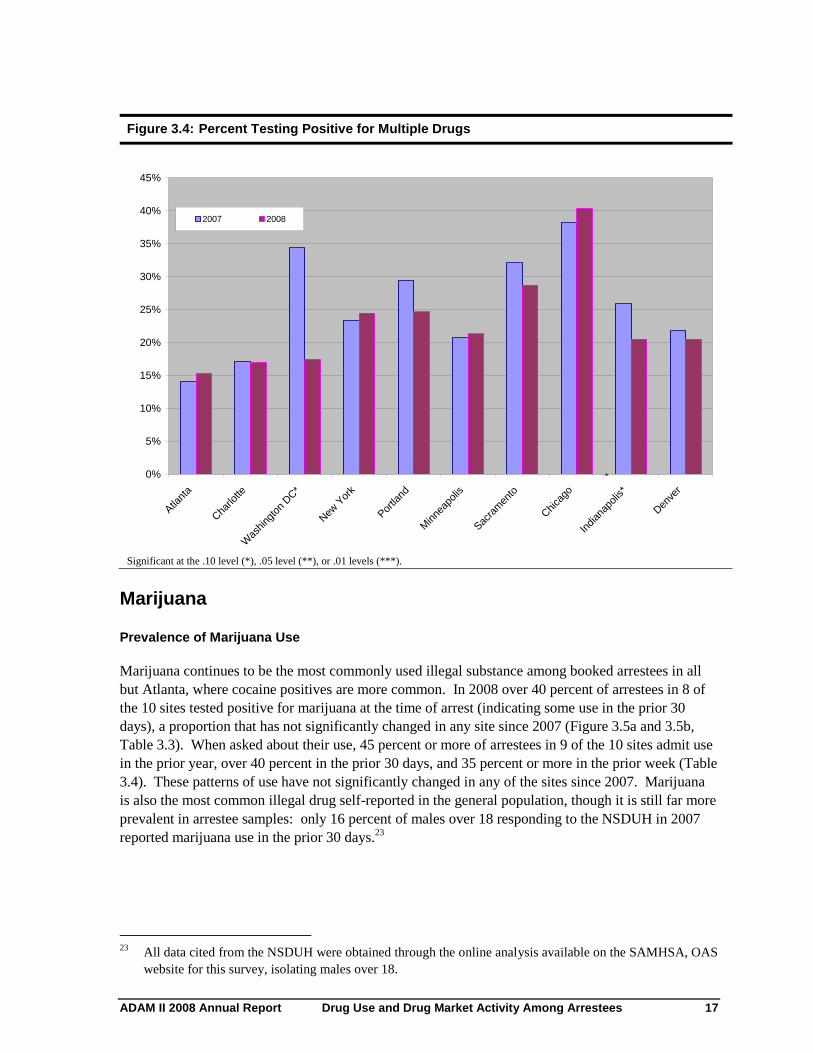
ADAM II 2008 Annual Report Drug Use and Drug Market Activity Among Arrestees 17
Figure 3.4: Percent Testing Positive for Multiple Drugs
0%
5%
10%
15%
20%
25%
30%
35%
40%
45%
Atla
nta
Cha
rlotte
Was
hing
ton
DC*
New
Yor
k
Por
tland
Minne
apolis
Sac
ram
ento
Chica
go
Indian
apolis*
Den
ver
2007 2008
Significant at the .10 level (*), .05 level (**), or .01 levels (***).
Marijuana
Prevalence of Marijuana Use
Marijuana continues to be the most commonly used illegal substance among booked arrestees in all
but Atlanta, where cocaine positives are more common. In 2008 over 40 percent of arrestees in 8 of
the 10 sites tested positive for marijuana at the time of arrest (indicating some use in the prior 30
days), a proportion that has not significantly changed in any site since 2007 (Figure 3.5a and 3.5b,
Table 3.3). When asked about their use, 45 percent or more of arrestees in 9 of the 10 sites admit use
in the prior year, over 40 percent in the prior 30 days, and 35 percent or more in the prior week (Table
3.4). These patterns of use have not significantly changed in any of the sites since 2007. Marijuana
is also the most common illegal drug self-reported in the general population, though it is still far more
prevalent in arrestee samples: only 16 percent of males over 18 responding to the NSDUH in 2007
reported marijuana use in the prior 30 days.23
23
All data cited from the NSDUH were obtained through the online analysis available on the SAMHSA, OAS
website for this survey, isolating males over 18.
*

18 Drug Use and Drug Market Activity Among Arrestees ADAM II 2008 Annual Report
Figure 3.5a: Percent Testing Positive for Marijuana—East and Midwest
0%
10%
20%
30%
40%
50%
60%
2000 2001 2002 2003 2007 2008
Atlanta Charlotte Washington, DC Indianapolis New York
Figure 3.5b: Percent Testing Positive for Marijuana—Midwest and West
0%
10%
20%
30%
40%
50%
60%
2000 2001 2002 2003 2007 2008
Chicago Portland Minneapolis Sacramento Denver

ADAM II 2008 Annual Report Drug Use and Drug Market Activity Among Arrestees 19
As these figures show, trends in marijuana use among arrestees in all sites have been stable since
ADAM collection began in 2000. Results from some sites (Atlanta, Portland, Denver, NY,
Washington DC) fluctuate at around a third of arrestees testing positive, while others (Charlotte,
Minneapolis, Sacramento, Chicago) remain at a somewhat higher level (45-50%).
Figure 3.6: Percent Self-Reporting Use of Marijuana, Past 30 Days
0
0.1
0.2
0.3
0.4
0.5
0.6
Atlanta Charlotte Chicago Denver Indianapolis Minneapolis New York Portland Sacramento Washington,
DC
2007 2008
Differences between 2008 estimate and 2007 estimate are reported as significant at the .10 level (*), .05 level (**), or .01 levels (***).
The ADAM II interview asks both whether arrestees use (any use in a specified time period) and the
frequency of use of each drug. Arrestees who admit to marijuana use in the last 30 days are asked on
how many days over the prior 30 they used it (Table 3.4). The average number of days on which the
arrestee used marijuana in the last 30 ranges from 5 days per month in Washington DC to 19 days per
month in New York; in 7 of the 10 sites the average number of days used is 15 or more. In three sites
there is a statistically significant increase in the number of days used in 2008 (New York, Portland
and Chicago) and in one site (Washington DC) a significant decline.
Arrestees who admit to use also are asked the age at which they first used each drug (Table 3.5). The
average age of initiation of marijuana use is the youngest for all of the drugs investigated. In 9 of the
10 sites for those who report use in prior 30 days, the average age of first marijuana use is 16 or
younger; only Washington DC arrestees reported an older average age of first use (18).
60%
50%
10%
0%
20%
30%
40%

20 Drug Use and Drug Market Activity Among Arrestees ADAM II 2008 Annual Report
Buying and Selling: Marijuana Markets 24
Given the prevalence of marijuana use among booked arrestees, it is not surprising that marijuana is
the most frequently acquired drug in the ADAM II sites. In the market section of the interview
arrestees are asked which drugs they acquired over the prior 30 days, whether the drugs were for their
own use or not, and whether they were acquired through a cash transaction, a non-cash transaction
(barter, theft, trading sex or services, sharing, gifting), or a combination of the two. In addition, they
are asked a number of questions regarding the circumstances and nature of the transaction (locale,
number of dealers used, price, unit obtained, whether it was purchased in or out of their
neighborhood, etc.). These questions are intended to help characterize changes in the nature of drug
markets. For example, a preponderance of cash transactions generally characterize a more formal
market with a larger number of entrepreneurs and buyers who may or may not be known to each
other. Some types of non-cash transactions (i.e., sharing or ―gifting‖ drugs) are more characteristic of
less formal or relational market activities taking place among more familiar associates. For example,
methamphetamine made locally in a ―mom and pop‖ clandestine lab for the use of the cook and his
friends would be the latter market type, while methamphetamine purchased as finished product from a
street dealer would be the former. As a market becomes more formal and organized, one might
expect to see less sharing or non-cash transactions between familiars and more cash-only transactions
using multiple dealers not well known to the buyer.
As with marijuana use, the overall level of acquisition of marijuana (in either cash or non-cash
transactions) remains stable across most sites from 2007 to 2008 (Tables 3.6 to Table 3.8). Only in
Portland is there a statistically significant drop (from 44% to 38% of arrestees) in arrestees acquiring
marijuana.
Arrestees who acquired marijuana in the prior 30 days are asked if they paid cash or obtained drugs
through non-cash exchanges in any of the transactions.25
In 7 of the 10 sites over 60 percent of the
marijuana users made transactions using cash (Table 3.7); in the other three sites (Denver, Portland
and Sacramento) anywhere from 39 to 54 percent of users used cash. In New York, the proportion of
arrestees reporting purchases made via cash increases significantly from 65 percent in 2007 to 74
percent in 2008, though the percentage of arrestees reporting non-cash transactions remains the same
(64%). Eighty percent of arrestees in Portland and Sacramento and over 70 percent in Denver and
Minneapolis report a non-cash transaction; about half or fewer arrestees report transactions in these
sites involvinf cash. In Charlotte significantly fewer arrestees report cash transactions (67%) and
significantly more report noncash transactions (65%) from 2007 to 2008. There is a significant
decrease in arrestees reporting cash transactions in Sacramento.
The marijuana market appears to be one where the person acquiring the drug is familiar with the
individual selling, sharing or otherwise distributing it. Over half of those who acquired marijuana in
the prior 30 days did so from a ―regular‖ source (as opposed to a ―new‖ or ―occasional‖ source) in 6
of the 10 sites. This pattern is unchanged for all but one site (New York). In New York a
significantly higher proportion of arrestees report their marijuana buys were from a regular source in
24
The term marijuana includes hashish, a compressed marijuana product.
25 As they may be reporting more than one transaction, arrestees may have utilized both methods in the course
of the month. The interview asks the arrestee to provide details only on the last or most recent cash and the
last non-cash transaction in the prior 30 days.

ADAM II 2008 Annual Report Drug Use and Drug Market Activity Among Arrestees 21
2008 than was true in 2007 (Table 3.9). Over 80 percent of the arrestees across all sites report they
are buying it directly themselves from the seller rather than giving money to someone else to obtain it
(Table 3.10).
Outdoor or ―open air‖ transactions of drugs are often associated with a less relational market; that is,
buyers and sellers are not exchanging the drugs in someone’s house or apartment but rather in a
public building, on the street or in some other outdoor venue. For marijuana, the last buy is as likely
to occur in outdoor or public sales as in a more private setting in 4 of the 10 sites; that is, half or more
arrestees report that the last transaction was in a public place. The market is less public, however, in
Indianapolis (only 19% of arrestees report the last buy was outdoors), Portland (27%) and Charlotte
(28%). In two sites (Sacramento and Chicago) there is a statistically significant increase in the
percentage of arrestees who report that the last marijuana buy was made outdoors.
Marijuana users purchase the drug on average 6-8 days of the prior 30 across all but two sites
(Chicago and New York) where arrestees report purchasing on average 11 days out of the prior month
(Table 3.12). The average purchase days remains essentially the same since 2007 in all but three
sites. In Sacramento and Minneapolis marijuana users are buying less frequently and in New York
they are buying more frequently.
ADAM arrestees are asked a series of questions that in combination provide some information on the
availability of each drug in the markets in which ADAM arrestees are acquiring their drugs (Table
3.13); that is, how difficult is the drug to get when there is the desire and the means? Arrestees who
admit a purchase also are asked if they had tried to buy marijuana in the past 30 days, had the funds
but could not (i.e., a failed buy). They are then asked the reason the buy failed (police presence, no
dealers available with the drug, no dealers with the quality desired). The proportion of arrestees who
report a failed marijuana buy does not change significantly in any site from 2007 to 2008, though the
availability of marijuana differs across the 10 markets. Marijuana may be more accessible in Denver
(only 25% of arrestees reporting a failed buy) and Portland (30% of arrestees reporting a failed buy)
than in New York, Atlanta, Indianapolis and Washington DC where over 40 percent of arrestees
trying to buy report a failure in the prior 30 days. Of those who report a failed buy, the most frequent
reason given across sites is ―unavailability of the drug‖ in all sites except Chicago, where more
arrestees report a failed marijuana transaction due to police activity.
Cocaine: Crack and Powder
Cocaine is the second most commonly detected substance among arrestees in 2008 in all but
Sacramento where methamphetamine is more common and in Atlanta where cocaine is the most
commonly detected substance. Anywhere from 17 percent (Sacramento) to 44 percent (Chicago) of
arrestees test positive for cocaine in their system at the time of arrest26
in 2008. In 5 of the 10 sites
(Figures 3.7a and b, Table 3.3), 30 percent or more arrestees test positive for cocaine.
26
The urinalysis test used detects the metabolites of cocaine, but cannot differentiate between cocaine in
powder or in crack form, so test results could indicate either the use of either form of the drug. Self-report
is used to distinguish patterns of use (30 day, 12 month, etc.) and purchase between these two forms of the
drug.
22 Drug Use and Drug Market Activity Among Arrestees ADAM II 2008 Annual Report
While still high, the prevalence of cocaine use among arrestees appears to be stable or declining
across many of the ADAM II sites. There are statistically significant declines from 2007 to 2008 in
the percentage of arrestees testing positive in Indianapolis and Washington DC. In Chicago and
Portland significant declines occurred from 2003 to 2007 and use remains at the lowered 2007 level
into 2008.
While there is little variation in some sites (Atlanta, Charlotte, Minneapolis, Sacramento) in the
percentage of arrestees testing positive for cocaine since 2000, there are fluctuations in other sites.
New York is a good example. In 2000, half of the New York arrestee sample tested positive for
cocaine, a number that declined significantly to 46 percent in 2001, then declined again in 2003. That
decline remained stable to where in 2008 about 30 percent of arrestees test positive. Chicago also
maintained a high level from 2000 to 2003 (about half of all of arrestees testing positive), dropped
significantly in 2007 and remains at the lower level (44%) into 2008.
We note again that the test results shown in these figures represent both cocaine in powder and crack
form, as either form produces a positive drug test result. Across all sites, the majority of arrestees
who test positive for cocaine report being crack users; 46 percent of those with positive cocaine urine
screens report using crack in the past three days versus 8 percent who say they used powder cocaine.
To further differentiate users of crack from cocaine powder in ADAM II we turn to self-report data on
each form of the drug, discussed separately below.
Prevalence of Use: Self-reported Crack Use
The popularity of crack varies across sites (Figure 3.8, Table 3.16). In 2008 in Atlanta and Chicago
over 20 percent of arrestees admit use in both the prior year and the prior 30 days. In New York and
Sacramento crack appears less popular—11 percent or fewer arrestees in either site report any crack
use in the prior year and less than 9 percent in the prior 30 days. There are significant declines since
2007 in two sites in the percentage of arrestees reporting crack use in the prior 30 days (Portland and
Charlotte), both of which fell from highs of 15-19 percent to 11-14 percent levels.

ADAM II 2008 Annual Report Drug Use and Drug Market Activity Among Arrestees 23
Figure 3.7a: Percent Testing Positive for Cocaine—East and Midwest
0%
10%
20%
30%
40%
50%
60%
2000 2001 2002 2003 2007 2008
Atlanta Charlotte New York
Indianapolis Washington DC
Figure 3.7b: Percent Testing Positive for Cocaine—Midwest and West
0%
10%
20%
30%
40%
50%
60%
2000 2001 2002 2003 2007 2008
Portland Minneapolis Sacramento Denver Chicago

24 Drug Use and Drug Market Activity Among Arrestees ADAM II 2008 Annual Report
Figure 3.8: Percent Self-Reporting Use of Crack Cocaine, Past 30 Days
0%
5%
10%
15%
20%
25%
30%
Atlanta Charlotte* Chicago Denver Indianapolis Minneapolis New York Portland* Sacramento Washington,
DC
2007 2008
Significant at the .10 level (*), .05 level (**), or .01 levels (***).
As with marijuana, crack is far more common in the arrestee population in the ADAM II sites than in
the general population: in 2007 less than 1 percent of males over 18 reported using crack either in the
prior 12 months or in the prior 30 days in the NSDUH sample. Across all ADAM II sites in 2007, 10
percent is the smallest percentage of arrestees reporting crack use in the last 30 days (in New York).
The frequency of use (average number of days on which crack is used) for those who report prior 30-
day use continues to be high (Table 3.16) across most sites in 2008. The average number of use days
ranges from a high of 20 days in Atlanta to a low of 6 days in Washington DC.
The age of first use of crack is older than that found for marijuana across all sites (Table 3.5). The
median age of first use among those reporting prior 30-day use across all sites is 25 years old, ranging
from 23 (Minneapolis) to 27 (Washington DC).
Across the ADAM II sites, crack use either remains stable or is declining since 2007. There are
statistically significant drops in past 30-day reported crack use in Charlotte (from 19 to 14%) and in
Portland (from 15 to 11%), but no significant changes in any other site (Table 3.16).
Buying and Selling: Crack Markets
The crack cocaine market is the second most active drug market among arrestees (after marijuana) in
all but three sites. In New York more arrestees report acquiring powder cocaine than crack and in
Sacramento and Portland more arrestees report acquiring methamphetamine than crack. In all sites,
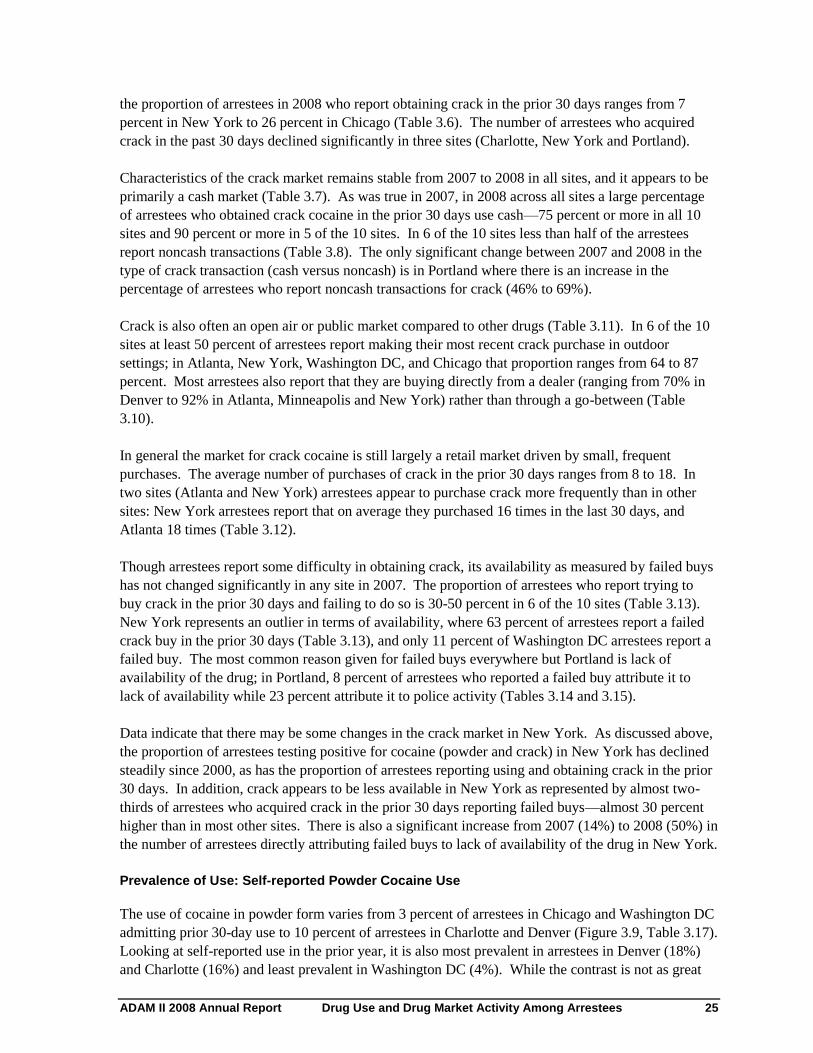
ADAM II 2008 Annual Report Drug Use and Drug Market Activity Among Arrestees 25
the proportion of arrestees in 2008 who report obtaining crack in the prior 30 days ranges from 7
percent in New York to 26 percent in Chicago (Table 3.6). The number of arrestees who acquired
crack in the past 30 days declined significantly in three sites (Charlotte, New York and Portland).
Characteristics of the crack market remains stable from 2007 to 2008 in all sites, and it appears to be
primarily a cash market (Table 3.7). As was true in 2007, in 2008 across all sites a large percentage
of arrestees who obtained crack cocaine in the prior 30 days use cash—75 percent or more in all 10
sites and 90 percent or more in 5 of the 10 sites. In 6 of the 10 sites less than half of the arrestees
report noncash transactions (Table 3.8). The only significant change between 2007 and 2008 in the
type of crack transaction (cash versus noncash) is in Portland where there is an increase in the
percentage of arrestees who report noncash transactions for crack (46% to 69%).
Crack is also often an open air or public market compared to other drugs (Table 3.11). In 6 of the 10
sites at least 50 percent of arrestees report making their most recent crack purchase in outdoor
settings; in Atlanta, New York, Washington DC, and Chicago that proportion ranges from 64 to 87
percent. Most arrestees also report that they are buying directly from a dealer (ranging from 70% in
Denver to 92% in Atlanta, Minneapolis and New York) rather than through a go-between (Table
3.10).
In general the market for crack cocaine is still largely a retail market driven by small, frequent
purchases. The average number of purchases of crack in the prior 30 days ranges from 8 to 18. In
two sites (Atlanta and New York) arrestees appear to purchase crack more frequently than in other
sites: New York arrestees report that on average they purchased 16 times in the last 30 days, and
Atlanta 18 times (Table 3.12).
Though arrestees report some difficulty in obtaining crack, its availability as measured by failed buys
has not changed significantly in any site in 2007. The proportion of arrestees who report trying to
buy crack in the prior 30 days and failing to do so is 30-50 percent in 6 of the 10 sites (Table 3.13).
New York represents an outlier in terms of availability, where 63 percent of arrestees report a failed
crack buy in the prior 30 days (Table 3.13), and only 11 percent of Washington DC arrestees report a
failed buy. The most common reason given for failed buys everywhere but Portland is lack of
availability of the drug; in Portland, 8 percent of arrestees who reported a failed buy attribute it to
lack of availability while 23 percent attribute it to police activity (Tables 3.14 and 3.15).
Data indicate that there may be some changes in the crack market in New York. As discussed above,
the proportion of arrestees testing positive for cocaine (powder and crack) in New York has declined
steadily since 2000, as has the proportion of arrestees reporting using and obtaining crack in the prior
30 days. In addition, crack appears to be less available in New York as represented by almost two-
thirds of arrestees who acquired crack in the prior 30 days reporting failed buys—almost 30 percent
higher than in most other sites. There is also a significant increase from 2007 (14%) to 2008 (50%) in
the number of arrestees directly attributing failed buys to lack of availability of the drug in New York.
Prevalence of Use: Self-reported Powder Cocaine Use
The use of cocaine in powder form varies from 3 percent of arrestees in Chicago and Washington DC
admitting prior 30-day use to 10 percent of arrestees in Charlotte and Denver (Figure 3.9, Table 3.17).
Looking at self-reported use in the prior year, it is also most prevalent in arrestees in Denver (18%)
and Charlotte (16%) and least prevalent in Washington DC (4%). While the contrast is not as great

26 Drug Use and Drug Market Activity Among Arrestees ADAM II 2008 Annual Report
with crack cocaine use, again arrestees in ADAM II sites are far more involved with cocaine powder
than persons surveyed in general population (NSDUH). In 2007 only 1 percent of males over 18
surveyed in NSDUH admitted use in the prior 30 days and only 3 percent admitted use in the past
year.
Figure 3.9: Percent Self-Reporting Use of Powder Cocaine, Past 30 days
0.00%
2.00%
4.00%
6.00%
8.00%
10.00%
12.00%
14.00%
16.00%
Atlant
a
Cha
rlotte
Chica
go
Den
ver*
Indian
apolis**
Minne
apolis
New
Yor
k
Portla
nd
Sacra
men
to
Was
hing
ton,
DC
2007 2008
Differences between 2008estimate and 2007 estimate are reported as significant at the .10 level (*), .05 level (**), or .01 levels (***).
There are statistically significant decreases in very recent use (last three days) from 2007 to 2008 in
four sites (Atlanta, Indianapolis, Portland and Sacramento), as shown in Table 3.17. The percentage
of arrestees who report prior 30-day use remains the same in 8 of the 10 sites, but declines
significantly in Denver and Indianapolis from 2007.
Unlike marijuana or crack cocaine, cocaine in powder form is often injected. Arrestees who report
using cocaine powder in the prior year are asked if they injected the drug at the most recent use.
There is considerable variability across the sites in the percentage of users who inject (Table 3.18).
Cocaine injection is most common in New York (27%) and Portland (18%); 6 percent or less of
cocaine users in the other sites report injecting at last use.
Cocaine powder users also appear to use the drug with less frequency (on fewer days per month) than
those using crack. In all sites, self-reported cocaine powder users said they used the drug on fewer
than 10 days in the past month (Table 3.17), ranging from an average of 3 days in Minneapolis and
Washington DC to 10 days in New York . The frequency of use remains the same from 2007 to 2008
across 7 of 10 sites. The exceptions are Washington DC, Minneapolis and Charlotte where the
number of days used in the prior 30 declines significantly.
16%
14%
12%
8%
10%
6%
4%
2%
0%

ADAM II 2008 Annual Report Drug Use and Drug Market Activity Among Arrestees 27
The average age of initiation of cocaine powder use among arrestees who admit prior month use is
somewhat younger than found with crack (Table 3.5). Crack users appear to have begun their use in
their mid to late 20s in all sites while cocaine powder users are more likely to have started use before
they were 22 in all but the Washington DC sample (Table 3.5).
Buying and Selling: Cocaine Powder Markets
The drop in the number of arrestees testing positive for cocaine may be driven in some sites by
reductions in powder cocaine use rather than crack cocaine use. The proportion of arrestees who
report acquiring powder cocaine in the past 30 days is either stable or decreases in all ADAM II sites
in 2008 (Table 3.6). In four sites declines are statistically significant (Charlotte, Denver, Indianapolis
and Portland).
Despite the drop in percentage of arrestees who report acquiring powder cocaine, corresponding
changes in other market characteristics that might be expected in a tightening market are not as
apparent. For example, three sites (Atlanta, Charlotte, Minneapolis) show a significant decline in the
average number of purchases arrestees report making in the past 30 days from 2007 to 2008 (Table
3.12). The average number of purchases in two sites (Washington DC and Indianapolis) increases
significantly in 2008.
In most sites, the market for powder cocaine appears less driven by cash transactions than the crack
market. Whereas over 75 percent of arrestees (Table 3.7) who acquired crack in the prior 30 days
report a cash transaction, in only two sites is the percentage of cash transactions for cocaine powder
that high—New York (84%) and Charlotte (80%). In Atlanta where 70 percent of arrestees in 2007
who acquired cocaine powder in the prior 30 days paid cash for it, only 44 percent did so in 2008, a
statistically significant decline. An even more dramatic decline is reported in Chicago where the
percentage of those who acquired cocaine powder via a cash transaction declines from 89 percent in
2007 to 38 percent in 2008. The number of arrestees reporting obtaining cocaine powder through
noncash means (exchange of goods or services, sharing, gifts) remains stable in all sites but
Washington DC where there is a significant decline in noncash transactions.
In all but one site (Denver) more than 75 percent of arrestees report buying cocaine powder directly
from the dealer (Table 3.10); and in 6 of the 10 sites arrestees report buying it from a regular source
over 60 percent of the time (Table 3.9). In Chicago there is a significant decline in the number of
arrestees reporting the last transaction was through a regular source (from 84% in 2007 to 28% in
2008); in New York and Minneapolis there is a significant increase in the number buying from a
regular source.
Cocaine powder transactions also are less likely to occur outdoors or in a public setting than found
with crack (Table 3.11). Fewer than half of those who report a cash transaction for cocaine powder in
the past 30 days made that purchase outside in every site but Denver where 54 percent of transactions
occurred outside; in two sites (Indianapolis and Charlotte) less than 20 percent of cocaine powder
sales occurred in outdoor or public venues. These characteristics may suggest a somewhat more
private and less cash-oriented market for powder cocaine in most ADAM II sites.
Availability of cocaine powder as measured by percentage of arrestees reporting failed buys in the
prior 30 days remains unchanged in all sites (Table 3.13). As with crack, New York arrestees report
the highest percentage of failed cocaine powder buys (63%), followed by Portland and Charlotte
28 Drug Use and Drug Market Activity Among Arrestees ADAM II 2008 Annual Report
(47%). Sites with the fewest unsuccessful powder cocaine buys (and perhaps greater availability) are
Sacramento (15%), Minneapolis (18%) and Indianapolis (19%). Inability to purchase due to police
activity is only reported in New York (6%); but most failed buys in New York are attributed to
unavailability of the drug (Table 3.15). This attribution increases significantly from 2007 (7%) to
2008 (42%) in New York. By contrast, in Denver cocaine powder may be somewhat more available
than in 2007—65 percent of arrestees reporting a failed buy in 2007 attributed it to unavailability,
whereas in 2008 only 23 percent cite that reason.
Heroin
Prevalence of Use: Heroin 27
Figures 3.10a and 3.10b (Table 3.3) indicate trends in positive tests for opiates for each site from
2000 to 2008. Chicago leads the ten sites (29% test positive) with twice the proportion of arrestees
testing positive than the next most prevalent site, Washington DC (12%). Chicago’s test results also
represent a statistically significant increase over 2007, moving closer to its peak in 2000 (36%).
Denver also remains statistically unchanged from the significant decline reported in 2007 after a peak
in 2003 (8%). Fewer than 2 percent test positive in the two southern sites (Atlanta and Charlotte) and
in 3 of the remaining sites 5 percent or fewer arrestees test positive for opiates.
While many sites have remained relatively constant in the percentage of arrestees testing positive for
opiates there have been some interesting shifts since 2000 in others. Portland shows a significant
decline in opiate positives in 2008 (8%), after reaching a high point of 16 percent in 2003. New York
test data indicate a steady decline from 20 percent of arrestees testing positive in 2000 to a significant
decline in 2002 (13%) and 2007 (8%), remaining stable in 2008 (7%). In Denver the percentage of
opiate positives rose significantly in 2003 (8%) from the 3-4 percent estimates from the prior three
years, then dropped significantly to 3-4 percent where it remains in 2008.
27
Drug testing referenced here detects natural opiate derivatives: heroin, morphine and codeine. Tests for
synthetics narcotics such as oxycontin or methadone are conducted separately and not included in the
discussion of heroin. Questions on self-reported behavior refer to heroin.

ADAM II 2008 Annual Report Drug Use and Drug Market Activity Among Arrestees 29
Figure 3.10a: Percent Testing Positive for Opiates—East and Midwest
0%
5%
10%
15%
20%
25%
30%
35%
40%
45%
50%
2000 2001 2002 2003 2007 2008
Atlanta Charlotte New York
Washington, DC Indianapolis
Figure 3.10b: Percent Testing Positive for Opiates—Midwest and West
0%
5%
10%
15%
20%
25%
30%
35%
40%
45%
50%
2000 2001 2002 2003 2007 2008
Chicago Portland Minneapolis Sacramento Denver

30 Drug Use and Drug Market Activity Among Arrestees ADAM II 2008 Annual Report
Figure 3.11: Percent Self-Reporting Use of Heroin, Past 30 Days
0%
5%
10%
15%
20%
25%
30%
Atlanta Charlotte Chicago Denver* Indianapolis Minneapolis New York Portland Sacramento Washington,
DC
2007 2008
Significant at the .10 level (*), .05 level (**), or .01 levels (***).
Self report data on heroin (Figure 3.11, Table 3.19) also indicate considerable variability across sites.
While 27 percent of arrestees report its use in the past year and 25 percent in the past 30 days in
Chicago, 2 percent or fewer arrestees in Atlanta, Charlotte, Denver, and Indianapolis report any past
year use, and even fewer in the prior 30 days. A number of sites fall in between these extremes—8
percent report prior year use in New York, 10 percent in Portland and 4 percent in Washington DC
and Minneapolis. Washington DC and Denver data show a significant decline in the number of users
reporting past 30 days use. Again, as low as many of the site numbers are for heroin use among
arrestees, reports from the general population are lower still—0.1 percent of males over 18 in the
NSDUH report 30 days use and 0.3 percent report past year use.
Arrestees who admit heroin use in the prior 30 days report a consistently high frequency of use. In 7
of the 10 sites, arrestees who use heroin report using it 15 or more days of the prior 30; in Chicago,
Portland, and Washington DC in 2008 those admitting heroin use report an average of over 20 days
per month.
Heroin is also the drug most often reported as injected at the last episode of use in all sites (Table
3.18). Virtually all heroin users in Charlotte injected at the last use (99.5%) and over half of heroin
users injected at last use in 4 other of the sites. It is interesting to note that in Chicago, the site with
the highest proportion of arrestees testing positive for opiates in 2008 (29%) and the highest self-
reported use of heroin in the prior year (27%), only 25 percent report that they injected it at last use.
This suggests that large portions of Chicago heroin users may be employing other methods of
ingestion like inhalation or smoking.
*

ADAM II 2008 Annual Report Drug Use and Drug Market Activity Among Arrestees 31
For each site, the average age of first use of heroin of those admitting prior 30 day use is similar to
that found with powder cocaine—ranging from 22 years old in New York to 34 years old in
Washington DC (Table 3.15).
Buying and Selling: Heroin Markets
Though the activity of heroin markets varies widely from site to site, it remains largely stable within
most ADAM II sites from 2007 to 2008 (Table 3.6). As has been the case in previous years of
ADAM, a few sites have notable proportions of arrestees who report acquiring heroin, and other sites
have very little to no reported heroin market activity. Atlanta, Charlotte, Indianapolis and Denver
have small numbers of arrestees reporting some heroin acquisition (less than 2%), whereas 26 percent
in 2008 report acquiring heroin in the prior 30 days in Chicago. Denver and Washington DC are the
only sites with a statistically significant change (decline) in the percent of arrestees reporting
obtaining heroin in 2008.28
The higher activity in the heroin markets of Chicago (26% obtained
heroin), New York (6%), and Portland (8%) remains basically unchanged from 2007.
While in most sites, the percentage of arrestees who participate in the heroin market is small, within
that small group of heroin users the level of participation is high. In Portland, New York, Chicago,
and Washington DC (the sites with the greatest heroin market activity), the average number of
purchases (Table 3.12) is very high—from 15 to 26 purchases in the prior 30 days. This level of
market participation is higher than found with the users of any of the other drugs, with the exception
of New York (where the frequency with which crack users are making their purchases exceeds the
frequency reported by New York heroin purchasers).
In the three most active heroin sites (Chicago, New York and Portland), most arrestees report buying
heroin from a regular source (Table 3.9): 70 percent of arrestees who reported heroin acquisition in
Chicago, 60 percent in New York (a significant increase from 2007), and 74 percent in Portland. The
majority of arrestees report that purchases are made directly from a dealer (Table 3.10): 90 percent of
arrestees reporting heroin purchases in Portland, and 87 percent in Chicago report they are made
directly from a dealer. Heroin is also a more open air market; in all three sites over half of arrestees
reporting heroin purchases also say the last purchase was made outdoors (Table 3.11).
Availability of heroin as measured by failed buys differs across the 10 sites. While only 3 percent of
Minneapolis arrestees report acquiring heroin in the prior 30 days, significantly fewer had difficulty
in buying than in 2007. Heroin also appears relatively more available in two of the three ADAM II
sites with the greatest prevalence of heroin use (Chicago and Portland). Less than a quarter of
arrestees who bought heroin in the prior 30 days report a failed drug buy in those sites, compared to
53 percent of heroin buyers in New York. Of those New York heroin buyers who experienced a
failure, 46 percent attribute it to lack of availability of the drug and 9 percent to police activity.
28
While Washington DC shows a decline from 2007 to 2008, this figure is based on very small numbers of
arrestees, and may be less reliable.
32 Drug Use and Drug Market Activity Among Arrestees ADAM II 2008 Annual Report
Methamphetamine
Prevalence of Methamphetamine Use
Methamphetamine remains a largely regional phenomenon. Use is highest in the two Western sites
where in 2008 35 percent of Sacramento arrestees and 15 percent of Portland arrestees tested positive
for methamphetamine, though this represents a continuing decline from 2003 and 2007 (Table 3.3). It
is lowest in some eastern sites (New York, Atlanta and Charlotte) where less than 1 percent of
arrestees tested positive. Less than 4 percent of Indianapolis, Denver and Minneapolis arrestees test
positive in 2008. Washington DC remains an anomaly for its geographic region with 2 percent
testing positive, significantly down from 6 percent in 2007. Figures 3.12a, 3.12b show the trends in
methamphetamine test results for the 10 sites from 2000 to 2008.
Self report of methamphetamine for the prior 12 months and prior 30 days mirrors urinalysis results.
In Portland (19%) and Sacramento (30%) the percentage of arrestees admitting past year use is high;
in New York, Chicago, Atlanta and Charlotte 1 percent or fewer arrestees report any use in the past
year or past 30 days. While admitted use of methamphetamine is still high in Portland, both prior 30
day and prior 3 days use has declined there significantly since 2007 (Table 3.13).

ADAM II 2008 Annual Report Drug Use and Drug Market Activity Among Arrestees 33
Figure 3.12a: Percent Testing Positive for Methamphetamine-East and Midwest
0%
5%
10%
15%
20%
25%
30%
2000 2001 2002 2003 2007 2008
Atlanta Charlotte New York Washington, DC Indianapolis
Figure 3.12b: Percent Testing Positive for Methamphetamine—Midwest and West
0%
5%
10%
15%
20%
25%
30%
35%
40%
45%
50%
2000 2001 2002 2003 2007 2008
Portland Chicago Minneapolis Sacramento Denver

34 Drug Use and Drug Market Activity Among Arrestees ADAM II 2008 Annual Report
Figure 3.13: Percent Self-Reporting Use of Methamphetamine, Past 30 Days
0%
5%
10%
15%
20%
25%
30%
35%
Atlanta* Charlotte Chicago Denver Indianapolis Minneapolis New York Portland*** Sacramento Washington,
DC
2007 2008
Significant at the .10 level (*), .05 level (**), or .01 levels (***).
The practice of injecting methamphetamine varies considerably across the sites (Table 3.18).
Portland has the highest proportion of arrestees who injected methamphetamine the last time they
used (32%). Other sites have some, but fewer methamphetamine of injectors: Sacramento (11%),
Minneapolis (11%), Indianapolis (14%) and Denver (7%).
Buying and Selling: Methamphetamine Markets
The percentage of arrestees who report that they acquired methamphetamine in the prior 30 days
continues to be low in most sites, with exceptions in Portland and Sacramento (Table 3.6). In
Sacramento, the proportion of arrestees who report acquiring methamphetamine (26%) remains
unchanged from 2007 to 2008. In Portland, however, reported acquisition of methamphetamine is
down significantly in 2008, from 23 percent in 2007 to 13 percent in 2008, also paralleling the
statistically significant decline in the percentage of arrestees testing positive in 2008. While the
overall percentage of arrestees reporting any methamphetamine market activity in Atlanta is small,
there are modest, but significant changes—down from 1 percent to 0.1 percent. No arrestees in
Chicago, New York and Washington DC admit acquiring methamphetamine in 2008.
In the two sites with the most active methamphetamine markets (Portland and Sacramento), there is
an almost equal likelihood of having either cash or noncash transactions in the prior 30 days for those
obtaining methamphetamine, though there is a significant reduction (to 60%) in cash buys in
Sacramento from 2007 to 2008 (Table 3.7 and 3.8). Sacramento also shows a significant increase

ADAM II 2008 Annual Report Drug Use and Drug Market Activity Among Arrestees 35
from 2007 (12%) to 2008 (26%) in the percentage of arrestees reporting that the last drug buy was
made outdoors or in a public setting (Table 3.11).
In 3 of the sites reporting methamphetamine market activity over 75 percent of arrestees report that
purchases are made directly from a dealer (Table 3.10). The exception is Minneapolis, but still
somewhat over half of arrestees report that purchases there are made directly from a dealer. More
than half of arrestees who report acquiring methamphetamine did so with cash in the past 30 days
across sites (Table 3.7), but in most sites the market is not as cash driven as found with crack cocaine
or heroin. In sites with some methamphetamine activity, the average number of purchase days
reported is more comparable to marijuana or powder cocaine, ranging from 4 days of the last 30 in
Atlanta to 14 in Indianapolis (Table 3.12).
In Portland, a site with significant declines in both methamphetamine use and acquisition, there are
few significant changes in other market characteristics. Cash versus non-cash buys remain almost
equally common, as does the source (regular versus new or occasional) of the drug. Among those
who report obtaining methamphetamine in the past 30 days, the proportion who made at least one
cash buy in the past 30 days is not statistically different from 2007 (71%) to 2008 (77%). Non-cash
transactions also remain flat at 61 percent compared to 66 percent in 2007. Somewhat fewer arrestees
bought it from a regular source in 2008 (46%) than in 2007 (56%), but this is not a significant decline.
The Portland market also remains primarily an indoor or non-public market. Only 16 percent of sales
are made outdoors, unchanged since 2007. Overall the market characteristics in Portland suggest that
while fewer arrestees obtained methamphetamine, the market that remains is relatively unchanged.
Both Portland (47%) and Sacramento (43%) remain unchanged from 2007 in the percentage of
methamphetamine users who report that they tried to buy the drug and failed in the prior 30 days.
The drug may be somewhat less available in Minneapolis in 2008 where 79 percent of those who
bought in the prior 30 days had a failed buy (Table 3.13), though the number of arrestees who
reported acquiring methamphetamine in Minneapolis remains small (Table 3.13).
Other Drugs
Arrestees also are asked in the interview about their use of a list of other drugs in the prior 3 days,
both when prescribed for them and when not legally prescribed. These include 11 categories of
substances like synthetic painkillers, sedatives/tranquilizers, barbiturates, MDMA, LSD and other
hallucinogens, aerosols, methadone, PCP and antidepressants.
All arrestees are tested for the panel of drugs listed earlier in Exhibit 1.1. They are also read a list of
drugs and asked to self-report use in the prior three days. Some of these drugs are those for which the
arrestee may have a legal prescription (anti-depressants, sedatives, barbiturates, Darvon), while others
are illegal substances (PCP, Ecstasy, LSD, other hallucinogens). In looking at test results we are not
able to distinguish legitimate use from illegal use or abuse for prescribed drugs except where the
arrestee has admitted illicit use in the series of self-report questions. In the section below we discuss
the test results for the illegal substances and for two of the substances available by prescription
(methadone and oxycodone) but with high street value as drugs of abuse.
Table 3.21 indicates the test results for six additional drugs (beyond those already discussed) included
in ADAM II urinalyses. PCP (phencyclidine) is detected among arrestees in 4 of the 10 sites, but is
rare. Only in Chicago is PCP detected in more than 1 percent of arrestees. Table 3.22 indicates the

36 Drug Use and Drug Market Activity Among Arrestees ADAM II 2008 Annual Report
self-report data for these drugs for the same sites. As this indicates, only in Washington DC,
Sacramento and New York did arrestees admit PCP use.
Test results for methadone are 1 percent or less in 7 of the 10 sites, but 7 percent in New York. In
that New York State is traditionally one of the largest providers of methadone services in the country,
the fact that many more arrestees in this site test positive is not surprising. In this case we are able to
separate those arrestees who are in methadone treatment and hence have a legitimate reason for the
substance in their systems from those who are not. It is interesting to note that while 7 percent of
arrestees test positive in New York for methadone, only 6 percent admit to its use.
Methadone use, either licit or illicit, is uncommon in all sites with the exception of New York City.
Understanding the true level of methadone abuse versus legitimate use is a challenge; methadone’s
primary licit use is as a maintenance treatment for opiate (heroin) addicts, though it can also be used
illicitly and (more rarely) prescribed as a painkiller. While only about 3 percent of arrestees test
positive for the drug in Chicago (the site with disproportionately high heroin use), 7 percent of
arrestees in New York test positive for methadone use; 6 percent admit to using it in the past 3 days.
Of those who test positive for methadone in New York, approximately two-thirds (67%) also report
receiving recent drug treatment. This indicates that about one-third of those who test positive for
methadone may be using it illegally in New York, but that the majority is likely accessing methadone
through drug treatment.
Self reported use adds information on the use of drugs for which ADAM is not specifically testing
(LSD, Ecstasy, other hallucinogens). As Table 3.22 indicates the drug Ecstasy (MDMA) is reported
as having been used within the last three days by 3 percent of arrestees in Atlanta and Charlotte, 2
percent in Minneapolis, New York and Sacramento and 1 percent or less in all other sites except
Washington DC. On the other hand, self reported use of opiate painkillers (including Dialudid,
Oxycodone, Vicodin, Percocet) is the most common across all of the other drug categories. From 8 to
11 percent of arrestees report use of one of these drugs in the past three days in half of the sites; in the
other sites prevalence ranges from less than 3 percent to 7 percent.
Summary and Conclusions
As the ADAM II project concludes its second year of data collection, it continues to serve as a
valuable source of data on a population often missed or undercounted in other surveys on drug use.
Since its inception in 2000, the ADAM program has provided information on the often extensive drug
use among persons entering the criminal justice system through interviews and drug testing of males
within 48 hours of their arrest. ADAM II collects data from a probability-based sample of
approximately 500 cases each year in 10 U.S. counties. In 2008 over 4500 interviews and 3900 test
samples were collected and weighted to represent over 36,000 arrests.
Information is collected on a wide range of topics in the 20-25 minute interviews conducted in
ADAM II jails: demographic characteristics, housing and immigration status, health care insurance,
drug use history, current drug and alcohol use, drug treatment history and current utilization, mental
health treatment history and current utilization, and participation in drug market activity. In addition,
a urine sample is taken and tested to match self-report answers to questions about ten categories of
drugs. All interviews and drug testing are voluntary, anonymous and confidential. Response rates for
2008 across all sites are 82 percent for consent to the interview for those persons physically available

ADAM II 2008 Annual Report Drug Use and Drug Market Activity Among Arrestees 37
(not transferred out or in court at the time of the interview) and 86 percent for providing a test sample
among those interviewed.
Urine test results provide an important mechanism to address the often-debated issue of the validity of
self-report data on drug use. Among all arrestees, both those who use drug and those who don’t,
congruence is high—over 80 percent for marijuana and cocaine and 90 percent for heroin and
methamphetamine. Not surprisingly, truth telling among those who are actually using (as verified by
a positive urine test) is lower and varies by drug. Cocaine (45% match) and heroin (48% match)
users are less likely to admit use than methamphetamine (55% match) and marijuana (82% match)
users, underscoring the value of test confirmation for self report data.
Illegal drugs are widely used among the arrestee population. Two thirds of all arrestees tested
positive for at least one substance in their system at the time of arrest and 15 percent or more in all
sites test positive for more than one substance. The most common substances in all but three sites are
marijuana, cocaine, opiates and methamphetamine. In Sacramento and Portland, methamphetamine
replaces cocaine in this ordering and in Atlanta cocaine is the most commonly detected.
Marijuana is the commonly used and acquired (purchased, shared or traded) and has remained
statistically unchanged across the ADAM II sites since 2007 with over 40 percent of arrestees testing
positive in all but two sites and ranging from 31 percent in Washington DC to 51 percent in Charlotte.
Cocaine is also commonly detected in either crack or powder form, ranging from 17 percent cocaine
positive in Sacramento to 44 percent positive in Chicago. The proportion of cocaine positives has
been stable or declining in all ADAM II sites. From 2007 to 2008 there are statistically significant
declines in cocaine positives in Indianapolis and Washington DC. Significant declines had occurred
from 2003 to 2007 in Chicago and Portland and remained at the lowered level into 2008. Since drug
testing cannot distinguish between the form of cocaine self report data on recent use (3 days, 7 days,
30 days) helps identify which form of the drug is most common. Self-report data indicate that the
majority of positive cocaine tests are the result of crack use rather than cocaine in powder form.
Heroin is found less often in many ADAM II sites than cocaine or marijuana with the exception of
Chicago where 29 percent of arrestees test positive in 2008, a statistically significant increase from
2007. Washington DC (12%), Portland (8%), New York (7%) and Minneapolis (6%) have the next
highest proportions of arrestees testing positive for opiates; from 1 to 5 percent of arrestees in the
other sites test positive.
Methamphetamine remains largely a regional phenomenon in this population and declines
significantly in one of the ADAM II western sites (Portland) from 2007 (20% positive) to 2008 (15%
positive). Thirty five percent of Sacramento arrestees test positive in 2008, representing no
statistically significant change from 2007.
As this report indicates, drug use and drug market activity can be misleading if using only national
level estimates and relying on more general population samples. Local availability, marketing and
demand for drugs can make results from even urban areas that are geographically close dramatically
different. For both law enforcement and treatment planning on both the local and national level, local
or regional information is essential.
38 Drug Use and Drug Market Activity Among Arrestees ADAM II 2008 Annual Report
The ADAM II data also point to a different population of users than captured in general population
surveys—those with more experience both with illegal drugs and with a range of offenses that put
them in frequent contact with the criminal justice system. These are users consuming and buying
drugs at frequencies often many multiple times population estimates. This makes data on what are
likely the heaviest consumers of illegal drugs a critical complement to general population data for
accurately estimating the Nation’s demand for these drugs and the resources needed to address the
problems they create.
Finally ADAM II is uniquely useful in that it provides a validated marker of self reported drug use.
Approximately half of the heroin, cocaine and methamphetamine users and 18 percent of marijuana
users deny use in a survey in which they know a test sample will be taken and there is no identifying
information linking them to the test. Only through using these test results in conjunction with other
data can we have confidence in our estimates.
ADAM II will begin its third year of collection in the 10 sites described here. Protocols and
procedures will remain the same and data will be available for comparison in early 2010.
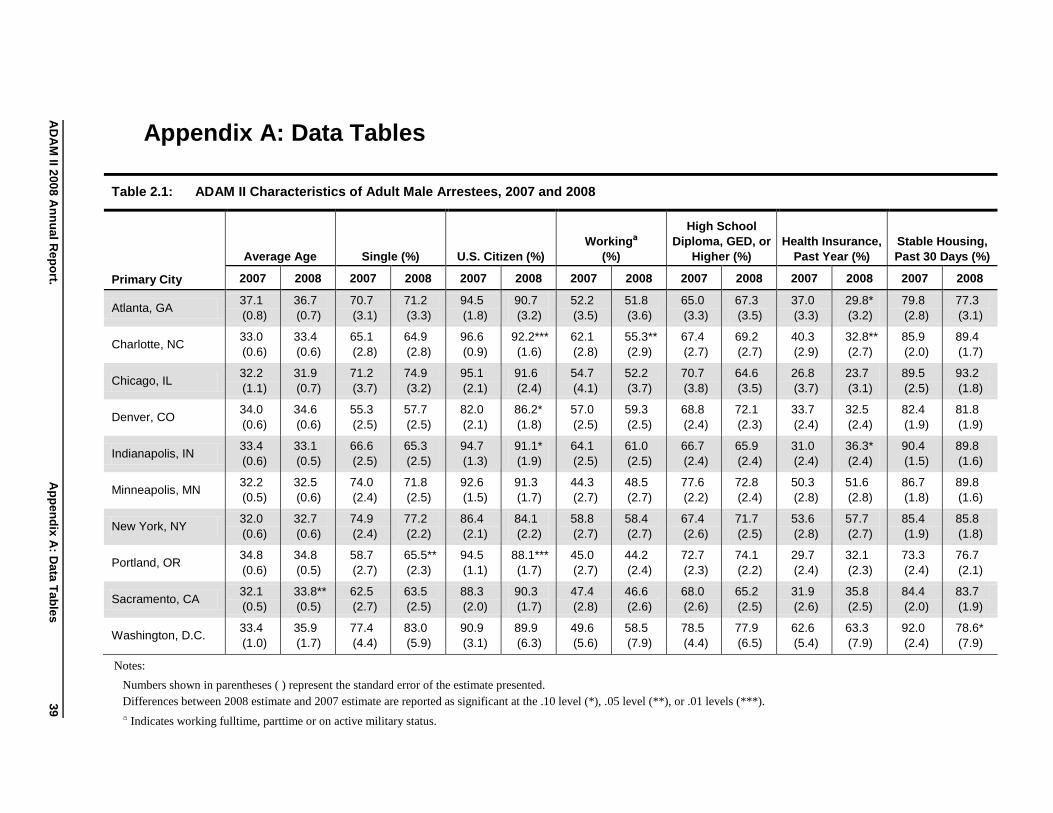
AD
AM
II 200
8 A
nn
ua
l Rep
ort.
Ap
pe
nd
ix A
: Da
ta T
ab
les
3
9
Appendix A: Data Tables
Table 2.1: ADAM II Characteristics of Adult Male Arrestees, 2007 and 2008
Average Age Single (%) U.S. Citizen (%)
Workinga
(%)
High School
Diploma, GED, or
Higher (%)
Health Insurance,
Past Year (%)
Stable Housing,
Past 30 Days (%)
Primary City 2007 2008 2007 2008 2007 2008 2007 2008 2007 2008 2007 2008 2007 2008
Atlanta, GA 37.1
(0.8)
36.7
(0.7)
70.7
(3.1)
71.2
(3.3)
94.5
(1.8)
90.7
(3.2)
52.2
(3.5)
51.8
(3.6)
65.0
(3.3)
67.3
(3.5)
37.0
(3.3)
29.8*
(3.2)
79.8
(2.8)
77.3
(3.1)
Charlotte, NC 33.0
(0.6)
33.4
(0.6)
65.1
(2.8)
64.9
(2.8)
96.6
(0.9)
92.2***
(1.6)
62.1
(2.8)
55.3**
(2.9)
67.4
(2.7)
69.2
(2.7)
40.3
(2.9)
32.8**
(2.7)
85.9
(2.0)
89.4
(1.7)
Chicago, IL 32.2
(1.1)
31.9
(0.7)
71.2
(3.7)
74.9
(3.2)
95.1
(2.1)
91.6
(2.4)
54.7
(4.1)
52.2
(3.7)
70.7
(3.8)
64.6
(3.5)
26.8
(3.7)
23.7
(3.1)
89.5
(2.5)
93.2
(1.8)
Denver, CO 34.0
(0.6)
34.6
(0.6)
55.3
(2.5)
57.7
(2.5)
82.0
(2.1)
86.2*
(1.8)
57.0
(2.5)
59.3
(2.5)
68.8
(2.4)
72.1
(2.3)
33.7
(2.4)
32.5
(2.4)
82.4
(1.9)
81.8
(1.9)
Indianapolis, IN 33.4
(0.6)
33.1
(0.5)
66.6
(2.5)
65.3
(2.5)
94.7
(1.3)
91.1*
(1.9)
64.1
(2.5)
61.0
(2.5)
66.7
(2.4)
65.9
(2.4)
31.0
(2.4)
36.3*
(2.4)
90.4
(1.5)
89.8
(1.6)
Minneapolis, MN 32.2
(0.5)
32.5
(0.6)
74.0
(2.4)
71.8
(2.5)
92.6
(1.5)
91.3
(1.7)
44.3
(2.7)
48.5
(2.7)
77.6
(2.2)
72.8
(2.4)
50.3
(2.8)
51.6
(2.8)
86.7
(1.8)
89.8
(1.6)
New York, NY 32.0
(0.6)
32.7
(0.6)
74.9
(2.4)
77.2
(2.2)
86.4
(2.1)
84.1
(2.2)
58.8
(2.7)
58.4
(2.7)
67.4
(2.6)
71.7
(2.5)
53.6
(2.8)
57.7
(2.7)
85.4
(1.9)
85.8
(1.8)
Portland, OR 34.8
(0.6)
34.8
(0.5)
58.7
(2.7)
65.5**
(2.3)
94.5
(1.1)
88.1***
(1.7)
45.0
(2.7)
44.2
(2.4)
72.7
(2.3)
74.1
(2.2)
29.7
(2.4)
32.1
(2.3)
73.3
(2.4)
76.7
(2.1)
Sacramento, CA 32.1
(0.5)
33.8**
(0.5)
62.5
(2.7)
63.5
(2.5)
88.3
(2.0)
90.3
(1.7)
47.4
(2.8)
46.6
(2.6)
68.0
(2.6)
65.2
(2.5)
31.9
(2.6)
35.8
(2.5)
84.4
(2.0)
83.7
(1.9)
Washington, D.C. 33.4
(1.0)
35.9
(1.7)
77.4
(4.4)
83.0
(5.9)
90.9
(3.1)
89.9
(6.3)
49.6
(5.6)
58.5
(7.9)
78.5
(4.4)
77.9
(6.5)
62.6
(5.4)
63.3
(7.9)
92.0
(2.4)
78.6*
(7.9)
Notes:
Numbers shown in parentheses ( ) represent the standard error of the estimate presented.
Differences between 2008 estimate and 2007 estimate are reported as significant at the .10 level (*), .05 level (**), or .01 levels (***).
a Indicates working fulltime, parttime or on active military status.
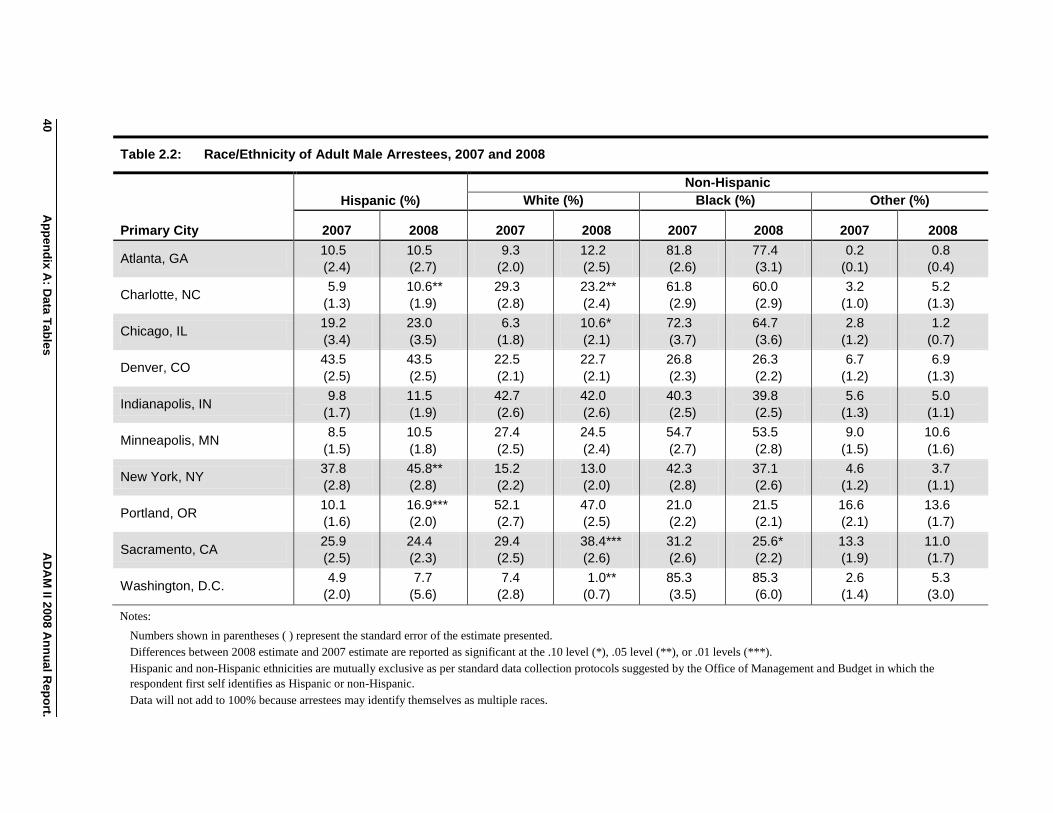
40
Ap
pe
nd
ix A
: Da
ta T
ab
les
A
DA
M II 2
00
8 A
nn
ua
l Rep
ort.
Table 2.2: Race/Ethnicity of Adult Male Arrestees, 2007 and 2008
Non-Hispanic
Primary City
Hispanic (%) White (%) Black (%) Other (%)
2007 2008 2007 2008 2007 2008 2007 2008
Atlanta, GA 10.5
(2.4)
10.5
(2.7)
9.3
(2.0)
12.2
(2.5)
81.8
(2.6)
77.4
(3.1)
0.2
(0.1)
0.8
(0.4)
Charlotte, NC 5.9
(1.3)
10.6**
(1.9)
29.3
(2.8)
23.2**
(2.4)
61.8
(2.9)
60.0
(2.9)
3.2
(1.0)
5.2
(1.3)
Chicago, IL 19.2
(3.4)
23.0
(3.5)
6.3
(1.8)
10.6*
(2.1)
72.3
(3.7)
64.7
(3.6)
2.8
(1.2)
1.2
(0.7)
Denver, CO 43.5
(2.5)
43.5
(2.5)
22.5
(2.1)
22.7
(2.1)
26.8
(2.3)
26.3
(2.2)
6.7
(1.2)
6.9
(1.3)
Indianapolis, IN 9.8
(1.7)
11.5
(1.9)
42.7
(2.6)
42.0
(2.6)
40.3
(2.5)
39.8
(2.5)
5.6
(1.3)
5.0
(1.1)
Minneapolis, MN 8.5
(1.5)
10.5
(1.8)
27.4
(2.5)
24.5
(2.4)
54.7
(2.7)
53.5
(2.8)
9.0
(1.5)
10.6
(1.6)
New York, NY 37.8
(2.8)
45.8**
(2.8)
15.2
(2.2)
13.0
(2.0)
42.3
(2.8)
37.1
(2.6)
4.6
(1.2)
3.7
(1.1)
Portland, OR 10.1
(1.6)
16.9***
(2.0)
52.1
(2.7)
47.0
(2.5)
21.0
(2.2)
21.5
(2.1)
16.6
(2.1)
13.6
(1.7)
Sacramento, CA 25.9
(2.5)
24.4
(2.3)
29.4
(2.5)
38.4***
(2.6)
31.2
(2.6)
25.6*
(2.2)
13.3
(1.9)
11.0
(1.7)
Washington, D.C. 4.9
(2.0)
7.7
(5.6)
7.4
(2.8)
1.0**
(0.7)
85.3
(3.5)
85.3
(6.0)
2.6
(1.4)
5.3
(3.0)
Notes:
Numbers shown in parentheses ( ) represent the standard error of the estimate presented.
Differences between 2008 estimate and 2007 estimate are reported as significant at the .10 level (*), .05 level (**), or .01 levels (***).
Hispanic and non-Hispanic ethnicities are mutually exclusive as per standard data collection protocols suggested by the Office of Management and Budget in which the
respondent first self identifies as Hispanic or non-Hispanic.
Data will not add to 100% because arrestees may identify themselves as multiple races.
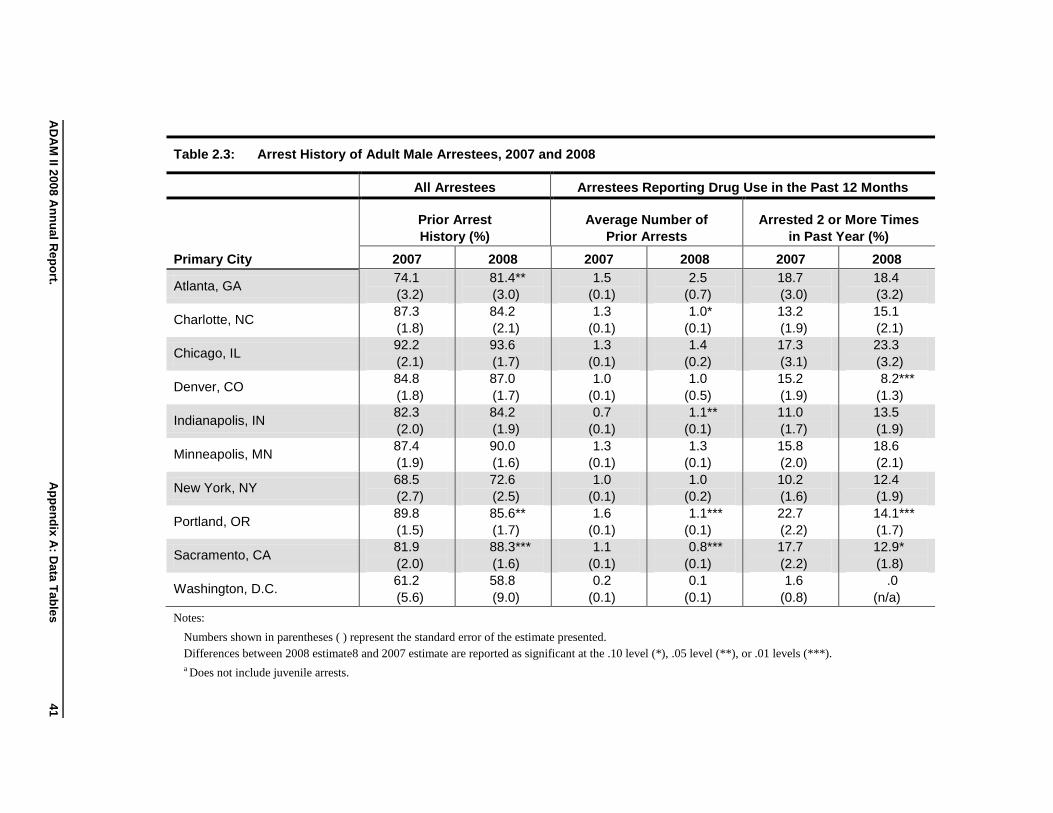
AD
AM
II 200
8 A
nn
ua
l Rep
ort.
Ap
pe
nd
ix A
: Da
ta T
ab
les
4
1
Table 2.3: Arrest History of Adult Male Arrestees, 2007 and 2008
All Arrestees Arrestees Reporting Drug Use in the Past 12 Months
Primary City
Prior Arrest
History (%)
Average Number of
Prior Arrests
Arrested 2 or More Times
in Past Year (%)
2007 2008 2007 2008 2007 2008
Atlanta, GA 74.1
(3.2)
81.4**
(3.0)
1.5
(0.1)
2.5
(0.7)
18.7
(3.0)
18.4
(3.2)
Charlotte, NC 87.3
(1.8)
84.2
(2.1)
1.3
(0.1)
1.0*
(0.1)
13.2
(1.9)
15.1
(2.1)
Chicago, IL 92.2
(2.1)
93.6
(1.7)
1.3
(0.1)
1.4
(0.2)
17.3
(3.1)
23.3
(3.2)
Denver, CO 84.8
(1.8)
87.0
(1.7)
1.0
(0.1)
1.0
(0.5)
15.2
(1.9)
8.2***
(1.3)
Indianapolis, IN 82.3
(2.0)
84.2
(1.9)
0.7
(0.1)
1.1**
(0.1)
11.0
(1.7)
13.5
(1.9)
Minneapolis, MN 87.4
(1.9)
90.0
(1.6)
1.3
(0.1)
1.3
(0.1)
15.8
(2.0)
18.6
(2.1)
New York, NY 68.5
(2.7)
72.6
(2.5)
1.0
(0.1)
1.0
(0.2)
10.2
(1.6)
12.4
(1.9)
Portland, OR 89.8
(1.5)
85.6**
(1.7)
1.6
(0.1)
1.1***
(0.1)
22.7
(2.2)
14.1***
(1.7)
Sacramento, CA 81.9
(2.0)
88.3***
(1.6)
1.1
(0.1)
0.8***
(0.1)
17.7
(2.2)
12.9*
(1.8)
Washington, D.C. 61.2
(5.6)
58.8
(9.0)
0.2
(0.1)
0.1
(0.1)
1.6
(0.8)
.0
(n/a)
Notes:
Numbers shown in parentheses ( ) represent the standard error of the estimate presented.
Differences between 2008 estimate8 and 2007 estimate are reported as significant at the .10 level (*), .05 level (**), or .01 levels (***).
a Does not include juvenile arrests.
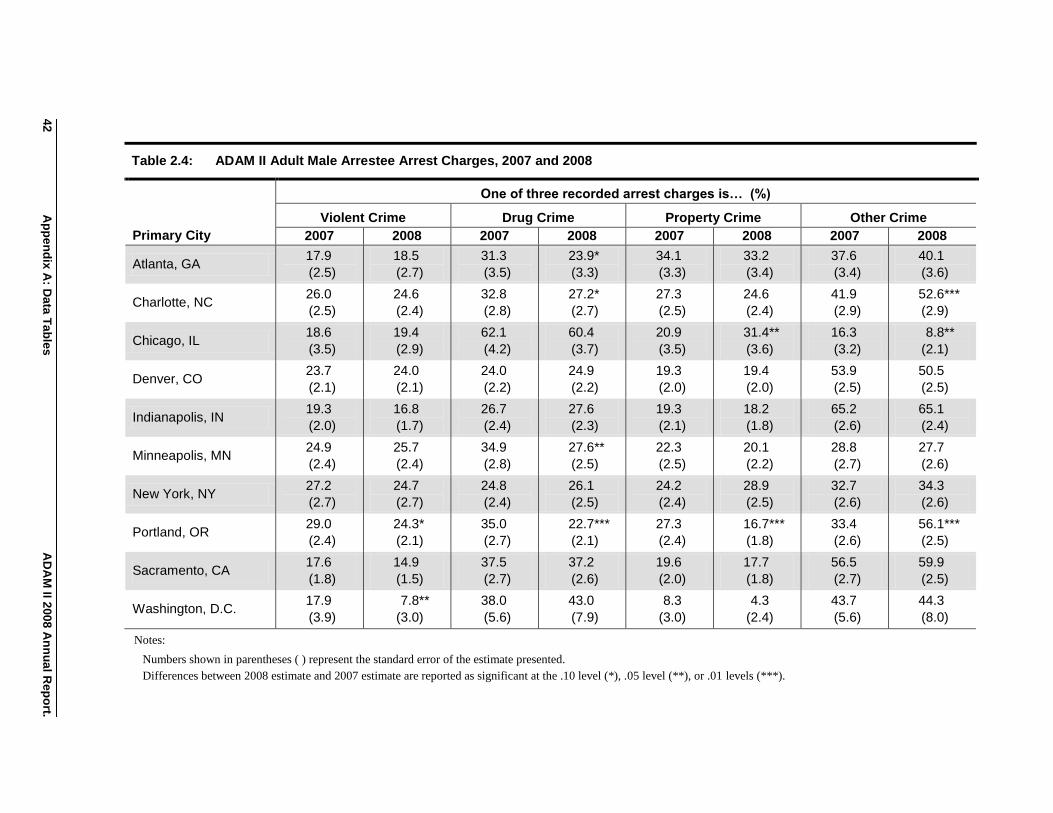
42
Ap
pe
nd
ix A
: Da
ta T
ab
les
A
DA
M II 2
00
8 A
nn
ua
l Rep
ort.
Table 2.4: ADAM II Adult Male Arrestee Arrest Charges, 2007 and 2008
One of three recorded arrest charges is… (%)
Violent Crime Drug Crime Property Crime Other Crime
Primary City 2007 2008 2007 2008 2007 2008 2007 2008
Atlanta, GA 17.9
(2.5)
18.5
(2.7)
31.3
(3.5)
23.9*
(3.3)
34.1
(3.3)
33.2
(3.4)
37.6
(3.4)
40.1
(3.6)
Charlotte, NC 26.0
(2.5)
24.6
(2.4)
32.8
(2.8)
27.2*
(2.7)
27.3
(2.5)
24.6
(2.4)
41.9
(2.9)
52.6***
(2.9)
Chicago, IL 18.6
(3.5)
19.4
(2.9)
62.1
(4.2)
60.4
(3.7)
20.9
(3.5)
31.4**
(3.6)
16.3
(3.2)
8.8**
(2.1)
Denver, CO 23.7
(2.1)
24.0
(2.1)
24.0
(2.2)
24.9
(2.2)
19.3
(2.0)
19.4
(2.0)
53.9
(2.5)
50.5
(2.5)
Indianapolis, IN 19.3
(2.0)
16.8
(1.7)
26.7
(2.4)
27.6
(2.3)
19.3
(2.1)
18.2
(1.8)
65.2
(2.6)
65.1
(2.4)
Minneapolis, MN 24.9
(2.4)
25.7
(2.4)
34.9
(2.8)
27.6**
(2.5)
22.3
(2.5)
20.1
(2.2)
28.8
(2.7)
27.7
(2.6)
New York, NY 27.2
(2.7)
24.7
(2.7)
24.8
(2.4)
26.1
(2.5)
24.2
(2.4)
28.9
(2.5)
32.7
(2.6)
34.3
(2.6)
Portland, OR 29.0
(2.4)
24.3*
(2.1)
35.0
(2.7)
22.7***
(2.1)
27.3
(2.4)
16.7***
(1.8)
33.4
(2.6)
56.1***
(2.5)
Sacramento, CA 17.6
(1.8)
14.9
(1.5)
37.5
(2.7)
37.2
(2.6)
19.6
(2.0)
17.7
(1.8)
56.5
(2.7)
59.9
(2.5)
Washington, D.C. 17.9
(3.9)
7.8**
(3.0)
38.0
(5.6)
43.0
(7.9)
8.3
(3.0)
4.3
(2.4)
43.7
(5.6)
44.3
(8.0)
Notes:
Numbers shown in parentheses ( ) represent the standard error of the estimate presented.
Differences between 2008 estimate and 2007 estimate are reported as significant at the .10 level (*), .05 level (**), or .01 levels (***).
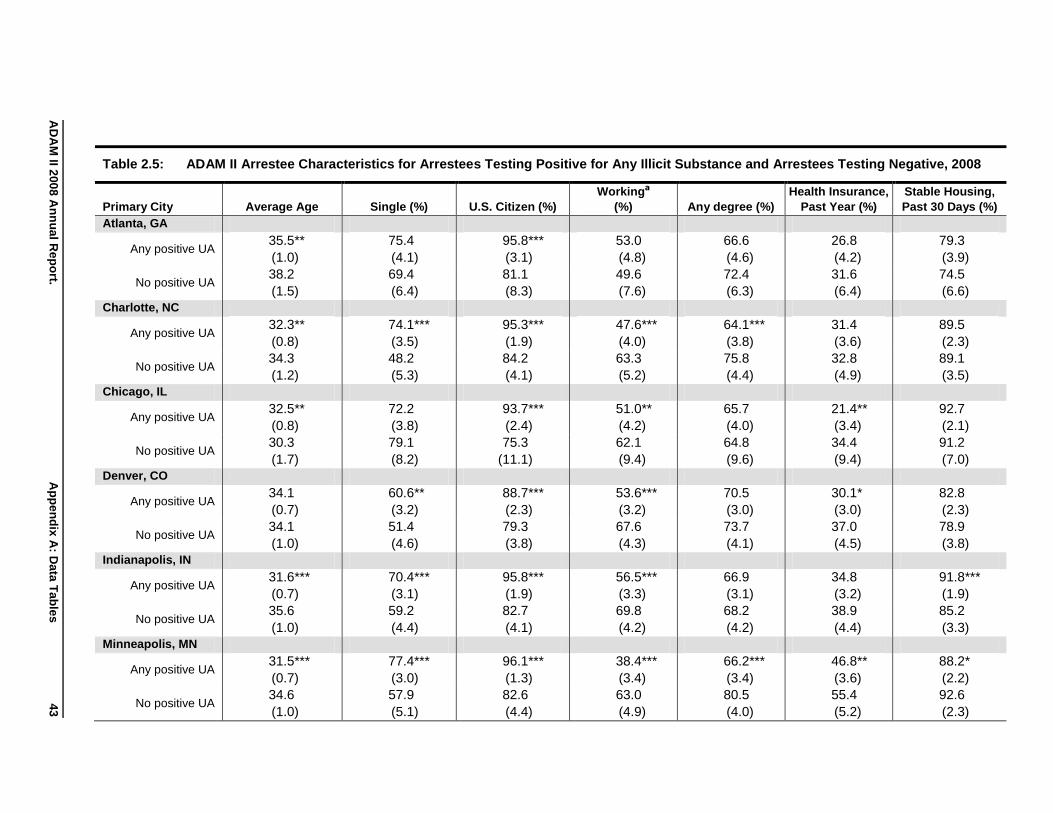
AD
AM
II 200
8 A
nn
ua
l Rep
ort.
Ap
pe
nd
ix A
: Da
ta T
ab
les
4
3
Table 2.5: ADAM II Arrestee Characteristics for Arrestees Testing Positive for Any Illicit Substance and Arrestees Testing Negative, 2008
Primary City Average Age Single (%) U.S. Citizen (%)
Workinga
(%) Any degree (%)
Health Insurance,
Past Year (%)
Stable Housing,
Past 30 Days (%)
Atlanta, GA
Any positive UA 35.5**
(1.0)
75.4
(4.1)
95.8***
(3.1)
53.0
(4.8)
66.6
(4.6)
26.8
(4.2)
79.3
(3.9)
No positive UA 38.2
(1.5)
69.4
(6.4)
81.1
(8.3)
49.6
(7.6)
72.4
(6.3)
31.6
(6.4)
74.5
(6.6)
Charlotte, NC
Any positive UA 32.3**
(0.8)
74.1***
(3.5)
95.3***
(1.9)
47.6***
(4.0)
64.1***
(3.8)
31.4
(3.6)
89.5
(2.3)
No positive UA 34.3
(1.2)
48.2
(5.3)
84.2
(4.1)
63.3
(5.2)
75.8
(4.4)
32.8
(4.9)
89.1
(3.5)
Chicago, IL
Any positive UA 32.5**
(0.8)
72.2
(3.8)
93.7***
(2.4)
51.0**
(4.2)
65.7
(4.0)
21.4**
(3.4)
92.7
(2.1)
No positive UA 30.3
(1.7)
79.1
(8.2)
75.3
(11.1)
62.1
(9.4)
64.8
(9.6)
34.4
(9.4)
91.2
(7.0)
Denver, CO
Any positive UA 34.1
(0.7)
60.6**
(3.2)
88.7***
(2.3)
53.6***
(3.2)
70.5
(3.0)
30.1*
(3.0)
82.8
(2.3)
No positive UA 34.1
(1.0)
51.4
(4.6)
79.3
(3.8)
67.6
(4.3)
73.7
(4.1)
37.0
(4.5)
78.9
(3.8)
Indianapolis, IN
Any positive UA 31.6***
(0.7)
70.4***
(3.1)
95.8***
(1.9)
56.5***
(3.3)
66.9
(3.1)
34.8
(3.2)
91.8***
(1.9)
No positive UA 35.6
(1.0)
59.2
(4.4)
82.7
(4.1)
69.8
(4.2)
68.2
(4.2)
38.9
(4.4)
85.2
(3.3)
Minneapolis, MN
Any positive UA 31.5***
(0.7)
77.4***
(3.0)
96.1***
(1.3)
38.4***
(3.4)
66.2***
(3.4)
46.8**
(3.6)
88.2*
(2.2)
No positive UA 34.6
(1.0)
57.9
(5.1)
82.6
(4.4)
63.0
(4.9)
80.5
(4.0)
55.4
(5.2)
92.6
(2.3)
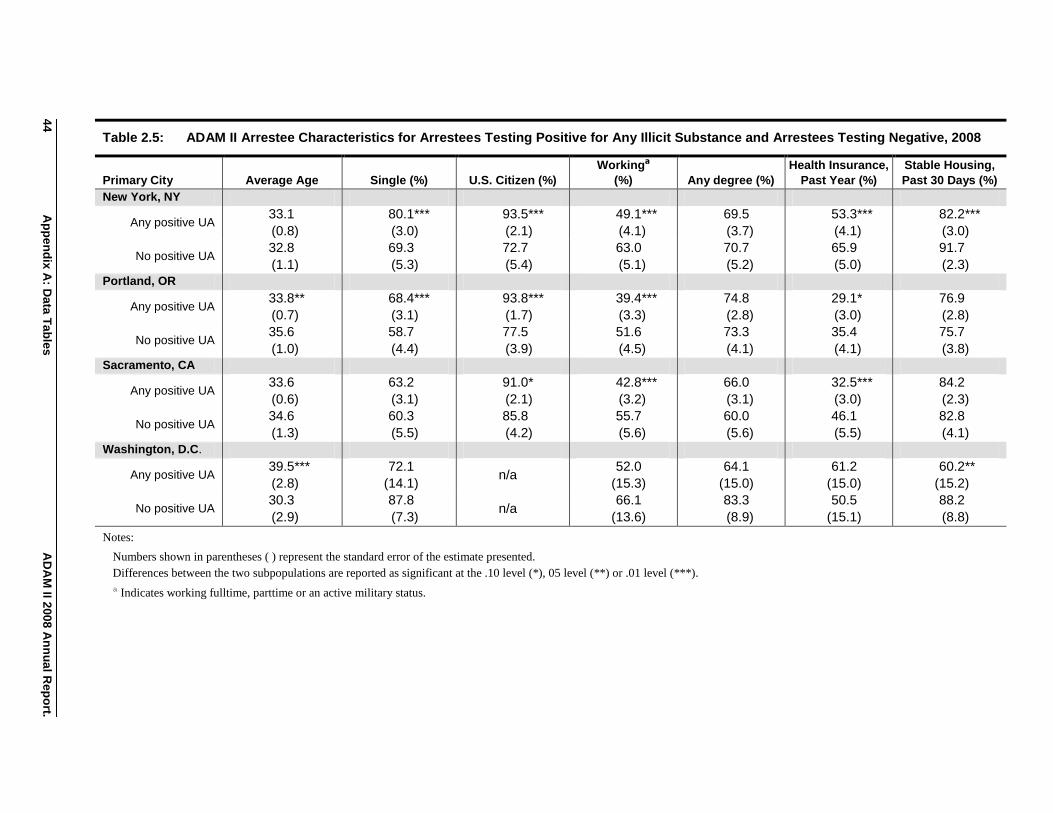
44
Ap
pe
nd
ix A
: Da
ta T
ab
les
A
DA
M II 2
00
8 A
nn
ua
l Rep
ort.
Table 2.5: ADAM II Arrestee Characteristics for Arrestees Testing Positive for Any Illicit Substance and Arrestees Testing Negative, 2008
Primary City Average Age Single (%) U.S. Citizen (%)
Workinga
(%) Any degree (%)
Health Insurance,
Past Year (%)
Stable Housing,
Past 30 Days (%)
New York, NY
Any positive UA 33.1
(0.8)
80.1***
(3.0)
93.5***
(2.1)
49.1***
(4.1)
69.5
(3.7)
53.3***
(4.1)
82.2***
(3.0)
No positive UA 32.8
(1.1)
69.3
(5.3)
72.7
(5.4)
63.0
(5.1)
70.7
(5.2)
65.9
(5.0)
91.7
(2.3)
Portland, OR
Any positive UA 33.8**
(0.7)
68.4***
(3.1)
93.8***
(1.7)
39.4***
(3.3)
74.8
(2.8)
29.1*
(3.0)
76.9
(2.8)
No positive UA 35.6
(1.0)
58.7
(4.4)
77.5
(3.9)
51.6
(4.5)
73.3
(4.1)
35.4
(4.1)
75.7
(3.8)
Sacramento, CA
Any positive UA 33.6
(0.6)
63.2
(3.1)
91.0*
(2.1)
42.8***
(3.2)
66.0
(3.1)
32.5***
(3.0)
84.2
(2.3)
No positive UA 34.6
(1.3)
60.3
(5.5)
85.8
(4.2)
55.7
(5.6)
60.0
(5.6)
46.1
(5.5)
82.8
(4.1)
Washington, D.C.
Any positive UA 39.5***
(2.8)
72.1
(14.1) n/a
52.0
(15.3)
64.1
(15.0)
61.2
(15.0)
60.2**
(15.2)
No positive UA 30.3
(2.9)
87.8
(7.3) n/a
66.1
(13.6)
83.3
(8.9)
50.5
(15.1)
88.2
(8.8)
Notes:
Numbers shown in parentheses ( ) represent the standard error of the estimate presented.
Differences between the two subpopulations are reported as significant at the .10 level (*), 05 level (**) or .01 level (***).
a Indicates working fulltime, parttime or an active military status.
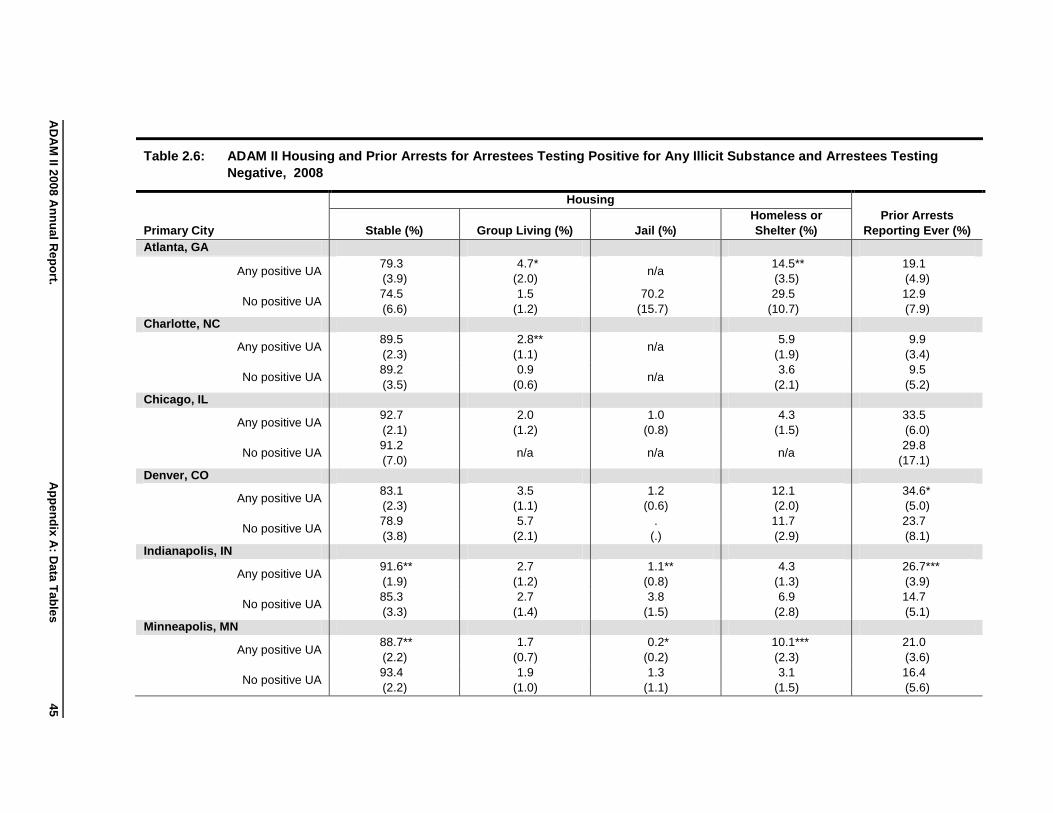
AD
AM
II 200
8 A
nn
ua
l Rep
ort.
Ap
pe
nd
ix A
: Da
ta T
ab
les
4
5
Table 2.6: ADAM II Housing and Prior Arrests for Arrestees Testing Positive for Any Illicit Substance and Arrestees Testing
Negative, 2008
Housing
Primary City Stable (%) Group Living (%) Jail (%)
Homeless or
Shelter (%)
Prior Arrests
Reporting Ever (%)
Atlanta, GA
Any positive UA 79.3
(3.9)
4.7*
(2.0) n/a
14.5**
(3.5)
19.1
(4.9)
No positive UA 74.5
(6.6)
1.5
(1.2)
70.2
(15.7)
29.5
(10.7)
12.9
(7.9)
Charlotte, NC
Any positive UA 89.5
(2.3)
2.8**
(1.1) n/a
5.9
(1.9)
9.9
(3.4)
No positive UA 89.2
(3.5)
0.9
(0.6) n/a
3.6
(2.1)
9.5
(5.2)
Chicago, IL
Any positive UA 92.7
(2.1)
2.0
(1.2)
1.0
(0.8)
4.3
(1.5)
33.5
(6.0)
No positive UA 91.2
(7.0) n/a n/a n/a
29.8
(17.1)
Denver, CO
Any positive UA 83.1
(2.3)
3.5
(1.1)
1.2
(0.6)
12.1
(2.0)
34.6*
(5.0)
No positive UA 78.9
(3.8)
5.7
(2.1)
.
(.)
11.7
(2.9)
23.7
(8.1)
Indianapolis, IN
Any positive UA 91.6**
(1.9)
2.7
(1.2)
1.1**
(0.8)
4.3
(1.3)
26.7***
(3.9)
No positive UA 85.3
(3.3)
2.7
(1.4)
3.8
(1.5)
6.9
(2.8)
14.7
(5.1)
Minneapolis, MN
Any positive UA 88.7**
(2.2)
1.7
(0.7)
0.2*
(0.2)
10.1***
(2.3)
21.0
(3.6)
No positive UA 93.4
(2.2)
1.9
(1.0)
1.3
(1.1)
3.1
(1.5)
16.4
(5.6)

46
Ap
pe
nd
ix A
: Da
ta T
ab
les
A
DA
M II 2
00
8 A
nn
ua
l Rep
ort.
Table 2.6: ADAM II Housing and Prior Arrests for Arrestees Testing Positive for Any Illicit Substance and Arrestees Testing
Negative, 2008
Housing
Primary City Stable (%) Group Living (%) Jail (%)
Homeless or
Shelter (%)
Prior Arrests
Reporting Ever (%)
New York, NY
Any positive UA 82.8***
(3.0)
1.5
(0.8)
0.2
(0.3)
15.3***
(2.9)
14.0***
(3.3)
No positive UA 91.7
(2.3)
0.8
(0.5) n/a
7.7
(2.4) n/a
Portland, OR
Any positive UA 77.2
(2.8)
5.5
(1.4)
2.7
(1.1)
14.4
(2.3)
35.0***
(4.2)
No positive UA 76.0
(3.8)
8.0
(2.5)
1.2
(0.8)
13.5
(3.0)
17.9
(5.7)
Sacramento, CA
Any positive UA 84.2
(2.3)
3.3
(1.0)
1.7
(0.8)
10.4
(2.0)
39.9***
(4.9)
No positive UA 83.0
(4.1)
2.9
(1.4)
1.3
(1.4)
8.5
(2.8) n/a
Washington, D.C.
Any positive UA 60.2**
(15.2) n/a n/a
40.7
(16.9) n/a
No positive UA 88.2
(8.8) n/a n/a n/a n/a
Notes:
Numbers shown in parentheses ( ) represent the standard error of the estimate presented.
Differences between the two subpopulations are reported as significant at the .10 level (*), .05 level (**) or .01 level (***).

AD
AM
II 200
8 A
nn
ua
l Rep
ort.
Ap
pe
nd
ix A
: Da
ta T
ab
les
4
7
Table 2.7: Lifetime Drug, Alcohol, and Mental Health Treatment Status among All Arrestees, 2007 and 2008
Drug or Alcohol Treatment (%) Inpatient Mental Health/
Psychiatric Treatment (%) Outpatient Inpatient or Residential
Primary City 2007 2008 2007 2008 2007 2008
Atlanta, GA 8.9
(1.8)
10.3
(2.0)
16.4
(2.5)
16.7
(2.5)
13.5
(2.6)
9.1
(2.2)
Charlotte, NC 21.4
(2.4)
19.9
(2.3)
26.9
(2.6)
25.3
(2.5)
10.8
(1.8)
8.9
(1.5)
Chicago, IL 22.7
(3.5)
22.7
(3.1)
24.9
(3.6)
25.2
(3.1)
10.7
(2.4)
10.6
(2.1)
Denver, CO 20.9
(2.1)
21.1
(2.1)
32.2
(2.4)
29.9
(2.3)
13.0
(1.7)
11.2
(1.5)
Indianapolis, IN 23.8
(2.3)
30.0**
(2.4)
15.8
(1.8)
13.6
(1.6)
7.4
(1.4)
9.0
(1.5)
Minneapolis, MN 31.9
(2.6)
34.7
(2.7)
39.1
(2.7)
34.5
(2.7)
14.3
(2.0)
12.6
(1.9)
New York, NY 17.8
(2.0)
23.9**
(2.3)
20.0
(2.1)
21.3
(2.1)
9.7
(1.6)
9.0
(1.6)
Portland, OR 37.4
(2.6)
28.6***
(2.2)
36.5
(2.6)
29.0**
(2.2)
13.0
(1.8)
13.1
(1.7)
Sacramento, CA 13.8
(1.9)
17.7*
(2.0)
21.1
(2.3)
19.5
(2.1)
12.1
(1.8)
10.7
(1.5)
Washington, D.C. 13.9
(3.6)
9.0
(3.6)
22.8
(4.9)
12.9*
(4.2)
8.1
(3.0)
3.1
(1.8)
Notes:
Numbers shown in parentheses ( ) represent the standard error of the estimate presented.
Differences between 2008 estimate and 2007 estimate are reported as significant at the .10 level (*), .05 level (**), or .01 levels (***).

48
Ap
pe
nd
ix A
: Da
ta T
ab
les
A
DA
M II 2
00
8 A
nn
ua
l Rep
ort.
Table 2.8: Drug, Alcohol, and Mental Health Treatment Received in the Past 12 Months Among Arrestees Reporting Prior 12
Month Drug Use, 2007 and 2008
Drug or Alcohol Treatment (%) Inpatient Mental Health/
Psychiatric Treatment (%) Outpatient Inpatient or Residential
Primary City 2007 2008 2007 2008 2007 2008
Atlanta, GA 1.5
(0.9)
0.6
(0.4)
5.3
(1.6)
3.9
(1.3)
2.0
(1.1)
0.8
(0.5)
Charlotte, NC 5.3
(1.5)
5.8
(1.6)
7.0
(1.5)
6.7
(1.5)
1.0
(0.5)
1.9
(0.8)
Chicago, IL 6.1
(2.1)
3.6
(1.4)
9.8
(2.5)
5.9
(1.7)
4.3
(1.6)
1.5*
(0.8)
Denver, CO 4.3
(1.1)
4.3
(1.0)
9.7
(1.6)
7.7
(1.4)
1.2
(0.5)
1.2
(0.5)
Indianapolis, IN 4.9
(1.4)
6.2
(1.5)
3.1
(0.9)
2.0
(0.7)
0.6
(0.4)
2.0
(0.9)
Minneapolis, MN 7.8
(1.6)
7.0
(1.5)
13.8
(2.0)
9.8*
(1.7)
3.2
(1.0)
3.2
(1.0)
New York, NY 7.0
(1.4)
9.1
(1.6)
5.2
(1.2)
7.2
(1.4)
2.3
(0.9)
2.4
(0.8)
Portland, OR 11.4
(1.8)
7.7*
(1.4)
10.8
(1.7)
8.6
(1.4)
4.3
(1.2)
2.0*
(0.7)
Sacramento, CA 4.9
(1.3)
4.3
(1.0)
7.7
(1.8)
5.4
(1.3)
2.0
(0.7)
1.6
(0.6)
Washington, D.C. 1.5
(1.0)
.0
(n/a)
1.9
(1.1)
0.4
(0.3) n/a n/a
Notes:
Numbers shown in parentheses ( ) represent the standard error of the estimate presented.
Question asked only of arrestees who reported prior 12-month drug use.
Differences between 2008 estimate and 2007 estimate are reported as significant at the .10 level (*), .05 level (**), or .01 levels (***).

AD
AM
II 200
8 A
nn
ua
l Rep
ort.
Ap
pe
nd
ix A
: Da
ta T
ab
les
4
9
Table 2.9: Past 12 Month Drug, Alcohol, and Mental Health Treatment Among Arrestees Reporting Prior 12 Month Drug Use, 2007
and 2008
Average Number of Admissions
to Outpatient Drug or Alcohol
Treatment
Average of Total Number of
Reported Nights of Inpatient or
Residential to Drug or Alcohol
Treatment
Average of Total Number of
Nights of Inpatient Mental Health/
Psychiatric Treatment
Primary City 2007 2008 2007 2008 2007 2008
Atlanta, GA 0.1
(0.0)
0.0**
(0.0)
2.6
(1.9)
0.0
(1.2)
0.6
(0.6)
0.4
(0.3)
Charlotte, NC 0.1
(0.0)
0.1
(0.0)
1.5
(0.7)
1.4
(0.6) n/a n/a
Chicago, IL 0.1
(0.0)
0.2
(0.1)
6.9
(1.7)
2.0**
(1.0)
0.7
(0.9) n/a
Denver, CO 0.1
(0.0)
0.0**
(0.0)
4.2
(1.0)
2.7
(0.8)
0.5
(0.4)
0.5
(0.3)
Indianapolis, IN 0.1
(0.1)
0.1
(0.0)
1.1
(0.5)
1.0
(0.6)
0.1
(0.2)
0.4
(0.2)
Minneapolis, MN 0.2
(0.0)
0.2
(0.1)
7.7
(1.5)
4.4**
(1.1)
1.6
(0.3)
0.4***
(0.2)
New York, NY 0.1
(0.0)
0.2*
(0.0)
1.4
(1.8)
1.9
(1.0)
0.6
(0.5)
1.5
(0.7)
Portland, OR 0.1
(0.0)
0.2
(0.1)
5.3
(1.6)
4.4
(1.1)
0.7
(0.4)
0.9
(0.5)
Sacramento, CA 0.0
(0.1) n/a
3.2
(0.7)
4.3
(1.2)
0.1
(0.1)
0.2
(0.1)
Washington, D.C. 0.0
(0.0) n/a
2.3
(1.5) n/a n/a n/a
Notes:
Numbers shown in parentheses ( ) represent the standard error of the estimate presented.
Question asked only of arrestees who reported 12-month drug use.
Differences between 2008 estimate and 2007 estimate are reported as significant at the .10 level (*), .05 level (**), or .01 levels (***).
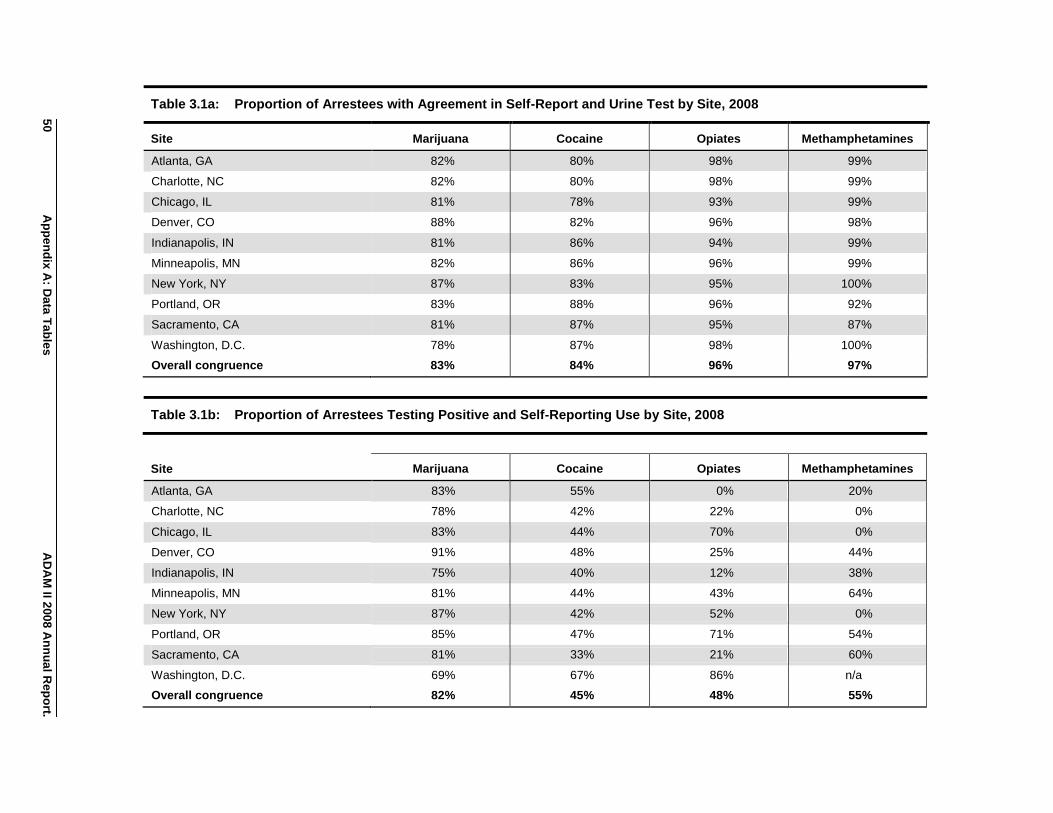
50
Ap
pe
nd
ix A
: Da
ta T
ab
les
A
DA
M II 2
00
8 A
nn
ua
l Rep
ort.
Table 3.1a: Proportion of Arrestees with Agreement in Self-Report and Urine Test by Site, 2008
Site Marijuana Cocaine Opiates Methamphetamines
Atlanta, GA 82% 80% 98% 99%
Charlotte, NC 82% 80% 98% 99%
Chicago, IL 81% 78% 93% 99%
Denver, CO 88% 82% 96% 98%
Indianapolis, IN 81% 86% 94% 99%
Minneapolis, MN 82% 86% 96% 99%
New York, NY 87% 83% 95% 100%
Portland, OR 83% 88% 96% 92%
Sacramento, CA 81% 87% 95% 87%
Washington, D.C. 78% 87% 98% 100%
Overall congruence 83% 84% 96% 97%
Table 3.1b: Proportion of Arrestees Testing Positive and Self-Reporting Use by Site, 2008
Site Marijuana Cocaine Opiates Methamphetamines
Atlanta, GA 83% 55% 0% 20%
Charlotte, NC 78% 42% 22% 0%
Chicago, IL 83% 44% 70% 0%
Denver, CO 91% 48% 25% 44%
Indianapolis, IN 75% 40% 12% 38%
Minneapolis, MN 81% 44% 43% 64%
New York, NY 87% 42% 52% 0%
Portland, OR 85% 47% 71% 54%
Sacramento, CA 81% 33% 21% 60%
Washington, D.C. 69% 67% 86% n/a
Overall congruence 82% 45% 48% 55%
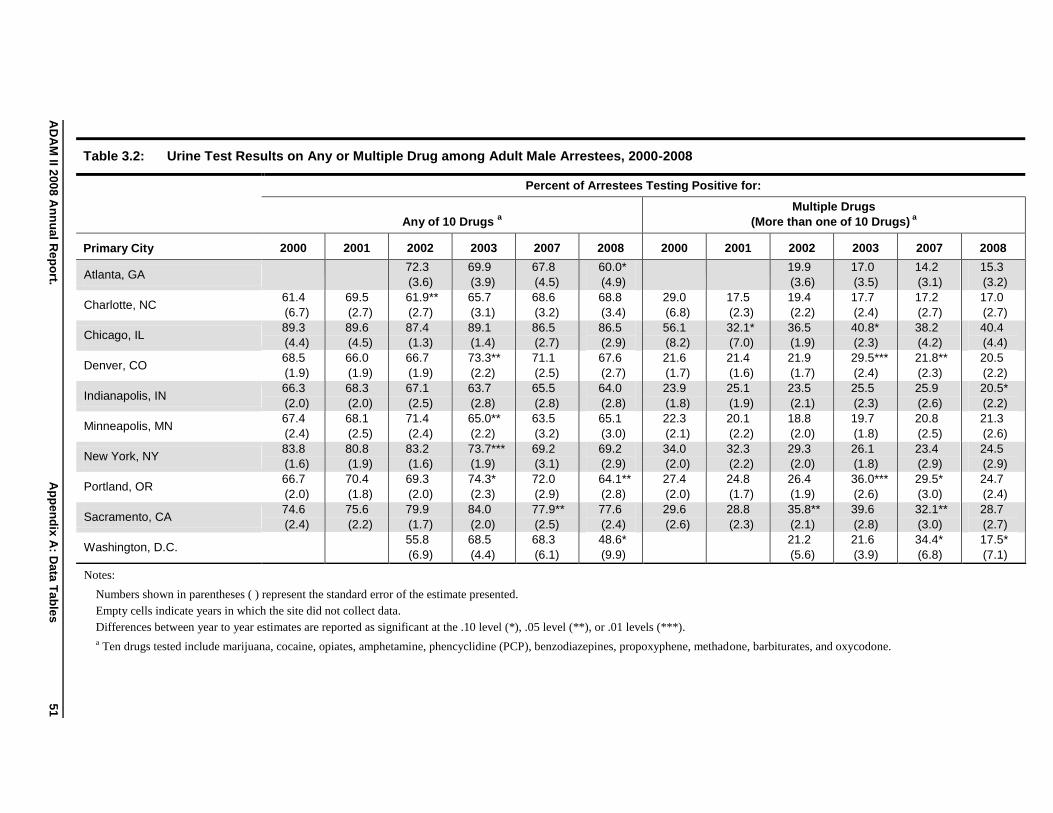
AD
AM
II 200
8 A
nn
ua
l Rep
ort.
Ap
pe
nd
ix A
: Da
ta T
ab
les
5
1
Table 3.2: Urine Test Results on Any or Multiple Drug among Adult Male Arrestees, 2000-2008
Percent of Arrestees Testing Positive for:
Any of 10 Drugs a
Multiple Drugs
(More than one of 10 Drugs) a
Primary City 2000 2001 2002 2003 2007 2008 2000 2001 2002 2003 2007 2008
Atlanta, GA
72.3
(3.6)
69.9
(3.9)
67.8
(4.5)
60.0*
(4.9)
19.9
(3.6)
17.0
(3.5)
14.2
(3.1)
15.3
(3.2)
Charlotte, NC 61.4
(6.7)
69.5
(2.7)
61.9**
(2.7)
65.7
(3.1)
68.6
(3.2)
68.8
(3.4)
29.0
(6.8)
17.5
(2.3)
19.4
(2.2)
17.7
(2.4)
17.2
(2.7)
17.0
(2.7)
Chicago, IL 89.3
(4.4)
89.6
(4.5)
87.4
(1.3)
89.1
(1.4)
86.5
(2.7)
86.5
(2.9)
56.1
(8.2)
32.1*
(7.0)
36.5
(1.9)
40.8*
(2.3)
38.2
(4.2)
40.4
(4.4)
Denver, CO 68.5
(1.9)
66.0
(1.9)
66.7
(1.9)
73.3**
(2.2)
71.1
(2.5)
67.6
(2.7)
21.6
(1.7)
21.4
(1.6)
21.9
(1.7)
29.5***
(2.4)
21.8**
(2.3)
20.5
(2.2)
Indianapolis, IN 66.3
(2.0)
68.3
(2.0)
67.1
(2.5)
63.7
(2.8)
65.5
(2.8)
64.0
(2.8)
23.9
(1.8)
25.1
(1.9)
23.5
(2.1)
25.5
(2.3)
25.9
(2.6)
20.5*
(2.2)
Minneapolis, MN 67.4
(2.4)
68.1
(2.5)
71.4
(2.4)
65.0**
(2.2)
63.5
(3.2)
65.1
(3.0)
22.3
(2.1)
20.1
(2.2)
18.8
(2.0)
19.7
(1.8)
20.8
(2.5)
21.3
(2.6)
New York, NY 83.8
(1.6)
80.8
(1.9)
83.2
(1.6)
73.7***
(1.9)
69.2
(3.1)
69.2
(2.9)
34.0
(2.0)
32.3
(2.2)
29.3
(2.0)
26.1
(1.8)
23.4
(2.9)
24.5
(2.9)
Portland, OR 66.7
(2.0)
70.4
(1.8)
69.3
(2.0)
74.3*
(2.3)
72.0
(2.9)
64.1**
(2.8)
27.4
(2.0)
24.8
(1.7)
26.4
(1.9)
36.0***
(2.6)
29.5*
(3.0)
24.7
(2.4)
Sacramento, CA 74.6
(2.4)
75.6
(2.2)
79.9
(1.7)
84.0
(2.0)
77.9**
(2.5)
77.6
(2.4)
29.6
(2.6)
28.8
(2.3)
35.8**
(2.1)
39.6
(2.8)
32.1**
(3.0)
28.7
(2.7)
Washington, D.C.
55.8
(6.9)
68.5
(4.4)
68.3
(6.1)
48.6*
(9.9)
21.2
(5.6)
21.6
(3.9)
34.4*
(6.8)
17.5*
(7.1)
Notes:
Numbers shown in parentheses ( ) represent the standard error of the estimate presented.
Empty cells indicate years in which the site did not collect data.
Differences between year to year estimates are reported as significant at the .10 level (*), .05 level (**), or .01 levels (***).
a Ten drugs tested include marijuana, cocaine, opiates, amphetamine, phencyclidine (PCP), benzodiazepines, propoxyphene, methadone, barbiturates, and oxycodone.
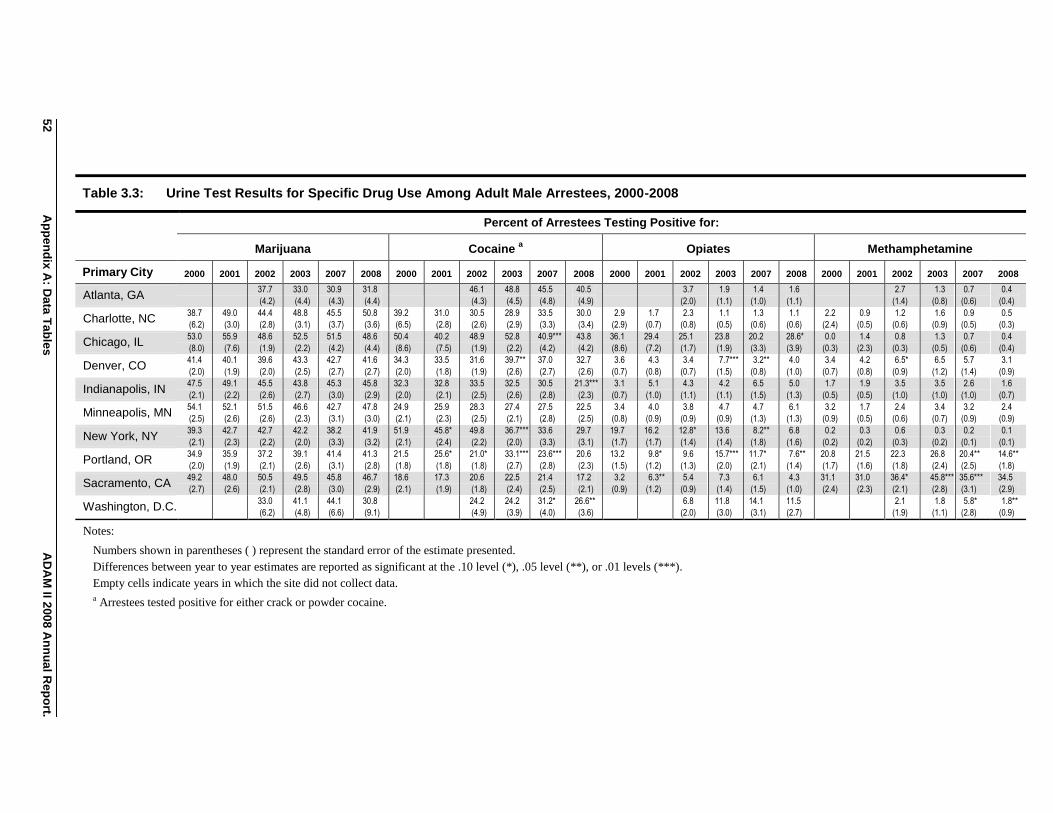
52
Ap
pe
nd
ix A
: Da
ta T
ab
les
A
DA
M II 2
00
8 A
nn
ua
l Rep
ort.
Table 3.3: Urine Test Results for Specific Drug Use Among Adult Male Arrestees, 2000-2008
Percent of Arrestees Testing Positive for:
Marijuana Cocaine a Opiates Methamphetamine
Primary City 2000 2001 2002 2003 2007 2008 2000 2001 2002 2003 2007 2008 2000 2001 2002 2003 2007 2008 2000 2001 2002 2003 2007 2008
Atlanta, GA
37.7
(4.2)
33.0
(4.4)
30.9
(4.3)
31.8
(4.4)
46.1
(4.3)
48.8
(4.5)
45.5
(4.8)
40.5
(4.9)
3.7
(2.0)
1.9
(1.1)
1.4
(1.0)
1.6
(1.1)
2.7
(1.4)
1.3
(0.8)
0.7
(0.6)
0.4
(0.4)
Charlotte, NC 38.7
(6.2)
49.0
(3.0)
44.4
(2.8)
48.8
(3.1)
45.5
(3.7)
50.8
(3.6)
39.2
(6.5)
31.0
(2.8)
30.5
(2.6)
28.9
(2.9)
33.5
(3.3)
30.0
(3.4)
2.9
(2.9)
1.7
(0.7)
2.3
(0.8)
1.1
(0.5)
1.3
(0.6)
1.1
(0.6)
2.2
(2.4)
0.9
(0.5)
1.2
(0.6)
1.6
(0.9)
0.9
(0.5)
0.5
(0.3)
Chicago, IL 53.0
(8.0)
55.9
(7.6)
48.6
(1.9)
52.5
(2.2)
51.5
(4.2)
48.6
(4.4)
50.4
(8.6)
40.2
(7.5)
48.9
(1.9)
52.8
(2.2)
40.9***
(4.2)
43.8
(4.2)
36.1
(8.6)
29.4
(7.2)
25.1
(1.7)
23.8
(1.9)
20.2
(3.3)
28.6*
(3.9)
0.0
(0.3)
1.4
(2.3)
0.8
(0.3)
1.3
(0.5)
0.7
(0.6)
0.4
(0.4)
Denver, CO 41.4
(2.0)
40.1
(1.9)
39.6
(2.0)
43.3
(2.5)
42.7
(2.7)
41.6
(2.7)
34.3
(2.0)
33.5
(1.8)
31.6
(1.9)
39.7**
(2.6)
37.0
(2.7)
32.7
(2.6)
3.6
(0.7)
4.3
(0.8)
3.4
(0.7)
7.7***
(1.5)
3.2**
(0.8)
4.0
(1.0)
3.4
(0.7)
4.2
(0.8)
6.5*
(0.9)
6.5
(1.2)
5.7
(1.4)
3.1
(0.9)
Indianapolis, IN 47.5
(2.1)
49.1
(2.2)
45.5
(2.6)
43.8
(2.7)
45.3
(3.0)
45.8
(2.9)
32.3
(2.0)
32.8
(2.1)
33.5
(2.5)
32.5
(2.6)
30.5
(2.8)
21.3***
(2.3)
3.1
(0.7)
5.1
(1.0)
4.3
(1.1)
4.2
(1.1)
6.5
(1.5)
5.0
(1.3)
1.7
(0.5)
1.9
(0.5)
3.5
(1.0)
3.5
(1.0)
2.6
(1.0)
1.6
(0.7)
Minneapolis, MN 54.1
(2.5)
52.1
(2.6)
51.5
(2.6)
46.6
(2.3)
42.7
(3.1)
47.8
(3.0)
24.9
(2.1)
25.9
(2.3)
28.3
(2.5)
27.4
(2.1)
27.5
(2.8)
22.5
(2.5)
3.4
(0.8)
4.0
(0.9)
3.8
(0.9)
4.7
(0.9)
4.7
(1.3)
6.1
(1.3)
3.2
(0.9)
1.7
(0.5)
2.4
(0.6)
3.4
(0.7)
3.2
(0.9)
2.4
(0.9)
New York, NY 39.3
(2.1)
42.7
(2.3)
42.7
(2.2)
42.2
(2.0)
38.2
(3.3)
41.9
(3.2)
51.9
(2.1)
45.8*
(2.4)
49.8
(2.2)
36.7***
(2.0)
33.6
(3.3)
29.7
(3.1)
19.7
(1.7)
16.2
(1.7)
12.8*
(1.4)
13.6
(1.4)
8.2**
(1.8)
6.8
(1.6)
0.2
(0.2)
0.3
(0.2)
0.6
(0.3)
0.3
(0.2)
0.2
(0.1)
0.1
(0.1)
Portland, OR 34.9
(2.0)
35.9
(1.9)
37.2
(2.1)
39.1
(2.6)
41.4
(3.1)
41.3
(2.8)
21.5
(1.8)
25.6*
(1.8)
21.0*
(1.8)
33.1***
(2.7)
23.6***
(2.8)
20.6
(2.3)
13.2
(1.5)
9.8*
(1.2)
9.6
(1.3)
15.7***
(2.0)
11.7*
(2.1)
7.6**
(1.4)
20.8
(1.7)
21.5
(1.6)
22.3
(1.8)
26.8
(2.4)
20.4**
(2.5)
14.6**
(1.8)
Sacramento, CA 49.2
(2.7)
48.0
(2.6)
50.5
(2.1)
49.5
(2.8)
45.8
(3.0)
46.7
(2.9)
18.6
(2.1)
17.3
(1.9)
20.6
(1.8)
22.5
(2.4)
21.4
(2.5)
17.2
(2.1)
3.2
(0.9)
6.3**
(1.2)
5.4
(0.9)
7.3
(1.4)
6.1
(1.5)
4.3
(1.0)
31.1
(2.4)
31.0
(2.3)
36.4*
(2.1)
45.8***
(2.8)
35.6***
(3.1)
34.5
(2.9)
Washington, D.C.
33.0
(6.2)
41.1
(4.8)
44.1
(6.6)
30.8
(9.1)
24.2
(4.9)
24.2
(3.9)
31.2*
(4.0)
26.6**
(3.6)
6.8
(2.0)
11.8
(3.0)
14.1
(3.1)
11.5
(2.7)
2.1
(1.9)
1.8
(1.1)
5.8*
(2.8)
1.8**
(0.9)
Notes:
Numbers shown in parentheses ( ) represent the standard error of the estimate presented.
Differences between year to year estimates are reported as significant at the .10 level (*), .05 level (**), or .01 levels (***).
Empty cells indicate years in which the site did not collect data.
a Arrestees tested positive for either crack or powder cocaine.
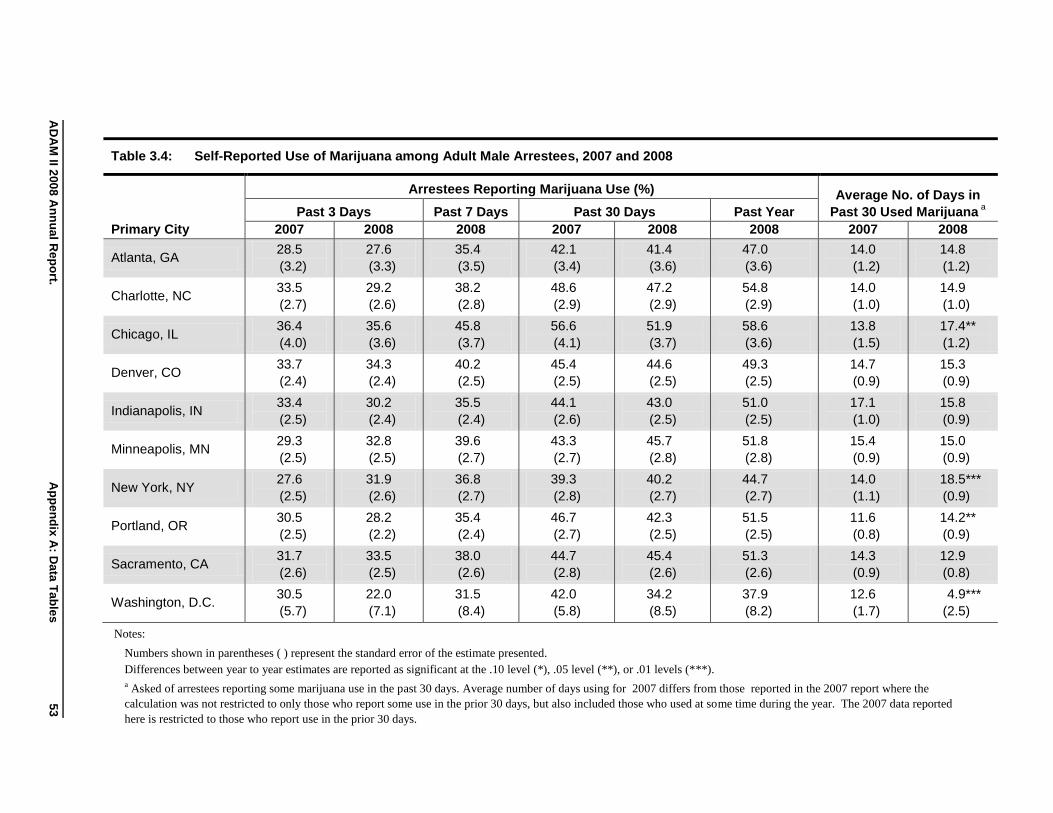
AD
AM
II 200
8 A
nn
ua
l Rep
ort.
Ap
pe
nd
ix A
: Da
ta T
ab
les
5
3
Table 3.4: Self-Reported Use of Marijuana among Adult Male Arrestees, 2007 and 2008
Arrestees Reporting Marijuana Use (%) Average No. of Days in
Past 30 Used Marijuana a
Past 3 Days Past 7 Days Past 30 Days Past Year
Primary City 2007 2008 2008 2007 2008 2008 2007 2008
Atlanta, GA 28.5
(3.2)
27.6
(3.3)
35.4
(3.5)
42.1
(3.4)
41.4
(3.6)
47.0
(3.6)
14.0
(1.2)
14.8
(1.2)
Charlotte, NC 33.5
(2.7)
29.2
(2.6)
38.2
(2.8)
48.6
(2.9)
47.2
(2.9)
54.8
(2.9)
14.0
(1.0)
14.9
(1.0)
Chicago, IL 36.4
(4.0)
35.6
(3.6)
45.8
(3.7)
56.6
(4.1)
51.9
(3.7)
58.6
(3.6)
13.8
(1.5)
17.4**
(1.2)
Denver, CO 33.7
(2.4)
34.3
(2.4)
40.2
(2.5)
45.4
(2.5)
44.6
(2.5)
49.3
(2.5)
14.7
(0.9)
15.3
(0.9)
Indianapolis, IN 33.4
(2.5)
30.2
(2.4)
35.5
(2.4)
44.1
(2.6)
43.0
(2.5)
51.0
(2.5)
17.1
(1.0)
15.8
(0.9)
Minneapolis, MN 29.3
(2.5)
32.8
(2.5)
39.6
(2.7)
43.3
(2.7)
45.7
(2.8)
51.8
(2.8)
15.4
(0.9)
15.0
(0.9)
New York, NY 27.6
(2.5)
31.9
(2.6)
36.8
(2.7)
39.3
(2.8)
40.2
(2.7)
44.7
(2.7)
14.0
(1.1)
18.5***
(0.9)
Portland, OR 30.5
(2.5)
28.2
(2.2)
35.4
(2.4)
46.7
(2.7)
42.3
(2.5)
51.5
(2.5)
11.6
(0.8)
14.2**
(0.9)
Sacramento, CA 31.7
(2.6)
33.5
(2.5)
38.0
(2.6)
44.7
(2.8)
45.4
(2.6)
51.3
(2.6)
14.3
(0.9)
12.9
(0.8)
Washington, D.C. 30.5
(5.7)
22.0
(7.1)
31.5
(8.4)
42.0
(5.8)
34.2
(8.5)
37.9
(8.2)
12.6
(1.7)
4.9***
(2.5)
Notes:
Numbers shown in parentheses ( ) represent the standard error of the estimate presented.
Differences between year to year estimates are reported as significant at the .10 level (*), .05 level (**), or .01 levels (***).
a Asked of arrestees reporting some marijuana use in the past 30 days. Average number of days using for 2007 differs from those reported in the 2007 report where the
calculation was not restricted to only those who report some use in the prior 30 days, but also included those who used at some time during the year. The 2007 data reported
here is restricted to those who report use in the prior 30 days.
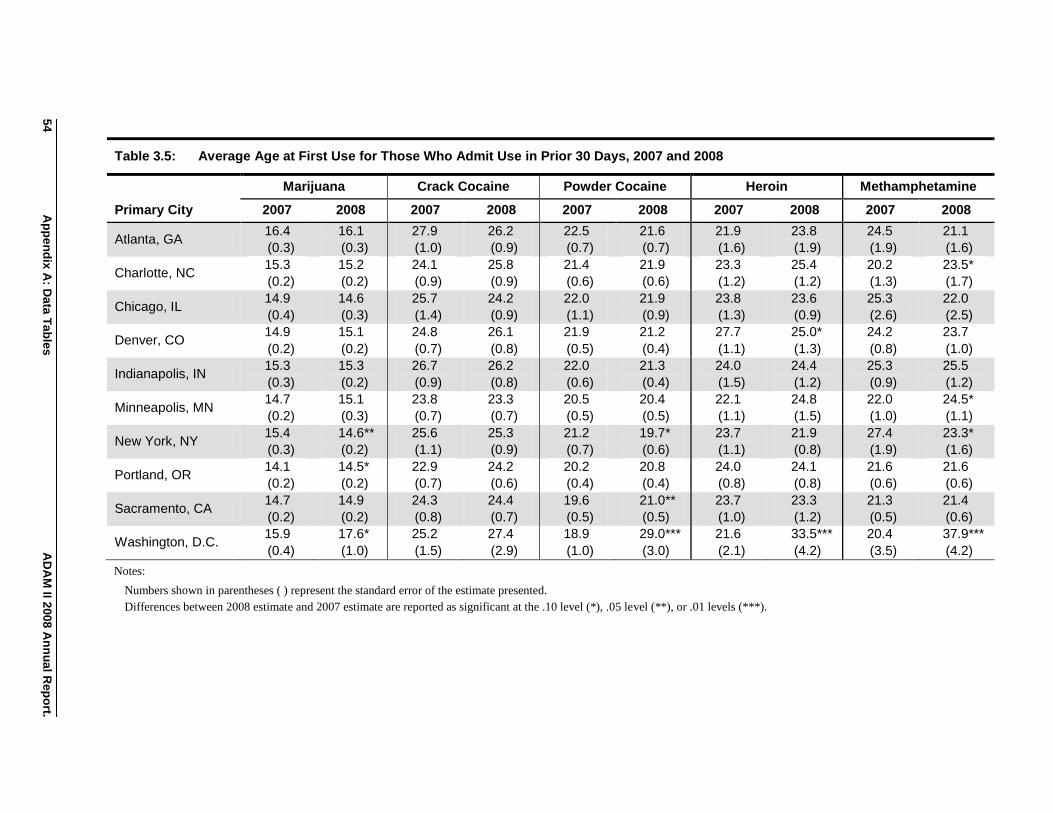
54
Ap
pe
nd
ix A
: Da
ta T
ab
les
A
DA
M II 2
00
8 A
nn
ua
l Rep
ort.
Table 3.5: Average Age at First Use for Those Who Admit Use in Prior 30 Days, 2007 and 2008
Marijuana Crack Cocaine Powder Cocaine Heroin Methamphetamine
Primary City 2007 2008 2007 2008 2007 2008 2007 2008 2007 2008
Atlanta, GA 16.4
(0.3)
16.1
(0.3)
27.9
(1.0)
26.2
(0.9)
22.5
(0.7)
21.6
(0.7)
21.9
(1.6)
23.8
(1.9)
24.5
(1.9)
21.1
(1.6)
Charlotte, NC 15.3
(0.2)
15.2
(0.2)
24.1
(0.9)
25.8
(0.9)
21.4
(0.6)
21.9
(0.6)
23.3
(1.2)
25.4
(1.2)
20.2
(1.3)
23.5*
(1.7)
Chicago, IL 14.9
(0.4)
14.6
(0.3)
25.7
(1.4)
24.2
(0.9)
22.0
(1.1)
21.9
(0.9)
23.8
(1.3)
23.6
(0.9)
25.3
(2.6)
22.0
(2.5)
Denver, CO 14.9
(0.2)
15.1
(0.2)
24.8
(0.7)
26.1
(0.8)
21.9
(0.5)
21.2
(0.4)
27.7
(1.1)
25.0*
(1.3)
24.2
(0.8)
23.7
(1.0)
Indianapolis, IN 15.3
(0.3)
15.3
(0.2)
26.7
(0.9)
26.2
(0.8)
22.0
(0.6)
21.3
(0.4)
24.0
(1.5)
24.4
(1.2)
25.3
(0.9)
25.5
(1.2)
Minneapolis, MN 14.7
(0.2)
15.1
(0.3)
23.8
(0.7)
23.3
(0.7)
20.5
(0.5)
20.4
(0.5)
22.1
(1.1)
24.8
(1.5)
22.0
(1.0)
24.5*
(1.1)
New York, NY 15.4
(0.3)
14.6**
(0.2)
25.6
(1.1)
25.3
(0.9)
21.2
(0.7)
19.7*
(0.6)
23.7
(1.1)
21.9
(0.8)
27.4
(1.9)
23.3*
(1.6)
Portland, OR 14.1
(0.2)
14.5*
(0.2)
22.9
(0.7)
24.2
(0.6)
20.2
(0.4)
20.8
(0.4)
24.0
(0.8)
24.1
(0.8)
21.6
(0.6)
21.6
(0.6)
Sacramento, CA 14.7
(0.2)
14.9
(0.2)
24.3
(0.8)
24.4
(0.7)
19.6
(0.5)
21.0**
(0.5)
23.7
(1.0)
23.3
(1.2)
21.3
(0.5)
21.4
(0.6)
Washington, D.C. 15.9
(0.4)
17.6*
(1.0)
25.2
(1.5)
27.4
(2.9)
18.9
(1.0)
29.0***
(3.0)
21.6
(2.1)
33.5***
(4.2)
20.4
(3.5)
37.9***
(4.2)
Notes:
Numbers shown in parentheses ( ) represent the standard error of the estimate presented.
Differences between 2008 estimate and 2007 estimate are reported as significant at the .10 level (*), .05 level (**), or .01 levels (***).

AD
AM
II 200
8 A
nn
ua
l Rep
ort.
Ap
pe
nd
ix A
: Da
ta T
ab
les
5
5
Table 3.6: Acquisition of Selected Drugs by Adult Male Arrestees, 2007 and 2008
Acquired Marijuana
in Past 30 days
Acquired Crack Cocaine
in Past 30 days
Acquired Powder Cocaine
in Past 30 days
Acquired Heroin
in Past 30 days
Acquired Methamphetamine in
Past 30 days
% of
Arrestees
Mean Number
of Days a
2008
% of
Arrestees
Mean Number
of Days a
2008
% of
Arrestees
Mean
Number of
Days a
2008
% of
Arrestees
Mean
Number of
Days a
2008
% of
Arrestees
Mean Number
of Days a
2008
Primary City 2007 2008 Cash Non-cash 2007 2008 Cash Non-cash 2007 2008 Cash Non-cash 2007 2008 Cash Non-cash 2007 2008 Cash Non-cash
Atlanta, GA 44.1
(3.5)
45.4
(3.6)
11.7
(1.2)
4.6
(0.9)
28.7
(3.2)
24.2
(3.0)
19.8
(1.5)
15.5*
(2.1)
8.7
(1.8)
8.9
(1.9)
6.8
(2.1)
2.7
(1.0)
0.5
(0.4)
1.3
(0.7)
7.4
(6.2) n/a
1.1
(0.6)
0.1*
(0.1) n/a
1.9
(2.6)
Charlotte, NC 43.8
(2.9)
46.1
(2.9)
10.1
(1.0)
5.9
(0.8)
19.9
(2.3)
15.4*
(2.1)
14.6*
(1.5)
5.0
(1.5)
14.1
(2.1)
10.1*
(1.7)
5.7*
(1.4)
4.3
(1.5)
0.8
(0.5)
0.9
(0.5)
7.6
(6.7) n/a n/a
0.2
(0.2) n/a n/a
Chicago, IL 55.6
(4.1)
55.5
(3.7)
14.8*
(1.2)
6.0
(0.9)
22.3
(3.4)
25.5
(3.2)
13.5
(1.4)
3.3
(1.2)
6.6
(2.1)
4.0
(1.4)
2.1
(1.0)
1.6
(0.9)
21.9
(3.4)
25.5
(3.2)
24.1
(1.4)
7.7
(2.2) n/a n/a
13.5
(10.2) n/a
Denver, CO 44.6
(2.5)
44.4
(2.5)
6.9
(0.7)
5.0
(0.6)
20.1
(2.1)
17.2
(1.9)
10.8
(1.4)
7.2
(1.2)
15.6
(1.9)
10.7**
(1.5)
6.8
(1.8)
3.4
(0.7)
3.3
(0.9)
1.6*
(0.5)
17.0
(4.8)
0.4**
(2.4)
4.7
(1.1)
3.1
(0.9)
4.4**
(1.6)
9.2
(5.7)
Indianapolis, IN 36.4
(2.5)
33.4
(2.4)
8.6
(0.9)
5.5
(0.8)
13.3
(1.7)
10.4
(1.5)
11.1
(1.5)
11.6
(2.0)
7.0
(1.3)
3.4**
(0.9)
9.1
(3.0)
10.1
(4.0)
0.9
(0.5)
1.6
(0.6)
15.2
(4.0)
17.9
(5.4)
2.3
(0.8)
1.3
(0.6)
17.6
(7.2)
3.2
(1.2)
Minneapolis, MN 38.7
(2.7)
43.9
(2.7)
8.9**
(0.9)
5.8
(0.6)
17.7
(2.1)
15.6
(2.0)
13.0
(1.7)
5.8*
(1.3)
8.9
(1.6)
6.7
(1.4)
4.3
(1.8)
1.4
(0.8)
2.4
(0.7)
3.1
(0.9)
17.6
(3.4)
6.4
(3.6)
3.7
(1.1)
3.5
(1.0)
8.4
(4.0)
5.1
(2.5)
New York, NY 42.2
(2.8)
39.8
(2.7)
14.3**
(1.0)
6.2
(0.9)
10.8
(1.6)
7.4*
(1.3)
18.1
(2.1)
0.8*
(1.2)
11.0
(1.6)
8.1
(1.3)
8.3
(1.4)
8.0
(2.6)
6.0
(1.2)
6.1
(1.3)
18.1
(2.7)
10.3
(3.4)
0.7
(0.6)
0
(n/a) n/a n/a
Portland, OR 44.0
(2.7)
37.9*
(2.4)
7.7
(0.9)
4.9
(0.6)
15.8
(2.0)
11.4*
(1.5)
14.1
(1.9)
6.4
(1.4)
12.3
(1.8)
8.6*
(1.4)
7.3
(1.9)
3.2
(0.7)
9.4
(1.5)
7.8
(1.3)
21.6
(2.0)
7.7
(1.8)
23.0
(2.3)
13.2***
(1.6)
8.5
(1.4)
7.7
(1.2)
Sacramento, CA 43.0
(2.7)
45.6
(2.6)
9.8
(1.0)
5.7
(0.5)
11.7
(1.8)
9.9
(1.6)
13.2
(1.9)
7.1
(1.9)
8.7
(1.7)
5.8
(1.3)
4.5
(1.8)
3.5
(1.0)
3.3
(1.0)
2.4
(0.7)
11.0**
(3.3)
8.4
(3.3)
28.0
(2.5)
25.7
(2.3)
12.1
(1.1)
9.1
(1.0)
Washington, D.C. 35.3
(6.0)
21.2
(7.2)
7.5***
(2.9)
14.2
(5.0)
15.3
(4.2)
11.0
(3.6)
10.6
(4.1)
24.3***
(5.8)
7.9
(4.2)
3.3
(2.3) n/a
2.4***
(0.3)
12.7
(4.4)
2.9**
(2.0)
20.8
(7.5)
22.1*
(9.6) n/a n/a n/a n/a
Notes:
Numbers shown in parentheses ( ) represent the standard error of the estimate presented.
Differences between 2008 estimate and 2007 estimate are reported as significant at the .10 level (*), .05 level (**), or .01 levels (***).
a Asked of those who said they obtained the drug in the past 30 days. Significance indicated results from a comparison of the parallel 2007 measure (not shown), i.e., 2007 ―cash‖
with 2008 ―cash‖ acquisition days, not ―cash‖ versus ―non cash‖ days for the same year.

56
Ap
pe
nd
ix A
: Da
ta T
ab
les
A
DA
M II 2
00
8 A
nn
ua
l Rep
ort.
Table 3.7: Percent Reporting Cash Buys in Past 30 Days, 2007 and 2008
Marijuana Crack Cocaine Powder Cocaine Heroin Methamphetamine
Primary City 2007 2008 2007 2008 2007 2008 2007 2008 2007 2008
Atlanta, GA 66.6
(5.1)
71.8
(5.2)
94.7
(2.2)
97.2
(1.4)
69.7
(11.8)
44.0*
(12.0) n/a
92.7
(8.9) n/a n/a
Charlotte, NC 80.6
(3.4)
66.9***
(4.3)
93.9
(2.9)
95.8
(2.6)
79.1
(6.9)
79.5
(7.6) n/a
75.0
(26.0) n/a n/a
Chicago, IL 82.1
(3.9)
73.5
(4.3)
92.6
(4.3)
87.9
(5.2)
89.3
(10.5)
37.6***
(16.5)
84.4
(6.5)
92.5
(3.3) n/a n/a
Denver, CO 52.3
(3.8)
53.7
(3.8)
77.8
(4.9)
75.4
(5.1)
47.1
(6.7)
58.2
(7.9)
75.4
(12.9)
84.6
(14.4)
58.8
(12.5)
60.1
(14.3)
Indianapolis, IN 70.6
(3.9)
72.5
(3.8)
88.0
(4.3)
90.1
(4.2)
65.2
(9.3)
70.3
(12.1)
40.1
(32.2)
75.6
(18.2)
56.8
(20.6)
88.3
(11.9)
Minneapolis, MN 72.0
(3.9)
68.2
(3.8)
85.5
(4.7)
93.0
(2.9)
59.3
(9.7)
71.5
(10.4)
76.3
(15.0)
95.8
(4.5)
90.1
(7.1)
65.4
(14.7)
New York, NY 65.0
(4.5)
74.3*
(4.0)
96.6
(3.4)
96.6
(3.4)
78.7
(5.8)
83.5
(5.9)
83.6
(7.2)
73.6
(10.4) n/a n/a
Portland, OR 49.9
(4.0)
53.9
(4.0)
82.8
(5.2)
82.1
(5.2)
67.0
(7.3)
68.1
(7.7)
84.3
(6.2)
86.4
(5.7)
70.9
(5.0)
77.3
(5.2)
Sacramento, CA 56.7
(4.1)
39.0***
(3.7)
79.0
(6.9)
76.0
(7.3)
55.0
(10.1)
41.4
(11.9)
83.8
(11.0)
74.1
(12.7)
75.0
(4.6)
60.4**
(5.1)
Washington, D.C. 57.4
(12.2)
62.1
(16.3)
92.0
(8.2)
89.4
(9.4) n/a n/a
88.3
(10.0)
17.5***
(21.1) n/a n/a
Notes:
Numbers shown in parentheses ( ) represent the standard error of the estimate presented.
Differences between 2008 estimate and 2007 estimate are reported as significant at the .10 level (*), .05 level (**), or .01 levels (***).

AD
AM
II 200
8 A
nn
ua
l Rep
ort.
Ap
pe
nd
ix A
: Da
ta T
ab
les
5
7
Table 3.8: Percent Reporting Noncash Acquisitions in Past 30 Days, 2007 and 2008
Marijuana Crack Cocaine Powder Cocaine Heroin Methamphetamine
Primary City 2007 2008 2007 2008 2007 2008 2007 2008 2007 2008
Atlanta, GA 52.7
(5.3)
49.0
(5.7)
31.3
(5.7)
33.1
(6.5)
49.2
(11.2)
61.3
(11.0) n/a n/a n/a n/a
Charlotte, NC 44.0
(4.5)
64.8***
(4.3)
42.7
(6.4)
44.2
(7.2)
49.5
(8.4)
58.4
(8.9)
20.8
(23.4)
7.0
(9.9) n/a n/a
Chicago, IL 59.4
(5.6)
61.3
(4.9)
47.7
(8.6)
43.7
(7.3)
61.0
(16.9)
57.9
(17.3)
48.7
(8.7)
35.5
(6.8) n/a n/a
Denver, CO 68.5
(3.5)
73.5
(3.3)
47.7
(5.8)
55.3
(6.1)
67.4
(5.9)
53.0
(7.8)
43.5
(13.4)
23.0
(16.1)
66.5
(12.3)
39.3
(14.3)
Indianapolis, IN 61.4
(4.1)
64.9
(4.3)
54.2
(7.0)
39.3
(7.2)
55.2
(9.5)
44.3
(13.6)
55.2
(27.3)
47.8
(20.8)
64.0
(19.7)
33.1
(22.5)
Minneapolis, MN 69.4
(3.9)
74.2
(3.4)
54.4
(6.6)
54.1
(7.1)
60.6
(9.3)
66.5
(10.3)
55.9
(14.7)
65.1
(14.7)
58.0
(14.2)
81.0
(13.5)
New York, NY 65.9
(4.1)
64.4
(4.3)
37.6
(7.7)
35.7
(9.8)
40.6
(7.6)
35.4
(8.4)
37.4
(10.2)
39.7
(12.4) n/a n/a
Portland, OR 78.4
(3.3)
80.6
(3.1)
46.4
(7.2)
68.6**
(6.4)
53.7
(8.0)
69.8
(7.9)
39.3
(8.7)
73.9***
(7.7)
65.6
(5.4)
60.8
(6.6)
Sacramento, CA 80.9
(3.3)
79.8
(3.0)
55.8
(8.1)
50.9
(8.6)
70.9
(9.1)
77.0
(9.0)
51.3
(14.0)
43.0
(16.9)
67.0
(5.2)
70.5
(4.7)
Washington, D.C. 59.0
(11.3)
42.0
(17.6)
29.2
(13.0)
35.9
(19.2)
60.8
(27.6)
9.6*
(13.6)
50.1
(17.8)
93.4**
(8.5) n/a n/a
Notes:
Numbers shown in parentheses ( ) represent the standard error of the estimate presented.
Differences between 2008 estimate and 2007 estimate are reported as significant at the .10 level (*), .05 level (**), or .01 levels (***).
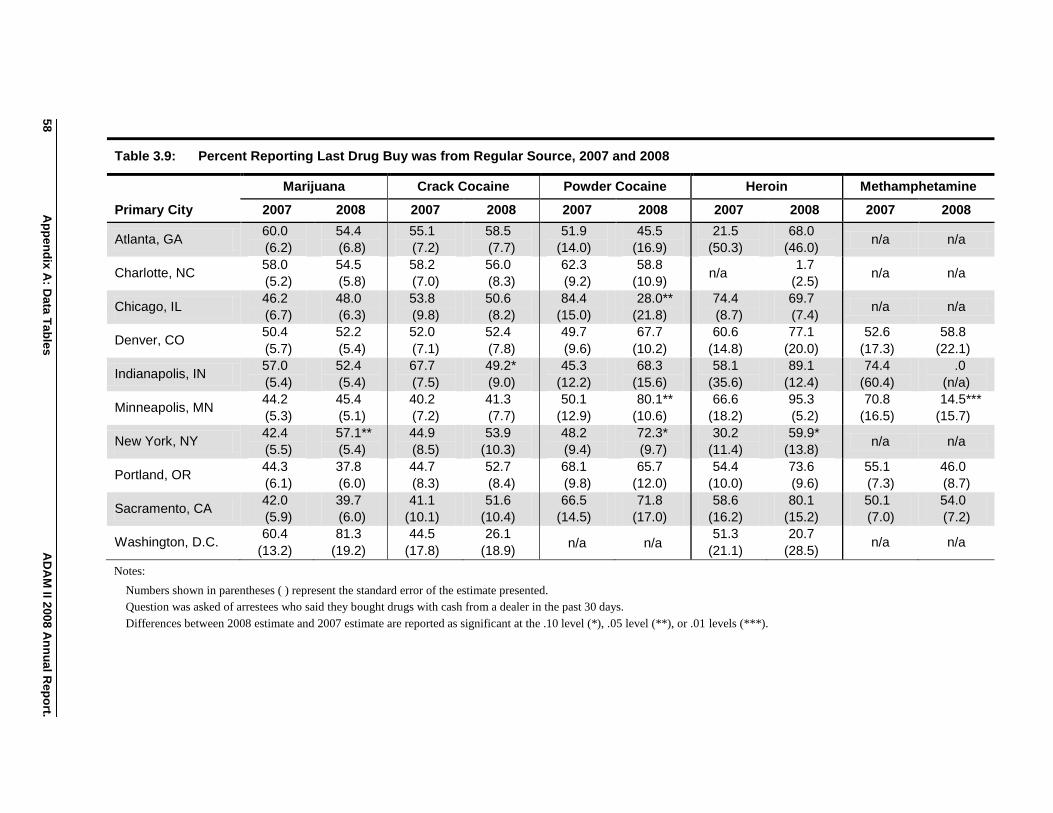
58
Ap
pe
nd
ix A
: Da
ta T
ab
les
A
DA
M II 2
00
8 A
nn
ua
l Rep
ort.
Table 3.9: Percent Reporting Last Drug Buy was from Regular Source, 2007 and 2008
Marijuana Crack Cocaine Powder Cocaine Heroin Methamphetamine
Primary City 2007 2008 2007 2008 2007 2008 2007 2008 2007 2008
Atlanta, GA 60.0
(6.2)
54.4
(6.8)
55.1
(7.2)
58.5
(7.7)
51.9
(14.0)
45.5
(16.9)
21.5
(50.3)
68.0
(46.0) n/a n/a
Charlotte, NC 58.0
(5.2)
54.5
(5.8)
58.2
(7.0)
56.0
(8.3)
62.3
(9.2)
58.8
(10.9) n/a
1.7
(2.5) n/a n/a
Chicago, IL 46.2
(6.7)
48.0
(6.3)
53.8
(9.8)
50.6
(8.2)
84.4
(15.0)
28.0**
(21.8)
74.4
(8.7)
69.7
(7.4) n/a n/a
Denver, CO 50.4
(5.7)
52.2
(5.4)
52.0
(7.1)
52.4
(7.8)
49.7
(9.6)
67.7
(10.2)
60.6
(14.8)
77.1
(20.0)
52.6
(17.3)
58.8
(22.1)
Indianapolis, IN 57.0
(5.4)
52.4
(5.4)
67.7
(7.5)
49.2*
(9.0)
45.3
(12.2)
68.3
(15.6)
58.1
(35.6)
89.1
(12.4)
74.4
(60.4)
.0
(n/a)
Minneapolis, MN 44.2
(5.3)
45.4
(5.1)
40.2
(7.2)
41.3
(7.7)
50.1
(12.9)
80.1**
(10.6)
66.6
(18.2)
95.3
(5.2)
70.8
(16.5)
14.5***
(15.7)
New York, NY 42.4
(5.5)
57.1**
(5.4)
44.9
(8.5)
53.9
(10.3)
48.2
(9.4)
72.3*
(9.7)
30.2
(11.4)
59.9*
(13.8) n/a n/a
Portland, OR 44.3
(6.1)
37.8
(6.0)
44.7
(8.3)
52.7
(8.4)
68.1
(9.8)
65.7
(12.0)
54.4
(10.0)
73.6
(9.6)
55.1
(7.3)
46.0
(8.7)
Sacramento, CA 42.0
(5.9)
39.7
(6.0)
41.1
(10.1)
51.6
(10.4)
66.5
(14.5)
71.8
(17.0)
58.6
(16.2)
80.1
(15.2)
50.1
(7.0)
54.0
(7.2)
Washington, D.C. 60.4
(13.2)
81.3
(19.2)
44.5
(17.8)
26.1
(18.9) n/a n/a
51.3
(21.1)
20.7
(28.5) n/a n/a
Notes:
Numbers shown in parentheses ( ) represent the standard error of the estimate presented.
Question was asked of arrestees who said they bought drugs with cash from a dealer in the past 30 days.
Differences between 2008 estimate and 2007 estimate are reported as significant at the .10 level (*), .05 level (**), or .01 levels (***).
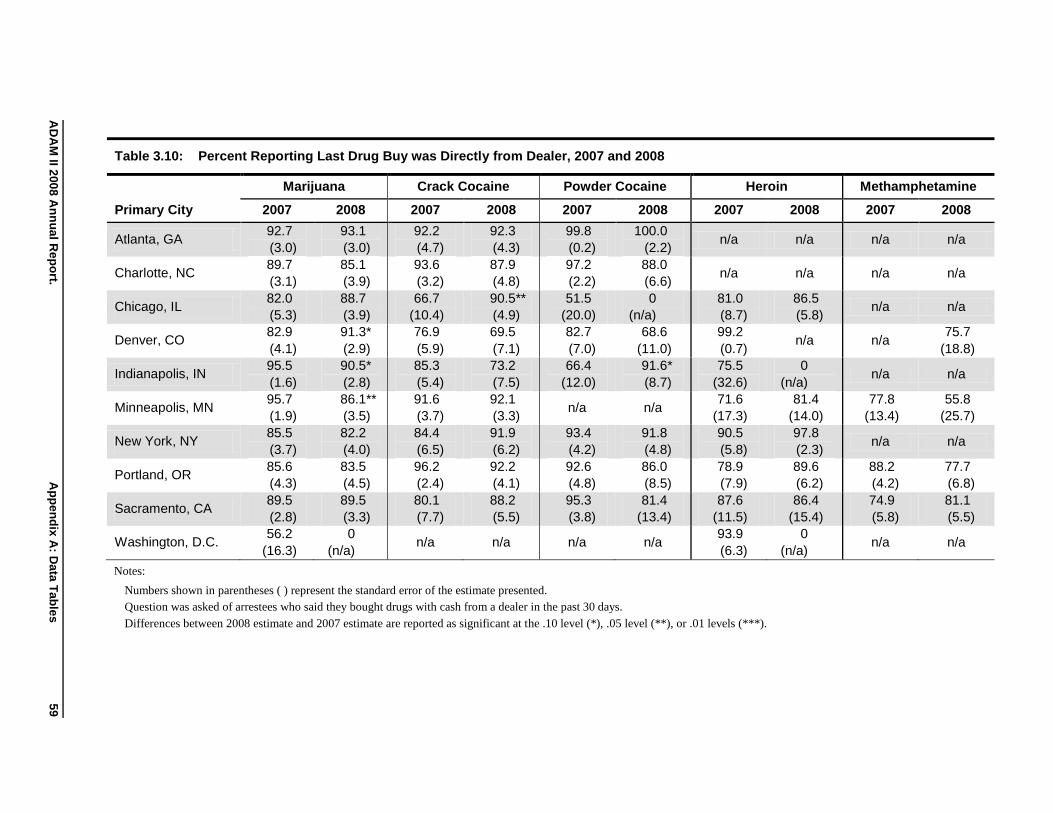
AD
AM
II 200
8 A
nn
ua
l Rep
ort.
Ap
pe
nd
ix A
: Da
ta T
ab
les
5
9
Table 3.10: Percent Reporting Last Drug Buy was Directly from Dealer, 2007 and 2008
Marijuana Crack Cocaine Powder Cocaine Heroin Methamphetamine
Primary City 2007 2008 2007 2008 2007 2008 2007 2008 2007 2008
Atlanta, GA 92.7
(3.0)
93.1
(3.0)
92.2
(4.7)
92.3
(4.3)
99.8
(0.2)
100.0
(2.2) n/a n/a n/a n/a
Charlotte, NC 89.7
(3.1)
85.1
(3.9)
93.6
(3.2)
87.9
(4.8)
97.2
(2.2)
88.0
(6.6) n/a n/a n/a n/a
Chicago, IL 82.0
(5.3)
88.7
(3.9)
66.7
(10.4)
90.5**
(4.9)
51.5
(20.0)
0
(n/a)
81.0
(8.7)
86.5
(5.8) n/a n/a
Denver, CO 82.9
(4.1)
91.3*
(2.9)
76.9
(5.9)
69.5
(7.1)
82.7
(7.0)
68.6
(11.0)
99.2
(0.7) n/a n/a
75.7
(18.8)
Indianapolis, IN 95.5
(1.6)
90.5*
(2.8)
85.3
(5.4)
73.2
(7.5)
66.4
(12.0)
91.6*
(8.7)
75.5
(32.6)
0
(n/a) n/a n/a
Minneapolis, MN 95.7
(1.9)
86.1**
(3.5)
91.6
(3.7)
92.1
(3.3) n/a n/a
71.6
(17.3)
81.4
(14.0)
77.8
(13.4)
55.8
(25.7)
New York, NY 85.5
(3.7)
82.2
(4.0)
84.4
(6.5)
91.9
(6.2)
93.4
(4.2)
91.8
(4.8)
90.5
(5.8)
97.8
(2.3) n/a n/a
Portland, OR 85.6
(4.3)
83.5
(4.5)
96.2
(2.4)
92.2
(4.1)
92.6
(4.8)
86.0
(8.5)
78.9
(7.9)
89.6
(6.2)
88.2
(4.2)
77.7
(6.8)
Sacramento, CA 89.5
(2.8)
89.5
(3.3)
80.1
(7.7)
88.2
(5.5)
95.3
(3.8)
81.4
(13.4)
87.6
(11.5)
86.4
(15.4)
74.9
(5.8)
81.1
(5.5)
Washington, D.C. 56.2
(16.3)
0
(n/a) n/a n/a n/a n/a
93.9
(6.3)
0
(n/a) n/a n/a
Notes:
Numbers shown in parentheses ( ) represent the standard error of the estimate presented.
Question was asked of arrestees who said they bought drugs with cash from a dealer in the past 30 days.
Differences between 2008 estimate and 2007 estimate are reported as significant at the .10 level (*), .05 level (**), or .01 levels (***).

60
Ap
pe
nd
ix A
: Da
ta T
ab
les
A
DA
M II 2
00
8 A
nn
ua
l Rep
ort.
Table 3.11: Percent Reporting Last Drug Buy with Cash was Outdoors, 2007 and 2008
Marijuana Crack Cocaine Powder Cocaine Heroin Methamphetamine
Primary City 2007 2008 2007 2008 2007 2008 2007 2008 2007 2008
Atlanta, GA 43.7
(6.5)
49.3
(7.0)
61.8
(6.8)
62.8
(7.5)
18.6
(10.1)
32.3
(16.0) n/a n/a n/a n/a
Charlotte, NC 26.5
(4.5)
27.5
(5.2)
44.3
(7.3)
36.0
(8.1)
20.2
(7.3)
16.9
(7.8) n/a
0.5
(0.8) n/a n/a
Chicago, IL 50.5
(6.9)
65.9*
(6.0)
62.2
(9.6)
69.3
(7.7)
33.0
(20.3)
33.4
(24.1)
55.4
(10.2)
53.7
(8.5) n/a n/a
Denver, CO 37.0
(5.4)
39.4
(5.1)
43.9
(6.9)
46.9
(7.8)
45.9
(9.8)
54.3
(10.9)
69.5
(15.2)
60.0
(20.5)
56.2
(18.9)
.0
(n/a)
Indianapolis, IN 25.3
(4.7)
19.0
(4.1)
36.8
(7.6)
46.5
(8.9)
36.6
(12.3)
14.1
(11.0)
51.5
(41.3)
24.2
(22.8) n/a n/a
Minneapolis, MN 52.9
(5.2)
52.4
(5.1)
56.5
(7.4)
58.7
(7.7)
20.7
(11.0)
32.4
(13.7)
59.3
(19.4)
45.6
(18.5)
21.8
(16.7)
14.0
(17.2)
New York, NY 53.7
(6.0)
51.7
(5.6)
63.4
(8.6)
63.9
(11.4)
40.6
(9.2)
38.8
(9.6)
65.0
(11.7)
59.4
(12.9) n/a n/a
Portland, OR 28.8
(5.4)
27.2
(5.3)
57.4
(8.2)
61.7
(8.4)
64.4
(9.8)
37.3*
(12.3)
63.2
(9.9)
66.8
(9.8)
16.1
(5.0)
15.8
(6.0)
Sacramento, CA 27.6
(5.1)
40.0*
(6.1)
37.6
(9.6)
41.3
(10.1)
9.6
(6.6)
35.9
(18.7)
51.2
(18.7)
29.2
(19.8)
11.7
(4.7)
25.8*
(6.4)
Washington, D.C. 69.6
(13.7)
58.6
(28.7)
65.1
(16.1)
87.2
(11.8) n/a n/a
83.0
(12.3)
91.7
(13.5) n/a n/a
Notes:
Numbers shown in parentheses ( ) represent the standard error of the estimate presented.
Question was asked of arrestees who said they bought drugs with cash in the past 30 days.
Differences between 2008 estimate and 2007 estimate are reported as significant at the .10 level (*), .05 level (**), or .01 levels (***).
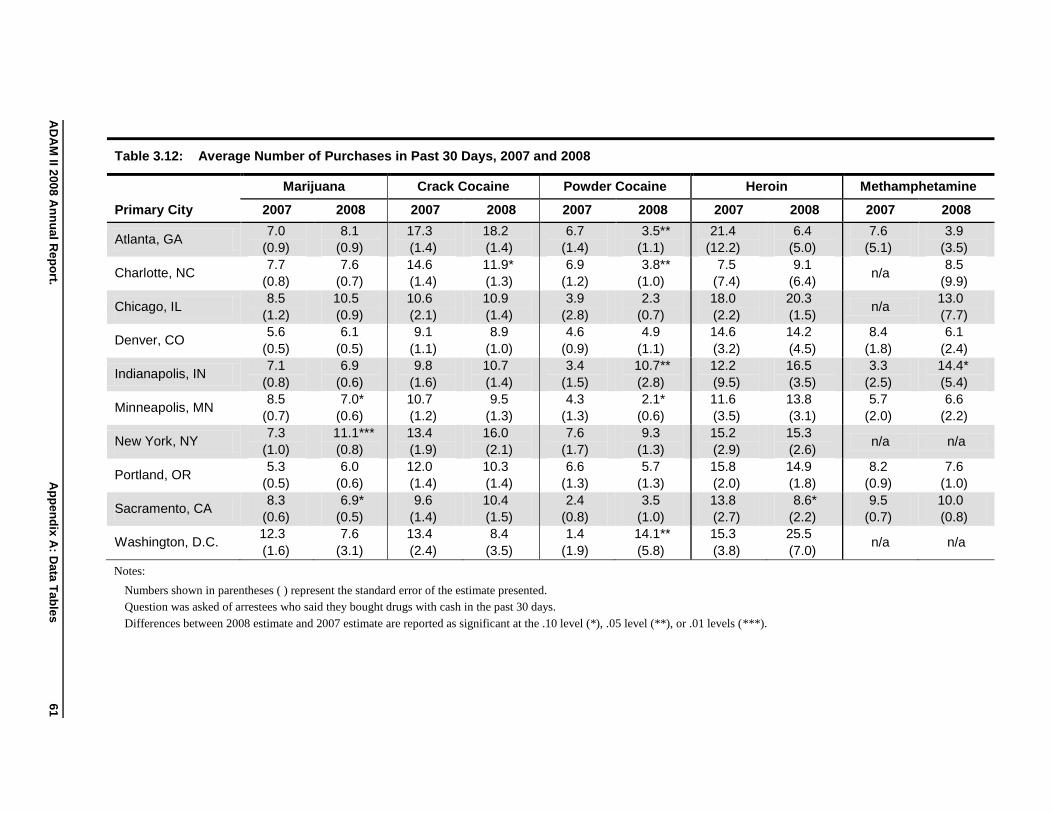
AD
AM
II 200
8 A
nn
ua
l Rep
ort.
Ap
pe
nd
ix A
: Da
ta T
ab
les
6
1
Table 3.12: Average Number of Purchases in Past 30 Days, 2007 and 2008
Marijuana Crack Cocaine Powder Cocaine Heroin Methamphetamine
Primary City 2007 2008 2007 2008 2007 2008 2007 2008 2007 2008
Atlanta, GA 7.0
(0.9)
8.1
(0.9)
17.3
(1.4)
18.2
(1.4)
6.7
(1.4)
3.5**
(1.1)
21.4
(12.2)
6.4
(5.0)
7.6
(5.1)
3.9
(3.5)
Charlotte, NC 7.7
(0.8)
7.6
(0.7)
14.6
(1.4)
11.9*
(1.3)
6.9
(1.2)
3.8**
(1.0)
7.5
(7.4)
9.1
(6.4) n/a
8.5
(9.9)
Chicago, IL 8.5
(1.2)
10.5
(0.9)
10.6
(2.1)
10.9
(1.4)
3.9
(2.8)
2.3
(0.7)
18.0
(2.2)
20.3
(1.5) n/a
13.0
(7.7)
Denver, CO 5.6
(0.5)
6.1
(0.5)
9.1
(1.1)
8.9
(1.0)
4.6
(0.9)
4.9
(1.1)
14.6
(3.2)
14.2
(4.5)
8.4
(1.8)
6.1
(2.4)
Indianapolis, IN 7.1
(0.8)
6.9
(0.6)
9.8
(1.6)
10.7
(1.4)
3.4
(1.5)
10.7**
(2.8)
12.2
(9.5)
16.5
(3.5)
3.3
(2.5)
14.4*
(5.4)
Minneapolis, MN 8.5
(0.7)
7.0*
(0.6)
10.7
(1.2)
9.5
(1.3)
4.3
(1.3)
2.1*
(0.6)
11.6
(3.5)
13.8
(3.1)
5.7
(2.0)
6.6
(2.2)
New York, NY 7.3
(1.0)
11.1***
(0.8)
13.4
(1.9)
16.0
(2.1)
7.6
(1.7)
9.3
(1.3)
15.2
(2.9)
15.3
(2.6) n/a n/a
Portland, OR 5.3
(0.5)
6.0
(0.6)
12.0
(1.4)
10.3
(1.4)
6.6
(1.3)
5.7
(1.3)
15.8
(2.0)
14.9
(1.8)
8.2
(0.9)
7.6
(1.0)
Sacramento, CA 8.3
(0.6)
6.9*
(0.5)
9.6
(1.4)
10.4
(1.5)
2.4
(0.8)
3.5
(1.0)
13.8
(2.7)
8.6*
(2.2)
9.5
(0.7)
10.0
(0.8)
Washington, D.C. 12.3
(1.6)
7.6
(3.1)
13.4
(2.4)
8.4
(3.5)
1.4
(1.9)
14.1**
(5.8)
15.3
(3.8)
25.5
(7.0) n/a n/a
Notes:
Numbers shown in parentheses ( ) represent the standard error of the estimate presented.
Question was asked of arrestees who said they bought drugs with cash in the past 30 days.
Differences between 2008 estimate and 2007 estimate are reported as significant at the .10 level (*), .05 level (**), or .01 levels (***).

62
Ap
pe
nd
ix A
: Da
ta T
ab
les
A
DA
M II 2
00
8 A
nn
ua
l Rep
ort.
Table 3.13: Percent Reporting Any Failed Drug Buy in the Past 30 Days, 2007 and 2008
Marijuana Crack Cocaine Powder Cocaine Heroin Methamphetamine
Primary City 2007 2008 2007 2008 2007 2008 2007 2008 2007 2008
Atlanta, GA 41.6
(6.2)
43.2
(6.6)
41.7
(7.1)
34.4
(7.3)
29.4
(11.8)
41.6
(17.5) n/a n/a n/a n/a
Charlotte, NC 34.2
(4.8)
37.8
(5.2)
25.5
(5.7)
32.7
(7.2)
32.8
(9.1)
47.3
(11.0) n/a
0.8
(1.2) n/a n/a
Chicago, IL 38.0
(6.4)
34.8
(6.1)
22.7
(7.4)
35.2
(7.9)
26.5
(18.7)
22.7
(25.4)
32.3
(9.6)
17.9
(7.0) n/a n/a
Denver, CO 33.5
(5.2)
24.7
(4.6)
31.0
(6.2)
28.7
(6.8)
22.6
(7.1)
21.5
(7.8)
10.3
(7.5)
0
(n/a)
12.8
(10.0)
22.5
(17.0)
Indianapolis, IN 42.6
(5.1)
42.1
(5.1)
46.4
(7.6)
35.2
(7.7)
23.3
(9.0)
19.0
(11.6)
39.0
(27.5)
26.2
(20.1) n/a n/a
Minneapolis, MN 40.2
(4.9)
39.0
(4.7)
31.1
(6.4)
25.3
(6.4)
29.0
(11.6)
17.9
(9.5)
70.5
(17.3)
31.5*
(20.1)
56.5
(17.6)
79.0
(17.1)
New York, NY 50.0
(5.5)
47.9
(5.3)
63.2
(7.8)
62.9
(9.6)
50.8
(9.6)
63.4
(9.2)
76.5
(9.3)
52.5
(13.1) n/a n/a
Portland, OR 31.9
(5.4)
29.8
(5.1)
48.8
(8.0)
46.6
(8.3)
40.1
(10.5)
47.0
(11.9)
15.6
(6.0)
21.8
(7.5)
39.5
(7.0)
46.9
(8.2)
Sacramento, CA 35.3
(5.2)
37.1
(5.6)
45.1
(9.6)
34.5
(8.9)
17.6
(10.5)
14.8
(9.6)
30.6
(13.7)
38.9
(21.1)
36.9
(6.2)
42.7
(6.7)
Washington, D.C. 66.4
(12.5)
71.8
(23.6)
27.9
(14.1)
10.8
(9.6) n/a n/a
6.8
(6.9)
42.3
(33.5) n/a n/a
Notes:
Numbers shown in parentheses ( ) represent the standard error of the estimate presented.
Question was asked of arrestees who said they bought drugs with cash in the past 30 days.
Differences between 2008 estimate and 2007 estimate are reported as significant at the .10 level (*), .05 level (**), or .01 levels (***).
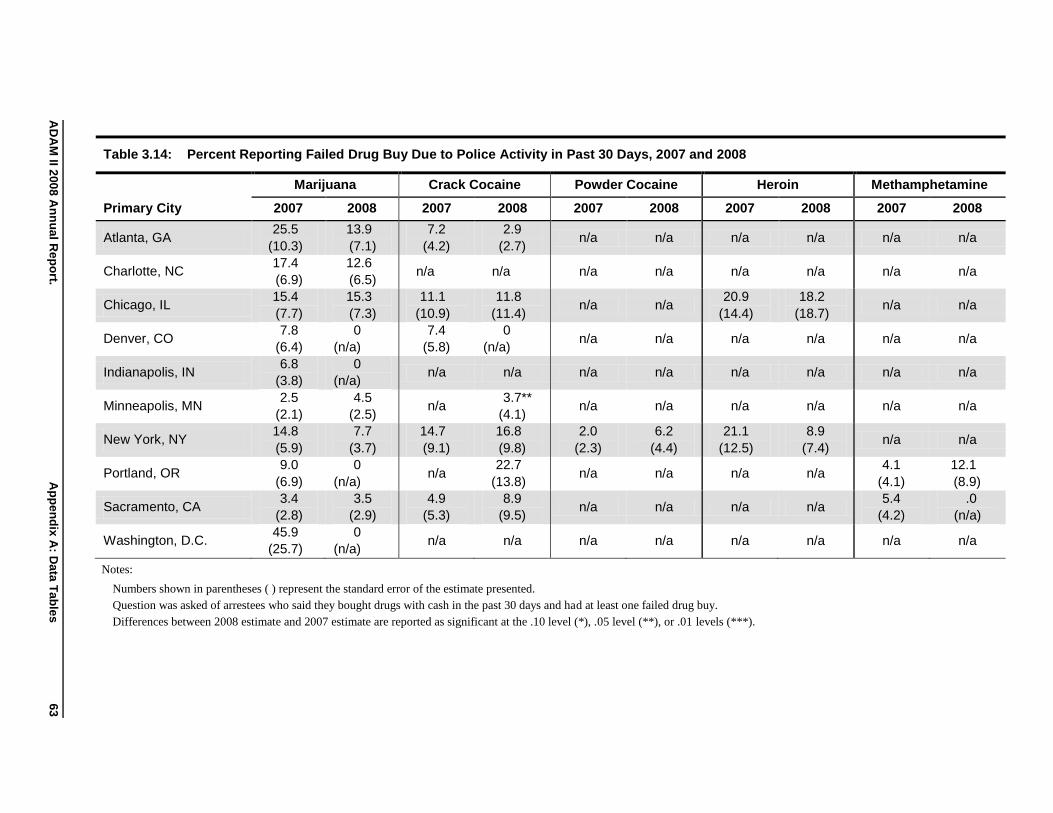
AD
AM
II 200
8 A
nn
ua
l Rep
ort.
Ap
pe
nd
ix A
: Da
ta T
ab
les
6
3
Table 3.14: Percent Reporting Failed Drug Buy Due to Police Activity in Past 30 Days, 2007 and 2008
Marijuana Crack Cocaine Powder Cocaine Heroin Methamphetamine
Primary City 2007 2008 2007 2008 2007 2008 2007 2008 2007 2008
Atlanta, GA 25.5
(10.3)
13.9
(7.1)
7.2
(4.2)
2.9
(2.7) n/a n/a n/a n/a n/a n/a
Charlotte, NC 17.4
(6.9)
12.6
(6.5) n/a n/a n/a n/a n/a n/a n/a n/a
Chicago, IL 15.4
(7.7)
15.3
(7.3)
11.1
(10.9)
11.8
(11.4) n/a n/a
20.9
(14.4)
18.2
(18.7) n/a n/a
Denver, CO 7.8
(6.4)
0
(n/a)
7.4
(5.8)
0
(n/a) n/a n/a n/a n/a n/a n/a
Indianapolis, IN 6.8
(3.8)
0
(n/a) n/a n/a n/a n/a n/a n/a n/a n/a
Minneapolis, MN 2.5
(2.1)
4.5
(2.5) n/a
3.7**
(4.1) n/a n/a n/a n/a n/a n/a
New York, NY 14.8
(5.9)
7.7
(3.7)
14.7
(9.1)
16.8
(9.8)
2.0
(2.3)
6.2
(4.4)
21.1
(12.5)
8.9
(7.4) n/a n/a
Portland, OR 9.0
(6.9)
0
(n/a) n/a
22.7
(13.8) n/a n/a n/a n/a
4.1
(4.1)
12.1
(8.9)
Sacramento, CA 3.4
(2.8)
3.5
(2.9)
4.9
(5.3)
8.9
(9.5) n/a n/a n/a n/a
5.4
(4.2)
.0
(n/a)
Washington, D.C. 45.9
(25.7)
0
(n/a) n/a n/a n/a n/a n/a n/a n/a n/a
Notes:
Numbers shown in parentheses ( ) represent the standard error of the estimate presented.
Question was asked of arrestees who said they bought drugs with cash in the past 30 days and had at least one failed drug buy.
Differences between 2008 estimate and 2007 estimate are reported as significant at the .10 level (*), .05 level (**), or .01 levels (***).

64
Ap
pe
nd
ix A
: Da
ta T
ab
les
A
DA
M II 2
00
8 A
nn
ua
l Rep
ort.
Table 3.15: Percent Reporting Failed Drug Buy Due to Unavailability of Drug in Past 30 Days, 2007 and 2008
Marijuana Crack Cocaine Powder Cocaine Heroin Methamphetamine
Primary City 2007 2008 2007 2008 2007 2008 2007 2008 2007 2008
Atlanta, GA 15.4
(6.4)
21.6
(8.7) n/a n/a
30.9
(22.8)
20.1
(21.8) n/a n/a n/a n/a
Charlotte, NC 60.0
(8.3)
37.6**
(9.5)
2.5
(1.3)
2.2
(1.1)
26.8
(16.0)
36.8
(22.5) n/a n/a n/a n/a
Chicago, IL 11.1
(7.7)
9.8
(6.9)
37.0
(17.6)
7.4
(7.6) n/a n/a
10.9
(9.8)
30.6
(25.6) n/a n/a
Denver, CO 44.1
(9.8)
49.4
(12.0)
46.0
(13.0)
41.0
(15.3)
64.6
(19.5)
23.3*
(19.5) n/a n/a
37.9
(40.0) n/a
Indianapolis, IN 11.0
(4.5)
22.6
(6.8)
40.9
(13.9)
24.6
(17.0)
26.9
(21.8)
24.7
(31.5) n/a n/a n/a n/a
Minneapolis, MN 22.1
(6.7)
24.7
(7.0)
5.4
(4.4)
10.8
(9.6) n/a n/a n/a n/a
0.2
(0.4)
.0
(n/a)
New York, NY 16.8
(7.2)
25.7
(7.3)
13.9
(10.1)
50.1*
(17.9)
6.8
(5.4)
42.4**
(15.3)
22.4
(19.3)
46.0
(23.4) n/a n/a
Portland, OR 27.3
(9.3)
27.5
(9.8)
27.5
(11.7)
8.4
(6.6)
24.2
(15.4)
14.1
(12.9)
15.6
(15.1)
30.0
(20.1)
37.8
(12.1)
18.1
(10.7)
Sacramento, CA 26.6
(7.9)
21.1
(8.0)
19.9
(12.2)
11.4
(8.8)
44.8
(36.6)
10.7
(19.8)
19.2
(25.3)
46.3
(44.9)
25.0
(8.7)
29.9
(9.2)
Washington, D.C. n/a n/a n/a n/a n/a n/a n/a n/a n/a n/a
Notes:
Numbers shown in parentheses ( ) represent the standard error of the estimate presented.
Question was asked of arrestees who said they bought drugs with cash in the past 30 days and had at least one failed drug buy.
Differences between 2008 estimate and 2007 estimate are reported as significant at the .10 level (*), .05 level (**), or .01 levels (***).
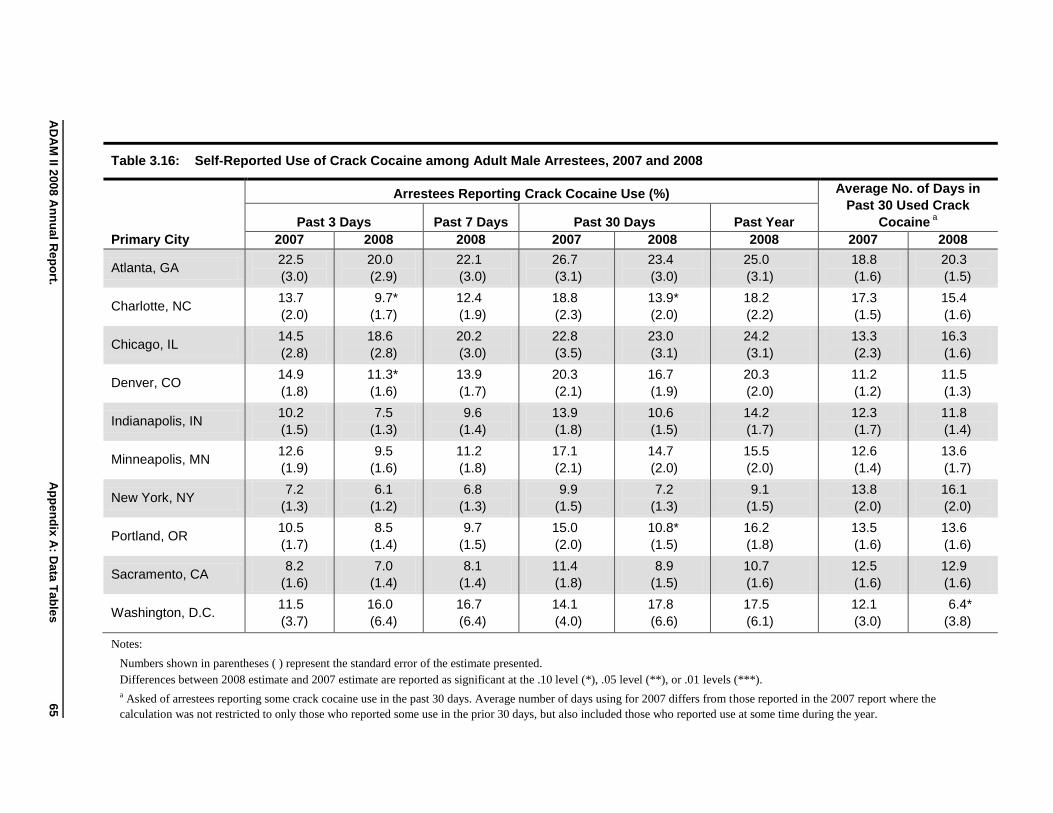
AD
AM
II 200
8 A
nn
ua
l Rep
ort.
Ap
pe
nd
ix A
: Da
ta T
ab
les
6
5
Table 3.16: Self-Reported Use of Crack Cocaine among Adult Male Arrestees, 2007 and 2008
Arrestees Reporting Crack Cocaine Use (%) Average No. of Days in
Past 30 Used Crack
Cocaine a
Past 3 Days Past 7 Days Past 30 Days Past Year
Primary City 2007 2008 2008 2007 2008 2008 2007 2008
Atlanta, GA 22.5
(3.0)
20.0
(2.9)
22.1
(3.0)
26.7
(3.1)
23.4
(3.0)
25.0
(3.1)
18.8
(1.6)
20.3
(1.5)
Charlotte, NC 13.7
(2.0)
9.7*
(1.7)
12.4
(1.9)
18.8
(2.3)
13.9*
(2.0)
18.2
(2.2)
17.3
(1.5)
15.4
(1.6)
Chicago, IL 14.5
(2.8)
18.6
(2.8)
20.2
(3.0)
22.8
(3.5)
23.0
(3.1)
24.2
(3.1)
13.3
(2.3)
16.3
(1.6)
Denver, CO 14.9
(1.8)
11.3*
(1.6)
13.9
(1.7)
20.3
(2.1)
16.7
(1.9)
20.3
(2.0)
11.2
(1.2)
11.5
(1.3)
Indianapolis, IN 10.2
(1.5)
7.5
(1.3)
9.6
(1.4)
13.9
(1.8)
10.6
(1.5)
14.2
(1.7)
12.3
(1.7)
11.8
(1.4)
Minneapolis, MN 12.6
(1.9)
9.5
(1.6)
11.2
(1.8)
17.1
(2.1)
14.7
(2.0)
15.5
(2.0)
12.6
(1.4)
13.6
(1.7)
New York, NY 7.2
(1.3)
6.1
(1.2)
6.8
(1.3)
9.9
(1.5)
7.2
(1.3)
9.1
(1.5)
13.8
(2.0)
16.1
(2.0)
Portland, OR 10.5
(1.7)
8.5
(1.4)
9.7
(1.5)
15.0
(2.0)
10.8*
(1.5)
16.2
(1.8)
13.5
(1.6)
13.6
(1.6)
Sacramento, CA 8.2
(1.6)
7.0
(1.4)
8.1
(1.4)
11.4
(1.8)
8.9
(1.5)
10.7
(1.6)
12.5
(1.6)
12.9
(1.6)
Washington, D.C. 11.5
(3.7)
16.0
(6.4)
16.7
(6.4)
14.1
(4.0)
17.8
(6.6)
17.5
(6.1)
12.1
(3.0)
6.4*
(3.8)
Notes:
Numbers shown in parentheses ( ) represent the standard error of the estimate presented.
Differences between 2008 estimate and 2007 estimate are reported as significant at the .10 level (*), .05 level (**), or .01 levels (***).
a Asked of arrestees reporting some crack cocaine use in the past 30 days. Average number of days using for 2007 differs from those reported in the 2007 report where the
calculation was not restricted to only those who reported some use in the prior 30 days, but also included those who reported use at some time during the year.

66
Ap
pe
nd
ix A
: Da
ta T
ab
les
A
DA
M II 2
00
8 A
nn
ua
l Rep
ort.
Table 3.17: Self-Reported Use of Powder Cocaine among Adult Male Arrestees, 2007 and 2008
Arrestees Reporting Powder Cocaine Use (%) Average No. of Days in
Past 30 Used Powder
Cocaine a
Past 3 Days Past 7 Days Past 30 Days Past Year
Primary City 2007 2008 2008 2007 2008 2008 2007 2008
Atlanta, GA 5.4
(1.6)
2.2**
(0.8)
4.6
(1.3)
9.0
(2.0)
8.2
(1.9)
13.1
(2.4)
7.4
(1.9)
5.7
(2.0)
Charlotte, NC 5.2
(1.3)
4.1
(1.1)
6.9
(1.4)
11.6
(2.0)
10.1
(1.8)
16.3
(2.2)
10.4
(1.6)
6.9**
(1.4)
Chicago, IL 2.5
(1.5)
0.9
(0.7)
1.7
(1.0)
5.4
(1.9)
2.9
(1.2)
7.2
(1.8)
6.1
(3.6)
5.4
(1.4)
Denver, CO 8.4
(1.5)
6.7
(1.3)
8.5
(1.4)
14.1
(1.8)
10.4*
(1.5)
17.6
(2.0)
5.7
(1.1)
7.1
(1.4)
Indianapolis, IN 3.1
(0.9)
1.2**
(0.5)
2.1
(0.7)
6.5
(1.3)
3.2**
(0.8)
9.0
(1.5)
4.7
(1.9)
7.7
(2.3)
Minneapolis, MN 1.5
(0.6)
1.0
(0.4)
2.2
(0.8)
6.3
(1.3)
6.0
(1.4)
10.2
(1.7)
7.1
(1.7)
2.9***
(0.7)
New York, NY 5.7
(1.2)
4.9
(1.1)
6.7
(1.2)
8.3
(1.4)
7.2
(1.2)
11.1
(1.6)
8.0
(2.0)
9.6
(1.5)
Portland, OR 6.9
(1.4)
2.5***
(0.8)
5.1
(1.1)
11.4
(1.8)
8.3
(1.4)
14.2
(1.7)
7.2
(1.7)
5.2
(1.1)
Sacramento, CA 4.5
(1.3)
1.2***
(0.5)
2.5
(0.8)
7.2
(1.5)
4.7
(1.1)
7.4
(1.3)
5.1
(1.5)
6.0
(1.8)
Washington, D.C. 3.4
(2.5)
3.1
(2.5)
3.4
(2.5)
5.2
(3.0)
3.1
(2.3)
4.1
(2.5)
18.5
(6.2)
3.3**
(7.6)
Notes:
Numbers shown in parentheses ( ) represent the standard error of the estimate presented.
Differences between 2008 estimate and 2007 estimate are reported as significant at the .10 level (*), .05 level (**), or .01 levels (***).
a Asked of arrestees reporting some powder cocaine use in the past 30 days. Average number of days using for 2007 differs from those reported in the 2007 report where the
calculation was not restricted to only those who reported some use in the prior 30 days, but also included those who reported use at some time during the year.
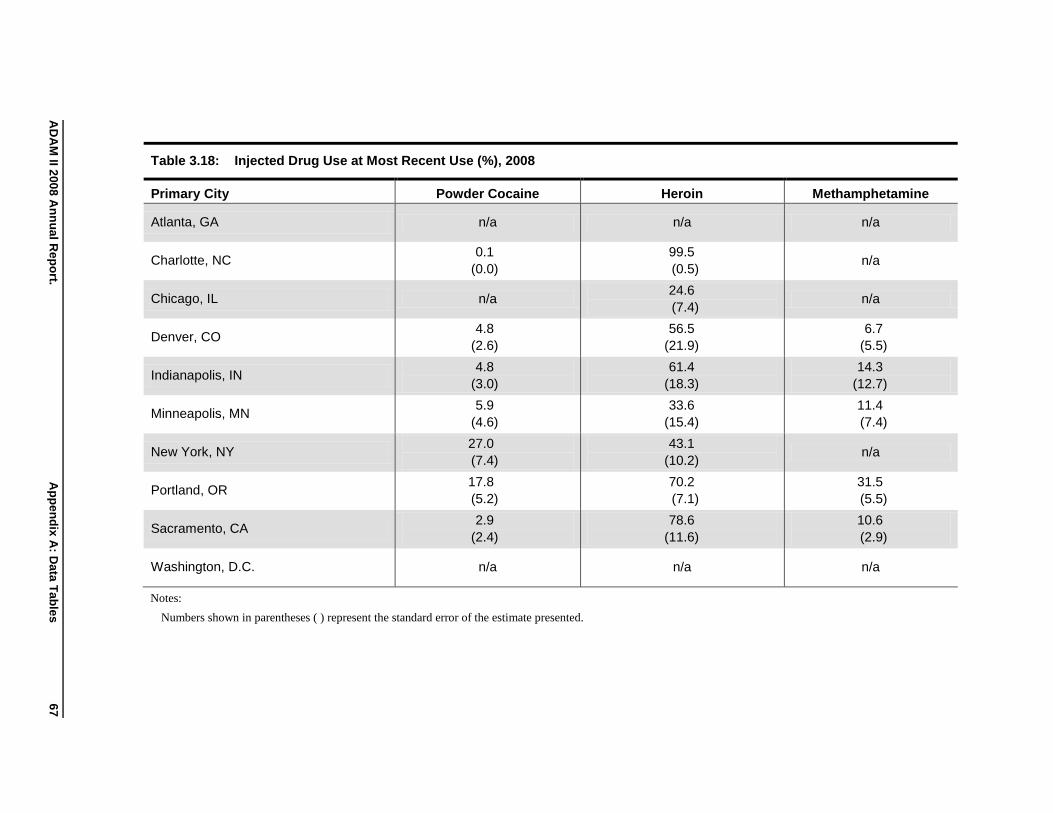
AD
AM
II 200
8 A
nn
ua
l Rep
ort.
Ap
pe
nd
ix A
: Da
ta T
ab
les
6
7
Table 3.18: Injected Drug Use at Most Recent Use (%), 2008
Primary City Powder Cocaine Heroin Methamphetamine
Atlanta, GA n/a n/a n/a
Charlotte, NC 0.1
(0.0)
99.5
(0.5) n/a
Chicago, IL n/a 24.6
(7.4) n/a
Denver, CO 4.8
(2.6)
56.5
(21.9)
6.7
(5.5)
Indianapolis, IN 4.8
(3.0)
61.4
(18.3)
14.3
(12.7)
Minneapolis, MN 5.9
(4.6)
33.6
(15.4)
11.4
(7.4)
New York, NY 27.0
(7.4)
43.1
(10.2) n/a
Portland, OR 17.8
(5.2)
70.2
(7.1)
31.5
(5.5)
Sacramento, CA 2.9
(2.4)
78.6
(11.6)
10.6
(2.9)
Washington, D.C. n/a n/a n/a
Notes:
Numbers shown in parentheses ( ) represent the standard error of the estimate presented.

68
Ap
pe
nd
ix A
: Da
ta T
ab
les
A
DA
M II 2
00
8 A
nn
ua
l Rep
ort.
Table 3.19: Self-Reported Use of Heroin Among Adult Male Arrestees, 2007 and 2008
Arrestees Reporting Heroin Use (%) Average No. of Days in
Past 30 Used Heroin a
Past 3 Days Past 7 Days Past 30 Days Past Year
Primary City 2007 2008 2008 2007 2008 2008 2007 2008
Atlanta, GA 0.5
(0.3)
0.5
(0.4)
1.1
(0.9)
0.3
(0.3)
0.5
(0.4)
1.5
(0.8)
22.0
(13.8)
10.1
(9.5)
Charlotte, NC 0.3
(0.3)
0.6
(0.4)
0.4
(0.3)
0.7
(0.5)
0.6
(0.4)
2.2
(0.8)
16.9
(9.5)
14.4
(7.6)
Chicago, IL 18.9
(3.2)
23.3
(3.2)
24.4
(3.2)
20.6
(3.3)
24.8
(3.2)
26.7
(3.2)
23.0
(2.2)
25.8
(1.3)
Denver, CO 3.1
(0.9)
1.0**
(0.4)
1.3
(0.5)
3.3
(0.9)
1.5*
(0.5)
2.0*
(0.6)
16.7
(3.2)
14.8
(4.6)
Indianapolis, IN 0.7
(0.4)
0.9
(0.4)
1.0
(0.4)
1.3
(0.6)
1.2
(0.5)
1.8
(0.6)
14.4
(6.2)
18.3
(4.8)
Minneapolis, MN 1.4
(0.6)
2.6
(0.8)
2.7
(0.8)
2.2
(0.7)
2.9
(0.9)
4.0
(1.0)
14.1
(4.1)
19.4
(3.4)
New York, NY 3.3
(0.8)
3.4
(1.0)
4.3
(1.1)
5.5
(1.2)
5.5
(1.2)
7.6
(1.4)
13.8
(2.7)
15.6
(2.4)
Portland, OR 7.8
(1.4)
6.5
(1.2)
7.6
(1.3)
9.4
(1.5)
7.7
(1.3)
10.2
(1.5)
17.9
(2.2)
20.3
(2.0)
Sacramento, CA 2.1
(0.8)
1.5
(0.6)
1.8
(0.7)
2.7
(0.8)
2.1
(0.7)
2.9
(0.8)
20.2
(3.4)
14.1
(3.3)
Washington, D.C. 11.8
(4.4)
4.3
(2.6)
4.5
(2.6)
12.5
(4.5)
4.4*
(2.6)
4.3
(2.4)
18.5
(4.2)
21.4
(8.3)
Notes:
Numbers shown in parentheses ( ) represent the standard error of the estimate presented.
Differences between 2008 estimate and 2007 estimate are reported as significant at the .10 level (*), .05 level (**), or .01 levels (***).
a Asked of arrestees reporting some heroin use in the past 30 days. Average number of days using for 2007 differs from those reported in the 2007 report where the
calculation was not restricted to only those who reported some use in the prior 30 days, but also included those who reported use at some time during the year.

AD
AM
II 200
8 A
nn
ua
l Rep
ort.
AD
AM
II Pro
gra
m
69
Table 3.20: Self-Reported Use of Methamphetamine Among Adult Male Arrestees, 2007 and 2008
Arrestees Reporting Methamphetamine Use (%) Average No. of Days in
Past 30 Used
Methamphetamine a
Past 3 Days Past 7 Days Past 30 Days Past Year
Primary City 2007 2008 2008 2007 2008 2008 2007 2008
Atlanta, GA n/a n/a 0.1
(0.1)
1.3
(0.7)
0.1*
(0.1)
0.6
(0.4)
8.4
(5.7)
3.8
(3.7)
Charlotte, NC n/a n/a n/a 0.3
(0.4)
0.4
(0.4)
0.8
(0.5) n/a
29.7
(7.6)
Chicago, IL n/a n/a n/a 0
(n/a)
0
(n/a)
0.3
(0.3) n/a
3.7
(14.1)
Denver, CO 3.3
(0.9)
1.6
(0.6)
2.2
(0.7)
5.1
(1.2)
3.0
(0.9)
4.8
(1.1)
11.6
(2.4)
7.7
(2.7)
Indianapolis, IN 0.9
(0.4)
0.4
(0.2)
0.6
(0.3)
2.1
(0.8)
1.0
(0.5)
2.5
(0.7)
9.8
(4.0)
8.9
(4.4)
Minneapolis, MN 2.9
(1.0)
2.0
(0.7)
2.5
(0.9)
3.7
(1.0)
3.0
(0.9)
4.3
(1.0)
10.2
(2.7)
15.4
(3.6)
New York, NY 0.3
(0.3)
0
(n/a)
.0
(n/a)
0.8
(0.7)
0.2
(0.3)
0.5
(0.4)
3.2
(23.8) n/a
Portland, OR 16.7
(2.1)
9.5***
(1.5)
12.1
(1.6)
22.4
(2.2)
13.7***
(1.6)
19.2
(1.9)
14.7
(1.2)
12.8
(1.3)
Sacramento, CA 22.3
(2.4)
19.0
(2.1)
23.9
(2.3)
28.9
(2.6)
25.6
(2.3)
29.5
(2.4)
16.2
(1.0)
15.0
(1.1)
Washington, D.C. n/a n/a n/a n/a n/a n/a n/a n/a
Notes:
Numbers shown in parentheses ( ) represent the standard error of the estimate presented.
Differences between 2008 estimate and 2007 estimate are reported as significant at the .10 level (*), .05 level (**), or .01 levels (***).
a Asked of arrestees reporting some methamphetamine use in the past 12 months. Average number of days using for 2007 differs from those reported in the 2007 report where the
calculation was not restricted to only those who reported some use in the prior 30 days, but also included those who reported use at some time during the year.

70
Ap
pe
nd
ix A
: Da
ta T
ab
les
A
DA
M II 2
00
8 A
nn
ua
l Rep
ort.
Table 3.21: Percent Testing Positive for Other Drugs, 2007 and 2008
Barbiturates Darvon Methadone Oxycodonea PCP Valium
Primary City 2007 2008 2007 2008 2007 2008 2007 2008 2007 2008 2007 2008
Atlanta, GA 23.9
(16.6)
28.9
(15.3) n/a n/a n/a n/a
0.0
(n/a)
0.0
(n/a) n/a n/a
1.2
(0.9)
0.9
(0.6)
Charlotte, NC n/a n/a n/a n/a 0.5
(0.5)
0.6
(0.4)
0.7
0.4
0.6
0.3 n/a n/a
3.3
(1.4)
4.7
(1.4)
Chicago, IL 0.0
(0.0)
0
(n/a) n/a n/a
5.6
(2.1)
2.9
(1.2)
0.0
(n/a)
0.0
(n/a)
2.0
(1.5)
1.4
(1.1)
1.6
(1.3)
4.0
(1.6)
Denver, CO 0.4
(0.4)
0
(n/a)
0.4
(0.4)
0.2
(0.2)
0.3
(0.3)
1.0
(0.5)
0.7
0.4
1.2
0.5 n/a n/a
4.0
(1.0)
6.0
(1.2)
Indianapolis, IN n/a n/a 0.8
(0.4)
0.9
(0.5)
1.1
(0.7)
0.2
(0.2)
1.3
0.6
1.1
0.4
0.1
(0.1)
0
(n/a)
7.5
(1.5)
9.0
(1.7)
Minneapolis, MN n/a n/a 0.3
(0.2)
0.1
(0.2)
1.5
(0.7)
0.8
(0.5)
1.2
0.5
1.4
0.6
1.4
(0.8)
0.3
(0.3)
2.5
(1.0)
4.1
(1.3)
New York, NY n/a 0.7
(0.7) n/a n/a
4.3
(1.3)
6.7
(1.4)
0.7
0.5
0.4
0.3
0.7
(0.5)
0.8
(0.5)
2.5
(1.1)
5.2
(1.5)
Portland, OR n/a n/a n/a n/a 3.4
(1.1)
1.3*
(0.5)
2.4
0.7
0.6
0.3 n/a
0
(n/a)
0.4
(0.4)
2.9***
(0.8)
Sacramento, CA 0.1
(0.1)
0
(n/a)
0.2
(0.1)
0.5
(0.3)
0.8
(0.5)
0.5
(0.3)
0.5
0.3
2.6
0.9 n/a
0.2
(0.2)
1.5
(0.6)
2.5
(0.9)
Washington, D.C. n/a n/a n/a n/a 4.5
(2.9)
1.1
(1.3)
0.9
0.9
0.0
(n/a)
3.7
(2.4)
0
(n/a) n/a n/a
Notes:
Numbers shown in parentheses ( ) represent the standard error of the estimate presented.
Differences between 2008 estimate and 2007 estimate are reported as significant at the .10 level (*), .05 level (**), or .01 levels (***).
a Oxycodone estimates are weighted, but not annualized since testing for this drug was not conducted in earlier years.

AD
AM
II 200
8 A
nn
ua
l Rep
ort.
AD
AM
II Pro
gra
m
71
Table 3.22: Percent Admitting to Secondary Drug Use in the Past 3 Days, 2008
Primary City Methadone
Amphet-
amine Barbiturates
Tranquil-
izers
Opiate
Painkillers Darvon Demerol
Ecstasy /
MDMA PCP
LSD /
Acid
Other
Hallucingen Inhalant
Anti-
Depressant
Other
Drug
Atlanta, GA n/a n/a n/a n/a 3.6
(1.2) n/a n/a
3.3
(1.8) n/a n/a n/a n/a
1.5
(0.7)
3.8
(1.3)
Charlotte, NC n/a 0.4
(0.4) n/a
4.7
(1.4)
5.4
(1.4) n/a
0.6
(0.5)
3.1
(1.3) n/a n/a
31.4
(14.9) n/a
2.7
(0.9)
8.7
(1.7)
Chicago, IL 2.2
(1.1)
0.0
(0.0) n/a
3.1
(1.5)
8.8
(2.6) n/a n/a
0.4
(0.4) n/a n/a n/a n/a
2.0
(1.0)
6.3
(1.9)
Denver, CO 1.3
(0.7)
0.2
(0.2) n/a
2.1
(0.8)
6.8
(1.3) n/a n/a
0.8
(0.4) n/a n/a n/a n/a
1.9
(0.6)
11.9
(1.7)
Indianapolis, IN 0.7
(0.4) n/a
0.6
(0.5)
9.4
(1.8)
10.7
(1.7)
0.3
(0.3)
0.2
(0.2)
0.9
(0.4) n/a
0.3
(0.3) n/a n/a
4.9
(1.3)
6.4
(1.4)
Minneapolis, MN 1.5
(0.7)
0.2
(0.2) n/a
3.4
(1.2)
10.1
(1.8) n/a n/a
2.2
(0.8) n/a n/a
0.7
(0.5) n/a
7.7
(1.7)
10.1
(1.8)
New York, NY 5.9
(1.4)
0.7
(0.6)
0.3
(0.3)
4.3
(1.6)
3.1
(1.0)
1.4
(1.0) n/a
1.8
(0.9)
0.3
(0.2) n/a n/a n/a
1.6
(0.7)
2.9
(0.9)
Portland, OR 2.0
(0.7)
1.3
(0.5)
0.1
(0.1)
2.9
(0.9)
10.2
(1.6) n/a
0.1
(0.1)
1.1
(0.6) n/a
0.5
(0.5)
0.8
(0.5)
2.5
(1.6)
3.8
(1.0)
8.3
(1.4)
Sacramento, CA 0.5
(0.3)
1.7
(1.0) n/a
3.4
(1.0)
10.9
(1.7)
0.4
(0.4) n/a
1.8
(0.7)
0.2
(0.2) n/a n/a
1.1
(0.8)
4.5
(1.1)
14.8
(2.0)
Washington, D.C. n/a n/a n/a n/a 5.8
(4.3) n/a n/a
36.7
(16.5)
0.9
(0.9) n/a n/a n/a n/a n/a
Notes:
Numbers shown in parentheses ( ) represent the standard error of the estimate presented.

72
Ap
pe
nd
ix A
: Da
ta T
ab
les
A
DA
M II 2
00
8 A
nn
ua
l Rep
ort.

ADAM II 2008 Annual Report Appendix B: ADAM II Program Methodology 73
Appendix B
ADAM II Program Methodology
In the fall of 2006, ten sites were selected to participate in the ADAM II initiative. The ten sites were
selected to provide:
Geographic spread, as trends in drug use tend to be regional;
A focus on counties east of the Mississippi to monitor the emergence of methamphetamine
use; and
Consistent, biannual data collection points to support statistical trend analysis.
All of the former ADAM sites were considered, focusing on those that were more likely to meet the
goals of the ADAM II program. Factors that were considered when making this determination
included the complexity of the site’s sampling plan (with a preference for single facility sampling
designs) and past performance participating in the ADAM program (e.g., consistent high quality data
collection over an adequate period of time for trend development, quality of the census data provided
for weighting). The selection process was also driven by ONDCP’s interest in monitoring the
emergence of methamphetamine use and was, therefore, biased toward counties east of the
Mississippi.
A site did not need to meet all of the above criteria to be considered, but had to meet at least the
majority. Table B.1 provides information on selection criteria for each of the final ten sites.
The 10 sites from 2007 continued into data collection in 2008.
Site Sampling
ADAM II comprises a non-probability sample of 10 counties and a probability sample of arrestees
booked into jails within those counties. Consequently, program data are not generalizable to the
Nation as a whole or to any specific region in which the sites sit; however, the study is designed so
that each county’s data represents all adult male arrestees booked in that county during the data
collection period.
Sampling Within a County. The standard catchment area for each site is the county, although the
sites are referred to by the largest city in that geographic region. Within each site, the number of
booking facilities and the manner in which arrestees are moved from arrest to arraignment to holding
varies.

74 Appendix B: ADAM II Program Methodology ADAM II 2008 Annual Report
Table B.1: ADAM II Site Selection Criteria
Site Name
Annual Arrests per
1,000 Residents
29
Number of Male
Booking Facilities
Number of Booking
Facilities in Sampling
Plan Sampling
Design
Number of quarters of ADAM Data Collection
(2000-2003)
Census Data
Format
Charlotte 40.8 1 1 Single 10 Electronic
Indianapolis 65.8 1 1 Single 15 Electronic
Chicago 463.3 12 3 Stratified Cluster
9 Electronic
Minneapolis 24.8 17 1 Stratified 14 Electronic
New York 183.8 2 1 Stratified 15 Electronic
Atlanta 74.6 2 2 Stratified 9 Unknown
Washington DC Not Reported 7 4 Stratified Cluster
6 Unknown
Denver 171.9 1 1 Single 15 Paper
Sacramento 61.3 1 1 Single 15 Electronic
Portland 44.0 1 1 Single 15 Electronic
In some cases, regardless of arresting agency, all bookings in the county take place in a single jail,
while in other counties bookings may take place in multiple facilities across the county. Table B.1
identifies the number of booking facilities in each of the ADAM II sites. Sampling plans are
designed based on whether the site has a single or multiple booking facilities.
Many ADAM II counties have a single jail where all arrestees arrested in the county are brought to be
booked pending further processing. Some ADAM II counties, however, book in multiple jails. In
these cases, each jail constitutes a stratum, and the result is a stratified random sample. However,
resource constraints dictate that in some instances small booking facilities have to be excluded from
the sample. For example, the Hennepin County (Minneapolis) sample does not include small
suburban facilities and is restricted to the central Minneapolis jail where the majority of arrestees are
transferred and/or initially booked; similarly, the Manhattan sample is restricted to the large central
booking facility downtown (Manhattan House of Detention). In both cases, the included jail captures
the overwhelming majority of the county bookings.30
In Cook County (Chicago) the sample is
29
Based on male arrest figures in 2003 UCR, except in Chicago (2001) and New York (2001).
30 It would have been possible to sample small jails and station interviewers in those facilities to provide
representation for arrestees who do not appear in the included jails. However, so few arrestees are booked
into the small jails that interviewers would spend most of their time waiting for arrivals. The resulting
sample from the small jails would have a sampling variance that was so large that the small-jail estimate
could not add appreciable information to a sample based exclusively on the large jail. A second jail in
Manhattan was eliminated because it has a specialized caseload of public nuisance crimes and was
excluded during 2002 and 2003 by ADAM.
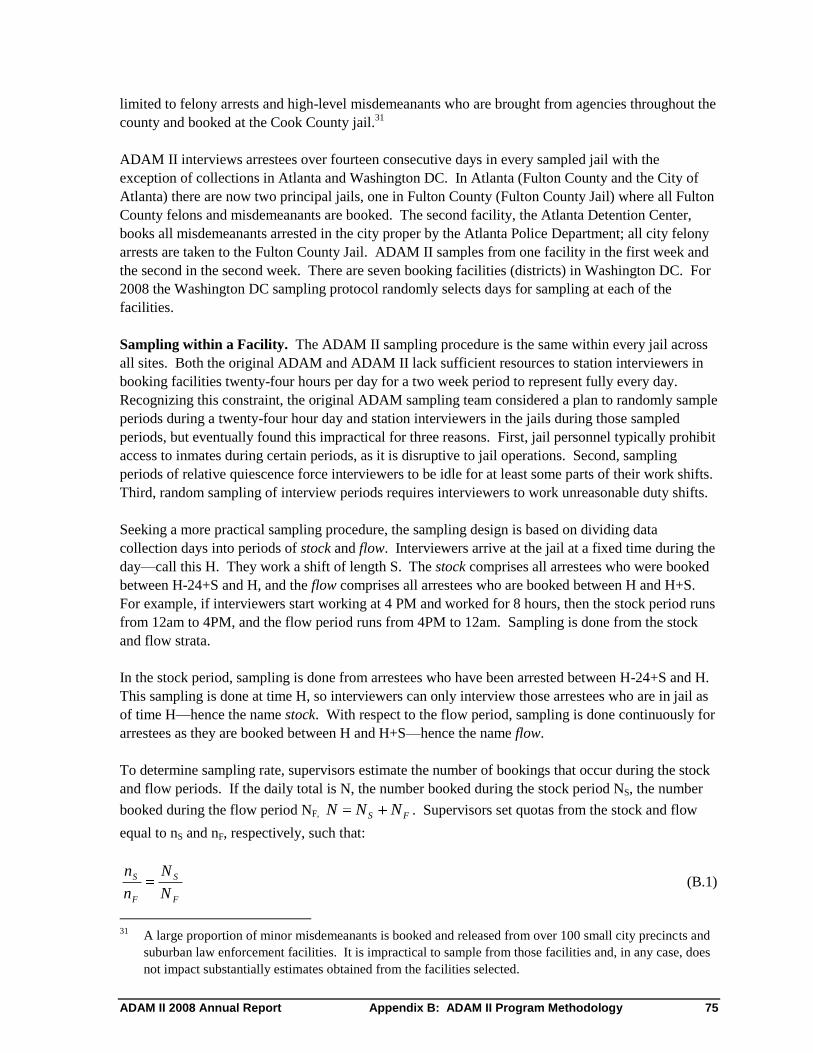
ADAM II 2008 Annual Report Appendix B: ADAM II Program Methodology 75
limited to felony arrests and high-level misdemeanants who are brought from agencies throughout the
county and booked at the Cook County jail.31
ADAM II interviews arrestees over fourteen consecutive days in every sampled jail with the
exception of collections in Atlanta and Washington DC. In Atlanta (Fulton County and the City of
Atlanta) there are now two principal jails, one in Fulton County (Fulton County Jail) where all Fulton
County felons and misdemeanants are booked. The second facility, the Atlanta Detention Center,
books all misdemeanants arrested in the city proper by the Atlanta Police Department; all city felony
arrests are taken to the Fulton County Jail. ADAM II samples from one facility in the first week and
the second in the second week. There are seven booking facilities (districts) in Washington DC. For
2008 the Washington DC sampling protocol randomly selects days for sampling at each of the
facilities.
Sampling within a Facility. The ADAM II sampling procedure is the same within every jail across
all sites. Both the original ADAM and ADAM II lack sufficient resources to station interviewers in
booking facilities twenty-four hours per day for a two week period to represent fully every day.
Recognizing this constraint, the original ADAM sampling team considered a plan to randomly sample
periods during a twenty-four hour day and station interviewers in the jails during those sampled
periods, but eventually found this impractical for three reasons. First, jail personnel typically prohibit
access to inmates during certain periods, as it is disruptive to jail operations. Second, sampling
periods of relative quiescence force interviewers to be idle for at least some parts of their work shifts.
Third, random sampling of interview periods requires interviewers to work unreasonable duty shifts.
Seeking a more practical sampling procedure, the sampling design is based on dividing data
collection days into periods of stock and flow. Interviewers arrive at the jail at a fixed time during the
day—call this H. They work a shift of length S. The stock comprises all arrestees who were booked
between H-24+S and H, and the flow comprises all arrestees who are booked between H and H+S.
For example, if interviewers start working at 4 PM and worked for 8 hours, then the stock period runs
from 12am to 4PM, and the flow period runs from 4PM to 12am. Sampling is done from the stock
and flow strata.
In the stock period, sampling is done from arrestees who have been arrested between H-24+S and H.
This sampling is done at time H, so interviewers can only interview those arrestees who are in jail as
of time H—hence the name stock. With respect to the flow period, sampling is done continuously for
arrestees as they are booked between H and H+S—hence the name flow.
To determine sampling rate, supervisors estimate the number of bookings that occur during the stock
and flow periods. If the daily total is N, the number booked during the stock period NS, the number
booked during the flow period NF, FS NNN . Supervisors set quotas from the stock and flow
equal to nS and nF, respectively, such that:
F
S
F
S
N
N
n
n (B.1)
31
A large proportion of minor misdemeanants is booked and released from over 100 small city precincts and
suburban law enforcement facilities. It is impractical to sample from those facilities and, in any case, does
not impact substantially estimates obtained from the facilities selected.

76 Appendix B: ADAM II Program Methodology ADAM II 2008 Annual Report
The actual sample size (n=nS+nF) depends on the number of interviewers and sometimes (for smaller
jails) the number of bookings; N=NS+NF since n cannot exceed N.
The supervisor sorts arrestees who are booked into the jail during the stock period and forms ns of
equal sized strata based on that ordering. Sampling is systematic within each stratum: nS+1, nS+2,
etc. If the sampled arrestee is unavailable or unwilling to participate, the supervisor selects the
nearest neighbor—meaning the arrestees whose booking time occurs immediately after the arrestee
who was unavailable or had declined to be interviewed. This replacement continues until the quota is
filled.
During the flow period, the supervisor selects the arrestee who was booked most recently and assigns
an interviewer. If the arrestee is unavailable or unwilling to participate, the supervisor selects the
next most recently booked arrestee as a substitute. This process continues until the work shift ends.
This procedure produces a sample that is reasonably well balanced, meaning that arrestees tend to
have about the same probability of being included in the sample. If the sample were perfectly
balanced, weighting would be unnecessary to achieve unbiased estimates; and in fact, estimates based
on weighted and unweighted ADAM data are similar. The sample is not perfectly balanced, however,
for several reasons.
First, while supervisors attempt to sample proportional to size during the stock and flow periods,
achieving this proportionality requires two pieces of information that are unavailable at the time that
supervisors set quotas. A supervisor can only estimate NS and NF based on historical experience;
furthermore, the supervisor can not know the length of time required to complete interviews because
the length of the ADAM instrument depends on the extent of the arrestee’s reported drug use, so the
achieved value of nF is variable.
Second, the number of bookings varies from day-to-day but the number of interviewers is constant.
Days with a high number of bookings result in lower sampling probabilities than days with a low
number of bookings. Furthermore, the number of bookings varies over the flow period, so that
arrestees who are booked during periods with the most intensive booking activity have lower
sampling rates than arrestees who are booked during periods with the least intensive booking activity.
Sampling rates do not vary as much across the stock period because of the way that the period is
partitioned.
Third, arrestees can exit the jail during the stock period. The probability that an arrestee will have
been released prior to being approached by an interviewer depends on both the time during the stock
period when he was booked and the charge. The earlier that booking occurred during the stock
period, the greater the opportunity to have been released. The more serious the charge, the lower the
probability of being released because serious offenders are more likely to be detained for some time
pending trial. Neither factor plays an important role during the flow period because of the way that
the sample is selected during the flow period.
ADAM II preserves the sampling procedures used by the original ADAM, with the exception of
Washington DC. Due to insufficient resources to station an interviewer in each jail for every day, a
random sample of days was taken so that each of the seven district jails has two or three interviewing
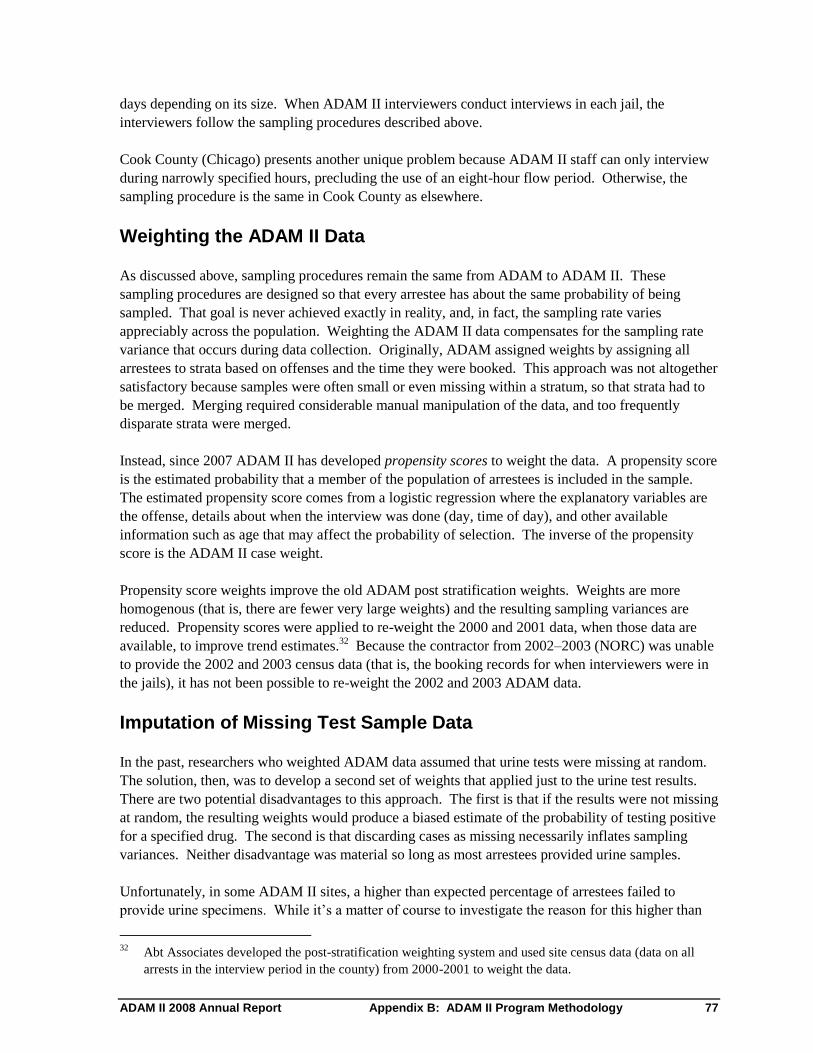
ADAM II 2008 Annual Report Appendix B: ADAM II Program Methodology 77
days depending on its size. When ADAM II interviewers conduct interviews in each jail, the
interviewers follow the sampling procedures described above.
Cook County (Chicago) presents another unique problem because ADAM II staff can only interview
during narrowly specified hours, precluding the use of an eight-hour flow period. Otherwise, the
sampling procedure is the same in Cook County as elsewhere.
Weighting the ADAM II Data
As discussed above, sampling procedures remain the same from ADAM to ADAM II. These
sampling procedures are designed so that every arrestee has about the same probability of being
sampled. That goal is never achieved exactly in reality, and, in fact, the sampling rate varies
appreciably across the population. Weighting the ADAM II data compensates for the sampling rate
variance that occurs during data collection. Originally, ADAM assigned weights by assigning all
arrestees to strata based on offenses and the time they were booked. This approach was not altogether
satisfactory because samples were often small or even missing within a stratum, so that strata had to
be merged. Merging required considerable manual manipulation of the data, and too frequently
disparate strata were merged.
Instead, since 2007 ADAM II has developed propensity scores to weight the data. A propensity score
is the estimated probability that a member of the population of arrestees is included in the sample.
The estimated propensity score comes from a logistic regression where the explanatory variables are
the offense, details about when the interview was done (day, time of day), and other available
information such as age that may affect the probability of selection. The inverse of the propensity
score is the ADAM II case weight.
Propensity score weights improve the old ADAM post stratification weights. Weights are more
homogenous (that is, there are fewer very large weights) and the resulting sampling variances are
reduced. Propensity scores were applied to re-weight the 2000 and 2001 data, when those data are
available, to improve trend estimates.32
Because the contractor from 2002–2003 (NORC) was unable
to provide the 2002 and 2003 census data (that is, the booking records for when interviewers were in
the jails), it has not been possible to re-weight the 2002 and 2003 ADAM data.
Imputation of Missing Test Sample Data
In the past, researchers who weighted ADAM data assumed that urine tests were missing at random.
The solution, then, was to develop a second set of weights that applied just to the urine test results.
There are two potential disadvantages to this approach. The first is that if the results were not missing
at random, the resulting weights would produce a biased estimate of the probability of testing positive
for a specified drug. The second is that discarding cases as missing necessarily inflates sampling
variances. Neither disadvantage was material so long as most arrestees provided urine samples.
Unfortunately, in some ADAM II sites, a higher than expected percentage of arrestees failed to
provide urine specimens. While it’s a matter of course to investigate the reason for this higher than
32
Abt Associates developed the post-stratification weighting system and used site census data (data on all
arrests in the interview period in the county) from 2000-2001 to weight the data.

78 Appendix B: ADAM II Program Methodology ADAM II 2008 Annual Report
expected level of missing data and seek to improve response rates, one must recognize that what was
a minor problem when the missing data rate was small becomes a potentially serious problem when
the missing data rate is large.
The approach to mitigate the problem is to use existing information to impute missing values. When
both self-report of drug use and the urine test results are known, a regression is estimated where the
urine test result is the dependent variable and the self-report is the explanatory variable. The results
from this regression are then used to impute a value when the self-report is known but there is no
urine test result. Although conceptually simple, the practice of doing data imputations is more
complicated, and is detailed in ADAM II Technical Documentation Report.
Given the desire to improve all estimates, data imputation procedures are now used to improve
estimates of the probability that offenders test positive for specified drugs in all sites.
Each site raises unique problems. For example, the sample size is unexpectedly small in Washington
DC because arrestees accumulate across seven distinct jails, so each jail has a fairly small flow of
offenders. An eventual solution may be to expand the number of interview days, but in the meantime,
other means were used to improve the estimates. DC presents a unique opportunity to improve
estimates because Pretrial Services obtains a urine sample from everyone who is arraigned—typically
only offenders with serious charges. Thus, the ADAM II sample is partitioned into two groups:
those with a high probability of having Pretrial Services urine test and those with a low probability of
having a Pretrial Services urine test. For the former, the results from the Pretrial Services urine test
are used as the estimate; for the latter, the weighted ADAM II data were used.
Estimating Trends
One of the primary goals of reestablishing the ADAM II program is to generate trends that bridge the
ADAM programs and assess the significance of changes. While one could produce trend estimates
by placing ADAM II estimates onto a graph with previous ADAM estimates, this trend would not be
accurate. Two important considerations are taken into account in producing trend estimates: 1)
Police practices change and thus affect who is arrested over time; any simple comparison could not
distinguish between the probability that an offender would use drugs and the probability that an
offender would appear in a jail-based sample; and 2) ADAM and ADAM II samples were collected at
different times of year and may thereby affect trends based on cyclical patterns of drug use.
Model-based predictions that control for the offender mix are developed to account for these
considerations. This is analogous to case-mix adjustments often required in health services research.
Specifically, weighted regressions are estimated where the result of a urine test is the left-hand-side
variable and the right-hand-side variables include the year, the offense, variables controlling for
seasonality, and some additional factors that vary from place-to-place. The trends are then based on
regression-based predictions that control for the offense and for seasonality.
Confidence intervals around each estimate to determine the significance of year to year change are
also developed using regression models. This is a necessary step because the annualized estimates
are not independent of each other.

ADAM II 2008 Annual Report Appendix B: ADAM II Program Methodology 79
2008 Data Collection
Sample Sizes
A little over 7,700 adult male arrestees were sampled across all sites, an average of 838 cases sampled
per site.33
The number of sampled cases does not represent the number of sampled cases that are
available to be interviewed, a number contingent on whether the arrestee is physically available or has
been transferred to another facility, is ill and in the medical unit or isolated due to violent behavior
(see below for complete explanation of inclusion criteria). There were 5,456 sampled and available
adult male arrestees across all sites, with an average of 606 per site34
in the two data collection
quarters of 2008.
Interview Completion Goals
The interview completion goals for each of the 10 ADAM II sites are 250 completes per quarter for
two quarters for a total of 5,000 completes across all sites. In the two quarters of 2008 collection
4,592 interviews were completed across all sites with an average of 500 completes per site.35
Five
sites (Denver, Indianapolis, New York, Portland and Sacramento) exceeded the goal of 500
completed interviews. Other sites ranged from 419 completes in Atlanta to 485 in Chicago.
To understand the ADAM II sample of arrestees and how that translates into an estimate for all
booked arrestees, it is important to take into account the unique ADAM II sampling approach as well
as the environment in which the sampling plan is executed. ADAM II sampling plans are designed to
systematically sample from a population that may or may not be eligible or available to participate in
the study, both of which may not be determined until the arrestee is sampled and approached for
participation.
Disposition of Sampled Arrestees
Facesheets completed in ADAM II serve two purposes. The first is to generate data to assess whether
the interviewers are following the sampling plan. The second is to generate a potential sample of
arrestees eligible to be interviewed. This potential sample includes arrestees who may be eligible, but
they may also have been released back into the community, transferred to another facility, taken to
court or otherwise unavailable to the interviewer.
In creating the sampling frame data collectors remove from the list those arrestees who were booked
into the facility more than 48 hours period, if those data are available to them at the facility. This list
becomes the sampling frame to which they apply the protocols for stock and flow selection described
earlier. However, accurate data on time since arrest is not always available and consequently an
arrestee’s true eligibility may not be known until the interviewer finds the sampled arrestee and asks
33
Washington DC is excluded from calculation of this average. That sample size totaled 177 across both
quarters (21% of the average).
34 Washington DC is excluded from this average. The available cases totaled 161 across both quarters (27%
of the average).
35 Washington DC is excluded from this average. The number of completed interviews totaled 95 across both
quarters (19% of the average).
80 Appendix B: ADAM II Program Methodology ADAM II 2008 Annual Report
when he was arrested. Of that pool of eligible arrestees some may also not be available for a number
of reasons, such as being taken to court, released, or removed from the booking area for violent
behavior, or illness. The remaining arrestees are eligible and available. A sampled, available case
may choose not to be interviewed: language barrier, does not want to, etc. Those who are
successfully interviewed are complete cases. If an eligible and available arrestee completes an
interview, he has the option of providing a urine sample. He may also refuse to supply the specimen
for a number of reasons.
The following definitions summarize these conditions:
Eligible cases: All male arrestees who have been arrested within the prior 48-hour period
and are not immigration or federal holds.
Sampled cases: Eligible male arrestees booked into the facility within the 24-hour period of
data collection, selected by interval from the ―stock‖ period and by temporal ordering from
the ―flow‖ period.
Available cases: Sampled cases that are 1) physically in the facility, and 2) have not been
removed from the booking area due to illness or violent behavior.
In addition, those arrestees not contacted before the end of the interview shift are eligible but
unavailable for the interview.36
The remaining arrestees are eligible and available. If an eligible and
available arrestee completed an interview, he had the option of providing a urine sample. Using the
above eligibility rules, disposition codes are created for each facesheet. Table B.2 reports the
numbers of completed facesheets with each final disposition (i.e., ineligible, eligible and unavailable,
eligible and available, and completes), by ADAM II site and overall. The number of arrestees eligible
and available for the interview is found in the final six rows.
Interview Response Rates
Similar to examining sample sizes, there are two interview response rates: one that reflects the total
sampled arrestees (the overall response rate), and one that reflects the sampled, available arrestees
(the conditional response rate.37
) Given the ADAM II sampling plans, in particular the stock
sampling approach, everyone who is sampled is not available to be approached for the interview. A
conditional response rate calculated based upon the number of arrestees who are physically available
for interviewing is instructive as a reflection of the percentage of eligible and available respondents
completing the survey. The conditional response rate is more for assessing how well the interviewer
performs.
36
We recognize that there may be some unavailable arrestees that would be ineligible since they were booked
more than 48 hours prior to being contacted. However, as reported in Table B.2, there are very few
ineligible arrestees. To simplify the response rates, we assume all arrestees that were unavailable to be
eligible for the interview.
37 The overall response rate is analogous to RR1 and the conditional response rate is analogous to the contact
rate CON1 found in found in the Standard Definitions from the American Association of Public Opinion
Research (AAPOR 2006, p. 32-36).

ADAM II 2008 Annual Report Appendix B: ADAM II Program Methodology 81
Table B.2: Final Disposition of Completed Facesheets
Atl
an
ta
Ch
arl
ott
e
Ch
ica
go
De
nv
er
Ind
ian
ap
oli
s
Min
nea
po
lis
Ne
w Y
ork
Po
rtla
nd
Sa
cra
me
nto
Wa
sh
ing
ton
DC
Ov
era
ll
Ineligible for the Interview
Arrested More than 48 Hours Ago 1 0 0 0 0 0 0 0 0 0 1
Eligible but Unavailable for the
Interview
Taken to Court 4 2 1 2 0 4 290 0 0 0 303
Released 126 104 13 71 0 260 0 245 137 0 956
Transferred 1 22 7 5 413 1 0 2 2 0 453
Medical Unit 15 2 3 2 1 3 0 3 6 3 38
Violent or Uncontrolled Behavior 9 16 2 11 13 24 2 35 15 11 138
Physically Ill 1 1 2 3 3 5 12 16 21 1 65
Shift Ended 3 2 3 0 0 0 4 1 0 0 13
Other/Missing 70 25 4 7 7 3 9 3 4 1 133
Eligible and Available for the
Interview
Did Not Want to Answer Interview 47 88 44 77 34 100 218 78 50 52 788
Could Not Answer Interview Due
to Language Barrier 0 10 7 23 9 15 14 17 6 4 105
Other/Missing 14 2 18 2 20 3 5 0 1 7 72
Agreed, Did not Complete
Interview 2 0 4 8 5 3 25 6 4 3 60
Completed Interview
No Urine Sample 65 72 59 51 54 50 150 73 54 40 668
Provided Urine Sample 354 396 426 460 524 383 365 453 508 55 3,924
Prior to discussing the actual response rates, it is important to remember that the most critical part of
the ADAM II sampling and weighting strategy is to provide the basis for making inferences about
booked arrestees given the idiosyncrasies imposed on ADAM II sample due to the setting (booking
facilities). The sampling strategy balances the sample, and the propensity score weights control for
things correlated to testing positive for drugs, such as day and time of booking and severity of
offense. This sampling and weighting strategy, rather than simply pure response rates, justifies the
ADAM II sample as a valid indicator of the booked population.
The overall response rate is computed as the number of arrestees completing interviews divided by
the sum of the number of arrestees completing interviews and the number of sampled eligible
arrestees not completing interviews. We partition the eligible arrestees not completing interviews
into two subgroups: arrestees not available for interview (e.g. taken to court) and arrestees available
for interview but refusing or unable to take the interview (e.g. a language barrier) or who agree to the
interview but do not complete it. For any ADAM II site i, this may be written as:
iii
i
ispReonAvailableNlableEligUnavaiResp
RespteResponseRa (B.2)
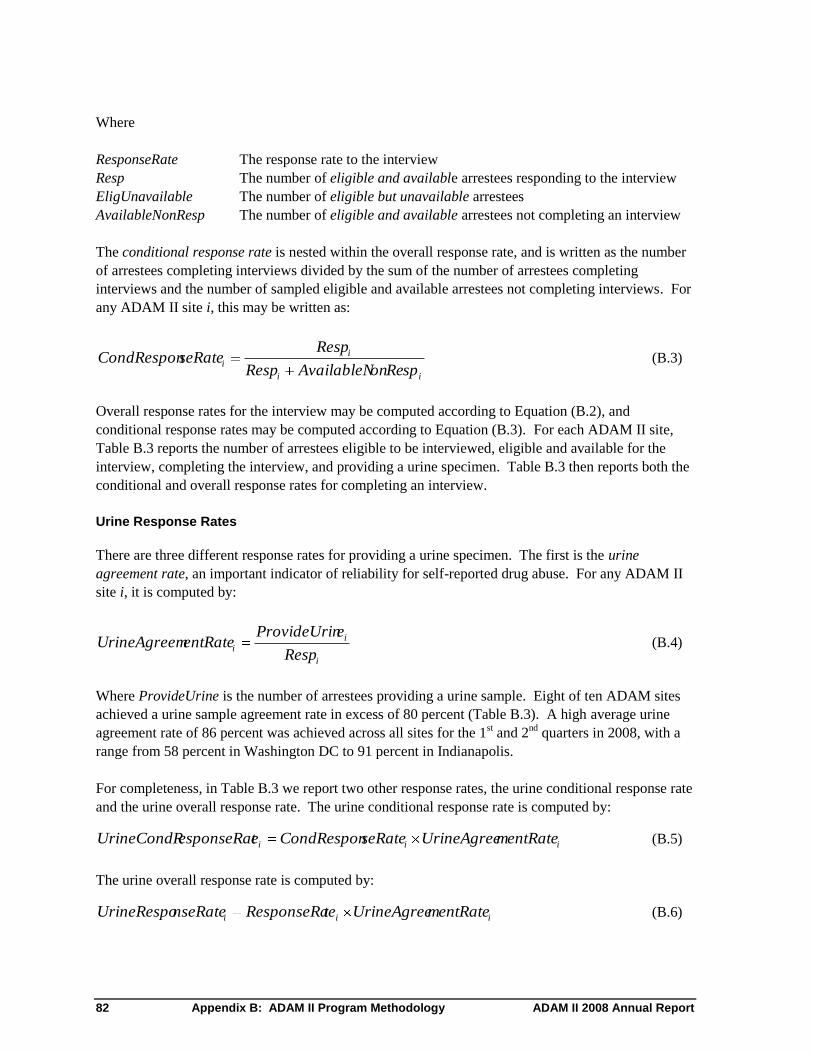
82 Appendix B: ADAM II Program Methodology ADAM II 2008 Annual Report
Where
ResponseRate The response rate to the interview
Resp The number of eligible and available arrestees responding to the interview
EligUnavailable The number of eligible but unavailable arrestees
AvailableNonResp The number of eligible and available arrestees not completing an interview
The conditional response rate is nested within the overall response rate, and is written as the number
of arrestees completing interviews divided by the sum of the number of arrestees completing
interviews and the number of sampled eligible and available arrestees not completing interviews. For
any ADAM II site i, this may be written as:
ii
i
ispReonAvailableNResp
RespseRateCondRespon (B.3)
Overall response rates for the interview may be computed according to Equation (B.2), and
conditional response rates may be computed according to Equation (B.3). For each ADAM II site,
Table B.3 reports the number of arrestees eligible to be interviewed, eligible and available for the
interview, completing the interview, and providing a urine specimen. Table B.3 then reports both the
conditional and overall response rates for completing an interview.
Urine Response Rates
There are three different response rates for providing a urine specimen. The first is the urine
agreement rate, an important indicator of reliability for self-reported drug abuse. For any ADAM II
site i, it is computed by:
i
i
iResp
erovideUrinPentRaterineAgreemU (B.4)
Where ProvideUrine is the number of arrestees providing a urine sample. Eight of ten ADAM sites
achieved a urine sample agreement rate in excess of 80 percent (Table B.3). A high average urine
agreement rate of 86 percent was achieved across all sites for the 1st and 2
nd quarters in 2008, with a
range from 58 percent in Washington DC to 91 percent in Indianapolis.
For completeness, in Table B.3 we report two other response rates, the urine conditional response rate
and the urine overall response rate. The urine conditional response rate is computed by:
iii mentRateUrineAgreeseRateCondResponeesponseRatUrineCondR (B.5)
The urine overall response rate is computed by:
iii mentRateUrineAgreeteResponseRanseRateUrineRespo (B.6)

ADAM II 2008 Annual Report Appendix B: ADAM II Program Methodology 83
Table B.3: Sample Sizes and Response Rates for Interview and Urine Specimen
Atl
an
ta
Ch
arl
ott
e
Ch
ica
go
De
nv
er
Ind
ian
ap
oli
s
Min
nea
po
lis
Ne
w Y
ork
Po
rtla
nd
Sa
cra
me
nto
Wa
sh
ing
ton
DC
Ov
era
ll
Sample Sizes
Provided Urine Specimen 354 396 3,924
Completed Interviews 419 468 485 511 578 433 515 526 562 95 4,592
Eligible and Available to be Interviewed 482 568 558 621 646 554 777 627 623 161 5,617
Eligible to be Interviewed 711 742 593 722 1,083 854 1,094 932 808 177 7,716
Interview Response Rates
Conditional Response Rate 0.869 0.824 0.869 0.823 0.895 0.782 0.663 0.839 0.902 0.590 0.818
Overall Response Rate 0.589 0.631 0.818 0.708 0.534 0.507 0.471 0.564 0.696 0.537 0.595
Urine Response Rates
Urine Agreement Rate 0.845 0.846 0.878 0.900 0.907 0.885 0.709 0.861 0.904 0.579 0.855
Conditional Response Rate 0.734 0.697 0.763 0.741 0.811 0.691 0.470 0.722 0.815 0.342 0.699
Overall Response Rate 0.498 0.534 0.718 0.637 0.484 0.448 0.334 0.486 0.629 0.311 0.509
Indicators of Responding to the Survey
Not every arrestee sampled, answers a survey. Table B.2 above includes the reasons arrestees do not
respond to the interview. In Atlanta, Charlotte, Chicago, Denver, Minneapolis, Portland, and
Sacramento, unavailable arrestees are most frequently released before the ADAM interviewers are
able to contact them. In Indianapolis unavailable arrestees are most frequently transferred away from
the booking facility. In New York, ineligible arrestees are most frequently taken to court. In
Washington DC, ineligible arrestees most frequently have violent or uncontrolled behavior.
For eligible arrestees, in every site the most frequent reason for not-response is due to the arrestee not
wanting to participate. Language difficulties appeared in every site, but most frequently in Charlotte,
Denver, Minneapolis, New York, and Portland.
We might wonder whether there are differences in response rates among subpopulations of the
eligible arrestees. In the following details, we find the day of week, time of day, and whether the
arrestee was booked in the stock or flow period differentiate arrestees that agree to the interview. The
other characteristics only occasionally differentiate response rates. We collect a number of variables
on the facesheet to distinguish subpopulations of the sample, including booking day of the week,
booking time, whether the sampled case was from the stock of booked arrestees, age, race and
ethnicity, severity, and charge.
For each of the stratifying variables described above, Table B.4 reports the number of facesheets with
non-missing values for the stratifying variables, the percentage of arrestees among the subpopulations
with facesheets that respond to the survey, and a 2 test of significance that the response percentages
84 Appendix B: ADAM II Program Methodology ADAM II 2008 Annual Report
are statistically different across the subpopulations. In other words, the analysis is looking at different
factors that might help to predict why someone agrees to participate in the survey.
A few notes are necessary to discuss the 2 tests of significance. One, in this section we consider a
difference statistically significant if its p-value is less than or equal to 0.10. Two, in the case of
Washington DC, we control for the facility in which the sample was drawn in addition to the
stratifying variable.38
All but two sites, New York and Washington DC, have statistically different agreement percentages
across days of the week. In six of those sites, Sunday has some of the lowest agreement percentages.
Wednesday generally has higher agreement percentages than the rest of the week. Though we might
expect the high-volume days Friday and Saturday to have lower agreement percentages, Monday
generally has lower agreement percentages than the rest of the week.
For eligible arrestees in all sites but Chicago and Washington DC, the time at which an arrestee is
booked appears to differentiate agreement percentages. In all sites, arrestees booked early in the day
(12:00 AM – 8:59 AM) have the lowest agreement percentages. The highest agreement percentages
are evenly divided between midday (9:00 AM – 3:59 PM) and late in the day (4:00 PM – 11:59 PM)
among the eight sites with statistically different agreement percentages. Agreement percentages are
always higher in the flow time period rather than the stock time period.
With respect to age, agreement percentages are statistically different for three sites: Atlanta,
Charlotte, and Portland. The age agreement percentages appear to be idiosyncratic to the site. In
Atlanta, 24-29 year olds have the lowest agreement percentages, while 36-44 year old have the
highest. In Charlotte, 30-35 year olds have the lowest agreement percentages, while those aged 45
and older have the highest. In Portland, those aged 45 and older have the lowest agreement
percentages, while 24-29 year olds have the highest.
Race and ethnicity differentiates the agreement percentages for Minneapolis and New York. In
Minneapolis, whites have the lowest agreement percentage. The Hispanic agreement percentage
should not be taken seriously, since there was only one Hispanic arrestee sampled. In New York,
other races have the lowest agreement percentages, while it is roughly equal in the others.
The severity of charge differentiates the agreement percentages in half the sites: Charlotte,
Minneapolis, New York, Portland, and Sacramento. Although felons never have the lowest
agreement percentages, the ordering of agreement percentages among felons, misdemeanants, and
those with other severities are idiosyncratic to the site.
In four sites, Charlotte, Minneapolis, Portland, and Sacramento, the type of charge differentiates the
agreement percentages. Those with drug crimes tend agree to the survey relatively less often, while
those with violent crimes tend to agree to the survey relative more often.
38
This would enable us to discern differences that could not be explained simply by differences in the facility
in which the sample was drawn.
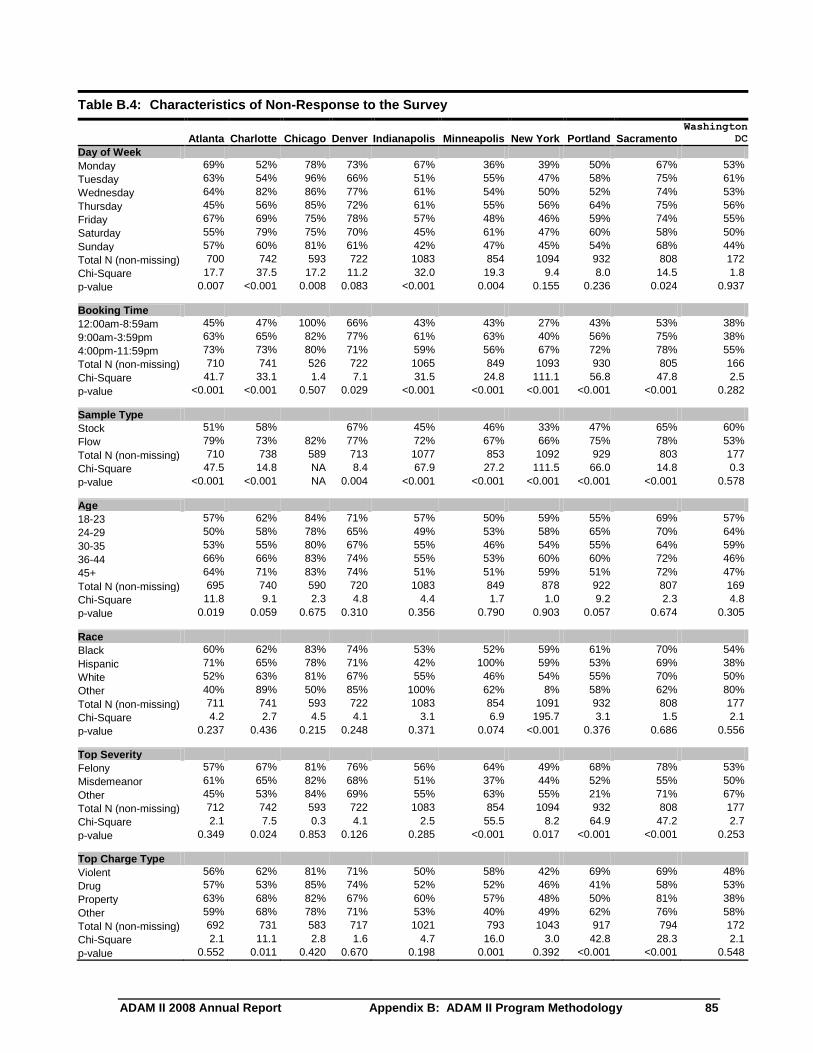
ADAM II 2008 Annual Report Appendix B: ADAM II Program Methodology 85
Table B.4: Characteristics of Non-Response to the Survey
Atlanta Charlotte Chicago Denver Indianapolis Minneapolis New York Portland Sacramento
Washington
DC
Day of Week
Monday 69% 52% 78% 73% 67% 36% 39% 50% 67% 53%
Tuesday 63% 54% 96% 66% 51% 55% 47% 58% 75% 61%
Wednesday 64% 82% 86% 77% 61% 54% 50% 52% 74% 53%
Thursday 45% 56% 85% 72% 61% 55% 56% 64% 75% 56%
Friday 67% 69% 75% 78% 57% 48% 46% 59% 74% 55%
Saturday 55% 79% 75% 70% 45% 61% 47% 60% 58% 50%
Sunday 57% 60% 81% 61% 42% 47% 45% 54% 68% 44%
Total N (non-missing) 700 742 593 722 1083 854 1094 932 808 172
Chi-Square 17.7 37.5 17.2 11.2 32.0 19.3 9.4 8.0 14.5 1.8
p-value 0.007 <0.001 0.008 0.083 <0.001 0.004 0.155 0.236 0.024 0.937
Booking Time
12:00am-8:59am 45% 47% 100% 66% 43% 43% 27% 43% 53% 38%
9:00am-3:59pm 63% 65% 82% 77% 61% 63% 40% 56% 75% 38%
4:00pm-11:59pm 73% 73% 80% 71% 59% 56% 67% 72% 78% 55%
Total N (non-missing) 710 741 526 722 1065 849 1093 930 805 166
Chi-Square 41.7 33.1 1.4 7.1 31.5 24.8 111.1 56.8 47.8 2.5
p-value <0.001 <0.001 0.507 0.029 <0.001 <0.001 <0.001 <0.001 <0.001 0.282
Sample Type
Stock 51% 58% 67% 45% 46% 33% 47% 65% 60%
Flow 79% 73% 82% 77% 72% 67% 66% 75% 78% 53%
Total N (non-missing) 710 738 589 713 1077 853 1092 929 803 177
Chi-Square 47.5 14.8 NA 8.4 67.9 27.2 111.5 66.0 14.8 0.3
p-value <0.001 <0.001 NA 0.004 <0.001 <0.001 <0.001 <0.001 <0.001 0.578
Age
18-23 57% 62% 84% 71% 57% 50% 59% 55% 69% 57%
24-29 50% 58% 78% 65% 49% 53% 58% 65% 70% 64%
30-35 53% 55% 80% 67% 55% 46% 54% 55% 64% 59%
36-44 66% 66% 83% 74% 55% 53% 60% 60% 72% 46%
45+ 64% 71% 83% 74% 51% 51% 59% 51% 72% 47%
Total N (non-missing) 695 740 590 720 1083 849 878 922 807 169
Chi-Square 11.8 9.1 2.3 4.8 4.4 1.7 1.0 9.2 2.3 4.8
p-value 0.019 0.059 0.675 0.310 0.356 0.790 0.903 0.057 0.674 0.305
Race
Black 60% 62% 83% 74% 53% 52% 59% 61% 70% 54%
Hispanic 71% 65% 78% 71% 42% 100% 59% 53% 69% 38%
White 52% 63% 81% 67% 55% 46% 54% 55% 70% 50%
Other 40% 89% 50% 85% 100% 62% 8% 58% 62% 80%
Total N (non-missing) 711 741 593 722 1083 854 1091 932 808 177
Chi-Square 4.2 2.7 4.5 4.1 3.1 6.9 195.7 3.1 1.5 2.1
p-value 0.237 0.436 0.215 0.248 0.371 0.074 <0.001 0.376 0.686 0.556
Top Severity
Felony 57% 67% 81% 76% 56% 64% 49% 68% 78% 53%
Misdemeanor 61% 65% 82% 68% 51% 37% 44% 52% 55% 50%
Other 45% 53% 84% 69% 55% 63% 55% 21% 71% 67%
Total N (non-missing) 712 742 593 722 1083 854 1094 932 808 177
Chi-Square 2.1 7.5 0.3 4.1 2.5 55.5 8.2 64.9 47.2 2.7
p-value 0.349 0.024 0.853 0.126 0.285 <0.001 0.017 <0.001 <0.001 0.253
Top Charge Type
Violent 56% 62% 81% 71% 50% 58% 42% 69% 69% 48%
Drug 57% 53% 85% 74% 52% 52% 46% 41% 58% 53%
Property 63% 68% 82% 67% 60% 57% 48% 50% 81% 38%
Other 59% 68% 78% 71% 53% 40% 49% 62% 76% 58%
Total N (non-missing) 692 731 583 717 1021 793 1043 917 794 172
Chi-Square 2.1 11.1 2.8 1.6 4.7 16.0 3.0 42.8 28.3 2.1
p-value 0.552 0.011 0.420 0.670 0.198 0.001 0.392 <0.001 <0.001 0.548
86 Appendix B: ADAM II Program Methodology ADAM II 2008 Annual Report
Once an arrestee agrees to answer a survey, his characteristics as measured on the facesheet do little
to differentiate whether he will provide a urine test. Table B.5 is structured similarly to Table B.4,
though for survey respondents. It reports the number of survey respondents with non-missing values
for the stratifying variables, the percentage of surveyed arrestees among the subpopulations with
facesheets that provide a urine sample, and a 2 test of significance that the response percentages are
statistically different across the subpopulations.
With the exception of race/ethnicity, the facesheet variables only distinguish the percentages agreeing
to provide a urine sample in isolated cases. For the non-race/ethnicity facesheet variables that are not
actual booking time, between 0 and 3 sites have statistically different urine agreement percentages
across values of the facesheet variable.
In the four sites with statistically different urine agreement percentages for race/ethnicity,39
Charlotte,
Minneapolis, and Portland, no general pattern emerges. Whites tend agree to the urine test less often
in Charlotte, Denver, and Portland.
39
Despite reporting a statistically different percentage of people responding to the urine test in Chicago, the
p-value for race is driven by responses from the 2 Hispanic arrestees there.

ADAM II 2008 Annual Report Appendix B: ADAM II Program Methodology 87
Table B.5: Characteristics of Non-Response to the Urine Test
Atlanta Charlotte Chicago Denver Indianapolis Minneapolis New York Portland Sacramento
Washington
DC
Day of Week
Monday 81% 84% 80% 85% 91% 83% 63% 92% 88% 60%
Tuesday 81% 92% 86% 91% 90% 89% 76% 82% 91% 45%
Wednesday 85% 82% 91% 90% 91% 89% 79% 85% 96% 47%
Thursday 84% 83% 95% 89% 86% 92% 74% 86% 94% 56%
Friday 94% 85% 86% 95% 94% 86% 59% 86% 90% 67%
Saturday 85% 87% 89% 94% 93% 83% 69% 91% 89% 67%
Sunday 79% 80% 86% 87% 90% 95% 78% 82% 84% 64%
Total N (non-missing) 414 468 485 511 578 433 515 526 562 91
Chi-Square 6.6 4.2 9.6 6.2 4.4 8.1 12.1 6.2 7.5 1.5
p-value 0.360 0.650 0.143 0.405 0.624 0.229 0.061 0.401 0.275 0.958
Booking Time
12:00am-8:59am 83% 89% 100% 90% 93% 89% 74% 88% 91% 0%
9:00am-3:59pm 86% 85% 88% 89% 94% 93% 68% 89% 92% 100%
4:00pm-11:59pm 85% 82% 100% 91% 86% 83% 72% 83% 89% 53%
Total N (non-missing) 417 468 431 511 563 429 515 525 559 87
Chi-Square 0.4 2.3 1.9 0.5 8.8 6.1 1.0 3.9 0.6 0.0
p-value 0.826 0.317 0.387 0.771 0.012 0.047 0.609 0.145 0.728 0.999
Sample Type
Stock 84% 85% 91% 92% 91% 71% 90% 91% 89%
Flow 84% 83% 88% 89% 88% 82% 71% 82% 89% 55%
Total N (non-missing) 418 467 482 505 573 432 514 524 557 95
Chi-Square 0.0 0.4 NA 0.4 2.8 7.9 0.0 5.8 0.8 2.4
p-value 0.992 0.543 NA 0.551 0.094 0.005 0.999 0.016 0.380 0.121
Age
18-23 88% 88% 85% 96% 88% 87% 63% 89% 94% 45%
24-29 88% 86% 82% 90% 94% 89% 72% 91% 90% 63%
30-35 83% 89% 93% 89% 93% 86% 80% 84% 80% 50%
36-44 82% 80% 91% 92% 91% 91% 74% 82% 95% 59%
45+ 84% 81% 92% 84% 89% 89% 71% 85% 90% 69%
Total N (non-missing) 411 466 482 510 578 431 512 524 561 89
Chi-Square 1.7 4.6 7.6 9.7 3.5 1.7 6.6 4.6 13.3 3.8
p-value 0.790 0.335 0.106 0.046 0.473 0.798 0.161 0.330 0.010 0.428
Race
Black 84% 85% 90% 85% 88% 86% 72% 87% 93% 58%
Hispanic 76% 94% 82% 93% 88% 0% 72% 95% 89% 33%
White 90% 80% 87% 91% 93% 94% 66% 83% 89% 75%
Other 100% 100% 50% 100% 100% 87% 56% 88% 94% 50%
Total N (non-missing) 418 467 485 511 578 433 515 526 562 95
Chi-Square 2.7 6.3 6.4 7.2 4.7 12.5 3.1 6.7 2.7 1.0
p-value 0.444 0.099 0.093 0.066 0.198 0.006 0.377 0.081 0.442 0.793
Top Severity
Felony 84% 84% 91% 92% 92% 93% 68% 86% 90% 65%
Misdemeanor 85% 85% 86% 89% 90% 87% 73% 86% 92% 58%
Other 80% 86% 84% 90% 89% 88% 69% 81% 60% 50%
Total N (non-missing) 419 468 485 511 578 433 515 526 562 95
Chi-Square 0.3 0.2 3.1 0.9 0.7 1.6 1.5 0.3 5.6 0.9
p-value 0.879 0.921 0.216 0.644 0.692 0.457 0.467 0.848 0.061 0.638
Top Charge Type
Violent 92% 85% 91% 88% 93% 88% 66% 89% 91% 64%
Drug 82% 78% 90% 90% 92% 89% 75% 79% 91% 57%
Property 84% 90% 83% 91% 90% 93% 73% 92% 95% 40%
Other 81% 84% 85% 90% 89% 85% 69% 85% 88% 58%
Total N (non-missing) 407 461 478 508 546 405 484 518 552 91
Chi-Square 4.7 5.6 4.5 0.5 1.7 2.9 2.6 7.1 4.2 1.1
p-value 0.198 0.130 0.217 0.925 0.628 0.404 0.453 0.068 0.236 0.774

88 Appendix B: ADAM II Program Methodology ADAM II 2008 Annual Report
Examination of the Congruence between Self-Reported Recent Drug Use and a Positive or
Negative Urine Test
ADAM II provides two indicators of recent drug use: survey questions about the arrestee’s recent
drug use and the urine test. Test thresholds and detection windows are summarized in Exhibit B.1 at
the end of this discussion. This section discusses the agreement between the urine test results and
questions about recent drug use. We focus on the four drugs with the largest proportion testing
positive: marijuana, cocaine, heroin, and methamphetamine. For the survey questions discussing
cocaine, the separate responses about crack cocaine and powder cocaine are combined, as the urine
test does not distinguish between the two.
In the ADAM II calendar, there are questions about drug use at varying time intervals: ever, past year,
past 30 days, past 7 days, and past 3 days. Because of the different testing windows, recent use is
defined separately for each drug. For marijuana, recent use is self-reported use for at least one day in
the past 30. For crack and powder cocaine, heroin, and methamphetamine, recent use is self-reported
use for at least one day in the past 3.
Table B.6 reports the agreement between self-reported recent drug use and results from the urine test,
by site across the two quarters of data collection. The first column indicates the ADAM II site. The
second column indicates the number of arrestees reporting recent drug use and providing a urine test.
Note that these may differ within site across drugs due to two factors: 1) not enough urine being
collected to test for every drug or 2) an arrestee not responding to the self-report for a particular drug.
The third through sixth columns report the percentage of arrestees answer to recent drug use versus
their urine test result. Columns 3 through 6 add to 100 percent for each row. The sites are grouped
by drug, since there do not appear to be patterns within site (e.g. Chicago has relatively high
percentages of arrestees admitting to use and testing positive for marijuana and heroin, but relatively
low percentages for cocaine).
Although there is significant variance in the percentages between sites, some general conclusions can
be made about each drug from Table B.6. For marijuana, roughly 9 percent of arrestees admit to use
in the past 30 days, but test negative. About 8 percent do not admit to use in the past 30 days but test
positive. These differences for marijuana may be due to a combination of the lengthy testing window
and the frequency of use among heavier users of marijuana. Among the roughly 28 percent of
arrestees testing positive for cocaine, around 15 percent of arrestees test positive but do not admit to
use, similar to the proportion admitting to use and testing positive. Similarly, the percentage testing
positive for heroin averages 7.5 percent, though only about half admitting to use. For cocaine, heroin,
and methamphetamine, very few arrestees (less than 1 percent) admit to use but test negative for the
same drug.
What is most compelling is the percentage of arrestees telling the truth, that is, self-reporting no use
and testing negative or self-reporting use and testing positive. Across all four drugs and all ten
ADAM II sites, the proportion telling is extremely high. For marijuana, 83 percent of arrestees were
consistent in their response to self-reported use and the results of the testing of their urine specimen.
A similar percent of congruence was identified for cocaine (84 percent) and even higher rates for
heroin (96 percent) and methamphetamine (97 percent).

ADAM II 2008 Annual Report Appendix B: ADAM II Program Methodology 89
Table B.6: Proportion Admitting to Recent Drug Use versus Urine Test Result
Site
Number That Answer Recent
Use and Provide Urine
Test
No Recent Use and Negative
Urine Test
Has Recent Use and Negative
Urine Test
No Recent Use and
Positive Urine Test
Has Recent Use and
Positive Urine Test
Marijuana
Atlanta 350 49.4% 11.1% 6.6% 32.9%
Charlotte 393 46.3% 7.9% 10.2% 35.6%
Chicago 423 40.9% 10.4% 8.3% 40.4%
Denver 456 49.3% 8.1% 3.9% 38.6%
Indianapolis 523 47.4% 7.5% 11.3% 33.8%
Minneapolis 381 40.4% 8.1% 10.0% 41.5%
New York 358 48.0% 7.5% 5.9% 38.5%
Portland 448 48.7% 10.3% 6.3% 34.8%
Sacramento 507 43.2% 10.1% 8.7% 38.1%
Washington DC 55 61.8% 14.5% 7.3% 16.4%
Overall 3,894 46.2% 9.1% 8.0% 36.8%
Cocaine
Atlanta 350 55.4% 0.3% 20.0% 24.3%
Charlotte 389 66.1% 0.8% 19.3% 13.9%
Chicago 422 62.6% 1.2% 20.4% 15.9%
Denver 458 66.8% 1.1% 16.6% 15.5%
Indianapolis 520 77.1% 0.2% 13.7% 9.0%
Minneapolis 380 76.3% 1.6% 12.4% 9.7%
New York 361 71.5% 1.1% 15.8% 11.6%
Portland 451 78.5% 0.7% 11.1% 9.8%
Sacramento 504 81.0% 0.8% 12.3% 6.0%
Washington DC 55 61.8% 0.0% 12.7% 25.5%
Overall 3,890 71.1% 0.8% 15.4% 12.6%
Heroin
Atlanta 353 98.3% 0.3% 1.4% 0.0%
Charlotte 396 97.7% 0.0% 1.8% 0.5%
Chicago 421 78.6% 0.5% 6.2% 14.7%
Denver 460 94.8% 0.0% 3.9% 1.3%
Indianapolis 524 93.1% 0.4% 5.7% 0.8%
Minneapolis 383 92.2% 0.0% 4.4% 3.4%
New York 364 91.5% 1.1% 3.6% 3.8%
Portland 452 90.0% 0.9% 2.7% 6.4%
Sacramento 508 93.9% 0.6% 4.3% 1.2%
Washington DC 55 87.3% 0.0% 1.8% 10.9%
Overall 3,916 92.1% 0.4% 3.9% 3.6%
Methamphetamine
Atlanta 351 98.6% 0.0% 1.1% 0.3%
Charlotte 396 99.2% 0.0% 0.8% 0.0%
Chicago 425 99.3% 0.0% 0.7% 0.0%
Denver 459 96.5% 0.0% 2.0% 1.5%
Indianapolis 524 98.3% 0.2% 1.0% 0.6%
Minneapolis 383 96.9% 0.3% 1.0% 1.8%
New York 365 99.7% 0.0% 0.3% 0.0%
Portland 447 83.7% 1.1% 6.9% 8.3%
Sacramento 505 69.7% 1.0% 11.7% 17.6%
Washington DC 55 100.0% 0.0% 0.0% 0.0%
Overall 3,910 93.0% 0.3% 3.0% 3.7%
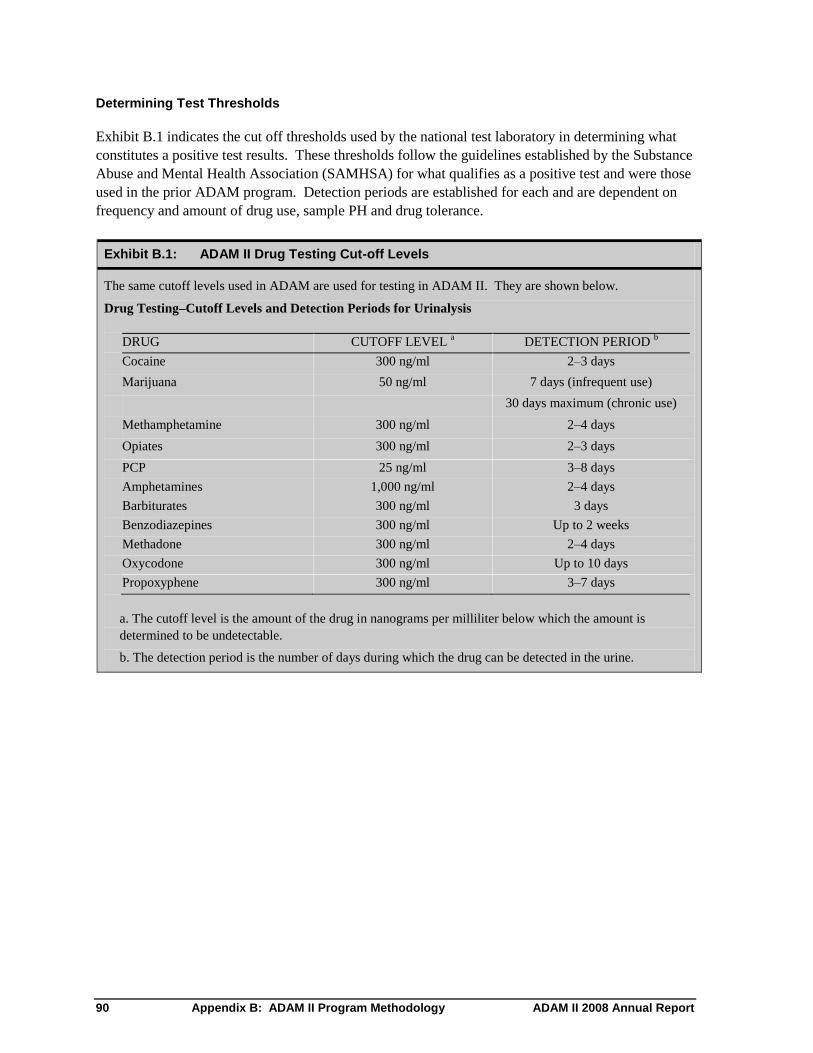
90 Appendix B: ADAM II Program Methodology ADAM II 2008 Annual Report
Determining Test Thresholds
Exhibit B.1 indicates the cut off thresholds used by the national test laboratory in determining what
constitutes a positive test results. These thresholds follow the guidelines established by the Substance
Abuse and Mental Health Association (SAMHSA) for what qualifies as a positive test and were those
used in the prior ADAM program. Detection periods are established for each and are dependent on
frequency and amount of drug use, sample PH and drug tolerance.
Exhibit B.1: ADAM II Drug Testing Cut-off Levels
The same cutoff levels used in ADAM are used for testing in ADAM II. They are shown below.
Drug Testing–Cutoff Levels and Detection Periods for Urinalysis
DRUG CUTOFF LEVEL a DETECTION PERIOD
b
Cocaine 300 ng/ml 2–3 days
Marijuana 50 ng/ml 7 days (infrequent use)
30 days maximum (chronic use)
Methamphetamine 300 ng/ml 2–4 days
Opiates 300 ng/ml 2–3 days
PCP 25 ng/ml 3–8 days
Amphetamines 1,000 ng/ml 2–4 days
Barbiturates 300 ng/ml 3 days
Benzodiazepines 300 ng/ml Up to 2 weeks
Methadone 300 ng/ml 2–4 days
Oxycodone 300 ng/ml Up to 10 days
Propoxyphene 300 ng/ml 3–7 days
a. The cutoff level is the amount of the drug in nanograms per milliliter below which the amount is
determined to be undetectable.
b. The detection period is the number of days during which the drug can be detected in the urine.

ADAM II 2008 Annual Report Appendix C: Site Fact Sheets 91
Appendix C. Site Fact Sheets
This appendix contains the data for each site annualized to reflect the entire year. Readers who
compare estimates for 2008 from the annual data sheet and the estimates that appear in trend tables
will find small apparent discrepancies because the former do not control for offender mix while the
latter do introduce that control.
In each of the fact sheets, one column reports the estimated annualized percentage of arrestees testing
positive for each of the specified drugs. A second column reports the standard error for those
estimated annualized percentages. The estimates appearing in these columns use imputed values for
drug test results when respondents failed to provide urines specimens. The advantage of data
imputation is that it can reduce response bias and it will reduce standard errors.
The disadvantage of data imputation is that calculations are computer intensive and are prone to
possible errors when applied mechanically. Therefore all the other estimates reported on the fact
sheets are based on non-imputed data. That is, respondents with missing urine test results are
excluded from the calculations.
As a result, the estimates for total testing positive are not a simple weighted average of the proportion
testing positive for the age, race and offense stratifications.
For some sites data are not adequate to report reliable trend graphs for all drugs, notably
methamphetamine and heroin. The number of drug trend graphs, therefore, vary from two to four
across the sites.

ADAM II 2008 Report
City of Atlanta/Fulton County, GA
Primary City: Atlanta
Male ArresteesAll Statistics Weighted
Facilities in Sample: 2
Sampled Eligible Arrestees: 712 Conditional Interview Response Rate1: 87% (n = 419)
Arrestees Booked in Data Collection Period: 1994 Urine Response Rate to Interviews: 84% (n = 354)
Mean Age <21 21-25 26-30 31-35 36+ Unknown White
Black or
African
American
Hispanic/
Latino
American
Indian/
Alaska
Native
Native
Hawaiian/
Pacific
Islander Asian
36.8 8.0 14.7 12.4 11.9 50.7 2.3 17.7 79.8 9.8 0.9 n/a n/a
Percent Positive for Drugs
Std Error <21 21-25 26-30 31-35 36+ Unknown White Black Hispanic Other Unknown
Any Drug2,3
63.7 2.8 78.9 64.6 63.0 68.2 61.6 25.4 34.9 72.8 37.1 73.2 71.1
Cocaine 39.8 2.8 16.1 15.2 22.9 44.4 54.2 n/a 24.0 44.3 22.7 42.3 n/a
Marijuana 39.2 2.8 76.9 57.7 61.4 51.1 21.0 n/a 12.9 46.5 8.6 50.0 38.8
Opiates 1.4 - n/a n/a n/a n/a 3.4 n/a n/a 1.7 n/a n/a n/a
Oxycodone4
0.0 - 0.0 0.0 0.0 0.0 0.0 n/a 0.0 0.0 0.0 0.0 0.0
Meth 1.0 - n/a n/a n/a n/a n/a n/a n/a n/a n/a n/a n/a
Multiple Drug2,3
20.8 2.2 19.5 22.0 25.1 27.8 18.5 2.9 13.8 21.1 0.5 n/a 44.2
Percent Positive for Drugs by Offense Category
(n = 77) (n = 118) (n = 43) (n = 1) (n = 155) (n = 11)
Any Drug2,3
55.4 78.7 87.6 n/a 52.8 n/a
Cocaine 21.0 58.5 39.1 n/a 29.6 n/a
Marijuana 37.3 37.5 64.5 n/a 37.4 n/a
Opiates n/a 4.3 n/a n/a 2.3 n/a
Oxycodone4
0.0 0.0 0.0 0.0 0.0 0.0
Meth n/a n/a n/a n/a n/a n/a
Multiple Drug2,3
8.4 21.7 21.7 88.2 21.4 n/a
Self-Reported Drug Use in the Past Year and Experience with Drug and Mental Health Treatment
Ever % Last Avg Nights Ever % Last Avg Adm Ever % Last Avg Nights
Year5
Last Year Year5
Last Year Year5
Last Year
Crack Cocaine 47.2 36.5 11.0 n/a 19.2 1.7 0.1 19.4 3.0 0.8
Powder Cocaine 42.1 35.9 17.0 2.4 6.3 4.7 0.1 9.9 3.0 n/a
Marijuana 23.3 19.5 8.4 1.6 5.8 1.5 0.0 5.3 1.1 0.2
Heroin 52.9 45.5 n/a n/a 6.9 n/a n/a 15.8 n/a n/a
Meth 56.6 55.7 n/a n/a n/a n/a n/a 19.2 n/a n/a
1 - Conditional interview response rate is the number of completed interviews divided by the number of sampled arrestees available to be interviewed
2 - Drug panel includes marijuana, cocaine, opiates, amphetamine EMIT test, PCP, valium, darvon, methadone, barbiturates, and oxycodone
3 - Denominator includes anyone that provided a large enough urine sample to test for all of the drug panel
4 - Percentages for oxycodone not annualized since the test is new for 2008
5 - Percentage of arrestees responding to the calendar section of the ADAM survey
n/a - Not enough observations to annualize this estimate
City of Atlanta/Fulton County, GA, 2008 Page 89
Age of Booked Arrestees (%)
Treatment Time by Type of Treatment (%)
Testing Positive by Drug and Age (%) Testing Positive by Drugs and Race (%)
Violent (%) Property (%)
Drug Possession
(%)
Drug Distribution
(%)
Ethnicity/Race of Booked Arrestees (%)
Other (%) Unknown (%)
Total Testing
Positive (%)
Any Treatment
Ever (%)Mental Health TreatmentInpatient Outpatient

Trend Estimates of Testing Positive for Drugs
Note: For each year, the dot is the prevalence estimate and the line indicates a 95% confidence interval
City of Atlanta/Fulton County, GA, 2008 Page 90
0%
10%
20%
30%
40%
50%
60%
70%
2000 2001 2002 2003 2004 2005 2006 2007 2008
Pre
va
len
ce
Prevalence Estimates of Cocaine Use
0%
10%
20%
30%
40%
50%
2000 2001 2002 2003 2004 2005 2006 2007 2008
Pre
va
len
ce
Prevalence Estimates of Marijuana Use
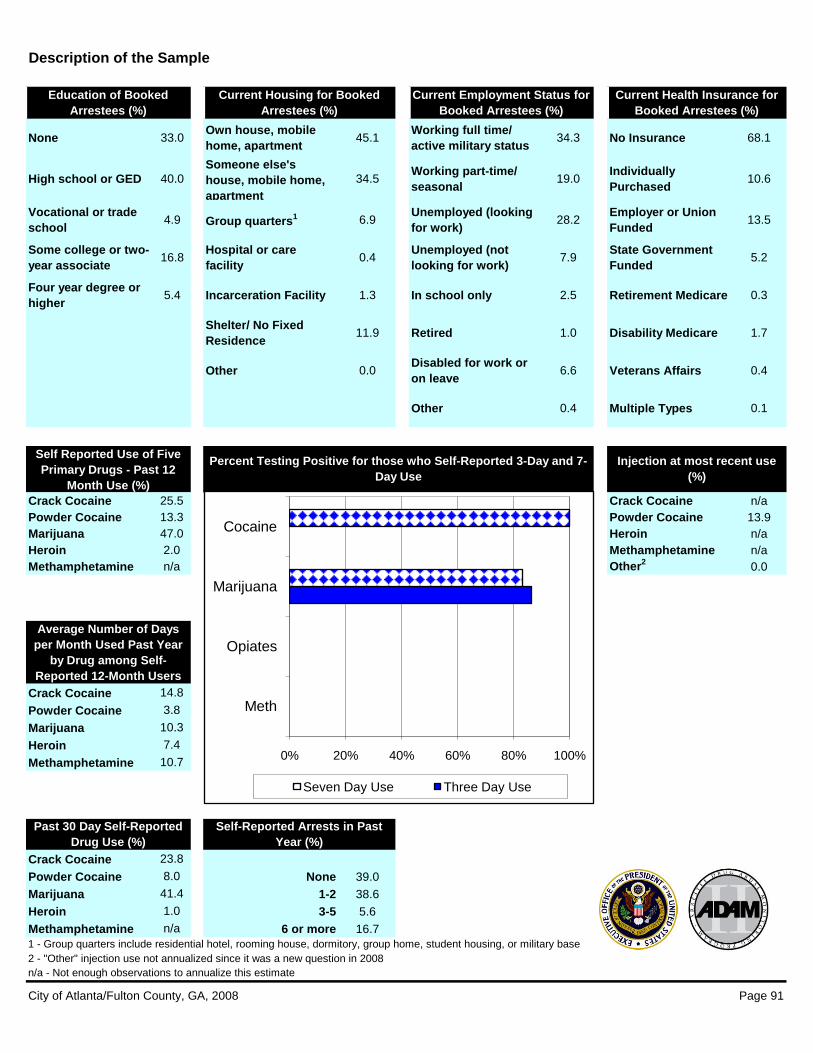
Description of the Sample
None 33.0Own house, mobile
home, apartment45.1
Working full time/
active military status34.3 No Insurance 68.1
High school or GED 40.0
Someone else's
house, mobile home,
apartment
34.5Working part-time/
seasonal 19.0
Individually
Purchased10.6
Vocational or trade
school4.9 Group quarters
1 6.9Unemployed (looking
for work)28.2
Employer or Union
Funded13.5
Some college or two-
year associate 16.8
Hospital or care
facility0.4
Unemployed (not
looking for work)7.9
State Government
Funded5.2
Four year degree or
higher5.4 Incarceration Facility 1.3 In school only 2.5 Retirement Medicare 0.3
Shelter/ No Fixed
Residence11.9 Retired 1.0 Disability Medicare 1.7
Other 0.0Disabled for work or
on leave6.6 Veterans Affairs 0.4
Other 0.4 Multiple Types 0.1
Crack Cocaine 25.5 Crack Cocaine n/a
Powder Cocaine 13.3 Powder Cocaine 13.9
Marijuana 47.0 Heroin n/a
Heroin 2.0 Methamphetamine n/a
Methamphetamine n/a Other2
0.0
Crack Cocaine 14.8
Powder Cocaine 3.8
Marijuana 10.3
Heroin 7.4
Methamphetamine 10.7
Crack Cocaine 23.8
Powder Cocaine 8.0 None 39.0
Marijuana 41.4 1-2 38.6
Heroin 1.0 3-5 5.6
Methamphetamine n/a 6 or more 16.7
1 - Group quarters include residential hotel, rooming house, dormitory, group home, student housing, or military base
2 - "Other" injection use not annualized since it was a new question in 2008
n/a - Not enough observations to annualize this estimate
City of Atlanta/Fulton County, GA, 2008 Page 91
Education of Booked
Arrestees (%)
Current Housing for Booked
Arrestees (%)
Current Employment Status for
Booked Arrestees (%)
Current Health Insurance for
Booked Arrestees (%)
Self-Reported Arrests in Past
Year (%)
Percent Testing Positive for those who Self-Reported 3-Day and 7-
Day Use
Injection at most recent use
(%)
Average Number of Days
per Month Used Past Year
by Drug among Self-
Reported 12-Month Users
Self Reported Use of Five
Primary Drugs - Past 12
Month Use (%)
Past 30 Day Self-Reported
Drug Use (%)
0% 20% 40% 60% 80% 100%
Meth
Opiates
Marijuana
Cocaine
Seven Day Use Three Day Use

Dynamics of Drug Markets in Past 30 Days
Place where Last Purchase Occurred (%) Method of Non-Cash Transaction (%)
Public House Outdoor Other Trade Trade Trade
n Building Apartment Area Area n Drugs Property Sex Other1
Crack Cocaine 96 3.7 31.3 63.9 1.1 Crack Cocaine 39 1.4 15.4 3.8 79.5
Powder Cocaine 19 10.9 58.4 30.0 0.7 Powder Cocaine 21 n/a n/a n/a n/a
Marijuana 118 9.3 44.2 45.3 1.1 Marijuana 90 47.9 33.7 0.0 18.4
Heroin 4 0.0 0.0 0.0 0.0 Heroin 1 n/a n/a n/a n/a
Methamphetamine 0 - - - - Methamphetamine 1 n/a n/a n/a n/a1 - Credit, fronted, manufactured, transport/steal drugs, gift, other
Drugs obtained by Cash, Non-cash, and Combination Transactions2
Acquiring Drugs by Non-Cash (Manufacture or Other)3
2 - Respondents report most recent cash and non-cash transactions
3 - Data not annualized due to small numbers of people manufacturing
City of Atlanta/Fulton County, GA, 2008 Page 92
0% 20% 40% 60% 80% 100%
Methamphetamine
Heroin
Marijuana
Powder Cocaine
Crack Cocaine
Cash Only Non-cash Only Cash and non-cash
0% 20% 40% 60% 80% 100%
Methamphetamine
Heroin
Marijuana
Powder Cocaine
Crack Cocaine
Manufactured Non-Manufactured

ADAM II 2008 Report
Mecklenburg County, NC
Primary City: Charlotte
Male ArresteesAll Statistics Weighted
Facilities in Sample: 1
Sampled Eligible Arrestees: 742 Conditional Interview Response Rate1: 82% (n = 468)
Arrestees Booked in Data Collection Period: 2637 Urine Response Rate to Interviews: 85% (n = 396)
Mean Age <21 21-25 26-30 31-35 36+ Unknown White
Black or
African
American
Hispanic/
Latino
American
Indian/
Alaska
Native
Native
Hawaiian/
Pacific
Islander Asian
33.4 13.9 19.6 14.3 13.0 33.0 6.2 32.0 63.7 10.9 3.5 0.7 n/a
Percent Positive for Drugs
Std Error <21 21-25 26-30 31-35 36+ Unknown White Black Hispanic Other Unknown
Any Drug2,3
64.9 2.4 64.4 75.2 78.8 63.2 57.6 n/a 51.6 75.9 47.9 39.9 96.5
Cocaine 32.4 2.5 3.9 21.3 51.0 33.1 45.3 n/a 25.9 39.9 29.0 33.1 61.2
Marijuana 45.8 2.5 65.9 65.2 58.9 41.9 25.8 n/a 30.3 54.0 27.8 28.9 94.8
Opiates 2.1 - n/a n/a n/a 2.2 2.8 n/a 5.3 0.3 n/a n/a n/a
Oxycodone4
0.6 - 0.0 0.0 1.2 1.1 0.8 0.0 1.3 0.4 0.9 0.0 0.0
Meth 0.7 - n/a n/a n/a n/a n/a n/a n/a n/a n/a n/a n/a
Multiple Drug2,3
18.8 2.0 8.2 12.9 41.9 18.9 18.1 n/a 17.4 19.6 10.4 18.2 61.2
Percent Positive for Drugs by Offense Category
(n = 98) (n = 116) (n = 52) (n = 12) (n = 197) (n = 7)
Any Drug2,3
65.0 83.5 86.5 n/a 57.0 n/a
Cocaine 26.0 48.1 42.1 58.7 31.3 n/a
Marijuana 44.7 58.6 65.8 67.6 35.4 n/a
Opiates 2.1 3.2 4.0 n/a 2.3 n/a
Oxycodone4
1.4 1.1 0.0 3.6 0.2 0.0
Meth n/a n/a n/a n/a n/a n/a
Multiple Drug2,3
11.6 27.9 30.5 40.0 14.9 n/a
Self-Reported Drug Use in the Past Year and Experience with Drug and Mental Health Treatment
Ever % Last Avg Nights Ever % Last Avg Adm Ever % Last Avg Nights
Year5
Last Year Year5
Last Year Year5
Last Year
Crack Cocaine 76.5 61.9 20.1 4.9 38.5 8.8 0.2 20.9 10.2 n/a
Powder Cocaine 58.9 49.1 21.3 5.3 32.7 11.4 0.2 14.6 3.0 n/a
Marijuana 45.1 28.2 9.9 2.0 28.1 8.5 0.1 10.8 3.2 n/a
Heroin 79.1 64.9 30.7 12.8 49.2 n/a n/a 17.5 n/a n/a
Meth n/a 42.6 n/a n/a n/a n/a n/a n/a n/a n/a
1 - Conditional interview response rate is the number of completed interviews divided by the number of sampled arrestees available to be interviewed
2 - Drug panel includes marijuana, cocaine, opiates, amphetamine EMIT test, PCP, valium, darvon, methadone, barbiturates, and oxycodone
3 - Denominator includes anyone that provided a large enough urine sample to test for all of the drug panel
4 - Percentages for oxycodone not annualized since the test is new for 2008
5 - Percentage of arrestees responding to the calendar section of the ADAM survey
n/a - Not enough observations to annualize this estimate
Mecklenburg County, NC, 2008 Page 93
Other (%) Unknown (%)
Total Testing
Positive (%)
Any Treatment
Ever (%)Mental Health TreatmentInpatient Outpatient
Ethnicity/Race of Booked Arrestees (%)Age of Booked Arrestees (%)
Treatment Time by Type of Treatment (%)
Testing Positive by Drug and Age (%) Testing Positive by Drugs and Race (%)
Violent (%) Property (%)
Drug Possession
(%)
Drug Distribution
(%)

Trend Estimates of Testing Positive for Drugs
Note: For each year, the dot is the prevalence estimate and the line indicates a 95% confidence interval
Mecklenburg County, NC, 2008 Page 94
0%
10%
20%
30%
40%
50%
60%
2000 2001 2002 2003 2004 2005 2006 2007 2008
Pre
va
len
ce
Prevalence Estimates of Cocaine Use
0%
10%
20%
30%
40%
50%
60%
70%
2000 2001 2002 2003 2004 2005 2006 2007 2008
Pre
va
len
ce
Prevalence Estimates of Marijuana Use
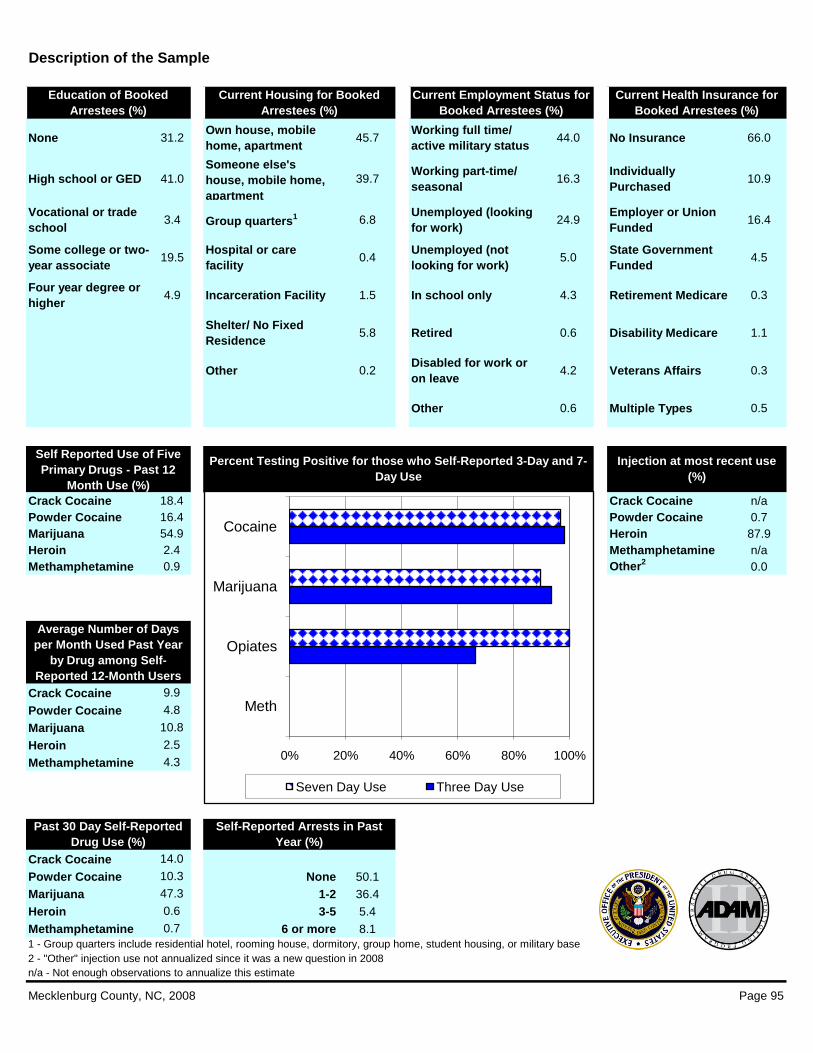
Description of the Sample
None 31.2Own house, mobile
home, apartment45.7
Working full time/
active military status44.0 No Insurance 66.0
High school or GED 41.0
Someone else's
house, mobile home,
apartment
39.7Working part-time/
seasonal 16.3
Individually
Purchased10.9
Vocational or trade
school3.4 Group quarters
1 6.8Unemployed (looking
for work)24.9
Employer or Union
Funded16.4
Some college or two-
year associate 19.5
Hospital or care
facility0.4
Unemployed (not
looking for work)5.0
State Government
Funded4.5
Four year degree or
higher4.9 Incarceration Facility 1.5 In school only 4.3 Retirement Medicare 0.3
Shelter/ No Fixed
Residence5.8 Retired 0.6 Disability Medicare 1.1
Other 0.2Disabled for work or
on leave4.2 Veterans Affairs 0.3
Other 0.6 Multiple Types 0.5
Crack Cocaine 18.4 Crack Cocaine n/a
Powder Cocaine 16.4 Powder Cocaine 0.7
Marijuana 54.9 Heroin 87.9
Heroin 2.4 Methamphetamine n/a
Methamphetamine 0.9 Other2
0.0
Crack Cocaine 9.9
Powder Cocaine 4.8
Marijuana 10.8
Heroin 2.5
Methamphetamine 4.3
Crack Cocaine 14.0
Powder Cocaine 10.3 None 50.1
Marijuana 47.3 1-2 36.4
Heroin 0.6 3-5 5.4
Methamphetamine 0.7 6 or more 8.1
1 - Group quarters include residential hotel, rooming house, dormitory, group home, student housing, or military base
2 - "Other" injection use not annualized since it was a new question in 2008
n/a - Not enough observations to annualize this estimate
Mecklenburg County, NC, 2008 Page 95
Education of Booked
Arrestees (%)
Current Housing for Booked
Arrestees (%)
Current Employment Status for
Booked Arrestees (%)
Current Health Insurance for
Booked Arrestees (%)
Self-Reported Arrests in Past
Year (%)
Percent Testing Positive for those who Self-Reported 3-Day and 7-
Day Use
Injection at most recent use
(%)
Average Number of Days
per Month Used Past Year
by Drug among Self-
Reported 12-Month Users
Self Reported Use of Five
Primary Drugs - Past 12
Month Use (%)
Past 30 Day Self-Reported
Drug Use (%)
0% 20% 40% 60% 80% 100%
Meth
Opiates
Marijuana
Cocaine
Seven Day Use Three Day Use

Dynamics of Drug Markets in Past 30 Days
Place where Last Purchase Occurred (%) Method of Non-Cash Transaction (%)
Public House Outdoor Other Trade Trade Trade
n Building Apartment Area Area n Drugs Property Sex Other1
Crack Cocaine 63 7.1 40.9 46.6 5.4 Crack Cocaine 32 1.3 13.4 1.6 83.7
Powder Cocaine 33 11.6 50.6 29.2 8.6 Powder Cocaine 23 1.7 4.4 0.7 93.2
Marijuana 110 12.7 50.9 32.8 3.5 Marijuana 121 1.7 1.6 0.8 96.0
Heroin 6 26.0 55.8 16.6 1.6 Heroin 1 n/a n/a n/a n/a
Methamphetamine 0 - - - - Methamphetamine 0 - - - -1 - Credit, fronted, manufactured, transport/steal drugs, gift, other
Drugs obtained by Cash, Non-cash, and Combination Transactions2
Acquiring Drugs by Non-Cash (Manufacture or Other)3
2 - Respondents report most recent cash and non-cash transactions
3 - Data not annualized due to small numbers of people manufacturing
Mecklenburg County, NC, 2008 Page 96
0% 20% 40% 60% 80% 100%
Methamphetamine
Heroin
Marijuana
Powder Cocaine
Crack Cocaine
Cash Only Non-cash Only Cash and non-cash
0% 20% 40% 60% 80% 100%
Methamphetamine
Heroin
Marijuana
Powder Cocaine
Crack Cocaine
Manufactured Non-Manufactured

ADAM II 2008 Report
Cook County, IL
Primary City: Chicago
Male ArresteesAll Statistics Weighted
Facilities in Sample: 1
Sampled Eligible Arrestees: 593 Conditional Interview Response Rate1: 87% (n = 485)
Arrestees Booked in Data Collection Period: 6697 Urine Response Rate to Interviews: 88% (n = 426)
Mean Age <21 21-25 26-30 31-35 36+ Unknown White
Black or
African
American
Hispanic/
Latino
American
Indian/
Alaska
Native
Native
Hawaiian/
Pacific
Islander Asian
31.9 18.3 20.0 13.2 11.4 31.8 5.2 26.3 66.6 21.9 0.7 n/a 1.1
Percent Positive for Drugs
Std Error <21 21-25 26-30 31-35 36+ Unknown White Black Hispanic Other Unknown
Any Drug2,3
76.0 2.0 83.8 88.0 72.1 85.0 86.9 n/a 87.2 85.3 72.7 60.5 n/a
Cocaine 35.6 2.3 40.9 19.1 33.7 44.7 67.7 n/a 45.7 46.2 33.4 15.7 n/a
Marijuana 47.8 2.4 65.9 73.4 53.6 37.6 19.7 n/a 32.5 50.6 38.7 50.5 n/a
Opiates 20.3 1.8 9.1 11.2 17.6 44.3 46.7 n/a 41.0 25.3 24.3 6.5 n/a
Oxycodone4
0.0 - 0.0 0.0 0.0 0.0 0.0 n/a 0.0 0.0 0.0 0.0 n/a
Meth 0.6 - 10.4 n/a n/a n/a n/a n/a n/a n/a n/a n/a n/a
Multiple Drug2,3
30.3 2.2 38.1 22.3 32.8 35.2 48.5 n/a 33.3 38.9 24.9 21.5 2.1
Percent Positive for Drugs by Offense Category
(n = 42) (n = 55) (n = 105) (n = 11) (n = 31) (n = 2)
Any Drug2,3
67.9 91.3 91.2 65.1 70.8 n/a
Cocaine 10.2 56.7 54.5 24.3 31.8 n/a
Marijuana 50.1 41.3 55.3 37.7 35.6 n/a
Opiates 10.6 46.0 27.4 4.2 32.8 n/a
Oxycodone4
0.0 0.0 0.0 0.0 0.0 0.0
Meth n/a n/a 6.6 n/a n/a n/a
Multiple Drug2,3
10.2 52.6 43.0 17.3 29.1 n/a
Self-Reported Drug Use in the Past Year and Experience with Drug and Mental Health Treatment
Ever % Last Avg Nights Ever % Last Avg Adm Ever % Last Avg Nights
Year5
Last Year Year5
Last Year Year3
Last Year
Crack Cocaine 70.8 63.0 22.2 7.1 39.6 10.7 0.3 26.1 7.3 n/a
Powder Cocaine 50.4 47.3 14.9 6.1 20.1 7.8 0.1 18.9 n/a n/a
Marijuana 42.8 25.5 7.3 1.6 23.9 4.3 0.1 11.9 1.0 n/a
Heroin 61.5 53.0 15.2 5.1 39.9 9.7 0.7 16.2 2.0 0.1
Meth n/a n/a n/a n/a n/a n/a n/a n/a n/a n/a
1 - Conditional interview response rate is the number of completed interviews divided by the number of sampled arrestees available to be interviewed
2 - Drug panel includes marijuana, cocaine, opiates, amphetamine EMIT test, PCP, valium, darvon, methadone, barbiturates, and oxycodone
3 - Denominator includes anyone that provided a large enough urine sample to test for all of the drug panel
4 - Percentages for oxycodone not annualized since the test is new for 2008
5 - Percentage of arrestees responding to the calendar section of the ADAM survey
n/a - Not enough observations to annualize this estimate
Cook County, IL, 2008 Page 97
Total Testing
Positive (%)
Ethnicity/Race of Booked Arrestees (%)Age of Booked Arrestees (%)
Treatment Time by Type of Treatment (%)
Testing Positive by Drug and Age (%) Testing Positive by Drugs and Race (%)
Violent (%) Property (%)
Any Treatment
Ever (%)Mental Health TreatmentInpatient Outpatient
Other (%) Unknown (%)
Drug Possession
(%)
Drug Distribution
(%)
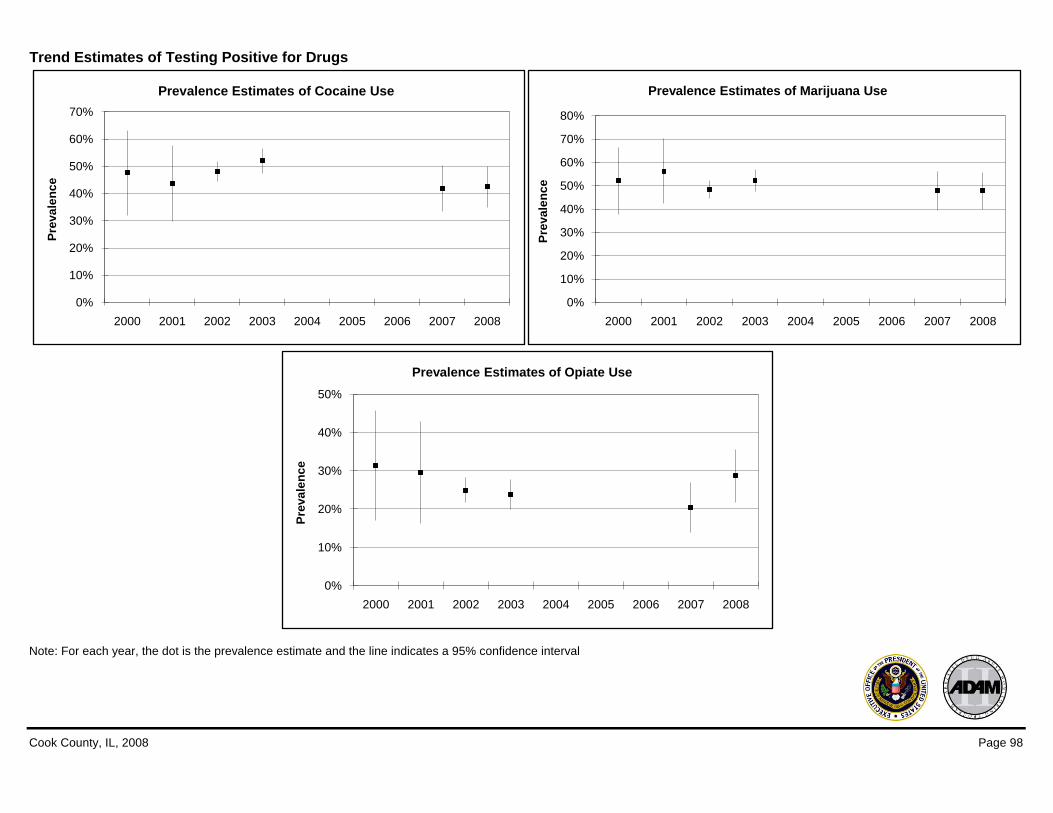
Trend Estimates of Testing Positive for Drugs
Note: For each year, the dot is the prevalence estimate and the line indicates a 95% confidence interval
Cook County, IL, 2008 Page 98
0%
10%
20%
30%
40%
50%
60%
70%
2000 2001 2002 2003 2004 2005 2006 2007 2008
Pre
va
len
ce
Prevalence Estimates of Cocaine Use
0%
10%
20%
30%
40%
50%
2000 2001 2002 2003 2004 2005 2006 2007 2008
Pre
va
len
ce
Prevalence Estimates of Opiate Use
0%
10%
20%
30%
40%
50%
60%
70%
80%
2000 2001 2002 2003 2004 2005 2006 2007 2008
Pre
va
len
ce
Prevalence Estimates of Marijuana Use

Description of the Sample
None 35.8Own house, mobile
home, apartment45.5
Working full time/
active military status35.5 No Insurance 74.8
High school or GED 38.4
Someone else's
house, mobile home,
apartment
45.4Working part-time/
seasonal 19.0
Individually
Purchased5.8
Vocational or trade
school3.7 Group quarters
1 1.9Unemployed (looking
for work)26.3
Employer or Union
Funded12.0
Some college or two-
year associate 19.2
Hospital or care
facility0.3
Unemployed (not
looking for work)6.8
State Government
Funded5.0
Four year degree or
higher2.9 Incarceration Facility 0.9 In school only 7.5 Retirement Medicare 0.2
Shelter/ No Fixed
Residence6.0 Retired 0.5 Disability Medicare 1.7
Other 0.1Disabled for work or
on leave4.1 Veterans Affairs 0.5
Other 0.3 Multiple Types 0.0
Crack Cocaine 24.4 Crack Cocaine n/a
Powder Cocaine 7.2 Powder Cocaine n/a
Marijuana 58.7 Heroin 23.9
Heroin 27.0 Methamphetamine n/a
Methamphetamine 0.3 Other2
0.0
Crack Cocaine 11.1
Powder Cocaine 3.1
Marijuana 11.7
Heroin 17.1
Methamphetamine n/a
Crack Cocaine 23.2
Powder Cocaine 2.9 None 37.3
Marijuana 51.9 1-2 47.8
Heroin 25.0 3-5 6.7
Methamphetamine 0.3 6 or more 8.2
1 - Group quarters include residential hotel, rooming house, dormitory, group home, student housing, or military base
2 - "Other" injection use not annualized since it was a new question in 2008
n/a - Not enough observations to annualize this estimate
Cook County, IL, 2008 Page 99
Education of Booked
Arrestees (%)
Current Housing for Booked
Arrestees (%)
Current Employment Status for
Booked Arrestees (%)
Current Health Insurance for
Booked Arrestees (%)
Self-Reported Arrests in Past
Year (%)
Percent Testing Positive for those who Self-Reported 3-Day and 7-
Day Use
Injection at most recent use
(%)
Average Number of Days
per Month Used Past Year
by Drug among Self-
Reported 12-Month Users
Self Reported Use of Five
Primary Drugs - Past 12
Month Use (%)
Past 30 Day Self-Reported
Drug Use (%)
0% 20% 40% 60% 80% 100%
Meth
Opiates
Marijuana
Cocaine
Seven Day Use Three Day Use

Dynamics of Drug Markets in Past 30 Days
Place where Last Purchase Occurred (%) Method of Non-Cash Transaction (%)
Public House Outdoor Other Trade Trade Trade
n Building Apartment Area Area n Drugs Property Sex Other1
Crack Cocaine 46 6.4 26.3 67.1 0.2 Crack Cocaine 23 2.8 5.4 0.0 91.8
Powder Cocaine 5 17.5 43.1 39.4 0.0 Powder Cocaine 5 n/a n/a n/a n/a
Marijuana 76 8.9 30.0 60.7 0.4 Marijuana 73 0.1 0.1 0.0 99.9
Heroin 47 14.0 32.0 53.8 0.2 Heroin 22 n/a n/a n/a n/a
Methamphetamine 1 n/a n/a n/a n/a Methamphetamine 0 - - - -1 - Credit, fronted, manufactured, transport/steal drugs, gift, other
Drugs obtained by Cash, Non-cash, and Combination Transactions2
Acquiring Drugs by Non-Cash (Manufacture or Other)3
2 - Respondents report most recent cash and non-cash transactions
3 - Data not annualized due to small numbers of people manufacturing
Cook County, IL, 2008 Page 100
0% 20% 40% 60% 80% 100%
Methamphetamine
Heroin
Marijuana
Powder Cocaine
Crack Cocaine
Cash Only Non-cash Only Cash and non-cash
0% 20% 40% 60% 80% 100%
Methamphetamine
Heroin
Marijuana
Powder Cocaine
Crack Cocaine
Manufactured Non-Manufactured
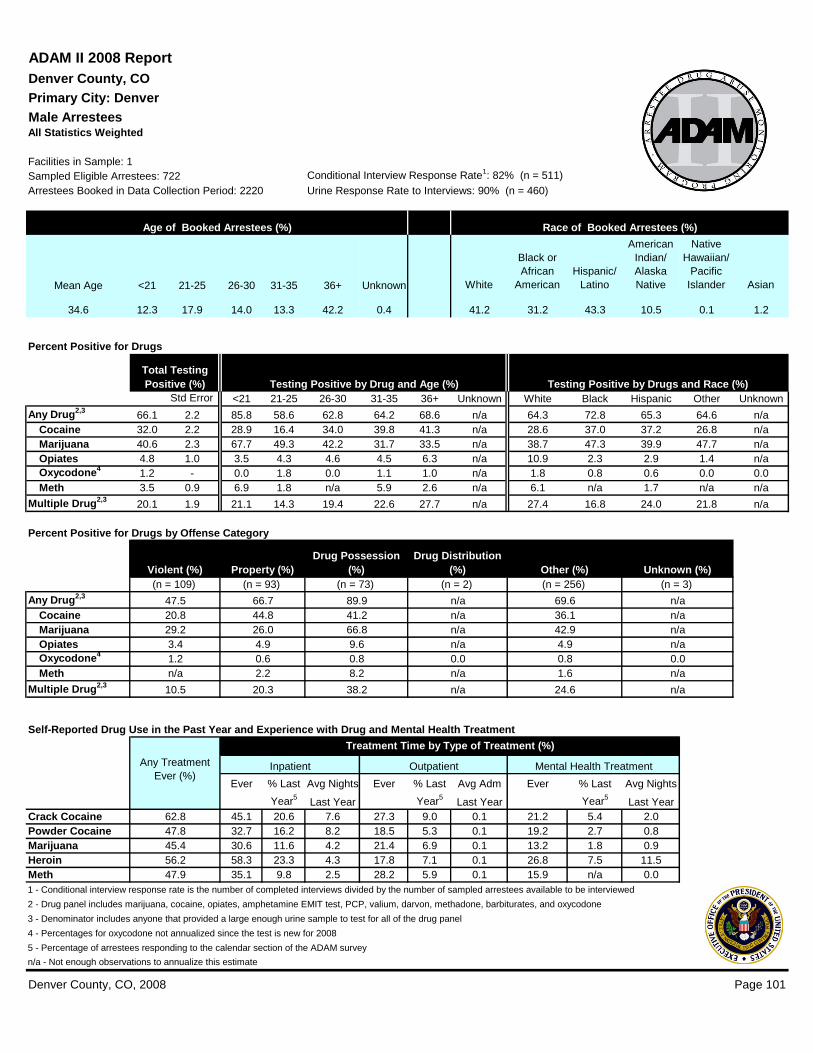
ADAM II 2008 Report
Denver County, CO
Primary City: Denver
Male ArresteesAll Statistics Weighted
Facilities in Sample: 1
Sampled Eligible Arrestees: 722 Conditional Interview Response Rate1: 82% (n = 511)
Arrestees Booked in Data Collection Period: 2220 Urine Response Rate to Interviews: 90% (n = 460)
Mean Age <21 21-25 26-30 31-35 36+ Unknown White
Black or
African
American
Hispanic/
Latino
American
Indian/
Alaska
Native
Native
Hawaiian/
Pacific
Islander Asian
34.6 12.3 17.9 14.0 13.3 42.2 0.4 41.2 31.2 43.3 10.5 0.1 1.2
Percent Positive for Drugs
Std Error <21 21-25 26-30 31-35 36+ Unknown White Black Hispanic Other Unknown
Any Drug2,3
66.1 2.2 85.8 58.6 62.8 64.2 68.6 n/a 64.3 72.8 65.3 64.6 n/a
Cocaine 32.0 2.2 28.9 16.4 34.0 39.8 41.3 n/a 28.6 37.0 37.2 26.8 n/a
Marijuana 40.6 2.3 67.7 49.3 42.2 31.7 33.5 n/a 38.7 47.3 39.9 47.7 n/a
Opiates 4.8 1.0 3.5 4.3 4.6 4.5 6.3 n/a 10.9 2.3 2.9 1.4 n/a
Oxycodone4
1.2 - 0.0 1.8 0.0 1.1 1.0 n/a 1.8 0.8 0.6 0.0 0.0
Meth 3.5 0.9 6.9 1.8 n/a 5.9 2.6 n/a 6.1 n/a 1.7 n/a n/a
Multiple Drug2,3
20.1 1.9 21.1 14.3 19.4 22.6 27.7 n/a 27.4 16.8 24.0 21.8 n/a
Percent Positive for Drugs by Offense Category
(n = 109) (n = 93) (n = 73) (n = 2) (n = 256) (n = 3)
Any Drug2,3
47.5 66.7 89.9 n/a 69.6 n/a
Cocaine 20.8 44.8 41.2 n/a 36.1 n/a
Marijuana 29.2 26.0 66.8 n/a 42.9 n/a
Opiates 3.4 4.9 9.6 n/a 4.9 n/a
Oxycodone4
1.2 0.6 0.8 0.0 0.8 0.0
Meth n/a 2.2 8.2 n/a 1.6 n/a
Multiple Drug2,3
10.5 20.3 38.2 n/a 24.6 n/a
Self-Reported Drug Use in the Past Year and Experience with Drug and Mental Health Treatment
Ever % Last Avg Nights Ever % Last Avg Adm Ever % Last Avg Nights
Year5
Last Year Year5
Last Year Year5
Last Year
Crack Cocaine 62.8 45.1 20.6 7.6 27.3 9.0 0.1 21.2 5.4 2.0
Powder Cocaine 47.8 32.7 16.2 8.2 18.5 5.3 0.1 19.2 2.7 0.8
Marijuana 45.4 30.6 11.6 4.2 21.4 6.9 0.1 13.2 1.8 0.9
Heroin 56.2 58.3 23.3 4.3 17.8 7.1 0.1 26.8 7.5 11.5
Meth 47.9 35.1 9.8 2.5 28.2 5.9 0.1 15.9 n/a 0.0
1 - Conditional interview response rate is the number of completed interviews divided by the number of sampled arrestees available to be interviewed
2 - Drug panel includes marijuana, cocaine, opiates, amphetamine EMIT test, PCP, valium, darvon, methadone, barbiturates, and oxycodone
3 - Denominator includes anyone that provided a large enough urine sample to test for all of the drug panel
4 - Percentages for oxycodone not annualized since the test is new for 2008
5 - Percentage of arrestees responding to the calendar section of the ADAM survey
n/a - Not enough observations to annualize this estimate
Denver County, CO, 2008 Page 101
Age of Booked Arrestees (%)
Treatment Time by Type of Treatment (%)
Testing Positive by Drug and Age (%) Testing Positive by Drugs and Race (%)
Violent (%) Property (%)
Drug Possession
(%)
Drug Distribution
(%)
Race of Booked Arrestees (%)
Other (%) Unknown (%)
Total Testing
Positive (%)
Any Treatment
Ever (%)Mental Health TreatmentInpatient Outpatient
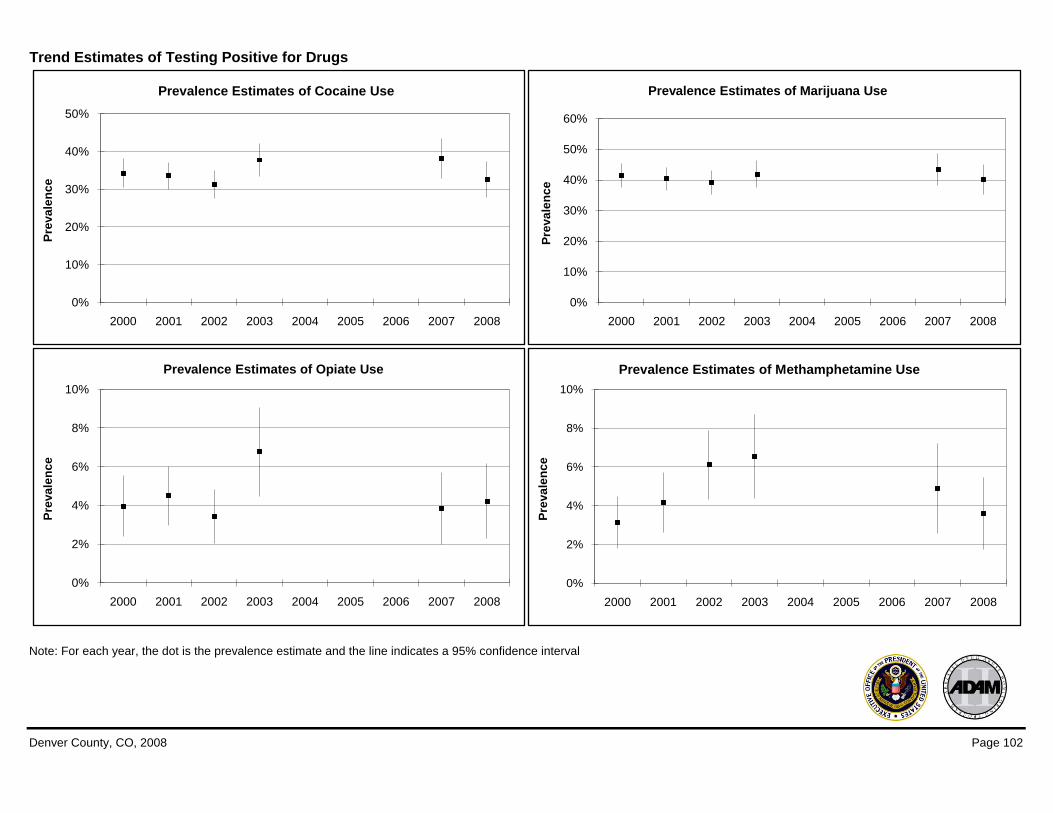
Trend Estimates of Testing Positive for Drugs
Note: For each year, the dot is the prevalence estimate and the line indicates a 95% confidence interval
Denver County, CO, 2008 Page 102
0%
2%
4%
6%
8%
10%
2000 2001 2002 2003 2004 2005 2006 2007 2008
Pre
va
len
ce
Prevalence Estimates of Methamphetamine Use
0%
10%
20%
30%
40%
50%
2000 2001 2002 2003 2004 2005 2006 2007 2008
Pre
va
len
ce
Prevalence Estimates of Cocaine Use
0%
2%
4%
6%
8%
10%
2000 2001 2002 2003 2004 2005 2006 2007 2008
Pre
va
len
ce
Prevalence Estimates of Opiate Use
0%
10%
20%
30%
40%
50%
60%
2000 2001 2002 2003 2004 2005 2006 2007 2008
Pre
va
len
ce
Prevalence Estimates of Marijuana Use

Description of the Sample
None 29.1Own house, mobile
home, apartment52.9
Working full time/
active military status44.4 No Insurance 67.1
High school or GED 42.4
Someone else's
house, mobile home,
apartment
29.0Working part-time/
seasonal 15.5
Individually
Purchased3.9
Vocational or trade
school3.8 Group quarters
1 4.7Unemployed (looking
for work)20.6
Employer or Union
Funded17.2
Some college or two-
year associate 19.7
Hospital or care
facility0.6
Unemployed (not
looking for work)9.1
State Government
Funded6.7
Four year degree or
higher5.0 Incarceration Facility 1.1 In school only 1.8 Retirement Medicare 0.8
Shelter/ No Fixed
Residence11.5 Retired 0.7 Disability Medicare 3.1
Other 0.2Disabled for work or
on leave7.5 Veterans Affairs 1.0
Other 0.4 Multiple Types 0.2
Crack Cocaine 20.5 Crack Cocaine n/a
Powder Cocaine 17.7 Powder Cocaine 4.2
Marijuana 49.4 Heroin 63.5
Heroin 2.3 Methamphetamine 3.3
Methamphetamine 5.1 Other2
0.0
Crack Cocaine 6.3
Powder Cocaine 2.3
Marijuana 9.8
Heroin 7.5
Methamphetamine 4.8
Crack Cocaine 16.8
Powder Cocaine 10.6 None 49.4
Marijuana 44.7 1-2 39.0
Heroin 1.6 3-5 5.9
Methamphetamine 3.2 6 or more 5.6
1 - Group quarters include residential hotel, rooming house, dormitory, group home, student housing, or military base
2 - "Other injection use not annualized since it was a new question in 2008
n/a - Not enough observations to annualize this estimate
Denver County, CO, 2008 Page 103
Education of Booked
Arrestees (%)
Current Housing for Booked
Arrestees (%)
Current Employment Status for
Booked Arrestees (%)
Current Health Insurance for
Booked Arrestees (%)
Self-Reported Arrests in Past
Year (%)
Percent Testing Positive for those who Self-Reported 3-Day and 7-
Day Use
Injection at most recent use
(%)
Average Number of Days
per Month Used Past Year
by Drug among Self-
Reported 12-Month Users
Self Reported Use of Five
Primary Drugs - Past 12
Month Use (%)
Past 30 Day Self-Reported
Drug Use (%)
0% 20% 40% 60% 80% 100%
Meth
Opiates
Marijuana
Cocaine
Seven Day Use Three Day Use

Dynamics of Drug Markets in Past 30 Days
Place where Last Purchase Occurred (%) Method of Non-Cash Transaction (%)
Public House Outdoor Other Trade Trade Trade
n Building Apartment Area Area n Drugs Property Sex Other1
Crack Cocaine 55 9.9 33.4 53.9 2.8 Crack Cocaine 45 1.0 7.6 0.0 91.3
Powder Cocaine 27 15.5 35.8 48.3 0.4 Powder Cocaine 24 0.3 0.6 0.0 99.0
Marijuana 119 9.7 46.2 42.7 1.3 Marijuana 161 2.4 1.0 0.0 96.6
Heroin 8 10.1 15.3 73.0 1.6 Heroin 2 n/a n/a n/a n/a
Methamphetamine 8 2.9 35.5 50.3 11.4 Methamphetamine 5 n/a n/a n/a n/a1 - Credit, fronted, manufactured, transport/steal drugs, gift, other
Drugs obtained by Cash, Non-cash, and Combination Transactions2
Acquiring Drugs by Non-Cash (Manufacture or Other)3
2 - Respondents report most recent cash and non-cash transactions
3 - Data not annualized due to small numbers of people manufacturing
Denver County, CO, 2008 Page 104
0% 20% 40% 60% 80% 100%
Methamphetamine
Heroin
Marijuana
Powder Cocaine
Crack Cocaine
Cash Only Non-cash Only Cash and non-cash
0% 20% 40% 60% 80% 100%
Methamphetamine
Heroin
Marijuana
Powder Cocaine
Crack Cocaine
Manufactured Non-Manufactured

ADAM II 2008 Report
Marion County, IN
Primary City: Indianapolis
Male ArresteesAll Statistics Weighted
Facilities in Sample: 1
Sampled Eligible Arrestees: 1083 Conditional Interview Response Rate1: 89% (n = 578)
Arrestees Booked in Data Collection Period: 3526 Urine Response Rate to Interviews: 91% (n = 524)
Mean Age <21 21-25 26-30 31-35 36+ Unknown White
Black or
African
American
Hispanic/
Latino
American
Indian/
Alaska
Native
Native
Hawaiian/
Pacific
Islander Asian
33.1 12.4 21.5 14.6 13.3 38.0 0.2 51.8 44.3 10.8 6.5 n/a n/a
Percent Positive for Drugs
Std Error <21 21-25 26-30 31-35 36+ Unknown White Black Hispanic Other Unknown
Any Drug2,3
62.6 2.2 77.4 69.8 67.6 43.3 56.9 n/a 61.0 68.2 33.5 45.4 n/a
Cocaine 21.3 1.9 6.2 8.5 22.9 7.1 37.0 n/a 13.7 31.1 11.0 11.5 n/a
Marijuana 45.6 2.3 75.3 61.4 49.7 39.9 27.0 n/a 41.3 52.8 29.1 35.1 n/a
Opiates 6.2 1.1 n/a 5.1 9.6 1.0 4.8 n/a 7.0 3.3 n/a n/a n/a
Oxycodone4
1.2 - 2.7 2.9 0.4 0.0 0.6 n/a 2.1 0.4 1.9 0.0 0.0
Meth 1.9 - n/a 10.4 n/a n/a n/a n/a 0.0 1.9 n/a n/a n/a
Multiple Drug2,3
20.9 1.9 22.8 15.4 30.2 13.8 21.9 n/a 21.5 20.9 14.3 n/a n/a
Percent Positive for Drugs by Offense Category
(n = 108) (n = 105) (n = 91) (n = 8) (n = 306) (n = 30)
Any Drug2,3
53.6 59.8 85.1 100.0 59.4 56.3
Cocaine 13.4 25.4 26.3 46.6 19.0 4.3
Marijuana 44.9 35.2 60.1 85.3 42.6 35.7
Opiates 0.6 3.3 10.6 n/a 5.5 n/a
Oxycodone4
0.8 0.4 2.3 9.1 1.5 1.5
Meth n/a 2.7 10.2 n/a 5.4 n/a
Multiple Drug2,3
14.6 17.0 33.3 41.2 21.4 2.4
Self-Reported Drug Use in the Past Year and Experience with Drug and Mental Health Treatment
Ever % Last Avg Nights Ever % Last Avg Adm Ever % Last Avg Nights
Year5
Last Year Year5
Last Year Year5
Last Year
Crack Cocaine 52.5 27.5 5.8 5.1 41.2 10.7 0.2 9.5 2.2 0.4
Powder Cocaine 54.5 35.7 8.9 7.8 47.6 14.3 0.2 8.9 3.9 0.4
Marijuana 40.3 13.8 3.1 1.8 34.6 9.8 0.1 9.5 3.9 0.8
Heroin 80.6 77.4 21.0 1.0 63.1 25.9 0.3 n/a n/a n/a
Meth 52.2 36.3 n/a n/a 46.3 1.1 n/a 12.8 n/a n/a
1 - Conditional interview response rate is the number of completed interviews divided by the number of sampled arrestees available to be interviewed
2 - Drug panel includes marijuana, cocaine, opiates, amphetamine EMIT test, PCP, valium, darvon, methadone, barbiturates, and oxycodone
3 - Denominator includes anyone that provided a large enough urine sample to test for all of the drug panel
4 - Percentages for oxycodone not annualized since the test is new for 2008
5 - Percentage of arrestees responding to the calendar section of the ADAM survey
n/a - Not enough observations to annualize this estimate
Marion County, IN, 2008 Page 105
Age of Booked Arrestees (%)
Treatment Time by Type of Treatment (%)
Testing Positive by Drug and Age (%) Testing Positive by Drugs and Race (%)
Violent (%) Property (%)
Drug Possession
(%)
Drug Distribution
(%)
Ethnicity/Race of Booked Arrestees (%)
Other (%) Unknown (%)
Total Testing
Positive (%)
Any Treatment
Ever (%)Mental Health TreatmentInpatient Outpatient

Trend Estimates of Testing Positive for Drugs
Note: For each year, the dot is the prevalence estimate and the line indicates a 95% confidence interval
Marion County, IN, 2008 Page 106
0%
1%
2%
3%
4%
5%
6%
2000 2001 2002 2003 2004 2005 2006 2007 2008
Pre
va
len
ce
Prevalence Estimates of Methamphetamine Use
0%
5%
10%
15%
20%
25%
30%
35%
40%
45%
2000 2001 2002 2003 2004 2005 2006 2007 2008
Pre
va
len
ce
Prevalence Estimates of Cocaine Use
0%
2%
4%
6%
8%
10%
2000 2001 2002 2003 2004 2005 2006 2007 2008
Pre
va
len
ce
Prevalence Estimates of Opiate Use
0%
10%
20%
30%
40%
50%
60%
2000 2001 2002 2003 2004 2005 2006 2007 2008
Pre
va
len
ce
Prevalence Estimates of Marijuana Use

Description of the Sample
None 31.7Own house, mobile
home, apartment51.7
Working full time/
active military status50.2 No Insurance 66.3
High school or GED 44.0
Someone else's
house, mobile home,
apartment
40.1Working part-time/
seasonal 15.1
Individually
Purchased5.3
Vocational or trade
school3.8 Group quarters
1 2.5Unemployed (looking
for work)21.3
Employer or Union
Funded19.6
Some college or two-
year associate 16.9
Hospital or care
facility0.1
Unemployed (not
looking for work)4.0
State Government
Funded6.1
Four year degree or
higher3.5 Incarceration Facility 1.5 In school only 1.3 Retirement Medicare 0.6
Shelter/ No Fixed
Residence3.9 Retired 1.2 Disability Medicare 1.7
Other 0.2Disabled for work or
on leave6.5 Veterans Affairs 0.3
Other 0.6 Multiple Types 0.1
Crack Cocaine 14.4 Crack Cocaine n/a
Powder Cocaine 9.4 Powder Cocaine 6.3
Marijuana 51.1 Heroin 60.6
Heroin 1.9 Methamphetamine 17.2
Methamphetamine 2.6 Other2
0.0
Crack Cocaine 6.3
Powder Cocaine 1.8
Marijuana 11.1
Heroin 10.8
Methamphetamine 2.8
Crack Cocaine 11.0
Powder Cocaine 3.9 None 52.3
Marijuana 43.2 1-2 37.4
Heroin 1.4 3-5 3.7
Methamphetamine 1.2 6 or more 6.6
1 - Group quarters include residential hotel, rooming house, dormitory, group home, student housing, or military base
2 - "Other" injection use not annualized since it was a new question in 2008
n/a - Not enough observations to annualize this estimate
Marion County, IN, 2008 Page 107
Education of Booked
Arrestees (%)
Current Housing for Booked
Arrestees (%)
Current Employment Status for
Booked Arrestees (%)
Current Health Insurance for
Booked Arrestees (%)
Self-Reported Arrests in Past
Year (%)
Percent Testing Positive for those who Self-Reported 3-Day and 7-
Day Use
Injection at most recent use
(%)
Average Number of Days
per Month Used Past Year
by Drug among Self-
Reported 12-Month Users
Self Reported Use of Five
Primary Drugs - Past 12
Month Use (%)
Past 30 Day Self-Reported
Drug Use (%)
0% 20% 40% 60% 80% 100%
Meth
Opiates
Marijuana
Cocaine
Seven Day Use Three Day Use
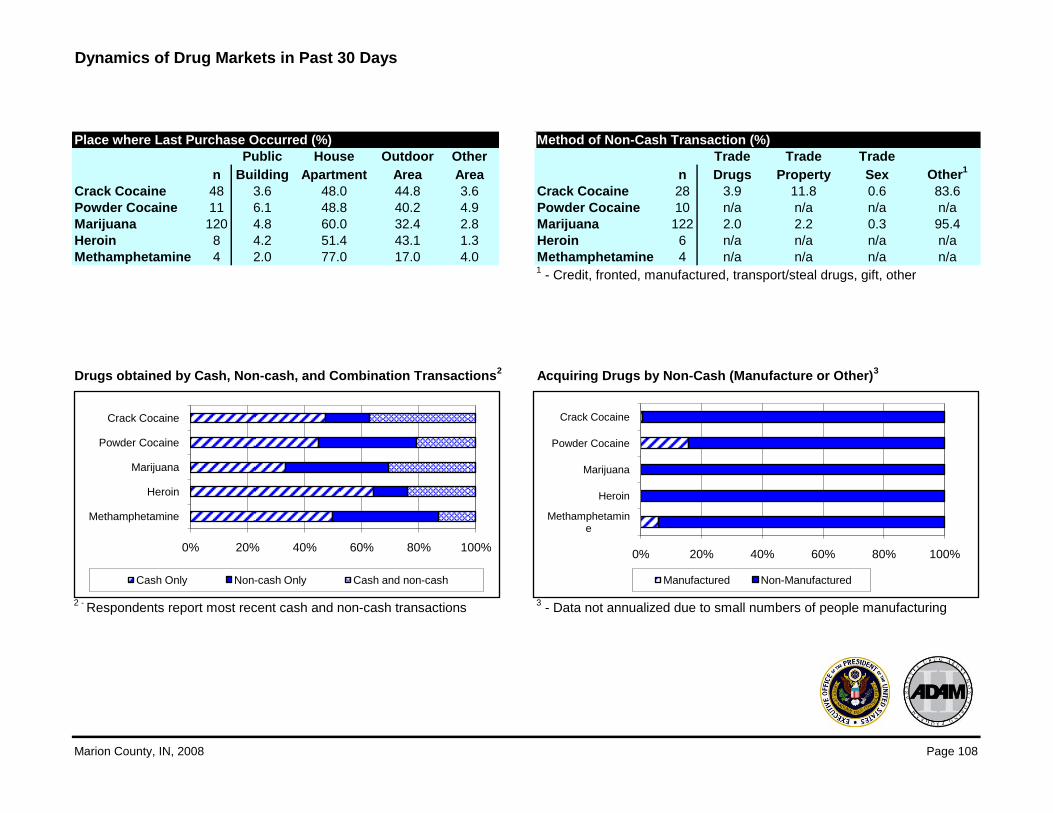
Dynamics of Drug Markets in Past 30 Days
Place where Last Purchase Occurred (%) Method of Non-Cash Transaction (%)
Public House Outdoor Other Trade Trade Trade
n Building Apartment Area Area n Drugs Property Sex Other1
Crack Cocaine 48 3.6 48.0 44.8 3.6 Crack Cocaine 28 3.9 11.8 0.6 83.6
Powder Cocaine 11 6.1 48.8 40.2 4.9 Powder Cocaine 10 n/a n/a n/a n/a
Marijuana 120 4.8 60.0 32.4 2.8 Marijuana 122 2.0 2.2 0.3 95.4
Heroin 8 4.2 51.4 43.1 1.3 Heroin 6 n/a n/a n/a n/a
Methamphetamine 4 2.0 77.0 17.0 4.0 Methamphetamine 4 n/a n/a n/a n/a1 - Credit, fronted, manufactured, transport/steal drugs, gift, other
Drugs obtained by Cash, Non-cash, and Combination Transactions2
Acquiring Drugs by Non-Cash (Manufacture or Other)3
2 - Respondents report most recent cash and non-cash transactions
3 - Data not annualized due to small numbers of people manufacturing
Marion County, IN, 2008 Page 108
0% 20% 40% 60% 80% 100%
Methamphetamine
Heroin
Marijuana
Powder Cocaine
Crack Cocaine
Cash Only Non-cash Only Cash and non-cash
0% 20% 40% 60% 80% 100%
Methamphetamine
Heroin
Marijuana
Powder Cocaine
Crack Cocaine
Manufactured Non-Manufactured
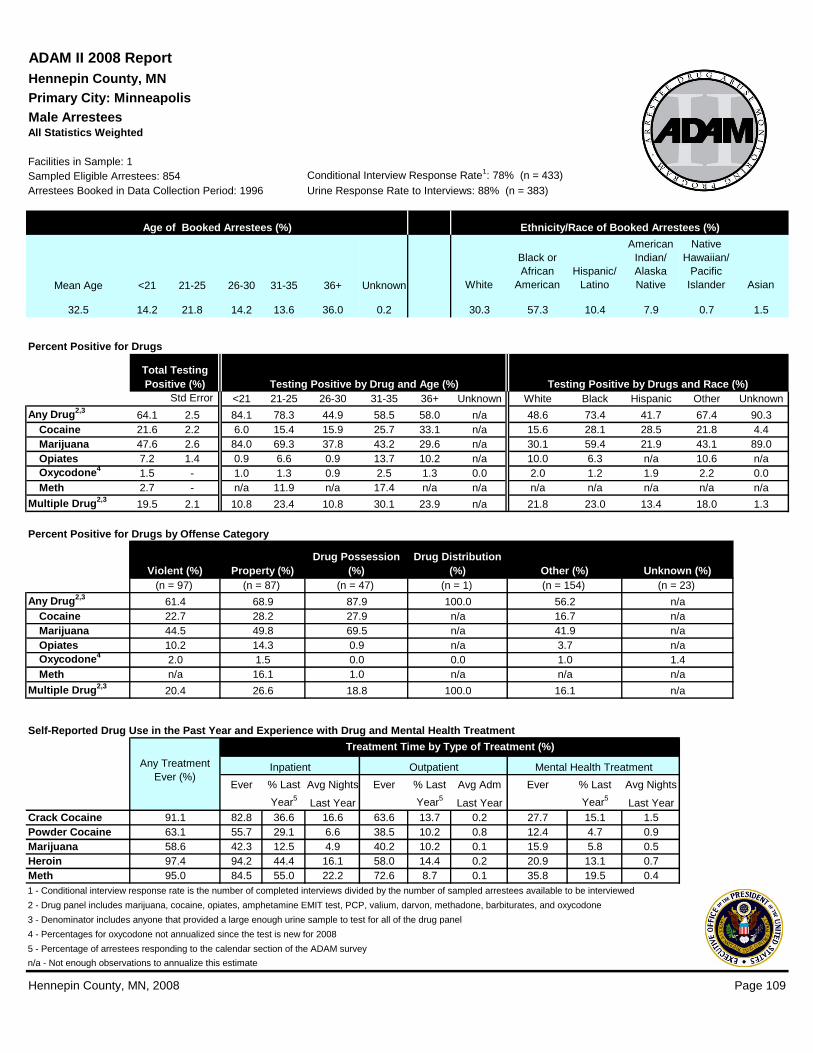
ADAM II 2008 Report
Hennepin County, MN
Primary City: Minneapolis
Male ArresteesAll Statistics Weighted
Facilities in Sample: 1
Sampled Eligible Arrestees: 854 Conditional Interview Response Rate1: 78% (n = 433)
Arrestees Booked in Data Collection Period: 1996 Urine Response Rate to Interviews: 88% (n = 383)
Mean Age <21 21-25 26-30 31-35 36+ Unknown White
Black or
African
American
Hispanic/
Latino
American
Indian/
Alaska
Native
Native
Hawaiian/
Pacific
Islander Asian
32.5 14.2 21.8 14.2 13.6 36.0 0.2 30.3 57.3 10.4 7.9 0.7 1.5
Percent Positive for Drugs
Std Error <21 21-25 26-30 31-35 36+ Unknown White Black Hispanic Other Unknown
Any Drug2,3
64.1 2.5 84.1 78.3 44.9 58.5 58.0 n/a 48.6 73.4 41.7 67.4 90.3
Cocaine 21.6 2.2 6.0 15.4 15.9 25.7 33.1 n/a 15.6 28.1 28.5 21.8 4.4
Marijuana 47.6 2.6 84.0 69.3 37.8 43.2 29.6 n/a 30.1 59.4 21.9 43.1 89.0
Opiates 7.2 1.4 0.9 6.6 0.9 13.7 10.2 n/a 10.0 6.3 n/a 10.6 n/a
Oxycodone4
1.5 - 1.0 1.3 0.9 2.5 1.3 0.0 2.0 1.2 1.9 2.2 0.0
Meth 2.7 - n/a 11.9 n/a 17.4 n/a n/a n/a n/a n/a n/a n/a
Multiple Drug2,3
19.5 2.1 10.8 23.4 10.8 30.1 23.9 n/a 21.8 23.0 13.4 18.0 1.3
Percent Positive for Drugs by Offense Category
(n = 97) (n = 87) (n = 47) (n = 1) (n = 154) (n = 23)
Any Drug2,3
61.4 68.9 87.9 100.0 56.2 n/a
Cocaine 22.7 28.2 27.9 n/a 16.7 n/a
Marijuana 44.5 49.8 69.5 n/a 41.9 n/a
Opiates 10.2 14.3 0.9 n/a 3.7 n/a
Oxycodone4
2.0 1.5 0.0 0.0 1.0 1.4
Meth n/a 16.1 1.0 n/a n/a n/a
Multiple Drug2,3
20.4 26.6 18.8 100.0 16.1 n/a
Self-Reported Drug Use in the Past Year and Experience with Drug and Mental Health Treatment
Ever % Last Avg Nights Ever % Last Avg Adm Ever % Last Avg Nights
Year5
Last Year Year5
Last Year Year5
Last Year
Crack Cocaine 91.1 82.8 36.6 16.6 63.6 13.7 0.2 27.7 15.1 1.5
Powder Cocaine 63.1 55.7 29.1 6.6 38.5 10.2 0.8 12.4 4.7 0.9
Marijuana 58.6 42.3 12.5 4.9 40.2 10.2 0.1 15.9 5.8 0.5
Heroin 97.4 94.2 44.4 16.1 58.0 14.4 0.2 20.9 13.1 0.7
Meth 95.0 84.5 55.0 22.2 72.6 8.7 0.1 35.8 19.5 0.4
1 - Conditional interview response rate is the number of completed interviews divided by the number of sampled arrestees available to be interviewed
2 - Drug panel includes marijuana, cocaine, opiates, amphetamine EMIT test, PCP, valium, darvon, methadone, barbiturates, and oxycodone
3 - Denominator includes anyone that provided a large enough urine sample to test for all of the drug panel
4 - Percentages for oxycodone not annualized since the test is new for 2008
5 - Percentage of arrestees responding to the calendar section of the ADAM survey
n/a - Not enough observations to annualize this estimate
Hennepin County, MN, 2008 Page 109
Age of Booked Arrestees (%)
Treatment Time by Type of Treatment (%)
Testing Positive by Drug and Age (%) Testing Positive by Drugs and Race (%)
Violent (%) Property (%)
Drug Possession
(%)
Drug Distribution
(%)
Ethnicity/Race of Booked Arrestees (%)
Other (%) Unknown (%)
Total Testing
Positive (%)
Any Treatment
Ever (%)Mental Health TreatmentInpatient Outpatient

Trend Estimates of Testing Positive for Drugs
Note: For each year, the dot is the prevalence estimate and the line indicates a 95% confidence interval
Hennepin County, MN, 2008 Page 110
0%
1%
2%
3%
4%
5%
6%
7%
8%
2000 2001 2002 2003 2004 2005 2006 2007 2008
Pre
va
len
ce
Prevalence Estimates of Methamphetamine Use
0%
5%
10%
15%
20%
25%
30%
35%
40%
2000 2001 2002 2003 2004 2005 2006 2007 2008
Pre
va
len
ce
Prevalence Estimates of Cocaine Use
0%
2%
4%
6%
8%
10%
2000 2001 2002 2003 2004 2005 2006 2007 2008
Pre
va
len
ce
Prevalence Estimates of Opiate Use
0%
10%
20%
30%
40%
50%
60%
70%
2000 2001 2002 2003 2004 2005 2006 2007 2008
Pre
va
len
ce
Prevalence Estimates of Marijuana Use

Description of the Sample
None 27.0Own house, mobile
home, apartment49.6
Working full time/
active military status31.6 No Insurance 45.4
High school or GED 44.9
Someone else's
house, mobile home,
apartment
37.0Working part-time/
seasonal 15.9
Individually
Purchased6.0
Vocational or trade
school5.9 Group quarters
1 3.6Unemployed (looking
for work)29.2
Employer or Union
Funded20.3
Some college or two-
year associate 18.0
Hospital or care
facility0.8
Unemployed (not
looking for work)9.3
State Government
Funded23.4
Four year degree or
higher4.1 Incarceration Facility 1.2 In school only 3.2 Retirement Medicare 0.6
Shelter/ No Fixed
Residence7.6 Retired 0.8 Disability Medicare 3.6
Other 0.2Disabled for work or
on leave9.6 Veterans Affairs 0.6
Other 0.5 Multiple Types 0.2
Crack Cocaine 15.7 Crack Cocaine 0.0
Powder Cocaine 10.3 Powder Cocaine 6.9
Marijuana 51.9 Heroin 35.4
Heroin 4.1 Methamphetamine 12.8
Methamphetamine 4.3 Other2
7.1
Crack Cocaine 9.8
Powder Cocaine 2.6
Marijuana 10.9
Heroin 11.6
Methamphetamine 6.7
Crack Cocaine 14.9
Powder Cocaine 6.2 None 36.8
Marijuana 45.8 1-2 45.2
Heroin 3.1 3-5 8.8
Methamphetamine 3.1 6 or more 9.2
1 - Group quarters include residential hotel, rooming house, dormitory, group home, student housing, or military base
2 - "Other" injection use not annualized since it was a new question in 2008
n/a - Not enough observations to annualize this estimate
Hennepin County, MN, 2008 Page 111
Education of Booked
Arrestees (%)
Current Housing for Booked
Arrestees (%)
Current Employment Status for
Booked Arrestees (%)
Current Health Insurance for
Booked Arrestees (%)
Self-Reported Arrests in Past
Year (%)
Percent Testing Positive for those who Self-Reported 3-Day and 7-
Day Use
Injection at most recent use
(%)
Average Number of Days
per Month Used Past Year
by Drug among Self-
Reported 12-Month Users
Self Reported Use of Five
Primary Drugs - Past 12
Month Use (%)
Past 30 Day Self-Reported
Drug Use (%)
0% 20% 40% 60% 80% 100%
Meth
Opiates
Marijuana
Cocaine
Seven Day Use Three Day Use

Dynamics of Drug Markets in Past 30 Days
Place where Last Purchase Occurred (%) Method of Non-Cash Transaction (%)
Public House Outdoor Other Trade Trade Trade
n Building Apartment Area Area n Drugs Property Sex Other1
Crack Cocaine 57 7.2 32.2 59.4 1.3 Crack Cocaine 33 3.6 13.8 1.2 81.5
Powder Cocaine 16 15.3 50.4 32.3 2.0 Powder Cocaine 16 n/a n/a n/a n/a
Marijuana 125 9.8 31.3 57.6 1.3 Marijuana 145 0.6 0.5 0.1 98.8
Heroin 13 7.8 25.3 64.6 2.3 Heroin 9 n/a n/a n/a n/a
Methamphetamine 5 2.5 76.8 20.7 0.0 Methamphetamine 11 n/a n/a n/a n/a1 - Credit, fronted, manufactured, transport/steal drugs, gift, other
Drugs obtained by Cash, Non-cash, and Combination Transactions2
Acquiring Drugs by Non-Cash (Manufacture or Other)3
2 - Respondents report most recent cash and non-cash transactions
3 - Data not annualized due to small numbers of people manufacturing
Hennepin County, MN, 2008 Page 112
0% 20% 40% 60% 80% 100%
Methamphetamine
Heroin
Marijuana
Powder Cocaine
Crack Cocaine
Cash Only Non-cash Only Cash and non-cash
0% 20% 40% 60% 80% 100%
Methamphetamine
Heroin
Marijuana
Powder Cocaine
Crack Cocaine
Manufactured Non-Manufactured

ADAM II 2008 Report
Manhattan, New York City, NY
Male ArresteesAll Statistics Weighted
Facilities in Sample: 1
Sampled Eligible Arrestees: 1094 Conditional Interview Response Rate1: 66% (n = 515)
Arrestees Booked in Data Collection Period: 4444 Urine Response Rate to Interviews: 71% (n = 365)
Mean Age <21 21-25 26-30 31-35 36+ Unknown White
Black or
African
American
Hispanic/
Latino
American
Indian/
Alaska
Native
Native
Hawaiian/
Pacific
Islander Asian
32.9 15.4 21.9 15.3 12.7 32.1 2.6 16.5 46.7 44.1 4.4 n/a 3.4
Percent Positive for Drugs
Std Error <21 21-25 26-30 31-35 36+ Unknown White Black Hispanic Other Unknown
Any Drug2,3
63.3 2.5 67.2 52.1 59.3 63.5 62.7 2.7 61.8 65.1 63.1 45.0 18.1
Cocaine 26.8 2.6 12.6 11.8 12.3 17.1 45.7 n/a 34.9 29.9 20.8 10.5 12.4
Marijuana 40.0 2.6 62.7 44.9 55.5 47.6 25.8 n/a 28.7 45.2 47.7 39.4 16.5
Opiates 6.9 1.7 n/a 4.0 0.5 10.5 7.0 n/a 13.3 3.2 6.8 7.9 5.7
Oxycodone4
0.4 - 0.0 1.7 0.0 1.7 0.2 n/a 1.5 0.1 1.3 2.2 0.0
Meth 0.7 - n/a n/a n/a n/a n/a n/a n/a n/a n/a n/a n/a
Multiple Drug2,3
22.5 2.6 6.9 18.7 17.2 25.9 25.6 n/a 35.9 18.6 20.4 11.9 10.1
Percent Positive for Drugs by Offense Category
(n = 66) (n = 113) (n = 58) (n = 34) (n = 134) (n = 22)
Any Drug2,3
58.5 68.2 95.6 80.2 50.5 n/a
Cocaine 19.2 34.0 35.6 33.9 19.7 41.5
Marijuana 42.7 40.9 67.2 69.5 40.0 75.4
Opiates 3.6 6.6 10.0 11.8 2.6 n/a
Oxycodone4
0.8 0.8 0.0 0.0 0.5 0.0
Meth n/a n/a n/a n/a n/a n/a
Multiple Drug2,3
19.5 28.0 25.0 36.9 16.7 n/a
Self-Reported Drug Use in the Past Year and Experience with Drug and Mental Health Treatment
Ever % Last Avg Nights Ever % Last Avg Adm Ever % Last Avg Nights
Year5
Last Year Year5
Last Year Year5
Last Year
Crack Cocaine 78.9 67.8 38.5 16.2 53.5 33.0 1.1 25.3 12.1 11.4
Powder Cocaine 68.6 55.0 23.9 10.3 56.5 28.5 1.1 20.5 5.9 3.5
Marijuana 43.0 27.0 10.2 3.2 27.4 11.1 0.2 12.7 3.9 2.4
Heroin 75.4 53.4 23.0 1.6 63.5 42.3 0.9 30.2 13.3 6.9
Meth 82.2 79.0 14.3 n/a 36.8 n/a 0.3 20.8 n/a n/a
1 - Conditional interview response rate is the number of completed interviews divided by the number of sampled arrestees available to be interviewed
2 - Drug panel includes marijuana, cocaine, opiates, amphetamine EMIT test, PCP, valium, darvon, methadone, barbiturates, and oxycodone
3 - Denominator includes anyone that provided a large enough urine sample to test for all of the drug panel
4 - Percentages for oxycodone not annualized since the test is new for 2008
5 - Percentage of arrestees responding to the calendar section of the ADAM survey
n/a - Not enough observations to annualize this estimate
Manhattan, NY, 2008 Page 113
Age of Booked Arrestees (%)
Treatment Time by Type of Treatment (%)
Testing Positive by Drug and Age (%) Testing Positive by Drugs and Race (%)
Violent (%) Property (%)
Drug Possession
(%)
Drug Distribution
(%)
Ethnicity/Race of Booked Arrestees (%)
Other (%) Unknown (%)
Total Testing
Positive (%)
Any Treatment
Ever (%)Mental Health TreatmentInpatient Outpatient

Trend Estimates of Testing Positive for Drugs
Note: For each year, the dot is the prevalence estimate and the line indicates a 95% confidence interval
Manhattan, NY, 2008 Page 114
0%
10%
20%
30%
40%
50%
60%
2000 2001 2002 2003 2004 2005 2006 2007 2008
Pre
va
len
ce
Prevalence Estimates of Cocaine Use
0%
5%
10%
15%
20%
25%
2000 2001 2002 2003 2004 2005 2006 2007 2008
Pre
va
len
ce
Prevalence Estimates of Opiate Use
0%
10%
20%
30%
40%
50%
60%
2000 2001 2002 2003 2004 2005 2006 2007 2008
Pre
va
len
ce
Prevalence Estimates of Marijuana Use

Description of the Sample
None 27.0Own house, mobile
home, apartment52.9
Working full time/
active military status44.0 No Insurance 47.4
High school or GED 37.9
Someone else's
house, mobile home,
apartment
32.0Working part-time/
seasonal 14.9
Individually
Purchased5.5
Vocational or trade
school1.3 Group quarters
1 3.4Unemployed (looking
for work)23.8
Employer or Union
Funded16.0
Some college or two-
year associate 26.0
Hospital or care
facility0.4
Unemployed (not
looking for work)10.8
State Government
Funded29.0
Four year degree or
higher7.9 Incarceration Facility 0.6 In school only 2.9 Retirement Medicare 0.5
Shelter/ No Fixed
Residence10.6 Retired 0.3 Disability Medicare 1.3
Other 0.1Disabled for work or
on leave3.0 Veterans Affairs 0.4
Other 0.3 Multiple Types 0.0
Crack Cocaine 9.4 Crack Cocaine n/a
Powder Cocaine 11.1 Powder Cocaine 28.7
Marijuana 44.6 Heroin 45.6
Heroin 7.0 Methamphetamine n/a
Methamphetamine 0.7 Other2
3.7
Crack Cocaine 10.9
Powder Cocaine 8.2
Marijuana 13.3
Heroin 11.3
Methamphetamine n/a
Crack Cocaine 7.8
Powder Cocaine 7.0 None 53.8
Marijuana 40.1 1-2 36.5
Heroin 4.9 3-5 3.9
Methamphetamine 0.3 6 or more 5.8
1 - Group quarters include residential hotel, rooming house, dormitory, group home, student housing, or military base
2 - "Other" injection use not annualized since it was a new question in 2008
n/a - Not enough observations to annualize this estimate
Manhattan, NY, 2008 Page 115
Education of Booked
Arrestees (%)
Current Housing for Booked
Arrestees (%)
Current Employment Status for
Booked Arrestees (%)
Current Health Insurance for
Booked Arrestees (%)
Self-Reported Arrests in Past
Year (%)
Percent Testing Positive for those who Self-Reported 3-Day and 7-
Day Use
Injection at most recent use
(%)
Average Number of Days
per Month Used Past Year
by Drug among Self-
Reported 12-Month Users
Self Reported Use of Five
Primary Drugs - Past 12
Month Use (%)
Past 30 Day Self-Reported
Drug Use (%)
0% 20% 40% 60% 80% 100%
Meth
Opiates
Marijuana
Cocaine
Seven Day Use Three Day Use

Dynamics of Drug Markets in Past 30 Days
Place where Last Purchase Occurred (%) Method of Non-Cash Transaction (%)
Public House Outdoor Other Trade Trade Trade
n Building Apartment Area Area n Drugs Property Sex Other1
Crack Cocaine 37 12.4 12.2 75.0 0.4 Crack Cocaine 13 2.0 6.5 1.2 90.4
Powder Cocaine 41 14.8 29.6 55.1 0.5 Powder Cocaine 19 n/a n/a n/a n/a
Marijuana 136 8.9 20.0 70.4 0.7 Marijuana 113 1.0 1.0 0.5 97.6
Heroin 25 8.5 16.9 74.3 0.3 Heroin 11 n/a n/a n/a n/a
Methamphetamine 0 - - - - Methamphetamine 0 - - - -1 - Credit, fronted, manufactured, transport/steal drugs, gift, other
Drugs obtained by Cash, Non-cash, and Combination Transactions2
Acquiring Drugs by Non-Cash (Manufacture or Other)3
2 - Respondents report most recent cash and non-cash transactions
3 - Data not annualized due to small numbers of people manufacturing
Manhattan, NY, 2008 Page 116
0% 20% 40% 60% 80% 100%
Methamphetamine
Heroin
Marijuana
Powder Cocaine
Crack Cocaine
Cash Only Non-cash Only Cash and non-cash
0% 20% 40% 60% 80% 100%
Methamphetamine
Heroin
Marijuana
Powder Cocaine
Crack Cocaine
Manufactured Non-Manufactured

ADAM II 2008 Report
Multnomah County, OR
Primary City: Portland
Male ArresteesAll Statistics Weighted
Facilities in Sample: 1
Sampled Eligible Arrestees: 932 Conditional Interview Response Rate1: 84% (n = 526)
Arrestees Booked in Data Collection Period: 1450 Urine Response Rate to Interviews: 86% (n = 453)
Mean Age <21 21-25 26-30 31-35 36+ Unknown White
Black or
African
American
Hispanic/
Latino
American
Indian/
Alaska
Native
Native
Hawaiian/
Pacific
Islander Asian
34.8 8.6 16.2 14.7 16.2 44.0 0.2 61.1 26.8 17.2 11.7 2.3 1.6
Percent Positive for Drugs
Std Error <21 21-25 26-30 31-35 36+ Unknown White Black Hispanic Other Unknown
Any Drug2,3
62.3 2.3 72.0 67.6 68.5 51.4 60.8 n/a 61.8 79.3 42.2 57.9 100.0
Cocaine 20.8 1.8 15.5 14.0 19.6 19.1 29.1 n/a 14.0 47.9 18.0 11.2 n/a
Marijuana 39.7 2.3 58.4 49.7 47.7 38.0 30.0 n/a 41.1 46.7 25.6 44.1 n/a
Opiates 8.9 1.3 10.6 9.4 10.3 9.1 7.9 n/a 9.4 8.7 0.8 4.2 n/a
Oxycodone4
0.6 - 2.8 1.7 3.0 1.3 1.0 n/a 2.3 0.0 0.6 2.2 0.0
Meth 15.6 1.7 n/a 5.8 12.0 18.1 12.4 n/a 18.0 0.5 n/a 14.4 n/a
Multiple Drug2,3
24.3 2.0 19.9 17.4 24.9 28.9 26.9 n/a 25.1 29.1 9.5 20.6 1.6
Percent Positive for Drugs by Offense Category
(n = 123) (n = 80) (n = 49) (n = 14) (n = 265) (n = 8)
Any Drug2,3
52.2 76.5 91.4 80.1 62.1 15.1
Cocaine 10.8 29.0 52.9 21.2 22.5 10.0
Marijuana 34.4 48.6 34.9 49.2 41.9 20.6
Opiates 2.6 15.3 19.1 15.8 7.8 n/a
Oxycodone4
3.6 1.1 0.5 0.0 1.2 3.2
Meth 9.0 17.6 19.8 19.6 9.4 n/a
Multiple Drug2,3
14.0 34.9 43.5 28.4 24.1 0.0
Self-Reported Drug Use in the Past Year and Experience with Drug and Mental Health Treatment
Ever % Last Avg Nights Ever % Last Avg Adm Ever % Last Avg Nights
Year5
Last Year Year5
Last Year Year5
Last Year
Crack Cocaine 73.4 60.1 23.1 11.1 33.4 8.2 0.1 17.8 7.3 4.7
Powder Cocaine 66.8 48.8 19.1 15.5 41.1 15.3 0.4 14.5 2.9 0.4
Marijuana 48.4 29.7 11.5 5.5 27.9 11.1 0.4 11.3 2.5 0.3
Heroin 70.4 53.7 25.3 12.7 44.9 9.6 0.2 25.0 2.7 0.3
Meth 55.0 37.3 13.1 6.1 36.0 15.6 0.5 18.8 4.1 2.0
1 - Conditional interview response rate is the number of completed interviews divided by the number of sampled arrestees available to be interviewed
2 - Drug panel includes marijuana, cocaine, opiates, amphetamine EMIT test, PCP, valium, darvon, methadone, barbiturates, and oxycodone
3 - Denominator includes anyone that provided a large enough urine sample to test for all of the drug panel
4 - Percentages for oxycodone not annualized since the test is new for 2008
5 - Percentage of arrestees responding to the calendar section of the ADAM survey
n/a - Not enough observations to annualize this estimate
Multnomah County, OR, 2008 Page 117
Total Testing
Positive (%)
Ethnicity/Race of Booked Arrestees (%)Age of Booked Arrestees (%)
Treatment Time by Type of Treatment (%)
Testing Positive by Drug and Age (%) Testing Positive by Drugs and Race (%)
Violent (%) Property (%)
Any Treatment
Ever (%)Mental Health TreatmentInpatient Outpatient
Other (%) Unknown (%)
Drug Possession
(%)
Drug Distribution
(%)

Trend Estimates of Testing Positive for Drugs
Note: For each year, the dot is the prevalence estimate and the line indicates a 95% confidence interval
Multnomah County, OR, 2008 Page 118
0%
5%
10%
15%
20%
25%
30%
35%
2000 2001 2002 2003 2004 2005 2006 2007 2008
Pre
va
len
ce
Prevalence Estimates of Methamphetamine Use
0%
5%
10%
15%
20%
25%
30%
35%
40%
45%
2000 2001 2002 2003 2004 2005 2006 2007 2008
Pre
va
len
ce
Prevalence Estimates of Cocaine Use
0%
5%
10%
15%
20%
25%
2000 2001 2002 2003 2004 2005 2006 2007 2008
Pre
va
len
ce
Prevalence Estimates of Opiate Use
0%
10%
20%
30%
40%
50%
60%
2000 2001 2002 2003 2004 2005 2006 2007 2008
Pre
va
len
ce
Prevalence Estimates of Marijuana Use

Description of the Sample
None 27.0Own house, mobile
home, apartment41.0
Working full time/
active military status31.6 No Insurance 70.9
High school or GED 45.7
Someone else's
house, mobile home,
apartment
32.8Working part-time/
seasonal 13.4
Individually
Purchased2.5
Vocational or trade
school5.2 Group quarters
1 5.7Unemployed (looking
for work)29.6
Employer or Union
Funded10.5
Some college or two-
year associate 18.7
Hospital or care
facility1.4
Unemployed (not
looking for work)11.2
State Government
Funded13.8
Four year degree or
higher3.3 Incarceration Facility 2.6 In school only 1.5 Retirement Medicare 0.1
Shelter/ No Fixed
Residence15.7 Retired 0.9 Disability Medicare 1.5
Other 1.0Disabled for work or
on leave10.9 Veterans Affairs 0.5
Other 0.9 Multiple Types 0.2
Crack Cocaine 16.3 Crack Cocaine n/a
Powder Cocaine 14.2 Powder Cocaine 19.6
Marijuana 51.6 Heroin 69.1
Heroin 10.2 Methamphetamine 32.0
Methamphetamine 19.3 Other2
0.0
Crack Cocaine 8.9
Powder Cocaine 4.3
Marijuana 9.3
Heroin 11.0
Methamphetamine 7.6
Crack Cocaine 10.8
Powder Cocaine 8.4 None 37.6
Marijuana 42.4 1-2 45.6
Heroin 7.7 3-5 9.8
Methamphetamine 13.7 6 or more 7.0
1 - Group quarters include residential hotel, rooming house, dormitory, group home, student housing, or military base
2 - "Other" injection use not annualized since it was a new question in 2008
n/a - Not enough observations to annualize this estimate
Multnomah County, OR, 2008 Page 119
Education of Booked
Arrestees (%)
Current Housing for Booked
Arrestees (%)
Current Employment Status for
Booked Arrestees (%)
Current Health Insurance for
Booked Arrestees (%)
Self-Reported Arrests in Past
Year (%)
Percent Testing Positive for those who Self-Reported 3-Day and 7-
Day Use
Injection at most recent use
(%)
Average Number of Days
per Month Used Past Year
by Drug among Self-
Reported 12-Month Users
Self Reported Use of Five
Primary Drugs - Past 12
Month Use (%)
Past 30 Day Self-Reported
Drug Use (%)
0% 20% 40% 60% 80% 100%
Meth
Opiates
Marijuana
Cocaine
Seven Day Use Three Day Use

Dynamics of Drug Markets in Past 30 Days
Place where Last Purchase Occurred (%) Method of Non-Cash Transaction (%)
Public House Outdoor Other Trade Trade Trade
n Building Apartment Area Area n Drugs Property Sex Other1
Crack Cocaine 46 7.2 24.0 63.8 5.0 Crack Cocaine 40 0.7 5.4 1.1 92.8
Powder Cocaine 20 8.6 25.4 64.1 1.9 Powder Cocaine 29 1.5 4.6 0.0 93.9
Marijuana 88 9.7 52.7 34.9 2.7 Marijuana 163 4.4 3.3 0.4 92.0
Heroin 29 4.7 19.3 73.2 2.8 Heroin 28 5.6 14.6 0.8 79.0
Methamphetamine 42 9.2 61.4 25.5 3.9 Methamphetamine 41 2.6 9.2 0.4 87.81 - Credit, fronted, manufactured, transport/steal drugs, gift, other
Drugs obtained by Cash, Non-cash, and Combination Transactions2
Acquiring Drugs by Non-Cash (Manufacture or Other)3
2 - Respondents report most recent cash and non-cash transactions
3 - Data not annualized due to small numbers of people manufacturing
Multnomah County, OR, 2008 Page 120
0% 20% 40% 60% 80% 100%
Methamphetamine
Heroin
Marijuana
Powder Cocaine
Crack Cocaine
Cash Only Non-cash Only Cash and non-cash
0% 20% 40% 60% 80% 100%
Methamphetamine
Heroin
Marijuana
Powder Cocaine
Crack Cocaine
Manufactured Non-Manufactured

ADAM II 2008 Report
Sacramento County, CA
Primary City: Sacramento
Male ArresteesAll Statistics Weighted
Facilities in Sample: 1
Sampled Eligible Arrestees: 808 Conditional Interview Response Rate1: 90% (n = 562)
Arrestees Booked in Data Collection Period: 4649 Urine Response Rate to Interviews: 90% (n = 508)
Mean Age <21 21-25 26-30 31-35 36+ Unknown White
Black or
African
American
Hispanic/
Latino
American
Indian/
Alaska
Native
Native
Hawaiian/
Pacific
Islander Asian
33.8 12.5 21.1 15.6 13.3 37.3 0.2 53.1 29.1 24.2 4.1 4.5 5.4
Percent Positive for Drugs
Std Error <21 21-25 26-30 31-35 36+ Unknown White Black Hispanic Other Unknown
Any Drug2,3
74.5 2.1 75.5 73.9 76.1 86.4 77.8 n/a 75.5 81.7 76.9 77.2 41.3
Cocaine 18.0 1.8 12.1 11.9 17.1 9.2 28.2 n/a 12.8 32.4 16.0 14.9 10.9
Marijuana 45.4 2.4 67.9 54.6 54.8 55.4 34.1 n/a 45.8 58.1 41.3 35.3 34.2
Opiates 5.7 1.1 4.9 4.8 3.4 2.3 8.1 n/a 8.0 2.1 3.8 3.9 n/a
Oxycodone4
2.5 - 2.3 1.1 2.2 1.3 1.4 n/a 2.1 0.4 1.4 1.1 0.0
Meth 30.8 2.2 17.7 23.9 21.1 45.5 32.6 n/a 37.5 13.9 36.6 28.0 7.1
Multiple Drug2,3
27.6 2.2 25.3 24.6 26.2 30.8 30.9 n/a 31.4 29.7 23.9 16.8 8.3
Percent Positive for Drugs by Offense Category
(n = 116) (n = 126) (n = 88) (n = 27) (n = 299) (n = 5)
Any Drug2,3
76.2 83.0 90.4 85.2 75.8 n/a
Cocaine 16.4 8.6 29.0 29.7 18.7 n/a
Marijuana 52.8 60.2 47.1 62.6 47.2 n/a
Opiates 0.8 3.7 9.4 n/a 7.0 n/a
Oxycodone4
0.4 0.9 2.2 3.5 1.8 0.0
Meth 25.8 42.3 42.0 21.0 26.6 n/a
Multiple Drug2,3
28.2 32.6 39.9 35.7 27.8 n/a
Self-Reported Drug Use in the Past Year and Experience with Drug and Mental Health Treatment
Ever % Last Avg Nights Ever % Last Avg Adm Ever % Last Avg Nights
Year5
Last Year Year5
Last Year Year5
Last Year
Crack Cocaine 56.0 36.4 13.5 18.0 30.9 8.8 n/a 15.9 3.6 0.2
Powder Cocaine 54.4 30.2 8.2 8.9 41.9 12.0 0.2 16.2 2.9 n/a
Marijuana 39.4 23.3 8.0 4.8 18.8 6.5 0.0 11.2 2.1 0.2
Heroin 80.8 69.3 32.4 26.4 10.2 2.3 0.1 30.7 23.7 2.2
Meth 47.2 29.9 7.4 5.5 22.7 8.8 0.1 14.2 4.2 0.2
1 - Conditional interview response rate is the number of completed interviews divided by the number of sampled arrestees available to be interviewed
2 - Drug panel includes marijuana, cocaine, opiates, amphetamine EMIT test, PCP, valium, darvon, methadone, barbiturates, and oxycodone
3 - Denominator includes anyone that provided a large enough urine sample to test for all of the drug panel
4 - Percentages for oxycodone not annualized since the test is new for 2008
5 - Percentage of arrestees responding to the calendar section of the ADAM survey
n/a - Not enough observations to annualize this estimate
Sacramento County, CA, 2008 Page 121
Other (%) Unknown (%)
Total Testing
Positive (%)
Any Treatment
Ever (%)Mental Health TreatmentInpatient Outpatient
Ethnicity/Race of Booked Arrestees (%)Age of Booked Arrestees (%)
Treatment Time by Type of Treatment (%)
Testing Positive by Drug and Age (%) Testing Positive by Drugs and Race (%)
Violent (%) Property (%)
Drug Possession
(%)
Drug Distribution
(%)

Trend Estimates of Testing Positive for Drugs
Note: For each year, the dot is the prevalence estimate and the line indicates a 95% confidence interval
Sacramento County, CA, 2008 Page 122
0%
10%
20%
30%
40%
50%
60%
2000 2001 2002 2003 2004 2005 2006 2007 2008
Pre
va
len
ce
Prevalence Estimates of Methamphetamine Use
0%
5%
10%
15%
20%
25%
30%
2000 2001 2002 2003 2004 2005 2006 2007 2008
Pre
va
len
ce
Prevalence Estimates of Cocaine Use
0%
2%
4%
6%
8%
10%
12%
2000 2001 2002 2003 2004 2005 2006 2007 2008
Pre
va
len
ce
Prevalence Estimates of Opiate Use
0%
10%
20%
30%
40%
50%
60%
2000 2001 2002 2003 2004 2005 2006 2007 2008
Pre
va
len
ce
Prevalence Estimates of Marijuana Use

Description of the Sample
None 34.7Own house, mobile
home, apartment43.7
Working full time/
active military status37.4 No Insurance 65.8
High school or GED 40.0
Someone else's
house, mobile home,
apartment
37.7Working part-time/
seasonal 13.8
Individually
Purchased4.4
Vocational or trade
school6.7 Group quarters
1 3.9Unemployed (looking
for work)25.1
Employer or Union
Funded14.3
Some college or two-
year associate 16.5
Hospital or care
facility0.6
Unemployed (not
looking for work)9.7
State Government
Funded11.5
Four year degree or
higher2.2 Incarceration Facility 1.8 In school only 1.5 Retirement Medicare 0.5
Shelter/ No Fixed
Residence12.3 Retired 1.7 Disability Medicare 2.9
Other 0.1Disabled for work or
on leave10.1 Veterans Affairs 0.4
Other 0.7 Multiple Types 0.2
Crack Cocaine 11.0 Crack Cocaine n/a
Powder Cocaine 7.5 Powder Cocaine 2.2
Marijuana 51.4 Heroin 77.5
Heroin 2.5 Methamphetamine 10.7
Methamphetamine 29.7 Other2
2.5
Crack Cocaine 7.5
Powder Cocaine 3.9
Marijuana 8.7
Heroin 9.0
Methamphetamine 9.5
Crack Cocaine 9.1
Powder Cocaine 4.7 None 46.1
Marijuana 45.4 1-2 43.2
Heroin 1.7 3-5 5.5
Methamphetamine 25.8 6 or more 5.2
1 - Group quarters include residential hotel, rooming house, dormitory, group home, student housing, or military base
2 - "Other" injection use not annualized since it was a new question in 2008
n/a - Not enough observations to annualize this estimate
Sacramento County, CA, 2008 Page 123
Education of Booked
Arrestees (%)
Current Housing for Booked
Arrestees (%)
Current Employment Status for
Booked Arrestees (%)
Current Health Insurance for
Booked Arrestees (%)
Self-Reported Arrests in Past
Year (%)
Percent Testing Positive for those who Self-Reported 3-Day and 7-
Day Use
Injection at most recent use
(%)
Average Number of Days
per Month Used Past Year
by Drug among Self-
Reported 12-Month Users
Self Reported Use of Five
Primary Drugs - Past 12
Month Use (%)
Past 30 Day Self-Reported
Drug Use (%)
0% 20% 40% 60% 80% 100%
Meth
Opiates
Marijuana
Cocaine
Seven Day Use Three Day Use
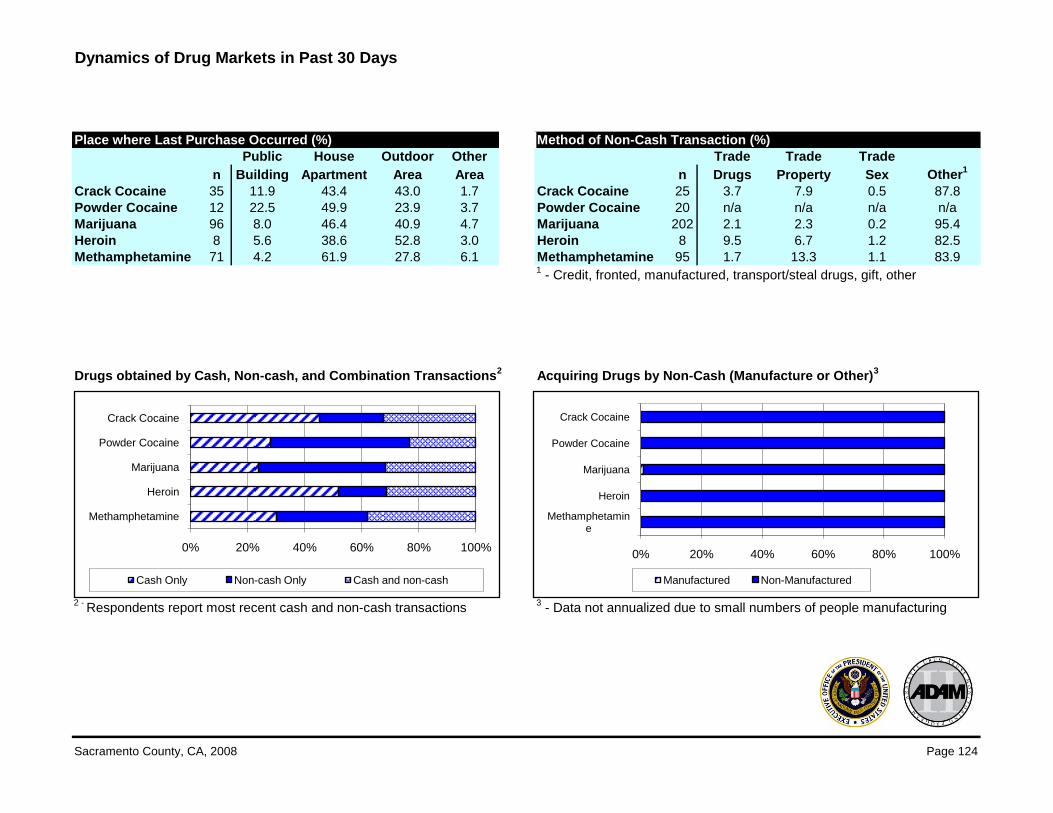
Dynamics of Drug Markets in Past 30 Days
Place where Last Purchase Occurred (%) Method of Non-Cash Transaction (%)
Public House Outdoor Other Trade Trade Trade
n Building Apartment Area Area n Drugs Property Sex Other1
Crack Cocaine 35 11.9 43.4 43.0 1.7 Crack Cocaine 25 3.7 7.9 0.5 87.8
Powder Cocaine 12 22.5 49.9 23.9 3.7 Powder Cocaine 20 n/a n/a n/a n/a
Marijuana 96 8.0 46.4 40.9 4.7 Marijuana 202 2.1 2.3 0.2 95.4
Heroin 8 5.6 38.6 52.8 3.0 Heroin 8 9.5 6.7 1.2 82.5
Methamphetamine 71 4.2 61.9 27.8 6.1 Methamphetamine 95 1.7 13.3 1.1 83.91 - Credit, fronted, manufactured, transport/steal drugs, gift, other
Drugs obtained by Cash, Non-cash, and Combination Transactions2
Acquiring Drugs by Non-Cash (Manufacture or Other)3
2 - Respondents report most recent cash and non-cash transactions
3 - Data not annualized due to small numbers of people manufacturing
Sacramento County, CA, 2008 Page 124
0% 20% 40% 60% 80% 100%
Methamphetamine
Heroin
Marijuana
Powder Cocaine
Crack Cocaine
Cash Only Non-cash Only Cash and non-cash
0% 20% 40% 60% 80% 100%
Methamphetamine
Heroin
Marijuana
Powder Cocaine
Crack Cocaine
Manufactured Non-Manufactured

ADAM II 2008 Report
Washington, DC
Male ArresteesAll Statistics Weighted
Facilities in Sample: 7
Sampled Eligible Arrestees: 177 Conditional Interview Response Rate1: 59% (n = 95)
Arrestees Booked in Data Collection Period: 6774 Urine Response Rate to Interviews: 58% (n = 55)
Mean Age <21 21-25 26-30 31-35 36+ Unknown White
Black or
African
American
Hispanic/
Latino
American
Indian/
Alaska
Native
Native
Hawaiian/
Pacific
Islander Asian
36.4 13.9 15.2 12.5 7.3 51.1 0.0 0.0 86.7 5.8 2.2 n/a n/a
Percent Positive for Drugs
Std Error <21 21-25 26-30 31-35 36+ Unknown White Black Hispanic Other Unknown
Any Drug2,3
52.1 6.7 39.2 34.3 63.4 n/a 66.0 n/a n/a 69.9 n/a n/a 20.8
Cocaine 36.0 1.5 n/a 16.0 10.4 n/a 53.6 n/a n/a 40.5 0.1 n/a n/a
Marijuana 30.7 6.5 41.1 19.8 54.7 n/a 33.7 n/a n/a 40.1 n/a n/a n/a
Opiates 11.2 1.0 n/a n/a n/a n/a 18.2 n/a n/a 9.2 n/a n/a n/a
Oxycodone4
0.0 - 0.0 2.2 0.0 0.0 0.0 n/a n/a 0.4 0.0 0.0 0.0
Meth 2.0 - n/a n/a n/a n/a n/a n/a n/a 0.5 n/a n/a n/a
Multiple Drug2,3
18.8 5.2 6.4 2.8 24.2 n/a 30.8 n/a n/a 25.6 n/a n/a 9.1
Percent Positive for Drugs by Offense Category
(n = 7) (n = 3) (n = 16) (n = 1) (n = 28) (n = 2)
Any Drug2,3
19.8 62.5 n/a 100.0 42.3 n/a
Cocaine n/a 60.3 31.7 n/a 34.5 n/a
Marijuana 24.7 52.5 33.9 n/a 21.6 n/a
Opiates n/a n/a 15.5 n/a 5.7 n/a
Oxycodone4
0.0 0.0 0.0 0.0 0.6 0.0
Meth n/a n/a n/a n/a n/a n/a
Multiple Drug2,3
7.7 50.2 35.9 n/a 18.9 n/a
Self-Reported Drug Use in the Past Year and Experience with Drug and Mental Health Treatment
Ever % Last Avg Nights Ever % Last Avg Adm Ever % Last Avg Nights
Year5
Last Year Year5
Last Year Year5
Last Year
Crack Cocaine 34.9 31.9 n/a n/a 14.0 0.3 n/a n/a n/a n/a
Powder Cocaine 57.4 59.2 n/a n/a n/a n/a n/a n/a n/a n/a
Marijuana 17.7 18.3 n/a n/a 2.2 n/a n/a 0.1 n/a n/a
Heroin 56.1 26.3 n/a n/a 51.1 n/a n/a n/a n/a n/a
Meth - - - - - - - - - -
1 - Conditional interview response rate is the number of completed interviews divided by the number of sampled arrestees available to be interviewed
2 - Drug panel includes marijuana, cocaine, opiates, amphetamine EMIT test, PCP, valium, darvon, methadone, barbiturates, and oxycodone
3 - Denominator includes anyone that provided a large enough urine sample to test for all of the drug panel
4 - Percentages for oxycodone not annualized since the test is new for 2008
5 - Percentage of arrestees responding to the calendar section of the ADAM survey
n/a - Not enough observations to annualize this estimate
Washington, DC, 2008 Page 125
Age of Booked Arrestees (%)
Treatment Time by Type of Treatment (%)
Testing Positive by Drug and Age (%) Testing Positive by Drugs and Race (%)
Violent (%) Property (%)
Drug Possession
(%)
Drug Distribution
(%)
Ethnicity/Race of Booked Arrestees (%)
Other (%) Unknown (%)
Total Testing
Positive (%)
Any Treatment
Ever (%)Mental Health TreatmentInpatient Outpatient

Trend Estimates of Testing Positive for Drugs
Note: For each year, the dot is the prevalence estimate and the line indicates a 95% confidence interval
Washington, DC, 2008 Page 126
-2%
0%
2%
4%
6%
8%
10%
12%
14%
2000 2001 2002 2003 2004 2005 2006 2007 2008
Pre
va
len
ce
Prevalence Estimates of Methamphetamine Use
0%
5%
10%
15%
20%
25%
30%
35%
40%
45%
2000 2001 2002 2003 2004 2005 2006 2007 2008
Pre
va
len
ce
Prevalence Estimates of Cocaine Use
0%
5%
10%
15%
20%
25%
2000 2001 2002 2003 2004 2005 2006 2007 2008
Pre
va
len
ce
Prevalence Estimates of Opiate Use
0%
10%
20%
30%
40%
50%
60%
2000 2001 2002 2003 2004 2005 2006 2007 2008
Pre
va
len
ce
Prevalence Estimates of Marijuana Use

Description of the Sample
None 24.9Own house, mobile
home, apartment43.6
Working full time/
active military status47.7 No Insurance 40.4
High school or GED 54.4
Someone else's
house, mobile home,
apartment
38.8Working part-time/
seasonal 11.8
Individually
Purchased11.3
Vocational or trade
school2.0 Group quarters
1 3.6Unemployed (looking
for work)23.4
Employer or Union
Funded19.6
Some college or two-
year associate 15.4
Hospital or care
facility0.2
Unemployed (not
looking for work)8.0
State Government
Funded24.7
Four year degree or
higher3.3 Incarceration Facility 0.4 In school only 2.1 Retirement Medicare 1.1
Shelter/ No Fixed
Residence13.4 Retired 1.1 Disability Medicare 1.7
Other 0.0Disabled for work or
on leave5.7 Veterans Affairs 0.1
Other 0.3 Multiple Types 1.0
Crack Cocaine 19.7 Crack Cocaine n/a
Powder Cocaine 5.5 Powder Cocaine n/a
Marijuana 38.6 Heroin n/a
Heroin 4.9 Methamphetamine n/a
Methamphetamine 0.7 Other2
0.0
Crack Cocaine 6.7
Powder Cocaine 4.0
Marijuana 5.2
Heroin 17.5
Methamphetamine n/a
Crack Cocaine 19.6
Powder Cocaine 4.2 None 81.0
Marijuana 35.3 1-2 16.1
Heroin 5.2 3-5 0.5
Methamphetamine n/a 6 or more 2.4
1 - Group quarters include residential hotel, rooming house, dormitory, group home, student housing, or military base
2 - "Other" injection use not annualized since it was a new question in 2008
n/a - Not enough observations to annualize this estimate
Washington, DC, 2008 Page 127
Education of Booked
Arrestees (%)
Current Housing for Booked
Arrestees (%)
Current Employment Status for
Booked Arrestees (%)
Current Health Insurance for
Booked Arrestees (%)
Self-Reported Arrests in Past
Year (%)
Percent Testing Positive for those who Self-Reported 3-Day and 7-
Day Use
Injection at most recent use
(%)
Average Number of Days
per Month Used Past Year
by Drug among Self-
Reported 12-Month Users
Self Reported Use of Five
Primary Drugs - Past 12
Month Use (%)
Past 30 Day Self-Reported
Drug Use (%)
0% 20% 40% 60% 80% 100%
Meth
Opiates
Marijuana
Cocaine
Seven Day Use Three Day Use
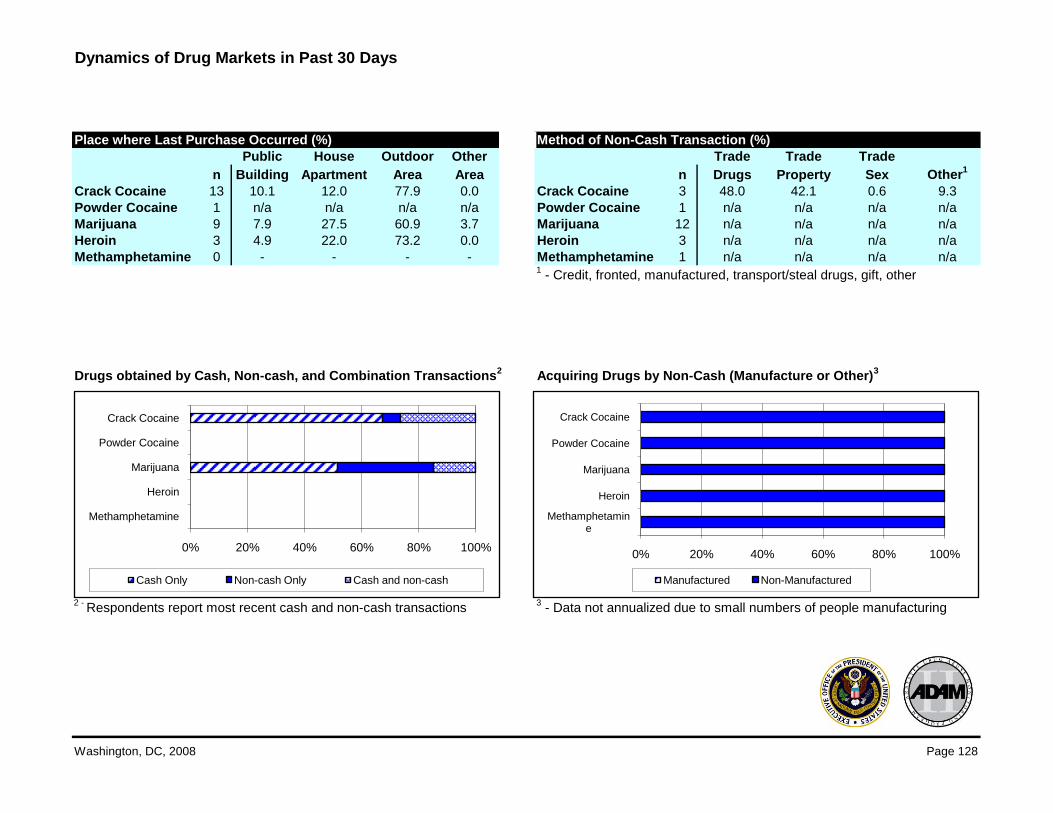
Dynamics of Drug Markets in Past 30 Days
Place where Last Purchase Occurred (%) Method of Non-Cash Transaction (%)
Public House Outdoor Other Trade Trade Trade
n Building Apartment Area Area n Drugs Property Sex Other1
Crack Cocaine 13 10.1 12.0 77.9 0.0 Crack Cocaine 3 48.0 42.1 0.6 9.3
Powder Cocaine 1 n/a n/a n/a n/a Powder Cocaine 1 n/a n/a n/a n/a
Marijuana 9 7.9 27.5 60.9 3.7 Marijuana 12 n/a n/a n/a n/a
Heroin 3 4.9 22.0 73.2 0.0 Heroin 3 n/a n/a n/a n/a
Methamphetamine 0 - - - - Methamphetamine 1 n/a n/a n/a n/a1 - Credit, fronted, manufactured, transport/steal drugs, gift, other
Drugs obtained by Cash, Non-cash, and Combination Transactions2
Acquiring Drugs by Non-Cash (Manufacture or Other)3
2 - Respondents report most recent cash and non-cash transactions
3 - Data not annualized due to small numbers of people manufacturing
Washington, DC, 2008 Page 128
0% 20% 40% 60% 80% 100%
Methamphetamine
Heroin
Marijuana
Powder Cocaine
Crack Cocaine
Cash Only Non-cash Only Cash and non-cash
0% 20% 40% 60% 80% 100%
Methamphetamine
Heroin
Marijuana
Powder Cocaine
Crack Cocaine
Manufactured Non-Manufactured

*NCJ~226971*

ad
am
II • 2008 an
nu
al
re
po
rt
ADAM II 2 0 0 8 a n n u a l r e p o r t
o f f I c e o f n a t I o n a l d r u g c o n t r o l p o l I c ye X e c u t I V e o f f I c e o f t H e p r e S I d e n t
ar
r e s t e e dr
ug
a
bu
se
m
on
itoring
pr
og
ra
m •
IIA r r e s t e e D r u g A b u s e M o n i t o r i n g P r o g r a m