
ADA241 135 I I MECHANICAL OF MASS CONCRETE · A1D"A241 135 TECHNICAL REPORT SL-91-14 I I _____J...
106
A 1 D"A241 135 TECHNICAL REPORT SL-91-14 I I __________J MECHANICAL PROPERTIES OF MASS CONCRETE US OFm MASoCNCET of AT EARLY AGES by Donald Mark Smith Structures Laboratory DEPARTMENT OF THE ARMY Waterways Experiment Station, Corps of Engineers 3909 Halls Ferry Road, Vicksburg, Mississippi 39180-6199 DTI fELECTS -II A AAugust 1991 6 Final Report ________ ,____ _ - Approved For Public Release; Distribution Is Unlimited CPrepared for DEPARTMENT OF THE ARMY US Army Corps of Engineers Washington, DC 20314-1000 SLABORATORY Under Work Unit No. 32260 91 9 30 045
Transcript of ADA241 135 I I MECHANICAL OF MASS CONCRETE · A1D"A241 135 TECHNICAL REPORT SL-91-14 I I _____J...

A1D"A241 135 TECHNICAL REPORT SL-91-14
I I __________J MECHANICAL PROPERTIES OF MASS CONCRETE
US OFm MASoCNCETof AT EARLY AGES
by
Donald Mark Smith
Structures Laboratory
DEPARTMENT OF THE ARMYWaterways Experiment Station, Corps of Engineers
3909 Halls Ferry Road, Vicksburg, Mississippi 39180-6199
DTIfELECTS
-II
A AAugust 19916 Final Report
________ ,____ _ - Approved For Public Release; Distribution Is Unlimited
CPrepared for DEPARTMENT OF THE ARMYUS Army Corps of Engineers
Washington, DC 20314-1000SLABORATORY Under Work Unit No. 32260
91 9 30 045

Destroy this report when no longer needed. Do not returnit to the originator.
The findings in this report are not to be construed as an officialDepartment of the Army position unless so designated
by other authorized documents.
The contents of this report are not to be used foradvertising, publication, or pro.mnotional purposes.
Citation of trade names does not constitute anofficial endorsement or approval of the use of
such commercial products.

Form ApprovedREPORT DOCUMENTATION PAGE OMB No.- 0704-0188
Public reporting burden for this (ollection of information is estimated to average I hour per response, including the time for reviewing instructions, searching exsting data sources,gathering and maintaining the data needed, and completing and reviewing the collection of information, Send comments regarding this burden estimate or any other aspect of thiscollection of information. including suggestions for reducing this burden to Washington Headquarters Services, Directorate for information Operations and Reports. 1215 jeffersonDavis Highway. Suite 1204. Arlington, VA 222024302. and to the Office of Management and Budget. Paperwork Reduction Project (0704.0188). Washington. DC 20503.
1. AGENCY USE ONLY (Leave blank) 2. REPORT DATE 3. REPORT TYPE AND DATES COVEREDAu st 1991 , Final report ,_________,___
4. TITLE AND SUBTITLE 5. FUNDING NUMBERS
Mechanical Properties of Mass Concrete at Early Ages W No. 32260
6. AUTHOR(S)
Donald Mark Smith
7. PERFORMING ORGANIZATION NAME(S) AND ADDRESS(ES) 8. PERFORMING ORGANIZATIONREPORT NUMBER
USAE Waterways Experiment Station, Structures Laboratory Technical Report3909 Halls Ferry Road, Vicksburg, MS 39180-6199 SL-91-14
9 .-SPONSORING/MONITORINGlAGENCY NAME(S) AND ADDRESS(ES) 10. SPONSORING/MONITORINGAGENCY REPORT NUMBER
US Army Corps of EngineersWashington, DC 20314-1000
11. SUPPLEMENTARYNOTES r- -
Available from National Technical Information Service, 5285 Port Royal Road, Springfield,VA 22161.
12a. DISTRIBUTION/AVAILABILITY STATEMENT 12b. DISTRIBUTION CODE
Approved for public release; distribution is unlimited
13. ABSTRACT (Maximum 200 words)
A series of early-time material properties tests was conducted on mass concrete mixtures to beused in the construction of locks and dams along the Red River Waterway. Tests were conducted todetermine creep, compressive strength, and Young's modulus of elasticity at ages of loading from18 hr through several days. While a significant data base exists for the material properties of massconcrete at later ages, very few data exist for the early-time material properties of mass concrete.Therefore, this investigation provided a significant contribution to the existing data base. Twocommon simple models used to predict the strength and Young's modulus of elasticity as functionsof time were selected for comparison with early-age mechanical properties test data. The dataobtained from the early-time material properties tests were used to evaluate three viscoelastic creepmodels. The results of the investigation and the analysis are reported.
14.-SUBJECT TERMS 15. NUMBER OF PAGESConcrete mixtures Strength of materials 106Concrete research Stresses and strains 16. PRICE CODEMass concrete F
17. SECURITY CLASSIFICATION 18. SECURITY CLASSIFICATION 19. SECURITY CLASSIFICATION 20. LIMITATION OF ABSTRACT
OF REPORT OF THIS PAGE OF ABSTRACT
UNCLASSIFIED UNCLASSIFIED I_ _ __NSN 7540.01-280-5500 Standard Form 298 (Rev. 2-89)
Prescribed by ANSI Std 39.18298-102

PREFACE
The research-described in this report was conducted for Headquarters, US
Army Corps of Engineers (HQUSACE), under the Concrete Research Program, Work
Unit 32260, Cracking of Concrete. Dr. Tony Liu, HQUSACE, was the Technical
Monitor.
The- research--was performed at the US Army Engineer Waterways Experiment
Station (WES) by members of the staff of the Structures Laboratory (SL), Con-
crete Technology Division (CTD), under the general supervision of
Messrs. Bryant Mather, Chief, SL, J. T. Ballard, o;sistant Chief, SL, and
K. L. Saucier, Chief, CTD. Direction and technical guidance were provided by
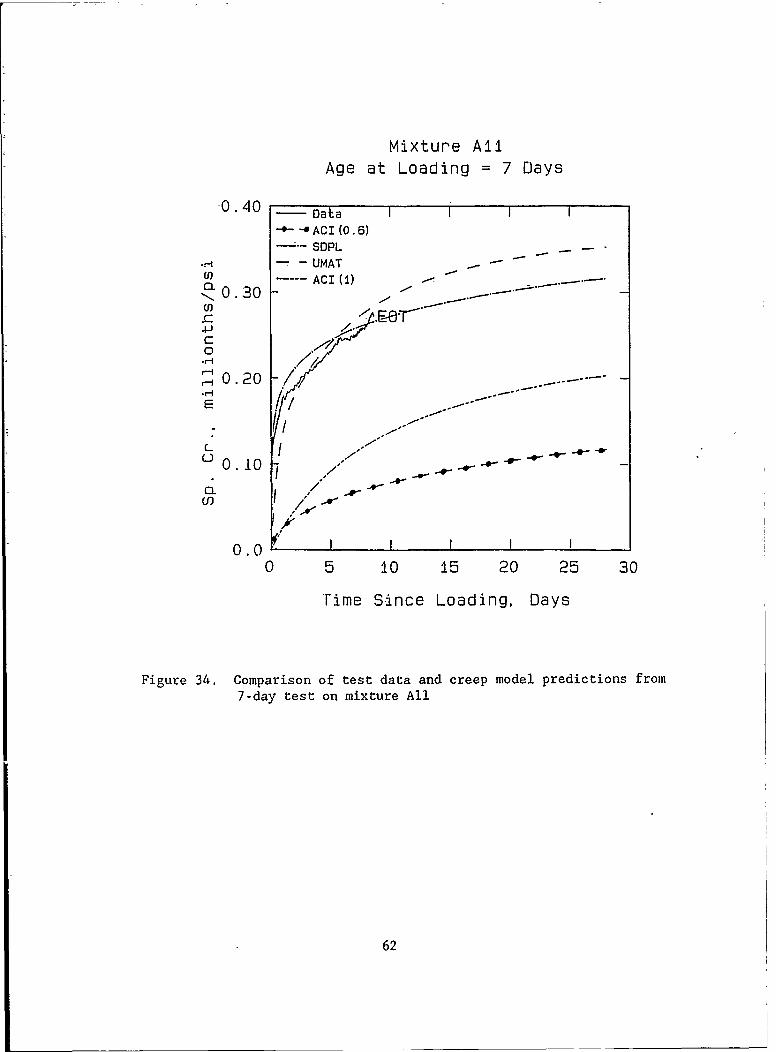
Mr. Michael I. Hammons, Applied Mechanics Group (AMG), CTD. This thesis was
prepared by Mr. Donald Mark Smith, AMG, CTD.
The author acknowledges the assistance of Dr. George M. Hammitt II and
Mr. Michael I. Hammons, Research Civil Engineers, WES, who provided guidance
during the investigation, analysis, and preparation of this report. The
author expresses appreciation to Dr. Keith H. Denson, Professor of Civil Engi-
neering, Mississippi State University, for chairing the thesis review commit-
tee and providing suggestions during the preparation of this report. The
author also acknowledges Messrs. Dan Wilson, Andy Shirley, Brent Lamb,
Mich Alexander, and Tony Bombich, and-Ms. Linda Mayfield, AMG, CTD, for their
help during this investigation.
COL Larry B. Fulton, EN, was Commander and Director of WES during this
investigation and preparation of this report. Dr. Robert W. Whalin was Tech-
nical Director of WES.
COPY I 60038ion ForINSPrCTEADSB.O Q
DTIO TAB ]Unannounoed 133ustlfioation
ByDistr~bution ,.
Avallablaity Code&Avail and/or
Atat Special
J _

TABLE- OF CONTENT&~
PREFACE............................................................. x
LIST OF TABLES ..................... ................................
LIST OF FIGURES........ ............................................ ii
CONVERSION FACTORS, NON-SI TO SI (METRIC) UNITS OFMEASUREMENT............................................................ vi
CHAPTER I: INTRODUCTION ............................................. 1
Background ..................................................... 1Literature Review............................................. 2Objective ...................................................... 3Scope............................ ............................. 3
CHAPTER II: CONCRETE ,4ATERT.AL PROPERTIES...........................5
General....................................................... 5Physical and Thermal--'Properties ................................ 5-Me1 chanical Properties ........................................... 6,
CHAPTER III: CONCRETE MODELS........................ .................. 8
keeral ....... ................................................. 8Strength and Modulus Equations...............................Theory and Prediction of Creep................................ 9
2 Rheologicd- Models................................................ 9Kelvin Model .............................................. 10Maxwell Model ............................................. 10
Viscoelastic Creep Models...................................... 12Bazant Sinh- Double Power Law .............................. 12ACI Creep Formula ........................... I.............. 15WES UMAT Time-Dependent Material Properties Model.........15:
CHAPTER IV: EXPERIMENTAL PROGRAM.................................. 17
General ................................................. 17Concrete Mixture Proportions................................. 17Test Specimen Preparation ..................................... 18Mechanical Properties Tests ................................... 1.9
Unconfined Compression Tests .............................. 19Modulus of Elasticity Tests ............................... 20
Compressive Creep Tests....................................... 21
CHAPTER V: -ANALYSIS............................................ 41
,Ge ra . .................................................................. 4;S616ecion of Mechanical Properties Models...................... 41iCalibration o Creep- .Roidel 'Parameters ......................... 41
* ACI Creep Equationi.......................................41WES UMAT Creep, Eqtation .................................. 42Bazant Sinh-Double Power Law ............................. 43

Discussion of Test Data and Models .......................... 44Compressive Strength and Modulus of Elasticity ......... 44Creep Data and Model Predictions ........................ 46
CHAPTER VI: CONCLUSIONS AND RECOMMENDATIONS ...................... 64
REFERENCES .. ......................................................... 66
APPENDIX A: CREEP TEST METHOD .................................... 68
APPENDIX B: COMPRESSIVE STRENGTH TEST METHOD ...................... 73
APPENDIX C: CARLSON STRAIN GAGES ................................... 80
APPENDIX D: CREEP TEST DATA .......................................... 85,
LIST OF TABLES
No. Pag
1 Mixture Proportions for One Cubic Yard of Concrete .......... 182 Mixture Characteristics .................................. ... 183 Results of Tests on Fresh Concrete .......................... 194 Compressive Strength Data for Mixtures A? and All ........... 205 Modulus of Elasticity Data for Mixtures A2 and All .......... 216 ACI Ultimate Specific Creep for Mixtures A2 and All ......... 427 UMAT Creep Equation Coefficients for Mixtures A2 and All .... 438 SDPL Creep Constants for Mixtures A2 and All ................ 449 Strength and Modulus Equation Constants ..................... 45
LIST OF FIGURES
No. Page
1 (a) Kelvin Model, (b) Maxwell Model ......................... 132 (a) Deforinational Response of a Kelvin Model
(b) Deformational Response of a Maxwell Model ................. 143 Basic specific creep relationships ............................ 244 Preparation of creep test specimens using vibratory
compaction table .............................................. 255 Steel mold for creep specimens with Carlson
Strain gage installed ....................................... 266 Application of Bituethane moisture barrier to
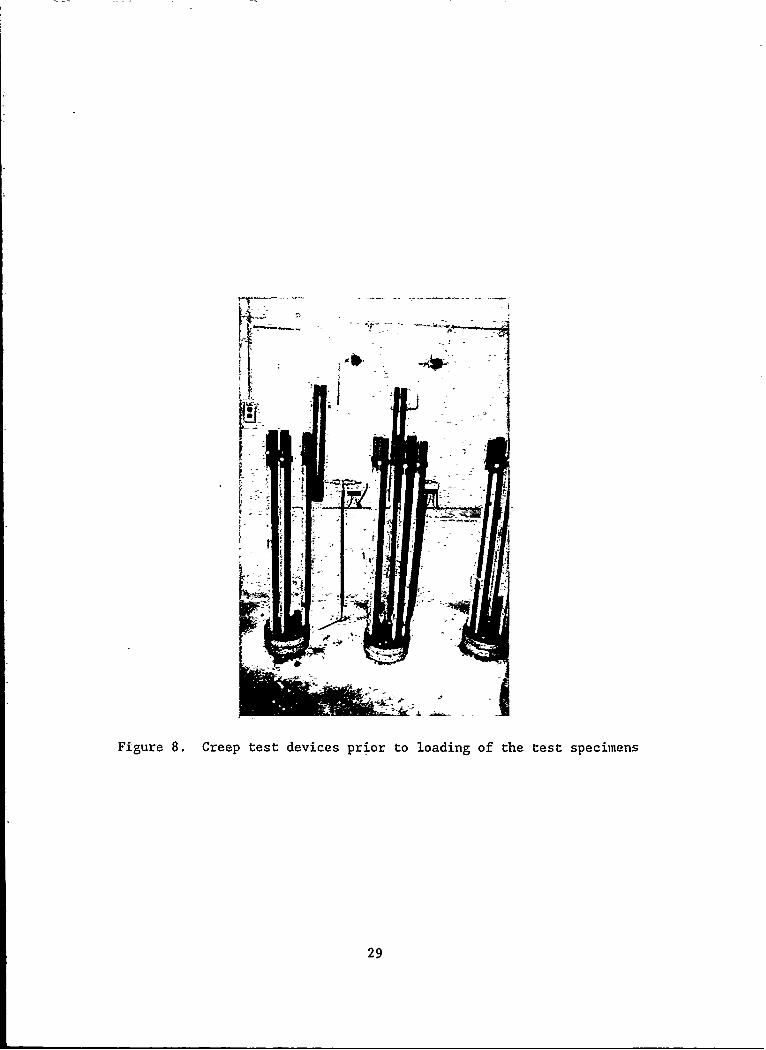
hardened creep specimen ................................... 277 Creep test control cylinders .................................. 288 Creep test devices prior to loading of the
test specimens ..... ....................................... 299 Creep test device complete with loaded creep cylinders ...... 3010 Specific creep versus time since loading from 18-hour
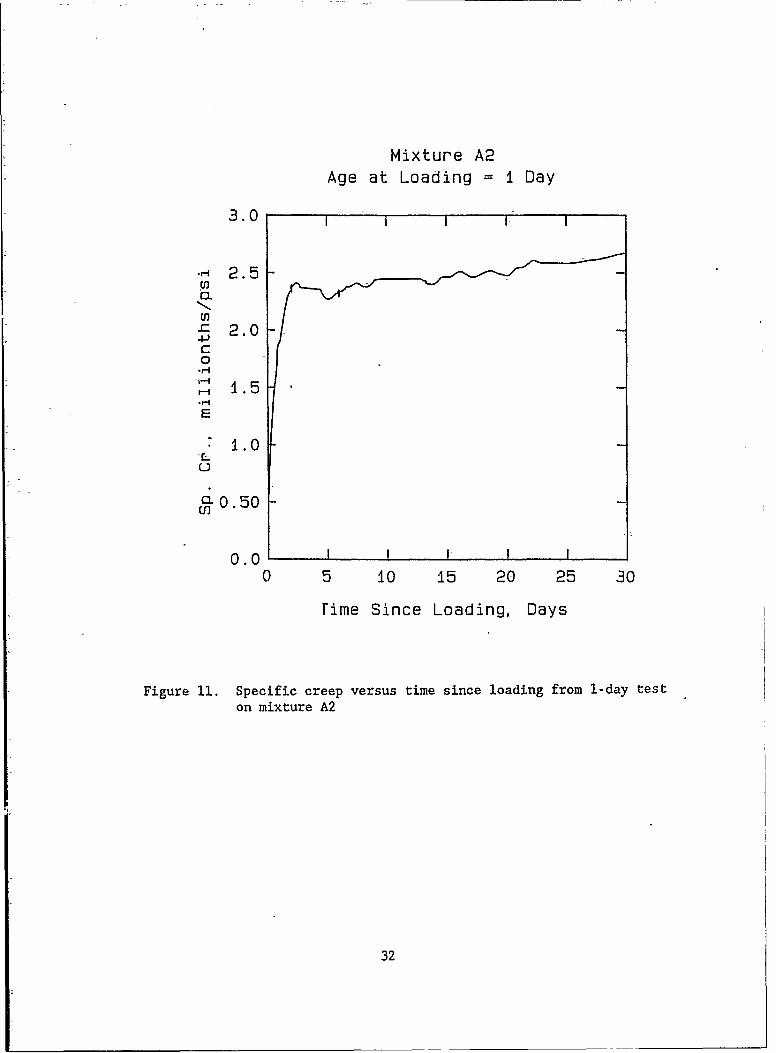
test on mixture A2 ........................................ 3111 Specific creep versus time since loading from 1-day
test on mixture A2 ........................................ 32
iii

No. Page
12 Specific creep versus time sirne loading from 3-daytest-on mixture.<A2 ..... ... ............ ........ 33
13, Specific creep versus time -since loading from 7-daytest on mixture A2 ........................................... 34
14. Specific creep versus time since loading from 14-daytest on-mixture A2 ......................................... 35
15 Specific' creep versus time since loading from 18-hourtest on mixture All ............ ::.:.: '..................... 36
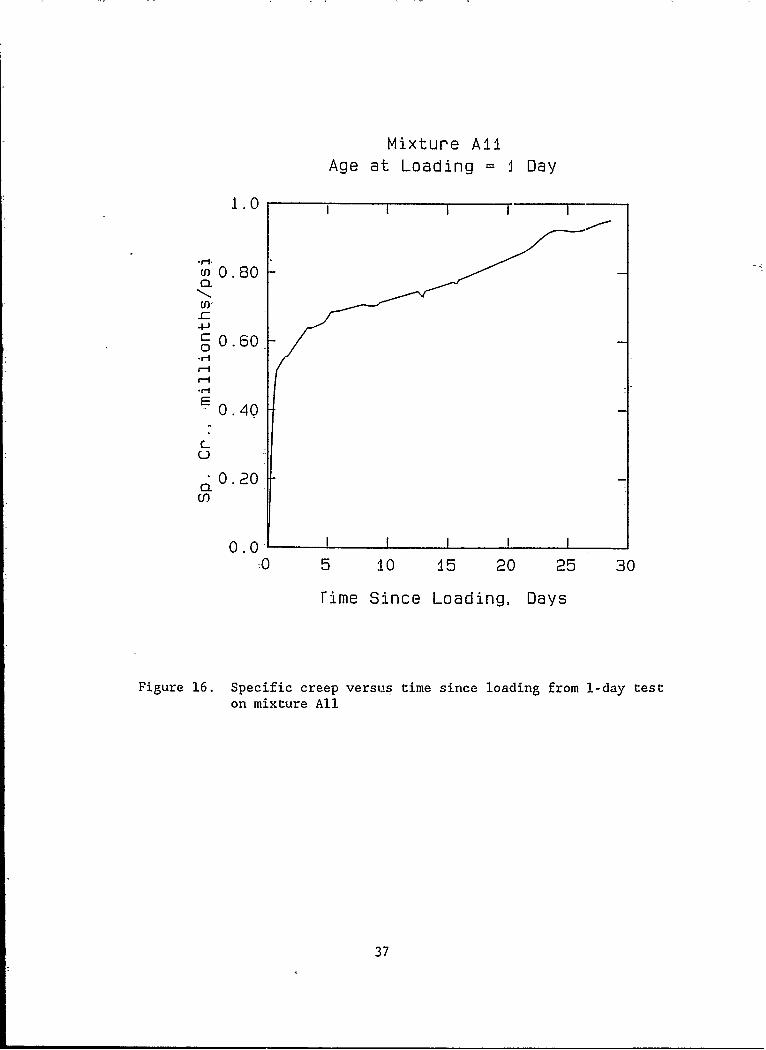
16 Specific creep versus time since-loading from 1-daytest on mixture All ........................................ 37
17 Specific cteep--versius time since loading from 3-daytes on mixture All ......................................... 38
18 Specific cieep versus time since loading from 7-daytest on mixture All ....................................... 39
j19 Specific creep versus time since-.loading.from 14-daytest on mixture All .......................................... 40
20 Comprcssive strength versus age for mixture A2 ............... -4821 Compressive strength versus age for mixture All ............. 4922 Elastic-modulus versus age for mixture A2 ..................... 5023! Elastic modulus versus age for mixture All .................. 512k Elasti% modulus-versus.square root of compressive
strength for mixture A2 ................................... 5225 Elastic modulus versus square root- of compressive
strength fox mixture All ......................... 5326N Comparison of -test -data and creep model predictions
from 18-hour test on mixture A2 .... .. . ............. 5427 Comparison of test data and creep model predictions
from 1-day test onmixture A2 .............................. 5528 Comparison of test data and creep model predictions
from 3-day-test on mixture A2 .............................. 5629 Comparison of test data and creep model predictions
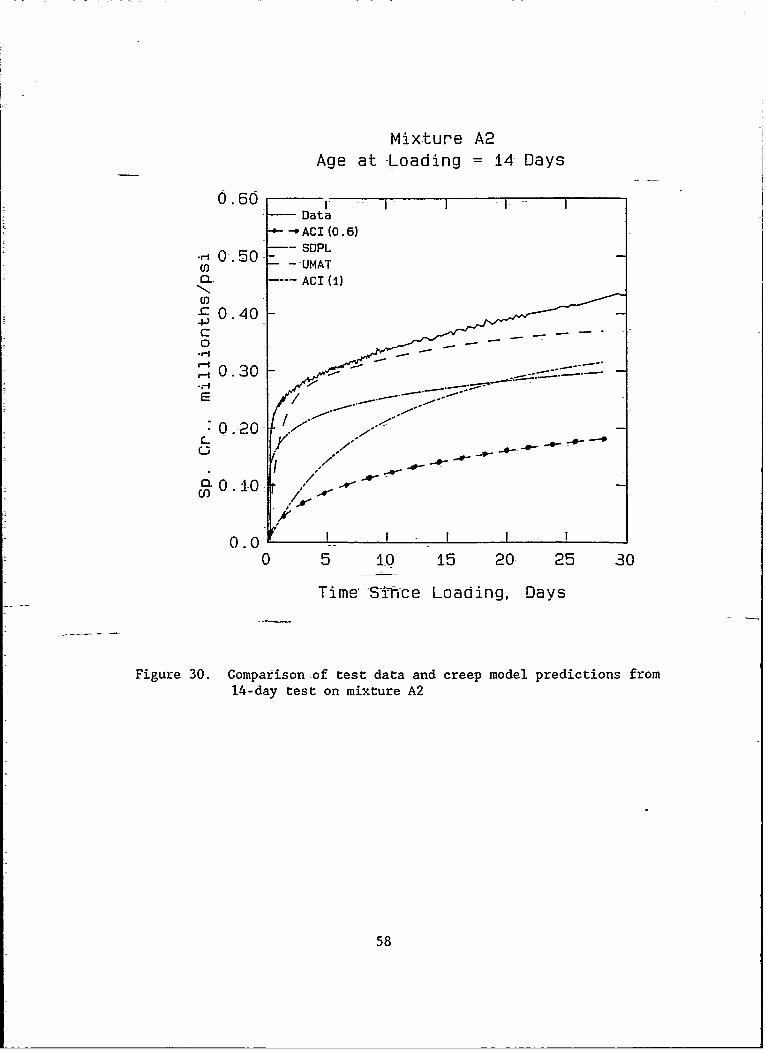
-from 7.-day test on mixture A2 . ...... ........ ................ 5730; Comparison of test data and creep, model predictions
from 14-day test on mixture A2-............................... 5831 Comparison of test data and creep-model predictions
from 18-hour test ofi.mixture .All ... .................. 59
32 Comparison of test data and creepmodel predictionsfrom 1-day test on-mixture All .............................. 60
33 Comparison of test data and creep model predictionsfrom 3-day test on mixture All ................ 61
34 Comparison of test data and' creep.mgdel.-predictionsfrom 7-day test on mixture All . .... ................. 62
35 Comparison of test data and creep,mp4l predictionsfrom 14-day teat on mixture All ........................... 63
36 Carlson strain ,eter .............. ................... 813?- Electrical schematic of Carlson-meter setup ................ 8438 Creep test data from 18-hour test on mixture A2 ............. 8639 Creeptest data from.1-day test on mixture..A? ................ 8740 zCreep test -datt from 3-day test on-mixture A2 ................ 8841 Creep test data from-7-day test on mixture A2 ............... 89
iv

No. Page
42 Creep test data from 14-day test on mixture A2 ............. 9043 Creep test data from 18-hour test on mixture All .............. 9144 Creep test data from 1-day test on mixture Ali. ................ .9245 Creep test data from 3-day test on mixture All ..... ; ......... 9346 Creep test data from 7-day test on mixture All ................ 9447 Creep test data from 14-day test on mixture All .............. -9548 Control cylinders for mixture A2 ............................. 9649 Control cylinders for mixture All ............................ 97
V

CONVERSION FACTORS, NON-SI TO SI (METRIC)UNITS OF MEASUREMENT
Non-SI units of measurement-used in this report can be converted to SI
(metric) units as follows:
Multiply By To Obtain
Fahrenheit degrees 5/9 Celsius degrees or kelvins*
inches 25.4 millimetres
kips (force) 4.448222 kilonewtons
pound (mass) 1.6.01846 kilograms per cubic metreper cubic foot
pounds (force) per 0.006894757 megapascalssquare inch
* To obtain Celsius (C) temperature readings from Fahrenheit (F) readings,use the following formula: C-(5/9) (F-32). To obtain kelvin (K) readings,use: K-(5/9) (F-32) + 273.15.
vi

MECHANICAL PROPERTIES OF MASS CONCRETE AT EARLY AGES
CHAPTER I: INTRODUCTION
Background
I. Two bf the three large dams completed by the Corps of Engineers in
the last 20 years have developed cracking which has- required costly repairs
and, in one case, caused serious leakage. The dams involved, Dworshak in
Idaho-, and Richard B. Russell on the Georgia-South Carolina border, have
cracked in a similar mode. In those monoliths where cracking has occurred, a
vertical crack forms in the upstream face midway between the monolith joints
and, with time, tends to propagate downstream normal to the axis of the dam.
In May 1980, when the reservoir at Russell Dam reached its full pool eleva-
tion, a crack in one of the monoliths opened approximately 2.5 mm allowing
flows of up to 29 m3 per minute into the galleries. In addition to this type
of cracking, the Corps has had repeated problems of cracking in concrete over-
lays and other structural elements of any significant size [1].
2. A three-dimensional finite-element model for concrete which includes
material aging, creep, shrinkage, and thermal effects has recently been devel-
oped for the Corps by Anatech International Corporation working under contract
for the Waterways Experiment Station. Through the use of this model in a
proven general-purpose finite-element code it has been possible for engineers
to determine the concrete mixture proportions and construction procedures
which will yield the-most cost-effective, safe, and serviceable structure for
a given application [2].
3. Recent analytical and experimental studies performed in the Concrete
Technology Division (CTD) have generated considerable interest in the thermal
stresses and related phenomena which occur at very early ages of concrete
placed in mass structures. These studies have shown that an accurate determi-
nation of concrete material properties at early ages (especially time of set-
ting through 3 days) is essential in performing an accurate analytical
prediction of thermal stresses and related cracking in a mass concrete struc-
ture. A series of early-time material properties tests was performed on mass
1

concrete-mixtures to be-used in the construction of locks and-dams. The
results,-of this investigation and an analysis are reported herein.
Literature Review
4. The ancient Egyptians, Greeks, and Romans were among the first peo-
ple to use concrete as a building material. The cracking associated with
concrete has been a major problem since that time [3]. As mentioned earlier,
the cracking of mass concrete structures has generated a great deal of inter-
est and concern within the US Army Corps of Engineers.
5. Given the experiences with Dworshak and Russell Dams, an important
question must be raised of why significant cracking occurred in two struc-
tures designed with verified computer programs using well-established proce-
dures. It should also be noted that this cracking occurred, in some
instances, before any water-was impounded behind the dam. This observation
rules- out hydrostatic loading as the cause of the cracks, and lends credibil-
ity to the idea that the cracks were due to excessive thermal strains. These
considerations led to a conclusion that the theoretical and computational
methods used in the analysis and design of mass concrete structures should be
modified-or developed to deal with cracking problems. Material properties
test methods should also be developed to provide data consistent with the
requirements set forth by the computational procedures [1].
6. The majority of research in the area of concrete cracking has been
and is concerned with materials that have attained a steady-state condition
with regard to material properties as a function of time and temperature [1].
This steady state condition occurc in most concretes at later ages. Due to
this fact, there are very few data available on concrete material properties
during the time that concrete is undergoing the greatest amount of thermal
activity and physical change (i.e. early ages, less than 3 days) (2].
7. Mass concrete structures are constructed incrementally in layers
commonly called lifts. Lift heights and sequencing are controlled by thermal
stress considerations, concrete batch plant capacity, and structural geometry.
Careful consideration given to preventing construction-related cracking in the
specification-writing phase of a construction project leads to a more durable,
cost-effective structure. Incremental-construction analyses have shown that
2

the cost of materials, heat generation and associated thermal stresses, and
cost of construction can be reduced through the use of higher proportions of
fly ash in the concrete mixtures [4].
8. The rate of gain of compressive strength and elastic modulus, espe-
cially in the first few days after placement, are critical parameters in pre-
dicting construction-related cracking in mass concrete structures. In
addition, the removal and anchorage of formwork depend upon the early-time
strength gain characteristics of the concrete mixture [5].
9. It should be noted that in a thermal-stress analysis of a mass con-
crete structure the creep, shrinkage, and thermal strains are of tnC same
order of magnitude as the elastic strains. Therefore, the accurate character-
ization, modeling, and prediction of these material propert±Is are of the
greatest importance in the analysis of a mass concrete structare [3].
Obiective-
10. The objective of this investigation was to determine the
characteristics of compressive strength, Young's modulus of elasticity, and
creep at very early ages in concrete. The impact of these parameters on the
constitutive models used in the solution of incrementt?-construction thermal
stress analysis problems will be evaluated. While a significant data base
exists for the material properties of mass concrete at later times or ages,
very few data exist for the early-time material properties of mass concrete.
Therefore, this investigation makes a significat1t contribution to the existing
data base.
Scope
11. Due to the significant changes occurring in concrete at ages under
48 hours, tests were conducted to determine creep response, compressive
strength, and elastic modulus for ages of loading from 18 hours through sev-
eral days. Techniques and equipment for performing these tests were adapted
to measure the low loads and large deformations observed in concrete loaded at
very early ages. The characteristics of creep, strength gain, and modulus
gain at very early ages must be clearly understood in order to accurately
3

predict thermal stresses and relatedcracking in mass concrete structures.
Tests conducted at WES have shown that the measurement of creep in concrete at
very early P'es is a difficult and complex task, because the specimen creeps
during the time required for application of the load. This makes the separa-
tion of the elastic strain from the creep strain quite difficult.
12. The data obtained from the early-time material properties tests
will be used to evaluate three viscoelastic models. These models are the
American-Concrete Institute (ACI) creep equation, the WES Time-Dependent Mate-
rial Properties Model (UMAT) creep equation, and the Bazant Sinh-Double Power-
Law (SDPL) creep formulation.
4

CHAPTER II: CONCRETE MATERIAL PROPERTIES
General
13. To properly-address the properties of mass concrete at early ages,
it is necessary to understand the general physical, thermal, and mechanical
properties of concrete at all ages. An extensive database currently exists
which addresses these issues. A number of rational and consistent constitu-
tive models currently exist which can accurately predict the response of con-
crete subjected to various loading conditions. This -chapter will present an
overview of the properties of concrete.
Physical and Thermal Properties
14. The physical and thermal properties of concrete are highly depen-
dent on the types and relative proportions of the materials used in producing
a given concrete mixture. These properties undergo significant changes during
the-first 48 to 72 hours after concrete is placed. General characteristics of
the physical and thermal properties relevant to this investigation are briefly
described below.
a. Density or Unit Weight. The density of mass concrete is approx-imately the same as that of conventional concrete. The densityof concrete is a relatively stable property and does notundergo significant changes at early times. The density ofconcrete is primarily used in calculating loads from construc-tion and- service environments.
b. Porosity. The porosity of concrete is-a critical property thatmust be accounted for in order to understand moisture migrationduring and after concrete hardening. Many of the theoriesconcerning the mechanism of creep in concrete address the mat-ter as a function of moisture migration as a result of loading.
c. Moisture Content. As stated above, moisture migration isbelieved to-be one of the mechanisms which cause concrete todeform under sustained loads, i.e. to creep.
d. Adiabatic Temperature Rise. Deep within the interior of a massconcrete structure an adiabatic condition is approached. Dur-ing the hydration of cement a great deal of heat can begenerated. The models used in predicting temperaturedistributions within mass concrete structures use the adiabatic
5

temperature rise as the driving function for makingpredictions.
e. Thermal Coefficient of Expansion, Thermal Conductivity, ThermalDiffusivity, and Specific Heat. These properties have a-sig-nificant indirect effect on concrete volume change.
Mechanical- Properties
15. The mechanical-properties of concrete at very early ages vary sig-
nificantly from the properties of mature concrete. The concrete properties
such as stress-strain behavior, unconfined uniaxial compressive strength,
modulus of elasticity, tensile strength, creep and stress relaxation, shrink-
age, contraction and expansion expressed as functions of time, are used in the
analysis and design of mass concrete structures. A brief description of these
properties is presented below:
a. Stress-strain Behavior in Uniaxial Compression. The shape ofthe stress-strain curve for concrete changes dramaticallywithin the first few days after concrete is placed. Duringearly times the ascending portion of the curve is less linearand much flatter than for mature concrete. A great deal ofthis can-be contributed to creep and other forms of non-linearbehavior during loading.
b. Unconfined Compressive Strength. Many factors influence thestrength of concrete. Some of the main factors include:water-cement ratio, degree of compaction, temperature, and age.In this thesis the influence of age on strength will be one ofthe main points of emphasis, with early times being the periodof primary interest.
c. Modulus of Elasticity. The values of the Young's modulus ofelasticity for concrete at early ages are vastly different fromthat of mature concrete. It is also important to note that themodulus of elasticity for concrete at early ages is increasingat a substantial rate.
d. Tensile Strength. The tensile strength of concrete varies withage just as the compressive strength varies with age. Thetensile strength of concrete is normally estimated to be 10 %of the compressive strength at the same age. Further investi-gation into this area is needed, but was outside the scope ofthis research effort.
e. Creep. The time-dependent deformation of hardened concrete
subjected to a sustained load is defined as creep. Thisincrease is obtained by subtracting from the strain in a loadedspecimen the sum of the elastic strain due to applied stress,the shrinkage and thermal strain in an identical load free
6

specimen. Creep is particularly related to strength, elasticmodulus, and age at loading. The primary effect of this phe-nomena is, in general, the relief of stress due to shrinkage,contraction, or expansion. This property of concrete variesgreatly with age and is associated with moisture migration andother viscoelastic behavior.
f. Shrinkage. The time-dependent decrease of concrete volume dueto loss of moisture is shrinkage, These changes in volumeoccur without stress attributable to actions external to theconcrete. A detailed study- of these phenomena was outside thescope of this investigation.
Z. Contraction and Expansion. Contraction or expansion is thealgebraic sum of concrete volume changes occurring as theresult of thermal variations- caused by heat of hydration ofcement or by changes in the ambient temperature. A detailedstudy of these phenomena was also outside the scope of thisinvestigation.
7
CHAPTER III: CONCRETE MODELS
General
16. Constitutive models are used to relate states- of stress to associ-
ated states of strain. This is a very general definition of the term "consti-
tutive model". For the purposes of this report only constitutive models capa-
ble -of predicting time-dependent behavior will be discussed. Time-insensitive
models based on elasticity and plasticity will not be discussed. Two common
simple models used to predict the relationship between strength- and elastic
modulus as it changes with -time, alongwith -more sophisticated models for
predicting creep, will be discussed in this section.
Strength and Modulus Equations
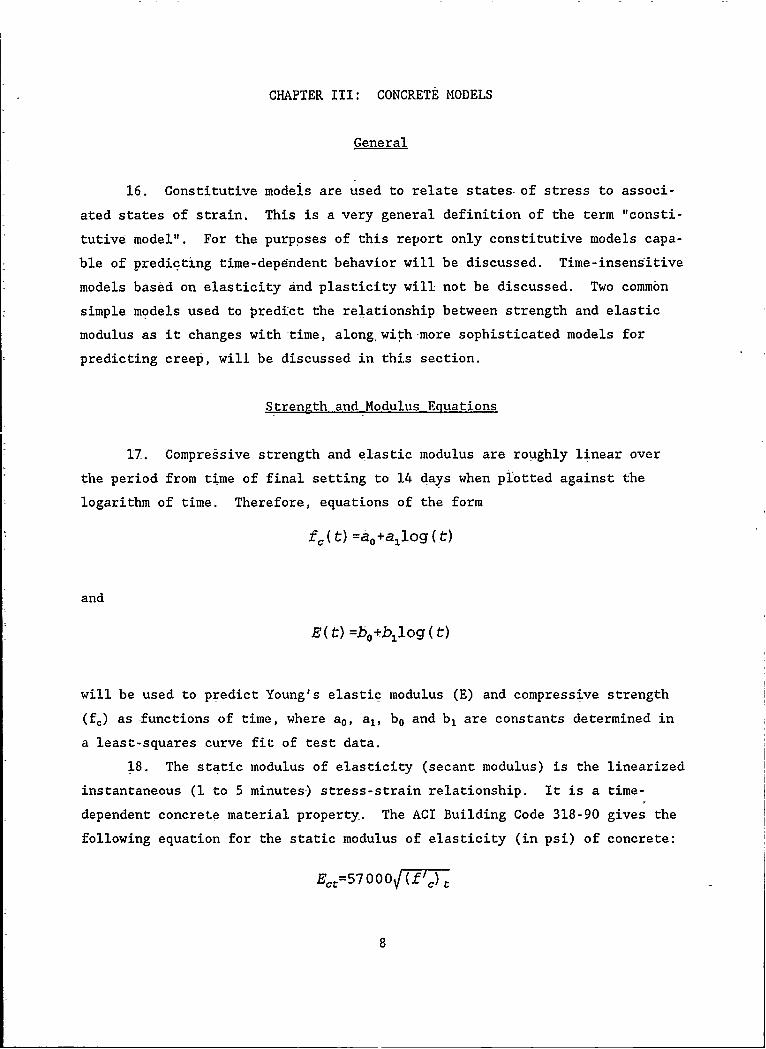
17. Compressive strength and elastic modulus are roughly linear over
the period from time of final setting to 14 days when plotted against the
logarithm of time. Therefore, equations of the form
f, ( t) =a0 +allog ( t)
and
E( t) =bo+bllog (t)
will be used to predict Young's elastic modulus (E) and compressive strength
(fc) as functions of time, where a0 , a,, b0 and b, are constants determined in
a least-squares curve fit of test data.
18. The static modulus of elasticity (secant modulus) is the linearized
instantaneous (1 to 5 minutes) stress-strain relationship. It is a time-
dependent concrete material property. The ACI Building Code 318-90 gives the
following equation for the static modulus of elasticity (in psi) of concrete:
Ect;=57 00 ______
8

where (f'cd t is the compressive strength in psi -at time t [6].
Theory and Prediction of -Creep
19. A number of theories about creep have been proposed over the years
but no single theory is capable of accounting for all the observed phenomena.
An understanding of the mechanism of creep is important in understanding the
theories that have been applied to predicting creep response of concrete.
Ac cording to ACI Committee 209, the main mechanisms which describe creep are:
a. Viscous flow of the cement paste caused-by sliding or shear ofthe-gel particles lubricated by layers of adsorbed water.
b. Consolidation due to seepage in the form of adsorbed water orthe decomposition of interlayer hydrate -water.
-g. -Delayed-,elasticity due to the cement paste acting as arestraint on the elastic deformation of the skeleton formed by-the aggregate and gel particles.
d. Permanent deformation caused by local fracture (microcrackingand failure) as well as recrystallization and formation of new
physical bonds '[7].
20. A satisfactory theory of-creep must explain-in a consistent manner
the behavior of concrete under various environmental conditions and various
states -of stress-. With this -in mind, any theory for-predicting tho creep
characteristics of concrete at all ages must be based on theoretical and
experimental backgrounds. The following discussion of some current creep
models will begin with simple rheological models and progress toward more
complicated viscoelastic models.
Rheoldgical Models
21. The- study of the flow properties of a material, hence the relation-
ships between stresses and strains in a very general sense is rheology. Theo-
retical ideal bodies with strictly defined properties are proposed and
combined to result in a behavior similar to that of real materials. The most
common ideal bodies used to build up a rheolcgical model are an elastic spring
and a dashpot. The spring is used to represent elastic behavior and the dash-
pot is used to represent viscous (time-dependent flow behavior). These basic
elements can be combined and built into rheological models of varying
91

complexity. The two basic models used are the Kelvin model -a-d the Maxwell
model, shown-in Figure 1. In the Kelvin model the spring and- the dashpot are
in-parallel so that they undergo the same displacement. This results in the
total force on the Kelvin model being the sum of the forces on the individual
elements. In-the Maxwell model the spring and the dashpot are in series so
that they take the same load. This results in the total displacement of a
Maxwell model being the sum of the displacements of the two elements.
Kelvin Model
22. Consider the Kelvin model, when a load is applied suddenly, the
element exhibits no initial deformation. However, the deformation increases
with time exponentia.ly. Initially, all the load is carried by the dashpot
but is transferred to the spring at a decreasing rate so that at infinite time
the -spring would carry the entire load. Because of this, a Kelvin model
approaches an asymptotic value equal to the instantaneous deformation of the
spring alone, Pa. The equation of a Kelvin model is given as:
P=PIx + V.---Ut
where P is .the applied force, a is the sprin: compliance, x is the deformation
of the model, v is the viscosity of the dashpot, and,:: is time. The solution
of the Kelvin model equation is of the form:
-Cx=Pa (1-e )
where t1=(av) is equal to the time in which the ultimate deformation would be
reached at a constant rate of deformatir. 2qual to rhe initial value. The
deformational response of a Kelvin model is shc.. in Figurt. 2. A Kelvi.n model
is well-suited for problems involving delayed elasticity and strain recovery
with some permanent deformation.
Maxwell Model
23. The characteristics of a Maxwell model are somewhat different from
a Kelvin modal. In a Maxwell model, when a load is applied, the extension of
the spring is:
10

where a i's the spring compliance. The deformation of the dashpot is given as:
dXd-.
Where v is the viscosity of the liquid id ne dashpot.
24. The total viscosity of the mod. is:
Since the load carried by the two elments in series is the same,
Therefore the differential equation of the Maxwell model is giv-en as:
dPa+P dxdt v dt
25. Figure 2 shows the deformational behavior -of a Maxwell model under
a sustained load and after its removal Lhe existence of a permanent deforma-
tion. It should also be noted that, when subjected to a constant deformation,
a Maxwell -model exhibits- the property of stress relaxation. Since dx/dt = 0
the solution to the differential equation yields that
__t
P=Po e Cv
where Po is the initial load. Fr,-m this, it can be seen that the relaxation
is exponential and complete after an infinite time. The Maxwell model is -ery
useful in relaxation problems.
11

26. Rheologica. models imply nothing about the physical mechanisms
responsible f'or the observed behavior of concrete but give an -overall descrip-
tion of the phenomena of deformation. The solution foru." for the rheological
models are the basic forms for most creep models: and they provide an excel-
lent background for further understanding of the more complicat-ed viscoelastic
models such as the Bazant creep formulation, the ACI creep formulation, and
the WES-UMAT time-dependent material properties model. These models will be
addressed in the next section.
Viscci,,astic Creep Models
27. In the following methods the specific creep, C(ti-0), is defined as
the ratio -of creep strain at any age t, after application of streFS at age to,
to the applied stress. This is shown in the following equation:
C(t, to) -6c'oep
Gapplied
Bazant Sinh-Double Power_Law
28. A simple basic creep f .nula for concrete based on Sinh Double
Power Law (SDPL) -has been-proposeJ by Bazant, et al [10]. The forulma is
designed to predict only load induced creep and not drying creep or st..-i.nnkage.
As presented, the formula allowed a good fit of experimental data from the
literature. -However, early time response was not thoroughly investigated.
The formula is presented below and will be evaluated against early-age test
-data in Chapter 5. The SDPL creep compliance (specific creep) function
C(t,t0) repr.esents the strain per unit stress at any age -t caused by a uni-
axial stress applied on concrete at a.g to.
C(t, t, Io) sinh-.
12

Ct
a
p p
Figure 1. (a) Kelvin Model, (b) Maxwell Model
13

Load sustained Load removed
E0
0 ti Time t(a)
Load sustained Load removed,
fC
0
-0 Time t(b)
Figure 2. (a) Deformiational Response of a Kelvin Model,(b) Deformiational Response of a Maxwell Model
14

where:
=*(to+a) (t-t o )n
Eo represents the elastic modulus at the time of loading and Vo, 01,
a, n, and m are five constants determined from fits of C(t,t.) to calibration
creep test data.
ACI creep formula
29. Based largely on experimental work on concretes at ages greater
than 7 days, ACI Committee 209 (7] recommends the following general equation
for-predicting creep of concrete at any time:
C( t, t o ) - c. ( * o)10+(t-t 0 ) t
where C(t,to) -represents the strain per unit stress at any age t caused by a
uniaxial stress applied on concrete at age t, and Cm,(to)- is known as the
ultimate specific creep. A more specific form of the ACI equation allows for
the exponent, 0, to be set equal to 0.6 and is the most widely used form of
the equation. ACI gives the following procedure for estimating C0 (to) from
specimen size, curing conditions, and mixture properties:
C. ( t o) =2.3 5xlx2x 3x 4xsx 6
where xj, x2 ...x6 are constants calculated from the concrete mixture propor-
tions and material properties. This type of procedure is only necessary when
test data are not available. For the purposes of this report the specific
creep values at the end of -the creep tests will be used to determine the ulti-
mate specific creep.
WES VI4AT time-dependent
material Properties model
30. A three-dimensional finite-element model (UMAT) for concrete which
includes material aging, creep, shrinkage, and thermal effects has recently
been developed for the Corps by Anatech International Corporation working
15

under contract for the Waterways Experiment Station. An equation of the fol-
lowing series form is used in UMAT to predict creep:
E t,) .i=C( t, t o) .E( to)- Al (1 -e X,(tto)
where
C(t,to) = creep compliance (specific creep)
to - age of concrete at time of loading, in days
t - age of the concrete, in days
.m - number of terms in the series
Aj, ri - experimentally determined coefficients
t= - age of loading from which equation coefficients
are determined, usually 3 days
E(tr) = modulus of concrete at the calibration age
E(t0) - modulus of concrete at the age of loading
31. The term E(tc)/E(to) is known as the age factor. This term is used
to account for an age-of loading that is different from the age of loading
from which the equation constants were determined (5].
16

CHAPTER IV: EXPERIMENTAL PROGRAM
GenirK.4
32. This chapter summarizes the equipment, procedures, methods, and
results of the experimental phase of the investigation. Described below are
the concrete mixture-proportions, test-specimen preparation, test devices,
mechanical properties tests, and test results.
Concrete Mixture Prop-.rtions
33. Two concrete mixtures, typical for mass concrete applications, -were
selected for this investigation. These concrete mixtures are designated as
mixtures A2 and All. Both mixtures used Type II, low alkali (LA) portland
cement meeting ASTM C 150 and a Class C fly ash meeting ASTM C 618 [11 i].
The fine aggregate was a natural sand composed of blocky, ellipsoidal, and
spherical particles. Chert was the primary constituent in sizes larger than
2.36 mm, with quartz predominating in the smaller sizes. The (No. 4 to
3/4-in.) coarse-aggregate was a primarily pale yellowish-brown chert composed
of blocky, pyramidal, and tabular particles with rounded edges and corners.
Quartz and other miscellaneous particles made up the remainder of the constit-
uents. The (3/4 to l-i/2-in.*) coarse-aggregate was a crushed stone. It was
a speckled medium-light-gray, medium-to-coarse-grained igneous rock classified
as syenite. Its composition and textural characteristics were similar to
those of granite. Physically the stone was angular with rough surface
texture.
34. The mixture proportions for one cubic yard of concrete are shown in
Table I for both mixtures, all weights are based on saturated-surface-dry
aggregate conditions. Table 2 summarizes both mixture characteristics of
water-cement ratio (W/C) and fly ash to Portland cement proportion which were
calculated by converting the fly ash volume to an equivalent volume of Port-
land cement.
* A table of factors for converting non-SI units of measurement to SI
(metric) is presented in page vi.
17
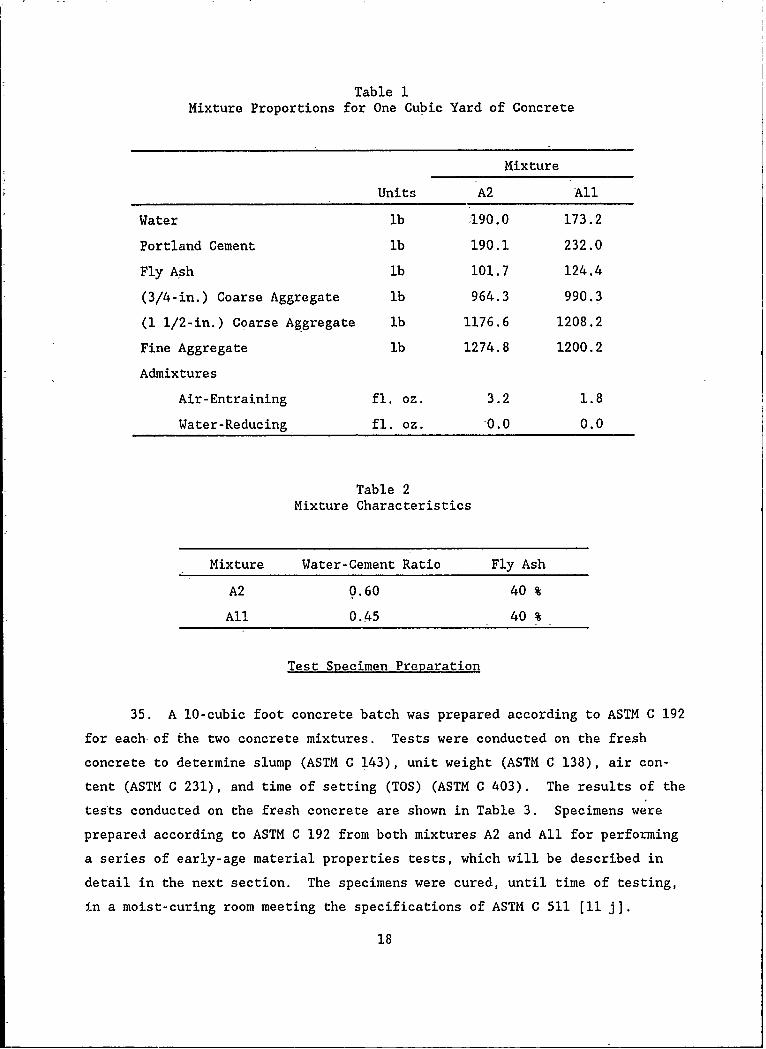
Table 1Mixture Proportions for One Cubic Yard of Concrete
Mixture
Units A2 All
Water lb 190.0 173.2
Portland Cement lb 190.1 232.0
Fly Ash lb 101.7 124.4
(3/4-in.) Coarse Aggregate lb 964.3 990.3
(1 1/2-in.) Coarse Aggregate lb 1176.6 1208.2
Fine Aggregate lb 1274.8 1200.2
Admixtures
Air-Entraining fl. oz. 3.2 1.8
Water-Reducing fl. oz. 0.0 0.0
Table 2Mixture Characteristics
Mixture Water-Cement Ratio Fly Ash
A2 0.60 40 %
All 0.45 40 %
Test Specimen Preparation
35. A 10-cubic foot concrete batch was prepared according to ASTM C 192
for each of the two concrete mixtures. Tests were conducted on the fresh
concrete to detetmine slump (ASTM C 143), unit weight (ASTM C 138), air con-
tent (ASTM C 231), and time of setting (TOS) (ASTM C 403). The results of the
tests conducted on the fresh concrete are shown in Table 3. Specimens were
prepared according to ASTM C 192 from both mixtures A2 and All for performing
a series of early-age material properties tests, which will be described in
detail in the next section. The specimens were cured, until time of testing,
in a moist-curing room meeting the specifications of ASTM C 511 [11 j).
18
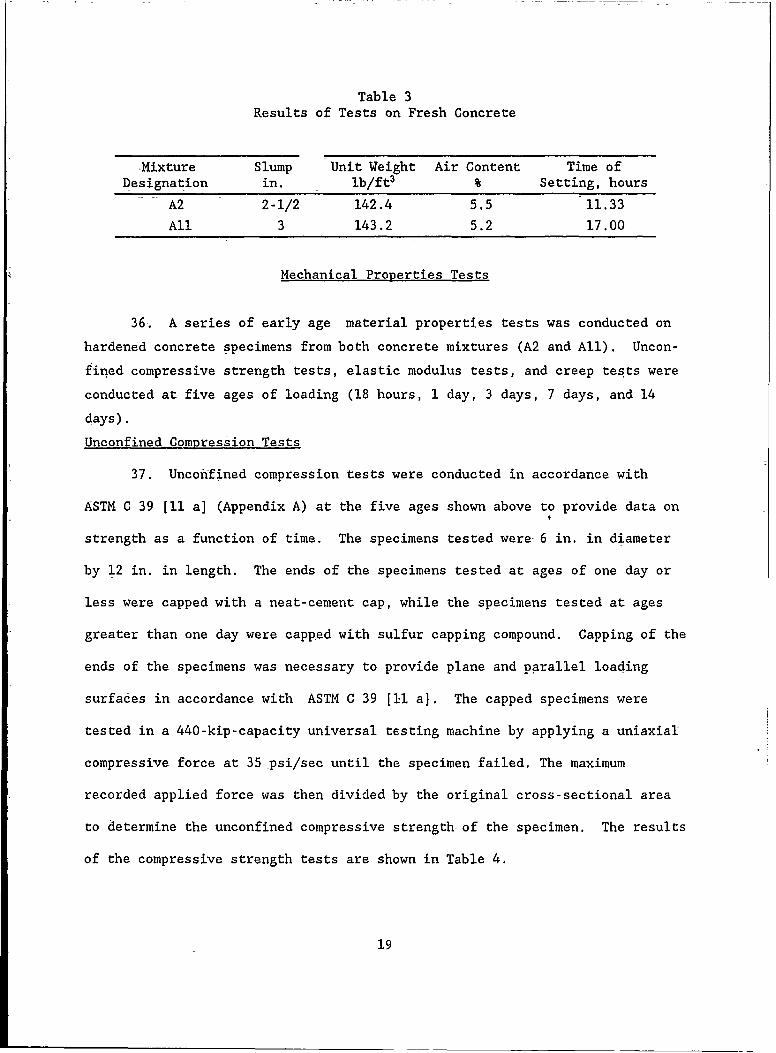
Table 3Results of Tests on Fresh Concrete
,Mixture Slump Unit Weight Air Content Time of
Designation in. lb/ft3 Setting, hours
A2 2-1/2 142.4 5.5 11.33
All 3 143.2 5.2 17.00
Mechanical Properties Tests
36. A series of early age material properties tests was conducted on
hardened concrete specimens from both concrete mixtures (A2 and All). Uncon-
fined compressive strength tests, elastic modulus tests, and creep tests were
conducted at five ages of loading (18 hours, 1 day, 3 days, 7 days, and 14
days).
Unconfined Compression Tests
37. Unconfined compression tests were conducted in accordance with
ASTM C 39 [11 a] (Appendix A) at the five ages shown above to provide data on
strength as a function of time. The specimens tested were-6 in. in diameter
by 12 in. in length. The ends of the specimens tested at ages of one day or
less were capped with a neat-cement cap, while the specimens tested at ages
greater than one day were capped with sulfur capping compound. Capping of the
ends of the specimens was necessary to provide plane and parallel loading
surfaces in accordance with ASTM C 39 [l1 a]. The capped specimens were
tested in a 440-kip-capacity universal testing machine by applying a uniaxial
compressive force at 35 psi/sec until the specimen failed. The maximum
recorded applied force was then divided by the original cross-sectional area
to determine the unconfined compressive strength of the specimen. The results
of the compressive strength tests are shown in Table 4.
19

Table 4Compressive Strength Data for Mixtures A2 and All
Mixture Age at Compressive Strength,
Loading, t. psi
A2 18 Hours 177
A2 1 Day 210
A2 3 Days 499
A2 7 Days 730
A2 14 Days 1010
All 18 Hours 375
All 1 Day 535
All 3 Days 1115
All 7 Days 1705
All 14 Days 2425
Modulus of Elasticity Tests
38. The modulus of elasticity of-both mixtures at the various ages of
loading was determined from the initial-loading phase of the creep tests.
Although at very early ages (three days or less) the mixtures exhibited lim-
ited linear-elastic compressive behavior, estimates of elastic modulus at very
early ages are necessary for calibrating the-material models to be investi-
gated in Chapter 5. Thus, a tangent modulus was determined from the stress-
strain data obtained upon initial loading of a compressive creep specimen.
This initial loading phase of the creep test was usually conducted in less
than two-minutes total elapsed time; however, some creep occurred during the
initial loading phase, particularly at the earlier ages of loading. Any
creep strains which occurred during the initial loading phase were subtracted
from the elastic strains in calculating the elastic modulus. The results of
the elastic modulus tests are shown in Table 5.
20

Table 5Modulus of Elasticity Data for Mixtures A2 and All
Mixture Age at Loading, Elastic Modulus
to 106 psi
A2 18 Hours 0.35
A2 1 Day 0.42
A2 3-Days 2.03
A2 7 Days 2.58
A2 14-Days 2.97
All 18 Hours 1.05
All 1 Day 1.37
All 3 Days 2.88
All 7 Days 3.82
All 14 Days 4.50
Compressive Creep Tests
39. Creep is most simply defined as time-dependent deformation induced
by sustained load. Although concrete can exhibit changes in deformation with
no applied- load due to shrinkage (both drying and sealed), creep is normally
assumed to be the deformation in excess of shrinkage strains and -elastic
strains. It is generally agreed that the creep response of concrete is funda-
mentally governed by the movement of water under load and its effect on con-
tinued hydration and strength development.
40. Upon initial application of load at time to, the material response
is primarily elastic, but may include a non-elastic component. The nominal
elastic strain is governed by the elastic modulus at time to. These basic
relationships are shown in Figure 3. It is common practice to ignore the
change in -elastic modulus with- time. Shrinkage of the creep specimen is mea-
sured by monitoring the deformation of identically prepared unloaded speci-
mens. Thus, the creep strains are calculated from the total measured strains
as follows:
21

Ecreep=Gtotal-elastc -Eshrinkage
41. Using these concepts, creep tests were conducted according to
ASTM C 512 [11 k] and modified to include continuous data acquisition by come
puter. The specimens tested were 6 in. in diameter by 16. in. in length. The
creep specimens were cast with the longitudinal axis in a horizontal plane in
steel forms anA were subjected to external vibration to provide adequate con-
solidation as shown in Figure 4. These forms accommodated Carlson strain
gages placed at the center of the specimens oriented along the longitudinal
axis of the cylinder as shown in Figure 5. A general discussion of Carlson
strain gages is presented in Appendix C. Steel bearing plates were attached
to the ends of the specimen by embedded mechanical anchors. These plates pro-
vided a smooth plane surface for applying the compressive force. A bituminous
moisture barrier was applied to the surface of the creep specimen immediately
after -the forms were- removed to prevent moisture from entering or leaving the
specimen as shown in Figure L.
42. The apparatus used to perform the creep tests was a- hydraulic load-
ing frame designed to-maintain a constant stress by means of a gas pressure
regulator in series with a gas and oil accumulator and hydraulic ram. The
desired applied stress was set-by means of the gas pressure regulator. The
test device accommodated two specimens loaded in series. For each mixture two
control cylinders were also monlitored to determine the strains not associated
with the applied loads as shown in Figure 7. Photos of a typical creep testing
device are shown in Figure 8 and Figure 9. The creep specimens were loaded to
40 percent of the unconfined compressive strength at the age of loading as
determined from unconfined compressive tests on companion 6-in by 12-in cylin-
ders. The applied stress was maintained until a minimum age of 28 days was
attained with the exception of the 7-day test on mixture All. That particular
test was terminated approximately 7 days after loading due to a malfunction of
the creep test device. The following measurements were recorded using a digi-
tal data acquisition system:
a. Applied stress, by pressure transducers located in the gas
pressure regulator output line;
22

b. Strain and temperature in the loaded specimen, by Carlsonstrain gages embedded in the center of the specimen;
c. Strain and temperature in the control specimen, by Carlson
strain gages embedded in the center of the specimen and
d. Time, byoan internal clock in -the computer data-
acquisition unit.
43. The recorded data from the creep tests are shown in Appendix D.
The data from the-creep tests -were reduced as specified in ASTM C 512. The
procedure requires that the strains which occur during the initial loading and
the strains recorded by the shrinkage compensation cylinders be subtracted
-from the measured- strains. These corrected strains were then divided by the
average sustained-stress to obtain specific creep:
C(t, t) - ecreepGapplied
These data are shown in Figures 10 through 19.
44. Several observations can be made about the creep data. The creep
strain per unit stress decreases with increasing age of loading. This
decrease of the creep response is related to the continuing increasG in modu-
lus of elasticity -and strength due to continuing hydration of the cement. The
specimens loaded at very early ages (1 day or less) exhibited high levels of
creep very early after the application of the stress-. It is likely that this
is due to the amount of free water which is able to move throughout the matrix
at -this early age.
23

-total
Eo0 -E at oading, wE(t E attime t
time
Figure 3. Basic specific creep relationships
24

Figure 4. Preparation of creep test specimens using vibratory
compaction table
25

Figure 5. Steel mold for creep specimens with Carlson
Strain gage installed
26
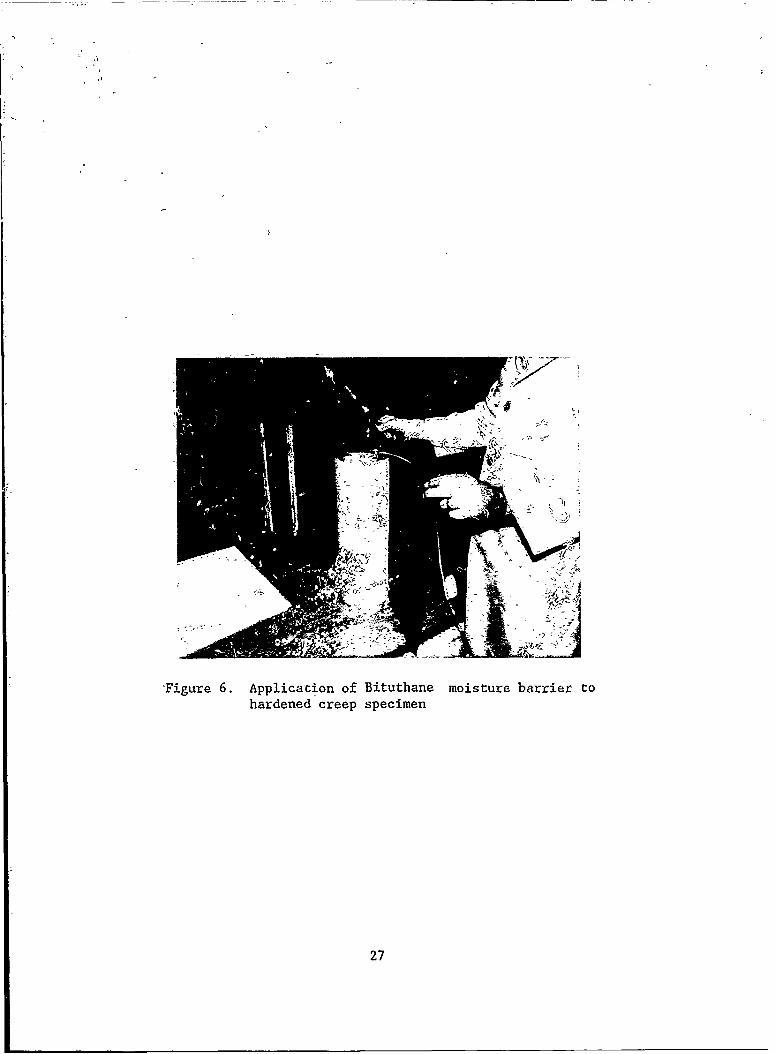
Figure 6. Application of Bituthane moisture barrier tohardened creep specimen
27

Figure 7. Creep test control cylinders
28
.U-- <;
29'1

J I
Figure 9. Creep test device complete with loaded creep cylinders
30

Mixture A2-Age at Loading 18 Hours
3.0
2.5cn0.
~2.0
0
.
(-3
0.0 I0 5 io 15 20 25 30
Time Since Loading, Days
Figure 10. Specific creep versus time since loading from 18-hour teston mixture A2
31
Mixture A2Age at Loading = i Day
3.0
2.5
c
0~.5
1.0
S0.50
0 .0 I I I0 5 10 15 20 25 30
rime Since Loading, Days
Figure 11. Specific creep versus time since loading from 1-day teston mixture A2
32

Mixture A2Age at Loading = 3 Days
• 0.50
0.40
0.H-
, 0.30
E
0.20C_
0.0
0-.0 I I ! ! !
0 5 10 15 20 25 30
Fime Since Loading, Days
Figure 12. Specific creep versus time since loading from 3-day teston mixture A2
33

Mixture A2Age at Loading =7 Days
*0.50
0.40
4J
0
ER
0-.20L-C-,
C-0. 10Cl)
0.-0I I0 5 10 15- 20 25 30
Fime Since Loading, Days
Figure 13. Specific creep versus time since loading from 7-day teston mixture A2
34

Mixture A2Age at Loading =14 Days-
0.-60I
0ri.50U)
U)-C 0.404~J
0
:0.30E
0_20
0 5 10 15 20 25- 30
Fime Since Loading, Days
Figure 14. Specific creep versus time since loading from 14-day teston mixture A2
35

Mixture AilAge at Loading = 18 Hours
1.5 I
ci)J_ 1.0-
.-0.50C-.
0 .. -I
0 -5 10 1,5 20 25 30
Time Si-nce Loading, Days
Figure 15; Specific creep versus time since loading from l 8-hour testoft mixture Al
36
Mixture AliAge at Loading = J Day
1.0 I
(1 0.80
0.
4-)c: 0.600
E 0.40
*0.20
0.0-
0.0 I I I I I
-0 5 10 15 20 25 30
rime Since Loading, Days
Figure 16. Specific creep versus time since loading from 1-day teston mixture All
37

Mixture AiAge-at Loading = 3 Days
0.50
cn 0.40
C1
.4-: Q1. 300
E0.20
C.)
' ,0. 10
0 .0 I I _ ! I0 5 10 15 20 25 30
Fime Since Loading, Days
Figure 17. Specific creep versus time since loading from 3-day teston mixture All
38

-Mix-ture AllAge at Loading =7-Days
0.50- 7- 1 - -- T
U0.40-,
0.
.20
L
*i 0. 10U)
0 2 4 6 8 10 12 14 16
rime Since Loading,-Days
Figure 18. Specific creep versus time since loading from 7-day teston mixture All
39

Mixture AllAge at Loading- 14 Days
0-.50 V[ I---,
"0,. 40
0
ER
CL
0_
040

CHAPTER V: ANALYSIS
General
45. In this chapter the results of the experimental program are used to
calibrate-, verify, and evaluate the effectiveness of currently used strengzh-
modulus relationships and -three viscoelastic material models for predicting
mechanical response of concrete at early ages. After the models were
selected, simple trial-and error procedures were used to calibrate the parame-
iters of each model. The models will be used to predict mechanical response of
concrete under the test conditions. The predictions will be evaluated- in
light of the test data. A sign convention of compression positive is used
throughout the analysis.
Selection- of Mechanical Properties Models
46. Two common simple models-used to predict the strength and elastic
modulus as -functions of time were selected for comparison with early age
mechanical properties test data. These models are based on -least-squares fits
of test data in a log-time domain. Three of the viscoelastic concrete creep
models presented in Chapter 5 were selected for comparison with- early age
mechanical properties test data. These models are the- ACI creep formula, the
WES UMAT creep equation, and the Bazant Sinh-Double Power -Law creep
formulation.
Calibration of Creep Model Parameters
ACI creep equation
47. ACI recommends the following equation for predicting creep of
moist-cured concrete at any time:
C(t, t o) t-to) Ct)1 tto
41

Where C(t,t,) represents the specific creep at any age t caused by a
-uniaxial -stress applied on concrete at age to. ACI recommends a value of 0.6
for the exponent 0. Predictions were made using the recommended value of
0-0.6 and with the maximum-value of -0=1. C,(t,), the ultimate specific creep,
was determined from the maximum specific creep value from each age of loading
for both mixtures. These values are shown in Table 6.
Table 6ACI Ultimate Specific Creep for Mixtures A2 and All
Mixture Age at Loading, C'(t.)_to
A2 18 Hours 2.931
A2 24 Hours 2.624
A2 3 Days 0.542
A2 7 Days 0.472
A2 14 Days 0.427
All 18 Hours 1.213
All 24 Hours 0.947
All 3 Days 0.471
All 7 Days 0.276
All 14 Days 0.258
WES UMAT creep equation
48. An equation of the following series form is used in UMAT to predict
creep:-
C(t, to) E(t) = e.
where:
C(t,to) - creep compliance (specific creep)
42

to = age of concrete at time of loading, in days
t = age of the concrete-, in- days
m - number of terms in the series
A1 , ri - experimentally determined coefficients
t= = age of loading from which equation coefficients are
determined
E(t,) =-modulus of concrete at the calibration-age
E(t0) = modulus of concrete at the age of loading
491. The coefficients Ai and ri were determined from fits of the equa-
tion to the experimental test data at an age of loading of 3 days and are
shown in Table 7. From previous work with this model the 3-day test has
proven to be an effective calibration age for the UMAT equation [5]. For the
purposes of this investigation a three-term series will be used.
Table 7UMAT Creep- Equation Coefficients for Mixtures A2 and All
Mixture A, r1 A2 r2 A3 r3
A2 0.1989 -0.0764 0.1487 -0.8831 0.2166 -1.300
All 0.1308 -0.0589 0.1965 -0.1892 0.1656 -1.766
Bazant Sinh-Double Power Law (SDPL)
50. The Bazant SDPL specific creep function C(t,t o) represents the
strain per unit stress at any age t caused- by a uniaxial stress -applied on
concrete at age to.
C( t, t o) -sinh-
43

where:
= t-+c ) (t-to)
Eo represents the elastic modulus at the time of loading and 7ho, 01, a, n,
and m are five constants determined from trial-and-error fits of C(t,t0 ) to
calibration test data. Bazant suggests that the parameter 01 be set equal to
I in order to reduce the number of constants to four. Acceptable results
were produced using this suggestion in the initial presentation of the SDPL.
To-provide- an effective comparison with the UMAT equation, 3-day test data
were also used to obtain -the calibration values for the SDPL equation con-
stants. The final values for these constants are shown in Table 8.
Table 8SDPL Creep Constants for Mixtures A2 and All
Mixture 00 0 a _n m
A2 0.9 1 0.027 0.194 0.21
All 1.1 1 0.020 0.194 0.20
Discussion of Test Data and Models
51. In the following sections a discussion of the test results and
their comparison with model predictions will be presented. As with the previ-
ous data presentations, a sign convention of compression positive will be
used.
Compressive strength
and modulus of elasticity
52. For each concrete mixture, two plots are shown: compressive
strength versus the logarithm of time (in days) and modulus of elasticity
versus the logarithm of time. These plots are shown in Figures 20 through 23.
44

53. Compressive strength and modulus of elasticity are roughly linear
over the period from time of final setting to 14 days when plotted against the
logarithm of time. Therefore, on each plot, equations of the form
f, (t) =ao +allog 0t
and
E(t) =bO+bllog (t)
have been fit to the data using the method of least squares where strength is
calculated in psi and modulus is calculated in psi X 106 , while ao, a,, b0 and
b, are constants determined in the least-squares curve fit. The results of
the least squares fits are shown on each plot and in Table 9.
Table 9Strength and Modulus Equation Constants
Mixture a0 a1 bo b,
A2 219.3 551.1 0.67 2.17
All 352.6 1244.1 1.25 2.76
54. The ACi Building Code 318-90 gives the following equation for the
static modulus of elasticity (in psi) of concrete:
Ecr=57 00j~c_,
where (f',)t is the compressive strength in psi at time t. The relationships
between modulus of elasticity and compressive strength for both mixtures are
shown in Figures 24 and 25. These data indicate that a relationship exists
between compressive strength and modulus of elasticity, even at vary early
time. It appears, however, that over the time period from time of final set-
ting to 14 days, this relationship may not be well-represented by a linear
45

function -in the modulus of elasticity-square root compressive strength plane.
For purposes of comparison, the ACI 318 equation has also been shown in Fig-
ures 24 and 25. Although this equation was not intended for use with the
independent variable as any value other than the 28-day compressive strength
(f'=), it is instructive to compare the results from the equa ... to early-
time data. As can be seen in Figures 24 and 25, the ACI 318 equation gener-
ally under predicts the modulus of elasticity at early times. Therefore, it
appears that this relationship should not be used by structural analysts to
predict modulus of elasticity from compressive strength at ages less than 28
days for mass concretes.
Creep -Data and Model Predictions
55. For both of the concrete mixtures, composite plots are shown of
specific creep versus time since loading from the creep test data, the ACI
Equation, the Sinh-Double Power Law, and the UMAT Creep Equation for all five
ages of loading. These plots are shown in Figures 26 through 35.
56. As expected, the very early age creep tests exhibit the greatest
amount and rate of creep. Mixture A2 clearly creeps more than Mixture All.
This was expected due to the higher water-cement ratio and consequent lower
strength and modulus of A2 (W/C-0.60) as compared to All (W/C=0.45). All
three creep models agreed with this general behavior at all ages of loading.
However, the -agreement of the models stops at this point.
57. The ACI equation, with either of the two exponent values (0.6 or
1.0), grossly underpredicts creep for both mixtures at all ages of loading for
the duration of the test. This underprediction can be attributed to the
nature of the test data- from which the ACI equation was developed. The major-
ity of test data use%- in developing the ACI creep equation came from tests on
structural concrete loaded at later ages. The emphasis of the development was
to provide an equation by which long-term structural deflections could be
calculated. Because of this, early-age effects were not considered and are
not adequately modeled. The ACI equation performs well the purpose for which
it was intended; however, since its performance at early ages is less than
desirable the following discussions of test data will primarily address the
SDPL and UMAT equations.
58. The SDPL and UMAT creep predictions for the 18-hour tests agreed
with the general form of the data for both mixtures. The SDPL equation
46

clearly overpredicted the creep response throughout the entire 18-hour test
for both mixtures. However, the SDPL prediction does fcllow the response of
mixture All more closely than that of mixture A2 for the 18-hour test. The
UMAT equation produced a better overall prediction of the 18-hour tests for
both mixtures. During the early times after application of load the UMAT
equation underpredicted creep response, while during the later stages of the
18-hour tests the UMAT equation overpredicted creep response for both
mixtures.
59. The UMAT equation produced the closest prediction of creep response
for 1-day test on both mixtures. Again, the SDPL equation overpredicted creep
for the majority of the 1-day testing period. The UMAT equation underpre-
dicted creep response for the first portion of the test and then overpredicted
creep during the later stages of the test.
60. As was expected, the prediction of both the UMAT and SDPL equations
are very good at the 3-day age of loading for both mixtures. The equation
constants for both the UMAT and SDPL equations were determined from trial and
error fits to the test data at the 3-day age of loading. The trends seen in
the earlier tests are still evident in the 3-day tests for both mixtures. The
SDPL equation o-v.rpredicts creep response during the early test stages and
very closely approximates the creep response during the later stages of the
3-day tests for both mixtures. For both mixtures, the UMAT equation provides
the closest prediction with a minimal amount of underprediction at early times
with a very close approximation of the creep response during the later stages
of the 3-day tests.
61. The predictions of both the UMAT and the SDPL equations for the
7-Eay and the 14-day tests for both mixtures exhibit the same general fea-
tures. The UMAT equation predicted the greatest amount of creep for both
concrete mixtures. Both equations underpredicted the creep response of mix-
ture A2 for the 7-day and the 14-day tests. As noted earlier, the mixture All
7-day test was terminated early due to a malfunction of the test device. In
general the predictions of both equations were less accurate for the 7-day and
14-day tests than for the earlier ages of loading for both concrete mixtures.
47

Mixture A2
12001 2 0 1- A I 1 ,I1 l
I 1 I-1'- 1' 1 9 1 I1 '1 I 1 l
<>*> <Data
"f 000 - 219.3 + 651.tI*og(t)
-in 1000
C3
800-
C-
- 600
400
CD.
E 2000
0.1 1 .0 ±0 100
4ge, days
Figure 20. Compressive strenigth versus age for mixture A2
48

Mixture All.
2500 --TrF-- I I I 1AI Ill=
* 'Datafc= 472.2 + 159i.5 *10 (t)
a. 2000
4-J
c .1500
4-JCl)
> 10,00U)
0
50
0. 1 1 .0 10 100
Age, days
Figure 21. Compressive strength versus age for mixture All
49

Mixture A2
4.0 ,
* < <Data-E -0.67 + 2.17 * log(t)
a3.0 C>2. 0
0 3 .0 C>
0
0 .0 - 1 o s
I
. ..0
Age, days
Figure 22, Elastic modulus versus age for mixture A2
50

Mixtur-e All
6.0- -
*-*~Data
*~5.0 E =1.25 + 2.76 *log(t)
c)0).
(0o 4.0-C
*3.0
U~ 2.0
(n
w 1.0
0.1 1.0 10 100
Age, days
Figure 23. Elastic modulus versus age for mixture All
51

Mixture A2
4.0-
* Data-ACI Equation
(na 3.0(0
2.0
U
(I) i.0
U
0 5 10 15 20 -25 30 35 40
\/C \/s
Figure-24. Elastic modulus versus square root of compressive strengthfor mixture A2
52

Mixture Ali
6.0 a
S-*Oata- ACI Equation. 5.0
(n
0 4.0
3.0
0
2.0-p
0 10 20 30 40 50
\\/psi
Figure 25. Elastic modulus versus square root of compressive strength
for mixture All
53

Mixture A2Age at Loading i 18Hours
5. 0 -z ta--. ACI (0. 6)
SDPLHf1 -UNATw 4.0 C(iAdII
-4-)
0 3
2.0
1.0 -
0.0 V0 5 i0 15 20 25 30
TieSince Loading, Days
Figure-26. Comparison of test data and creep model predictions from18-hour test on mixture A2
54

Mixture A2
Age at Loading =:1 Day
4.0 -
-ACI (0.6)SbPL
w -UMAT
-~3.0 -- ACI-i)
02.
0.0 I I0 10 15 20 25 30
Time Since Loading, Days
Figure 27. Comparison of test data and creep model predictions from1-day test on mixture A2
55

Age-aMiXture A20Ag 8 t Loading 3 Days
aa
0.X(0
4---4
4-- - 40.0
03riMe Since Loadingo Days
P~gu~ 28.Comparson Of test data and cre
3day test On mixture A2 eP Model predictions from
56

Mixture A2Age at Loading-= 7-Days
0.-60Data
-ACI (0. 6)*r0,50 -SDPL _
w -UMAT0. -- ACI (1)
(nS0.40
0
0.30
0.0 5 1 5 2 5 3Tim Sinc Loainay
Fiue2.Cmaio o etdt n re mdlpeitosfo
7-a etonmxueA
_U) 0 . 57
Mixture A2Age at-Loading =14 Days
0-.60- - ' _ -I tData
-ACI (0. 6)
-SDPL0- 5 -UMAT
0. -- ACI (i)
-~.40-
0
S0.30
'0.20~ -
C2- . -4.
0.0 III0 5- 10 15 20- 25 30
Time* -Slrce Lo-ading, -Days
Figure 30. Comparison-of test data and creep model predictions from14-day test on mixture A2
58

Mixture AilAge at Loading = 18 Hours
2.0- Dz
-- l ACI (0.6)SDPL
w - -UMAT
.O g i AC i Y0N 5C ( 0i5 20 25 3
-5;
2c
u0.50 - . .---
- _. 0 --
0 5 i0 15 20 25 30
rime Since Loading. Days
Figure 31. Comparison of test data and creep-model predictions from18-hour test on mixture All
59

Mixture~ AliAge at Loading-= I Day
1P--*4ACI-(O.6)
SOPL
U) - UMATa.- ACI (1)(n)
0.50 I I
& 5. 15~ 20 25- 30
Time Sinc-e Load-ing, Days
Figure 32. Corparison-of test data and reep- model predictions fromI-day test on mixture All
60

Mixture AilAge at Loading =3 Days-
U0.40
c:0.3
0.20/
4 - Data
Bazant SDFLCI UMAT Equaiion
ACI (1)
0.0 I0 5 10 15 20 25 30
Time Since Loading, Days
Figure 33. Comparison of test data and-creep model predictions from3-day test on mixture Al.
61
Mixture AiiAge at Loading = 7 Days
0.40 oata-- -ACI (0.6)
SDPL- UMAT ..- "
0) --..- ACI I)
0.304-, A... E-T
Co
0.20 .
(- I /
0.10 /"
U)4r
0.0 I I I I0 5 10 15 20 25 30
Time Since Loading, Days
Figure 34. Comparison of test data and creep model predictions from
7-day test on mixture All
62

Mixture Aii
Age at Loading =14 Days
0.50
DataACI (0. 6)
0.40 -- SP
- UMAT
--ACI W)
c0.300
E0.20
C-)
50.I10
0.0 v V I I I I I I I
0 4 8 12 16 20
Time Since Loading, Days
Figure 35. Comparison of test data and creep model predictions from14-day test on mixture All
63

CHAPTER VI: CONCLUSIONS AND RECOMMENDATIONS
62. The rates of increase in compressive strength and modulus of elas-
ticity, especially in the first few days after placement, are critical parame-
ters in predicting construction-related cracking in mass concrete structures.
In addition, the removal and anchorage of formwork depend upon the early age
strength gain characteristics of the concrete. The rate of development of
compressive strength and modulus of elasticity with time is highly dependent
on the selection of materials and mixture proportions. Therefore, early age
material properties tests should be conducted for each candidate mixture to
determine conformity with project requirements. Until more data are obtained,
no reliable, universally applicable relationship between early age compressive
strength and modulus of elasticity is known to exist. Therefore, early age
modulus of elasticity tests should be conducted for any concrete mixture for
which it is an important parameter.
63. Since there are major differences in the way that analysts view
creep depending on whether one's interest is in reinforced concrete or mass
concrete, a general statement about which model is best is not possible. If
one's interest is reinforced concrete, a model that closely overpredicts creep
response would provide a conservative value when used to determine overall
long-term deflections or loss of prestressing force. If one's interest is
mass concrete, a model that underpredicts creep would also underpredict the
stress-relieving properties of creep and provide a conservative estimate of
thermal stress and thermal-related cracking in mass concrete structures.
64. In mass-concrete thermal-stress analysis the early ages (less than 3
days) are more critical than the later ages. In reinforced-concrete analysis,
the primary concern is with ages greater than 28 days. The UMAT equation
yielded the most conservative and the closest prediction of early time creep
response. The UMAT equation may also be expanded with additional terms to
refine the response predictions of the model if a particular application
required additional accuracy. However, an increase in the number of terms
will increase the difficulty encountered in calibration of the model con-
stants. The SDPL equation can be made to closely predict creep response at a
given age provided that the equation constants are determined at that particu-
lar age of loading. However, the SDPL has demonstrated only a limited ability
64

to accurately predict creep response at ages of loading other than those used
for calibration. The addition of an aging factor similar to the one used in
the- UMAT equation should be developed for the SDPL in order to make it a more
effective analysis tool.
65. Extreme caution should -be used when applying conventional -concrete
material models- to mass concrete thermal-stress analysis. The vast differ-
ences between structural concrete and typical mass concrete mixtures will
usually require that specially developed or modified models be used. It
should also be noted that the use- of high percentages of pozzolans in mass
concrete invalidates most of the suggested values that ACI recommends for use
with the ACI creep equations. No-universally-applicable, constituent-based
model of early-time mass-concrete creep response is known to exist. There-
fore, early-time creep tests should be conducted for any concrete mixture for
which it is an important parameter. Models such as the SDPL creep equation
and- the UMAT creep equation will provide rational and consistent results when
properly calibrated and verified against accurate test data.
65

REFERENCES
[I.] Norman, C. Dean and Anderson, Fred A. 1985. "Reanalysis of Cracking inLarge Concrete Dams in the US Army Corps of Engineers", Proceedings,Fifteenth International Congress-On Large Dams, Lausanne, Switzerland.
[2] Norman,C. Dean, Campbell Roy L., and Garner, Sharon E. 1988. "Analysisof Concrete Cracking in Lock-Wall Resurfacing", Technical ReportREMR-CS-15, US Army Engineer Waterways Experiment Station, Vicksburg, MS39180.
[3] Neville, A. M. 1981, 1983. Properties of Concrete, Pittman PublishingInc., Marshfield, MA.
[4] Hammons, M. I., Smith, D. M., and Neeley, Billy D. 1990 (July). "RedRiver Waterway Thermal Study; Concrete Mixture Selection and Character-ization", Report 1, Technical Report SL-90-08, USAE Waterways ExperimentStation, Vicksburg, MS 39180.
[5] Garner, S. B., Hammons, M. I., and Bombich, Anthony A. 1991. "RedRiver Waterway Thermal Study; Thermal Stress Analyses", Report 2, Tech-nical Report SL-90-8, USAE Waterways Experiment Station, Vicksburg, MS39180.
[6) ACI Committee 318. 1990. "Building Code Requirements for ReinforcedConcrete", American Concrete Institute, Detroit, MI.
[7] ACI Committee 209. 1988. "Prediction of Creep, Shrinkage and Tempera-ture Effects in Concrete Structures", ACI Manual of Concrete Practice,Part 1, American Concrete Institute, Detroit, MI.
[8]- Neville, A. M., Dilger, W. H., and Brooks, J. J. 1983. Creep of Plainand Structural Concrete, Construction Press, New York, NY.
[9] Neville, A. M., and Brooks, J. J. 1987. Concrete Technology, JohnWiley and Sons, New York, NY.
[10] Bazant, Z. P., Chern, J. C., and Wu, Y. G. (1989). "Basic Creep Form-ula for Aging Concrete: Sinh Double Power Law," Cement, Concrete, andAggregates, Volume 11, Number 2, pp. 85-91.
[11] American Society for Testing and Materials. 1990. 1990 Annual Book ofASTM Standards, Philadelphia, PA.
a. Designation C 39-86. "Standard Test Method for Compressive Strengthof Cylindrical Concrete Specimens."
b. Designation C 138-81. "Standard Test Method for Unit Weight, Yield,
and Air Content (Gravimetric) of Concrete."
c. Designation C 143-78. "Standard Test Method for Slump of PortlandCement Concrete."
d. Designation C 150-85a. "Standard Specification for Portland Cement."
e. Designation C 191-82. "Standard Test Method for Time of Setting of
Hydraulic-Cement by Vicat Needle."
66

f. Designation-C 192-81. "Standard Practice for Making and Curing Con-crete Test Specimens in the Laboratory."
g. Designation . 231-82. "Standard Test Method for Air Content ofFreshly Mixed Concrete by the Pressure Method."
h. Designation C 311-87. "Standard Test Method for Sampling and TestingFly Ash or Natural Pozzolans for Use as a Mineral Admixture in Port-land Cement Concrete."
i. Designation C 403-85. "Standard Test Method for Time of Setting ofConcrete Mixtures by Penetration Resistance."
j. Designation C 511-85. "Standard Specification for Moist Cabinets,Moist Rooms, and Water Storage Tanks Used in the Testing of Hydrau-lic -Cements and-Concretes."
k. Designation C '512-87. "Standard Test Method for Creep of Concrete inCompression."
1. Designation C 618-85. "Standard Specification for Fly Ash and Raw orCalcined Natural Pozzolan for Use as a Mineral Admixture in PortlandCement Concrete."
[12] Raphael, J. M. and Carlson, R. W. 1954. "Measurement of StructuralAction in Dams," James J. Gillich & Co., Berkeley, CA
67

APPENDIX A
CREEP TEST METHOD
68

(Issued I Jun. 1989) C 54
CRD-C 54-89
4ip Designation: C 512- 87
Standard Test Method forCreep of Concrete in Compression'
Thu. uVA.di k immed uAT the 6"d dnisn. C 3i2: dl aumW immeiaudy hkao-if the d lumi sdimix, o o
u4A1dpemie mO. 0&hadC~hMs ilt thhep ... W t A~t Rt~bf PN ths WAs9vok rxp61A
1. Scope and loading Wv conditions for the prototype structur..-1.1 This test method covers-the determination of the Curr.nt theories and effects of material and environmetal
creep of molded concrete cylindes subjected to sustained parametcrs am presented in ACI SP-9.longitudinal compressive load. This test method is limited to 3.3 In the absence of a satisfactory hypothesis Ioveningconcrete in which the maximum agegate size does not creep phenomena, a number- of- assumptions have bocsexceed 2 in. (50 mm). developed that have been generally substantiated by tst ad
1.2 The values stated in inch-pound units arc to be experience.regarded as the standard. 3.3.1 Creep is proportional to strcss from 0 -to 40% of
1.3 This standard may involve hazardous materials oper. concrete compressive strength.ations. and equipment. Thisslandard does nor purport to 3.3.2 Creep has been conclusively shown to be directlyaddress all of the safety problems associated with its-use. It is proportional to paste content throughout the range of pmthe responsibility of the user of this standard to establish contents normally used in concrete. Thus the creep clans-appropriate safety and health practices and determine the teristics of concrete mixtures containing aggregate of snax-applicability of regulaor. imitations prior to use. imum size greater than 2 in. (50,rm) may be determied
from the creep charcteristics of the minus 2-in. (minus2. Referenced Douments 50-mm) fraction obtained by wet-sieving. Multiply the value
of the characteristic by the ratio of the cement paste contet2.1 ASTMStandards: (proportion by volume) in the full concrete mixture to theC 39 Test Method for Compressive Strength of Cylindrical paste content of the sieved sample.- Concrete Specimens2 3.4 The use of the logarithmic expression (Section 8) does
C-192 -Method of Making and Curing Concrete Test not imply that the creep strain-time relationship is nec*-Specimens in the Laboratoy, sadly an exact logarithmic function; however, for the period
C 470 Specification for Molds for Forming Concrete Test of one year, the expression approximates normal creepCylinders Vertically2 behavior with- sufficient accuracy to make possible the
C 617 Practice for Capping Cylindrical Concrete Speci. calculation of parameters that are useful for the purpoe ofmense comparing concretes.
E177 Practice for Use ofthe Terms Precision and Bias in 3.5 There arc no data that would support the extrapob-ASTM Test Methods tion of the results of this tes to tension or torsion.
2.2 American Concrete Institute (ACI)Publication SP-9 Symposium on Creep of Concrete 4. Apparatns
3. Significane w Use 4.1 Molds-Molds shall be cylindrical conforming to thegencral provisions of 2.1 of Mcthod C 192 and to the specific
3.1 This test method measures the load-induced -time- provisions of 2.2.1 or 2.2.3 of Method C 192 -whichever idcpendent-compressive strain at selected ages for concrete applicable, or to the provisions of Specification C470. Ifunder an arbitrary set of controUd environmental condi. required, provisions shall be made for attaching gag studstions. and inserts, and for affixing integral bearing plates to the
3.2 This test method can be ,ed to comparc creep ends of the specimen as it is cast.potentials of different concretes. A procedure is-available. 4.1.1 Horizontal molds shall conform to the niesilusing the developed equation (or graphical plot). for calcu, requirements of 2.1 of Method C 192 and to the speciklating stress from strain data-within massive non.rinfored provisions of 2.2.3 thereof. A horizontal mold that heconcrete structures. For most specific design applications, the proven satisfactory is shown in Fig, I.test conditions set forth herein must be modified to more 4.2 -Loading Frame, capable ofapplying and maintainingclosely simulate the anticipated curing. thermal, exposure, the required load on the specimen, despite any change in tbe
dimension of th specimen. In its simplest form the loadiframe consists of header plates bearing on the ends of the
,Uxv , ad es ,w-d t a tk tni,.eduo,, os.TM Cmmine C-9 o loaded specimens, a ioad.maintaining element that may heCo o01 =a ..M, e So4 hsbskems aCoam. either a spring or a hydraulic capsule or ram. and thsiW
C.t.t cxittion sv rPrd Ylj 9.1917 PubS Me A.%% Ill?. Ortipuy rods to take the reaction of the loaded system. BcsrWP .bh,,.x C)12- 6)7 LA wadu),a C ,5.-255 (tt5"0. surfaces of the header plates shall not depart from a plane li
A"e W&al oAST St. . Yd.d . Vc 04 02.Ak (MM, LNom AM, ,Caon-mreelU, P.O. box 19A0O.d. NMI more than 0.001 in. (0.025 mm). In any loading fiai
'alit, sevcral specimens may be stacked for simultaneous loadir-
69

(Issued I Jun. 1989)
2 Standard Test Method for Creep of Concrete in Compression (C 512-87) (C 54-89)
6. ~ ~ ~ ..~ a -.M 7 ofvAt MO.555
FKL IHwk*N MOW W ''*
acumlao. a reultr.ned iain gam ad sou~Y rceo n otc wio. ate betng patdes . e ecmnent
h;lO mmesur. W h as hylidro tamshrtanng eamn hih b .1 Secieult Siet e iaenth of thel speimen shall
presure pump. Spcings such as railroad car springs may be Apparatos plus he diamieter or the-speient. Whent the endswsed to- maintain the toad zn Frameis- similse to -thoue of the Specimen rea isContact with oether concreie specinseatsdescribed abose. the initial eonsprssioet shall be applied by similar t0 the tat spemme. the specimen lengt dull be atsons of a portable jack or tsting mschineWbeo springs least -equal to the gage -length -of-the sarsn-nsaeingae vied. cure should be taken to provide a spherical bea or apparatus plus 116 in. (38 mm). Iletween the test specimenba joint. and end plates rigid enought to cesume un~ and the steel bearing Plaue at-ads end-of a stack. atoiding o1 the cylinders. Figure 2 shows -an acceptable supplemetary siintummessed cylinder wsea diameter issoeog4oaded frame. Means shalt he provided fre measuring 'quat to that Of the set cylinders and whose lengt is as leastthe load la the nearest 2 % of Iota applied load. This may be wr its diameter shall be insalled.
a er~civ installed hydrauli peessure g or a hy. 5.2 Fabricaling Soecunets-The maxilmum siae of agg?.Ptt~hwhent tiC st ate shall not exceed 2 in. (5O-amen) (Section 3). Vertiallydrastic jack and a load cell inserted in the frame whnte cast cylinders shall be (sracated in accordlance with the
losd is applired or adjusted. provisions of Section 5 of ethod C 192. The endsg of sactt4.3 Srwain-Afeassnng Deviee-Ssuible apparatus shall be cylinder "ial meet thec plawrene. requirtrments or 1.2 ofprovided for the measurement of lontgitudmnal wain55 in the practice C 617(Note 2). Horizontallyant spiates shallbe
speemen to the nearest 10 misllionth. The apparatus may be consolidated by the method appropriate so the consisteney ofembedded, attached, or portable, lf a Portable -apparatus is the Concrete as indicated in 5.4.1 of Method C t92. -Cartuseds. gase points shaI be atueched to the specimens in a must be taken to ensure that the rod oe vibrator does notPositive manner. Attached gages relying on friction contact strike the strain mete. When vibration is used. the concreteare sot Permissible. If an euheded device is used. itnlt"I be "Ial be placed in one layer and the vibrating elemenit salsituated so that its strain moveme~nt occurs- along -the nsot exceed PA. in. (3Z mm) in diameter.When rodditig islnitudinal axis of the cylinder. If extteresl devices areused, used. the concetee Shal he placed in two approximately equsalam shalt be measuredl on not less than two gage lines layers and each layer shal he rodded 25 times evenly along
spaced uniformly around the periphery of the siedcimn. The et side or the strain meter. Aftr consolidation theats may be instrumented so that the average strain on 211 concrete shal-be smuck off with trowel or lat thengag lines can be read directly. The cfleetise gage length shall trowelled the minimum amouint to form the concrete in thebesat least three times tse maximusm size of aggregate in the opening concentrically with the rest of the specimsn. Aconcrete. The strain-measuring device shall be capable of template curved in fthradiusof thes~ecimen maybe used as
measrin stain fo atleast I year %ithout ecsange in a stnkeofr to shape and finish the concrete more precisely in'tasrin, sttn frahe openiMg When cylinders are to be stacked. lapping or
eslabetion.ends is strongly recommendeiL.Nose I-Symms in -bids abe va.ss soil., =r eoanwd 'nth a Ns 2-atq~kwma for pLuernan ins be men by esepo.
romait-keffs adad bar sin csssadeed an rdtiahkbut vnboe&d sapelug. ar. an the tune OcOWa inig. Wm' thet end itie buaasr platseleonc st sraws am satkietey. herteIJ 0 " oie sas l iaae.
70

(Issued IJun. 1989) C 54
Standard Test Method for Creep of Concrete in Compression (C 512-87) (C 54-89) 3
5.3 Number q Specimens-No fewer than six specimens loading. Take strain readings immediately before and after(Note 3) shall-be made from a given batch or concrete for loading. 2 to 6 h later. then daily for I week. weekly until theeach test condition: two shall be tested- for comprcssite end of month and monthly until the end of I year. Beforestrength. two shall boaded and obscrvcd for total deforma- taking each-strain reading, measure-the load. If the loadtion. and two shall remain unloaded for use as controls to varies more than 2 % from the correct value. it must beindicate deformations due to causes other than load. Each adjusted (Note 5). Take strain readings on the controlstrength and control specimen shall undergo the same curing specimens on the same schedule as the loaded specimens.and storage treatment as the loaded specimen. Noxr-4-ln 6an$ creep specimns in the frame. take care is
NOE 3-li is rrcommended that specimens be tested in triticate alipir.g the speoenm to avoid Kcenme Wtins. When cylmnda un_-althouh duplicate specimens are acceptable. stacked and extCral si hrt iiusd it may be helpfui to apply a snal
pteoad such thai the tsuhant nstu does ro exceed 200 psi (1380 U#s)
6. Curing and Storage of Specimens and note thr srain vration &round each specimen. afterwhich the toadmay be removed-snd the speciens reaigned for great suge6.1 Standard Curing-Bcfore-removal from the molds. uni e eOn n oy.
specimens shall be stored at 73.4 ± 3.0"F(23.0± 1.7"C)and Nose 5-Where srnts are uswd to ,nanta;n the tod. thecovered to prevent- evaporation. The specimens- shall- be adjustment can be accomplished by applying the correct load andremoved from the molds not less than 20 nor more thin 48- tightening the nuts oo the thrtaded reaction rods.h after molding and stored in a moist condition at atemperature of 73.4 :t 3.0F until the age of 7 days. A moisi 8. Calculationcondition is that in which free water is maintained on the 8.1 Calculiu.; the total load-induced strain per pound persurfaces of the specimens at all times. Specimens shall not be squarc inch (or kilopascal) -at any time as the differenceexposed to a stream of running water nor be stored in water. between the average strain values of the loaded and controlAfter the completion-of moist curing the-specimens shall be specimens divided by the average stress. To determine creepstored at a temperature of 73.4 + 2.0F 123.0 - I.I'C) and at strain per pound-force per square inch (or kilopascal) for anya relative humidity ofSO ± 4 % until completion of the test. age. subtract from the total load-induced strain per pound-
6.2 Basic Creep Curing-If-it is desired to prevent the force per square inch (or kilopascal) at that age the strain pergain or loss of water during the storage and test period, pound-force per square inch (or kilopaseal) immediatelysp mens shall at the time of fabrication or stripping be after loading. Ifdesired. plot total strain per pound-force perenclosed and scaled in moistureproofjackets (for example. square inch (or kilopascal) on semilog coordinate paper. o-copper or-butyl rubber) to prevent loss of moisture by which the logarithmic axis represents-time, to determine -beevaporation and shall remain scaled throughout the period of constants IIE and F9K) for the following equation:storage and testing.
6.3 Variable Curing Temperature Regimen-When it is - tilE) -FKK)ln(, + I1desired to introduce the effect of temperature on the elastic where:and inelastic proprtics of a concrete (as. for example. the -- total strain psi (or kPa).adiabatic temperature conditions existing in massive con- F - instantaneous elastic modulus, psi (or kPa).crete or temperature conditions to %%hich concrete is sub- F{K) = creep rate. calculated as the slope of a straight linejected during accelerated curing), temperatures within the representing the creep curve on the semilog plot,specimen storage facility shall be controlled to correspond to andthe desired temperature history. The user shall be responsible I - time after loading. days.for establishing the time-temperature history to be followed The quantity lIE is the initial elastic strain per pound peeand-the permissible range of deviation therefrom. square inch (or kilopascal) and is determined from the strai
6.4 Other Curing Conditons-Othcr tcst ages and am. readings taken immediately before and after-loading tiebient storage conditions may be substituted when informa- specimen. If loading-was not accomplished-expeditiously,lion is required for specific applications. The storage condi- some creep may have occurred before the after.loading strtalions shall be carefully detailed in the repon, was observed, in which event extrapolation to zero time by
the method of least squares may be used to determine tlis7. Procedure quantity.
7.1 Age at-Loading-When the purpose of the test is tocompare the creep potential of different concretes, initially 9. Reponlload the specimens at an age of 28 days. When the complete 9.1 The report shall inlude the following:creep behavior of a given concrete is desired, prepare the 9.1.1 Cement content, water-cement ratio, maximum 2tspecimens for initial loading in the following ages; 2. 7. 28. grcgatc size. slump. and atr content.and 90 days. and I year. If information is desircd for other 9.1.2 Type and source of cement. aggregate. admixture.ages of loading, include the age in the report. and mixing water (if other than fresh water is used).
7.2 Loading Letaili--lmmediatcly before loading the 9.1.3 Position of c.lnder when cast.creep specimens. detemine the compressive strength of the 9.1.4 Storage conditions pnor to and subsequent to load-strength specimens in accordance with Test Method C 39, At ing.the time unsealed creep specimens are placed in the loading 9.1.5 Age at time of loading.frame. cover the ends of the control c€lndcrs to prevent loss 9.1.6 Compressive strength at age of loading.of moisture (Note 4). Load the Specimens a an intcnsity of 9.1.7 Type of strain measuriig device.not more than 40 % of the compressive strength at the age of 9.1.8 Magnitude of any prcload.
71

(Issued I Jun.-1989)
4 Standard Test Method for Creep of Concrete in Compression (C 512-87) (C 54-89)
9.1.9 Intensity of applied load. as defined in Practice E 177. o er the range of creep strains9.l.10- Initial clas tic strain. from .250 to 2000 millionths: therefore. the results of(.1.11 Creep strain per pound per square inch (or kilo- properly conducted tests ofduplicate cylindersfroma single
pascal) at designated aps up to I year. and batch should agree within 6 % of'the average of the two. and9.1.12 Creep rate. FIA). if determined. the results of properlv conducted tests of duplicate cylinders
from diffcrent batches should agcee within -13 i of theitt. Precisiot and Bias average of the two.
10.1 Pircisio,-The singc.opefator.batch precision has 10.2 BiNut-This test method has-no bias because the
men found to be ±4.0 % (RIS %). and the single-operalor- values determined can only be defined in terms of the testmulti-batch p ccisi6n has ben found to be -:9.0 % (RIS %). method.
.eth " "0VWff* AM W StO~4. USWI OfttO SmaWW" 0 Ob I*OU.We AeWOWP7 Cift e*WV U &W LoChPuf01L 80RPM &A A*OI9MU-V* 1611f&WC* i~. NS *VW0~' W tUPOWcVt
OWMON abOWW tA Lo d eWMB- VOW N W-y lon # 9yMu0Ne dM kff~"If GION LebeOWOF W d~Wy*o'eWS 00
*S o @We "dtoASrU 4#dt*@fW. VOW COWW8 Nf@N"en CWAO COW4otSM MS~a POw~UMoeFOWI. fd"eeneu--I. w W y g~ryga t tVAOW y"d W W* flU cAO( a hW hwky 5ou 808.0 .M ew
om toI Ithe ASTI CaowM a LW~o. 10 16 Race S. Pfftbto PA It 103.
72

APPENDIX B
COMPRL. .~STRENGTH TEST METHOD
73

(Issued-t-Mar. 1987) C 14
CR D-C 14.87
Dek..gatiaon: C 39 - SIAfMcurv Aa600~~ Stae
AMERICAN 3OCIETY FOR TIESTINO AND MArEnIAs.S1916 Race St.. Phla(dohm#I Pa. 191031
Rep wited tr the Annua Booki of ASTM Standerds. Copyright ACT11A11 not I01 in the cIurnt combined IWOe. WIW ispp.Sf in the w~ net drtot.
Standard Test M.athoii-forCOMPRESSIVE STRENGTH OF CYLINDRICAL CONCRETESPECIMENS'
This standard is issued under the Aixed designation C .39: the numbeY inil~,f ]rely followint; th- designation indictes the year' oroniill adoption or. in the ca eofrmvision. the yteroftat revisioti. A nurntei in pitrcetsics indicates thc year of hit reappeovaI.
A upgiscript epsilon (4) indicates an edilortut chanpe since the Last revision or reapproval.
71111 meiri~hat bers, appear dfor ius~rkagrrejv ofte Depanne lm a/brr andfcv. l~in in er AP iD lndrx of~pejwlcJorsadStandards
Nost-Edijoniaichaniges vverc made throughout in June 1986.
1. Scope ing Instruments for-Verifying the Load In-1. 1 This test method covers determint.tion of. dkcation ofTesting Machines'
compreCssive strength ofcylindrical concrete spec- 2. Z OIter.-imcrnsuch as molded cylinders and drilled cores. Maulo gret ndC ceeTsigIt is limited to concrrte having .a unit weight in 3. Summary of Methodexcess or50 1lh/ft (800 kg/m 1;.
-1.2 The values stated in inch.pound units are 3.1 This test method consis6~ of applying ato be regarded as the statdard. -compressive a-xial load to molded cylind:rs or
1.3 TIji.' .%tandard may -in islt,a:arde~us ma- cores at a rate which is within a prescribed rangehirtal. dipirations. and e'quiptnent. This .andard- urtil Failure occurs. The compressive sircngth ofdir.s nuut puirpoirt to' addres all qfl'he. .sfeiyproh. the specimen is calculated by dividing the maxi-h'rnxs asvswm-ad sril/itt ax isc. It is the rexpcinsibil- mum load attained during the-test by the cross-
-ftt ril'hucsc'russ this standard w, consul'r and sectional area or the specimen.e'oviajhi apprqiprias' .Nafe'ly and h:ealth praeiict.' 4. Signirifrie and Useaddc'z c'ninethe~ appic-ab:lii'yedtre'glatry ~limi-latirons prior toits~. 4.1I Care imust- be exercised in the initrpreta-
tion of the significance of compressive strength2. Applicable Documents determinations by this test method since strength
1 T.41T Standards: is not a fundamental or ;ntnnsic property ofC 31 Method of Making and Curing Concrete concrete made from given materials. Values ob-
Test Specimens in the-Ficld-' tined will depend on the size and shape or theC 42 Method orObtatning and Testing Drilled specimen. batching. mixing -procedures, the
Cores and Sawed Beams of Concrete' methods ol-sampling, molding, and rabncationC 192 Method orMaking andCuring Concrete and the age. temperature. and moisture condi-
'rc.% Specimens in the Laboratory * tions during curing.C 617i Practice for Cappt1,s Cylindrical Con- 4.2 This test method may be used to detcr-
crete SPecimens' IbiN 1(51 1T5(tv1j is under tie onfs.sosono)It i(iTM Cown
C 873 Tvsi-Methcxj-rur Compressive Strength mIlicr C-9 "n (74r- SWd Cuncrete AWcjp~rs 46-djj theof Concrete Cylinders Casi~in Place in Cy- wIr*nist aurmtre093UtnMehx o
lindrcal o~s'Current edition approved Marv); 27. 1986. PuNIshed MvayE 4 Practices for Load Verification of Testing ;99I6. ontjnally put~ilshed as (C1 -~ 21 7 LAss pr~evious tSjiIio
C 39 - 4.Machines' 'Annoual 8IsA jl 4SrM Slunatduid' V 0 tMO
U 74,Practice for Calibration of Force-Measur- 'Annual Bl, IAS S7*4andardj, Vol ().AOf
74

(Issued I Mar. 1987)
2 Compressive Strength of Cylindrical Concrete Specimens (C 39) (C 14-87)
mine compressive strength of cylindrical spec- ing provisionsmens prepared and cured in accordance with 5.J3.1 The percentageoferrorfor theloadsMethods C 31, C42. and C-192, Practice C617. within the proposed range of use of the testingand Test Method C 873. machine shldl not exceed 1.0% of the gdi-
4.3 The results of this tcst method may be cated load.used as a basis for quality control of concrete 5.1.3.2 The accuracy of the testing machineproportioning, mixing, and placing ope.ations shall be verifamd by applying five test loads indetermination ofcompliance with specification; four approximately equal increments in as-
control for evaluating cfl'ectsvcncs ofadmixturs ceding order. The difference between any twoand similar uses. successive test loads shal not exceed one third of
the diTrc between the maximttm and mini-5. Apparatus mum test loads.
5.1 Tesling Machine--The testing machine 5.1.3.3 The test load as indicated by the tes-shall be of a type havingsuffcicent capacity and ingmaineandtheappliedloadcomputedfromcapable of providing the rates of loading Wt- th readings of the vificatou deVce shall bescribed in 7.5. recorded at each test point. Calculate-the error.
5.1.1 Verification of calibration of the test- E. and the percentage of eror, 4 for each pointing machines in accordance with Practices E 4 is from these data as follows:required under the followingcooditions:
5.1. 1.1 After- an elapsed interval sn ce E- -previous verification of 18 months maximum. JOO(, - B/Bbut.preferably after an interval of 12 months, where:
5.1.1.2 On original installation or relocation A - load, lbf(or N) indicased by the machineof the machine, being veified ad
5.1.1.3 Immediately after making repairs or B - applied load. lbf(or N) as determined byadjustments which may in any way affect the the calibrating device.operation of the weighing system or the values 5.1.3.4 The: report on the verification of adisplayed, except for zero adjustments that com- testing machine shall state within what loading-pensate for the weight of tooling, or specimen, or range it was found to conform to specification-both, or requirements rather than reporting a blanket
5.1.1.4 Whenever there is reason to doubt acceptance or. rejection. In no case shall thethe accuracy of the results, without regard to loading range-be stated as including loads be-the time interval-since the last verification, low the value which is 100 times the smallest
5.1.2 Design-The design of the machine change of load that can be estimated on themust include the following features: load-indicating mechanism of the testing ma-
5.1.2.1 The machine must be power operated chine or loads within that portion of the rangeand must apply the load continuously rather below 10 % of the maximum range capacity.than intermittently. and without shock. If it has 5.1.3.5 In no case shall the loading range beonly one loading rate (meeting the require- stated as including loads outside the range ofmens of 7.5), it must be provided with a sup- loads applied during the verification test.plemental means for loading at a rate suitable 5.1.3.6 The indicated load of a testing ma-for verification. This supplemental means of chine shall no' be corrected either by calcula-loading may be power or hand operated. ton or by the use of a calibration diagram to
5.1.2.2 The space provided-for test specimens obtain values within the required permissiblcshall be large enough to accommodate; in a read- variation.able position, an elastic calibration device which 5.2 The testing machine shall be equipped-is of sufficient capacity to cover the potential with two steel bearing blocks with hardened faccsloading range of the testingmachine and which INote 2). one of %4hich is a spheri-adly sealedcomplieswith the requirements oPractices E 74. bkKok that %ill bear on the upper surfac of the
NOTE I-Thetycofe kcaibuon devic rnosi specimen, and the other a solid block on whichgnerally availabW, and moo commonly used for this the specimen shall rest. Bearing fae of thepurpose is the circular proving ring. blocks shall have a minimum dimension at kast
5.1.3 Accurac-The accuracy of the testing 3 % greater than the diameter of the specimen tomachineshallbeinaccordancewiththefollow- be tested. Except for the concentric circles dc-
7.5
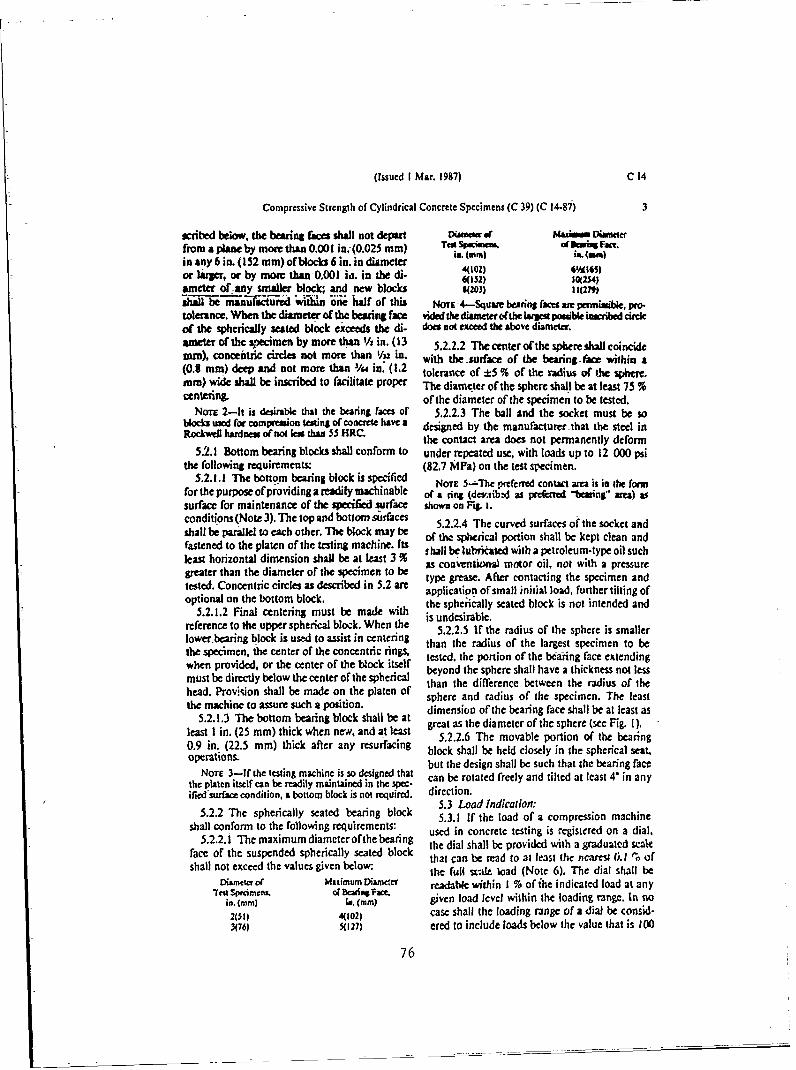
(issued I Mar. 1987) C 14
Compressive Strength of Cylindrical Concrete Specimens (C 39) (C 14-87) 3
scribed below, the bearing face shall not depart Disrnow o maimia Viameteffrom a plane by more than 0.001 in. (0.025 mm) TCO$mP. iKKA of Iki Fact.
in any 6 in. (152 mm) of bocks 6 in. in diameter it t0m) i. (0m0)
or l~z-r, or by mo 0 tha-O.001 ia. in the di- 4(t0) 6s6(152) 0(254)ametet of any smaller block; and new blocks (203) tt(2)
Sbe manufactred w6itw &ii half or this Non 4--Squam bering ram are pmime. pro-tolerance. When the diameter of the bearing face vided the diameter ofthe targest pombie aibed circleof the spherically seated block exceeds the di- does not exceed the above diameter.ameter of the si,-imen by more than h in. (13 5.2.2.2 Thecenter of the sphere Ul coincidemm), concen-tric circles not more than Va in. with the surface of the bearing-face within a(0.8 mm) deep and not more than 3/4 id. (1.2 tolerance of "±5 % of the radius of t sphere.am) wide shall be inscribed to facilitate proper The diameter of the sphere shall be at least 75 %centering. of the diameter of the specimen to be tested.
NoTe 2-I is desirable that the bearing racms or 5.2.23 The ball and the socket must be soblocks used for compresson testing ofcoocrete have a designed by the manufacturer that the steel in
Rockwell hardness ofnot le than 55 HRC the contact area does not permanently deform
5.2.1 Bottom bearing blocks shall conform to under repeated use, with loads up to 12 000 psithe following requirements: (82.7 MPa) on the test specimen.
5.2.1.1 The bottom bearing block is specified NoTE 5-The preferred contact area is in the formfor the purpose ofproviding a reldily machinable o" a ring (dev.-tibd as prknmd -"1saing" ara) assurface for maintenance of the specified surface shown on F-W 1;conditions (Note 3). The top and bottom surfaces 5.2.2.4 The curved surfaces of the socket andshall be parallel to each other. The block mny be of the spherical portion shall be kept clean andfastened to the platen of the testing machine. Its s hall be lubrkated with a petroleum-type oil suchleast horizontal dimension shall be at least 3 %greater than the diameter of the specimen to be type ease. Ator contacting the specimen andtested. Concentric circles as described in 5.2 ar ye ges.Afrcoatighepcmnadapplication of small initial load, further tilting ofoptional on the bottom block, the spherically seated block is not intended and
5.2.1.2 Final centering must be made with is undesirable.reference to theupper spherical block. When the 5.2.2.5 If the radius of the sphere is smallerlower-bearing block is used to assist in centering than the radius of the largest specimen to bethe specimen, the center of the concentric rings, tested the portion or the bearing face extendingwhen provided, or the center of the block itself beyond the sphere shall have a thickness not lessmust be directlybelowtheenterofthespherical than the difference between the radius of thehead. Provision shall be made on the platen of sphere and radius of the specimen. The leastthe machine to azsure such a poition. dimension of the bearing face shall be at least as
5.2.1.3 The bottom bearing block shall be at great as the diameter of the sphere (see Fig. 1).least I in. (25 mm) thick when ne . and at least 5.2.2.6 The movable portion of the bearing0.9 in. (22.5 mm) thick afer any resurfacing block shall be held closely in the spherical seat.operations. but the design shall be such that the bearing face
NorE 3-If the testing machine is so designed that can be rotated frely and tilled at least 4" in anythe platen itself can be readily maintained in the spc atifleds-wfac condition, a bottom block is not required. direction.
5.3 Load Indication:5.2.2 The spherically seated bearing block 5.3.1 If the load of a compression machine
shall conform to the following requirements: used in concrete testing is registered on a dial.5.2.2. The maximum diamcterof the bearing the dial shall be provided with a gradualed scale
face of the suspended spherically seated block that can be read to at least the ncare- 1). 1 1 ofshall not exceed the values given below: the full wale load (Note 6). The dial shall be
Diame co Maximum Diameter readable within I % of ihe indicated load at any'Tea Scrmem of eiirqFame
in, (mrm) is. ( .m.) given load level within the loading range. In no201) 4(102) case shall the loading range of a dial be consid-3(76) 5(1271 ered to include loads below the value that is 100
76

(Issued I Mar. 1987)
4 Compressive Strength of Cylindrical Concrete Specimens (C 39) (C 14-87)
times- the smallest change of load that can be shall be capped in accordance with Practiceread on the scale. The scale shall be provided C 617 or they may be sawed or ground to meetwith a graduation line equal to zero and so that tolerance. The diameter used for calculatingnumbered. The dial pointer shall be of sufficient the cross-sectional area of the test specimen shalllength-to reach the graduation marks; the width be determined to the nearest 0.01 in. (025 mm)of the end of the pointer shall not exceed the by averaging two diameters measured at -right
lclar distance between the smallest graduations, angles to each other at about midheight of theEach-dial shall be equipped with a zero adjust- specimen.ment that is easily accessible from the outside of 6.3 The number of individual cylinders mea-the dialcase, and with a suitable device that at sured for determination of average diameter mayall times-until reset, will indicate to within I % be reduced to one for each ten specimens or threeaccuracythe maximum load applied to the spec- specimens per day, whichever is greater, if allimen, cylinders are known to have been made from a
NOTF 6-As close as can reasonably be read is con- single lot of reusable or single-use molds whichsidered to be '/5o in. (0.5 mm) along the arc described consistently produce specimens with average di-by the end of the pointer. Also.'one half of a scale ameters within a range of 0.02 in. (0.51 mm).interval is about as close as can reasonably be read- When the average diameters do -not rall withinwhen the spacing on the load indicating mechanism isbetween 1/2s in.(I mm) and /A4 in.(I.6 mm). When the the range of 0.02 in. or when the cylinders arcspacing is between I6 in. and 1/ in. (3.2 mm). one third not made from a single lot of molds, each cylin-ofascaleintervalcanbereadwithreauortl:becerainty der tested must be;measured and the value usedWhen the spacing is 'A. in. or-more. one fourh of a in calculation of the unitcompressive strength ofscale interval can be read with reasonable certainty, that specimen. When thediameters are measured
5.3.2 If the testing machine load is indicated- at the reduced frequency, the cross-sectionalin digital form, the numerical display must be areas of all cylinders tested on that day shall belarge enough to-be easily read. The numerical computed from the average of the diameters ofincrement must be equal to or less than 0.10 % the three or more cylinders representing theof the full scale load of a given loading range. In group tested that day.no case shall the verified loading range include 6.4 The length shall be measured to theloads less than the minimum numerical incre- nearest 0.05 D when the length to diameterment multiplied by 100. The accuracy of the ratio is less than 1.8. or more than-2.2, or whenindicated load must be within-1.0 % for any v:iue the volume of the cylinder is determined fromdisplayed within the verified loading range. Pro- measured dimensions.vision must be made for adjusting to indicatetrue zero at zero load. There shall be provided a . Poceduremaximum load indicator that at all times until 7.1 Compression tests of moist-cured speci-reset will indicate within I % system accuracy mens shall bc made as soon as practicable afterthe maximum load applied to the specimen. removal from moist storage.
7.2 Test specimens shall be kept moist by6. Specimens any convenient method during the period be-
6.1 Specimens shall not be tested if any mdi- twecn removal from moist storage and testing.vidual diameter of a cylinder differs from any They shall be tested in the moist condition.other diameter of the same cylinder by more 7.3 All test specimens for a given test agethan 2 %. shall be broken within the permissible time
NoTE 7-This may occur when single use molds are tolerances prescribed as follows:damaged or deformed during shipment, when flcxiblc Test Age Permauisble Tolerancesingle use molds are deformed during molding or when 24 h 0.5 h or 2 1 O,-z core drill dcflects or shifts during drilling. 3 days 2 hor 2. 'i
7 da'. 6. h or 3.6 %6.2 Neither end of compressive test specimens :a '11 20 h or 3.0 %
when tested shall depart from perndiculany 9o dys 2 days 2.%to the axis by more than 0.5 (approximately 7.4 Placing the Specimen-Place the plainequivalent to 1/8 in. in 12 in. (3 mm in 300 (lower) bearing block, with its hardened facemm)). The ends of compression test specimens up, on the table or platen of the testing machinethat are not plane within 0.002 in. (0.050 mm) directly under the spherically seated (upper)
77

(Issued I Mar. 1987) C 14
Compressive Strength of Cylindrical Concrete Specimens (C 39) (C 14-87) 5
bearing block. Wipe clean the bearing faces of less than 1.8. correct the-result obtained in 8.1the upper and lower bearing blocks and of the by multiplying by the appropriate correction fac-test specimen and place the test specimen on tor shown in the following table:the lower bearing block. Carefully -align- the L/D: 1.3 1.0 1.25 1.00axis of the specimen with the center of thrust Fxitor 0.98 0.96 0,93 0.87 I1ore So
of the spherically seated block. As the spheri-cally seated block is brought to bear on- the NoT 8-These corection factors apply-to light-
weight concrete weighing between 100 and 120 lb/ft'specimen, rotate its movable portion gently by (1600 and 1920 kg/m; ) and to normal weight concrete.hand so that uniform seating is obtained. They are applicable- to concrete dry or soaked at-the
7.5 Rate of Loading-Apply the load contin- time of loading. Values not given in the table shall be
-uously and without shock, determined by interpolation. The correction factors are
7.5.1 For testing machines of the srewtypc. applicable for nominal concrete strengths from 2000 to6000 psit(13.8 to 41.4 MPa).
the moving head shall travel at a rate of approx-
imately 0.05 in. (I.3-mm)/min when the machine 9. Reportis running idle. For hydraulically operated ma- 9 i The report shall include the following:chines, the load shall be applied at a rate of 91.1 Identification number.
movement (platen to crosshead measurement) 9.1.2 Diameter (and length, if outside the
corresponding to a loading rate on the specimen
-within the range of 20 to 50 psi/s (0:14 to 0.34 range of I.8D to 2.2D). in inches or millimeires.- 9.1.3 Cross-sectional area. in .qtzare-inches
M Pa/s). The designated rate of movement shall
be maintained at least during the latter half of or square cntimetres.
the anticipated loading phase of the testing cycle. 9.A.4 Maximum load in pounds-force or
7.5.2 During-the application of the first-half 9ne tov
of the anticipated loading phae a higher rate of 9 s Com ssive strength calculated to the
loading shall be permitted. nearest 10 psi or 69 kPa.9.1.6 Type of fracture.if other than the usual
7.5.3 Make no adjustment in the rate of move- cone (see Fig. 2).ment of the platen at any time while a specimen 9.1-7 -Defects in citherspecimen or caps. and.is yielding rapidly immediately before failure. 9.1.8 Age of specimen.
7.6 Apply the load until the specimen fails.
and record the naxtmum load carried by the 0 Precisionspecimen during the test. Note the type offailure and the appearance of the concrete. 10.1 The precision of this test method has not
S. Calculation yet been determined. but data are beingcollected.and a precision statement will be included %hen
8.1 Calculate the compressive strength of it is fIormulated.'the specimen by dividing the maximum loadcarried by the specimen during the test by theaverage cross-sectional area determited as do-scribed in Section 6 and express the result to the 'Se "Concrete Strcngth in Structurs. by 0. L. Blooin.
nearest 10 psi (69 kPa). ACI Jountal. March 1968. especially Table 3. p. 11. for8.2earhest0pcimen lengt posible guidance as tothc tel ofteptoduabhtyouncrcte8.2 ifthe specimen length to diameter ratio is strength measurcmcntsthat may be expected,
78

(issued I Mar. 1987)
6- Compressive Strength of Cylindrical Concrce Specimens (C 39) (C 14-87)
I.IG
TtST KC no LESS TmAk (R-r)
TEST SPECIMEN
NoTE-P AI be dc for Wling the bag i re
Socket And for boidiag Alar colilc "mI in the basting mwacin.FIG. I S hA i~bi 1. &f SPAN"~ Be-bg
Ni
Cooc Coneaad Split Confc aWShe Sbcar Columnar(a) All) Wc (d) W€
FIG. 2 S~ktclso(TyPtDsoFratw
The Amw c Socity for Tesing wad Mattiale takes no positai expecting Ihe yof a-y plenl aigks -u ed liCeltd i Iat kern MtM ih L&IJlndr UMVs of LS I dart e dad eeti e amkavtm o tl riSi "
ofayachp wt t igta,. and tt ,i of ifnngee at of suh rShlu. art rirdytike*r own rep~ouely.
-This standard is subjeato revision at any lime by the responsible technical committee and mse reviewed reryfiveyears andIf no revriled, tither reappoved or withdrawn. Your commea's are invited either for revison of this standard r for additionalitandards and sholdd be addressed to .ASTM Headquarters. Your commenas will receive €orv2sd consideation at a mertian of thefeip esahletechnicalcommitee, which you may attend If you feel (hat your commets have not received a fair hearing yvu shouldmake xw views known ti the .4STM Commite on Standards 1916 Race St. Philadelphia. PA 19103
79

APPENDIX C
CARLSON STRAIN-GAGES
80

Physical Construction
1. The Carlson strain meter (or gage) is in the general form of a long
cylinder with anchors on -the end -to -engage the surrounding concrete. Within
the flexible brass cover tube, a steel framework supports porcelain spools
around which are wound, under 100,000-psi tension, two equal coils of
0.0025-in. diameter steel music wire. A schematic drawing of a Carlson strain
meter is shown in Figure 36.
------------------------------ to-------------to -----------------------,.Oil filter plug Porcelain spoofs.
. ellowS-. Steel spri 9 . - Steel bors s.O'e oled Colto sletve.
Meter ease lied 'Safety stop- Music wre CONS. Seating chamber filed
Meercae ifed I- euth seeal, compoaw'-'.ith nA-coffoaw oil'-
Figure 36. Carlson strain meter
Principle of Operation
2. The instrument is designed to take advantage of two electrical prop-
erties of steel wire: resistance of the wire varies directly with temperature
and with the tension on the wire. When the ends of the strain meter are
pulled-apart by an expansion in concrete, the outer or expansion coil elon-
gates and increases in tension and, consequently, in resistance as well. At
the same time, the inner-or contraction coil decreases in resistance as it
shortens. The ratio of -the resistance of the expansion coil to the resistance
of the contraction coil, which at all times is very near unity, is used as a
sensitive measure of length change in the strain meter. A typical meter
81

usually calibrates to about 4 millionths of an inch per inch per 0.01 percent
change in ratio. Resistance ratio- changes are not affected by simultaneous
temperature -changes of the wire since the temperature change affects both
coils by an equal percentage.
3. Temperature is measured by taking the sum of the resistance of the
expansion and contraction coils. This- sum is not affected materially by vari-
ation in resistance due to length changes, as these-plus and minus values very
nearly cancel each other in the sum. The resistance of the miniature meter is
about 60 ohms at 72°F, and increases about I ohm for every 9°F rise in temper-
ature. A correction of 6.7 millionths of an inch per inch for each 1F change
of temperature-must be made for the expansion of the strain meter frame.
Actual calibration-data are provided for each instrument.
Measurement Technique--Wheatstone Bridge
4. Strains are determined in the Carlson strain meter by a measurement
of the resistance change in- the expansion and contraction coils. There is a
direct relation between the resistance change and the strain of the coils of
the meter. This strain is measured with a data acquisition unit that employs
the Wheatstone -bridge technique in a- balanced configuration as- shown in Fig-
ure 37. Two of the four arms required to make up the bridge -cir-cuit are in
the meter itself. The other two arms are in the data acquisition unit.
5. -Each coil in a-new meter will be approximately equal in resistance.
It can be assumed without error that each arm is equal in resistance and that
any subsequent strain after placement in concrete will cause the expansion arm
to increase by the amount of AR and simultaneously produce a decrease of AR in
the contraction arm. Later calculations will show the miniature meter to have
a gage factor of about 6. This means that the percentage change in resistance
(AR/R x 100) is six times the percentage change in the length of the meter
(AL/L x 100). In contrast, a bonded SR-4 strain gage has a factor of about 2.
Factory Calibration Constants
6. Two calibration constants are given on the factory calibration
sheet. One is the relationship of strain to the least reading and the other
82

the relationship of the resistance change with temperature. Typical calibra-tion-constants for the SM-4 meter are 8-.18 microstrainsleast reading and
12.27°F/ohm. Also, the resistance of the meter is given-on the calibration
sheet for a temperature of 0°F. It is then possible to calculate the tempera-
ture for any known resistance or vice versa [12].
83

__-METER
CONTRACTION -EXPANSIONCOIL - C OIL
Rg-R Rg+ IRF
r 0-109.99 OHMS_ _ " -- - --i
EST --S E T
Figure 37. Electrical schematic of Carlson meter setup
84

APPENDIX D
CREEP TEST DATA
85
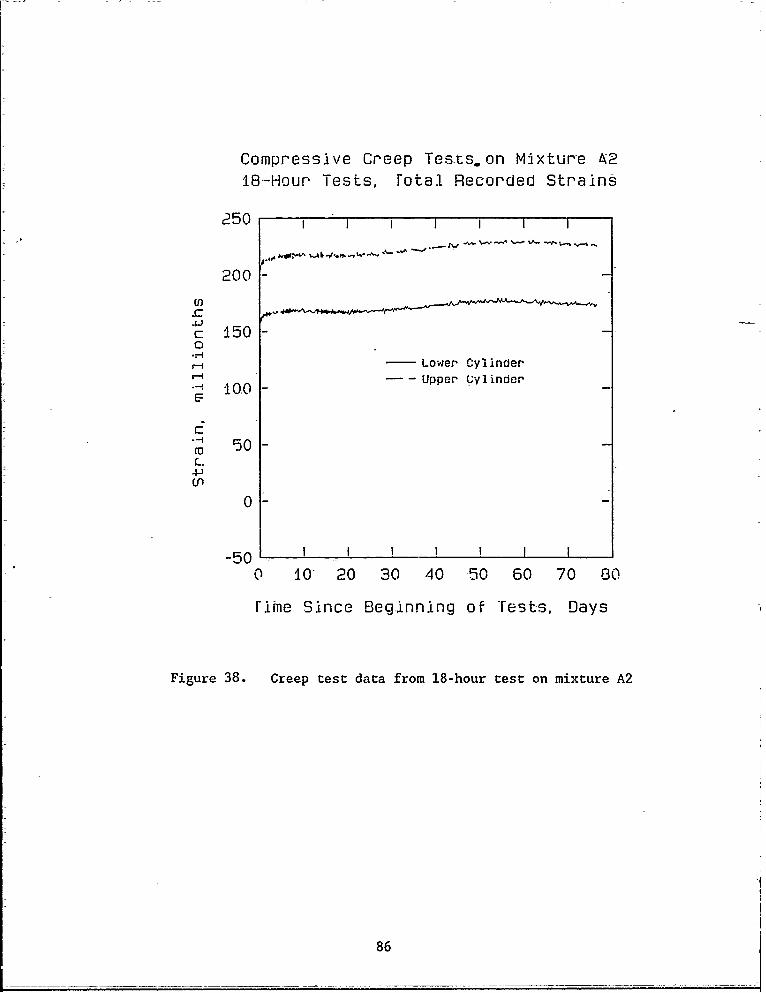
Compressive Creep Tests.on Mixture 42
18--Hour Tests, Total Recorded Strains
250
200-
-C
c 1500
-Lower Cylinder
S---Upper Cylinder
C"; 50
0
-50 I i I I I i0 10- 20 30 40 50 60 70 BO
[ime Since Beginning of rests, Days
Figure 38. Creep test data from 18-hour test on mixture A2
86

Compressive Creep Tests on Mixture A2I-Day Tests, Total Recorded Strains
200 , a a
4J
0- 100- Lower Cylinder
~-- Upper Cylnder
--
C O 0
-50 I I I I I I
0 10 20 30 40 50 60 70 80
Fime Since Beginning of Teqts. Days
Figure 39. Creep test data from 1-day test on mixture A2
87

Compressive Creep Tests on Mixtur-e A2
3-Day Tests, Fotai Recorded Strains
200 -- I I A
150
4-,C0
i-1 ~Lower Cylinaer
-- Upper Cylinder
Cf 50
4-)
50
-50 I I I I I I
0 10 20 30 40 50 60 70 80
rime Since Beginning of Tests, Days
Figure 40. Creep test-data from 3-day test on mixture A2
88
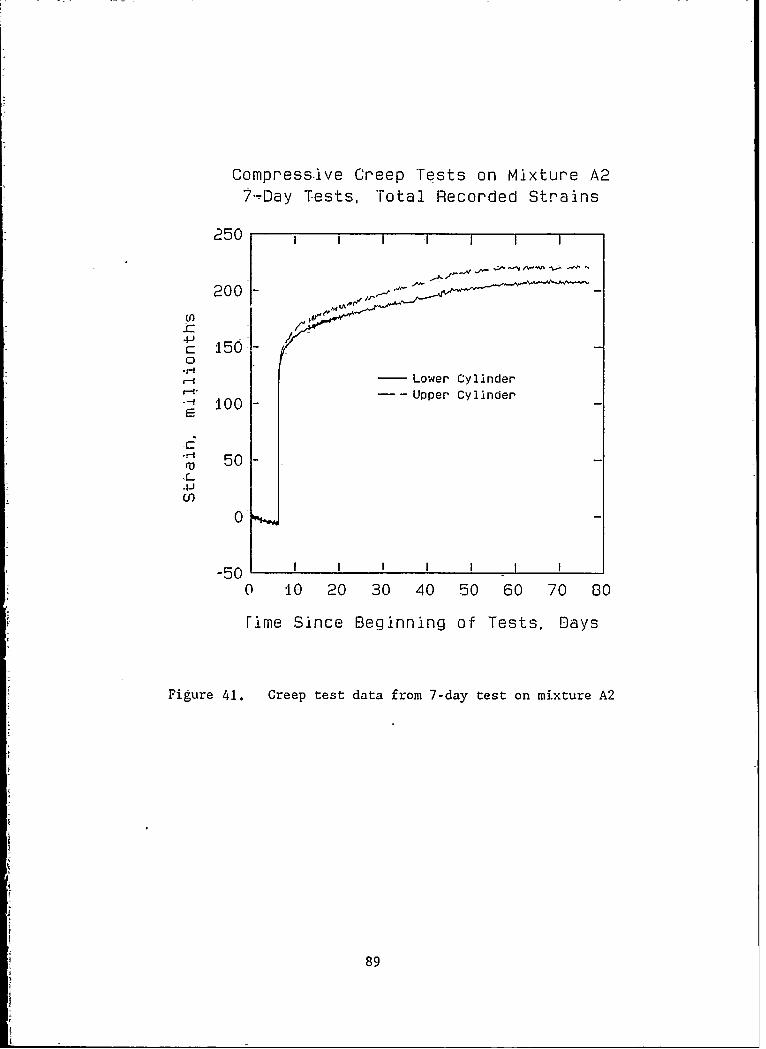
Compressi1ve Creep Tests on Mixture A27-Oay Tests, Total Recorded Strains
250 -
200-
(n)
c: 150-0
-Lower Cylinder-- Upper Cylinder
S50-
4-J
0
-50 I I0 10 20 30 40 50 -60 70 60
[ime Since Beginning of Tests, Days
Figure 41. Creep test data from 7-day test on mixture A2
89

Compressive Creep- Tests on Mixture A214-Day Tests, Total Recorded Strai-ns
300 1 1 1
250 -
-~200,
S150 -Lower Cy-linder-- Upper Cy-linder
-0-
0
500 10 20 30 40 50 60 70 80
rime-SinceBeginn-ing of Tests, Days
Figure 42. Creep test data from 14-day test on-mixture A2
90

Compressive Creep-Tests on Mixture All1-8-Hour Tests, Total Recorded Strains
200 i
150 -4
. ....0H100.--
.H
- 50
L -Lower4-' - -- ~pper
-50'1- I0 5 10 15 20 25 30
rime Since Beginning of Tests, Days
Figure 43. Creep test data from 18-hour test on mixture All
91

Compressiv-Creep Tests on Mixture AilI-Day, Total Recorded Strains
200-
0i~o
- 50
C ~Lower(J) -Upper
0 5 io 15 20 25 30
[ime Since 'Beginning of Tests, Days
Figure 44. Creep test-data from I-day test on mixture All
92

Compressive Creep Tests on Mixture AlA3-;Day-Tests, Total Recorded Stra-ins
250
200-
C1.50
50
C- Lower
Cn -- Upper
0
0 5 10 15 20 25 30
Time Since Beginning of Tests, Days
Figure 45. Creep test data from 3-day test on mixture All
93

Compressive Creep Tests on-Mixture All
7-Day Tests, Total Recorded Strains
300 i i
250 t
(n
200-I
0
150-'
100
C 50 Lower.). Upper
0
-50 ! I I I
0 5 10 15 20 25 30
Fime Since Beginning of Tests. Days
Figure 46. Creep test data from 7-day test on mixture All
94

Compressive Creep-Tests on Mixture All.14-Day Tests, Total Recorded-Strains
400
30
*H 200I-i
C_- Lower_P UpperCl) 0
0 o1 15 20 25 30
Trime Since Beginning o-f Tests, Days
Figure 47. Creep test data from 14-day test on mixture All
95

Compressive Creep Tests on Mixture A2Control Cylinders, Total Recorded Strains
200
150
4-)
0-q- 1000- Cylinder No. I
Cylinder No. 2E
50
0
-50 I
0 10 20 30 40 50 60 70 80
rime Since Beginning .of Tests, Days
Figure 48. Control cylinders for mixture A2
96

Compressive Creep Tests on Mixture AllControl Cylinders, Total Recorded Strains
150
t 00-Lowei
--- Upper0
.2q
"' 50
C-
-500 5 10 15 20 25 30 35
Fime Since Beginning of Tests, Days
Figure 49. Control cylinders for-mixture All
97


