A.D. Metal Industry ALFA-PLAM Vranje
112
1
Transcript of A.D. Metal Industry ALFA-PLAM Vranje
1
2
Persuant to Article 50 and 51 of the Capital Market Low („Official Gazette of the Republic of Serbia“ No.
31/2011) and Article 3 of th Regulation of the Form, Contents and Manner of Publication of Annual, Semi-
Annual and Quarterly Reports submitted by publics companies („Official Gazette of the Republic of Serbia“ No.
14/2012), A.D. Metal Industry Alfa-Plam Vranje, Reg.no. 07137923, publishes the following:
ANNUAL REPORT ALFA-PLAM FOR 2013.
C O N T E N T S:
1. FINANCIAL STATEMENTS ALFA-PLAM A.D. VRANJE FOR 2013.
(Balance sheet, Income statement, Cash flow statement, Statement of Changes in Equity, Notes to the
Financial Statements)
2. BUSINESS REPORT
3. STATEMENT OF RESPONSIBILITY (BY PERSON WHO PREPARED THE REPORT)
4. INDEPENDENT AUDITOR'S REPORT

3
4
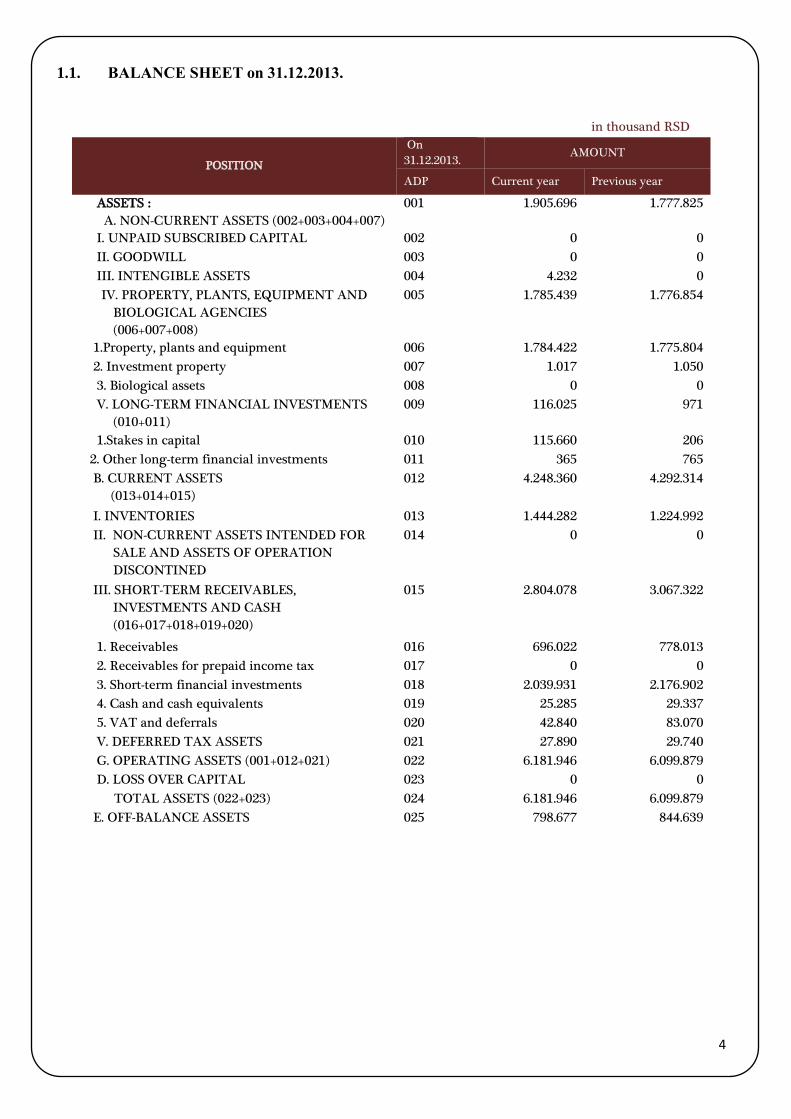
1.1. BALANCE SHEET on 31.12.2013.
in thousand RSD
POSITION
On
31.12.2013. AMOUNT
ADP Current year Previous year
ASSETS :
A. NON-CURRENT ASSETS (002+003+004+007)
001 1.905.696 1.777.825
I. UNPAID SUBSCRIBED CAPITAL 002 0 0
II. GOODWILL 003 0 0
III. INTENGIBLE ASSETS 004 4.232 0
IV. PROPERTY, PLANTS, EQUIPMENT AND
BIOLOGICAL AGENCIES
(006+007+008)
005 1.785.439 1.776.854
1.Property, plants and equipment 006 1.784.422 1.775.804
2. Investment property 007 1.017 1.050
3. Biological assets 008 0 0
V. LONG-TERM FINANCIAL INVESTMENTS
(010+011)
009 116.025 971
1.Stakes in capital 010 115.660 206
2. Other long-term financial investments 011 365 765
B. CURRENT ASSETS
(013+014+015)
012 4.248.360 4.292.314
I. INVENTORIES 013 1.444.282 1.224.992
II. NON-CURRENT ASSETS INTENDED FOR
SALE AND ASSETS OF OPERATION
DISCONTINED
014 0 0
III. SHORT-TERM RECEIVABLES,
INVESTMENTS AND CASH
(016+017+018+019+020)
015 2.804.078 3.067.322
1. Receivables 016 696.022 778.013
2. Receivables for prepaid income tax 017 0 0
3. Short-term financial investments 018 2.039.931 2.176.902
4. Cash and cash equivalents 019 25.285 29.337
5. VAT and deferrals 020 42.840 83.070
V. DEFERRED TAX ASSETS 021 27.890 29.740
G. OPERATING ASSETS (001+012+021) 022 6.181.946 6.099.879
D. LOSS OVER CAPITAL 023 0 0
TOTAL ASSETS (022+023) 024 6.181.946 6.099.879
E. OFF-BALANCE ASSETS 025 798.677 844.639
5
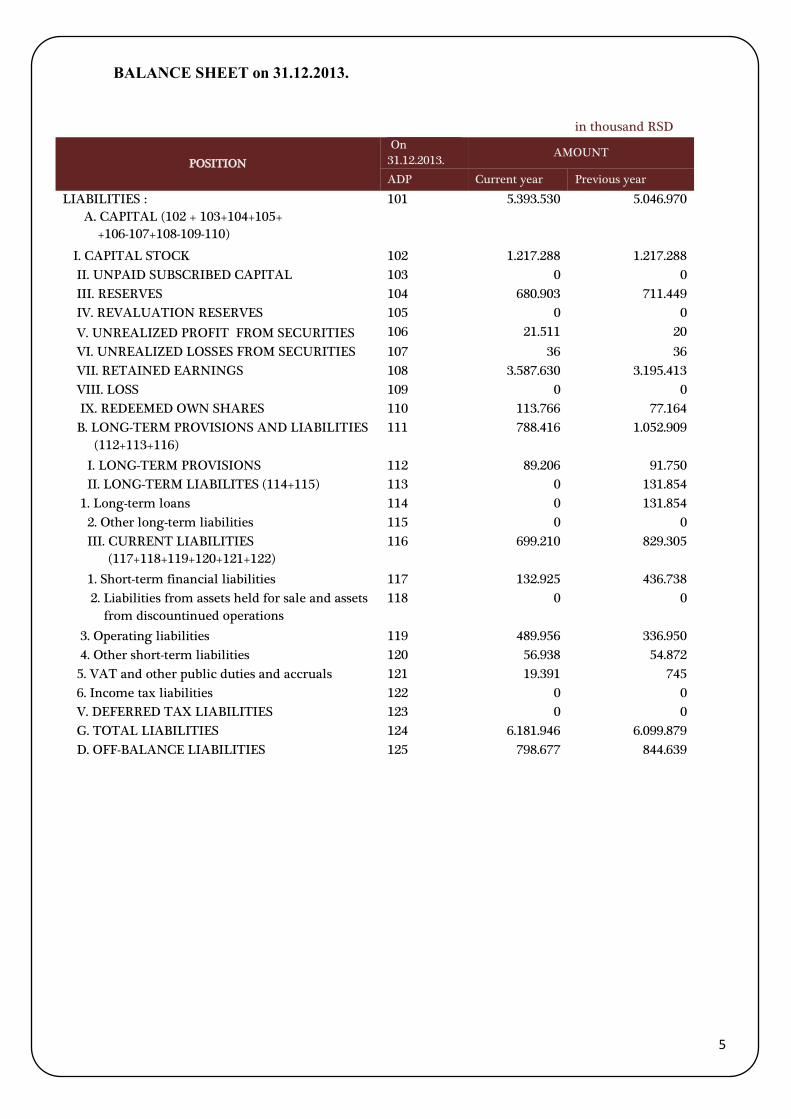
BALANCE SHEET on 31.12.2013.
in thousand RSD
POSITION
On
31.12.2013. AMOUNT
ADP Current year Previous year
LIABILITIES :
A. CAPITAL (102 + 103+104+105+
+106-107+108-109-110)
101 5.393.530 5.046.970
I. CAPITAL STOCK 102 1.217.288 1.217.288
II. UNPAID SUBSCRIBED CAPITAL 103 0 0
III. RESERVES 104 680.903 711.449
IV. REVALUATION RESERVES 105 0 0
V. UNREALIZED PROFIT FROM SECURITIES 106 21.511 20
VI. UNREALIZED LOSSES FROM SECURITIES 107 36 36
VII. RETAINED EARNINGS 108 3.587.630 3.195.413
VIII. LOSS 109 0 0
IX. REDEEMED OWN SHARES 110 113.766 77.164
B. LONG-TERM PROVISIONS AND LIABILITIES
(112+113+116)
111 788.416 1.052.909
I. LONG-TERM PROVISIONS 112 89.206 91.750
II. LONG-TERM LIABILITES (114+115) 113 0 131.854
1. Long-term loans 114 0 131.854
2. Other long-term liabilities 115 0 0
III. CURRENT LIABILITIES
(117+118+119+120+121+122)
116 699.210 829.305
1. Short-term financial liabilities 117 132.925 436.738
2. Liabilities from assets held for sale and assets
from discountinued operations
118 0 0
3. Operating liabilities 119 489.956 336.950
4. Other short-term liabilities 120 56.938 54.872
5. VAT and other public duties and accruals 121 19.391 745
6. Income tax liabilities 122 0 0
V. DEFERRED TAX LIABILITIES 123 0 0
G. TOTAL LIABILITIES 124 6.181.946 6.099.879
D. OFF-BALANCE LIABILITIES 125 798.677 844.639
6
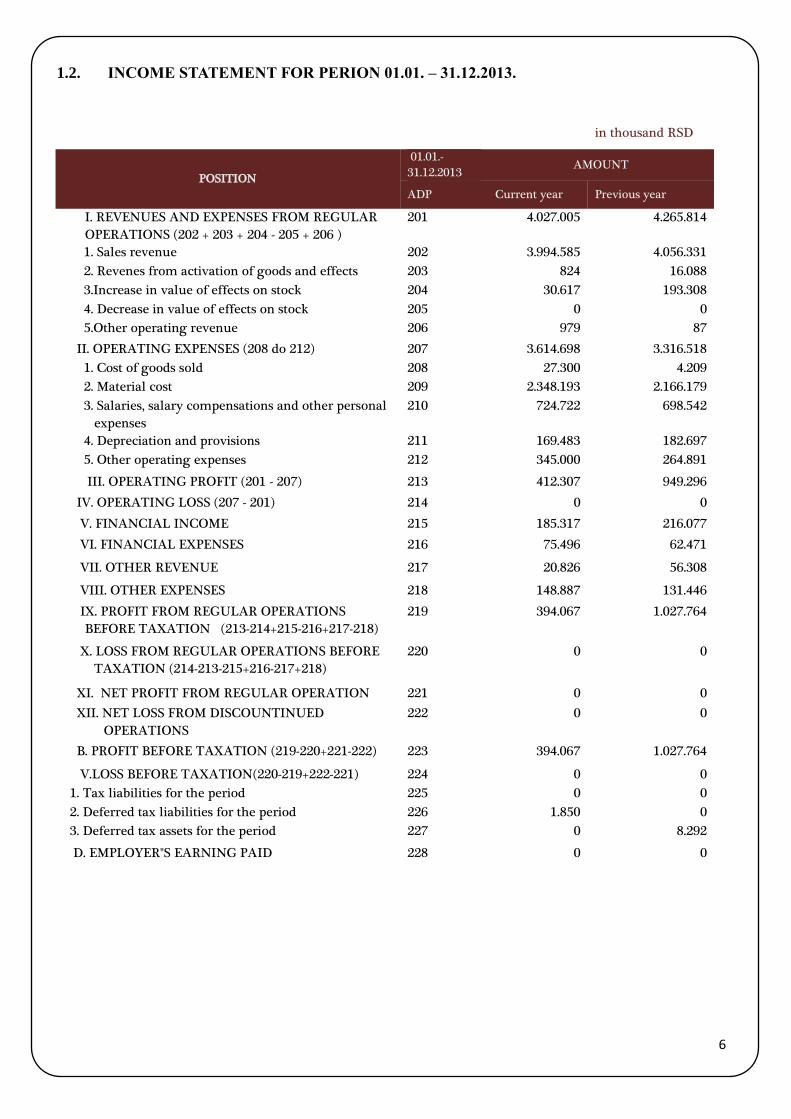
1.2. INCOME STATEMENT FOR PERION 01.01. – 31.12.2013.
in thousand RSD
POSITION
01.01.-
31.12.2013 AMOUNT
ADP Current year Previous year
I. REVENUES AND EXPENSES FROM REGULAR
OPERATIONS (202 + 203 + 204 - 205 + 206 )
201 4.027.005 4.265.814
1. Sales revenue 202 3.994.585 4.056.331
2. Revenes from activation of goods and effects 203 824 16.088
3.Increase in value of effects on stock 204 30.617 193.308
4. Decrease in value of effects on stock 205 0 0
5.Other operating revenue 206 979 87
II. OPERATING EXPENSES (208 do 212) 207 3.614.698 3.316.518
1. Cost of goods sold 208 27.300 4.209
2. Material cost 209 2.348.193 2.166.179
3. Salaries, salary compensations and other personal
expenses
210 724.722 698.542
4. Depreciation and provisions 211 169.483 182.697
5. Other operating expenses 212 345.000 264.891
III. OPERATING PROFIT (201 - 207) 213 412.307 949.296
IV. OPERATING LOSS (207 - 201) 214 0 0
V. FINANCIAL INCOME 215 185.317 216.077
VI. FINANCIAL EXPENSES 216 75.496 62.471
VII. OTHER REVENUE 217 20.826 56.308
VIII. OTHER EXPENSES 218 148.887 131.446
IX. PROFIT FROM REGULAR OPERATIONS
BEFORE TAXATION (213-214+215-216+217-218)
219 394.067 1.027.764
X. LOSS FROM REGULAR OPERATIONS BEFORE
TAXATION (214-213-215+216-217+218)
220 0 0
XI. NET PROFIT FROM REGULAR OPERATION 221 0 0
XII. NET LOSS FROM DISCOUNTINUED
OPERATIONS
222 0 0
B. PROFIT BEFORE TAXATION (219-220+221-222) 223 394.067 1.027.764
V.LOSS BEFORE TAXATION(220-219+222-221) 224 0 0
1. Tax liabilities for the period 225 0 0
2. Deferred tax liabilities for the period 226 1.850 0
3. Deferred tax assets for the period 227 0 8.292
D. EMPLOYER"S EARNING PAID 228 0 0
7
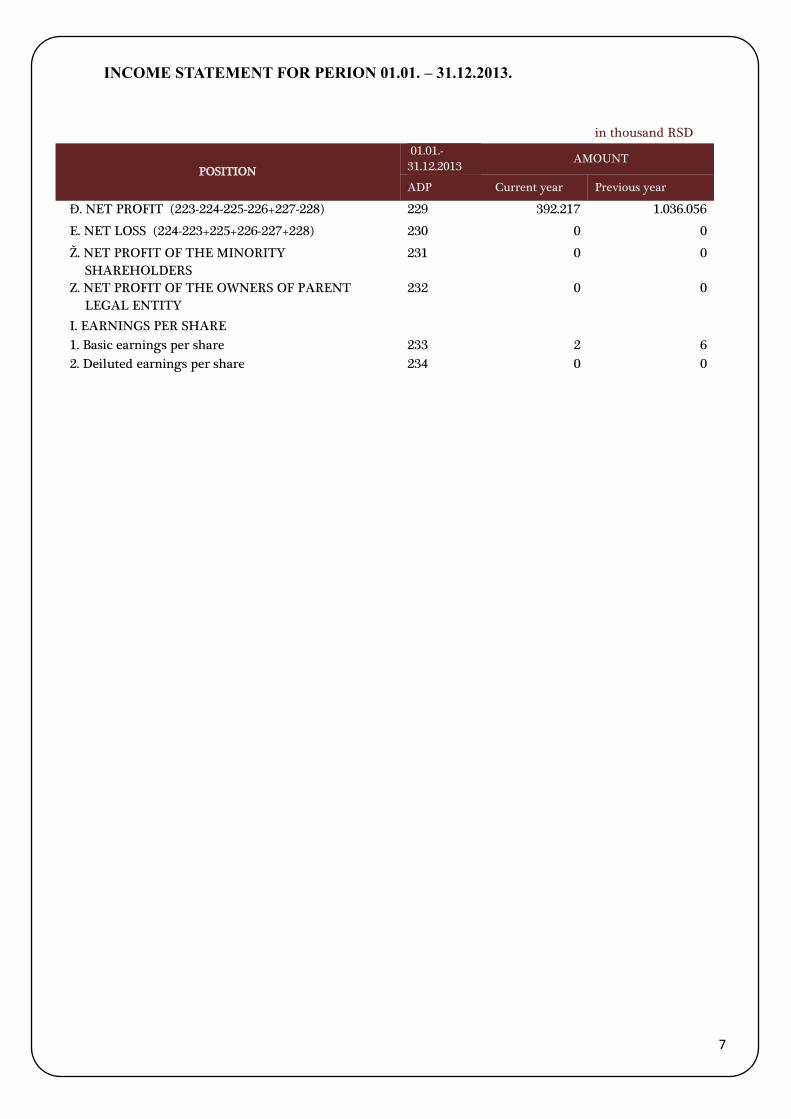
INCOME STATEMENT FOR PERION 01.01. – 31.12.2013.
in thousand RSD
POSITION
01.01.-
31.12.2013 AMOUNT
ADP Current year Previous year
Đ. NET PROFIT (223-224-225-226+227-228) 229 392.217 1.036.056
E. NET LOSS (224-223+225+226-227+228) 230 0 0
Ž. NET PROFIT OF THE MINORITY
SHAREHOLDERS
231 0 0
Z. NET PROFIT OF THE OWNERS OF PARENT
LEGAL ENTITY
232 0 0
I. EARNINGS PER SHARE
1. Basic earnings per share 233 2 6
2. Deiluted earnings per share 234 0 0
8
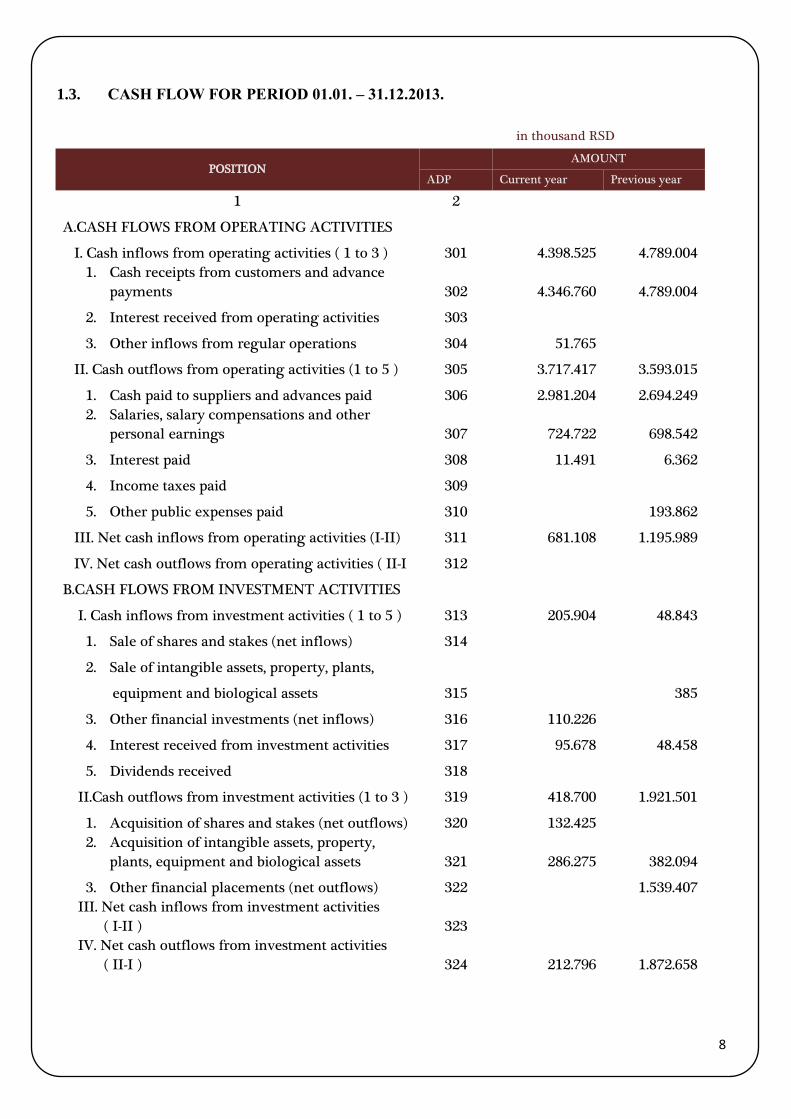
1.3. CASH FLOW FOR PERIOD 01.01. – 31.12.2013.
in thousand RSD
POSITION AMOUNT
ADP Current year Previous year
1 2
A.CASH FLOWS FROM OPERATING ACTIVITIES
I. Cash inflows from operating activities ( 1 to 3 ) 301 4.398.525 4.789.004
1. Cash receipts from customers and advance
payments 302 4.346.760 4.789.004
2. Interest received from operating activities 303
3. Other inflows from regular operations 304 51.765
II. Cash outflows from operating activities (1 to 5 ) 305 3.717.417 3.593.015
1. Cash paid to suppliers and advances paid 306 2.981.204 2.694.249
2. Salaries, salary compensations and other
personal earnings 307 724.722 698.542
3. Interest paid 308 11.491 6.362
4. Income taxes paid 309
5. Other public expenses paid 310
193.862
III. Net cash inflows from operating activities (I-II) 311 681.108 1.195.989
IV. Net cash outflows from operating activities ( II-I 312
B.CASH FLOWS FROM INVESTMENT ACTIVITIES
I. Cash inflows from investment activities ( 1 to 5 ) 313 205.904 48.843
1. Sale of shares and stakes (net inflows) 314
2. Sale of intangible assets, property, plants,
equipment and biological assets 315
385
3. Other financial investments (net inflows) 316 110.226
4. Interest received from investment activities 317 95.678 48.458
5. Dividends received 318
II.Cash outflows from investment activities (1 to 3 ) 319 418.700 1.921.501
1. Acquisition of shares and stakes (net outflows) 320 132.425
2. Acquisition of intangible assets, property,
plants, equipment and biological assets 321 286.275 382.094
3. Other financial placements (net outflows) 322
1.539.407
III. Net cash inflows from investment activities
( I-II ) 323
IV. Net cash outflows from investment activities
( II-I ) 324 212.796 1.872.658
9
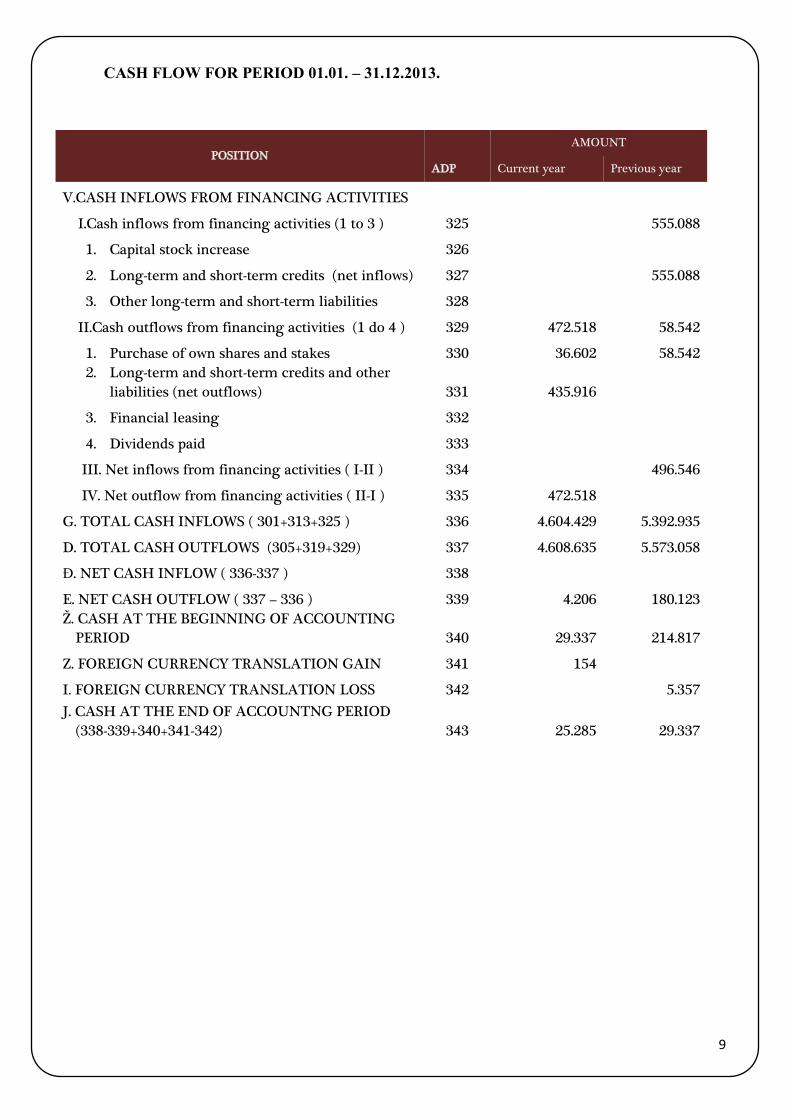
CASH FLOW FOR PERIOD 01.01. – 31.12.2013.
POSITION AMOUNT
ADP Current year Previous year
V.CASH INFLOWS FROM FINANCING ACTIVITIES
I.Cash inflows from financing activities (1 to 3 ) 325
555.088
1. Capital stock increase 326
2. Long-term and short-term credits (net inflows) 327
555.088
3. Other long-term and short-term liabilities 328
II.Cash outflows from financing activities (1 do 4 ) 329 472.518 58.542
1. Purchase of own shares and stakes 330 36.602 58.542
2. Long-term and short-term credits and other
liabilities (net outflows) 331 435.916
3. Financial leasing 332
4. Dividends paid 333
III. Net inflows from financing activities ( I-II ) 334
496.546
IV. Net outflow from financing activities ( II-I ) 335 472.518
G. TOTAL CASH INFLOWS ( 301+313+325 ) 336 4.604.429 5.392.935
D. TOTAL CASH OUTFLOWS (305+319+329) 337 4.608.635 5.573.058
Đ. NET CASH INFLOW ( 336-337 ) 338
E. NET CASH OUTFLOW ( 337 – 336 ) 339 4.206 180.123
Ž. CASH AT THE BEGINNING OF ACCOUNTING
PERIOD 340 29.337 214.817
Z. FOREIGN CURRENCY TRANSLATION GAIN 341 154
I. FOREIGN CURRENCY TRANSLATION LOSS 342
5.357
J. CASH AT THE END OF ACCOUNTNG PERIOD
(338-339+340+341-342) 343 25.285 29.337
10
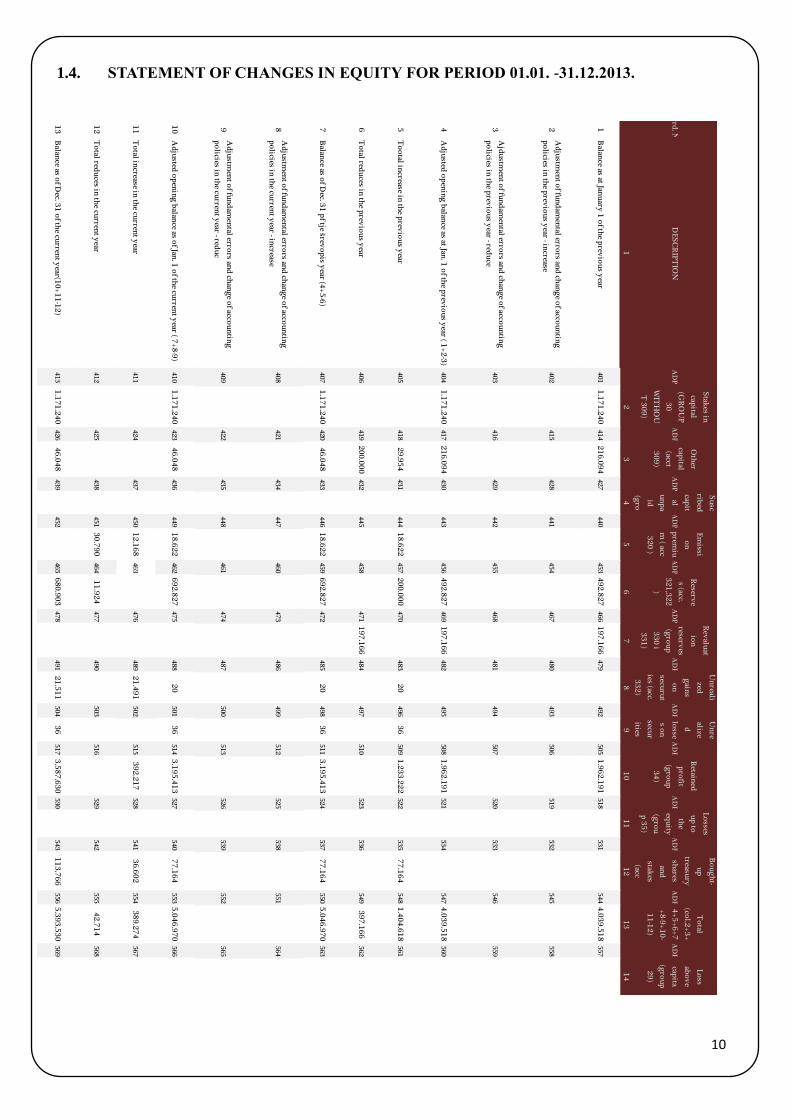
1.4. STATEMENT OF CHANGES IN EQUITY FOR PERIOD 01.01. -31.12.2013.
Ord
. No
.D
ES
CR
IPT
ION
AD
P
Stak
es in
capital
(GR
OU
P
30
WIT
HO
U
T 3
09
)
AD
P
Oth
er
capital
(acct
30
9)
AD
P
Su
sc
ribed
capit
al
un
pa
id
(gro
AD
P
Em
issi
on
prem
iu
m ( acc
32
0 )
AD
P
Reserv
e
s (acc.
32
1,3
22
)
AD
P
Rev
aluat
ion
reserves
(gro
up
33
0 i
33
1)
AD
P
Un
reali
zed
gain
s
on
securu
t
ies (acc.
33
2)
AD
P
Un
re
alize
d
losse
s on
secur
ities
AD
P
Retain
ed
pro
fit
(gro
up
34
)
AD
P
Lo
sses
up
to
the
equ
ity
(gro
u
p 3
5)
AD
P
Bo
ug
ht-
up
treasury
shares
and
stakes
(acc
AD
P
To
tal
(col.2
+3
+
4+
5+
6+
7
+8
-9+
10
-
11
-12
)
AD
P
Lo
ss
abo
ve
capita
(gro
up
29
)
12
34
56
78
91
01
11
21
31
4
1B
alance as at Jan
uary
1 o
f the p
revio
us y
ear401
1.1
71
.24
0414
21
6.0
94
427
440
453
49
2.8
27
466
19
7.1
66
479
492
505
1.9
62
.19
1518
531
544
4.0
39
.51
8557
2A
dju
stmen
t of fu
nd
amen
tal errors an
d ch
ang
e of acco
un
ting
po
licies in th
e prev
iou
s year - in
crease402
415
428
441
454
467
480
493
506
519
532
545
558
3A
jdu
stmen
t of fu
nd
amen
tal errors an
d ch
ang
e of acco
un
ting
po
licies in th
e prev
iou
s year - red
uce
403
416
429
442
455
468
481
494
507
520
533
546
559
4A
dju
sted o
pen
ing
balan
ce as at Jan. 1
of th
e prev
iou
s year ( 1
+2
-3)
404
1.1
71
.24
0417
21
6.0
94
430
443
456
49
2.8
27
469
19
7.1
66
482
495
508
1.9
62
.19
1521
534
547
4.0
39
.51
8560
5T
oo
tal increase in
the p
revio
us y
ear405
418
29
.95
4431
444
18
.62
2457
20
0.0
00
470
483
20
496
36
509
1.2
33
.22
2522
535
77
.16
4548
1.4
04
.61
8561
6T
otal red
uces in
the p
revio
us y
ear406
419
20
0.0
00
432
445
458
471
19
7.1
66
484
497
510
523
536
549
39
7.1
66
562
7B
alance as o
f Dec. 3
1 p
f tje šrevo
pis y
ear (4+
5-6
)407
1.1
71
.24
0420
46
.04
8433
446
18
.62
2459
69
2.8
27
472
485
20
498
36
511
3.1
95
.41
3524
537
77
.16
4550
5.0
46
.97
0563
8A
dju
stmen
t of fu
nd
amen
tal errors an
d ch
ang
e of acco
un
ting
po
licies in th
e curren
t year - in
crease408
421
434
447
460
473
486
499
512
525
538
551
564
9A
dju
stmen
t of fu
nd
amen
tal errors an
d ch
ang
e of acco
un
ting
po
licies in th
e curren
t year - red
uc
409
422
435
448
461
474
487
500
513
526
539
552
565
10
Ad
justed
op
enin
g b
alance as o
f Jan. 1
of th
e curren
t year ( 7
+8
-9)
410
1.1
71
.24
0423
46
.04
8436
449
18
.62
2462
69
2.8
27
475
488
20
501
36
514
3.1
95
.41
3527
540
77
.16
4553
5.0
46
.97
0566
11
To
tal increase in
the cu
rrent y
ear411
424
437
450
12
.16
8463
476
489
21
.49
1502
515
39
2.2
17
528
541
36
.60
2554
38
9.2
74
567
12
To
tal redu
ces in th
e curren
t year
412
425
438
451
30
.79
0464
11
.92
4477
490
503
516
529
542
555
42
.71
4568
13
Balan
ce as of D
ec. 31
of th
e curren
t year(1
0+
11
-12
)413
1.1
71
.24
0426
46
.04
8439
452
465
68
0.9
03
478
491
21
.51
1504
36
517
3.5
87
.63
0530
543
11
3.7
66
556
5.3
93
.53
0569
11
12
1.5. BASIC INFORMATION ABOUT THE COMPANY
General information
Full company name: A.D. Metal Industry ALFA-PLAM Vranje
Short name of company is: ALFA-PLAM AD
Headquater, steet and number: Vranje, Radnička 1
Identification number: 07137923
VAT.NO.: 100402750
Reg.No.: BD 14264/2005 od 11.07.2005.
Activity code: 2752 – production of not-eletrical device
Director of company: Goran Kostić
Number of employees 742
Phone number: 017/421-121
Fax: 017/424-808
E-mail address: [email protected]
Web: www.alfaplam.rs
Current account
160 -7007-07 Banca Intesa ad Beograd
340-11008671-89 Erste Bank A.D.
275-10221807082-07 Societe Generale Banca
165-27880-19 Hypo Alpe Adria Banca
330-6001380-22 Credit Agricole Banka Srbija
Information about trading of
Company”s shares during 2013.
Total value of capital 1.171.240.400,00 RSD
Number of shareholders on
31.12.2013. 620
Total number of shares 174.812
Nominal value of shares 6.700,00 RSD
ISIN number (CFI) RSALFAE34014 (ESVUFR)
Market Belgrade Stock Exchange
Business name, address and
business address of the audit
company that audited final
financial report
“MOORE STEPHENS Revizija i Računovodstvo”
doo Beograd, Ul. Studentski trg 4/V, Beograd
13
Our main business is the production of heating devices on solid, liquid and gaseous fuels, electric cooker,
and a combination of solid-fuel-electricity-gas and electricity. Products of "ALFA-PLAM" are primarily intended
for households.
According to the quantity of production, placement and quality, we are a leading manufacturer of heating
devices in Serbia and Southeast Europe, and are among the top 5 producers in Europe.
Today, production realized in 5 technical and technological unit, according to product groups, such as:
Solid fuel furnaces and stoves;
Fireplaces;
Gas furnaces;
Stoves, furnaces and fireplaces for floor heating;
Electric and combined cookers
Our total annual production is more than 150.000 units. The range of production is permanently expanding,
according to the needs of the market, and all in order to improve the quality of production, we are introducing
new technologies that guarantee the quality that is confirmed by ISO standard.
All our products have specific domestic and international certificates, which fully meet the strict
requirements for the placement on the EU market. ALFA-PLAM sells its products on domestic market (40%) and
in European markets. The main foreign markets are the ex-Yu republics (Bosnia and Herzegovina, Macedonia,
Montenegro, Slovenia and Croatia), Germany, Italy, Austria and Poland, and others.
1.6. COMPANY BACKGOUND
1948.- City craft-service company „Metalac“ was founded in Vranje. It was consisted of locksmith,
blacksmith, electrics, calc, wheelwright and sheet metal workshop. Company produced pots, water buckets,
pan and furnaces called "drummers," as well as products made according to clients’ wishes.
1950. – „Metalac“ employes 58 people.
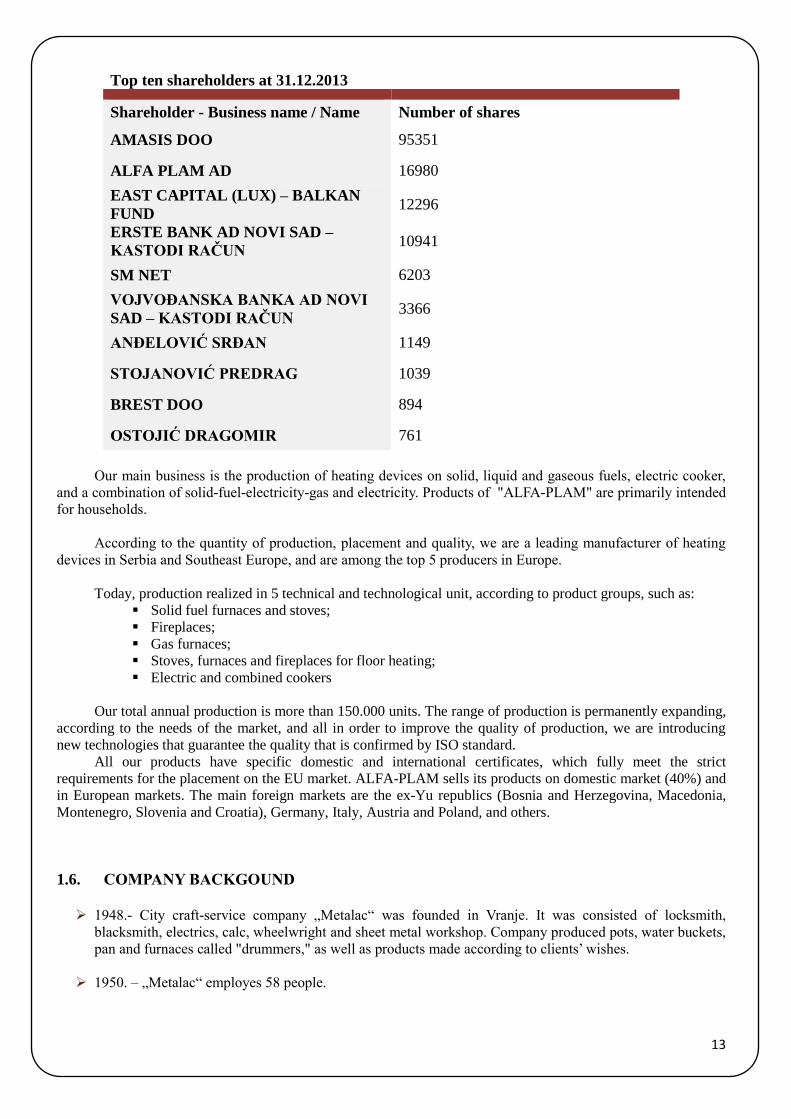
Top ten shareholders at 31.12.2013
Shareholder - Business name / Name Number of shares
AMASIS DOO 95351
ALFA PLAM AD 16980
EAST CAPITAL (LUX) – BALKAN
FUND 12296
ERSTE BANK AD NOVI SAD –
KASTODI RAČUN 10941
SM NET 6203
VOJVOĐANSKA BANKA AD NOVI
SAD – KASTODI RAČUN 3366
ANĐELOVIĆ SRĐAN 1149
STOJANOVIĆ PREDRAG 1039
BREST DOO 894
OSTOJIĆ DRAGOMIR 761
14
1959. – Company „Metalac“ has launched a galvanizing plant . Plant empoyes four new workers, who put
black sheet metal buckets in chemicals and then in zinc which was heated in large cauldron by oil.
1960. – Comapny plans production and galvanization of 100.000 buckets.
1962. – Metal Packging factory was built In the industrial district of Vranje and it changes its production
program in consumer goods. Name of the factory is Technical devices Industry “Alfa – Vranje” and it
employs 87 workers.
1964. – “Alfa – Vranje” wins gas furnace production “Feniks 140”, and plans other consumer goods
production (electric dryer, wash machine, furniture and locksmith). Factory employs 300 workers. “Feniks
15000”, gas furnace for floor heating, was exposed to Belgrade Techniques Fair.
1965. – "Metalac" after 16 years of work in bad conditions, gets adequate space in an industrial area of
Vranje, in addition to "Alpha". The company specializes in the execution of all trades and metal assembly
works in construction.
1970. - Winning production of gas stoves
1980. - Association of manufacturing plants in the firm "Alfa-Metalac"
1989. - Change the name of "Alfa Plam" and a new company logo
1992. - Winning products for floor heating
1998. - The introduction of ISO 9001 quality system
2002.- Commissioning of the latest line of enamelling. Shares "Alfa-Plam" listed on the BSE.
2003 - Total production 164,000 heaters. Started serial production of the new stoves for central heating,
solid fuel "Alfa Term 20". In Vranje, opened the first showroom where the entire product range of
manufacturers was exhibited.
2005. - replacement equipment in enameling sector II. An investment in value of EUR 1,500,000, realized
from its own funds.
2006. - purchased laser machine for perforation and punching of sheet metal, made tools for new stoves
and ovens, and completed Phase II of construction work at the sector I, Investments from its own funds in
the amount of about 1,500,000 EUR.
2007. - The value of one share on the stock market reached the maximum amount of 527.77 EUR (at the
middle rate). Conquered the production of pellet stoves by the Italian technology for known foreign buyer.
The company has 960 employees.
2008. - Introduced new technology with full equipment for wet paint in Plant 2, a new line of cutting sheet
metal and purchased installed presses. Total investment from its own resources is around 1,200,000 EUR.
Made in marketing project management function to further improvement of market position of the
company. Company adopted a new logo and slogan: "Alfa-Plam" - Safety and Warmth!
2009. - acquired robotic welding machines, lines for longitudinal and transverse cutting sheets, 2 machines
for bending, hydraulic presses and other valued at approximately 500,000 EUR. The company has 880
employees.
15
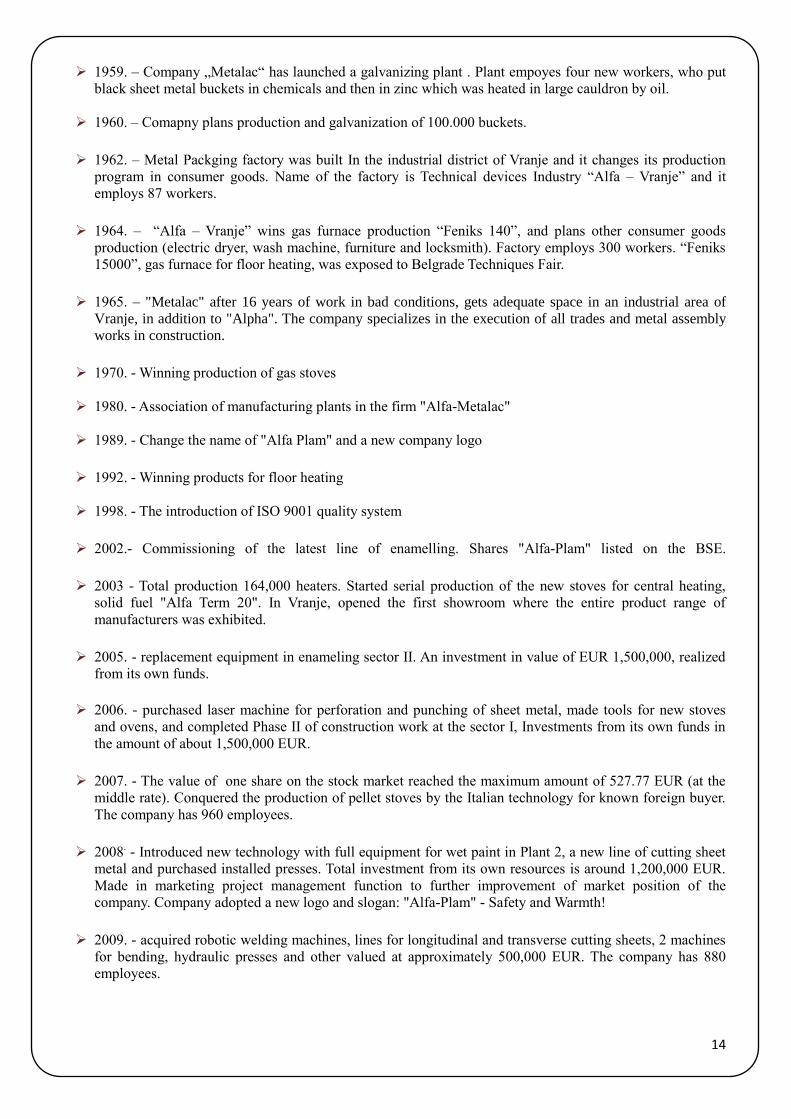
2010. - Acquired laser maschine for cutting and punching sheet metal. Started serial production of solid
fuel stoves for central heating "Alfa Term 27". The company buys in Vranje, in close proximity to their
seats, 12,500 m2 constructed production and warehouse space and approximately 13,000 m2 of land.
Dividend payment to shareholders for the year, which is the tenth consecutive year.
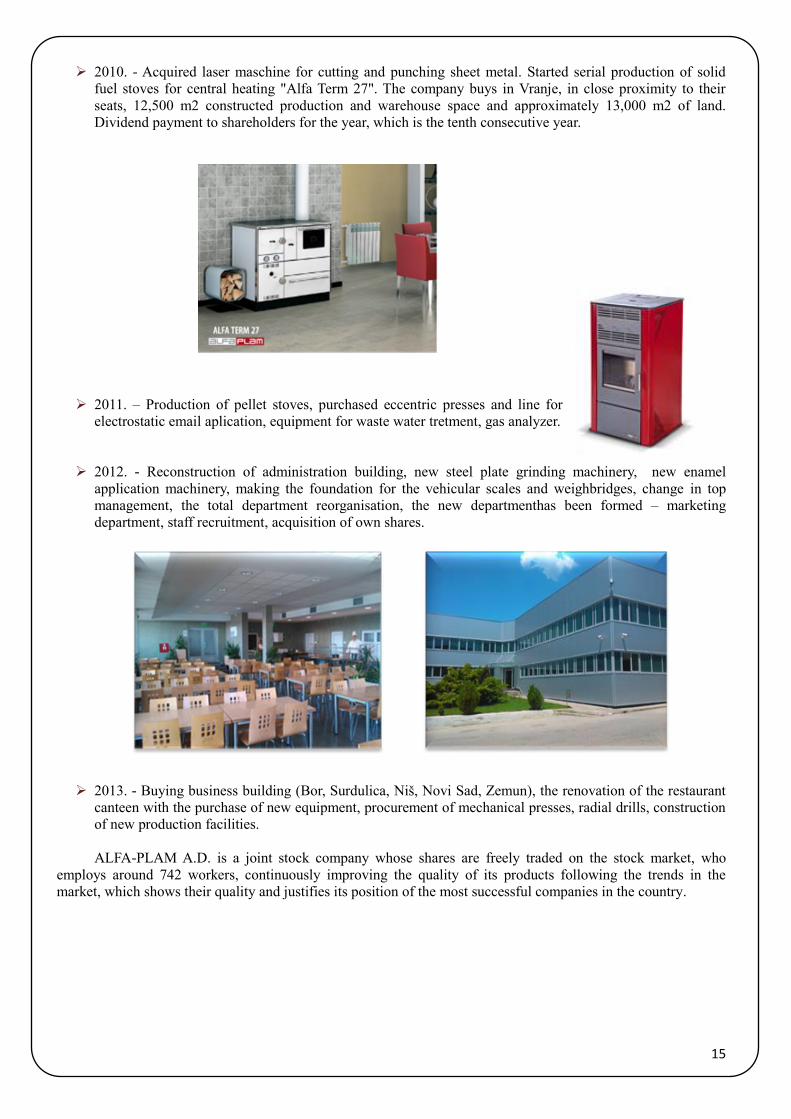
2011. – Production of pellet stoves, purchased eccentric presses and line for
electrostatic email aplication, equipment for waste water tretment, gas analyzer.
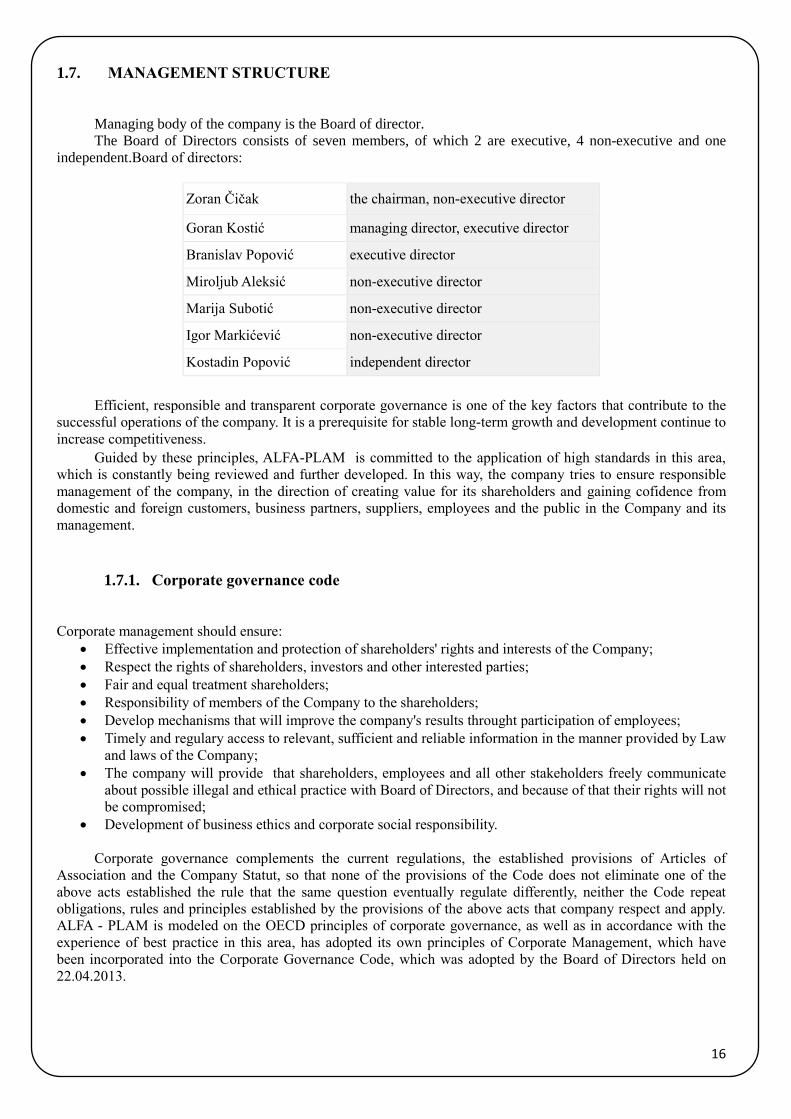
2012. - Reconstruction of administration building, new steel plate grinding machinery, new enamel
application machinery, making the foundation for the vehicular scales and weighbridges, change in top
management, the total department reorganisation, the new departmenthas been formed – marketing
department, staff recruitment, acquisition of own shares.
2013. - Buying business building (Bor, Surdulica, Niš, Novi Sad, Zemun), the renovation of the restaurant
canteen with the purchase of new equipment, procurement of mechanical presses, radial drills, construction
of new production facilities.
ALFA-PLAM A.D. is a joint stock company whose shares are freely traded on the stock market, who
employs around 742 workers, continuously improving the quality of its products following the trends in the
market, which shows their quality and justifies its position of the most successful companies in the country.
16
1.7. MANAGEMENT STRUCTURE
Managing body of the company is the Board of director.
The Board of Directors consists of seven members, of which 2 are executive, 4 non-executive and one
independent.Board of directors:
Zoran Čičak the chairman, non-executive director
Goran Kostić managing director, executive director
Branislav Popović executive director
Miroljub Aleksić non-executive director
Marija Subotić non-executive director
Igor Markićević non-executive director
Kostadin Popović independent director
Efficient, responsible and transparent corporate governance is one of the key factors that contribute to the
successful operations of the company. It is a prerequisite for stable long-term growth and development continue to
increase competitiveness.
Guided by these principles, ALFA-PLAM is committed to the application of high standards in this area,
which is constantly being reviewed and further developed. In this way, the company tries to ensure responsible
management of the company, in the direction of creating value for its shareholders and gaining cofidence from
domestic and foreign customers, business partners, suppliers, employees and the public in the Company and its
management.
1.7.1. Corporate governance code
Corporate management should ensure:
Effective implementation and protection of shareholders' rights and interests of the Company;
Respect the rights of shareholders, investors and other interested parties;
Fair and equal treatment shareholders;
Responsibility of members of the Company to the shareholders;
Develop mechanisms that will improve the company's results throught participation of employees;
Timely and regulary access to relevant, sufficient and reliable information in the manner provided by Law
and laws of the Company;
The company will provide that shareholders, employees and all other stakeholders freely communicate
about possible illegal and ethical practice with Board of Directors, and because of that their rights will not
be compromised;
Development of business ethics and corporate social responsibility.
Corporate governance complements the current regulations, the established provisions of Articles of
Association and the Company Statut, so that none of the provisions of the Code does not eliminate one of the
above acts established the rule that the same question eventually regulate differently, neither the Code repeat
obligations, rules and principles established by the provisions of the above acts that company respect and apply. ALFA - PLAM is modeled on the OECD principles of corporate governance, as well as in accordance with the
experience of best practice in this area, has adopted its own principles of Corporate Management, which have
been incorporated into the Corporate Governance Code, which was adopted by the Board of Directors held on
22.04.2013.
17
1.8. BASIS OF PREPARATION OF FINANCIAL STATEMENTS
The financial statements have been prepared in accordance with the regulations of the Republic of Serbia
based on the Law on Accounting and Auditing ("RS Official Gazette", no. 46/2006 and 111/2009), which provides
the International Accounting Standards (IAS) and international Financial Reporting Standards (IFRS) as the basis
for the preparation and presentation of financial statements.
Decision of the Minister of Finance of the Republic of Serbia (No. 401-00-1380/2010 - 16 of 25 October
2010) was produced translation of basic texts IAS or IFRS, as issued by the International Accounting Standards
by 1 January 2009. year, as well as interpretations issued by the Committee for the interpretation of accounting
standards by 1 January 2009. year. The Company is assessing the impact of changes to IAS and IFRS standards
and interpretations on the financial statements. Amendments of existing IAS and IFRS standards and
interpretations, replacing existing IAS new one, which came into effect from 1 January 2009. year, and the
application of new interpretations became effective in 2010. , have not led to significant changes in accounting
policies or material impact on the financial statements in the period of initial application. Despite the fact that
many of these changes are not applicable to the Company, the Company's management does not express an
explicit and unreserved statement of compliance with IAS financial statements and IFRS applicable to the periods
presented in the accompanying financial statements.
The financial statements are prepared in accordance of historical cost concept and the going concern
principle Society.The financial statements are presented in the format prescribed in the Regulations on the content
and form of financial statements for companies, cooperatives, other legal entities and entrepreneurs ("Fig. Gazette
of RS", no. 114/2006, 5/2007, 119/2008, 2 / 2010 and 101/2012), which differ from the presentation of certain
amounts as required under IAS 1 "Presentation of Financial Statements". Because of that, these financial
statements do not fully comply with IAS and MSF. According to the Law on Accounting and Auditing of financial
statements include: balance sheet, income statement, cash flow statement, statement of changes in equity and
notes to the financial statements and the statistical annex.
These financial statements are stated in thousands of RSD, unless otherwise is not indicated. RSD is the
functional and official currency of the Company. All transactions in currencies other than the functional currency
are treated as transactions in foreign currencies.
In the preparation of these financial statements company applied the policies od accounting described in
Note 3, which are in conformity with the accounting and tax regulations of the Republic of Serbia.
1.9. OVERVIEW OF SIGNIFICANT ACCOUNTING POLICIES
1.9.1. Use of estimates
The preparation of the financial statements in accordance with IAS and IFRS and accounting regulations
valid in Republic of Serbia requires the Company's management to make estimates and assumptions that affect
the amounts reported in the financial statements and notes to financial statements.
These estimates and assumptions are based on information available at the balance sheet date. Actual
results could be different from those estimates, whereby estimates are reviewed periodically.
The most significant estimates relate to the determination of impairment of financial and non-financial
assets, recognition of deferred tax assets, the determination of provisions for legal disputes and defining the
assumptions that are necessary for the actuarial calculation of employee benefits for retirement, and the same are
disclosed in the respective accounting policies and / or notes to the financial statements.
1.9.2. Foreign currency translation and accounting treatment of foreign exchange differences and
foreign currency clause
Items included in the financial statements of the Company valued by using the currency of the primary
economic environment in which the company operates (the functional currency). The financial statements are
stated in thousands of RSD, which is the functional and official currency the Company.
All assets and liabilities denominated in foreign currencies at the balance sheet date are translated into
RSD at the official exchange rate foreign exchange of the National Bank of Serbia valid on that date. Business
18
transactions in foreign currencies during the year are translated into RSD at the official exchange rate of the
National Bank of Serbia valid on the date of the transaction.
Positive and negative exchange rate arising from the translation of assets and liabilities denominated in
foreign currencies and transactions during the year are recorded in the income statement as financial income or
financial expenses.
Positive and negative effects of agreed clauses related with foreign receivables and liabilities incurred by
applying the agreed rate, shall also be stated as financial income or financial expenses.
1.9.3. Comparative data
The comparative data represent the Company's financial statements for 2013. year, which were subject of
revision by another auditor company– „MOORE STEPHENS Audit and Accounting“, Belgrade.
1.9.4. Revenues from regular operations
Sales revenue are included in the amount of invoiced realization, ie. the sale until the end of the accounting
period, provided that it is created on that date debtor - creditor relationship and the invoice. Revenue is measured
at the fair value of consideration received or receivable taking into account the amount of any trade discounts and
volume rebates approve by the Company. The difference between the fair value and the nominal amount is
recognized as interest income.
Income from sales is recognized when all conditions are satisfied:
a) the Company has transferred to the buyer the significant risks and benefits from ownership;
b) management of the Company does not hold or continuing managerial involvement to the degree
usually associated with ownership nor effective control over the goods sold;
c) when it is possible to reliably measure the amount of revenue;
d) it is probable that the transaction will be accompanied with a flow of economic benefits to the
Company and
e) when the costs incurred or to be incurred in respect of the transaction can be measured reliably.
Revenues from services are recognized to the stage of completion at the balance sheet.
1.9.5. Operating expenses
The overall expenses from regular operations include: cost of goods sold, costs of materials, costs of
salaries, benefits and other personnel expenses, costs, amortization and provisions, costs of production services,
and intangible costs.
The basic elements and principles of expense recognition are:
a) Expenses are recognized and stated when a decrease in future economic benefits related to a
decrease in assets or increase in liabilities can be measured reliably;
b) The charges are based on the direct link of expenses to revenues;
c) When it is expected that the economic benefits will flow over several accounting periods and
the association with income can only be broadly or indirectly determined, expenses are
recognized on the basis of systematic and rational allocation;
d) Expenses are recognized when an expenditure produces no future economic benefits or when,
and to the extent that future economic benefits do not qualify, or cease to qualify for recognition
in the balance sheet as an asset;
e) Expenses are recognized in those cases where the liability is incurred without the recognition of
assets.
Cost of goods sold wholesale is defined as the sales value of goods at the wholesale, minus the amount
determined by the difference in price and calculated the VAT included in the value of goods sold at the
wholesale.
Cost of goods sold at retail shall be in the amount of revenue from goods sold, net of the amount
determined by the difference in price, and the amount calculated VAT, contained in goods sold at retail.
19
1.9.6. Borrowing costs
Borrowing costs that are directly attributable to the acquisition, construction or production of a qualifying
are the part of the cost/price of the asset. Other borrowing costs are recognized as an expense.
1.9.7. Financial income and expenses
Financial income and expenses include income and expenses from interest (regardless of whether they
are overdue and whether paid or added to the amount of receivable or liabilities at the balance sheet), income and
losses from exchange differences, income and expenses from transactions with the parent, subsidiaries and other
related parties, and other financial income and expenses.
Dividend income is recognized as income in the year the same approved for payment.
1.9.8. Profits and losses
Profits represent increases in economic benefits, including income which occurs on sale of fixed assets at
values higher than their book value, unrealized profits on the sale of the securities market (in the case of the
evaluation of securities by their market values) and profit which arise from increasing accounting value non
curent assets because stopping conditions for the reduction in their value.
Losses arising from the sale of assets at prices lower than their book value, on the disposal of non write off
of fixed assets from claims which may be wholly or partially reimbursed by insurance companies and by applying
the principle of decrease (Impairment of Assets).
1.9.9. Property, plant and equipment
Property, plant and equipment are tangible assets:
that company hold for use in the production or supply of goods or services, for rental to others, or
for administrative purposes;
they are expected to be used during more than one period, and
with a single purchase price at the time of acquisition exceeds the average gross earnings per
employee, according to the latest data of the authority in charge of statistics.
Intangible assets consist of other intangible assets – software for computers.
Purchases of intangible assets during the year are recorded at cost. Cost represents the invoiced value plus
any directly attributable expenses and the costs of bringing into use . Cost of intangible assets in own production
are direct costs and indirect costs related to the investment.
After recognition as assets, property, plant and equipment they are stated at cost value or at cost value
decuted for accumulated depreciation and total impairment losses.
At each balance sheet date the Company assesses whether there is any indication that the asset may be
impaired. If any such indication exists , the Company estimates the amount of resources that can be recovered. If
the recoverable amount of the asset is less than its carrying amount the carrying value is reduced to its recoverable
amount and at the same time reduce the previously established revaluation reserve in respect of that asset. If you
have not created the revaluation reserve in respect of assets whose value is diminished or are used for other
purposes, the amount of the impairment loss is recognized in income statement.
If at the balance sheet date there are indications that the previously recognized impairment loss does not
exist or is reduced , are evaluated recoverable amount of the asset. An impairment loss recognized in prior years
is recognized as revenue, and the book value of the asset is increased to its recoverable amount.
Subsequent expenditure relating to an already recognized intangible assets, attributable to the carrying
amount of the asset if it is probable that future economic benefits will be higher than originally estimated rate of
return of the asset.
The Company recognizes in the carrying value of intangible assets , the cost of replacement of some parts
of these items , at a time when costs are incurred and when they met the recognition criteria in IAS 38 - "
Intangible assets" (paragraph 21) .
All other expenditure is recognized as an expense in the period in which it arises.
Intangible assets stop to be recognized in the balance sheet on disposal or when the asset is permanently
withdrawn from use and from its disposal does not expect any future economic benefits.
Gains or losses arising from the retirement or disposal is determined as the difference between the
estimated net disposal proceeds and the carrying amount of the asset and are recognized as income or expense in
the income statement.
20
1.9.10. Investment Property
Property, plant and equipment are tangible assets that:
the Company holds for use in the production or supply of goods or services, for rental to others, or
for administrative purposes;
that are expected to be used during more than one accounting period;
each with a purchase price at the time of acquisition is bigger than the average gross wage per
employee in the Republic, according to the latest published data of the body in charge of statistics.
Purchase value / cost of property, plant and equipment is recognized as an asset if, and only if:
- It is probable that future economic benefits associated with the item will flow to the entity; and
- The purchase value / cost of the asset can be measured reliably.
Purchases of propert, plant and equipment are initially recorded at cost value.
Cost value represents the invoiced amount plus any directly attributable costs of acquisition and the costs of
bringing into use. Cost of that assets in self-directed are direct costs and indirect costs related to the investment.
After being recognized as assets, property, plant and equipment are stated at cost value or cost of goods reduced
for accumulated accrued depreciation and accumulated impairment losses.
At each balance sheet date the Company assesses whether there is any indication that the asset may be
impaired. If any such indication exists, the Company estimates the amount of resources that can be recovered. If
the recoverable amount of the asset is less than its carrying amount the carrying value is reduced to its recoverable
amount and the impairment loss is recognized in income statement.
Subsequent expenditure relating to an already recognized for property, plant and equipment is attributed to
the carrying amount of the asset if it is probable that future economic benefits will be higher than originally
estimated rate of return of the asset and the purchase value / cost of subsequent expenditure can reliably utvrditii .
The Company recognizes in the book value of certain property, plant and equipment the cost of replacing
some parts of these items , at a time when costs are incurred and when they met the recognition criteria in IAS 16
- "Property, Plant and Equipment " (paragraph 7 ) .
All other expenditure is recognized as an expense in the period in which it arises.
City land is stated separately from the value of the property at cost and subsequently evaluation is done in
the same way and entered the property, plant and equipment.
Amortization of land is not performed.
Property, plant and equipment is eliminated from the balance sheet on disposal or when the asset is
permanently withdrawn from use and from its disposal does not expect any future economic benefits.
Gains or losses arising from the retirement or disposal is determined as the difference between the
estimated net inflow from sell and the carrying amount of the asset and they are recognized as income or expense
in the income statement.
1.9.11. Investment property
Investment property is apartment that Company as owner held to earn rental income and not for use in the
production or supply of goods or services or for administrative purposes or sale in the ordinary course of business.
Initial measurement of investment property carried at cost value or cost price. In the initial measurement,
purchase costs are included in the cost value or cost price.
After initial recognition, investment property is measured at cost value or cost price which is reduced for
total amount of corrections amortization.
1.9.12. Amortization
Calculation of amortization is performed from the beginning of the month following the month when were
the asset is put into use.
Amortization is calculated on the proportional method, using rates which are determined based on the
estimated useful life of the assets.
The basis for the calculation of amortization is cost of value.
Useful life and smortization rates are reviewed periodically and, if expectations are based on new
estimates significantly different from the previous, calculation of amortization costs for the current and future
periods are corrected.
Method of calculating amortization applied is reviewed periodically and there has been a significant
change in the expected pattern in which economic benefits from these assets, the method is changed to reflect the
changed method. When such a change is a method of calculating amortization is necessary, then it is accounted
for as a change in accounting estimate and calculate amortization for the current and future periods are corrected.
21
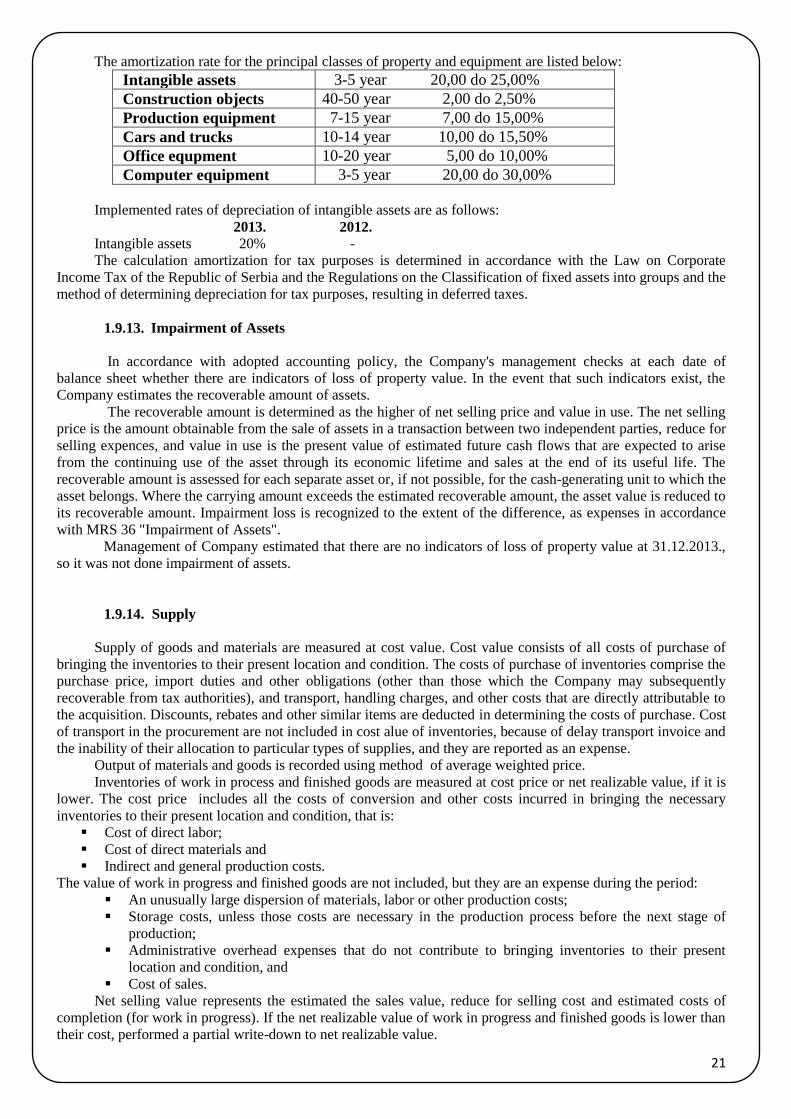
The amortization rate for the principal classes of property and equipment are listed below:
Intangible assets 3-5 year 20,00 do 25,00%
Construction objects 40-50 year 2,00 do 2,50%
Production equipment 7-15 year 7,00 do 15,00%
Cars and trucks 10-14 year 10,00 do 15,50%
Office equpment 10-20 year 5,00 do 10,00%
Computer equipment 3-5 year 20,00 do 30,00%
Implemented rates of depreciation of intangible assets are as follows:
2013. 2012.
Intangible assets 20% -
The calculation amortization for tax purposes is determined in accordance with the Law on Corporate
Income Tax of the Republic of Serbia and the Regulations on the Classification of fixed assets into groups and the
method of determining depreciation for tax purposes, resulting in deferred taxes.
1.9.13. Impairment of Assets
In accordance with adopted accounting policy, the Company's management checks at each date of
balance sheet whether there are indicators of loss of property value. In the event that such indicators exist, the
Company estimates the recoverable amount of assets.
The recoverable amount is determined as the higher of net selling price and value in use. The net selling
price is the amount obtainable from the sale of assets in a transaction between two independent parties, reduce for
selling expences, and value in use is the present value of estimated future cash flows that are expected to arise
from the continuing use of the asset through its economic lifetime and sales at the end of its useful life. The
recoverable amount is assessed for each separate asset or, if not possible, for the cash-generating unit to which the
asset belongs. Where the carrying amount exceeds the estimated recoverable amount, the asset value is reduced to
its recoverable amount. Impairment loss is recognized to the extent of the difference, as expenses in accordance
with MRS 36 "Impairment of Assets".
Management of Company estimated that there are no indicators of loss of property value at 31.12.2013.,
so it was not done impairment of assets.
1.9.14. Supply
Supply of goods and materials are measured at cost value. Cost value consists of all costs of purchase of
bringing the inventories to their present location and condition. The costs of purchase of inventories comprise the
purchase price, import duties and other obligations (other than those which the Company may subsequently
recoverable from tax authorities), and transport, handling charges, and other costs that are directly attributable to
the acquisition. Discounts, rebates and other similar items are deducted in determining the costs of purchase. Cost
of transport in the procurement are not included in cost alue of inventories, because of delay transport invoice and
the inability of their allocation to particular types of supplies, and they are reported as an expense.
Output of materials and goods is recorded using method of average weighted price.
Inventories of work in process and finished goods are measured at cost price or net realizable value, if it is
lower. The cost price includes all the costs of conversion and other costs incurred in bringing the necessary
inventories to their present location and condition, that is:
Cost of direct labor;
Cost of direct materials and
Indirect and general production costs.
The value of work in progress and finished goods are not included, but they are an expense during the period:
An unusually large dispersion of materials, labor or other production costs;
Storage costs, unless those costs are necessary in the production process before the next stage of
production;
Administrative overhead expenses that do not contribute to bringing inventories to their present
location and condition, and
Cost of sales.
Net selling value represents the estimated the sales value, reduce for selling cost and estimated costs of
completion (for work in progress). If the net realizable value of work in progress and finished goods is lower than
their cost, performed a partial write-down to net realizable value.
22
Charged to other expense shall be corrected suplly in cases where it is estimated to reduce the carrying
value of supply to their net realizable value. Damaged supply and inventory that does not meet the standards are
written off in full.
Inventories of goods for resale are valued at the sale prices throughout the year. At the end of the
accounting period their value is adjusted to cost by an apportionment of the cost and value added tax, calculated
on an average basis, the value of supply hold at the end of the year and the cost of goods sold.
1.9.15. Financial instruments
Financial investments are financial assets during initial recognition measured at cost value which presents
fair value of the consideration given for them. Transaction costs are included in the initial measurement of all
financial assets.
For the purpose of measuring a financial asset after initial recognition, financial assets are classified as
financial assets available for sale.
After initial recognition, the Company measures the financial assets available for sale at their fair values,
without any deduction for transaction costs it may incur on sale or other disposal, and a gain or loss arising from a
change in fair value of financial assets are recognized on the revaluation reserves .
1.9.16. Short term receivables
Short term receivables include receivables from customers - subsidiaries and other related parties and other
customers at home and abroad and sold products and services.
Short-term investments include other short-term investments with a maturity or sales within one year from
the date of commitment, or the balance sheet.
Short-term receivables are measured by the value of the original invoice. If the value of the invoice is
stated in a foreign currency are converted to the reporting currency at the average exchange rate in effect on the
date of the transaction. Changes in the exchange rate of the transaction date until the date of receivables are
recorded as exchange rate differences in income or expenses. Receivables denominated in foreign currencies at
the balance sheet date are translated at the middle exchange rate of current NBS, and exchange rate differences
are recognized as income or as expenses in the period.
Short-term investments that are not held for trading are measured at amortized cost, without taking into
account the intention of the company to hold them until maturity.
If it is probable that the Company will not be able to collect all amounts due (principal and interest)
according to the contractual terms for loans, receivables or held-to-maturity are carried at amortized cost, loss or
impairment due to unpaid debts.
Write-off of short-term receivables and investments for which there is a probability for inability to pay
performed indirect write-off, while in cases where the inability to collect certain and documented, remission, in
whole or in part, shall direct write-off.
1.9.17. Cash and cash equivalents
Cash and cash equivalents include cash in bank accounts, cash in cashier and highly liquid investments
with original maturities of three months or less and that can be quickly convertible to known amounts of cash and
with an insignificant risk of changes in value.
1.9.18. Provisions, potential liabilities and potential sources
Provisions are recognized when the Company has a legal or constructive obligation as a result of past
events and it is probable that an outflow of resources to settle the obligation and when a reliable estimate of the
amount.
Provisions for retirement benefits and jubilee awards are measured at the present value of expected future
outflows using a discount rate that reflects the high-interest securities that are denominated in the currency in
which the benefits will be paid.

23
1.9.19. Compesation of employees
1.9.19.1. Taxes and contributions for social insurance
In accordance with the regulations that apply to the Republic of Serbia, the Company is obliged to pay
contributions to the state social security funds. These obligations include contributions paid by the employee and
the employer in an amount computed by applying the statutory rate. The Company is also obligated to withhold
contributions from gross wages, and on their behalf to transfer the withheld funds to the appropriate state funds.
The Company is under no obligation to employees upon retirement pay fees that are the obligation of the pension
fund of the Republic of Serbia. Contributions on behalf of the employee and the employer are charged to
expenses in the period in which they arise.
1.9.19.2. Liabilities for retirement benefits and julilee awards
In accordance with the Labor Law ("Official Gazette" No. 61/05) and the general act of the individual
work, the Company is obligated to pay retirement benefits in an amount of 3 monthly gross earnings by the
employee of the month preceding the month to the payment of severance pay, which is not to be less than 3 times
the average gross salary paid by the Company in the month prior to the payment of severance pay.
In addition, the Company is obligated to pay jubilee awards in the amount of one half to one and a half the
average monthly salary. Number of monthly salaries for jubilee awards is determined based on the number of
years an employee has spent in the company.
Calculation and expression of long-term liabilities for retirement benefits and jubilee awards by the present
value of expected future payments, based on actuarial calculation.
1.9.20. Income taxes
1.9.20.1. Curent income
Income tax is the amount calculated in accordance with the provisions of the Income Tax Law. Income tax
is calculated at the rate of 15 % on the tax base reported in the income tax, net of tax credits. The taxable base
includes the profit shown in the profit and loss, as adjusted in accordance with the tax legislation of the Republic
of Serbia.
Tax Law recognizes the company give a tax credit amounting to 20% of investments in intangible assets,
property, plant and equipment in their own property within the territory of the Republic to perform the core
activities and activities listed in the Articles of Association of the Company, provided that the tax credit may not
exceed 33 % of the calculated tax in the year in which the investment was made . Unused tax credits can be offset
against income taxes in future periods , up to 33 % of the calculated tax in that tax period , but not more than 10
years.
Since the Society 31 December 2012th year , entitled to a tax incentive under Art . 48a of the Law on
Corporate Income Tax Law ( "Official Gazette of RS ", no . 25/ 01, 80 /02 , 80/ 02 - dr . Law , 43/ 03, 84 /04 ,
18/10 and 101 /11) and presented the information in the tax returns and tax return for year 2012. year , to be
entitled to benefits until the expiration of the deadline and in the manner prescribed by the law , or the unused
portion of the tax credit on that basis he recognizes no limits on the tax calculated for the next 10 years .
1.9.20.2. Deferred tax
Deferred income taxes are provided for temporary differences between the tax bases of assets and liabilities
and their book values. Currently tax rate on the balance sheet date are used to determine the amount of deferred
taxes. Deferred tax liabilities are recognized for all taxable temporary differences. Deferred tax assets are
recognized for deductible temporary differences and the transferred effects of loss and unused tax credits from
prior years to the extent that it is probable that there will be future taxable profits against which the deferred tax
asset to be utilized.
Current and deferred taxes are recognized as income or expense and included in the net profit for the
period.
24
1.9.21. Earnings per share
The Company calculates and discloses basic earnings per share. Basic earnings per share is calculated by
sharing net profit attributable to shareholders of the Company to holders of ordinary shares by the weighted
average number of ordinary shares outstanding during the period.
1.9.22. Distribution of dividends
Distribution of dividends to shareholders of the Company in the financial statements is recognized as a
liability in the period in which the dividends are approved by shareholders of the Company.
If the dividend declared after the balance sheet date but before the financial statements are authorized for
issue, the Company which is not the case, the dividends are not recognized as a liability at the balance sheet date,
they do not meet the criteria of a present obligation in IAS 37 "Provisions, contingent Liabilities and contingent
Assets". Such dividends are disclosed in the notes to the financial statements in accordance with MRS 1
"Presentation of Financial Statements".
1.9.23. Disclosure of related party
For the purposes of these financial statements, entities are treated as associated if one entity has the ability
to control another entity or have a substantial impact on the financial and business operations of the entity, as
defined in IAS 24 "Disclosures of related parties."
Relations between the Company and its related parties are regulated on a contractual basis and on market
conditions. Condition of assets and liabilities at the balance sheet date, and transactions occurred during the
reporting period with related parties are separately disclosed in the notes to the financial statements.
1.9.24. Financial risk management
The Company in its normal course of business to a different extent exposed to certain financial risks:
- Credit risk,
- Market risk (including currency risk Foreign currency risk, interest rate risk and price changes) and
- Liquidity risk.
Risk management in the Company is focused on minimizing the potential negative impact on the financial
condition and operations of the unpredictability of financial markets.
Risk management is defined by the accounting policies.
1.9.25. Credit risk
Credit risk is the risk that one party in financial instrument failing to discharge an obligation, causing a
financial loss on the other.
Credit risk arises from cash and cash equivalents, deposits with banks and financial institutions, accounts of
legal entities and individuals and commitments.
1.9.26. Market risk
The risk that the fair value or future cash flows of a financial instrument will fluctuate because of changes
in market prices. Market risk comprises three types of risk: currency risk, interest rate risk and other price
changes.
1.9.26.1. Risk of changes in foreign currency exchange rates
Currency risk is the risk of fluctuations in the fair value or future cash flows of a financial instrument due
to changes in exchange rates.
Currency risk (or foreign exchange risk) arises on financial instruments that are denominated in foreign
currency, that is in a currency other than the functional currency in which they are measured.
25
1.9.26.2. Risk of changes in interest rates
Risk of changes in interest rates is the risk that the fair value or future cash flows of a financial instrument
will fluctuate because of changes in market interest rates.
Interest rate risk arises on interest-bearing financial instruments recognized in the balance sheet (eg loans
and receivables and debt instruments issued) and on some financial instruments not recognized in the balance
sheet (eg. some loan commitments).
1.9.26.3. The risk of price changes
The risk of price changes is the risk that the fair value or future cash flows of a financial instrument will
fluctuate because of changes in market prices (other than those arising from interest rate risk or currency risk),
whether those changes are caused by factors specific to the individual financial instrument or its issuer, or factors
affecting all similar financial instruments traded in the market
The risk of price changes occurring in financial instruments because of changes in, for example,
commodity prices or equity prices.
1.9.27. Liquidity risk
Liquidity risk is the risk that the company will not have difficulty in meeting obligations associated with
financial liabilities.
1.9.28. Important business events that occurred after the expiration of the financial year for which
the report was prepared
National Bank of Serbia on 31 January of 2014. was revoked the license Universal banka ad, Beograd, and
a Commercial Court in Belgrade reached 03. February of 2014. the decision to open bankruptcy proceedings
against the bank. These events according to IAS - 10 are corrective events, so that on the basis of their actions
Universal Bank ad, Beograd devaluated in its entirety.
In addition, there were no other events between the date on which the financial statements have been
prepared (December 31, 2013.) And the date of approval of the financial statements (28.02.2014.), keeping in
mind the requirements of IAS-10.
1.9.29. The impact of important business events
Important business event that occurred during the financial year does not have a significant impact on the
business.
26
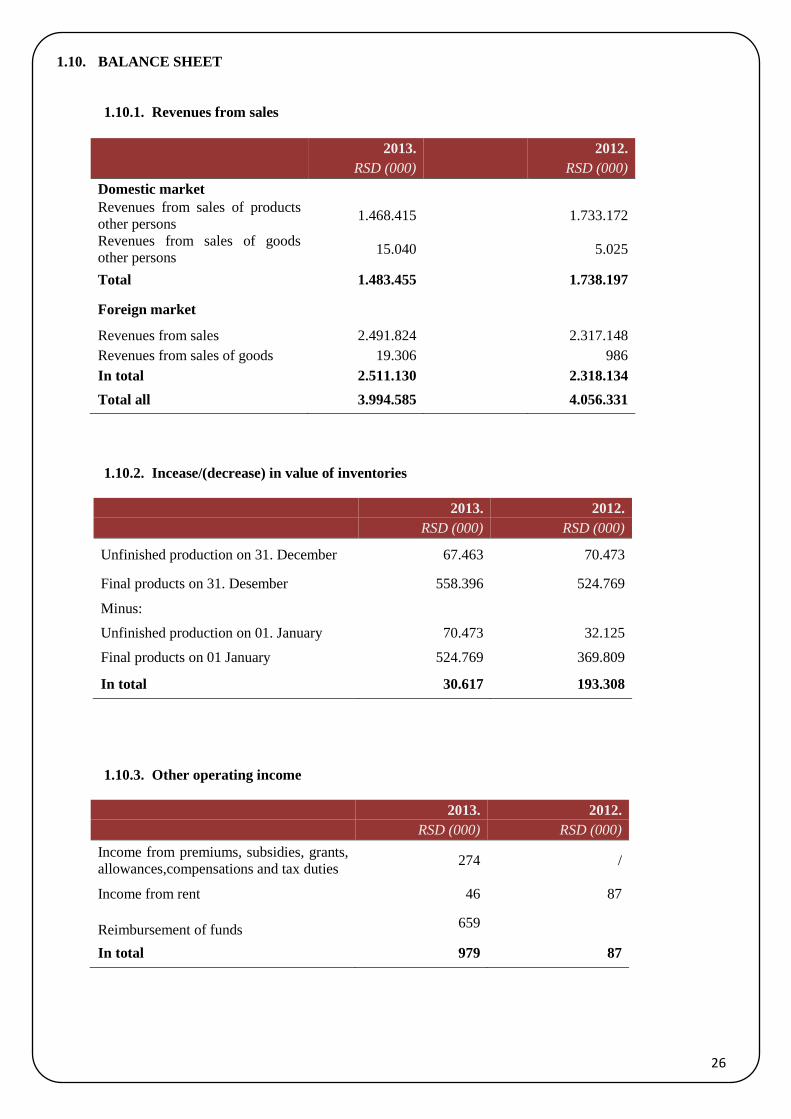
1.10. BALANCE SHEET
1.10.1. Revenues from sales
2013. 2012.
RSD (000) RSD (000)
Domestic market
Revenues from sales of products
other persons 1.468.415
1.733.172
Revenues from sales of goods
other persons 15.040
5.025
Total 1.483.455
1.738.197
Foreign market
Revenues from sales 2.491.824
2.317.148
Revenues from sales of goods 19.306
986
In total 2.511.130
2.318.134
Total all 3.994.585 4.056.331
1.10.2. Incease/(decrease) in value of inventories
2013. 2012.
RSD (000) RSD (000)
Unfinished production on 31. December 67.463 70.473
Final products on 31. Desember 558.396 524.769
Minus:
Unfinished production on 01. January 70.473 32.125
Final products on 01 January 524.769 369.809
In total 30.617 193.308
1.10.3. Other operating income
2013. 2012.
RSD (000) RSD (000)
Income from premiums, subsidies, grants,
allowances,compensations and tax duties 274 /
Income from rent 46 87
Reimbursement of funds 659
In total 979 87
27
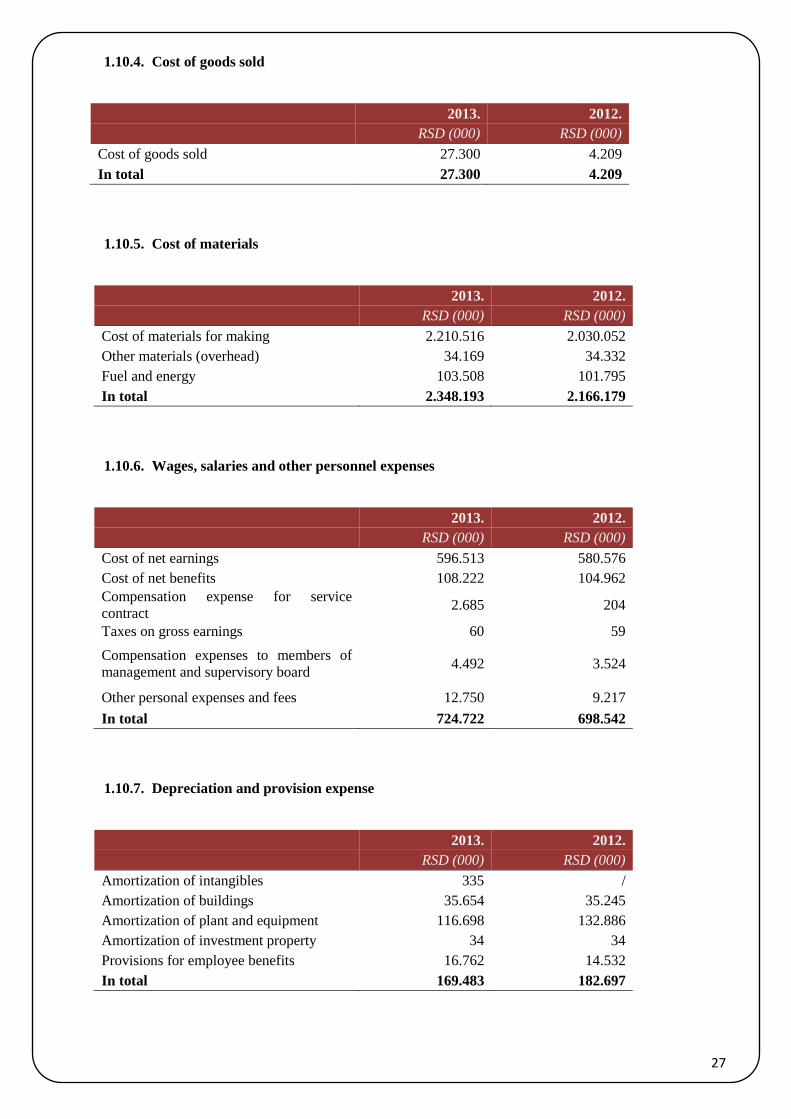
1.10.4. Cost of goods sold
2013. 2012.
RSD (000) RSD (000)
Cost of goods sold 27.300 4.209
In total 27.300 4.209
1.10.5. Cost of materials
2013. 2012.
RSD (000) RSD (000)
Cost of materials for making 2.210.516 2.030.052
Other materials (overhead) 34.169 34.332
Fuel and energy 103.508 101.795
In total 2.348.193 2.166.179
1.10.6. Wages, salaries and other personnel expenses
2013. 2012.
RSD (000) RSD (000)
Cost of net earnings 596.513 580.576
Cost of net benefits 108.222 104.962
Compensation expense for service
contract 2.685 204
Taxes on gross earnings 60 59
Compensation expenses to members of
management and supervisory board 4.492 3.524
Other personal expenses and fees 12.750 9.217
In total 724.722 698.542
1.10.7. Depreciation and provision expense
2013. 2012.
RSD (000) RSD (000)
Amortization of intangibles 335 /
Amortization of buildings 35.654 35.245
Amortization of plant and equipment 116.698 132.886
Amortization of investment property 34 34
Provisions for employee benefits 16.762 14.532
In total 169.483 182.697
28
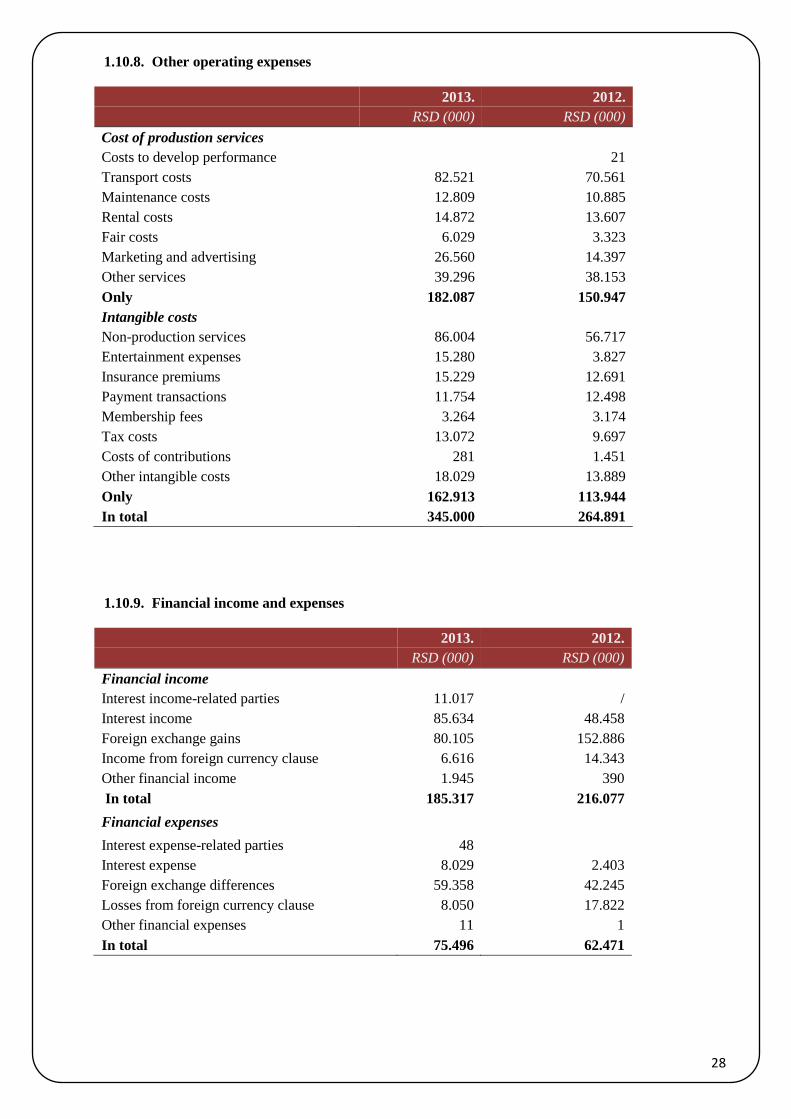
1.10.8. Other operating expenses
2013. 2012.
RSD (000) RSD (000)
Cost of produstion services
Costs to develop performance
21
Transport costs 82.521 70.561
Maintenance costs 12.809 10.885
Rental costs 14.872 13.607
Fair costs 6.029 3.323
Marketing and advertising 26.560 14.397
Other services 39.296 38.153
Only 182.087 150.947
Intangible costs
Non-production services 86.004 56.717
Entertainment expenses 15.280 3.827
Insurance premiums 15.229 12.691
Payment transactions 11.754 12.498
Membership fees 3.264 3.174
Tax costs 13.072 9.697
Costs of contributions 281 1.451
Other intangible costs 18.029 13.889
Only 162.913 113.944
In total 345.000 264.891
1.10.9. Financial income and expenses
2013. 2012.
RSD (000) RSD (000)
Financial income
Interest income-related parties 11.017 /
Interest income 85.634 48.458
Foreign exchange gains 80.105 152.886
Income from foreign currency clause 6.616 14.343
Other financial income 1.945 390
In total 185.317 216.077
Financial expenses
Interest expense-related parties 48
Interest expense 8.029 2.403
Foreign exchange differences 59.358 42.245
Losses from foreign currency clause 8.050 17.822
Other financial expenses 11 1
In total 75.496 62.471
29
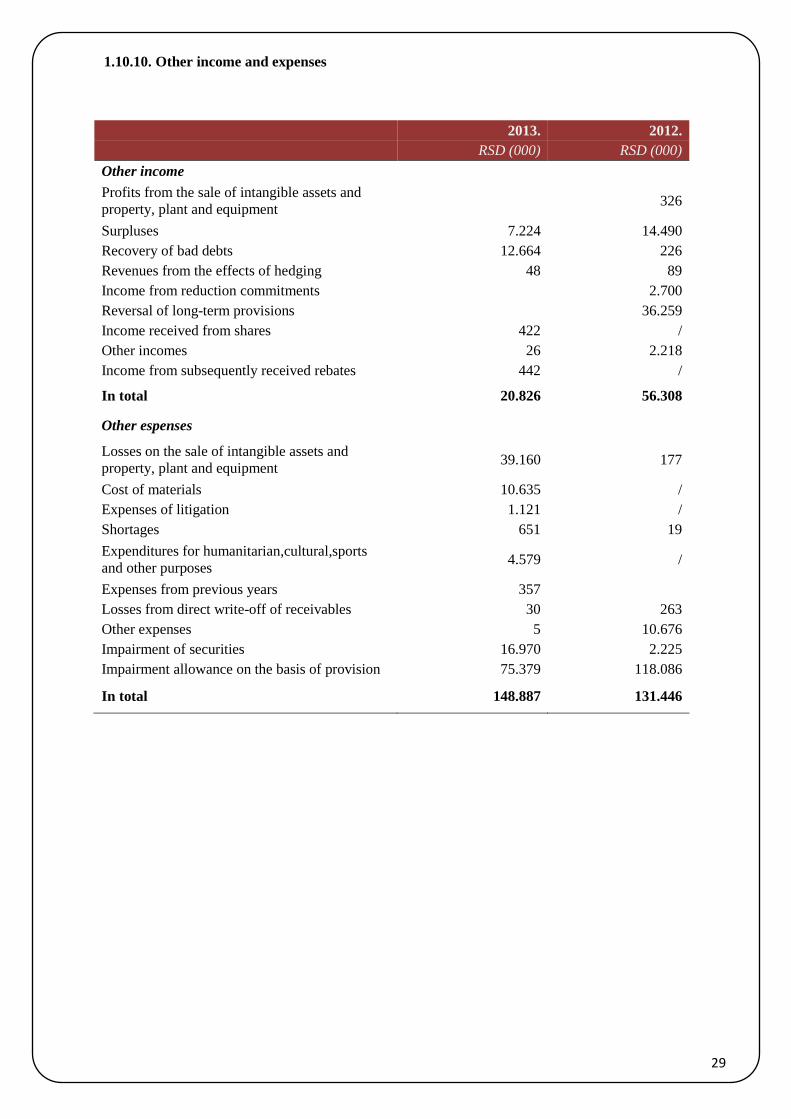
1.10.10. Other income and expenses
2013. 2012.
RSD (000) RSD (000)
Other income
Profits from the sale of intangible assets and
property, plant and equipment 326
Surpluses 7.224 14.490
Recovery of bad debts 12.664 226
Revenues from the effects of hedging 48 89
Income from reduction commitments
2.700
Reversal of long-term provisions
36.259
Income received from shares 422 /
Other incomes 26 2.218
Income from subsequently received rebates 442 /
In total 20.826 56.308
Other espenses
Losses on the sale of intangible assets and
property, plant and equipment 39.160 177
Cost of materials 10.635 /
Expenses of litigation 1.121 /
Shortages 651 19
Expenditures for humanitarian,cultural,sports
and other purposes 4.579 /
Expenses from previous years 357
Losses from direct write-off of receivables 30 263
Other expenses 5 10.676
Impairment of securities 16.970 2.225
Impairment allowance on the basis of provision 75.379 118.086
In total 148.887 131.446
30
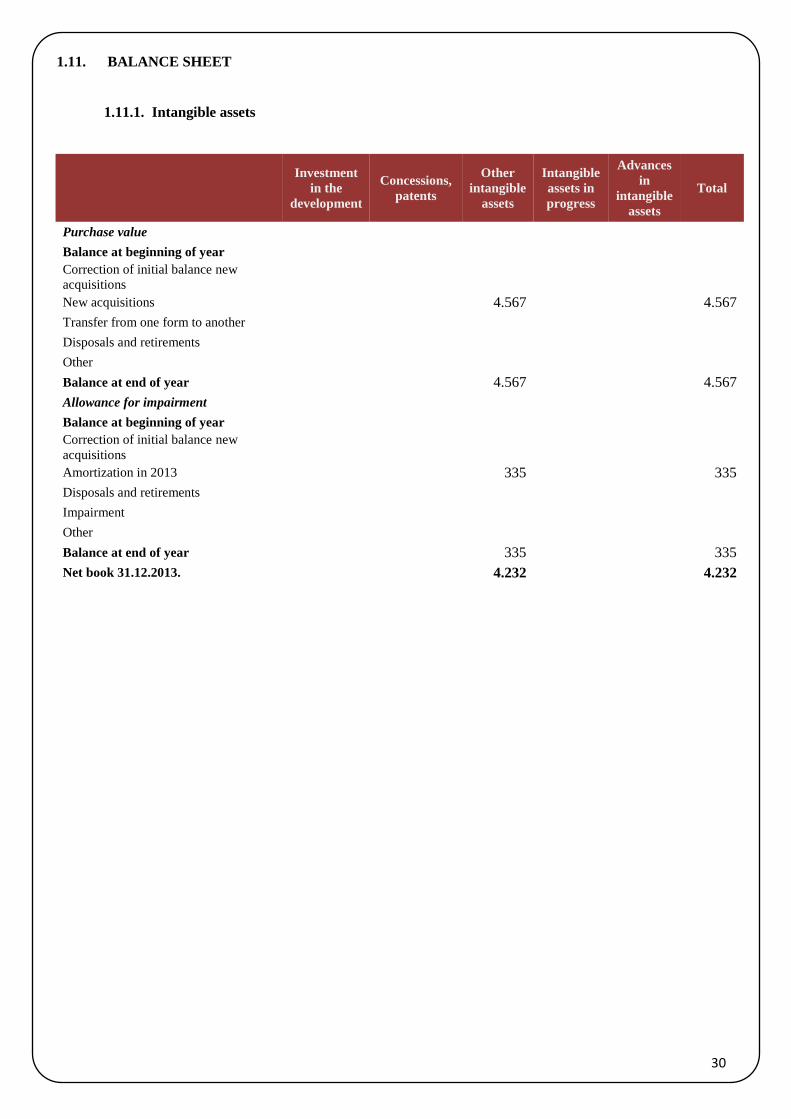
1.11. BALANCE SHEET
1.11.1. Intangible assets
Investment
in the
development
Concessions,
patents
Other
intangible
assets
Intangible
assets in
progress
Advances
in
intangible
assets
Total
Purchase value
Balance at beginning of year
Correction of initial balance new
acquisitions New acquisitions
4.567
4.567
Transfer from one form to another
Disposals and retirements
Other
Balance at end of year
4.567
4.567
Allowance for impairment
Balance at beginning of year
Correction of initial balance new
acquisitions Amortization in 2013
335
335
Disposals and retirements
Impairment
Other
Balance at end of year
335
335
Net book 31.12.2013.
4.232
4.232
31
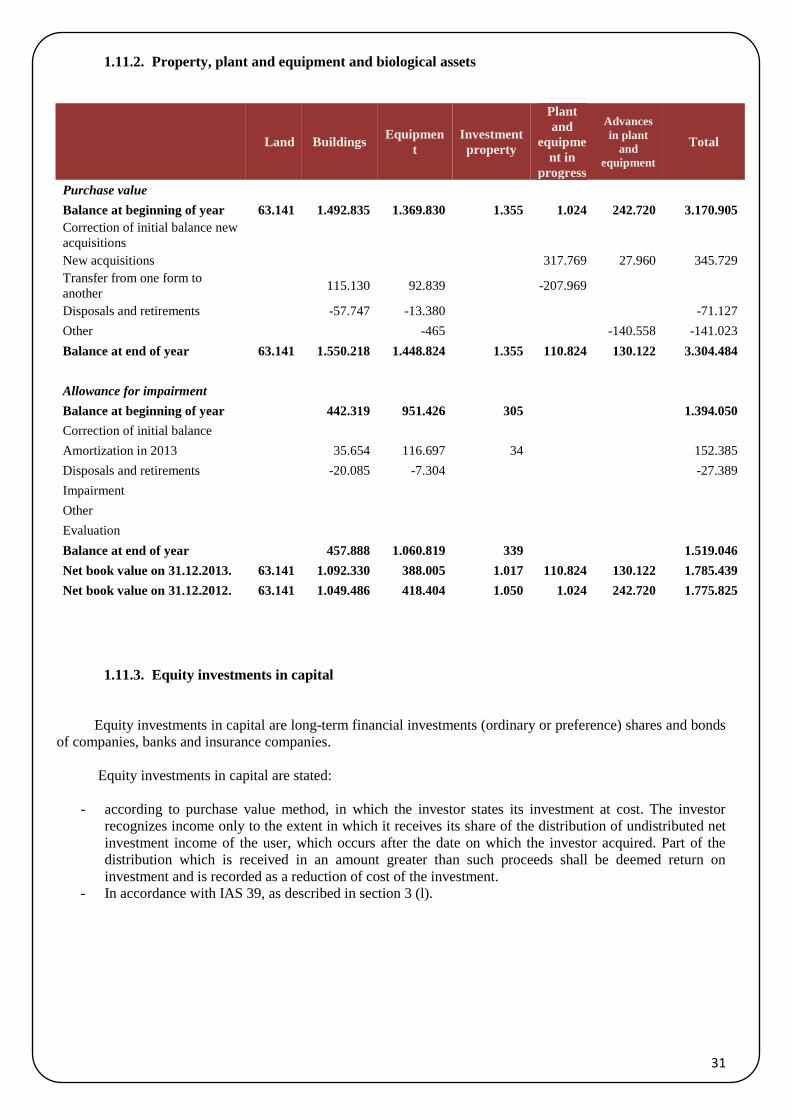
1.11.2. Property, plant and equipment and biological assets
Land Buildings Equipmen
t
Investment
property
Plant
and
equipme
nt in
progress
Advances
in plant
and
equipment
Total
Purchase value
Balance at beginning of year 63.141 1.492.835 1.369.830 1.355 1.024 242.720 3.170.905
Correction of initial balance new
acquisitions
New acquisitions
317.769 27.960 345.729
Transfer from one form to
another 115.130 92.839
-207.969
Disposals and retirements
-57.747 -13.380
-71.127
Other
-465
-140.558 -141.023
Balance at end of year 63.141 1.550.218 1.448.824 1.355 110.824 130.122 3.304.484
Allowance for impairment
Balance at beginning of year
442.319 951.426 305
1.394.050
Correction of initial balance
Amortization in 2013
35.654 116.697 34
152.385
Disposals and retirements
-20.085 -7.304
-27.389
Impairment
Other
Evaluation
Balance at end of year
457.888 1.060.819 339
1.519.046
Net book value on 31.12.2013. 63.141 1.092.330 388.005 1.017 110.824 130.122 1.785.439
Net book value on 31.12.2012. 63.141 1.049.486 418.404 1.050 1.024 242.720 1.775.825
1.11.3. Equity investments in capital
Equity investments in capital are long-term financial investments (ordinary or preference) shares and bonds
of companies, banks and insurance companies.
Equity investments in capital are stated:
- according to purchase value method, in which the investor states its investment at cost. The investor
recognizes income only to the extent in which it receives its share of the distribution of undistributed net
investment income of the user, which occurs after the date on which the investor acquired. Part of the
distribution which is received in an amount greater than such proceeds shall be deemed return on
investment and is recorded as a reduction of cost of the investment.
- In accordance with IAS 39, as described in section 3 (l).
32
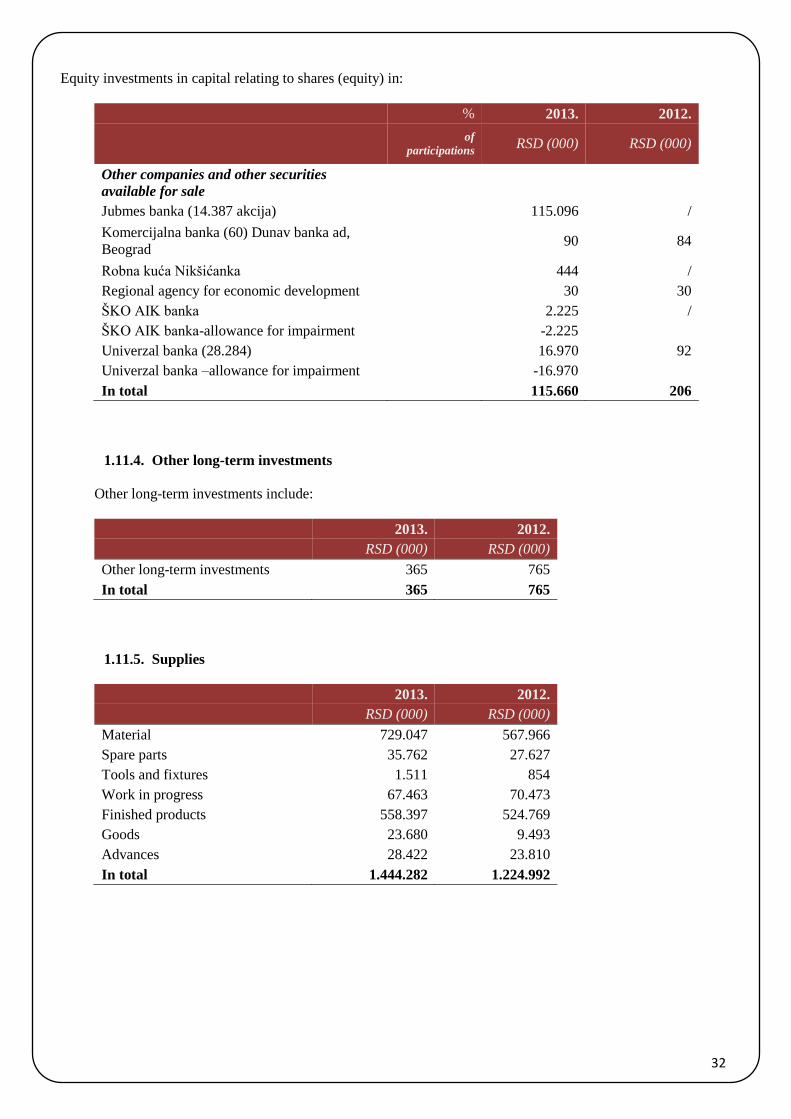
Equity investments in capital relating to shares (equity) in:
% 2013. 2012.
of
participations RSD (000) RSD (000)
Other companies and other securities
available for sale
Jubmes banka (14.387 akcija)
115.096 /
Komercijalna banka (60) Dunav banka ad,
Beograd 90 84
Robna kuća Nikšićanka
444 /
Regional agency for economic development
30 30
ŠKO AIK banka
2.225 /
ŠKO AIK banka-allowance for impairment
-2.225
Univerzal banka (28.284)
16.970 92
Univerzal banka –allowance for impairment
-16.970
In total 115.660 206
1.11.4. Other long-term investments
Other long-term investments include:
2013. 2012.
RSD (000) RSD (000)
Other long-term investments 365 765
In total 365 765
1.11.5. Supplies
2013. 2012.
RSD (000) RSD (000)
Material 729.047 567.966
Spare parts 35.762 27.627
Tools and fixtures 1.511 854
Work in progress 67.463 70.473
Finished products 558.397 524.769
Goods 23.680 9.493
Advances 28.422 23.810
In total 1.444.282 1.224.992

33
1.11.6. Receivables
2013. 2012.
RSD (000) RSD (000)
Receivables from the sale
Domestic buyers-related parties 1.948 /
Domestic buyers 143.834 147.930
Foreign buyers 724.643 762.305
Less: Allowance for impairment -183.294 -133.624
Only 687.131 776.611
Other receivables
Interest receivables 8.423 1.212
Receivables from employees 468 190
Only 8.891 1.402
In total 696.022 778.013
Geographical location of customers is as follows:
2013. 2012.
RSD (000) RSD (000)
Domestic buyers
Belgrade 20.881 39.413
Vojvodina 228.916 284.059
Central Serbia 1.541.618 1.722.480
Less: Allowance for impairment / 6.018
Only 1.791.415 2.051.970
Foreign buyers
Formal yugoslav republic 1.521.390 1.519.011
Evropa 1.002.713 849.184
Other…. 15.557 3.505
Less: Allowance for impairment 49.670 127.606
Only 2.489.990 2.244.094
In total 4.281.405 4.296.064
34
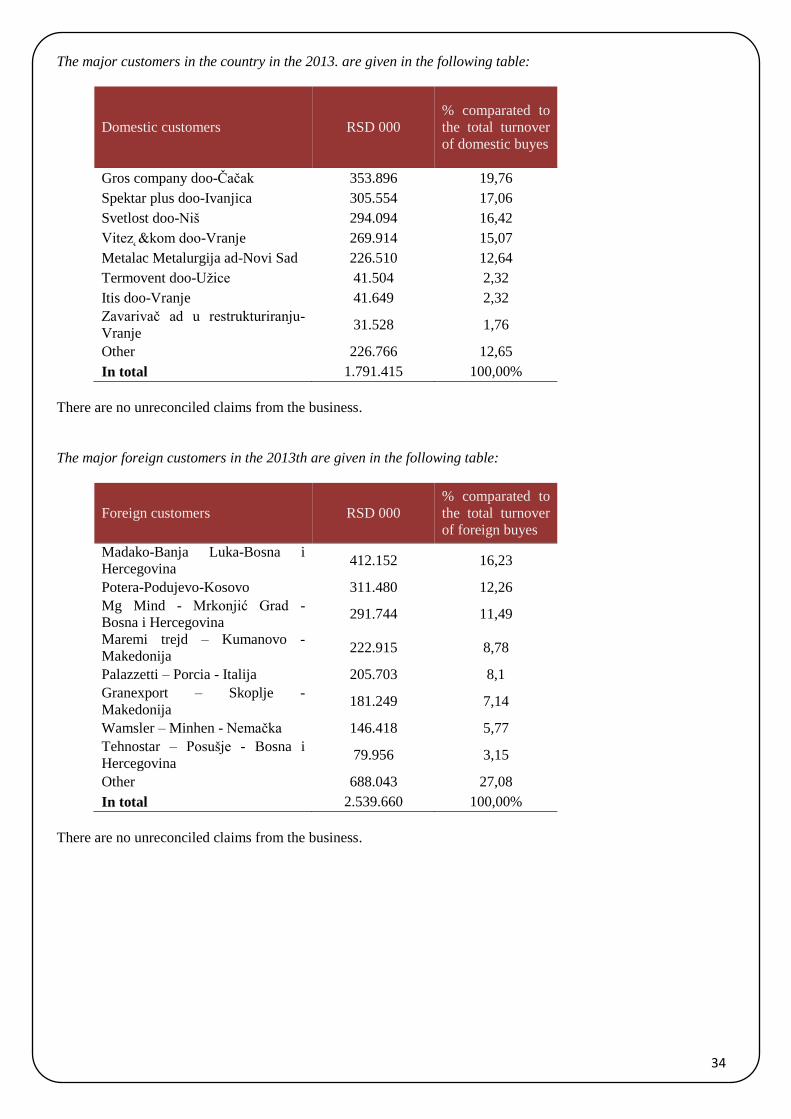
The major customers in the country in the 2013. are given in the following table:
Domestic customers RSD 000
% comparated to
the total turnover
of domestic buyes
Gros company doo-Čačak 353.896 19,76
Spektar plus doo-Ivanjica 305.554 17,06
Svetlost doo-Niš 294.094 16,42
Vitez˛&kom doo-Vranje 269.914 15,07
Metalac Metalurgija ad-Novi Sad 226.510 12,64
Termovent doo-Užice 41.504 2,32
Itis doo-Vranje 41.649 2,32
Zavarivač ad u restrukturiranju-
Vranje 31.528 1,76
Other 226.766 12,65
In total 1.791.415 100,00%
There are no unreconciled claims from the business.
The major foreign customers in the 2013th are given in the following table:
Foreign customers RSD 000
% comparated to
the total turnover
of foreign buyes
Madako-Banja Luka-Bosna i
Hercegovina 412.152 16,23
Potera-Podujevo-Kosovo 311.480 12,26
Mg Mind - Mrkonjić Grad - Bosna i Hercegovina
291.744 11,49
Maremi trejd – Kumanovo -
Makedonija 222.915 8,78
Palazzetti – Porcia - Italija 205.703 8,1
Granexport – Skoplje -
Makedonija 181.249 7,14
Wamsler – Minhen - Nemačka 146.418 5,77
Tehnostar – Posušje - Bosna i
Hercegovina 79.956 3,15
Other 688.043 27,08
In total 2.539.660 100,00%
There are no unreconciled claims from the business.

35
1.11.7. Short-term investments
2013. 2012.
Currency code Interest rate RSD (000) RSD (000)
Shor-term consumer loans 1.180 945
Sindicate loans
1.587 2.276
Only
2.767 3.221
Short-terms loans to related
parties
Pionir doo, Beograd EUR 3,5%+6 m EURIBOR 162.367
Pionir doo, Paraćin EUR 3,5%+6 m EURIBOR -4% 74.632
Short-term loans to legal entities
Krušik akumulatori ad, Beograd EUR
17.196 17.058
Vaterpolo klub Radnički EUR
10.074
Less: Allowance for impairment
26.745
Only
237.524 17.058
Other short-term investments
Societe Generale banka EUR 3,50% 1.396.100 /
Banka Intesa ad, Beograd
/ 17.058
KBC Banka ad Beograd
/ 1.109.891
Erste banka EUR 3,60% 240.748 /
Hypo-alpe-adria bank EUR 3,70-4,10% 105.471 460.559
Hypo-alpe-adria bank RSD
535.000
Eurobank EFG EUR 2,50-5,00% 57.321 34.115
Only
1.799.640 2.156.623
In total
2.039.931 2.176.902
1.11.8. Cash and cash equivalents
2013. 2012.
RSD (000) RSD (000)
In RSD:
Cheques
5
Current business account 4.415 19.913
Checkout foreign exchange 40 279
Only 4.455 20.197
In foreign currency:
Foreign currency account 20.779 9.140
Foreign box office 51
Only 20.830 9.140
In total 25.285 29.337
36
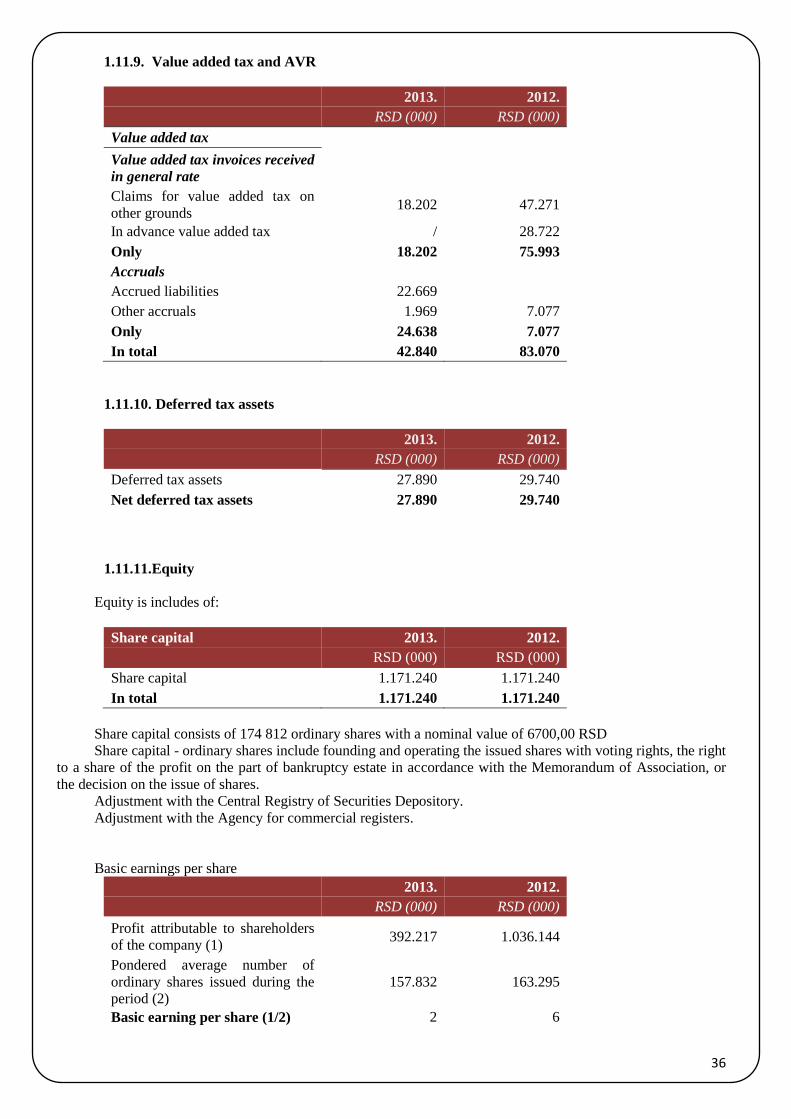
1.11.9. Value added tax and AVR
2013. 2012.
RSD (000) RSD (000)
Value added tax
Value added tax invoices received
in general rate
Claims for value added tax on
other grounds 18.202 47.271
In advance value added tax / 28.722
Only 18.202 75.993
Accruals
Accrued liabilities 22.669
Other accruals 1.969 7.077
Only 24.638 7.077
In total 42.840 83.070
1.11.10. Deferred tax assets
2013. 2012.
RSD (000) RSD (000)
Deferred tax assets 27.890 29.740
Net deferred tax assets 27.890 29.740
1.11.11. Equity
Equity is includes of:
Share capital 2013. 2012.
RSD (000) RSD (000)
Share capital 1.171.240 1.171.240
In total 1.171.240 1.171.240
Share capital consists of 174 812 ordinary shares with a nominal value of 6700,00 RSD
Share capital - ordinary shares include founding and operating the issued shares with voting rights, the right
to a share of the profit on the part of bankruptcy estate in accordance with the Memorandum of Association, or
the decision on the issue of shares.
Adjustment with the Central Registry of Securities Depository.
Adjustment with the Agency for commercial registers.
Basic earnings per share
2013. 2012.
RSD (000) RSD (000)
Profit attributable to shareholders
of the company (1) 392.217 1.036.144
Pondered average number of
ordinary shares issued during the
period (2)
157.832 163.295
Basic earning per share (1/2) 2 6
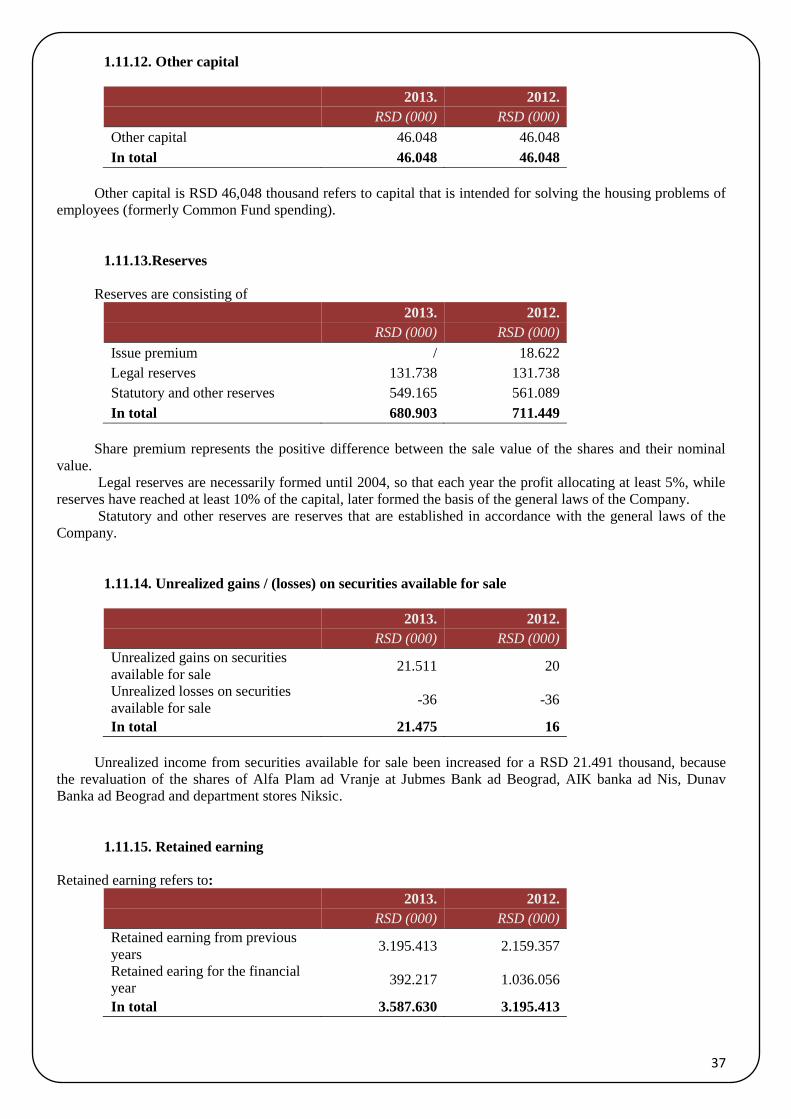
37
1.11.12. Other capital
2013. 2012.
RSD (000) RSD (000)
Other capital 46.048 46.048
In total 46.048 46.048
Other capital is RSD 46,048 thousand refers to capital that is intended for solving the housing problems of
employees (formerly Common Fund spending).
1.11.13. Reserves
Reserves are consisting of
2013. 2012.
RSD (000) RSD (000)
Issue premium / 18.622
Legal reserves 131.738 131.738
Statutory and other reserves 549.165 561.089
In total 680.903 711.449
Share premium represents the positive difference between the sale value of the shares and their nominal
value.
Legal reserves are necessarily formed until 2004, so that each year the profit allocating at least 5%, while
reserves have reached at least 10% of the capital, later formed the basis of the general laws of the Company.
Statutory and other reserves are reserves that are established in accordance with the general laws of the
Company.
1.11.14. Unrealized gains / (losses) on securities available for sale
2013. 2012.
RSD (000) RSD (000)
Unrealized gains on securities
available for sale 21.511 20
Unrealized losses on securities
available for sale -36 -36
In total 21.475 16
Unrealized income from securities available for sale been increased for a RSD 21.491 thousand, because
the revaluation of the shares of Alfa Plam ad Vranje at Jubmes Bank ad Beograd, AIK banka ad Nis, Dunav
Banka ad Beograd and department stores Niksic.
1.11.15. Retained earning
Retained earning refers to:
2013. 2012.
RSD (000) RSD (000)
Retained earning from previous
years 3.195.413 2.159.357
Retained earing for the financial
year 392.217 1.036.056
In total 3.587.630 3.195.413
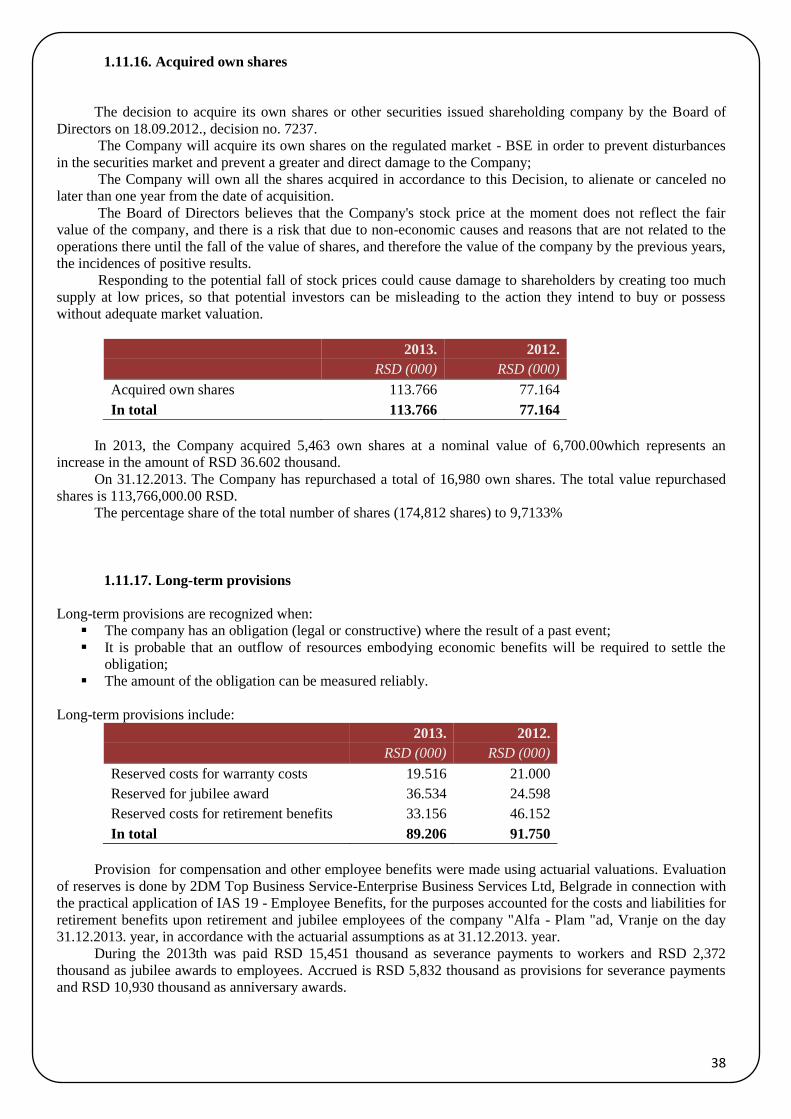
38
1.11.16. Acquired own shares
The decision to acquire its own shares or other securities issued shareholding company by the Board of
Directors on 18.09.2012., decision no. 7237.
The Company will acquire its own shares on the regulated market - BSE in order to prevent disturbances
in the securities market and prevent a greater and direct damage to the Company;
The Company will own all the shares acquired in accordance to this Decision, to alienate or canceled no
later than one year from the date of acquisition.
The Board of Directors believes that the Company's stock price at the moment does not reflect the fair
value of the company, and there is a risk that due to non-economic causes and reasons that are not related to the
operations there until the fall of the value of shares, and therefore the value of the company by the previous years,
the incidences of positive results.
Responding to the potential fall of stock prices could cause damage to shareholders by creating too much
supply at low prices, so that potential investors can be misleading to the action they intend to buy or possess
without adequate market valuation.
2013. 2012.
RSD (000) RSD (000)
Acquired own shares 113.766 77.164
In total 113.766 77.164
In 2013, the Company acquired 5,463 own shares at a nominal value of 6,700.00which represents an
increase in the amount of RSD 36.602 thousand.
On 31.12.2013. The Company has repurchased a total of 16,980 own shares. The total value repurchased
shares is 113,766,000.00 RSD.
The percentage share of the total number of shares (174,812 shares) to 9,7133%
1.11.17. Long-term provisions
Long-term provisions are recognized when:
The company has an obligation (legal or constructive) where the result of a past event;
It is probable that an outflow of resources embodying economic benefits will be required to settle the
obligation;
The amount of the obligation can be measured reliably.
Long-term provisions include:
2013. 2012.
RSD (000) RSD (000)
Reserved costs for warranty costs 19.516 21.000
Reserved for jubilee award 36.534 24.598
Reserved costs for retirement benefits 33.156 46.152
In total 89.206 91.750
Provision for compensation and other employee benefits were made using actuarial valuations. Evaluation
of reserves is done by 2DM Top Business Service-Enterprise Business Services Ltd, Belgrade in connection with
the practical application of IAS 19 - Employee Benefits, for the purposes accounted for the costs and liabilities for
retirement benefits upon retirement and jubilee employees of the company "Alfa - Plam "ad, Vranje on the day
31.12.2013. year, in accordance with the actuarial assumptions as at 31.12.2013. year.
During the 2013th was paid RSD 15,451 thousand as severance payments to workers and RSD 2,372
thousand as jubilee awards to employees. Accrued is RSD 5,832 thousand as provisions for severance payments
and RSD 10,930 thousand as anniversary awards.
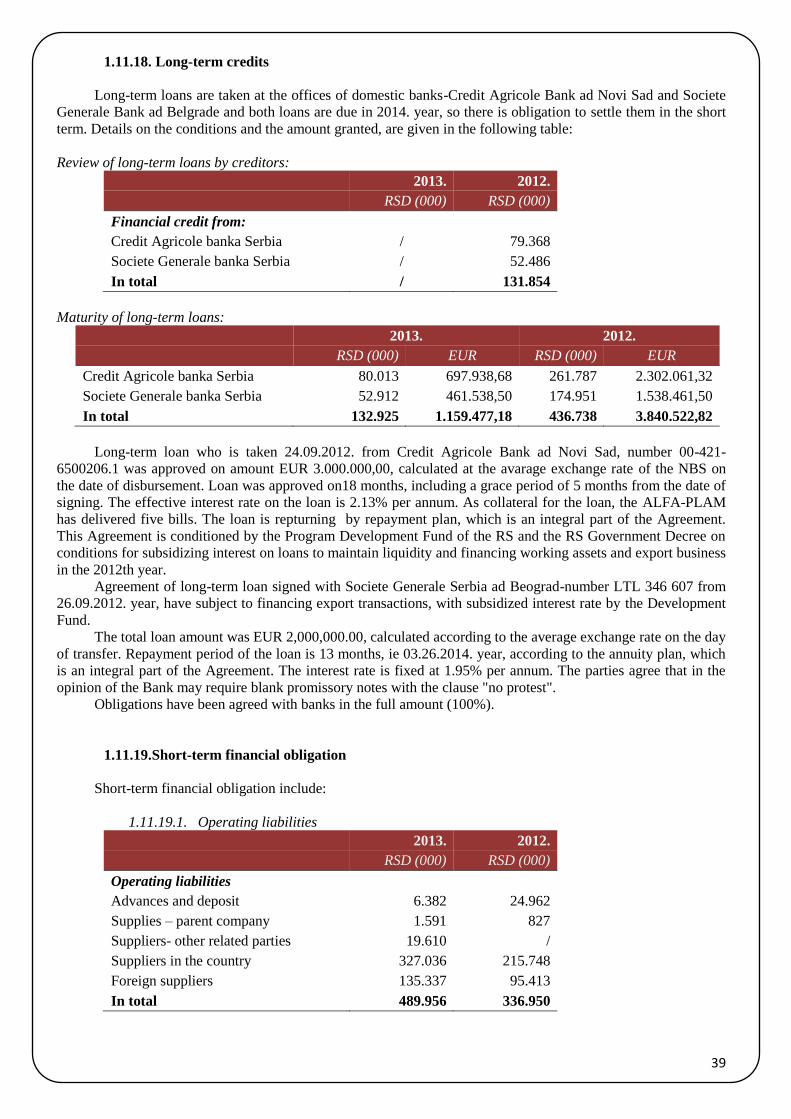
39
1.11.18. Long-term credits
Long-term loans are taken at the offices of domestic banks-Credit Agricole Bank ad Novi Sad and Societe
Generale Bank ad Belgrade and both loans are due in 2014. year, so there is obligation to settle them in the short
term. Details on the conditions and the amount granted, are given in the following table:
Review of long-term loans by creditors:
2013. 2012.
RSD (000) RSD (000)
Financial credit from:
Credit Agricole banka Serbia / 79.368
Societe Generale banka Serbia / 52.486
In total / 131.854
Maturity of long-term loans:
2013. 2012.
RSD (000) EUR RSD (000) EUR
Credit Agricole banka Serbia 80.013 697.938,68 261.787 2.302.061,32
Societe Generale banka Serbia 52.912 461.538,50 174.951 1.538.461,50
In total 132.925 1.159.477,18 436.738 3.840.522,82
Long-term loan who is taken 24.09.2012. from Credit Agricole Bank ad Novi Sad, number 00-421-
6500206.1 was approved on amount EUR 3.000.000,00, calculated at the avarage exchange rate of the NBS on
the date of disbursement. Loan was approved on18 months, including a grace period of 5 months from the date of
signing. The effective interest rate on the loan is 2.13% per annum. As collateral for the loan, the ALFA-PLAM
has delivered five bills. The loan is repturning by repayment plan, which is an integral part of the Agreement. This Agreement is conditioned by the Program Development Fund of the RS and the RS Government Decree on
conditions for subsidizing interest on loans to maintain liquidity and financing working assets and export business
in the 2012th year.
Agreement of long-term loan signed with Societe Generale Serbia ad Beograd-number LTL 346 607 from
26.09.2012. year, have subject to financing export transactions, with subsidized interest rate by the Development
Fund.
The total loan amount was EUR 2,000,000.00, calculated according to the average exchange rate on the day
of transfer. Repayment period of the loan is 13 months, ie 03.26.2014. year, according to the annuity plan, which
is an integral part of the Agreement. The interest rate is fixed at 1.95% per annum. The parties agree that in the
opinion of the Bank may require blank promissory notes with the clause "no protest".
Obligations have been agreed with banks in the full amount (100%).
1.11.19. Short-term financial obligation
Short-term financial obligation include:
1.11.19.1. Operating liabilities
2013. 2012.
RSD (000) RSD (000)
Operating liabilities
Advances and deposit 6.382 24.962
Supplies – parent company 1.591 827
Suppliers- other related parties 19.610 /
Suppliers in the country 327.036 215.748
Foreign suppliers 135.337 95.413
In total 489.956 336.950
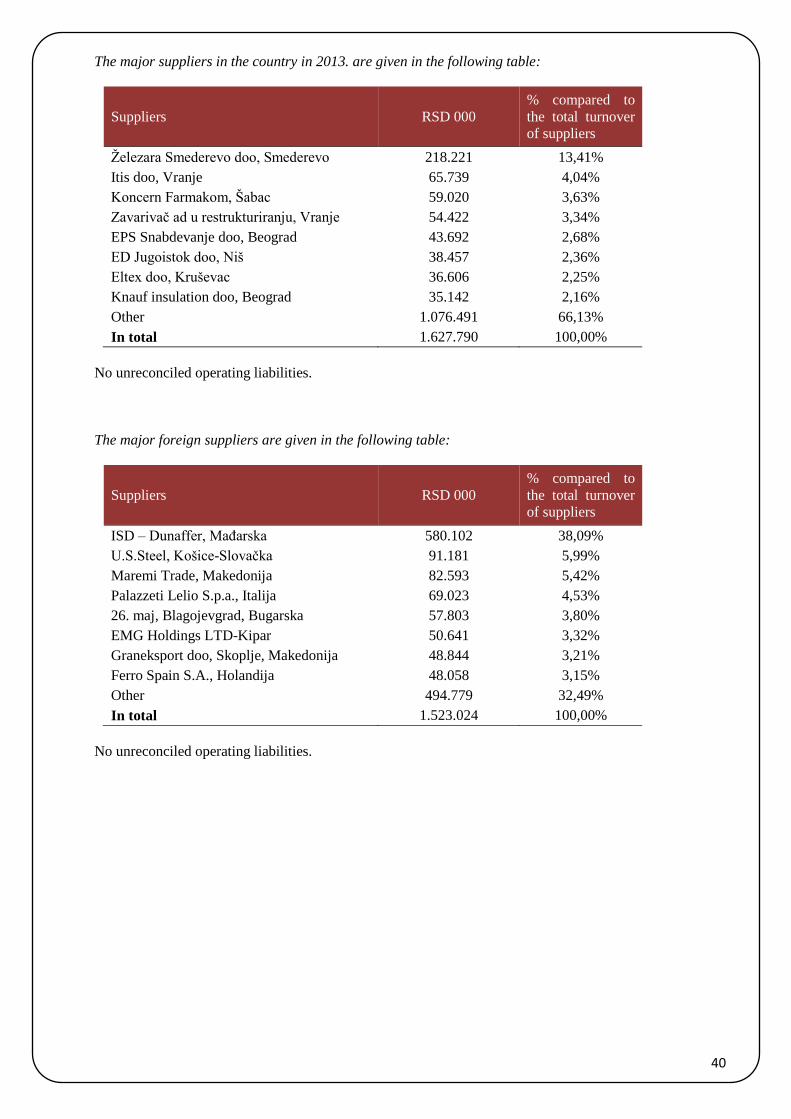
40
The major suppliers in the country in 2013. are given in the following table:
Suppliers RSD 000
% compared to
the total turnover
of suppliers
Železara Smederevo doo, Smederevo 218.221 13,41%
Itis doo, Vranje 65.739 4,04%
Koncern Farmakom, Šabac 59.020 3,63%
Zavarivač ad u restrukturiranju, Vranje 54.422 3,34%
EPS Snabdevanje doo, Beograd 43.692 2,68%
ED Jugoistok doo, Niš 38.457 2,36%
Eltex doo, Kruševac 36.606 2,25%
Knauf insulation doo, Beograd 35.142 2,16%
Other 1.076.491 66,13%
In total 1.627.790 100,00%
No unreconciled operating liabilities.
The major foreign suppliers are given in the following table:
Suppliers RSD 000
% compared to
the total turnover
of suppliers
ISD – Dunaffer, Mađarska 580.102 38,09%
U.S.Steel, Košice-Slovačka 91.181 5,99%
Maremi Trade, Makedonija 82.593 5,42%
Palazzeti Lelio S.p.a., Italija 69.023 4,53%
26. maj, Blagojevgrad, Bugarska 57.803 3,80%
EMG Holdings LTD-Kipar 50.641 3,32%
Graneksport doo, Skoplje, Makedonija 48.844 3,21%
Ferro Spain S.A., Holandija 48.058 3,15%
Other 494.779 32,49%
In total 1.523.024 100,00%
No unreconciled operating liabilities.
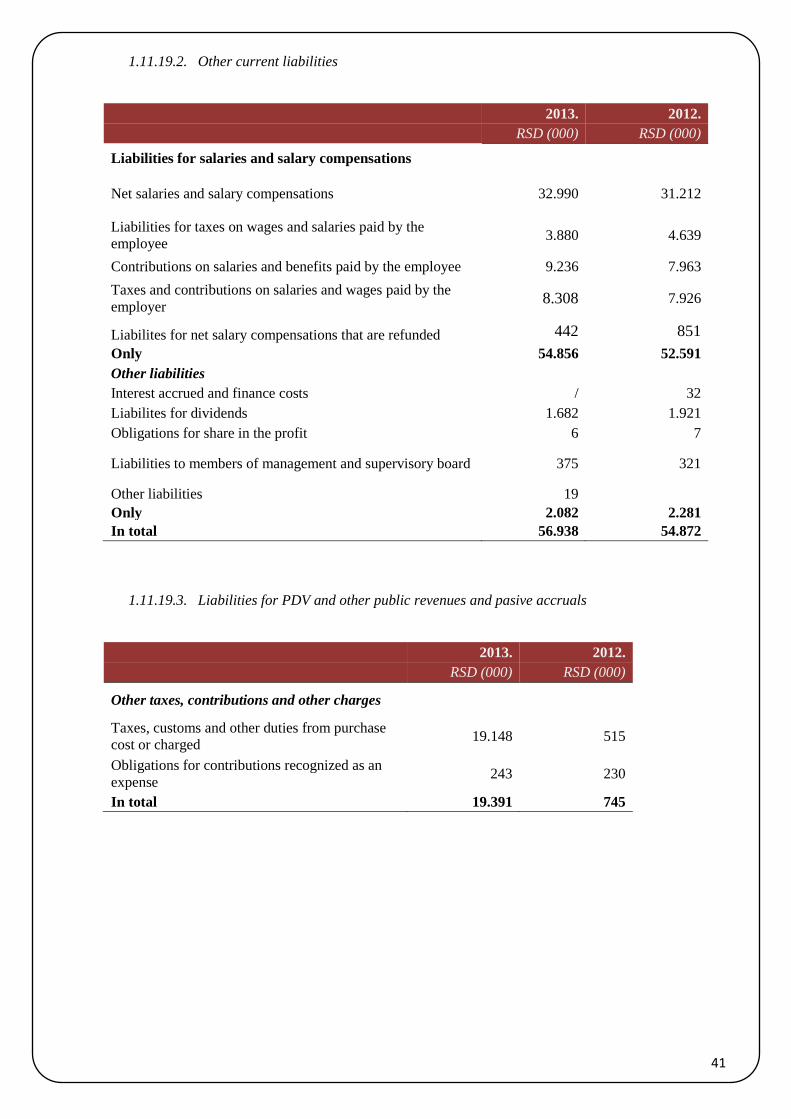
41
1.11.19.2. Other current liabilities
2013. 2012.
RSD (000) RSD (000)
Liabilities for salaries and salary compensations
Net salaries and salary compensations 32.990 31.212
Liabilities for taxes on wages and salaries paid by the
employee 3.880 4.639
Contributions on salaries and benefits paid by the employee 9.236 7.963
Taxes and contributions on salaries and wages paid by the
employer 8.308 7.926
Liabilites for net salary compensations that are refunded 442 851
Only 54.856 52.591
Other liabilities
Interest accrued and finance costs / 32
Liabilites for dividends 1.682 1.921
Obligations for share in the profit 6 7
Liabilities to members of management and supervisory board 375 321
Other liabilities 19
Only 2.082 2.281
In total 56.938 54.872
1.11.19.3. Liabilities for PDV and other public revenues and pasive accruals
2013. 2012.
RSD (000) RSD (000)
Other taxes, contributions and other charges
Taxes, customs and other duties from purchase
cost or charged 19.148 515
Obligations for contributions recognized as an
expense 243 230
In total 19.391 745
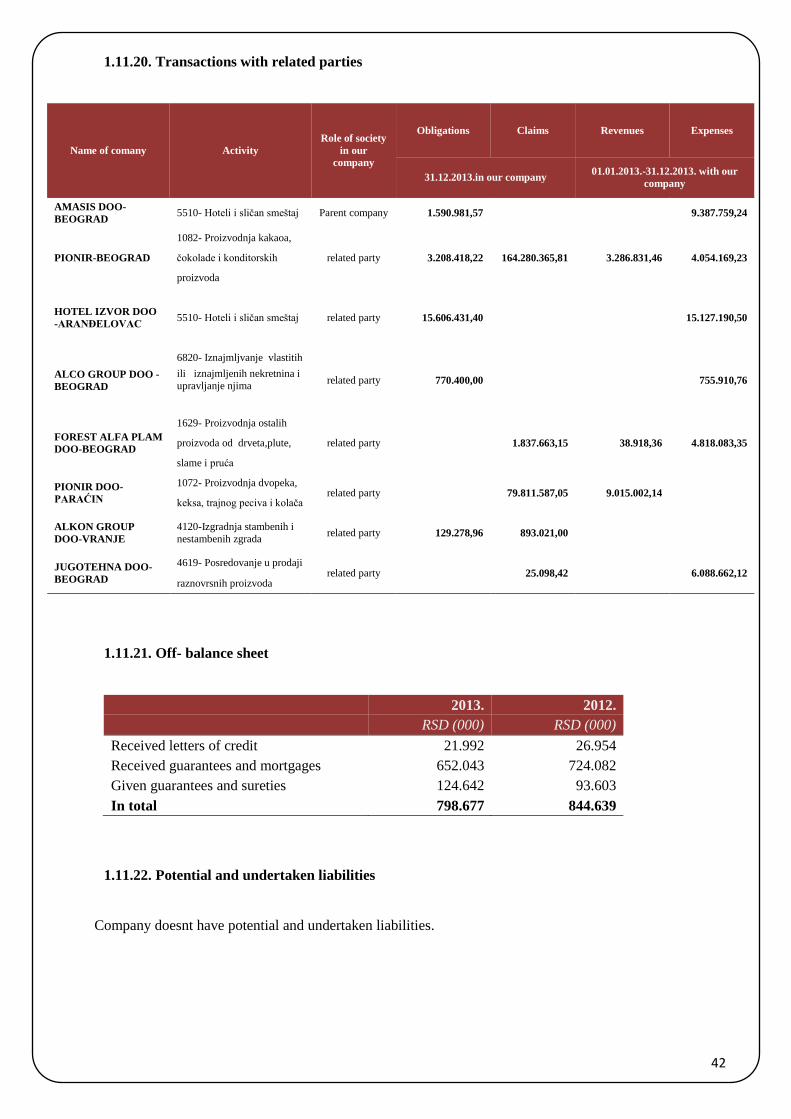
42
1.11.20. Transactions with related parties
Name of comany Activity
Role of society
in our
company
Obligations Claims Revenues Expenses
31.12.2013.in our company 01.01.2013.-31.12.2013. with our
company
AMASIS DOO-
BEOGRAD 5510- Hoteli i sličan smeštaj Parent company 1.590.981,57 9.387.759,24
PIONIR-BEOGRAD
1082- Proizvodnja kakaoa,
related party 3.208.418,22 164.280.365,81 3.286.831,46 4.054.169,23 čokolade i konditorskih
proizvoda
HOTEL IZVOR DOO
-ARANĐELOVAC 5510- Hoteli i sličan smeštaj related party 15.606.431,40
15.127.190,50
ALCO GROUP DOO -
BEOGRAD
6820- Iznajmljvanje vlastitih
related party 770.400,00
755.910,76 ili iznajmljenih nekretnina i
upravljanje njima
FOREST ALFA PLAM
DOO-BEOGRAD
1629- Proizvodnja ostalih
related party
1.837.663,15 38.918,36 4.818.083,35 proizvoda od drveta,plute,
slame i pruća
PIONIR DOO-
PARAĆIN
1072- Proizvodnja dvopeka, related party
79.811.587,05 9.015.002,14
keksa, trajnog peciva i kolača
ALKON GROUP
DOO-VRANJE
4120-Izgradnja stambenih i
nestambenih zgrada related party 129.278,96 893.021,00
JUGOTEHNA DOO-
BEOGRAD
4619- Posredovanje u prodaji related party
25.098,42
6.088.662,12
raznovrsnih proizvoda
1.11.21. Off- balance sheet
2013. 2012.
RSD (000) RSD (000)
Received letters of credit 21.992 26.954
Received guarantees and mortgages 652.043 724.082
Given guarantees and sureties 124.642 93.603
In total 798.677 844.639
1.11.22. Potential and undertaken liabilities
Company doesnt have potential and undertaken liabilities.
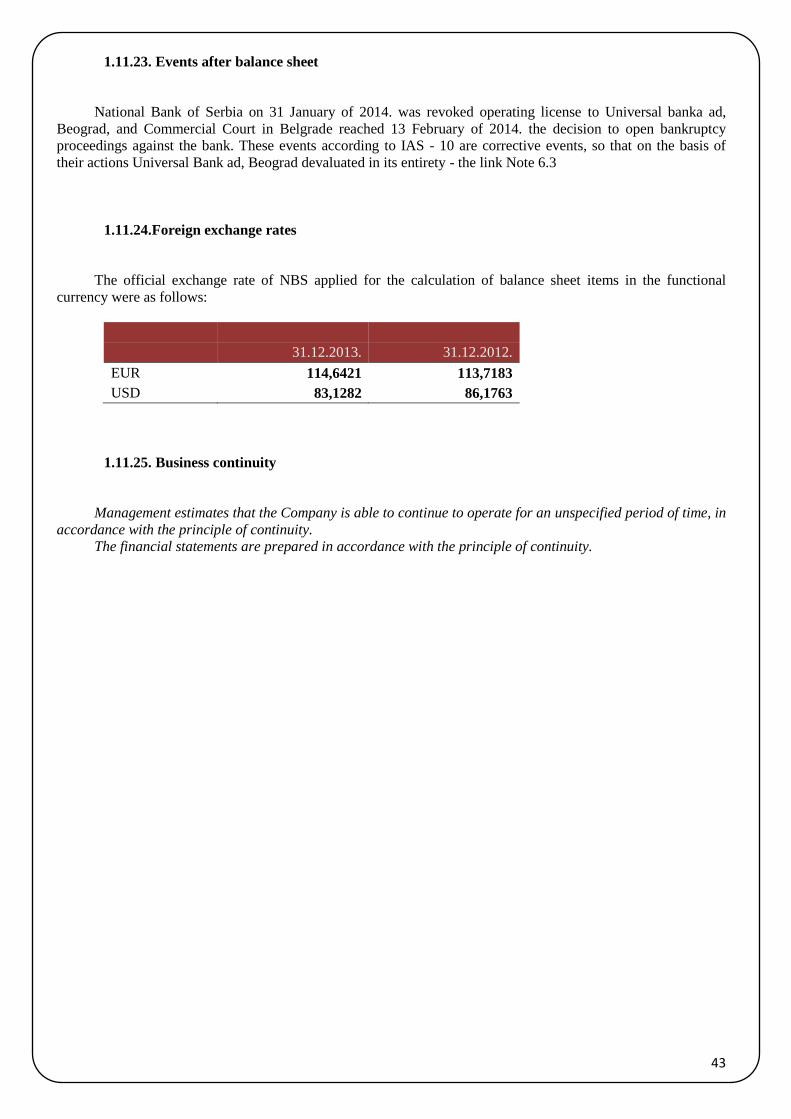
43
1.11.23. Events after balance sheet
National Bank of Serbia on 31 January of 2014. was revoked operating license to Universal banka ad,
Beograd, and Commercial Court in Belgrade reached 13 February of 2014. the decision to open bankruptcy
proceedings against the bank. These events according to IAS - 10 are corrective events, so that on the basis of
their actions Universal Bank ad, Beograd devaluated in its entirety - the link Note 6.3
1.11.24. Foreign exchange rates
The official exchange rate of NBS applied for the calculation of balance sheet items in the functional
currency were as follows:
31.12.2013. 31.12.2012.
EUR 114,6421 113,7183
USD 83,1282 86,1763
1.11.25. Business continuity
Management estimates that the Company is able to continue to operate for an unspecified period of time, in
accordance with the principle of continuity.
The financial statements are prepared in accordance with the principle of continuity.

44
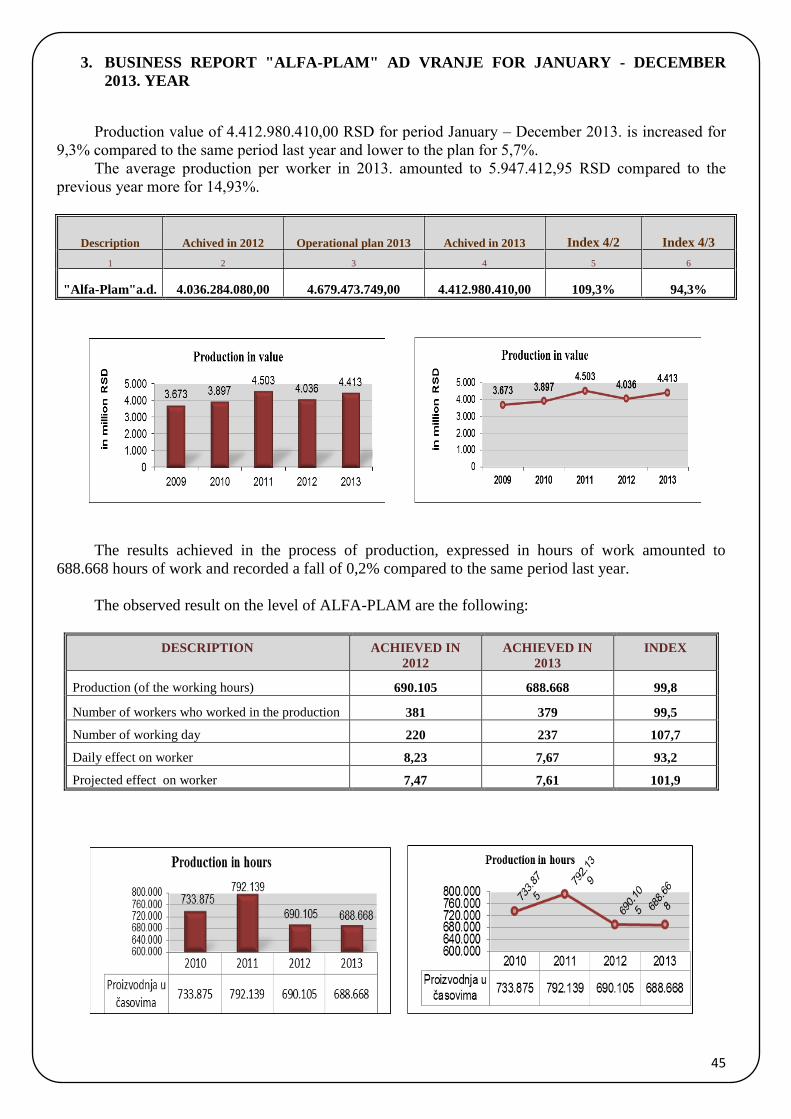
45
3. BUSINESS REPORT "ALFA-PLAM" AD VRANJE FOR JANUARY - DECEMBER
2013. YEAR
Production value of 4.412.980.410,00 RSD for period January – December 2013. is increased for
9,3% compared to the same period last year and lower to the plan for 5,7%.
The average production per worker in 2013. amounted to 5.947.412,95 RSD compared to the
previous year more for 14,93%.
Description Achived in 2012 Operational plan 2013 Achived in 2013 Index 4/2 Index 4/3 1 2 3 4 5 6
"Alfa-Plam"a.d. 4.036.284.080,00 4.679.473.749,00 4.412.980.410,00 109,3% 94,3%
The results achieved in the process of production, expressed in hours of work amounted to
688.668 hours of work and recorded a fall of 0,2% compared to the same period last year.
The observed result on the level of ALFA-PLAM are the following:
DESCRIPTION
ACHIEVED IN
2012
ACHIEVED IN
2013
INDEX
Production (of the working hours) 690.105 688.668 99,8
Number of workers who worked in the production 381 379 99,5
Number of working day 220 237 107,7
Daily effect on worker 8,23 7,67 93,2
Projected effect on worker 7,47 7,61 101,9
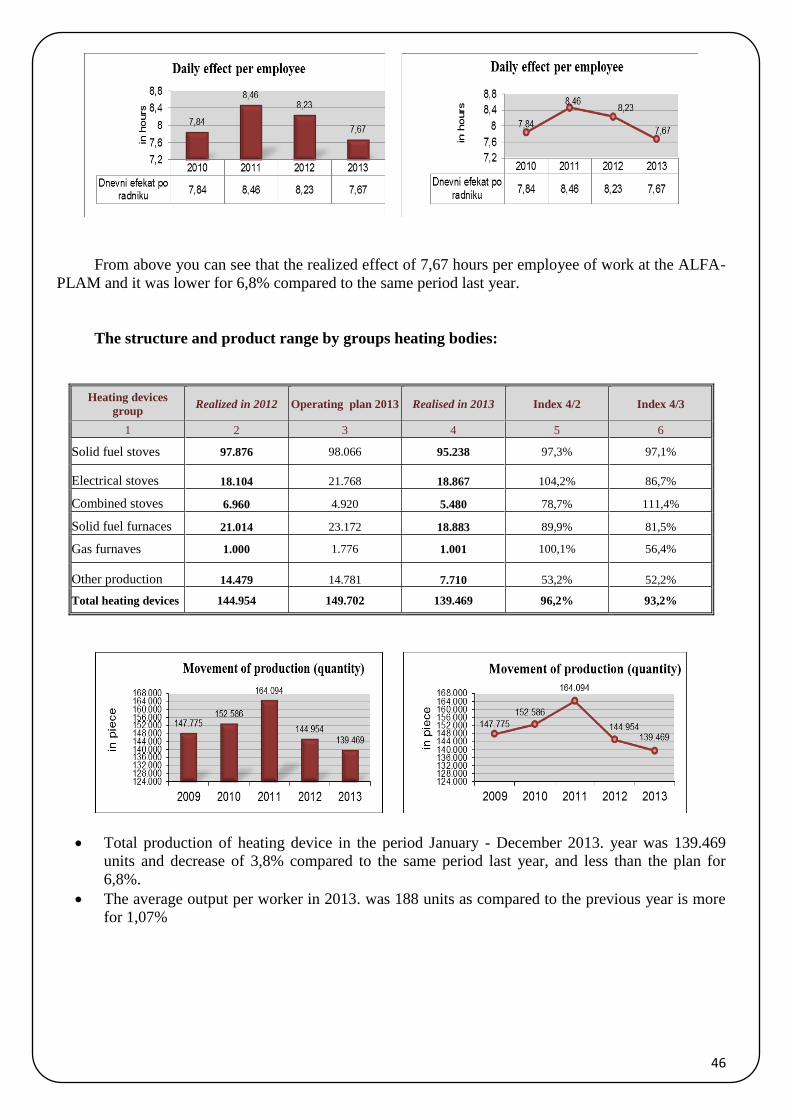
46
From above you can see that the realized effect of 7,67 hours per employee of work at the ALFA-
PLAM and it was lower for 6,8% compared to the same period last year.
The structure and product range by groups heating bodies:
Heating devices
group Realized in 2012 Operating plan 2013 Realised in 2013 Index 4/2 Index 4/3
1 2 3 4 5 6
Solid fuel stoves 97.876 98.066 95.238 97,3% 97,1%
Electrical stoves 18.104 21.768 18.867 104,2% 86,7%
Combined stoves 6.960 4.920 5.480 78,7% 111,4%
Solid fuel furnaces 21.014 23.172 18.883 89,9% 81,5%
Gas furnaves 1.000 1.776 1.001 100,1% 56,4%
Other production 14.479 14.781 7.710 53,2% 52,2%
Total heating devices 144.954 149.702 139.469 96,2% 93,2%
Total production of heating device in the period January - December 2013. year was 139.469
units and decrease of 3,8% compared to the same period last year, and less than the plan for
6,8%.
The average output per worker in 2013. was 188 units as compared to the previous year is more
for 1,07%

47
3.1. ACHIEVED REALIZATION
In the period from January - December 2013. the planned realization was 4.448.842.311,00 RSD,
and it was achived 4.172.553.819,80 RSD and it less for 1,6% in the same period last year, and
compared to the plan less for 6,2%.
The average realization per employee in the 2013. amounted to 5.623.387,90 RSD, and compared
with the previous year its more 3,41% .
Description Achieved in 2012 Operational plan
2013 Achieved in 2013 Index 4/2 Index 4/3 1 2 3 4 5 6
"Alfa-Plam" ad 4.241.710.367,00 4.448.842.311,00 4.172.553.819,80 98,4% 93,8%
Achieved realization through physical volume is as follows:
Heating devices
group Realized in 2012 Operating plan 2013 Realized in 2013 Index 4/2 Index 4/3
1 2 3 4 5 6
Heating devices group 103.997 100.454 93.771 90,2% 93,3%
Solid fuel stoves 17.146 19.527 18.543 108,1% 95,0%
Combined stoves 6.127 5.520 6.132 100,1% 111,1%
Solid fuel furnaces 21.833 20.752 20.945 95,9% 100,9%
Heating oil furnaces 2 0,0%
Gas furnaces 1.730 1.308 1.516 87,6% 115,9%
Other production 11.523 5.600 9.222 80,0% 164,7%
Total heating devices 150.835 147.561 140.907 93,4% 95,5%
The average realization in 2013. per employee was 190 units which is less for 1,55% compared to
the last year.
In 2013. realized a total of 140.907 units heating device, which in the foreign market 83.753 units,
or 59,44% of total sales, and it is for 2,12% more than in the 2012. year.
In the period from January - December 2013. exported goods in valued at EUR 21.869.815,12,
which is 4,75% more than in the same period last year.
In the domestic market were 57.154 units or 40,56% of total sales, which is 16,95% less than in
the 2012 year.
In the period from January - December 2013. in the domestic market were sold goods in the
amount of 1.506.293.081 RSD, which is 15,3% less than in the same period last year.
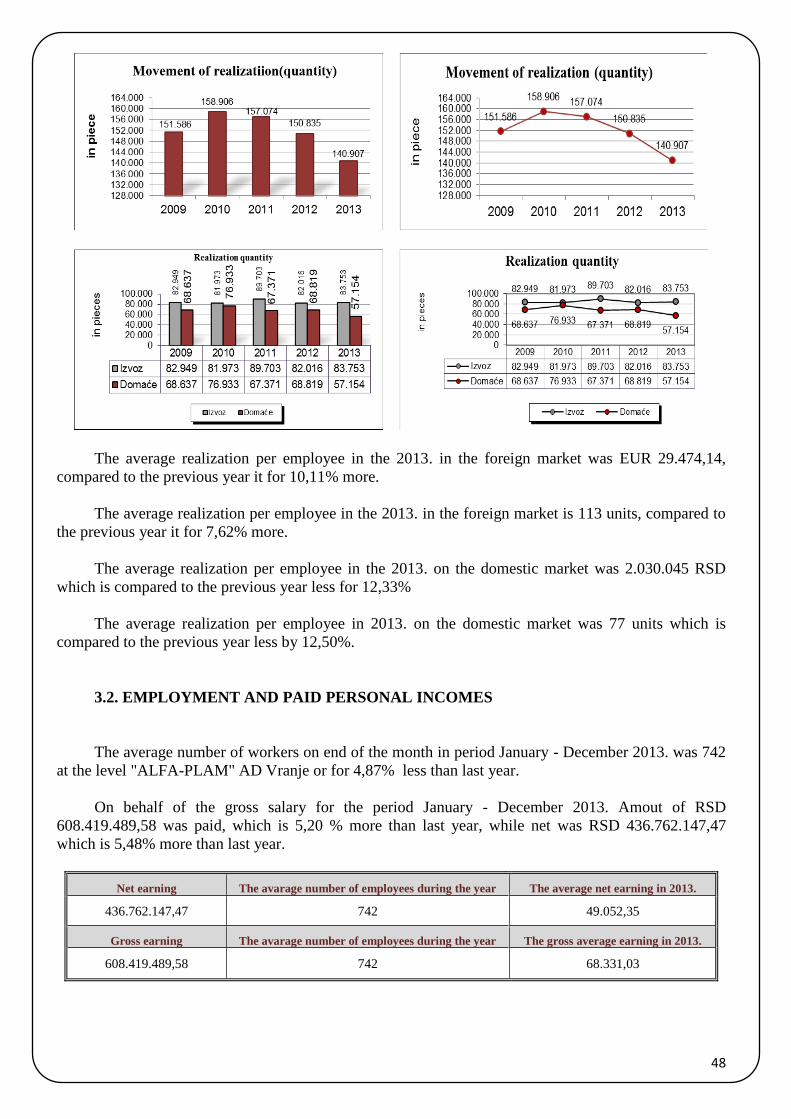
48
The average realization per employee in the 2013. in the foreign market was EUR 29.474,14,
compared to the previous year it for 10,11% more.
The average realization per employee in the 2013. in the foreign market is 113 units, compared to
the previous year it for 7,62% more.
The average realization per employee in the 2013. on the domestic market was 2.030.045 RSD
which is compared to the previous year less for 12,33%
The average realization per employee in 2013. on the domestic market was 77 units which is
compared to the previous year less by 12,50%.
3.2. EMPLOYMENT AND PAID PERSONAL INCOMES
The average number of workers on end of the month in period January - December 2013. was 742
at the level "ALFA-PLAM" AD Vranje or for 4,87% less than last year.
On behalf of the gross salary for the period January - December 2013. Amout of RSD
608.419.489,58 was paid, which is 5,20 % more than last year, while net was RSD 436.762.147,47
which is 5,48% more than last year.
Net earning The avarage number of employees during the year The average net earning in 2013. 436.762.147,47 742 49.052,35 Gross earning The avarage number of employees during the year The gross average earning in 2013.
608.419.489,58 742 68.331,03
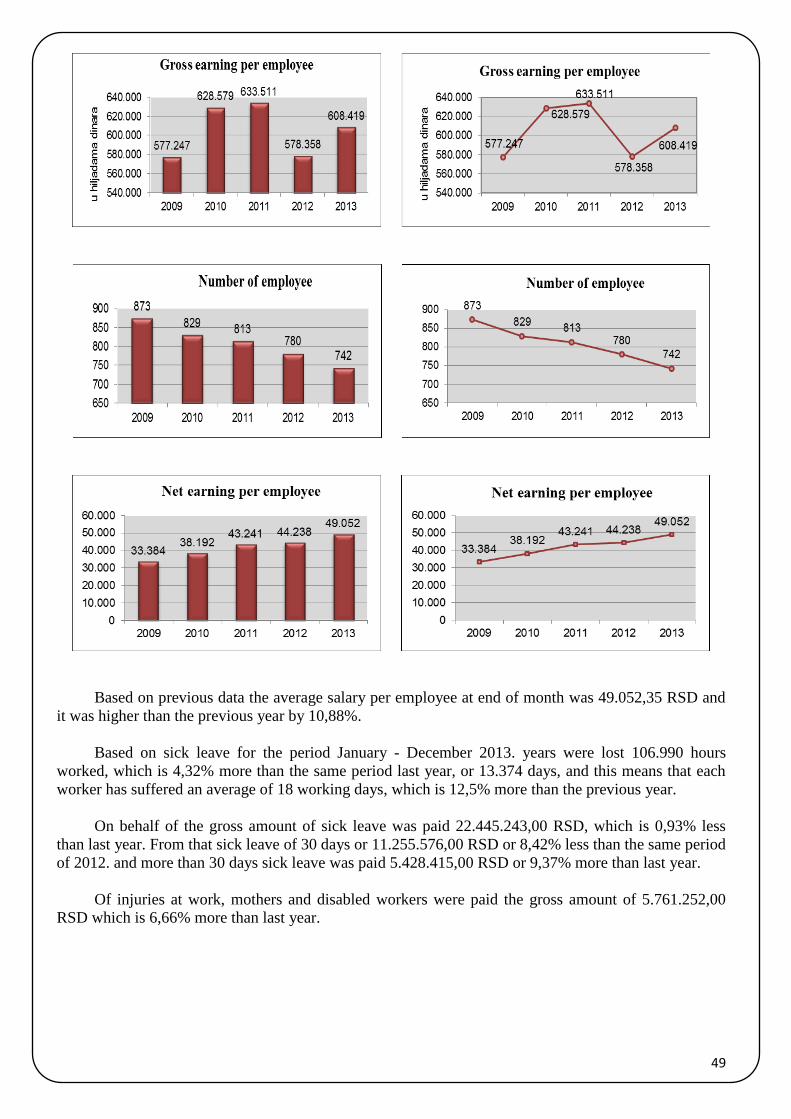
49
Based on previous data the average salary per employee at end of month was 49.052,35 RSD and
it was higher than the previous year by 10,88%.
Based on sick leave for the period January - December 2013. years were lost 106.990 hours
worked, which is 4,32% more than the same period last year, or 13.374 days, and this means that each
worker has suffered an average of 18 working days, which is 12,5% more than the previous year.
On behalf of the gross amount of sick leave was paid 22.445.243,00 RSD, which is 0,93% less
than last year. From that sick leave of 30 days or 11.255.576,00 RSD or 8,42% less than the same period
of 2012. and more than 30 days sick leave was paid 5.428.415,00 RSD or 9,37% more than last year.
Of injuries at work, mothers and disabled workers were paid the gross amount of 5.761.252,00
RSD which is 6,66% more than last year.
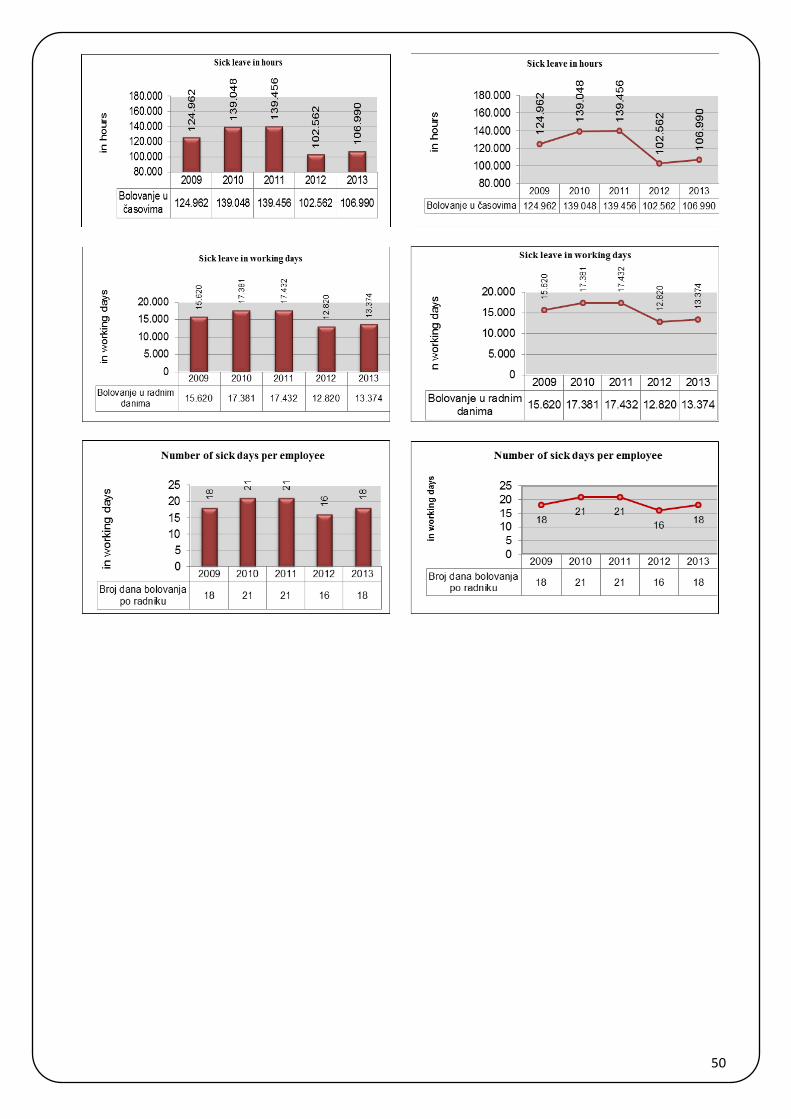
50
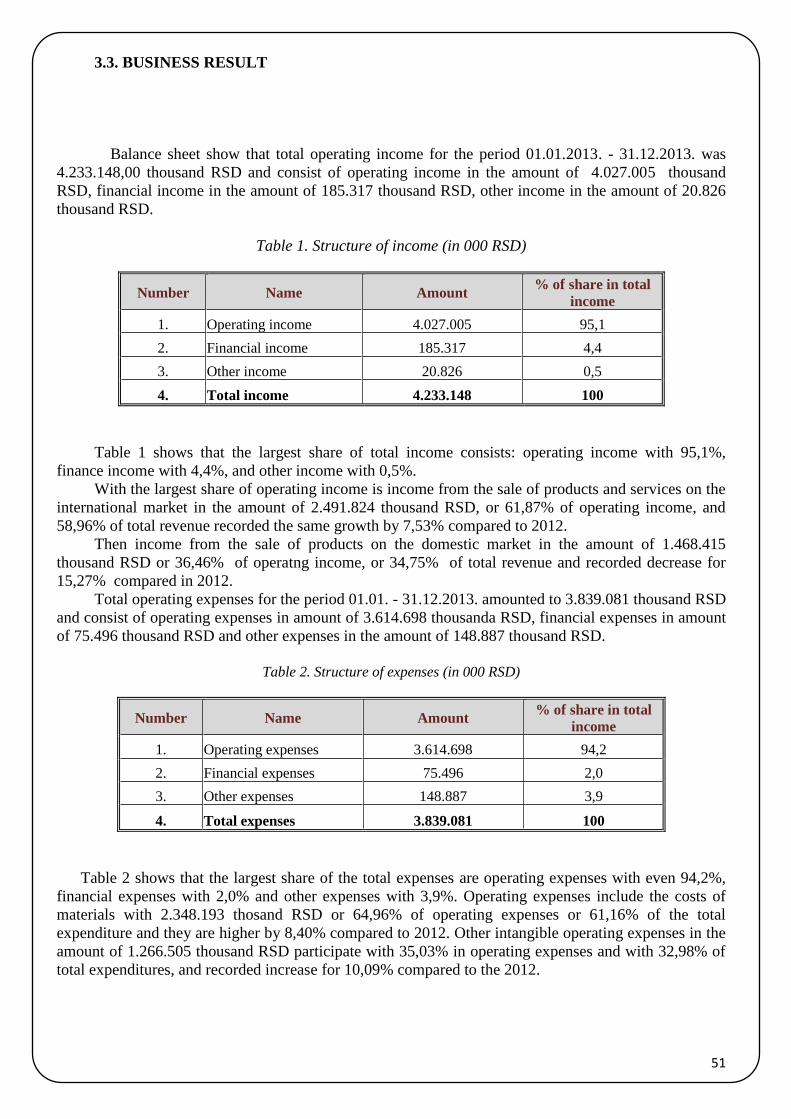
51
3.3. BUSINESS RESULT
Balance sheet show that total operating income for the period 01.01.2013. - 31.12.2013. was
4.233.148,00 thousand RSD and consist of operating income in the amount of 4.027.005 thousand
RSD, financial income in the amount of 185.317 thousand RSD, other income in the amount of 20.826
thousand RSD.
Table 1. Structure of income (in 000 RSD)
Number Name Amount % of share in total
income
1. Operating income 4.027.005 95,1
2. Financial income 185.317 4,4
3. Other income 20.826 0,5
4. Total income 4.233.148 100
Table 1 shows that the largest share of total income consists: operating income with 95,1%,
finance income with 4,4%, and other income with 0,5%.
With the largest share of operating income is income from the sale of products and services on the
international market in the amount of 2.491.824 thousand RSD, or 61,87% of operating income, and
58,96% of total revenue recorded the same growth by 7,53% compared to 2012.
Then income from the sale of products on the domestic market in the amount of 1.468.415
thousand RSD or 36,46% of operatng income, or 34,75% of total revenue and recorded decrease for
15,27% compared in 2012.
Total operating expenses for the period 01.01. - 31.12.2013. amounted to 3.839.081 thousand RSD
and consist of operating expenses in amount of 3.614.698 thousanda RSD, financial expenses in amount
of 75.496 thousand RSD and other expenses in the amount of 148.887 thousand RSD.
Table 2. Structure of expenses (in 000 RSD)
Number Name Amount % of share in total
income
1. Operating expenses 3.614.698 94,2
2. Financial expenses 75.496 2,0
3. Other expenses 148.887 3,9
4. Total expenses 3.839.081 100
Table 2 shows that the largest share of the total expenses are operating expenses with even 94,2%,
financial expenses with 2,0% and other expenses with 3,9%. Operating expenses include the costs of
materials with 2.348.193 thosand RSD or 64,96% of operating expenses or 61,16% of the total
expenditure and they are higher by 8,40% compared to 2012. Other intangible operating expenses in the
amount of 1.266.505 thousand RSD participate with 35,03% in operating expenses and with 32,98% of
total expenditures, and recorded increase for 10,09% compared to the 2012.
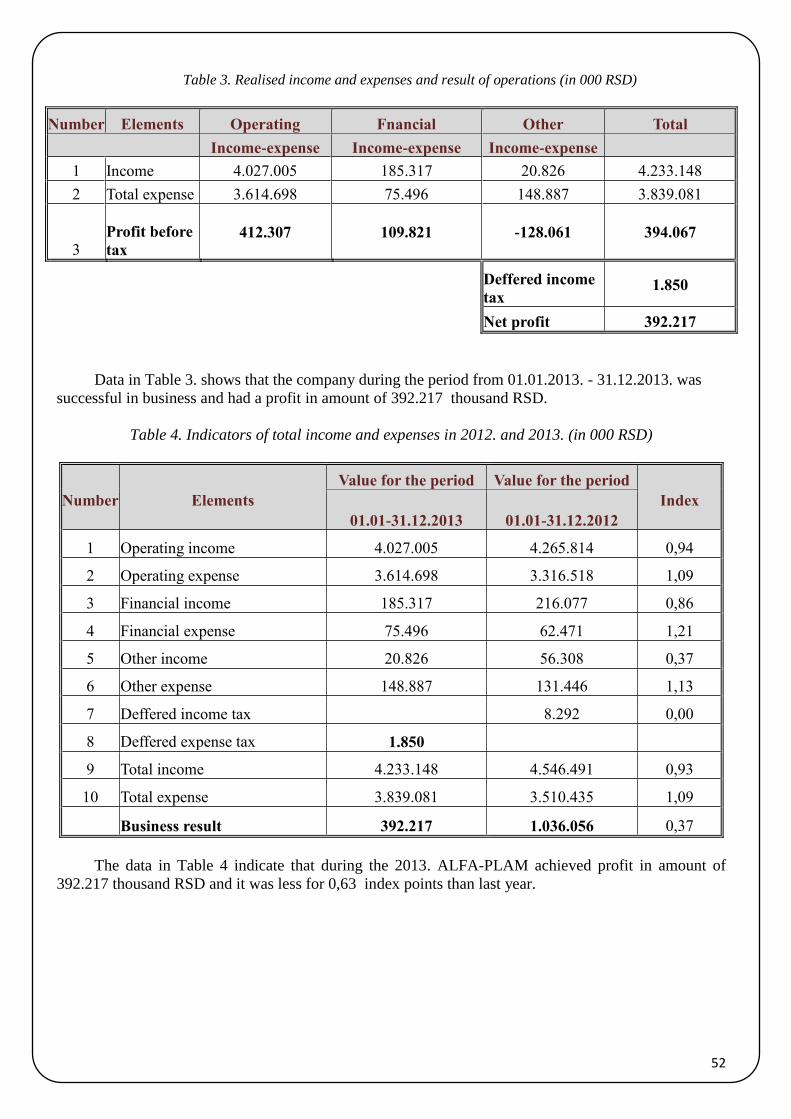
52
Table 3. Realised income and expenses and result of operations (in 000 RSD)
Number Elements Operating Fnancial Other Total
Income-expense Income-expense Income-expense
1 Income 4.027.005 185.317 20.826 4.233.148
2 Total expense 3.614.698 75.496 148.887 3.839.081
3 Profit before
tax 412.307 109.821 -128.061 394.067
Deffered income
tax 1.850
Net profit 392.217
Data in Table 3. shows that the company during the period from 01.01.2013. - 31.12.2013. was
successful in business and had a profit in amount of 392.217 thousand RSD.
Table 4. Indicators of total income and expenses in 2012. and 2013. (in 000 RSD)
Number Elements
Value for the period Value for the period
Index
01.01-31.12.2013 01.01-31.12.2012
1 Operating income 4.027.005 4.265.814 0,94
2 Operating expense 3.614.698 3.316.518 1,09
3 Financial income 185.317 216.077 0,86
4 Financial expense 75.496 62.471 1,21
5 Other income 20.826 56.308 0,37
6 Other expense 148.887 131.446 1,13
7 Deffered income tax 8.292 0,00
8 Deffered expense tax 1.850
9 Total income 4.233.148 4.546.491 0,93
10 Total expense 3.839.081 3.510.435 1,09
Business result 392.217 1.036.056 0,37
The data in Table 4 indicate that during the 2013. ALFA-PLAM achieved profit in amount of
392.217 thousand RSD and it was less for 0,63 index points than last year.
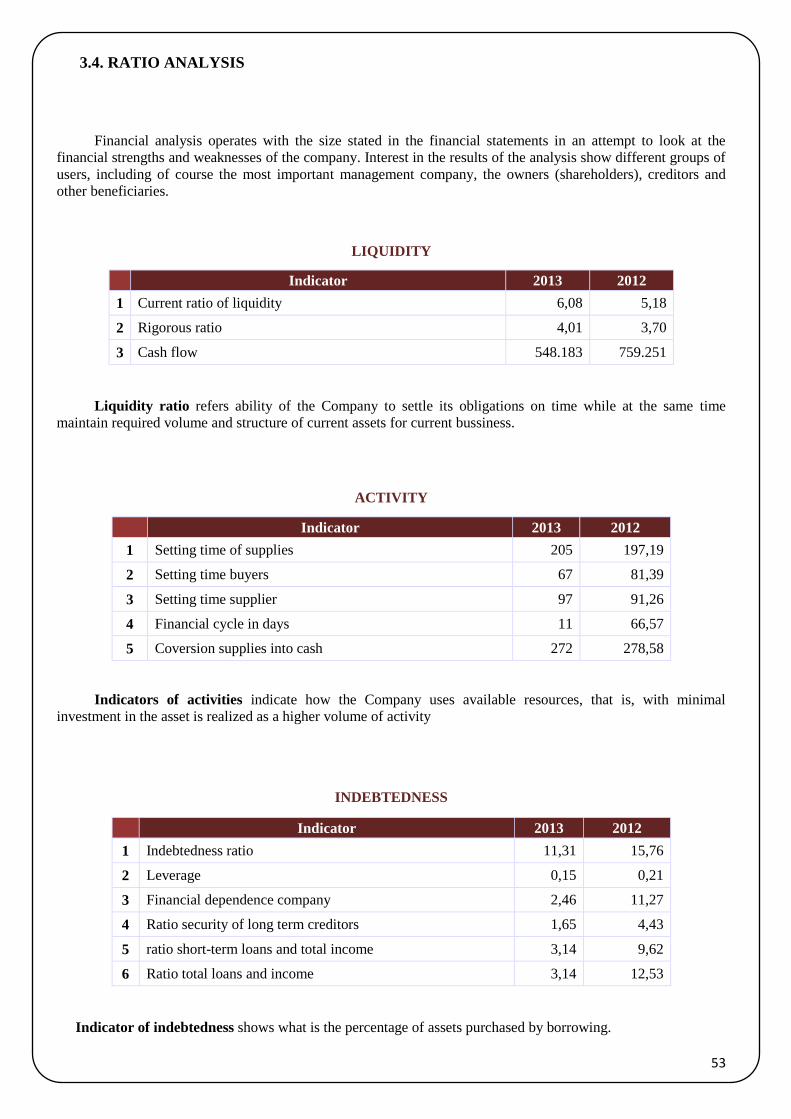
53
3.4. RATIO ANALYSIS
Financial analysis operates with the size stated in the financial statements in an attempt to look at the
financial strengths and weaknesses of the company. Interest in the results of the analysis show different groups of
users, including of course the most important management company, the owners (shareholders), creditors and
other beneficiaries.
LIQUIDITY
Indicator 2013 2012
1 Current ratio of liquidity 6,08 5,18
2 Rigorous ratio 4,01 3,70
3 Cash flow 548.183 759.251
Liquidity ratio refers ability of the Company to settle its obligations on time while at the same time
maintain required volume and structure of current assets for current bussiness.
ACTIVITY
Indicator 2013 2012
1 Setting time of supplies 205 197,19
2 Setting time buyers 67 81,39
3 Setting time supplier 97 91,26
4 Financial cycle in days 11 66,57
5 Coversion supplies into cash 272 278,58
Indicators of activities indicate how the Company uses available resources, that is, with minimal
investment in the asset is realized as a higher volume of activity
INDEBTEDNESS
Indicator 2013 2012
1 Indebtedness ratio 11,31 15,76
2 Leverage 0,15 0,21
3 Financial dependence company 2,46 11,27
4 Ratio security of long term creditors 1,65 4,43
5 ratio short-term loans and total income 3,14 9,62
6 Ratio total loans and income 3,14 12,53
Indicator of indebtedness shows what is the percentage of assets purchased by borrowing.
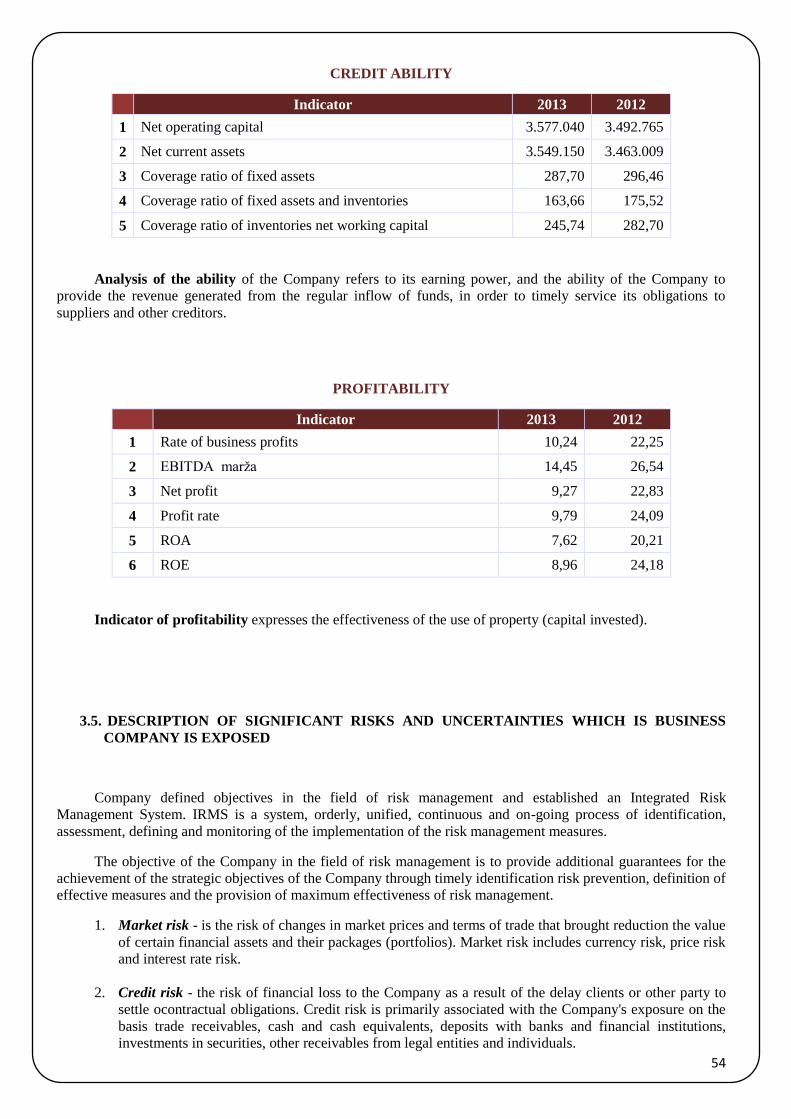
54
CREDIT ABILITY
Indicator 2013 2012
1 Net operating capital 3.577.040 3.492.765
2 Net current assets 3.549.150 3.463.009
3 Coverage ratio of fixed assets 287,70 296,46
4 Coverage ratio of fixed assets and inventories 163,66 175,52
5 Coverage ratio of inventories net working capital 245,74 282,70
Analysis of the ability of the Company refers to its earning power, and the ability of the Company to
provide the revenue generated from the regular inflow of funds, in order to timely service its obligations to
suppliers and other creditors.
PROFITABILITY
Indicator 2013 2012
1 Rate of business profits 10,24 22,25
2 EBITDA marža 14,45 26,54
3 Net profit 9,27 22,83
4 Profit rate 9,79 24,09
5 ROA 7,62 20,21
6 ROE 8,96 24,18
Indicator of profitability expresses the effectiveness of the use of property (capital invested).
3.5. DESCRIPTION OF SIGNIFICANT RISKS AND UNCERTAINTIES WHICH IS BUSINESS
COMPANY IS EXPOSED
Company defined objectives in the field of risk management and established an Integrated Risk
Management System. IRMS is a system, orderly, unified, continuous and on-going process of identification,
assessment, defining and monitoring of the implementation of the risk management measures.
The objective of the Company in the field of risk management is to provide additional guarantees for the
achievement of the strategic objectives of the Company through timely identification risk prevention, definition of
effective measures and the provision of maximum effectiveness of risk management.
1. Market risk - is the risk of changes in market prices and terms of trade that brought reduction the value
of certain financial assets and their packages (portfolios). Market risk includes currency risk, price risk
and interest rate risk.
2. Credit risk - the risk of financial loss to the Company as a result of the delay clients or other party to
settle ocontractual obligations. Credit risk is primarily associated with the Company's exposure on the
basis trade receivables, cash and cash equivalents, deposits with banks and financial institutions,
investments in securities, other receivables from legal entities and individuals.

55
3. Liquidity risk - is risk of negative effects on the financial result and capital of the Company due to the
inability of the Company to meet liabilities.
4. Operational risk - the risk of loss because of errors, interruptions or damages that may arise as a result
inadequate internal procedures, treatment of of persons, systems or external events, including the risk
of changes to the legal framework.
5. Risk reporting – refers to availability of information about the Company. All information about the
Company can be found on the official website www.alfaplam.rs, as well as on the Belgrade Stock
Exchange where the Company regularly submits reports of business.
6. Country risk and political risk - refers to the risk of investing in a particular country, depending on
changes in the business environment that may have a negative impact on the realization of profits or
asset values in that particular country.
7. Environmental risk - defined as the risk of potential damage that the company may suffer because of
environmental degradation by the company or by any other party if it can have an impact on its
business.
8. Risk conformity - can be defined as the risk of current income and capital of the company to be
exposed to losses resulting from violations or non-compliance with laws, rules, regulations, prescribed
business practices, internal policies and procedures, and ethical standards.
9. Reputational risk - the risk of loss of current or future earnings and capital because negative public
opinion about the way the business of the Company. It arises from the negative perceptions of their
partners, shareholders, investors or regulators that may adversely affect the Company's ability to
maintain existing, or establish new business relationships and continued access to funding sources.
Reputational risk includes the inability to sufficiently meet the needs and expectations of customers or
unreliable or inefficient delivery systems.
10. Other risks:
For the identification and assessment of risks to which the Company is or might be exposed shall be
applied:
Evaluation financial and business position of the Company;
Analysis of the external environment of the Company;
Business process analysis and critical control points in business processes;
Analysis relating to the marketing of new products / markets;
Regular Collegiums of the Board, as well as meetings at lower levels;
Reporting to the Company on the activities carried out for the company's own portfolio;
Reports of the internal auditor;
Reports functions compliance with the relevant regulations;
Other internal records and reports (profitability analysis, analysis of operational efficiency, analysis
of growth potential, analysis of financial structures, DuPont system of analysis).
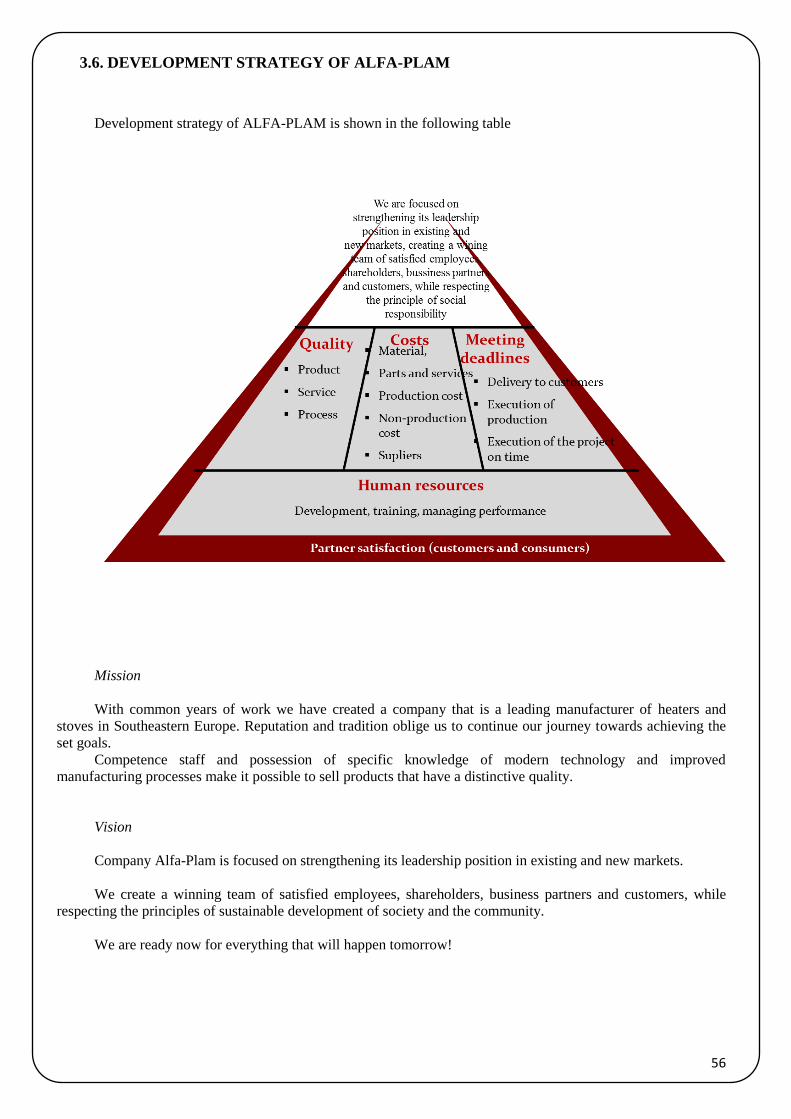
56
3.6. DEVELOPMENT STRATEGY OF ALFA-PLAM
Development strategy of ALFA-PLAM is shown in the following table
Mission
With common years of work we have created a company that is a leading manufacturer of heaters and
stoves in Southeastern Europe. Reputation and tradition oblige us to continue our journey towards achieving the
set goals.
Competence staff and possession of specific knowledge of modern technology and improved
manufacturing processes make it possible to sell products that have a distinctive quality.
Vision
Company Alfa-Plam is focused on strengthening its leadership position in existing and new markets.
We create a winning team of satisfied employees, shareholders, business partners and customers, while
respecting the principles of sustainable development of society and the community.
We are ready now for everything that will happen tomorrow!
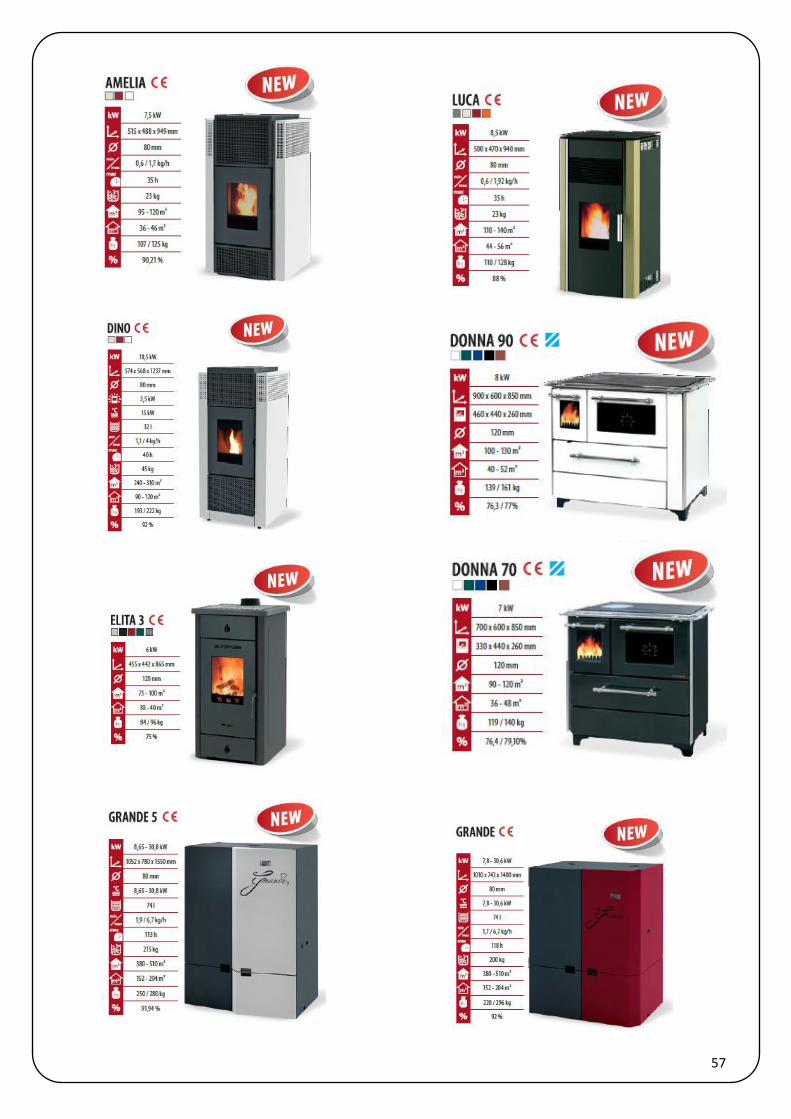
57
58
3.7. INFORMATION ABOUT THE ACQUIRED OWN SHARES
At the date of this Report, the Company has a total of 16,980 shares, which as of
31.12.2013. the year was 9.7133% of total shares. Own shares acquired by the decision
of the Board of Directors on 18.09.2012. year.
The decision was taken in order to protect the interests of shareholders, ensuring
the implementation of development plans of the Company and preventing the immediate
and significant damage to the Company.
3.8. MAJOR TRANSACTIONS WITH RELATED PARTIES
In thousand RSD
STRUCTURE FROM INCOME AND EXPENSES FROM RELATED PARTIES
Partner Note Income in 2013. Expense in 2013.
AMASIS DOO -BEOGRAD
Parent leal
entity
9.388
PIONIR - BEOGRAD Related party 3.287 4.054
HOTEL IZVOR DOO - ARANĐELOVAC Related party
15.127
ALCO GROUP DOO - BEOGRAD Related party
756
FOREST ALFA PLAM DOO - BEOGRAD Related party 39 4.818
PIONIR DOO - PARAĆIN Related party 9.015
ALKON GROUP DOO - VRANJE Related party
JUGOTEHNA DOO - BEOGRAD Related party 6.089
TOTAL
12.341 40.232
In thousand RSD
STRUCTURE OF RECEIVABLES AND LIABILITES FROM RELATED PARTIES
Partner Note Receivables in 2013. Liabilities in 2013.
AMASIS DOO -BEOGRAD
Parent leal
entity
1.591
PIONIR - BEOGRAD Related party 164.280 3.208
HOTEL IZVOR DOO - ARANĐELOVAC Related party
15.606
ALCO GROUP DOO - BEOGRAD Related party
770
FOREST ALFA PLAM DOO - BEOGRAD Related party 1.838
PIONIR DOO - PARAĆIN Related party 79.812
ALKON GROUP DOO - VRANJE Related party 893 129
JUGOTEHNA DOO - BEOGRAD Related party 25
TOTAL
246.848 21.304

59

60
61
62
63

64
65
66
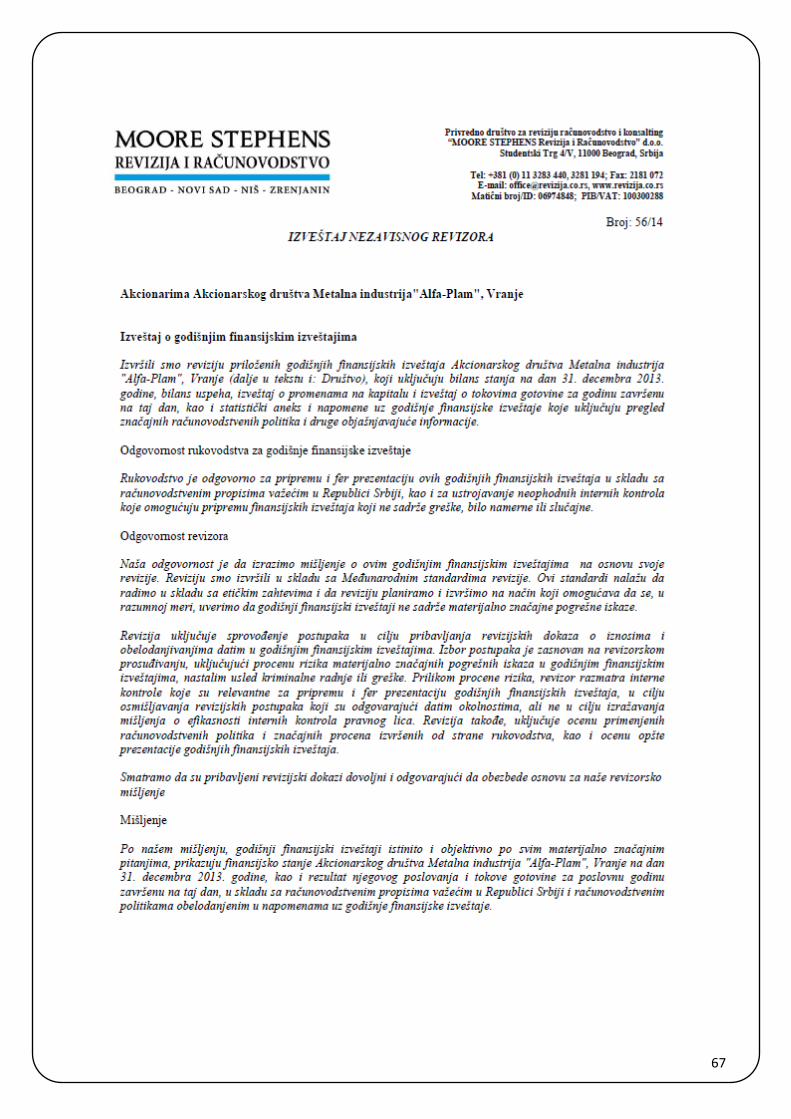
67
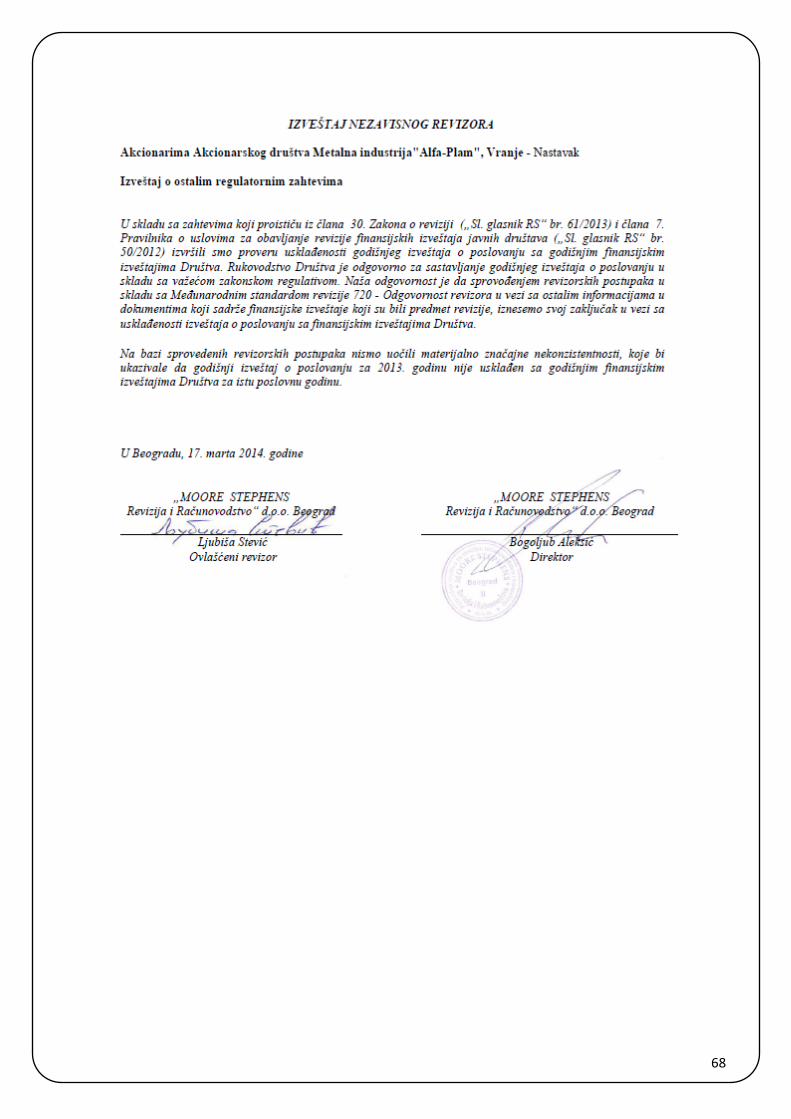
68
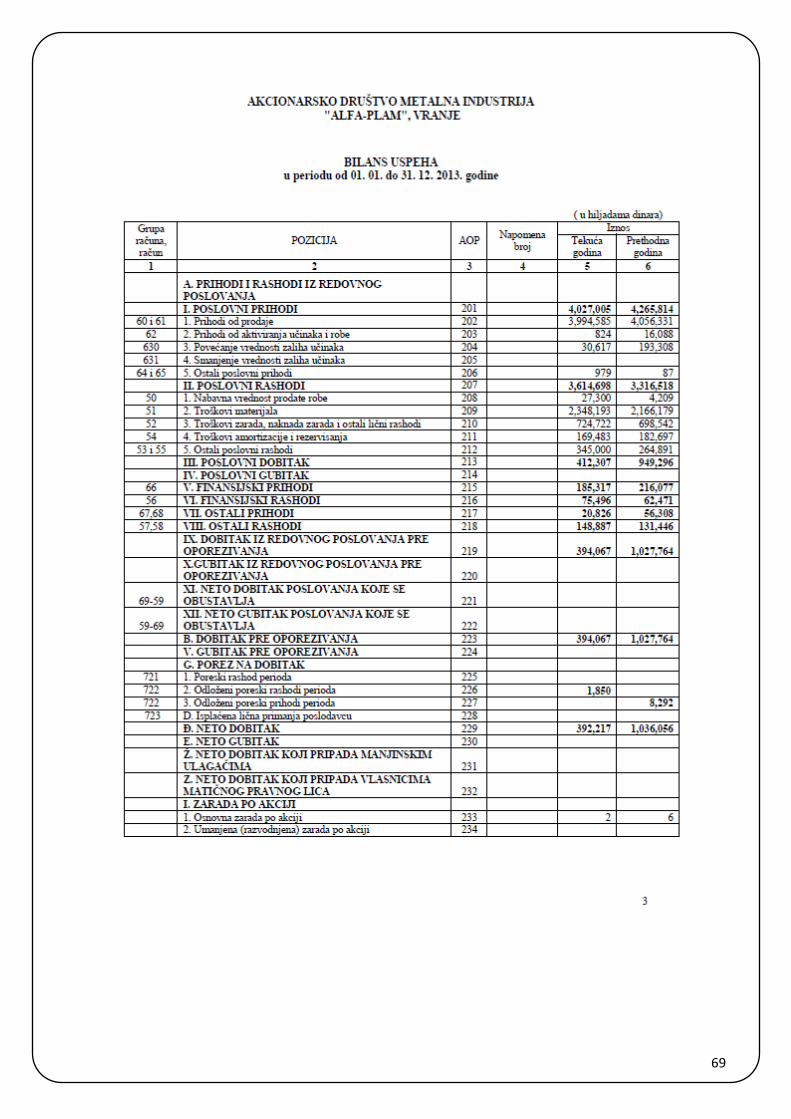
69
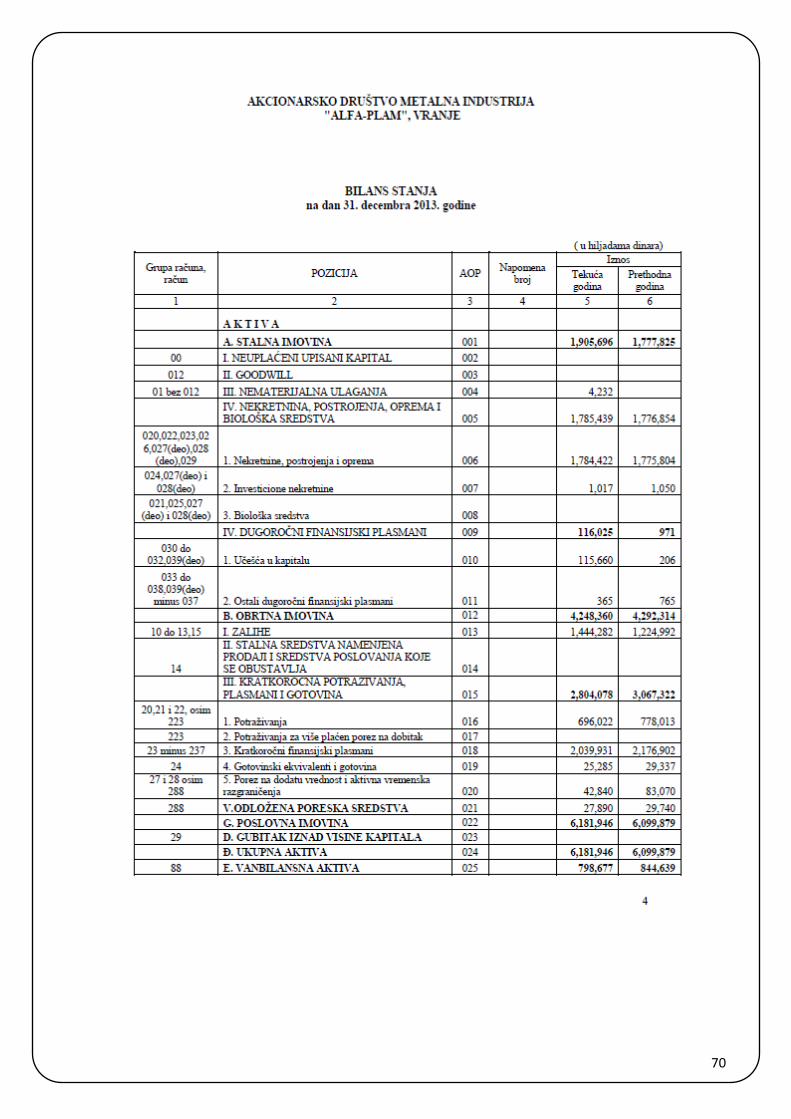
70
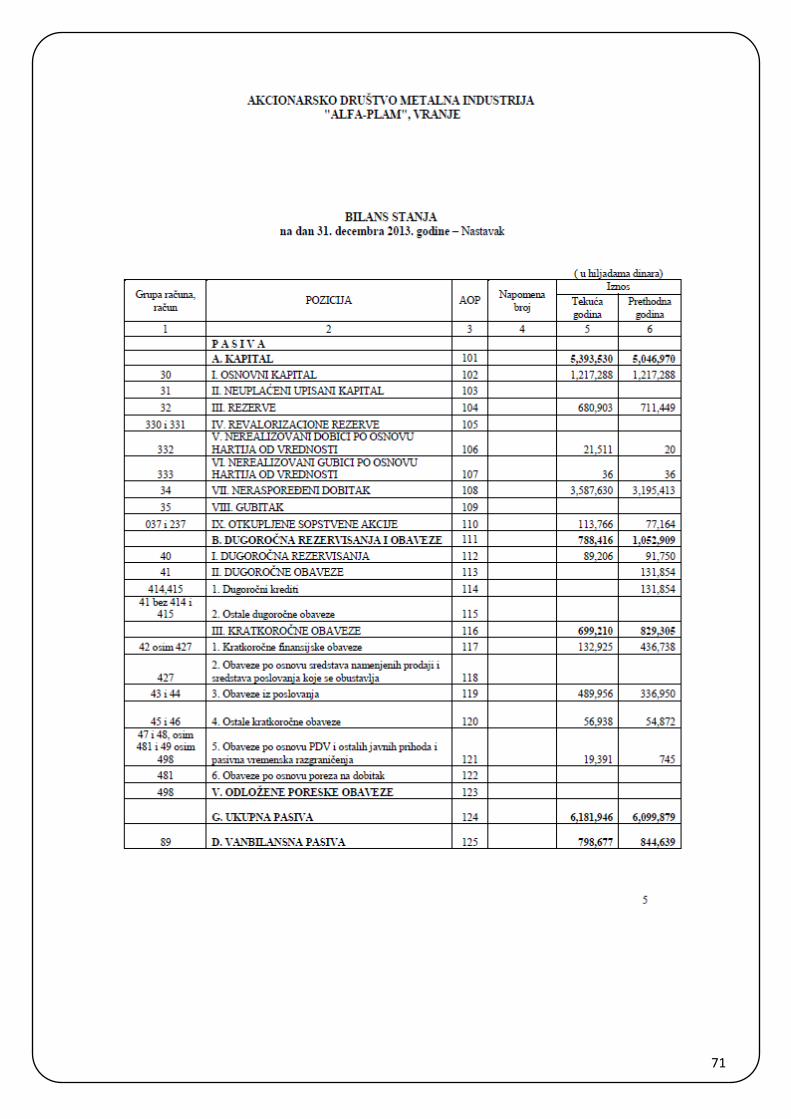
71

72
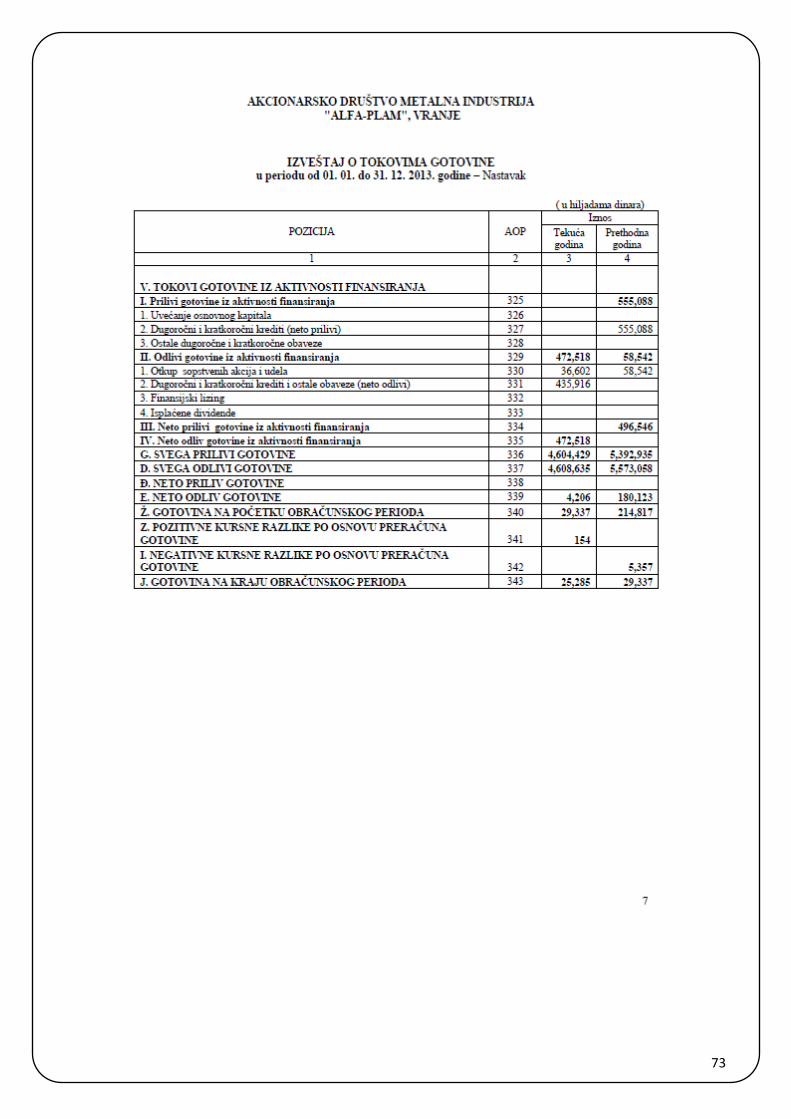
73
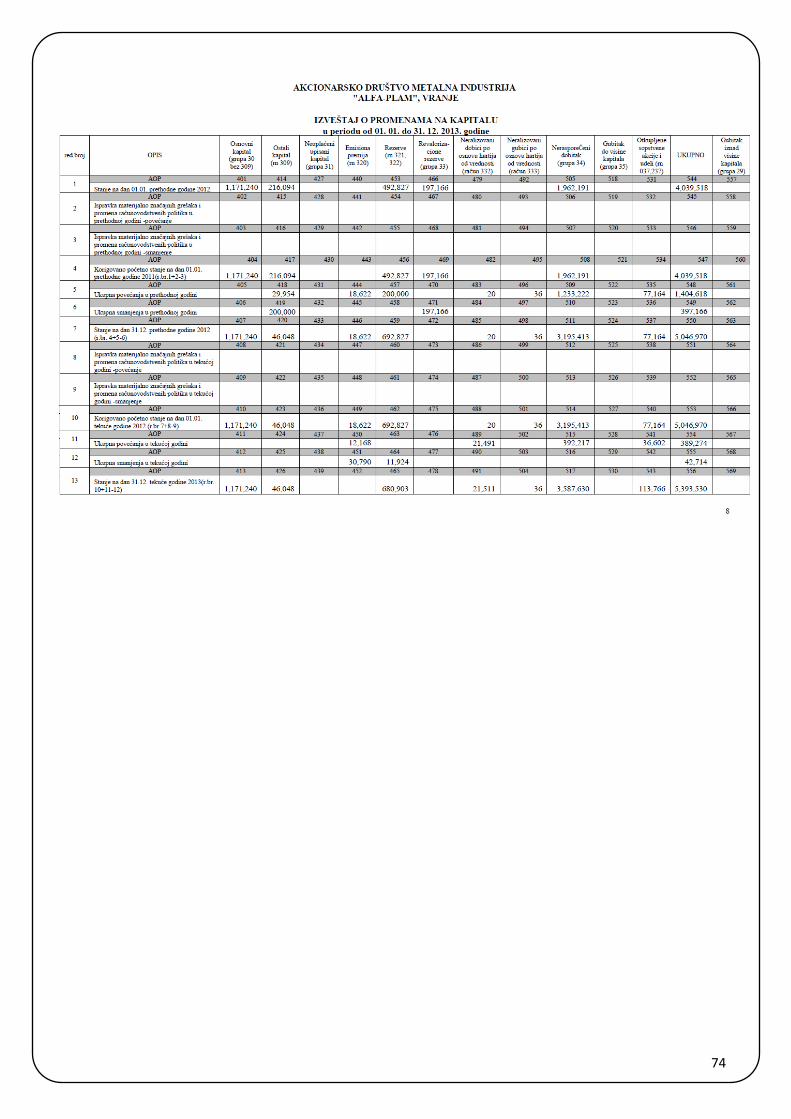
74
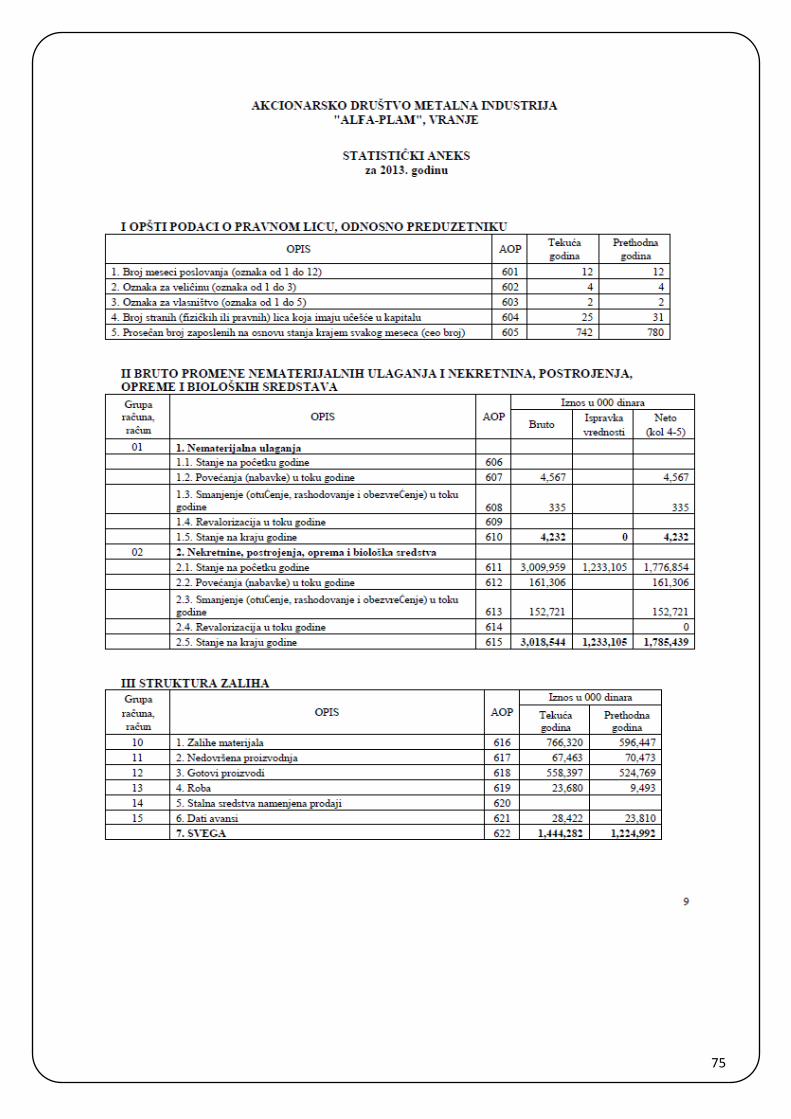
75
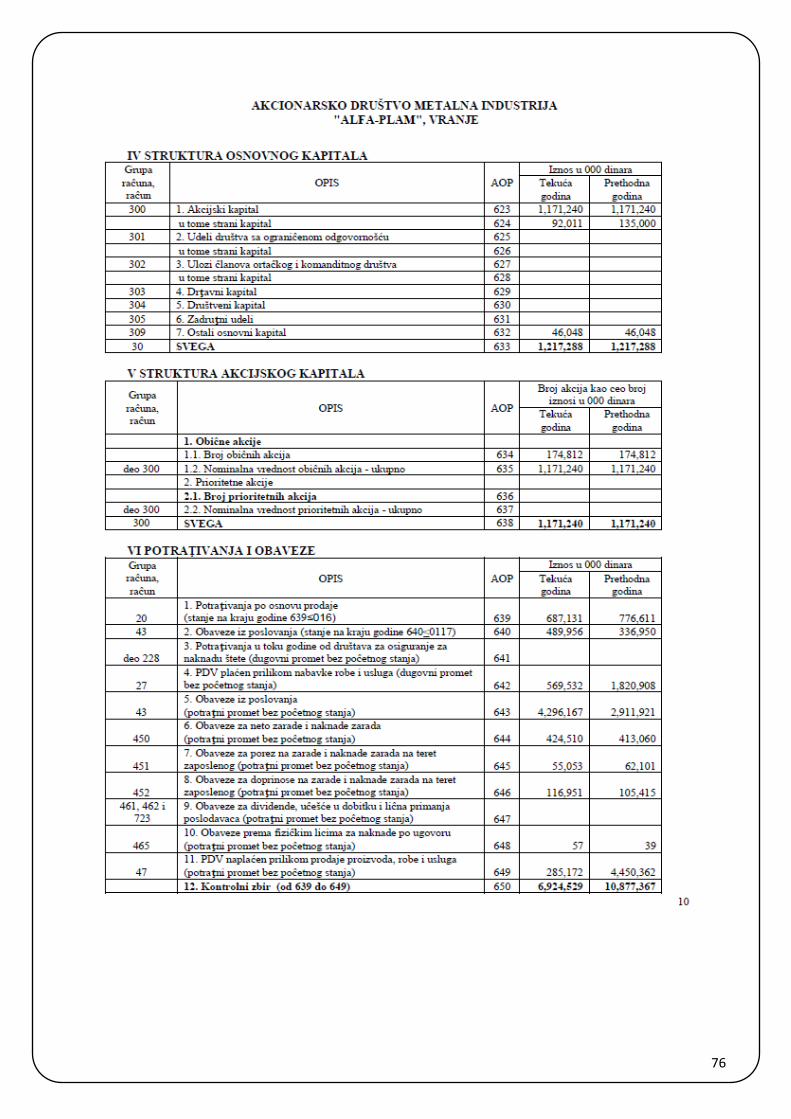
76
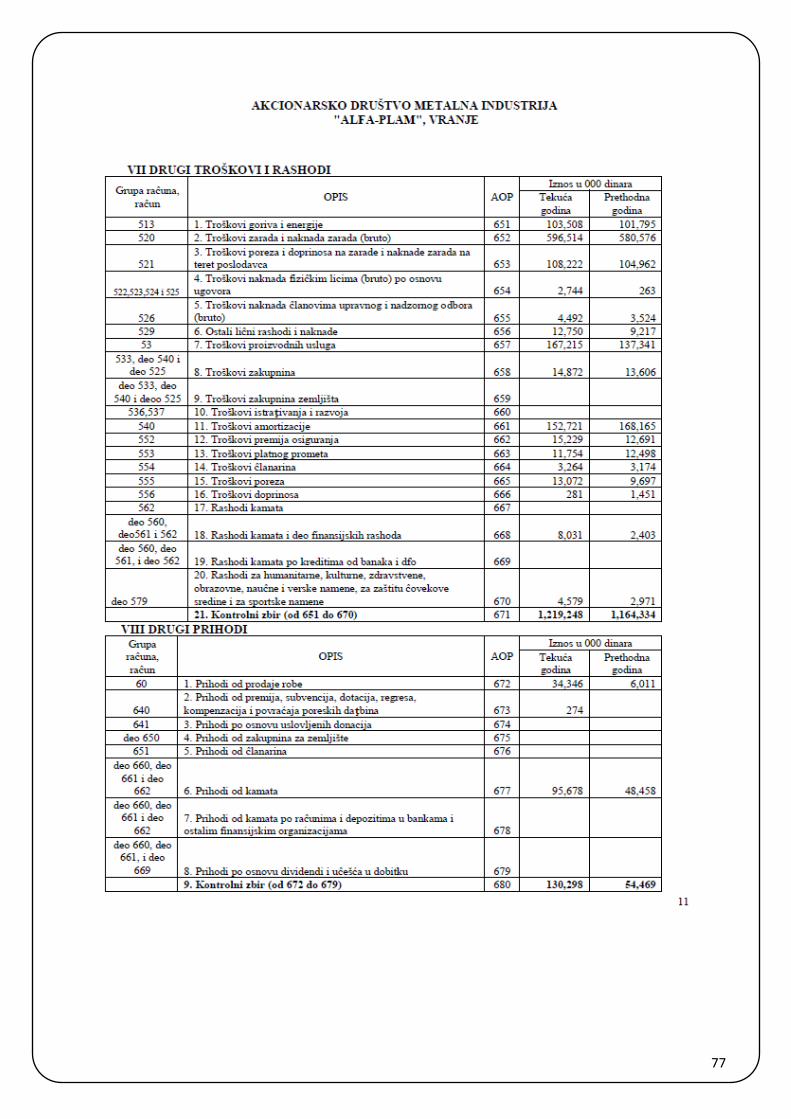
77
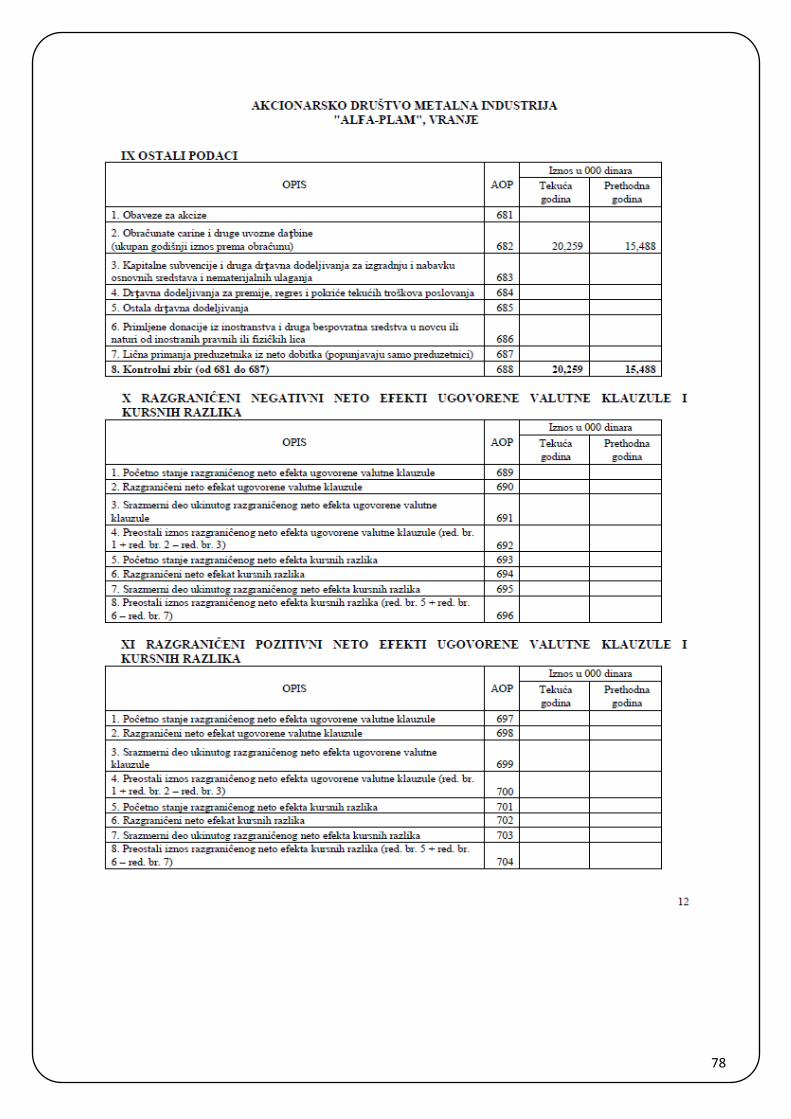
78
79
80
81
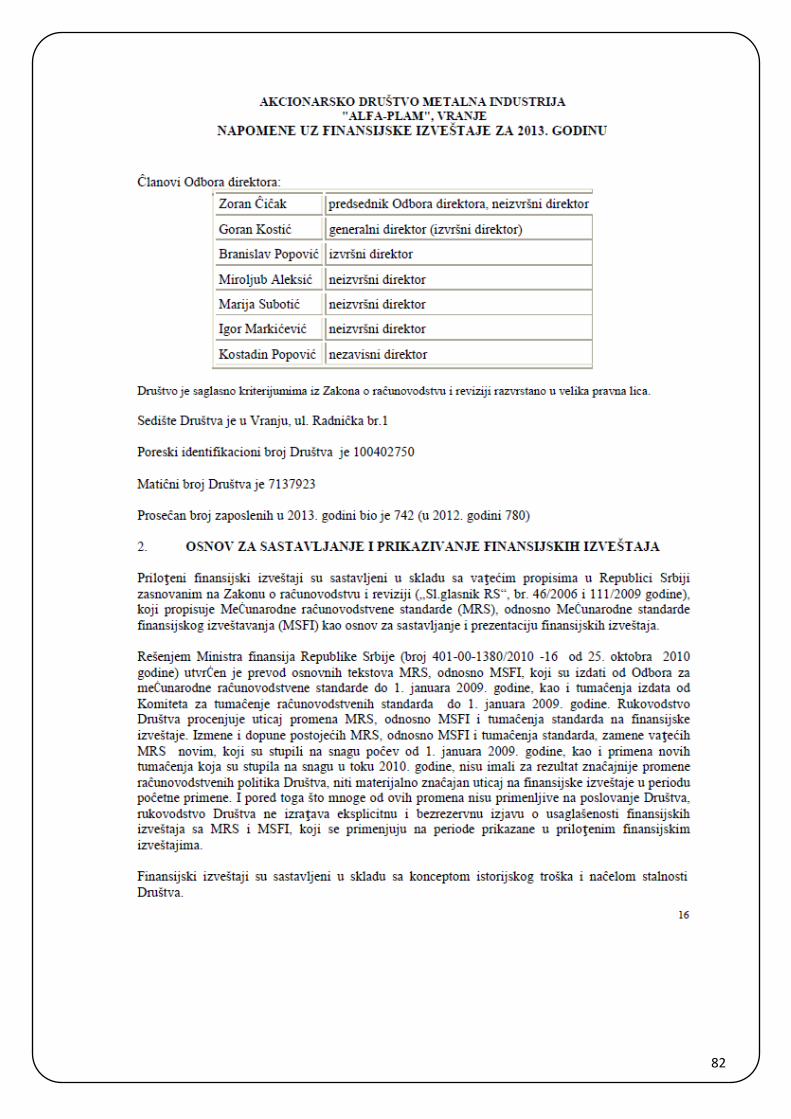
82
83

84
85
86
87
88

89

90
91
92
93
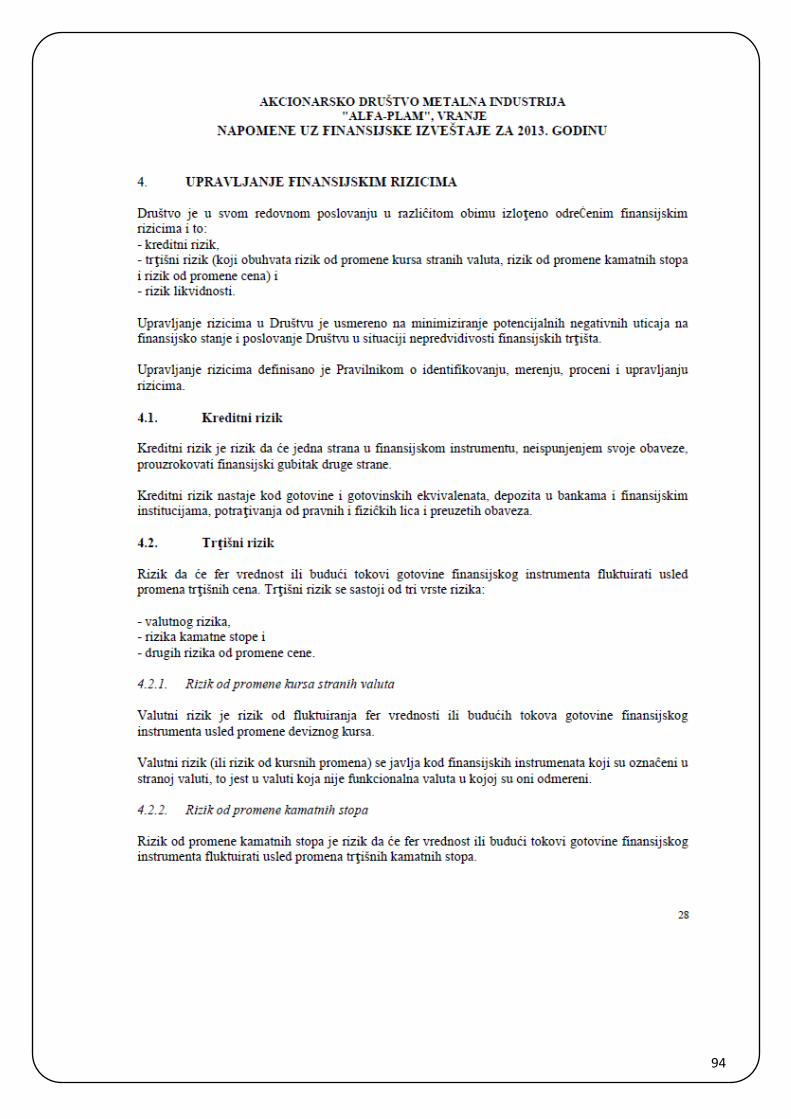
94
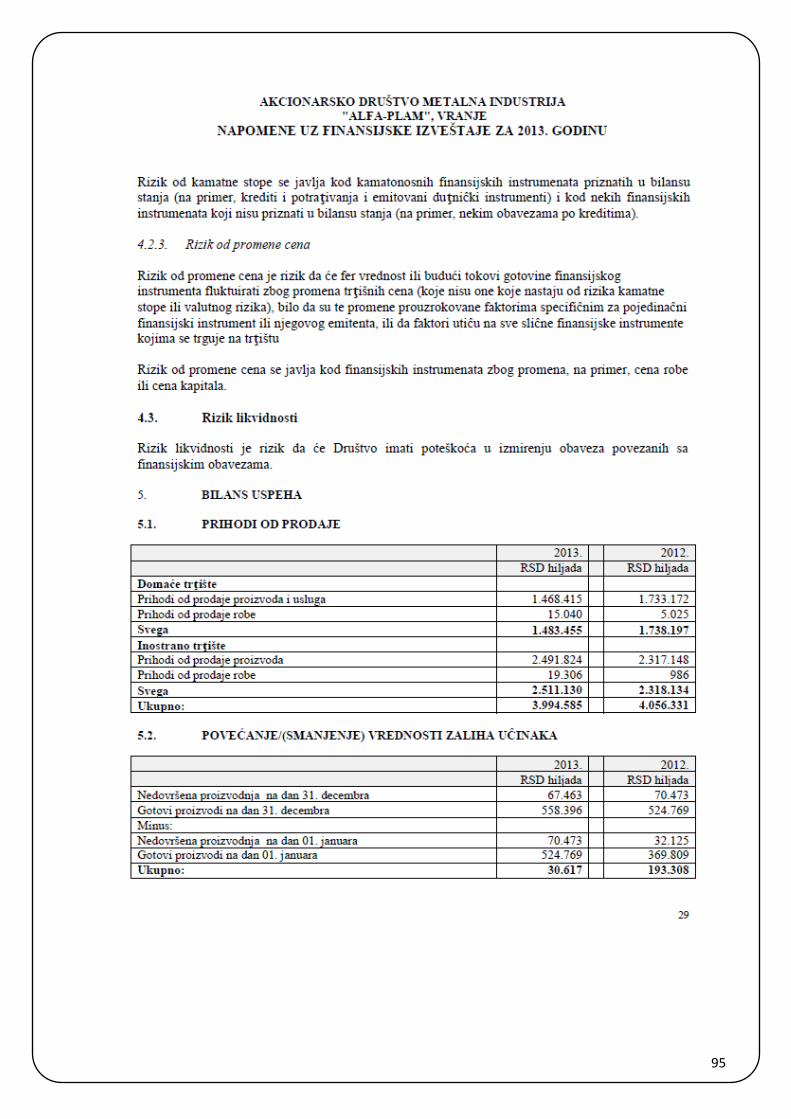
95
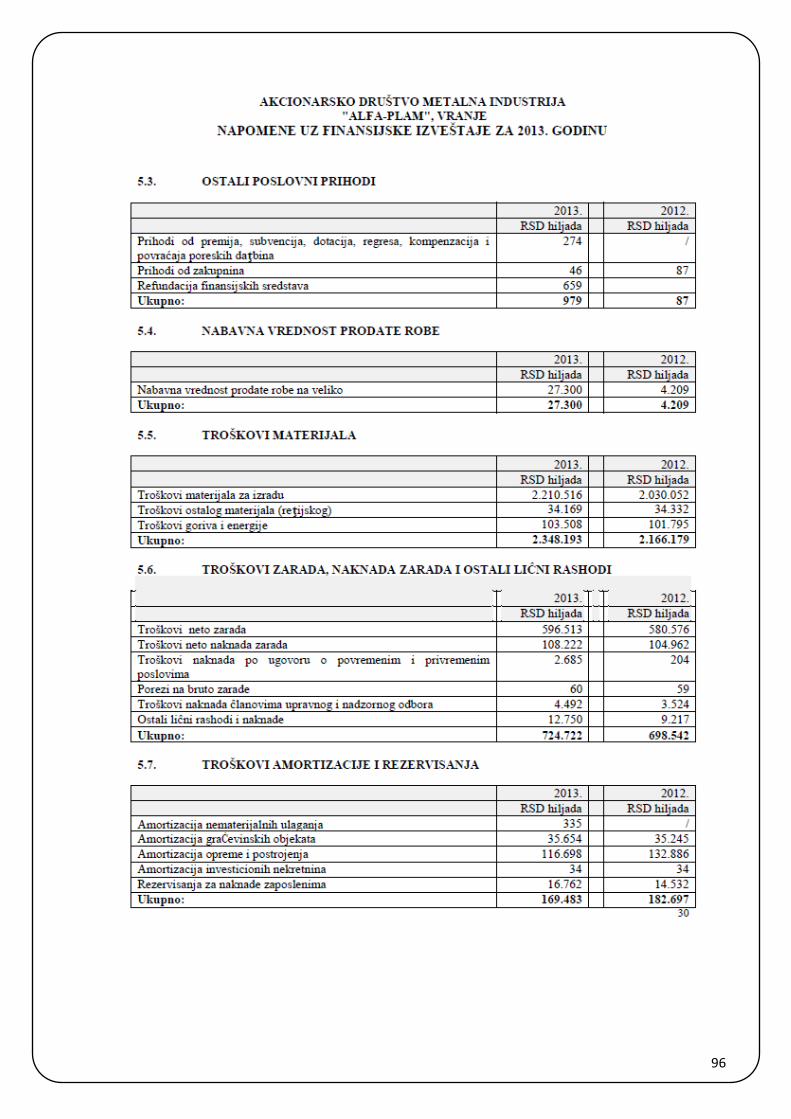
96
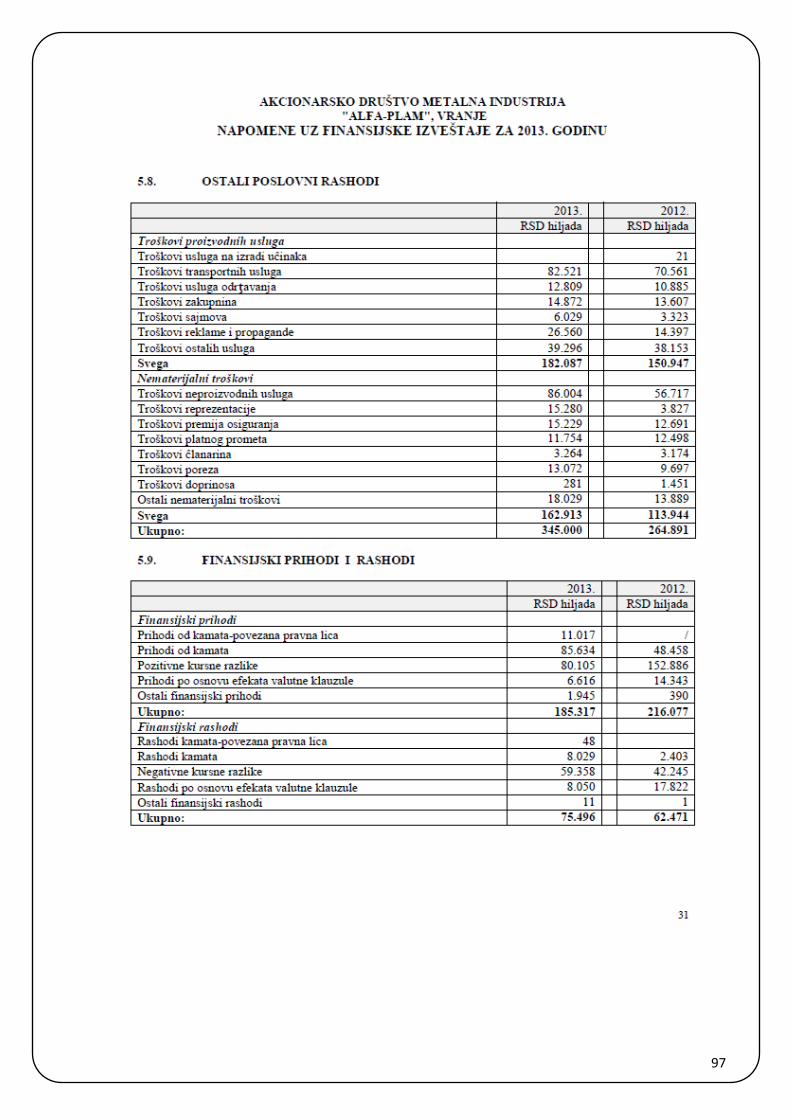
97
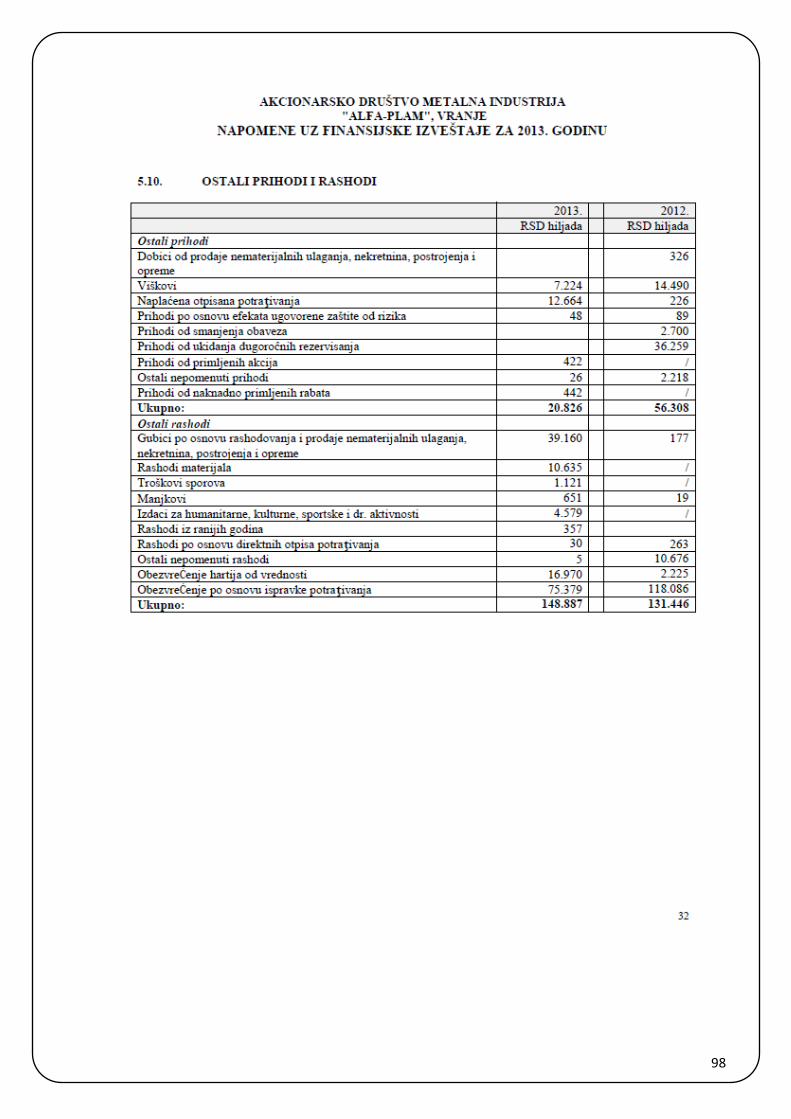
98
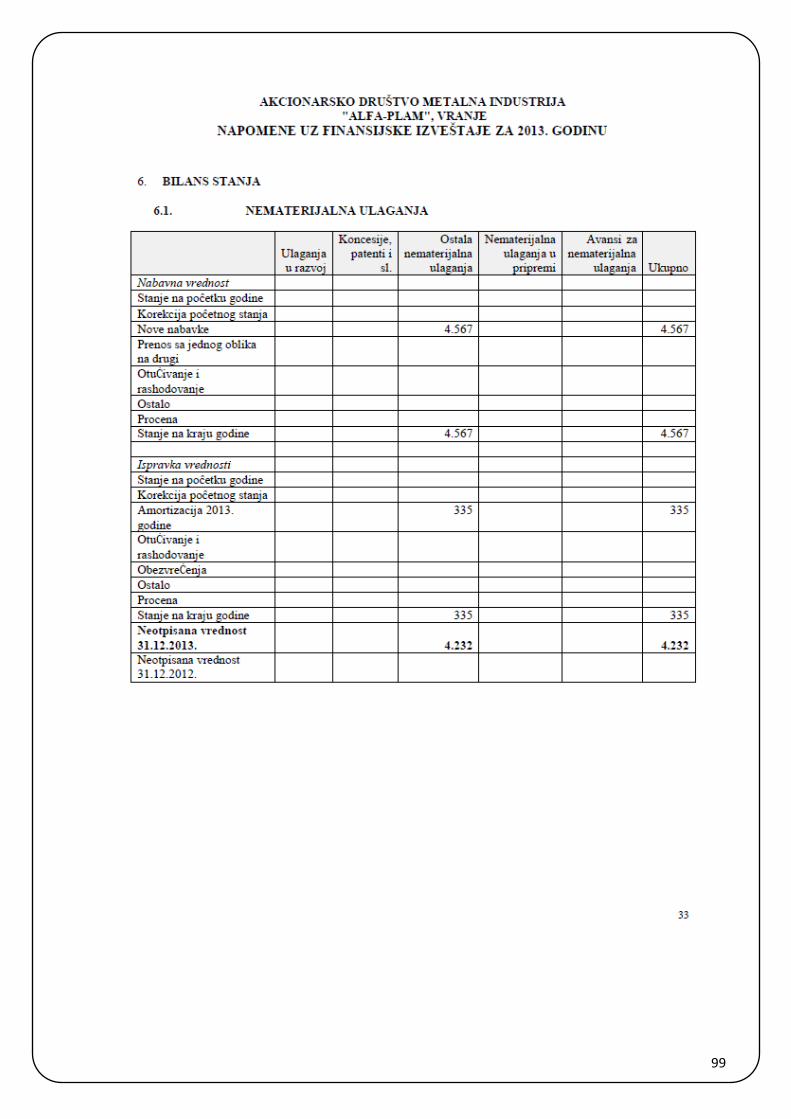
99
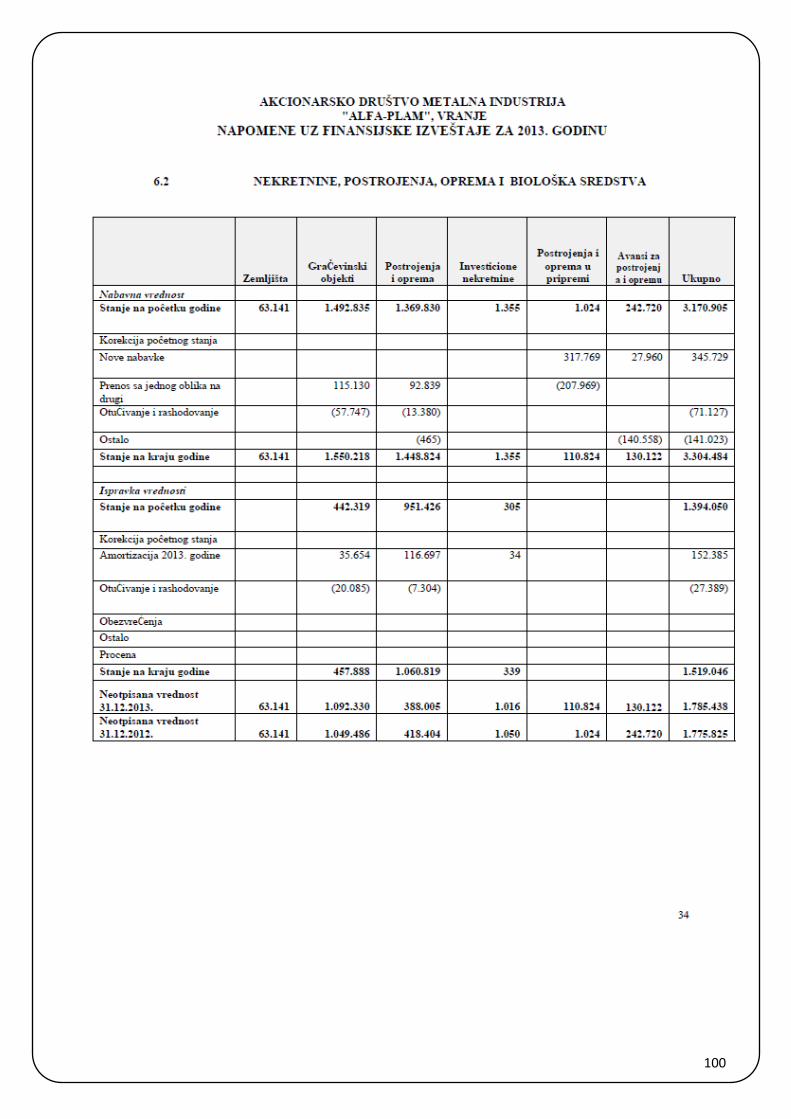
100
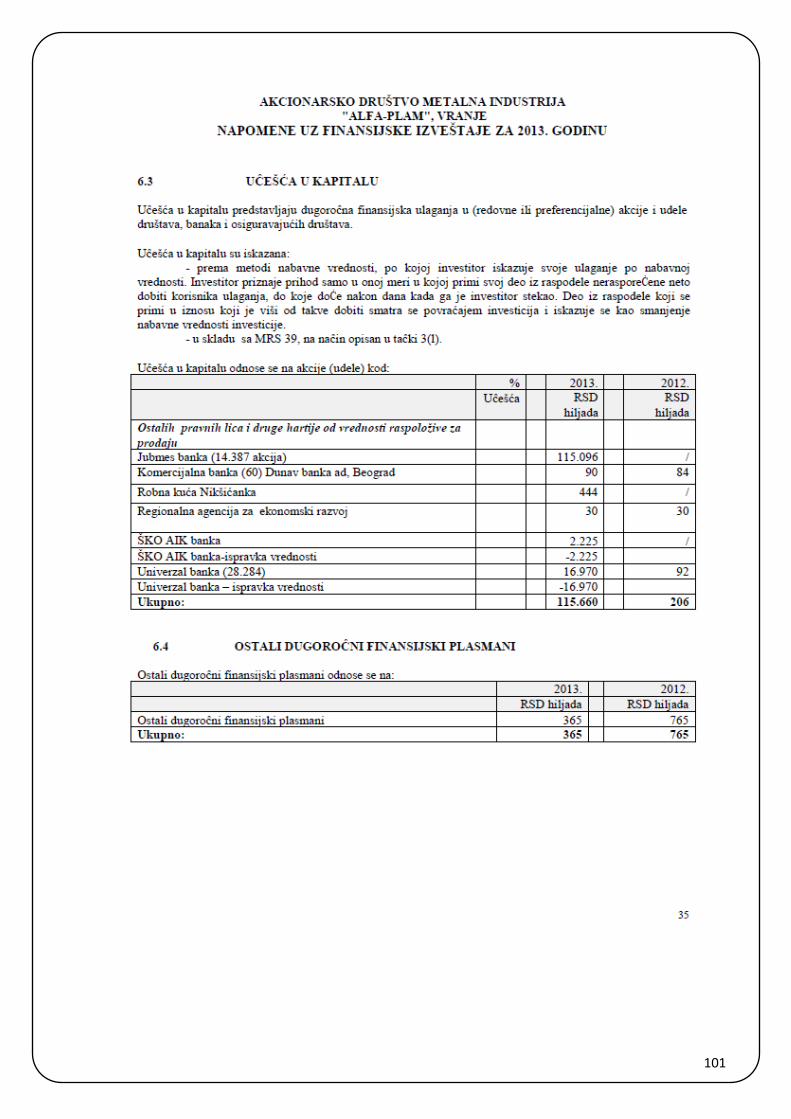
101
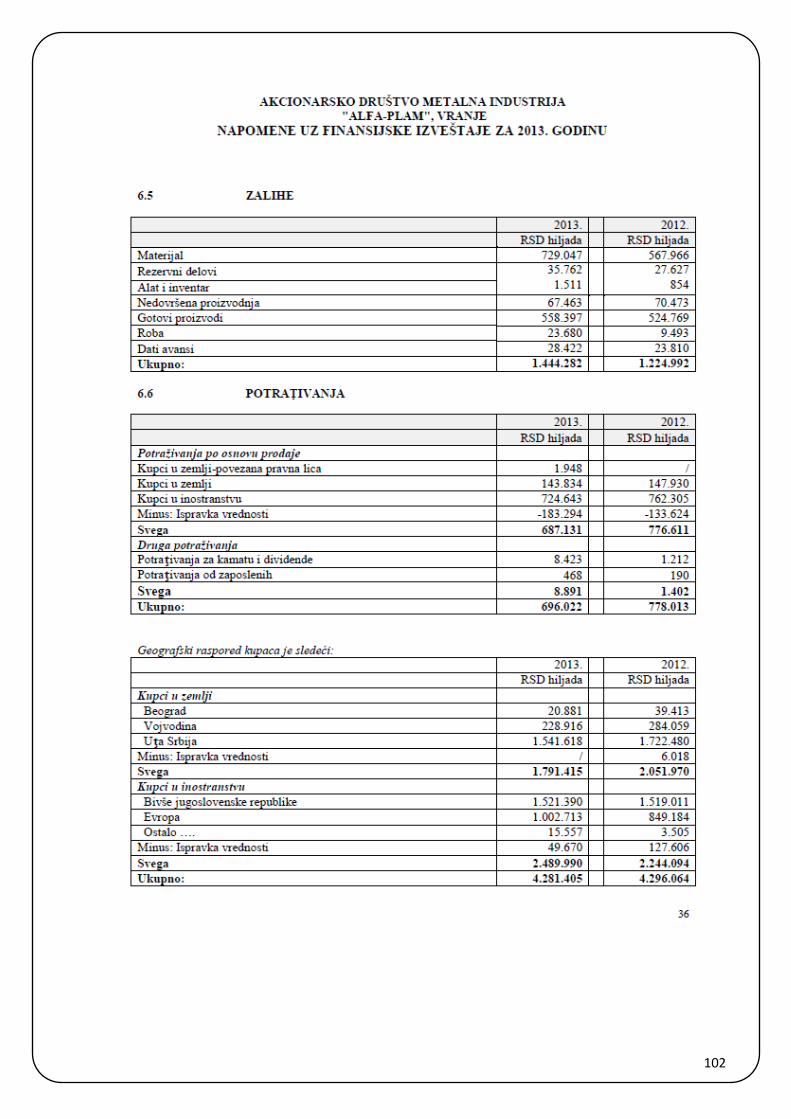
102
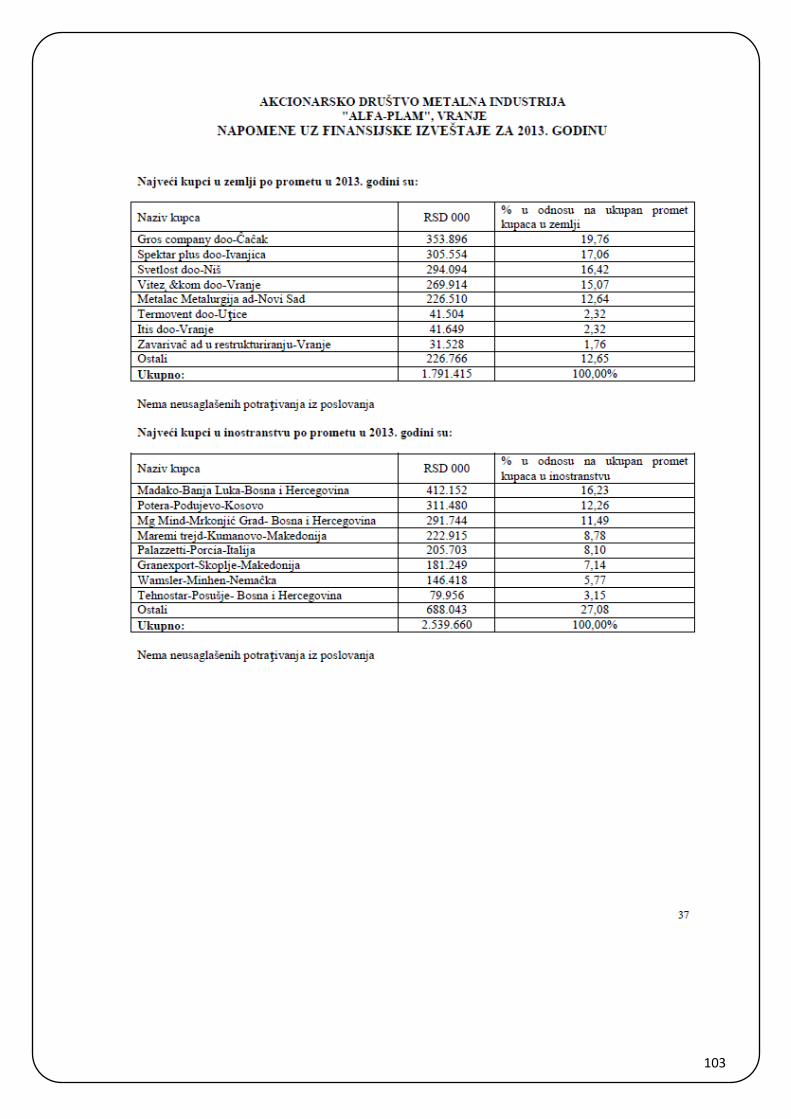
103
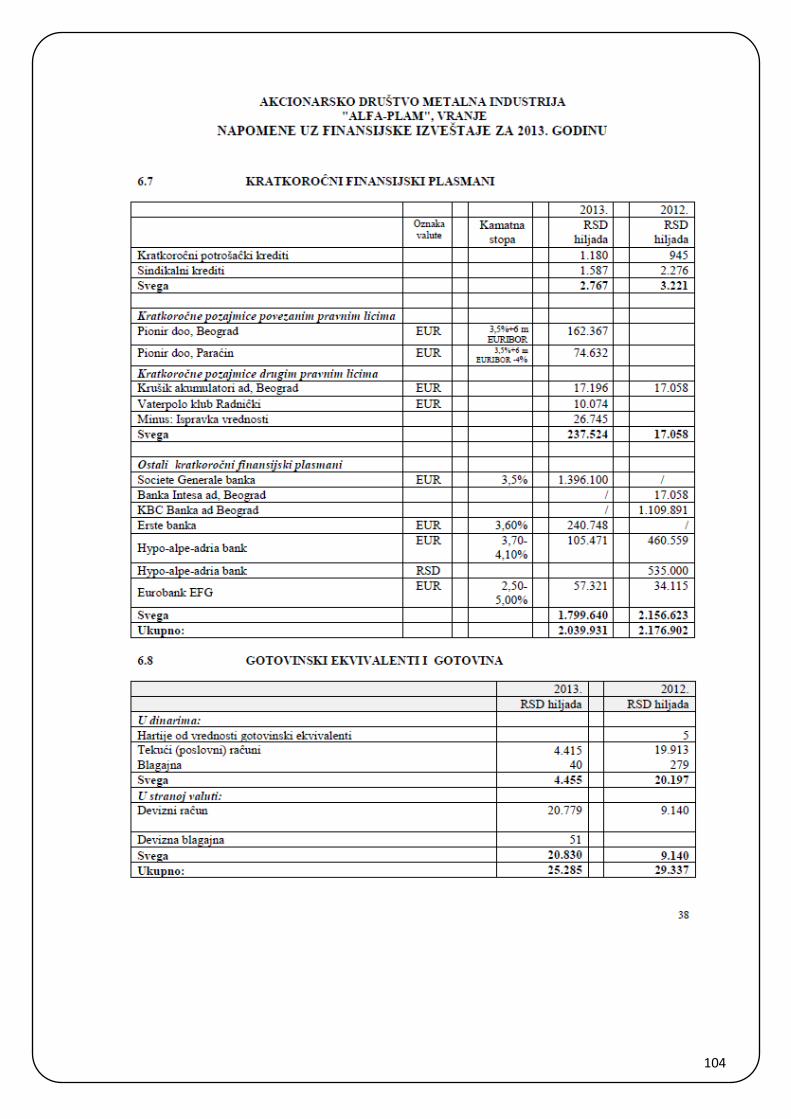
104
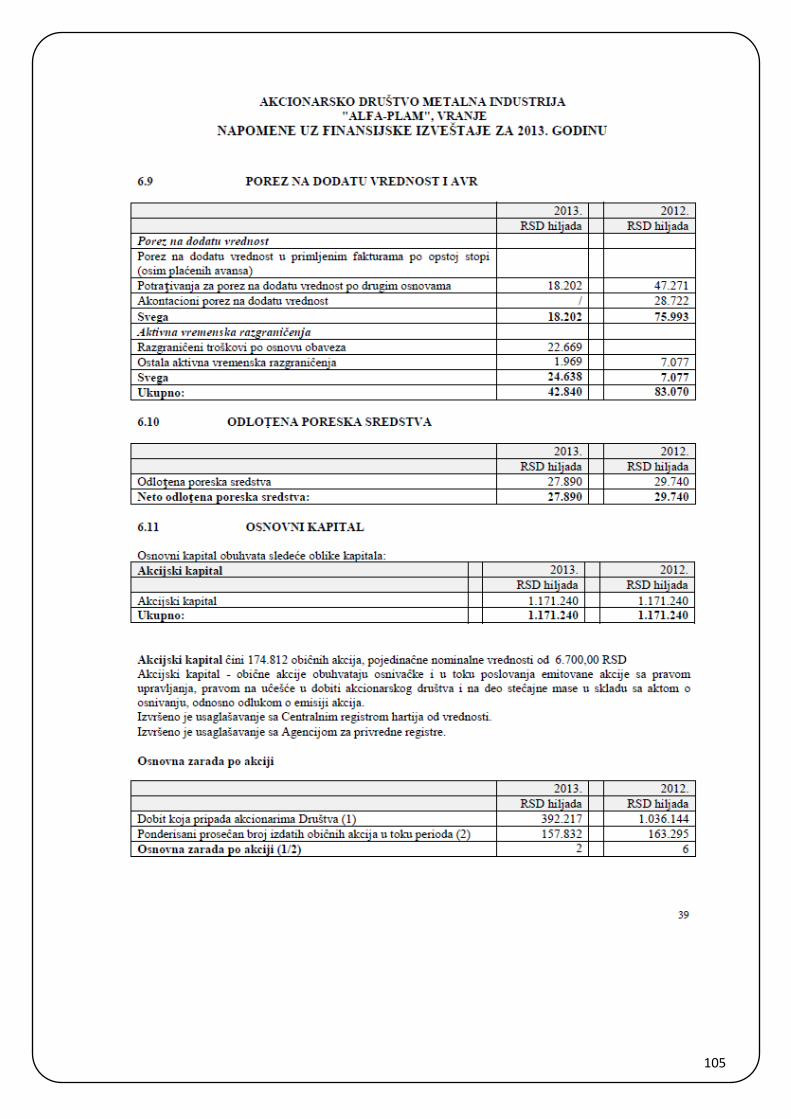
105
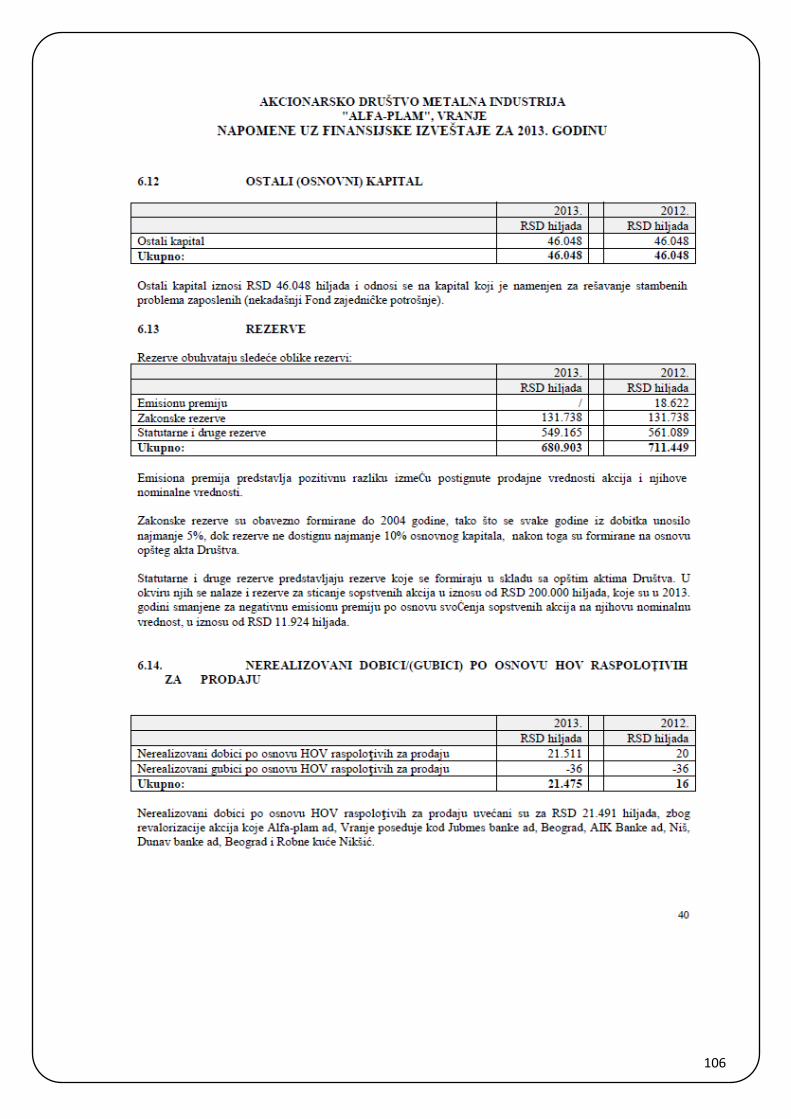
106
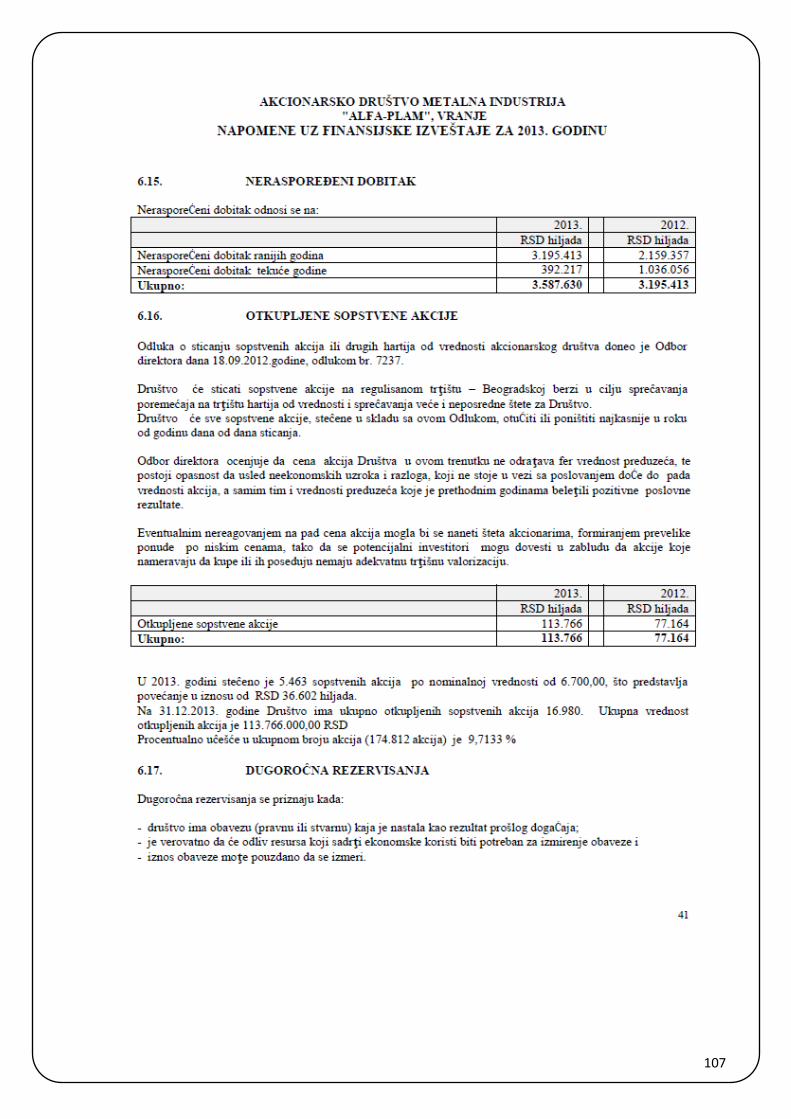
107
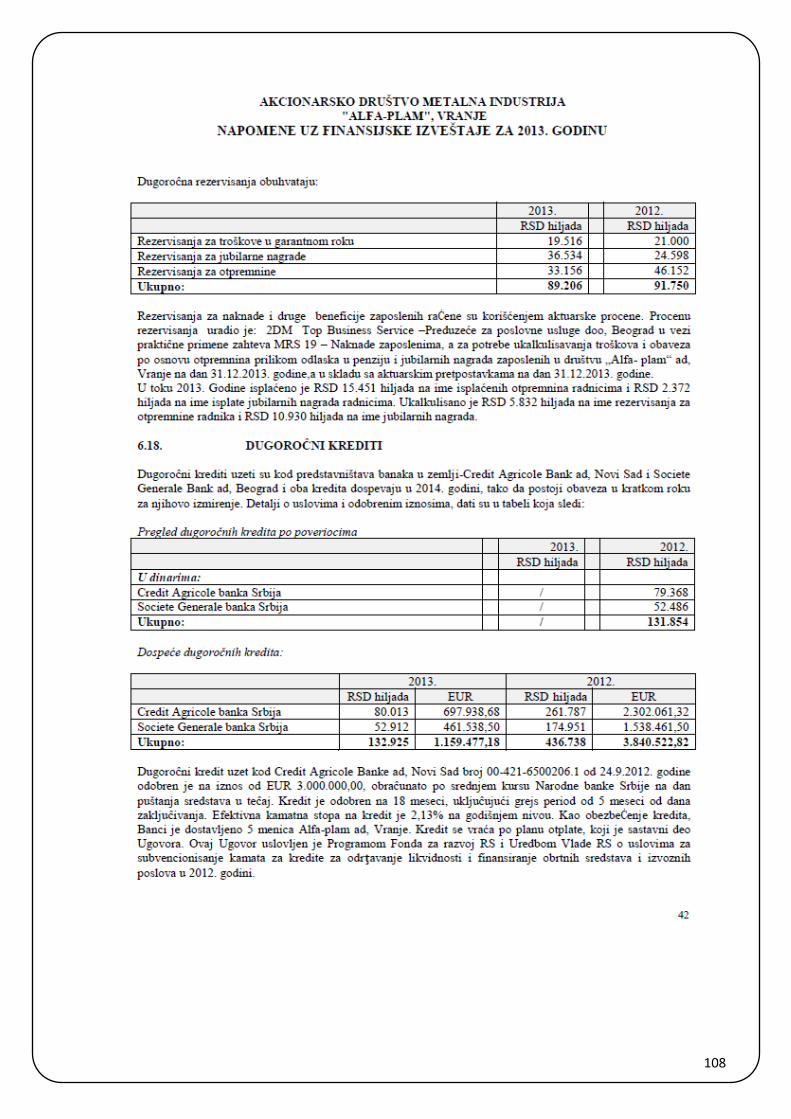
108

109
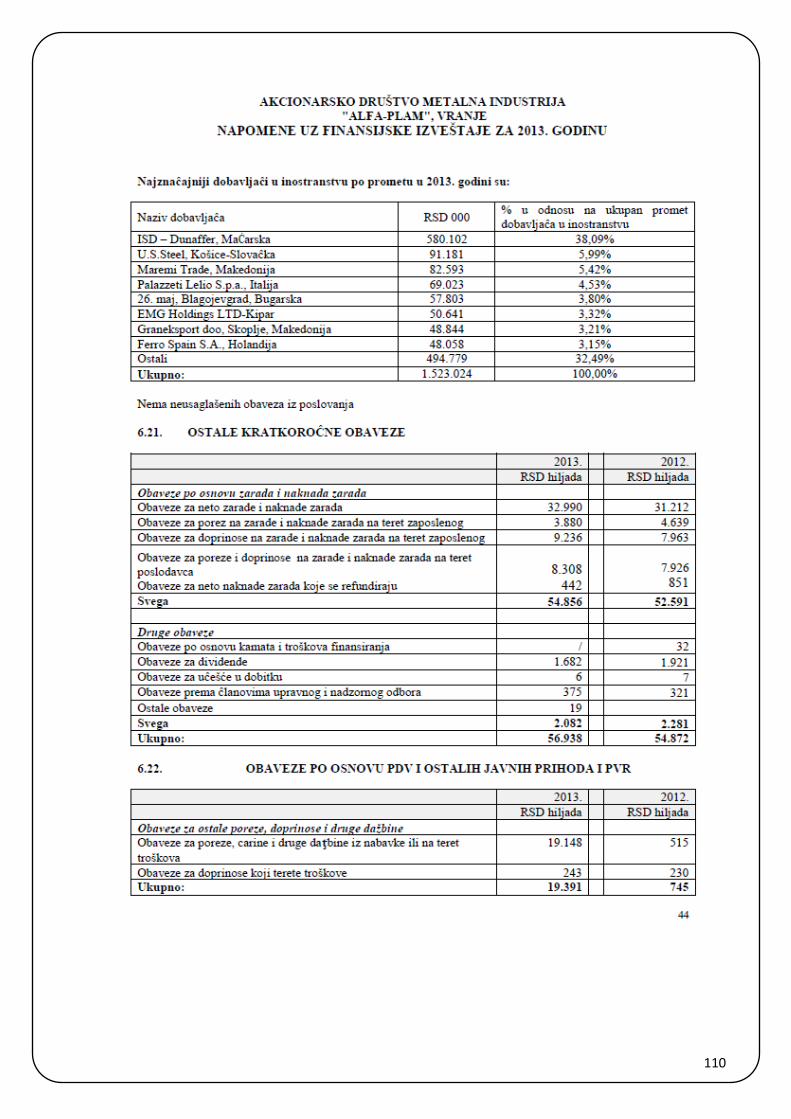
110
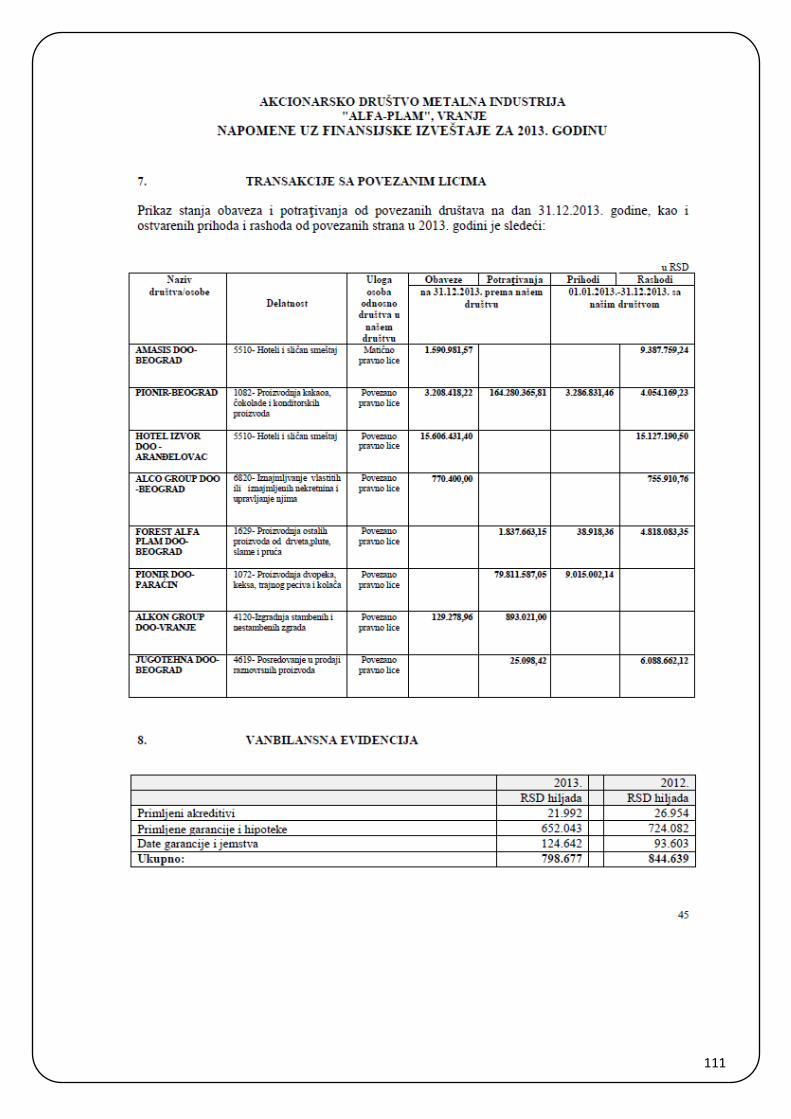
111
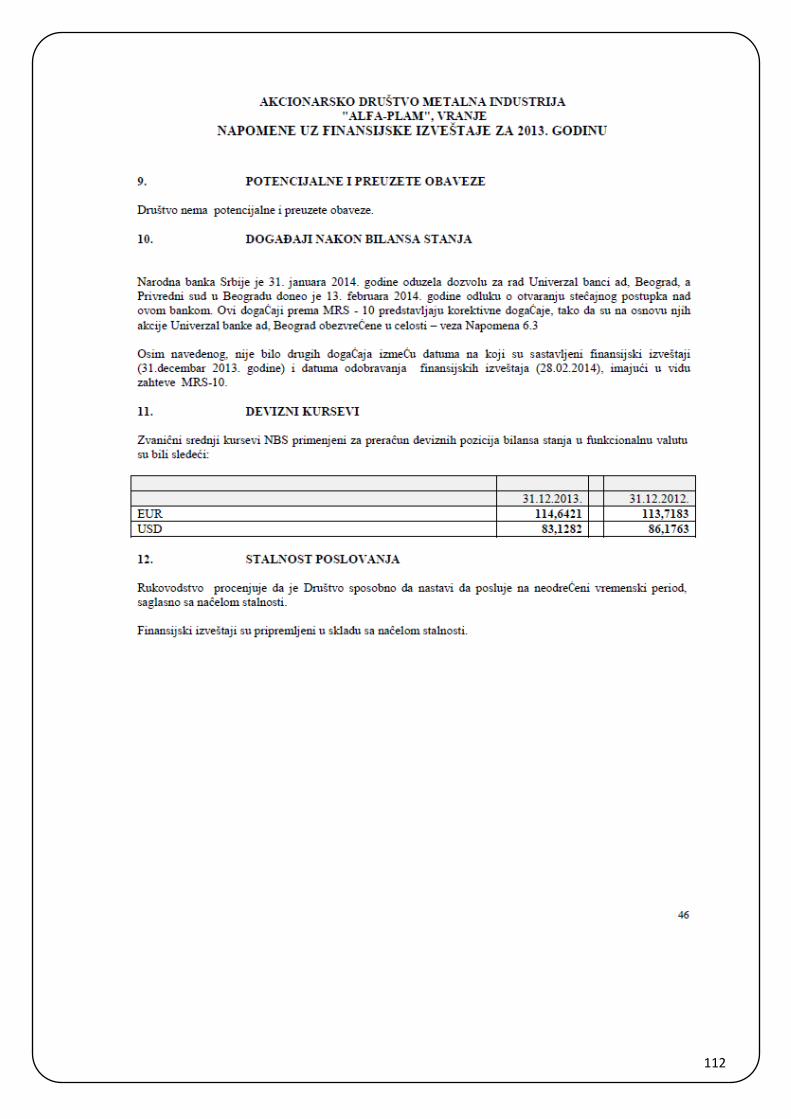
112