Ad Hoc Networks - Dipartimento Informatica · Ad Hoc Networks journal homepage: ... cellular...
19
Data offloading in social mobile networks through VIP delegation Marco Valerio Barbera a , Aline Carneiro Viana b , Marcelo Dias de Amorim c , Julinda Stefa a,⇑ a Sapienza University of Rome, Via Salaria 113, 00198 Rome, Italy b INRIA, Route de Saclay, 91128 Palaiseau Cedex Inria Saclay, Ile de France, France c CNRS/LIP6, UPMC Sorbonne Universités, LIP6 Boîte courrier 169 Couloir 26-00, Étage 1, Bureau 109 4 Place Jussieu, 75252 Paris Cedex 05, France article info Article history: Received 27 August 2012 Received in revised form 9 November 2013 Accepted 30 January 2014 Available online 5 March 2014 Keywords: Centrality-based metrics Coverage strategy Delay tolerant networks abstract The recent boost up of mobile data consumption is straining cellular networks in metropol- itan areas and is the main reason for the ending of unlimited data plans by many providers. To address this problem, we propose the use of series opportunistic delegation as a data traffic offload solution by investigating two main questions: (i) ‘‘Can we characterize a given social mobile scenario by observing only a small portion of it?’’. (ii) ‘‘How to exploit this characterization so to design solutions that alleviate overloaded cellular networks?’’. In our solution we build a social-graph of the given scenario by observing it for a period as short as 1-week, and then leverage a few, socially important users in the social-graph— the VIPs—to offload the network. The proposed VIP selection strategies are based on social network properties and are compared to the optimal (offline) solution. Through extensive evaluations with real and synthetic traces we show the effectiveness of VIP delegation both in terms of coverage and required number of VIPs – down to 7% in average of VIPs are needed in campus-like scenarios to offload about 90% of the traffic. Ó 2014 Elsevier B.V. All rights reserved. 1. Introduction Since the modern smartphones have been introduced worldwide, more and more users have become eager to en- gage with mobile applications and connected services. This eagerness has boosted up sales in the market – more than 64% up annually worldwide in Q2 2010 [1]. Simulta- neously, smartphone owners are using an increasing num- ber of applications requiring the transfer of large amounts of data to/from mobile devices. Opportunistic applications [2], crowd-source based ones [3], global sensing [4,5], and content distribution [6] are just a few of the examples. As a consequence, the traffic generated by such devices has caused many problems to cellular network providers. AT&T’s subscribers in USA were getting extremely slow or no service at all because of network straining to meet iPhone users’ demand [7]. The company switched from unlimited traffic plans to tiered pricing for cellular data users in summer 2010. Similarly, Dutch T-Mobile’s infra- structure has not been able to cope with intense mobile traffic, by thus forcing the company to issue refunds for affected users [8]. All these issues are bringing new technical challenges to the networking and telecommunication com- munity. In fact, finding new ways to manage such increased data usage is essential to improve the level of service required by the new wave of smartphones applications. One of the most promising solutions to avoid overwhelm- ing the cellular network infrastructure is to offload part of the traffic onto direct communication between wireless de- vices whenever possible. The offloading process targets at the part of the data that tolerates some delay before delivery. This means that data is stored and transferred http://dx.doi.org/10.1016/j.adhoc.2014.01.012 1570-8705/Ó 2014 Elsevier B.V. All rights reserved. ⇑ Corresponding author. Tel.: +39 06 4925 5164. E-mail address: [email protected] (J. Stefa). Ad Hoc Networks 19 (2014) 92–110 Contents lists available at ScienceDirect Ad Hoc Networks journal homepage: www.elsevier.com/locate/adhoc
Transcript of Ad Hoc Networks - Dipartimento Informatica · Ad Hoc Networks journal homepage: ... cellular...

Ad Hoc Networks 19 (2014) 92–110
Contents lists available at ScienceDirect
Ad Hoc Networks
journal homepage: www.elsevier .com/locate /adhoc
Data offloading in social mobile networks through VIPdelegation
http://dx.doi.org/10.1016/j.adhoc.2014.01.0121570-8705/� 2014 Elsevier B.V. All rights reserved.
⇑ Corresponding author. Tel.: +39 06 4925 5164.E-mail address: [email protected] (J. Stefa).
Marco Valerio Barbera a, Aline Carneiro Viana b, Marcelo Dias de Amorim c, Julinda Stefa a,⇑a Sapienza University of Rome, Via Salaria 113, 00198 Rome, Italyb INRIA, Route de Saclay, 91128 Palaiseau Cedex Inria Saclay, Ile de France, Francec CNRS/LIP6, UPMC Sorbonne Universités, LIP6 Boîte courrier 169 Couloir 26-00, Étage 1, Bureau 109 4 Place Jussieu, 75252 Paris Cedex 05, France
a r t i c l e i n f o
Article history:Received 27 August 2012Received in revised form 9 November 2013Accepted 30 January 2014Available online 5 March 2014
Keywords:Centrality-based metricsCoverage strategyDelay tolerant networks
a b s t r a c t
The recent boost up of mobile data consumption is straining cellular networks in metropol-itan areas and is the main reason for the ending of unlimited data plans by many providers.To address this problem, we propose the use of series opportunistic delegation as a datatraffic offload solution by investigating two main questions: (i) ‘‘Can we characterize agiven social mobile scenario by observing only a small portion of it?’’. (ii) ‘‘How to exploitthis characterization so to design solutions that alleviate overloaded cellular networks?’’. Inour solution we build a social-graph of the given scenario by observing it for a period asshort as 1-week, and then leverage a few, socially important users in the social-graph—the VIPs—to offload the network. The proposed VIP selection strategies are based on socialnetwork properties and are compared to the optimal (offline) solution. Through extensiveevaluations with real and synthetic traces we show the effectiveness of VIP delegation bothin terms of coverage and required number of VIPs – down to 7% in average of VIPs areneeded in campus-like scenarios to offload about 90% of the traffic.
� 2014 Elsevier B.V. All rights reserved.
1. Introduction
Since the modern smartphones have been introducedworldwide, more and more users have become eager to en-gage with mobile applications and connected services. Thiseagerness has boosted up sales in the market – more than64% up annually worldwide in Q2 2010 [1]. Simulta-neously, smartphone owners are using an increasing num-ber of applications requiring the transfer of large amountsof data to/from mobile devices. Opportunistic applications[2], crowd-source based ones [3], global sensing [4,5], andcontent distribution [6] are just a few of the examples. As aconsequence, the traffic generated by such devices hascaused many problems to cellular network providers.
AT&T’s subscribers in USA were getting extremely slowor no service at all because of network straining to meetiPhone users’ demand [7]. The company switched fromunlimited traffic plans to tiered pricing for cellular datausers in summer 2010. Similarly, Dutch T-Mobile’s infra-structure has not been able to cope with intense mobiletraffic, by thus forcing the company to issue refunds foraffected users [8]. All these issues are bringing new technicalchallenges to the networking and telecommunication com-munity. In fact, finding new ways to manage such increaseddata usage is essential to improve the level of servicerequired by the new wave of smartphones applications.One of the most promising solutions to avoid overwhelm-ing the cellular network infrastructure is to offload part ofthe traffic onto direct communication between wireless de-vices whenever possible. The offloading process targets atthe part of the data that tolerates some delay beforedelivery. This means that data is stored and transferred

Fig. 1. Network without and with opportunistic offloading.
M.V. Barbera et al. / Ad Hoc Networks 19 (2014) 92–110 93
directly between nodes in an ad hoc fashion until the dead-line arrives and, if necessary, nodes access the cellularinfrastructure to download or upload the data. Note thatin the case of redundant data (e.g., measurement of pollu-tion levels), the traffic on the cellular infrastructure can bedrastically reduced through opportunistic offloading (seeFig. 1(a and b) for an example in the data gathering case).1
In this paper, we propose VIP delegation, a solution tothis problem based solely on the inherent social aspectsof user mobility. Our idea is to exploit a few, important sub-scribers (users) that with their movement and interactionsare able to possibly contact regularly all the rest of the net-work users. These VIP devices would act as a bridge be-tween the network infrastructure and the remaining ofthe network, each time large amount of data has to betransferred. Because nodes move and meet each other, itsuffices to contact a subset of them to reach a large numberof nodes (possibly all of them). In the example of the figure,nodes fx; yg can serve as VIPs on behalf of the others, asthey meet by themselves the rest of the network.
VIP delegation can help alleviate the network traffic indifferent delay-tolerant scenarios. Distribution of contentto users by service providers, free updates of mobile soft-ware, system patches and so on, are just some examplesthat show how the network can exploit VIPs. However,their role for upload traffic (from the nodes to the network)is even more prominent: VIPs drastically reduce the num-ber of competing upload network flows. As a direct conse-quence, also the number of collisions, and mostimportantly, of retransmissions decreases drastically. Thisbecomes very valuable for users in overloaded networks.That said, we believe that VIPs can be even more valuablewhen involved in collection of urban-sensing related data[4,5]. In these cases data can be aggregated under the con-trol of a central entity (e.g., government institutions) so togive feedback to the users on the environment they are liv-ing in (e.g. average noise pollution, smog, and so on). Thisaggregation could happen at the VIPs, as they collect thedata sensed by the users. At the end of the coverage period,the VIPs would only send the aggregated value through thecellular network, by thus actually reducing the trafficflowing through the cellular network.
1 There are several other offloading alternatives (through Wi-Fi accesspoints for example, as discussed in Section 2.1). In this paper, we focus onlyon the case of opportunistic offloading.
The question here is how to compute an appropriate VIPset given some requirements. For this, we present, formalize,and evaluate two methods of VIPs selection: global andneighborhood VIP delegation (see Section 3). While the for-mer focuses on users that are globally important in the net-work (namely, global VIPs), the latter selects users that areimportant within their social communities. The importanceof a user within the network is given in terms of well-known attributes such as centrality (betweenness, degree,and closeness) and PageRank. In both cases, we observethat a short observation period (one week) is enough todetect users that keep their importance during longperiods (several months). Selected nodes are then used tocover the network during a certain time window, throughsolely direct wireless contacts with the remaining nodes(see Section 4). In this paper, we provide significantextension over a companion work by deeply investigatingcoverage aspects [9].
Through extensive evaluations on real-life and syn-thetic traces, we evaluate the performance of the globaland neighborhood VIP delegation methods in terms of net-work coverage, by varying the number of VIPs chosen (seeSection 6). We compare our solution with an optimalbenchmark computed from the full knowledge of the sys-tem. The results reveal that our strategies get very closeto the performance of the benchmark VIPs: Only 5.93%page-rank VIPs against almost 4% of the benchmark VIPsare required to offload about 90% of the network in cam-pus-like scenarios. Additionally we discuss on possibleVIP incentives, the way VIPs offload the traffic accumulatedto the network, and leveraged applications in Section 8.Finally, we conclude with Section 9.
2. Related works
We go through the related work in the area, discussingthe most representative results on both data offloading anduser-aided networking services.
2.1. Data offloading
Consumption of mobile data by the pervasive usage ofsmartphones is forcing carriers to find ways to offloadthe network. So far the most reasonable solution to theproblem is offloading to alternate networks, such as femto-cells and Wi-Fi. Femtocells exploit broadband connectionto the service provider’s network and leverage the licensed

94 M.V. Barbera et al. / Ad Hoc Networks 19 (2014) 92–110
spectrum of cellular macro-cells to offer better indoor cov-erage to subscribers [10]. As a side effect, automaticswitching of devices from cellular network to femtocellsreduces the load of the network. Besides from being local-ized (indoors only), such solution suffers from the non-proliferation of femtocells to subscribers’ homes. Moreover,charging users for the necessary equipment as the networkproviders are currently doing (150 USD for AT&T’s micro-cell) will not help in this direction. On the other hand,the proliferation of modern Wi-Fi enabled smartphones,together with the network providers’ tendency towardsalready existing technologies has turn Wi-Fi offloadinginto a reality. More and more carriers worldwide areinvesting in this direction [11], by installing access pointsand hot-spots close to overloaded cellular towers, and byproviding to clients Wi-Fi access within tiered monthlysubscription. In this direction, Balasubramanian et al. pro-pose a system to augment access to cellular networkthrough Wi-Fi offloading [12]. This system, called Wifflerfocuses only on Internet access from moving vehicles. Itleverages delay tolerance and fast switching of devices toovercome the poor availability and performance of Wi-Fi.
Even though offloading to Wi-Fi seems to be the bestsolution so far to cellular network overloading [13], thecontinuous increasing of mobile data-traffic demand sug-gests for integration of Wi-Fi with other offloading meth-ods. Indeed, according to a CISCO report,2 the mobile datatraffic will increase 18-fold within 2016, in front of a mere9-fold increase in connection speeds. This huge trafficincrease is very likely to pose problems also to publicWi-Fi access points. Most importantly, this forecast inmobile traffic demand outgrows the capabilities of plannedcellular technology advances like 4G and LTE. According toEricsson’s CTO, there is strong scepticism about possiblefurther improvements brought by 5G technology.3 As wewill show in this paper, our solution is essentially differentfrom Wi-Fi and femtocell-based offloading; nevertheless, itcan be integrated to these methods to further help alleviatemobile data overloads.
2.2. User-aided networking
Polat et al. suggest some sort of network members’ pro-motion to enhance network functionalities [14]. They focuson providing multi-hop connectivity in a mobile ad hocnetwork. Their solution makes use of the concept ofconnected message ferry dominating set (CMFDS), whereferry-members of the network are connected overspace–time paths. Besides from the difference in bothproblematic and application scenario with our work, no so-cial aspect/importance of the network members is consid-ered in promotion.
Many research works targeting social mobile networksmake use of social ties between users to leverage networkservices. To the best of our knowledge, Han et al. were thefirst to exploit opportunistic communication to alleviate
2 Cisco visual networking index: Global mobile data traffic forecast,2011–2016.
3 http://www.dnaindia.com/money/interview_there-will-be-no-5g-we-have-reached-the-channel-limits-ericsson-cto_1546408.
data traffic in cellular networks [15]. Later on, theyextended their work in [16]. However, conversely fromours, their solutions only apply to information dissemina-tion problems such as broadcasting. They focus on select-ing k target users to which the information is first sentthrough cellular network. These target users will then,through multi-hop opportunistic forwarding, disseminatethe information to all users in the network. We believe thatmulti-hop forwarding can be applicable to broadcasting,since users might willingly volunteer to share with othersthe same data they are interested in (data that they wouldanyway pull from other people). But, if the user is notdirectly interested in the data, collecting (disseminating)and eventually multi-hop forwarding data generated fromother users becomes a burden without any gain for her(e.g., scenarios where different data is being distributedfor different users, or collection and aggregation of sensingdata [4,5]). In these cases, it would be very costly to stim-ulate all the users in the network to cooperate. Rather, oursolution relies on upgrading a crucial small set of users’devices (down to 5.93% according to experiments with realcampus-like data traces) that, through direct contact withnetwork members, help alleviate the data traffic in bothupload and download directions, assuring that no packetis lost. That said, while we believe that multi-hop forward-ing is not applicable in our setting, for the sake of com-pleteness we have compared the coverage performanceof the sets obtained by the Heuristic strategy [16] withour VIP sets on the Dartmouth real trace.
Finally, also Push-and-Track, presented in [17] is rele-vant, though different to our work in various aspects:Firstly, it focuses on the dissemination scenario only. Sec-ond, in Push-and-Track the infrastructure relies on someperformance targets to determine how many copies shouldbe injected. Thirdly, and most importantly, Push-and-Trackonly makes use of the time a node enters the network, itsgeographic position, or its connectivity degree. It doesnot investigate the node interactions so to derive reliablefuture communication possibilities, as we do in this work.
3. VIP delegation in a nutshell
In view of the scenario presented in the introduction,we propose an offload method based solely on the socialaspects of user mobility. Our idea is to detect subscribers(users) that, with their inherent mobility, are able toencounter a large number of users (possibly all them) in aregular fashion. These VIPs would act as a bridge betweenthe network infrastructure and the remaining of the net-work, each time large amount of data has to be transferred.
The movement of smartphone users is not random;rather, it is a manifestation of their social behavior[18–21]. This movement, along with contact-based interac-tions among users, generates a social mobile network. Theanalysis of these mobility patterns and the understandingof how mobile users meet play a critical role at the designof solutions/services for such kind of networks. In particu-lar, though the number of network users can be very high,just a few of them have an ‘‘important’’ role within the so-cial graph induced by the encounters. The natural behavior

M.V. Barbera et al. / Ad Hoc Networks 19 (2014) 92–110 95
of these VIP nodes, which are considerably fewer than therest of the network, can be a valuable resource in bothinformation dissemination and collection to/from the restof the network. Motivated by the fact that opportunitiesfor users to exchange data depend on their habits andmobility patterns, our idea is the following: turn thosefew VIP nodes into bridges between regular users and theInternet, each time large amount of data is to be up-loaded/downloaded by these latter ones. In a word, VIPswould act as delegates of the network infrastructurebuilder. As a side effect, this would immediately drop downthe cellular network usage. That said, in the following ofthis manuscript we will denote as covered a user that is vis-ited by a VIP node. Similarly, we will denote as a coverednetwork a network whose every user has been covered.
In our scenario, we assume that users download/uploadlarge amount of data. This would demand a lot of network-ing resources and thus, makes the use of multi-hop proto-cols unfeasible. Indeed, it is quite hard to convince theaverage user to act as a relay for others, even though tothe closest access point, of such an overloading traffic.Rather, our solution relies on the upgrade of the devices,or payment, of a small, crucial set of VIP nodes that regu-larly visit network users and collect (disseminate) data tothem on behalf of the network infrastructure. Such upgradewould serve as incentive to users to play the role of VIPs(see Section 8 for discussions on possible VIP incentives).
Now the problem becomes: How to choose the smallestVIP set that with their natural movement in the network coverall users in a certain time window? More formally, the prob-lem is defined as follows: Let N ¼ fn1; . . . ;nng be the net-work nodes and let Gi ¼ ðVi; EiÞ be the graph whose set ofvertexes Vi � N are the network nodes that have at least ameeting during the time window i, whereas the set of edgesEi represents those meetings, i.e. fu1; u2g 2 Ei iff u1 and u2
meet in the time window i. We are looking for S � N suchthat S¼ argminS�N j [i½ðVi n ðS[ fujfu; sg 2 Ei; s 2 SgÞ� j. Notethat set S can be seen as the smallest set of vertexes fromN that dominates the nodes in each Gi according to therespective Ei. Though it has a dominating set flavor, thisproblem is different from it: Indeed, here we deal with aseries of graphs instead of a singular one.
As previously mentioned, we solve this problem bypresenting two VIP selection methods that rely on eithera global or a local view of the network (the methods aredetailed in Section 4). We also present a benchmarksolution for VIP delegation. The benchmark provides anoptimal selection method that (i) requires the completepre-knowledge of users’ behavior and (ii) is based on anadaptation of the well known NP-hard problem of theMinimum Dominating Set [22]. Such a method is clearlynot feasible in real-life applications, but useful to evaluatethe performance of our social-based VIP selection methods.
4. VIP selection methods
The selection of VIPs in a social mobile network is basedon the ranking of nodes according to their social structuralattributes and requires knowledge on their mobility. Forthis, a social graph describing the tightness of links in the
network has to be designed. As the authors of [23] show,the performance of network protocols is strictly relatedto the accuracy of the mapping between the mobility pro-cess and the network social graph. They propose an onlinealgorithm that uses concepts from unsupervised learningand spectral graph theory to infer the ‘‘correct’’ graphstructure. However, this approach is not applicable in ourcase, where VIPs are to be predicted. We thus decide to fol-low a simpler method in detecting the network’s socialgraph, based on the following intuition: The movementof users guided by their interests generates repeatabilityin their behaviors (e.g., go to work/school every day, hangout with the same group of friends) [18–21]. Intuitively, byobserving meeting patterns for a certain monitoring periodreveals enough information to characterize the tightness ofthe social links in the network graph.
In a real-life application, we could imagine the networkinfrastructure builder asking participating users to log theirmeetings for a certain time, called here as monitoring period.These logs serve then to build the networks’ social graph onwhich the VIPs selection is made. More specifically, frommobility patterns and wireless interactions of users in a net-work, we establish a social undirected graph GðV ; EÞ, whereV is the set of users and E is the set of social ties (encounters)among them. Note that such social graph is different fromeach of the Gi ¼ ðVi; EiÞ we mentioned in the previous sec-tion. Indeed, Gi represents exactly who meets who in a cer-tain time window i; whereas G is only a representation ofthe tightest friendship relations among network nodes thatappears during the monitoring period, which is composedof a set of time windows i. Here, by friendship we meansome sort of mobility tie among users in the network. Thedetails of the construction of the social graph will be givenin Section 6.4. However, we anticipate that social ties(edges) in the graph GðV ; EÞ are strictly related to users’ con-tact frequency: A link exists between two users if the num-ber of times they meet is larger than a certain threshold,which depends on the considered networking scenario.
At the following, we present our global and local VIPsselection methods as well as the social structural attributesused at nodes ranking.
4.1. VIPs selection methods
4.1.1. Global VIP selectionIn the global selection, all network nodes are first
ordered according to their importance in the network,determined by their social structural attributes (seeSection 4.3). Afterwards, the smallest VIP set over theglobal social graph that covers the network during a certaintime window through direct contacts is chosen, byapplying one of the following VIP promotion methods:
� Blind global promotion. It selects the top-ranked nodesnot yet promoted, until the network is covered.� Greedy global promotion. This is a set-cover flavored
solution. In particular, it starts with promoting to VIPthe top-ranked node. After this promotion, the nodescovered by this VIP are dumped and ranking on theremaining nodes are re-computed. Again, the procedureis repeated until the network is covered.

96 M.V. Barbera et al. / Ad Hoc Networks 19 (2014) 92–110
4.2. Hood VIP selection
The second strategy, neighborhood VIP delegation, isbased on the intuition that repetitive meetings among peo-ple happen usually in the same places. The mobile socialnetwork generated by this behavior encompasses, besidescontact locality, well tight social-community sub-struc-tures. With this in mind, the hood strategy aims to covereach community at a time, independently from other com-munities. It selects hood VIPs by their importance withinthe communities they belong to. Before doing so, we firstdetect social-communities using the k-clique communityalgorithm [18]. The reason behind this choice is that thek-clique algorithm can detect overlapping communities,i.e., nodes may appear to belong to more than one commu-nity. This characteristic of the k-clique algorithm makes itwell suited for a scenario like ours in which people belongto more than one social community (e.g. gym membersthat are also computer science students, etc.). This is alsothe reason why the k-clique algorithm is widely used inthe area of social mobile networking [19,24,25,27]. Finally,to study the overlapping between communities, we use theJaccard similarity index [26]. For two sets A and B is com-puted as: JA;B ¼ jA\Bj
jA[Bj.
Afterwards, we rank members of each communityaccording to their importance in the network (seeSection 4.3). Then, we start covering each community bypromoting its members to VIPs similarly to the global VIPsmethods:
� Blind hood promotion. It continuously selects the top-ranked nodes not yet promoted in the community, untilthe network is covered.� Greedy hood promotion. The highest-ranked member in
the community is promoted, nodes it covers withinthe community are dropped, and rankings are com-puted again in the remaining graph.
In both promoting ways, when the whole community iscovered, the procedure continues with another one, untilall the communities are covered.
4.3. Social structural attributes of nodes
We define the importance of a node in the network byapplying to the network social graph several structuralattributes: betweenness centrality, closeness centrality,degree centrality, and PageRank. All these are well-knownattributes in social network theory [28,29]:
4.4. Betweenness centrality
Measures the number of occurrences of a node in theshortest-path between pairs of others nodes. It thus deter-mines ‘‘bridge nodes’’ that, with their movement, act asconnectors between node groups (communities). For agiven node k it is calculated as:
CBðkÞ ¼XN
j¼1j–k
XN
i¼1i–k
gi;jðkÞgi;j
;
where N is the number of nodes in the network, gi;j is thetotal number of shortest paths linking i and j, and gi;jðkÞis the number of those shortest paths that include k.
4.5. Degree centrality
Ranks nodes based on the number of their direct ties(i.e., neighbors) in the graph. It identifies the most popularnodes, also called hubs in social network theory, possibleconduits for information exchange. Degree centrality is cal-culated as: CDðkÞ ¼
PNi¼1aðk; iÞ, where aðk; iÞ ¼ 1 if k and i
are linked, and aðk; iÞ ¼ 0 otherwise.
4.6. Closeness centrality
Ranks higher nodes with lower multi-hop distance toother nodes of the graph. It describes ‘‘independent nodes’’that do not dependent upon others as intermediaries orrelayers of messages due to their closeness to other nodes.The closeness centrality for a node k is calculated asCCðkÞ ¼ N�1PN
i¼1dðk;iÞ
, where dðk; iÞ is the length of the shortest
path between nodes k and i. To deal with disconnectionsit is computed within the subgraph induced by the ele-ments of the connected component to which k belongs.
4.7. PageRank
The well known Google’s ranking algorithm, measuresthe likelihood of nodes in having important friends in asocial graph [29]. In particular, PageRank of a node iin the social graph is given by the equationPRðkÞ ¼ 1�d
N þ dP
i2FðkÞPRðiÞjFðiÞj, where d (0 6 d 6 1) is the damp-
ing factor and FðkÞ is the set of neighbors of k in the socialgraph (the graph is undirected). The damping factor d con-trols the amount of randomness in page ranking: Valuesclose to 1 will give high PageRank to socially best-con-nected nodes.
Finally, note that, though betweenness centrality andcloseness centrality are metrics defined for multi-hopapplications, they do capture somehow the node popular-ity within the network: E.g., a very high-degree node isvery likely to have also a high closeness and a highbetweenness. This is why we considered also these metricsin our strategies.
5. Benchmark approach
To evaluate the efficiency of our strategies, we propose abenchmark approach that gives the optimal solution: 100%of user coverage in a time window of one day, with mini-mum number of VIPs. It is important to underline that thebenchmark serves only for comparison purposes, as it re-quires knowing the future to compute the exact set of VIPs.
5.1. Application scenario’s abstraction
Suppose the network has to be covered daily (i.e., thetime window i is of one day) by VIP delegates, for a periodP during which the activity of all network users is known.

Fig. 2. (a) Meeting between u; v , and w during days 1 and 2. (b–d) Rules for the construction of graph G. (e) Final representation of graph G.
M.V. Barbera et al. / Ad Hoc Networks 19 (2014) 92–110 97
Let also P be n days long. We construct a directed graphG ¼ ðV ; EÞ through the following rules (a step-by-step gen-eration of graph G is illustrated in Fig. 2):
Rule 1. Graph G has a vertex ui for each day i in which useru is active (i.e., u has at least one contact during the day).This vertex impersonates u during day i in G and is referredto as the clone of u during that day (see Fig. 2(a and b)). Theset of clones representing user u in G is denoted as Cu.
Rule 2. For every user u; Cu forms a clique in G, i.e., eachpair of clones ui; uj of user u in G is connected by twodirected edges, namely, ðui;ujÞ and ðuj;uiÞ (see Fig. 2(c)).
Rule 3. If users u and v meet on day i, then every memberut of Cu is connected to v i through an edge ðut ;v iÞ. Simi-larly, every member v t of Cv is connected to ui throughan edge ðv t ;uiÞ. In particular, G also contains edges ðv i;uiÞand ðui;v iÞ representing that u and v met on day i (seeFig. 2(c)).
The graph G constructed with the above rules repre-sents users’ behavior in the network during the whole per-iod P. Take for example a certain user u. According to Rules1 and 2, user u is ‘‘expanded’’ in G into a clique Cu, contain-ing clones of u only for the days u is active (see Fig. 2(b andc)). Moreover, if u meets v in day i, Rule 3 guarantees thatall members of Cu point to v i (see Fig. 2(d)). The intuitionbehind this rule is that outgoing edges from u0s clique indi-cate that ‘‘u can be a delegate for v on day i’’.
Rule 3 is applied to every day on which user u is active.As a consequence, all members of the u0s clique in G pointto the same members of other users’ cliques. Thus, any cloneof user u in G (any member of Cu) is enough to determinethe set of users v for which u can be a delegate, and onwhich days.
5.2. Benchmark delegates selection
Intuitively, in order to cover all the network day by day,it is enough to select as delegates the members of a
minimum out-dominating set of graph G. Moreover, sucha set of delegates is the smallest set that can achieve fullcoverage. The following theorems prove such intuition.
Theorem 1. Let MDS be a minimum out-dominating set of G.The set MDS can cover 100% of the active users for each dayi 2 P.
Proof. First recall that according to Rule 2, the set Cu ofclones of a same user u form a clique in G. Since MDS isminimum, it contains at most one clone for every user u.When members of such a set are promoted to delegates,we get at most one delegate-instance per user.
Suppose, without loss of generality, that user v is activeduring day i, i.e., v i 2 G. As MDS is a dominating set, eitherof the following cases might happen: (i) some clone v t of vis in MDS or (ii) there is at least one other node u’s cloneul 2 MDS such that the edge ðul; v iÞ is in G. In case (i), sincev t 2 MDS;v is promoted to a delegate and is covered byitself. Case (ii) can only happen if edge ðul;v iÞwas added byRule 3, i.e., u and v met during day i. Given that ul 2 MDS;uis promoted to a delegate. Thus, v is necessarily covered onday i. h
Theorem 2. Let MDS be a minimum out-dominating set of G.Let also S be the smallest set of VIP delegates able to cover, forevery day i 2 P, 100% of the active network users on day i.Then, jMDSj 6 jSj.
Proof. Suppose, on the contrary, that jSj < jMDSj. By con-struction, and with a similar reasoning used in the proofof Theorem 1 it is easy to see that S is an out-dominatingset of G. Then, by the minimum cardinality of MDS, weare done. h
The above theorems indicate how to proceed to find thebest possible solution to our problem: after constructinggraph G according to Rules 1–3, find a minimum out-dominating set of G and use the members of such set asbenchmark VIP delegates.

98 M.V. Barbera et al. / Ad Hoc Networks 19 (2014) 92–110
The minimum dominating set is notably a NP-hardproblem. Thus, to individuate our benchmark VIP dele-gates, we reduce our problem to Set Cover (equivalent toMDS under L-reductions [22]) for which a simple greedyalgorithm is known to be only a logarithmic approximationfactor away from the optimum [22]. Moreover, the inap-proximability result for this problem shows that nopolynomial algorithm can approximate better thanð1� oð1ÞÞ log n unless NP has quasi-polynomial algorithms.Thus, there is no polynomial-time algorithm with a smallerapproximation factor. The delegates obtained by this heu-ristic are then used as benchmark VIPs in our experiments.
6. Experimental setting: from data-sets to social graphs
We now give detailed information on the data-sets (realand synthetic) we use in the evaluation of our strategies.
6.1. Real data-sets
Two real data-sets are used: Dartmouth [30] (move-ment of students and staff in a college campus) and Taxis[31] (movement of taxi cabs in San Francisco). The vehicu-lar mobility of the cabs is different from human mobility(Dartmouth). However, the purpose of using the taxis traceis to test our solution’s extendibility to different contexts.
6.2. Dartmouth
Dartmouth includes SNMP logs from the access pointsacross the Dartmouth College campus from April 2001 toJune 2004. To generate user-to-user contacts from thedataset, we follow the popular consideration in the litera-ture that devices associated to the same AP at the sametime are assumed to be in contact [32]. We consider activ-ities from the 5th of January to the 6th of March 2004, cor-responding to a 2-month period during which theacademic campus life is reasonably consistent. We choseto work with the set of nodes that have a fairly stable activ-ity in time: at least 500 contacts per week with any otherdevice. This results in a set of 1146 nodes with an averageof 1060 daily active devices and 292 daily contacts in aver-age per device.
6.2.1. TaxisThe Taxi dataset contains GPS coordinates of 536 cabs
collected over 24 days in San Francisco. Here, we assumethat two cabs are in contact when their geographical dis-tance is smaller than 250 m (following suggestions of
Table 1Details on the real datasets and respective monitoring period. The term monitorinwhereas trace, for the whole trace duration.
Data set Taxi Dartmouth
Total nodes 536 1142AVG active nodes/day (trace) 491 1060AVG active nodes/day (monitoring) 429 1061.5AVG contacts/node/day (trace) 7804 292AVG contacts/node/day (monitoring) 7656 284
Piorkowski et al. [31]). This yields an average of 491 activenodes per day and 7804 daily contacts per node.
6.3. Synthetic data-sets
Synthetic traces are generated using the SWIM model[33–35], shown to simulate well human mobility from sta-tistical and social points of view. We use SWIM [35] to sim-ulate a 500-node version of the Cambridge Campus dataset(of only 36 Bluetooth enabled iMotes, 11 days long)according to the Phoenix Model (scaling by keeping thedensity constant). We call this trace SWIM-500. It simu-lates user activity during 2 months, yielding 128 daily con-tacts per node in average. Then, we scale up to 1500 nodesin two ways: (i) by keeping density constant (D-SWIM-1500) and (2) by keeping the area constant (A-SWIM-1500). The purpose of the two different scalings is to studythe behavior of our strategies in two scenarios: D-SWIM-1500 simulates an urban growing in both area and popula-tion and A-SWIM-1500 refers to a sudden over-populationof a given city with people that are there to stay for a longtime-period (e.g. students returning to the campus aftersummer holidays).
Table 1 summarizes the details of the data-sets. Notethat, although both data-sets represent campus scenarios,they yield different activity per node per day as they useddistinct technologies (Wi-Fi capable APs in Dartmouth andBluetooth-like characteristics in SWIM) in the two data-sets.
6.4. Monitoring period and social graph
As we have already discussed in Section 4, we observenodes encounters during an observation/monitoring peri-od and exploit repeatability of users’ movement patternsand recurrence of contacts among them. The used lengthof the monitoring period is not casual: It is as short as 1week and divided in time windows of 1 day. Usually, ourlife and the activities we conduct are organized on aweek-base, mostly having a common routine repeatedday by day (e.g., go to work/school or have lunch in thesame place). Such repetition also infers the common meet-ings generated by those activities.
In the case of the Taxi dataset, the repeatability of con-tacts is due to several factors including the popularity ofgeographical zones in the city (e.g., center, stations, andairports), the fixed tracks leading to such zones, and thecommon city areas covered by groups of taxis. As shownby Piorkowski et al., popularity of areas generates clustersof connectivity among cabs [31]. Taxis’ movements are
g indicates that the parameters are shown for the monitoring-period only,
SWIM-500 D-SWIM-1500 A-SWIM-1500
500 1500 1500499.98 1500 1500500 1500 1500128 130 380131 129 378

M.V. Barbera et al. / Ad Hoc Networks 19 (2014) 92–110 99
guided by clients’ (humans) necessity to reach a specificgeographic location. Thus, one week observation is againenough to predict future meetings.
Our intuition on the length of the monitoring period isalso confirmed by the results shown in Table 1. Indeed,the properties of the monitoring period are very close tothe whole trace, for each considered scenario. Hence, thismakes prediction of future meetings easy: the monitoringperiod we have chosen allows us characterizing social rela-tionships. We are then able to generate a social graph,where two users are connected only if they have met witha certain frequency – that we call social connectivity thresh-old – during the monitoring period. The social connectivitythreshold depends on the scenario considered:
� In the Dartmouth dataset, social connectivity in mostlydue to the frequentation of the same classes, or study-ing in the same library, or living in the same dormitory.All these activities generate lots of meetings amongpeople. We thus set the social connectivity thresholdin this case to be at least 1 contact per day, for at least5 days during a week.� The social connectivity threshold in the Taxi dataset is
higher due to higher speeds: at least 8 contacts perday during the monitoring period were considered.� As the SWIM-500 trace also represents a University
campus, we use the same social connectivity thresholdof the Dartmouth trace: at least 1 contact per day for atleast 5 days of the monitored week. This leads to a set of498 nodes. When scaling up with constant density (D-SWIM-1500) the social connectivity threshold remainsconstant. It increases to at least 8 contacts per day forat least 5 days of the monitored week when scaling upwith constant area (A-SWIM-1500).
The social graphs generated by the social connectivitythresholds are then used to individuate the VIP delegates,according to each of the strategies of Section 4.
6.5. Community detection
Our hood VIPs selection strategies operate on a commu-nity basis and aim at covering single communities byselecting members that are important within each com-munity. After applying the k-clique algorithm [18] todetermine the communities and with respect to the cam-pus-like scenarios, we have the following parameters: theDartmouth dataset has 24 communities of 41 membersin average, the SWIM-500 trace has 16 communities with32 members in average, the D-SWIM-1500 trace has 39communities with 39.6 members in average, and the A-SWIM-1500 has 35 communities with 44 members inaverage. Note that constant-area scaling yields less, biggercommunities.
The communities are well-knit and do not show muchintersection between them. Indeed, the average Jaccardsimilarity index [26] between intersecting communitiesis 0.038 in the Dartmouth case and about 0.025 in SWIM-500 and D-SWIM-1500 case. This result supports recentfindings on universities’ communities detected with thek-clique algorithm [19]. Conversely, in the constant-area
scaling of A-SWIM-1500, the communities have a higheroverlapping: the Jaccard similarity index in this case is0.045.
The Taxi dataset, due to the large number of contactsand the high mobility of nodes, does not present any com-munity sub-structuring. When applying the k-clique algo-rithm, we observe one huge community containingalmost 80% of the nodes, whereas the remaining 20% donot belong to any community. Thus, we decided to applyonly the global VIP selection strategies to this trace.
7. Experimental results
We analyze the performance of all our strategies interms of coverage when applied to real and synthetictraces. For better understanding the quality of the VIPsselected by each strategy, we investigate the coveragetrend with regard to an increasing number of the VIPs.The set used for coverage is updated from time to timefollowing the order in which each strategy selects VIPs.For the sake of comparison, the results for the benchmark(‘‘Bn’’) are included in the plots. We use the same tech-nique as above to build the benchmark’s trend: updatingthe VIPs set and the corresponding network coverage,following the order in which the benchmark promotesnodes to VIPs. For the PageRank attribute, we noted that,varying the damping factor in the interval ½0:51; 0:99�does not change the performance of PageRank VIPs withrespect to the VIPs selected according to other centralities.However, we decided to use d ¼ 0:85, since, for PageRank,it results in the best performance in terms of networkcoverage.
7.1. Results with real data-sets: Dartmouth case
7.1.1. Blind promotionWe show in Fig. 3 the coverage obtained by each of the
promotion strategies. The blind promotion in the globaland hood VIP selection strategies yields the results pre-sented in Fig. 3(a and b). Notice that there is a coverageefficiency gap between PageRank VIPs (referred as ‘‘PR’’in the figure) and those of other centralities (referred as‘‘BW’’, ‘‘DG’’, and ‘‘CL’’). In addition, PageRank is very closeto the benchmark, even for small percentages of delegatesconsidered. For instance, in the global blind strategy, to getto 90% of coverage, PageRank only requires the promotionof 5.93% of nodes as delegates against 3.92% with thebenchmark approach (see Table 2). Another considerationto be made is that hood selection is more effective thanglobal selection. Hence, aiming to cover the network byforcing VIP selection within different communities seemsto be a very good strategy. Nevertheless, there exist socialattributes such as PageRank that do not gain much fromthe hood selection. Indeed, global and hood PageRank VIPsperform very similarly in both data-sets. This is because,on the one hand, PageRank VIPs already target differentcommunities, even in the global case. On the other hand,betweenness, degree, and closeness centrality tend toover-select VIPs from a few network communities, andconsequently, leave uncovered many marginal ones. The

Fig. 3. Performance of the selection strategies on the Dartmouth dataset. ‘‘Bn’’ refers to the benchmark, ‘‘PR’’ to the page-rank, ‘‘BW’’ to betweennesscentrality, ‘‘DG’’ to degree centrality, and ‘‘CL’’ to closeness centrality. ‘‘H–1’’ refers to the Heuristic strategy of [16].
Table 2VIP sets cardinality to get 90% coverage on Dartmouth. The benchmarkneeds 3.92% of nodes.
G-blind (%) H-blind (%) G-greedy (%) H-greedy (%)
PR 8.98 6.89 5.93 6.19BW 15.96 9.16 8.98 6.19DG 26.96 15.09 5.93 6.19CL 47.993 26.0035 5.93 6.19
100 M.V. Barbera et al. / Ad Hoc Networks 19 (2014) 92–110
tendency of these social attributes to target only a fewcommunities is attenuated with the hood selection thatboosts their efficiency in covering the network. In Fig. 4,we show how the global strategy distributes VIPs amongcommunities of different centralities.
7.1.2. Greedy promotionWhen applying the greedy promotion, the performance
of all strategies improves considerably (see Fig. 3(c andd)). In addition, VIPs obtained with each social attributeperform very similarly to each other, in both hood andglobal selections. This is due to the capacity of the greedyapproach to not promote as VIPs nodes that are too closeto each other in the social graph. Indeed, after every node’spromotion to VIP, all its neighbors in the social graph andtheir links are removed. Since communities are very welltight, the promotion of one member can remove a largepart of the community (if not all of it). Thus, attributes suchas betweenness and closeness do not concentrate theirselection on a few communities as in the global selection.This is also confirmed by Fig. 5, where we show how thegreedy strategy distributes VIPs among communities fordifferent social attributes.
Finally, we have compared our strategies with the tar-get-sets selected by the best-performing strategy in [16]which does not rely on knowledge on the future: theHeuristic strategy. As suggested in [16], for Heuristic weexploit a History period of 1-day before the day to be cov-ered. The results are included in Fig. 3. We notice that, be-sides Closeness in the Global Blind case (Fig. 3(a)), all ourother strategies outperform Heuristic independently onthe selection methodology (either Blind/Greedy, or Glo-bal/Hood). In addition, Heuristic is very close to the perfor-mance of Global Blind Degree for VIP sets larger than 40%,though never outperforming it. These results are some-what expected: Heuristic target-sets are not to be used ina scenario like ours, but they are to be exploited in scenar-ios with multi-hop forwarding. Heuristic selects as target-set members nodes that have a peak of popularity duringsome previous day, but that, on average, are not the mostpopular ones. While this is more than enough if other net-work nodes help with multi-hop forwarding, in scenarioslike ours where network coverage relies on the VIPs only,the performance is much more sensible to the behavioralchanges of the nodes. Here we believe our training-periodcomes to help: it gives the strategies more information onthe behavior of the nodes in the network. In addition, itsimplifies the system (the set of VIPs is fixed and notre-computed daily as in Heuristic) and helps filtering-outpotentially misleading perturbations in the data. Secondly,even when the percentage of VIPs (Heuristic target-sets) ishigh enough to smooth out the first inefficiency, Heuristicis not able to distribute very well the VIPs across the differ-ent communities, which we have shown to be the reasonwhy the Pagerank and Betweenness Centrality based
Fig. 4. Distribution of VIPs per social attribute on the Dartmouth dataset with the blind global promotion strategy. The x-axis represents differentcommunities detected.
Fig. 5. Distribution of VIPs per social attribute on the Dartmouth dataset with the greedy global promotion strategy. The x-axis represents differentcommunities detected.
M.V. Barbera et al. / Ad Hoc Networks 19 (2014) 92–110 101
selection strategies significantly outperform all the otherones in the Global-Blind and Global-Greedy case.
7.2. Results with real data-sets: Taxi case
As discussed in Section 6.5, the community sub-struc-turing of the Taxi dataset is flat. This means that, due to
the high mobility of nodes, a huge unique community con-taining 80% of nodes is detected and the 20% remainingnodes do not belong to any community. Thus, only the glo-bal selection strategy is applicable to this dataset. Fig. 6shows the performance of blind and greedy global selec-tion strategies in terms of coverage for the Taxi dataset.As we can see, due to the high mobility of nodes, all
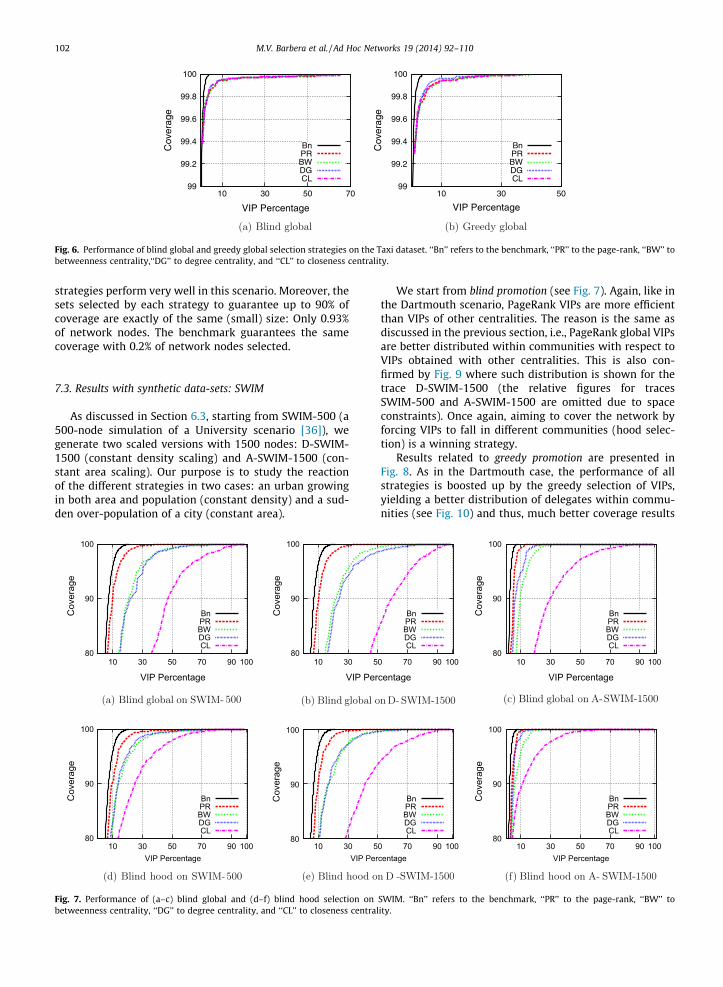
Fig. 6. Performance of blind global and greedy global selection strategies on the Taxi dataset. ‘‘Bn’’ refers to the benchmark, ‘‘PR’’ to the page-rank, ‘‘BW’’ tobetweenness centrality,‘‘DG’’ to degree centrality, and ‘‘CL’’ to closeness centrality.
102 M.V. Barbera et al. / Ad Hoc Networks 19 (2014) 92–110
strategies perform very well in this scenario. Moreover, thesets selected by each strategy to guarantee up to 90% ofcoverage are exactly of the same (small) size: Only 0.93%of network nodes. The benchmark guarantees the samecoverage with 0.2% of network nodes selected.
7.3. Results with synthetic data-sets: SWIM
As discussed in Section 6.3, starting from SWIM-500 (a500-node simulation of a University scenario [36]), wegenerate two scaled versions with 1500 nodes: D-SWIM-1500 (constant density scaling) and A-SWIM-1500 (con-stant area scaling). Our purpose is to study the reactionof the different strategies in two cases: an urban growingin both area and population (constant density) and a sud-den over-population of a city (constant area).
80
90
100
10 30 50 70 90 100
Cov
erag
e
80
90
100
Cov
erag
e
80
90
100
Cov
erag
e
VIP Percentage
BnPRBWDGCL
10 30 5
VIP Per
80
90
100
10 30 50 70 90 100
Cov
erag
e
VIP Percentage
BnPRBWDGCL
10 30 5VIP Per
Fig. 7. Performance of (a–c) blind global and (d–f) blind hood selection onbetweenness centrality, ‘‘DG’’ to degree centrality, and ‘‘CL’’ to closeness central
We start from blind promotion (see Fig. 7). Again, like inthe Dartmouth scenario, PageRank VIPs are more efficientthan VIPs of other centralities. The reason is the same asdiscussed in the previous section, i.e., PageRank global VIPsare better distributed within communities with respect toVIPs obtained with other centralities. This is also con-firmed by Fig. 9 where such distribution is shown for thetrace D-SWIM-1500 (the relative figures for tracesSWIM-500 and A-SWIM-1500 are omitted due to spaceconstraints). Once again, aiming to cover the network byforcing VIPs to fall in different communities (hood selec-tion) is a winning strategy.
Results related to greedy promotion are presented inFig. 8. As in the Dartmouth case, the performance of allstrategies is boosted up by the greedy selection of VIPs,yielding a better distribution of delegates within commu-nities (see Fig. 10) and thus, much better coverage results
80
90
100
Cov
erag
e
80
90
100
Cov
erag
e
0 70 90 100
centage
BnPRBWDGCL
10 30 50 70 90 100
VIP Percentage
BnPRBWDGCL
0 70 90 100centage
BnPRBWDGCL
10 30 50 70 90 100VIP Percentage
BnPRBWDGCL
SWIM. ‘‘Bn’’ refers to the benchmark, ‘‘PR’’ to the page-rank, ‘‘BW’’ toity.

80
90
100
10 30 50 70 90 100
Cov
erag
e
VIP Percentage
BnPRBWDGCL
80
90
100
10 30 50 70 90 100
Cov
erag
e
VIP Percentage
BnPRBWDGCL
80
90
100
10 30 50 70 90 100
Cov
erag
e
VIP Percentage
BnPRBWDGCL
80
90
100
10 30 50 70 90 100
Cov
erag
e
VIP Percentage
BnPRBWDGCL
80
90
100
10 30 50 70 90 100
Cov
erag
e
VIP Percentage
BnPRBWDGCL
80
90
100
10 30 50 70 90 100
Cov
erag
e
VIP Percentage
BnPRBWDGCL
Fig. 8. Performance of (a–c) greedy global and (d–f) greedy hood selection on SWIM. ‘‘Bn’’ refers to the benchmark, ‘‘PR’’ to the page-rank, ‘‘BW’’ tobetweenness centrality, ‘‘DG’’ to degree centrality, and ‘‘CL’’ to closeness centrality.
Fig. 9. Distribution of VIPs per social attribute on the D-SWIM-1500 dataset with the blind global promotion strategy. The x-axis represents differentcommunities detected.
M.V. Barbera et al. / Ad Hoc Networks 19 (2014) 92–110 103
with respect to the blind promotion. What is interesting tonotice here is the impact of the way of scaling in our strat-egies. When passing from SWIM-500 to D-SWIM-1500(constant density), all strategies perform very similarly in
both blind and greedy promotions. Conversely, in an emer-gency situation where the network is suddenly much moreoverloaded as a result of the over-population of the net-work area (A-SWIM-1500), our strategies perform even

Fig. 10. Distribution of VIPs per social attribute on the D-SWIM-1500 dataset with the greedy global promotion strategy. The x-axis represents differentcommunities detected.
Table 3Delegates given by each strategy to get 90% coverage on SWIM-500. Thebenchmark approach needs 7.4%.
G-blind (%) H-blind (%) G-greedy (%) H-greedy (%)
BW 21 14 9 10.6CL 48 25.4 12.8 11.6DG 23 13.6 8 8.8PR 10.8 10.2 9.8 9.6
Table 4VIP sets cardinality to get 90% coverage on D-SWIM-1500. The benchmarkapproach needs 7.06%.
G-blind (%) H-blind (%) G-greedy (%) H-greedy (%)
BW 22 17.26 9 9.93CL 59 42.06 12.93 11.6DG 24 17.2 8 9.06PR 10.9333 10.06 9 9.93
Table 5VIP sets cardinality to get 90% coverage on A-SWIM-1500. The benchmarkapproach needs 2.53%.
G-blind (%) H-blind (%) G-greedy (%) H-greedy (%)
BW 10 6.73 4 4.4CL 30 11.6 9 6.06
DG 7 5.13 4 3.53PR 5 4.33 6 4.4
Table 6Coverage potential for each strategy on Dartmouth. The benchmark’spotential is 0.91.
G-blind H-blind G-greedy H-greedy
PR 0.830 0.069 1.0 0.831BW 0.657 0.067 1.0 0.969DG 0.530 0.061 1.0 0.890CL 0.144 0.059 1.0 0.886
Table 7Coverage potential for each strategy on TAXI. The benchmark’s potential is0.96.
G-blind G-greedy
PR 0.760 1.0BW 0.758 1.0DG 0.742 1.0CL 0.745 1.0
Table 8Coverage potential for each strategy on D-SWIM-1500. The benchmark’spotential is 0.99.
G-blind H-blind G-greedy H-greedy
PR 0.888 0.558 1.0 0.992BW 0.688 0.451 1.0 0.993DG 0.607 0.288 1.0 0.994CL 0.180 0.094 1.0 0.993
104 M.V. Barbera et al. / Ad Hoc Networks 19 (2014) 92–110
better (see Figs. 7(c), (f), 8(c), and (f)). This is also con-firmed by the results shown in Tables 3–5 that contain,for each dataset, the percentage of delegates needed bythe different strategies to cover 90% of the network.
7.4. Coverage potential
To complete our study, we investigate the coverage po-tential of the first 10% of nodes promoted to delegatesaccording to each strategy. To this end, we measure, for
M.V. Barbera et al. / Ad Hoc Networks 19 (2014) 92–110 105
each delegate, the ratio of non-delegates neighbors on thesocial graph (i.e., the number of non-delegates neighbors ofdelegate i over the total number of neighbors in the socialgraph). We average then the result over the set of all dele-gates chosen by the corresponding strategy. Intuitively, thebigger this value, the larger the coverage potential ofthe strategy, and vice versa. In Tables 6–8 we present theresults for every strategy/social attribute for respectivelythe Dartmouth, Taxi and the D-SWIM-1500 trace. Becauseof space constraints we omit the tables related to SWIM-500 and A-SWIM-1500.
Note that in the global blind selection, page-rank is theone with the highest value, followed by betweenness,degree, and finally closeness. This again supports the re-sults of Fig. 3(a). The potential falls drastically when con-sidering the hood blind selection (second column ofTable 6): delegates are forced to be in the same commu-nity, in a blind way. Thus, with high probability, they aresocially connected with each other. However, PageRankremains the attribute with the highest value, supportingthe results of Fig. 3(b).
The global greedy selection naturally yields the highestcoverage potential for every attribute: after each node pro-motion, its neighbors are eliminated from the graph; thus,the ratio of non-delegate neighbors of a node is 1. The hoodgreedy selection (fourth column of Tables 6–8) leads tosmaller values. This is because selection is done on a com-munity basis and only community neighbors are elimi-nated after promotion. Since communities are not totallydistinct, it might happen that two VIP neighbors in thesocial graph belong to different communities and, conse-quently, are eliminated after the promotion, decreasingthus the coverage potential of the strategy. This effect issmaller for high betweenness nodes: they tend to belong
Fig. 11. Coverage stability in time for a
to the same group of communities (the ones that they con-nect). Closeness/degree attributes suffer less from thiseffect, as they select nodes that are central to communities.Finally, PageRank is the one that suffers most: high Page-Rank nodes are well distributed within the community towhich they belong (being communities well-knit). Thus,they are more likely to have high PageRank neighborsbelonging to other communities (that the hood greedyselection does not eliminate).
It is worth to note that the coverage potential just givesa hint on the real coverage power of a method: It doesnot affect the real ability of the selection method/attributein covering the network. Indeed, for all traces (seeTables 6–8) the coverage power of the benchmark in alltraces is less than all the values related to the global greedyselection. Regardless of the coverage potential, the bench-mark performs better with respect to every strategy. Inaddition, the results with 90% coverage presented in Tables2–5, confirm page ranks’s high performance ability whencombined with every strategy.
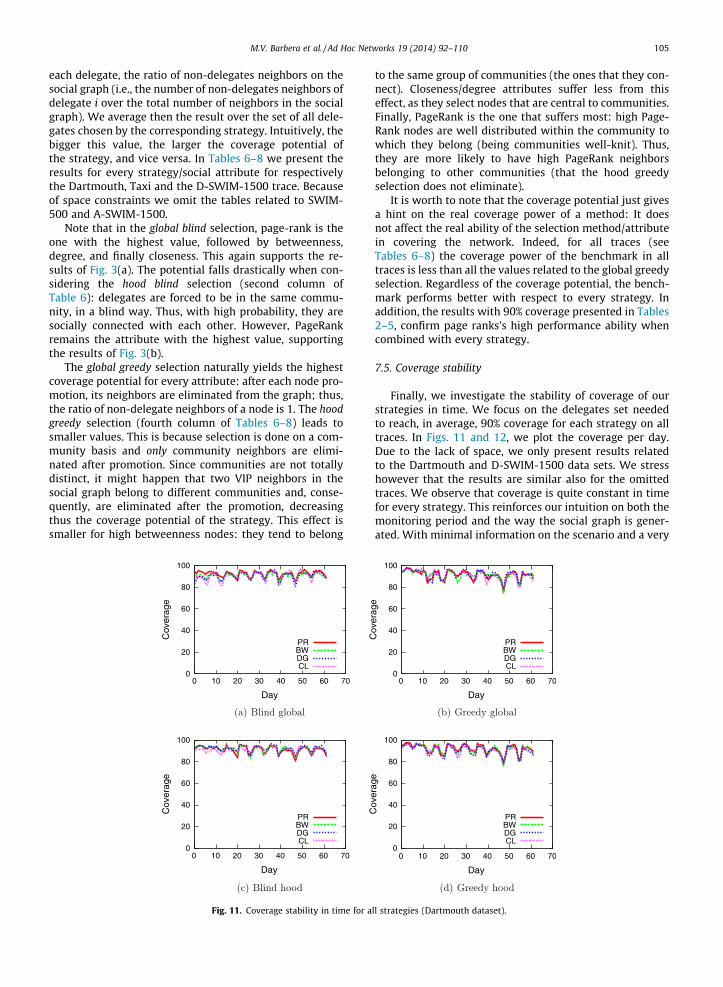
7.5. Coverage stability
Finally, we investigate the stability of coverage of ourstrategies in time. We focus on the delegates set neededto reach, in average, 90% coverage for each strategy on alltraces. In Figs. 11 and 12, we plot the coverage per day.Due to the lack of space, we only present results relatedto the Dartmouth and D-SWIM-1500 data sets. We stresshowever that the results are similar also for the omittedtraces. We observe that coverage is quite constant in timefor every strategy. This reinforces our intuition on both themonitoring period and the way the social graph is gener-ated. With minimal information on the scenario and a very
ll strategies (Dartmouth dataset).

Fig. 12. Coverage stability in time for all strategies (D-SWIM-1500 dataset).
Table 9VIP sets cardinality to get 90% coverage on D-SWIM-1500. The benchmarkapproach needs 13%. Half-day coverage interval.
G-blind (%) H-blind (%) G-greedy (%) H-greedy (%)
BW 30 25.53 15 15.63CL 70 56.33 15 15.69DG 34 28.66 15 15.65PR 18 17.46 15 15.6
106 M.V. Barbera et al. / Ad Hoc Networks 19 (2014) 92–110
short observation of the network, our strategies are able tocompute VIP sets that are small, efficient, and stable intime.
7.6. Coverage intervals vs. VIPs
The VIPs selected by our strategies are expected to cov-er all nodes every day of the data-trace by carrying datatraffic from/to the users. All our target applications (e.g.,urban-sensing related data, software updates) are delay-tolerant and would not suffer from the 1-day latency ofthe daily coverage of VIPs. But what happens for applica-tions that require coverage intervals different from1-day? How does the length of the coverage interval im-pact the selection of VIPs? Clearly, if the coverage intervalis longer, the 1-day coverage VIPs are a superset of therequired number of delegates. Indeed, for a coverage inter-val long e.g. 2 days, the 1-day coverage VIPs would performas good as in the 2-day coverage case. However, if thecoverage interval required is smaller, the VIP set requiredto cover the network is likely to change. To quantify suchchange we have also studied the half-day networkcoverage for all the traces. For both the Taxi and theA-SWIM-1500 traces we noted absolutely no differencefrom the 1-day coverage case. We believe this is due tothe high mixing and speed of movement of cabs in the Taxicase, and due to the high node density in the A-SWIM-1500trace. Recall that A-SWIM-1500 is obtained scalingSWIM-500 with constant area.
In Dartmouth, SWIM-500 and D-SWIM-1500 we ob-served a growth in the VIPs number required to assure90% of network coverage (due to lack of space here we onlyshow results related to the largest trace: D-SWIM-1500.However, we stress that both the Dartmouth and
SWIM-500 traces yield similar results). Intuitively, this isbecause the meeting patterns of the first half of the dayare different from those of the second half. The growthon the number of delegates required to cover 90% of thenetwork in the half-day coverage case is also reflected inthe benchmark’s VIPs, which are almost doubled withrespect to the 1-day coverage interval case (see Table 9).Hence, one would expect that the same should happen alsowith the VIP sets selected by our strategies. However, fromthe comparison of the 1-day coverage interval results ofTable 4 with the half-day coverage interval results ofTable 9 we note that the VIP sets have increased of about60%. This again means that selecting VIPs according totheir ‘‘importance’’ in the network is a good strategy:Indeed, most of the important people during the morningremain so also during evening. However, the coverageinterval length indeed does impact the cardinality of VIPs.This suggests for application developers or network infra-structure builders to trade off between data transfer fre-quency and number of VIPs.
To conclude, Figs. 13 and 14 show respectively, the cov-erage trend, and the performance of the different selectionstrategies for the case of half-day interval coverage. Again
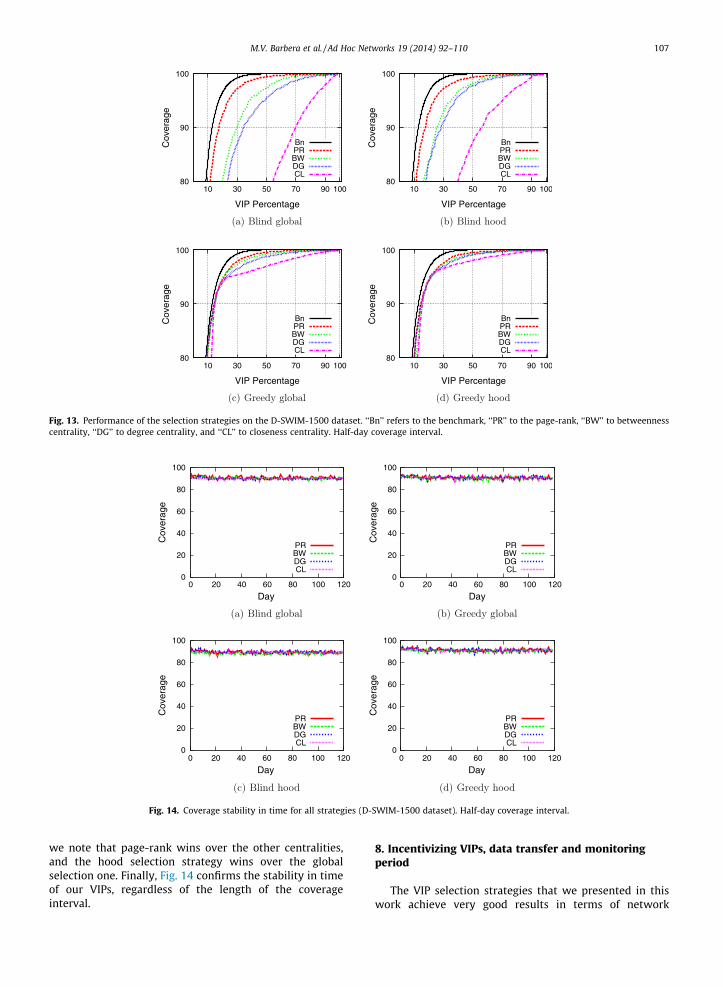
Fig. 13. Performance of the selection strategies on the D-SWIM-1500 dataset. ‘‘Bn’’ refers to the benchmark, ‘‘PR’’ to the page-rank, ‘‘BW’’ to betweennesscentrality, ‘‘DG’’ to degree centrality, and ‘‘CL’’ to closeness centrality. Half-day coverage interval.
Fig. 14. Coverage stability in time for all strategies (D-SWIM-1500 dataset). Half-day coverage interval.
M.V. Barbera et al. / Ad Hoc Networks 19 (2014) 92–110 107
we note that page-rank wins over the other centralities,and the hood selection strategy wins over the globalselection one. Finally, Fig. 14 confirms the stability in timeof our VIPs, regardless of the length of the coverageinterval.
8. Incentivizing VIPs, data transfer and monitoringperiod
The VIP selection strategies that we presented in thiswork achieve very good results in terms of network
108 M.V. Barbera et al. / Ad Hoc Networks 19 (2014) 92–110
coverage. Nonetheless, there are aspects of the VIP ap-proach that we deem important to discuss, starting withuser cooperation: The human nature is undoubtedly inher-ently selfish. So, it is very likely that no user, without beingstimulated somehow, would accept the promotion to VIP.Luckily, the number of VIPs selected by our strategies toguarantee 90% coverage is quite low (8% in SWIM, 5.93%in Dartmouth, less than 1% in Taxi). In view of this, itbecomes reasonable and convenient, from a network oper-ator point of view, to either upgrade the devices of VIP userto more fancy, recent ones, or to actually pay VIP nodes fortheir service. Considering the amount of funding thatGovernments worldwide are putting into global-sensingresearch [37–39], these incentives become feasible. An-other possibility involves considering users’ traffic load atthe delegates selection and use it to establish a maximumload threshold per delegate. Accordingly, combine it withthe social attributes for delegate selection consideringfairness and resource constraint among delegates.
Another issue to be considered is that network opera-tors cannot handle the data-traffic from/to VIPs in the clas-sic way (whenever VIPs like), as it would not be of anybenefit to offloading. A potential solution to this issue isto make VIPs use the cellular network for the data transferin different moments of the day. This way, the networkload would result distributed in time rather than concen-trated in highly congested hours. Another possibility is totransfer the data through wired networks, whenever a VIPsdevice gets connected to a broadband network during theday. After all, if VIPs are being paid to perform such task,this becomes a reasonable assumption.
A further aspect to be taken into account is the follow-ing: ‘‘How to handle the traffic of 10% of network users thatremain uncovered by our delegates?’’. As discussed above,the coverage of 90% of nodes requires the promotion asdelegates of very few and constant in time network mem-bers. This confirms the advantage of our opportunistic del-egation approach for covering a high percentage of nodesin a daily basis. Additionally, we claim that the impact ofthe few 10% non-covered nodes on the cellular networkwill be small and typically generated by nodes that aremarginal to the network (e.g., people frequenting periphe-ral areas of a city). Usually, nodes having a high activity ormostly visiting central areas in the network will be repre-sented in the constructed social graph, stressing their fre-quent encounters. In this way, we believe that such moreactive nodes will be mostly responsible for the traffic over-loading previously mentioned and will be covered by theselected delegates, with high probability. Therefore, to an-swer the previous consideration, the few remaining uncov-ered nodes could directly transfer their data using cellularnetworks, at the end of the day, once no delegate visit wasdetected.
Additionally, an important question to be asked is howdoes the monitoring period impact the VIP performance. Aswe already discussed, we believe that the monitoring per-iod length should be defined on a week-base—the week isintuitively the smallest amount of time that regularly gen-erates recurrent patterns in our lives. That said, it is impor-tant to point out that the length of the monitoring periodmight change from scenario to scenario. For the scenarios
considered in this work, a 1-week long monitoring periodturned out to work well. But, we acknowledge that forother scenarios might either be sufficient shorter monitor-ing periods, or might require longer monitoring periods.Nonetheless, the important take-away is that, social-related solutions for networking can safely rely on shortobservations of the social-properties of the society, as thepeople do preserve their movement patters in time.
That said, we acknowledge that if sudden (but perma-nent) changes happen in the network, e.g. students leavingthe campus for summer holidays, the VIPs selected a prioryprobably will lose their efficiency. In these cases, the mon-itoring period should start again to let the VIP sets adapt tothe new network conditions. Differently, we believe thatthis is not true for short-lasting (say, one day) suddenchanges in the network, like, e.g., public holidays. Intui-tively, the behavior of the people during a public holidayin the middle of the week is likely to be very similar totheir behavior during weekends: stay with family, seefriends, and so on. Because the monitoring period includesalso weekends, it is thus very likely that the VIPs selected apriory perform as good as during any weekend days in ourtraces. Nonetheless, we believe that, introducing morecomplex and adaptive techniques that monitor recurrentlythe network dynamics, like for example machine learningmechanisms, could impact positively the performance ofVIP sets. It would allow a smoother and faster adaptationof the VIPs to the changing conditions of the network itself,and to the new opportunities of communication that itbrings. Such adaptive learning approach will be consideredin a future work.
9. Conclusions
Dense metropolitan areas are suffering network over-loading due to the data-traffic generated by the prolifera-tion of smartphone devices. In this paper, we describeVIP delegation, a mechanism to alleviate such traffic basedon opportunistic contacts. Our solution relies on the up-grade of a small, crucial set of VIP nodes that regularly visitnetwork users and collect (disseminate) data to them onbehalf of the network infrastructure.
VIPs are defined according to well known social net-work attributes (betweenness, closeness, degree centralityand page-rank), and are selected according to two meth-ods: global (network-based) and hood (community-based)selection. Our observations reveals that 1 week of monitor-ing period is enough to characterize the tightness of thesocial links in the network graph. Hence, all methods relyon this network monitoring period and select VIP sets thatresult small, efficient, and stable in time. Extensiveexperiments with several real and synthetic data-setsshow the effectiveness of our methods in offloading: VIPsets of about 7% and 1% of network nodes in respectivelycampus-like and vehicular mobility scenarios are enoughto guarantee about 90% of network offload. Additionally,the performance of the VIPs selected by our methods isvery close to an optimal benchmark VIPs set computedfrom the full knowledge of the system (i.e., based on past,present, and future contacts among nodes).
M.V. Barbera et al. / Ad Hoc Networks 19 (2014) 92–110 109
References
[1] Canalys, 2010. <http://www.canalys.com/pr/2010/r2010081.html>.[2] N. Eagle, A. Pentland, Social serendipity: mobilizing social software,
IEEE Pervasive Comput. 4 (2) (2005) 28–34.[3] S. Gaonkar, J. Li, R.R. Choudhury, L. Cox, A. Schmidt, Micro-blog:
sharing and querying content through mobile phones and socialparticipation, in: ACM MobiSys, 2008.
[4] E. Miluzzo, N.D. Lane, K. Fodor, R. Peterson, H. Lu, M. Musolesi, S.B.Eisenman, X. Zheng, A.T. Campbell, Sensing meets mobile socialnetworks: the design, implementation and evaluation of thecenceme application, in: ACM SenSys, 2008.
[5] S.B. Eisenman, N.D. Lane, E. Miluzzo, R.A. Peterson, G. Ahn, A.T.Campbell, Metrosense project: people-centric sensisng at scale, in:ACM SenSys, 2006.
[6] S. Ioannidis, A. Chaintreau, L. Massoulie, Optimal and scalabledistribution of content updates over a mobile social network, in:IEEE Infocom, 2009.
[7] Customers Angered as iPhones Overload AT&T, New YorkTimes, September 2009. <http://www.nytimes.com/2009/09/03/technology/companies/03att.html>.
[8] iPhone Overload: Dutch T-Mobile Issues Refund after 3G Issues, ArsTechnica, July 2010. <http://arstechnica.com/tech-policy/news/2010/06/dutch-t-mobile-gives-some-cash-back-because-of-3g-issues.ars>.
[9] M.V. Barbera, J. Stefa, A.C. Viana, M.D. de Amorim, M. Boc, Vipdelegation: enabling vips to offload data in wireless social mobilenetworks, in: IEEE DCOSS, 2011.
[10] V. Chandrasekhar, J. Andrews, A. Gatherer, Femtocell networks: asurvey, IEEE Commun. Mag. 46 (9) (2008) 59–67.
[11] AT&T, Verizon Wireless Join Wi-Fi Interoperability Group, June 2010.<http://news.cnet.com/8301-30686_3-20008476-266.html>.
[12] A. Balasubramanian, R. Mahajan, A. Venkataramani, Augmentingmobile 3g using wifi, in: ACM MobiSys, 2010.
[13] K. Lee, I. Rhee, J. Lee, Y. Yi, S. Chong, Mobile data offloading: howmuch can wifi deliver?, in: ACM SIGCOMM 2010, 2010.
[14] B.K. Polat, P. Sachdeva, M.H. Ammar, E.W. Zegura, Message ferries asgeneralized dominating sets in intermittently connected mobilenetworks, in: ACM MobiOpp, 2010.
[15] B. Han, P. Hui, V.S.A. Kumar, V.M. Marathe, G. Peig, A. Srinivasan,Cellular traffic offloading through opportunistic communications: acase study, in: ACM CHANTS, 2010.
[16] B. Han, P. Hui, V.S.A. Kumar, V.M. Marathe, J. Shao, A. Srinivasan,Mobile data offloading through opportunistic communications andsocial participation, IEEE Trans. Mob. Comput. (2012).
[17] J. Whitbeck, Y. Lopez, J. Leguay, V. Conan, M.D. de Amorim, Push-and-track: saving infrastructure bandwidth through opportunisticforwarding, Pervasive Mob. Comput. (2012).
[18] G. Palla, I. Derenyi, I. Farkas, T. Vicsek, Uncovering the overlappingcommunity structure of complex networks in nature and society,Nature 435 (7043) (2005) 814–818.
[19] P. Hui, People are the Network: Experimental Design and Evaluationof Social-based Forwarding Algorithms, Ph.D. Thesis, UCAM-CL-TR-713. University of Cambridge, Computer Laboratory, 2008.
[20] M.C. Gonzalez, C.A. Hidalgo, A.-L. Barabasi, Understanding individualhuman mobility patterns, Nature 453 (2008) 779–782.
[21] C. Boldrini, M. Conti, A. Passarella, The sociable traveller: humantraveling patterns in social-based mobility, in: ACM MobiWac, 2009.
[22] V. Kann, On the Approximability of NP-Complete OptimizationProblems, Ph.D. Thesis, Department of Numerical Analysis andComputing Science, Royal Institute of Technology, Stockholm, 1992.
[23] T. Hossmann, T. Spyropoulos, F. Legendre, Know thy neighbor:towards optimal mapping of contacts to social graphs for dtnrouting, in: IEEE INFOCOM’10, 2010.
[24] P. Hui, J. Crowcroft, E. Yoneki, BUBBLE Rap: social-based forwardingin delay tolerant networks, in: ACM MobiHoc, 2008.
[25] A. Mei, J. Stefa, Give2Get: forwarding in social mobile wirelessnetworks of selfish individuals, in: IEEE ICDCS, 2010.
[26] P. Jaccard, Étude comparative de la distribution florale dans uneportion des Alpes et des Jura, Bull. Soc. Vaudoise Sci. Nat. 37 (1901)547–579.
[27] A. Mei, J. Stefa, Give2Get: forwarding in social mobile wirelessnetworks of selfish individuals, in: IEEE Transactions on Dependableand Secure Computing, 2012.
[28] L.C. Freeman, Centrality in social networks conceptual clarification,Soc. Netw. 1 (3) (1979) 215–239.
[29] S. Brin, L. Page, The anatomy of a large-scale hypertextual websearch engine, Comput. Netw. ISDN Syst. 30 (1998) 107–117.
[30] T. Henderson, D. Kotz, I. Abyzov, J. Yeo, CRAWDAD tracedartmouth/campus/movement/01_04 (v. 2005–03–08). <http://crawdad.cs.dartmouth.edu/dartmouth/campus/movement/01_04>.
[31] M. Piorkowski, N.S.-Djukic, M. Grossglauser, A parsimonious modelof mobile partitioned networks with clustering, in: COMSNETS,2009.
[32] A. Chaintreau, P. Hui, J. Crowcroft, C. Diot, R. Gass, J. Scott, Impact ofhuman mobility on the design of opportunistic forwardingalgorithms, IEEE Trans. Mob. Comput. 6 (6) (2007) 600–620.
[33] A. Mei, J. Stefa, SWIM: a simple model to generate small mobileworlds, in: IEEE Infocom, 2009.
[34] S. Kosta, A. Mei, J. Stefa, Small world in motion (SWIM): modelingcommunities in ad-hoc mobile networking, in: IEEE SECON, 2010.
[35] S. Kosta, A. Mei, J. Stefa, Large-scale social mobile synthetic networkswith SWIM, IEEE Trans. Mob. Comput. (2014).
[36] J. Leguay, A. Lindgren, J. Scott, T. Riedman, J. Crowcroft, P. Hui,CRAWDAD trace upmc/content/imote/cambridge (v. 2006–11–17).<http://crawdad.cs.dartmouth.edu/upmc/content/imote/cambridge>.
[37] CENS Urban Sensing. <http://urban.cens.ucla.edu/projects>.[38] MIT Senseable City Lab. <http://senseable.mit.edu>.[39] EARSeL. <http://www.earsel.org/?target=SIGs>.
Marco Valerio Barbera is a PhD student atthe Computer Science Department of Sapien-za University of Rome, Italy. He received theLaurea degree in Computer Science, summacum laude in 2009. From March 2011 toDecember 2011 he was a visiting fellow at theNetwork Security Lab of the Columbia Uni-versity, NY, USA. His research interestsinclude mobile cloud computing, distributedsystems, and analysis and modeling of socialmobile wireless networks.
Aline Carneiro Viana is a Senior Researcher atINRIA Saclay. Dr. Viana received her MScdegree in Electrical Engineering in 2001 fromthe Federal University of Goi�s, after spendingone year at the Polytechnic School of theFederal University of Rio de Janeiro, Brazil.She got her PhD in Computer Science from theUniversity Pierre et Marie Curie in 2005. Afterholding a postdoctoral position at IRISA/INRIARennes, she joined INRIA Saclay in 2006. Shewas an Invited Researcher at the TKN Group ofthe Technical University of Berlin in 2010. Her
research is primarily in data management and routing in wireless self-organized networks.
Marcelo Dias de Amorim is a CNRS perma-nent researcher at the computer science lab-oratory (LIP6) of UPMC Sorbonne Universites,France. His research interests focus on thedesign and evaluation of dynamic networks aswell as service-oriented architectures. Formore information, visit http://www-npa.lip6.fr/�amorim.

110 M.V. Barbera et al. / Ad Hoc Networks 19 (2014) 92–110
Julinda Stefa is a Post-Doc at the ComputerScience Department of Sapienza University ofRome, Italy. She received the Laurea degree inComputer Science, summa cum laude, and thePhD in Computer Science from Sapienza Uni-versity of Rome respectively in July 2006 andFebruary 2010. In 2005 she joined GoogleZurich for 3 months as an engineering intern.She was a visiting scholar at the CS Dept. ofUNC-Chapel Hill, USA, from From November2008 to April 2009, and a Research Intern atMicrosoft Research, Cambridge, UK, from
January to April in 2011. Her research interests include computer systemsand network security, parallel and distributed systems, and analysis and
modeling of social mobile wireless networks. She has published in someof the topmost conferences and journals like IEEE INFOCOM, ACMMobiHoc, IEEE ICDCS, and IEEE Transaction on Computers, and is involvedas reviewer and in technical program committees of several conferencesand workshops in the field. She is winner of a research grant fromWorking Capital PNI and offered by Telecom Italia (30 winners out of2138).