AD-AI14 793 BATTELLE COL4.WB3JS LASS O FORGED MAR L … · 2014-09-27 · forging, hot forging,...
71
AD-AI14 793 BATTELLE COL4.WB3JS LASS O SHEAR BANDS IN FORGED PROOUCTS.U) F/6 11/6 MAR 82 S L SERIATIN. S 0 LANOTI. S 1 0*4 AFOSR-79-*48 UNCLASSZFIED AFOSR-TR-82-O392 NL I Ih EIEE EE lIN 82 n L:! I6 2l
Transcript of AD-AI14 793 BATTELLE COL4.WB3JS LASS O FORGED MAR L … · 2014-09-27 · forging, hot forging,...

AD-AI14 793 BATTELLE COL4.WB3JS LASS OSHEAR BANDS IN FORGED PROOUCTS.U) F/6 11/6MAR 82 S L SERIATIN. S 0 LANOTI. S 1 0*4 AFOSR-79-*48UNCLASSZFIED AFOSR-TR-82-O392 NL
I Ih EIEE EElIN82 n
L:! I6
2l

11111 L 12)'~1N1U.0 M
aggI&' * 1 2 ." &36Ii.
1.4

UNCLASSIFIEDSECURITy CLASSIFICATION OF TIIS PAGE (*?Son Da# Entered)
PORT DOCUMENTATIONINSTRUCTIONSREPOT DCUMNTATON AGEBEFORE COMPLETING FORM
iREPORT NUMBER 7ar. qOVT ACCESSIO NO. S. RECiPiENT'S CATALOG NUMBERAFOSR.TR. 82-0392 )A '(3"4. TITLE (and Subtit e) S. TYPE OF REPORT & PERIOD COVERED
SHEAR BANDS IN FORGED PRODUCTS FINAL TECHNICAL (1979-1982)6. PERFORMING ORO. REPORT NUMBER
7. AUTHOR(c) B. CONTRACT OR GRANT NUMBER(s)
S. L. SEMIATIN, G. D. LAHOTI, S. I. OH, AFOSR-79-0048A. L. HOFFMANNER, AND T. ALTAN
. PERFORMING ORGAN NNAME AND ADDRESS PROGRAM ELEMENT. PROJECT. TASKAREA A WORKANIT NUMBERS
BATTELLE' S COLUMBUS LABORATORIES 6, 0 / 4 /6505 KING AVENUECOLUMBUS. OHIO 43201
It CONTROLLING OFFICE NAME AND ADDRESS 12. REPORT DATEAIR FORCE OFFICE OF SCIENTIFIC RESEAR MARCH, 1982
DIRECTORATE OF ELECTRONIC AND SOLID STAE SCIENCE! IS. NUMBER OF PAGESBOLLING AIR FORCE BASE, D.C. 20332 65
Is. MONITORING AGENCY NAME & ADDRESS(If dllferent from Cntfrolitnd Office) IS. SECURITY CLASS. (of this report)
UNCLASSIFIED_ISa. DECL ASSIFICATION/DOWNGRADING
SCHEDULE N.A.
16. DISTRIBUTION STATEMENT (of this Report)
Approved for public release ,distributLontuiLdted,
17. DISTRIBUTION STATEMENT (of the abstract enteedi Bl Eoc 20. i different free, Report) D17'" ( ,~ELECT m-
ML AY 2 4 198218, SUPPL EMENTARY NOTES L
1S. KEY WORDS (Continue on reverse side if neceseary and Identify by block nuaber)
Titanium alloys, shear bands. localized deformation, instability, flowsoftening, hot torsion, lateral sidepressing, conventional forging, isothermalforging, hot forging, localization parameter, heat transfer, shear band
Cl. fracture, tensile behavior, creep behavior, and fatigue behavior.
C) 20. ABSTRACT (Conelnue an reverse side If ncoeorv amd identify by block mrmber)
Shear bands, intense bands of localized deformation, are a primary sourceof defective forgings and their occurrence is a significant factor limitingthe precision attainable by forging. During this program, the occurrence ofshear bands in both isothermal, hot forging and conventional, non-isothermalhot forging has been determined for the alloy Ti-6A1-2Sn-4Zr-2Mo-0.1 Si(TI-6242). Lateral sidepressing of Ti-6242 cylinders was used to determinethe strain rate and temperature regimes in which shear bands may developduring isothermal, hot forging. From these observations, workability mans.
D I RA". 1473',DD A 473 UNCLASSIFIED
8 2 05 24 128 ZSCURITY CLASSIFICATION OF THIS PAE (fte Data Entered)

.UNCLASSIFIEDSECVRITY CLASSIFICATION OF THIS PAGE(Itbon Data fateu~d)
denoting process conditions which lead to shear bands were developed. A simpleinstability model based on these data and observations of shear localizationin torsion tests was used in conjunction with measured material data tointerpret the results. This model established the important influence of theflow localization parameter a (ratio of the work softening rate to the strain-rate sensitivity parameter) on the tendency to form shear bands. More in-depthanalysis, making use of an advanced computer code, confirmed the applicabilityof the simple instability model and established the capability of describingthe detailed process by which shear bands initiate as well as propagate.Uniaxial compression of cylinders, lateral sidepressing of cylinders, andforging of an airfoil shape were employed to document the occurrence of shearbands in non-isothermal (conventional), hot forging of Ti-6242. Run in mechani-cal and hydraulic presses, these forging operations established working speedas the most important process variable affecting the die chilling whichcontrols the development of shear bands non-isothermally. Even though shearbands occurred at both mechanical as well as hydraulic press speeds, thedeformation at the low hydraulic press speed was so severe as to lead tofracturing along the shear bands. Other process variables such as lubrication,dwell time, preheat temperature, and die temperature were also found to havesome influence on heat transfer and die chilling and, hence, on the severityof flow localization. A simple analysis was used to rationalize these observa-tions and, offer direction for more detailed process simulation of non-isother-mal forging. Lastly, the effect of shear bands in forged products of TI-6242on service properties was determined. Characterization of tensile, fatigue,and creep properties on forgings containing shear bands was done at 510 C(950 F), the maximum operating temperature of Ti-6242 forgings in jet engines.From these tests, it was found that the effect of thP shear bands was small.In the vast majority of the characterization tests, fracture initiation andfracture propagation sites lay in the homogeneously-deformed bulk of theforging and not at the shear bands. The effects of shear bands on propertiesthat were observed, however, were ascribed to either the generally higherhardness of the shear bands as compared to the homogeneously-deformed bulk ofthe forgings (tensile properties) or enhanced diffusion along shear bands(creep properties).
UNCLASSIFIEDSICURTY CLAWFICATIOI OF THIS PA$9SWhm egD*e *..^
-- " m memmm m

&EOSR-TR. 82-0392
FINAL TECHNICAL REPORT
on
SHEAR BANDS IN FORGED PRODUCTS
(Grant No. AFOSR-79-0048)
to
DEPARTMENT OF THE AIR FORCEAIR FORCE OFFICE OF SCIENTIFIC RESEARCH
BOLLING AIR FORCE BASE, D.C. 20332
March 15, 1982
by
Accession ForNTIS ",RA&I
S. L. Semiatin, G. D. Lahoti, S. I. Oh, DTI []
A. L. Hoffmanner, and T. Altan U..a
ByDistribution/Availability Codes
1"SpgamoAvail and/or2l Dist Special
BATTELLE £prroWed for plable ?LOSS1
Columbus Laboratories d1strwiUt1=Uo =m1wtd"*505 King Avenue
Columbus, Ohio 43201
__________

FINAL TECHNICAL REPORT
on
SHEAR BANDS IN FORGED PRODUCTS(Grant No. AFOSR-79-0048)
to
DEPARTMENT OF THE AIR FORCEAIR FORCE OFFICE OF SCIENTIFIC RESEARCH
BOLLING AIR FORCE BASE, D.C. 20332
from
BATTELLE
Columbus Laboratories
by
S. L. Semiatin, G. D. Lahoti, S. I. Oh,A. L. Hoffmanner, and T. Altan
March 15, 1982
ABSTRACT
Shear bands, intense bands of localized deformation, are a primary
source of defective forgings and their occurrence is a significant factor
limiting the precision attainable by forging. The occurrence and effects of
shear bands are not well understood. There is no test for predicting theiroccurrence and, therefore, they are averted by the inefficient and costly useof oversize forgings and in-process die reworking. The overall objective of
this program is to document the occurrence of shear bands in forged products
produced under well defined conditions, develop analytical techniques fortheir prediction, and evaluate their effects on structural performance-Theproposed approach is based on characterizing the deformation behavior ftitanium alloy, Ti-6242, of interest to the Air Force; employing the results
of the characterization as input for a mathematical model of the deformation
process to predict shear band formation; and evaluating the effects of shearArH ?O"Z 071!l a o sCZDJ?!rr iAR(ewi (4mS)bands on structural-test performance. FIM 0 OF TRARSTTAL 0 DTIC
This teohnical report has been reviewqd nd isapproved for public release Aw AfR 190-12.
*0o Distribution is unlimited.
Chief,__ __~a hi~Qt1v'&,
2
Lateral sidepressing of Ti-6Ai-2Sn-4Zr-2Mo-0.1 Si (Ti-6242)
cylinders was used to determine the strain rate and temperature regimes in
which shear bands may develop during isothermal, hot forging. From these
observations, workability maps, denoting process conditions which lead to
shear bands were developed. A simple instability model based on these data
and observations of shear localization in torsion tests was used in conjunction
with measured material data to interpret the results. This model established
the important influence of the flow localization parameter a (ratio of the
work softening rate to the strain-rate sensitivity parameter) on the tendency
to form shear bands. More in-depth analysis, making use of an advanced
computer code, confirmed the applicability of the simple instability model
and established the capability of describing the detailed process by which
shear bands initiate as well as propagate.
Uniaxial compression of cylinders, lateral sidepressing of cylinders,
and forging of an airfoil shape were employed to document the occurrence of
shear bands in non-isothermal (conventional), hot forging of Ti-6242. Run
in mechanical and hydraulic presses, these forging operations established
working speed as the most important process variable affecting the die
chilling which controls the development of shear bands non-isothermally.
Even though shear bands occurred at both mechanical as well as hydraulic
press speeds, the deformation at the low hydraulic press speed was so
severe as to lead to fracturing along the shear bands. Other process
variables such as lubrication, dwell time, preheat temperature, and die
temperature were also found to have some influence on heat transfer and
die chilling and, hence, on the severity of flow localization. A simple
analysis was used to rationalize these observations and offer direction
for more detailed process simulation of non-isothermal forging.
Lastly, the effect of shear bands in forged products of Ti-6242
on service properties was determined. Characterization of tensile, fatigue,
and creep properties on forgings containing shear bands was done at 510 C
(950 F), the maximum operating temperature of Ti-6242 forgings in jet
engines. From these tests, it was found that the effect of the shear bands
was small. In the vast majority of the characterization tests, fracture
initiation and fracture propagation sites lay in the homogeneously deformed
bulk of the forging and not at the shear bands. The small effects of shear
"Non." ... . ... II.I.II.II...

3
bands on properties that were observed, however, were ascribed to
either the generally higher hardness of the shear bands as compared to
the homogeneously-deformed bulk of the forgings (tensile properties) or
enhanced diffusion along shear bands (creep properties).
SUMMARY OF RESULTS AND THEIR SIGNIFICANCE
This program was performed over a three-year period. The objectives
of the first year's work were to characterize the program alloy, develop and
validate deformation-heat transfer models, and establish instability criteria.
These objectives were pursued under the following tasks: -
Task 1. Materials Characterization
Task 2. Determination of Fracture Strains and Fracture
Mode in Undaxial Tension
Task 3. Deformation Heating and Heat Transfer Tests
Task 4. Simple Shear Deformation Trials (and Preliminary
Shear Band Observations)
Task 5. Modeling of Heat Transfer and Deformation.
During the second year, the objective was to apply the deformation-
heat transfer analysis and instability criteria to actual forging situations
in order to predict the occurrence of shear bands. This work was conducted
under the following tasks:
Task 1. Shear Bands in Isothermally-Forged Ti-6242
Task 2. Shear Bands In Non-Isothermally-Forged Ti-6242
Task 3. Shear Bands in a Complex Forging
Task 4. Analysis and Modeling.
The objective of the third year' s program was to establish the
effect of shear bands on service properties in forged products of Ti-6242.
This objective was met by the following tasks:
Task 1. Generation of Shear Bands under Controlled
Conditions
Task 2. Effect of Heat Treatment on Microstructures
of Forged Samples With and Without Shear
Bands
Task 3. Evaluation of Tensile Properties
4
Task 4. Evaluation of Creep Properties
Task 5. Evaluation of Fatigue Properties.
The results of the first two years of the program have been presented
and discussed in detail in the first two yearly reports and several published
papers. However, for completeness, they will be summarized under the major
headings of (A) Materials Characterization, (B) Instability Criterion,
(C) Shear Band Occurrence and Prediction in Isothermal Forging, and (D) Shear
Band Occurrence and Prediction in Non-Isothermal Forging. Following this, the
third year's results will be discussed under the general heading of The
Effect of Shear Bands on Service Properties.
Materials Characterization
Materials Selection
After consultation with personnel at the Air Force Materials
Laboratory (A. M. Adair, H. Gegel) and AFOSR, the titanium alloy Ti-6242
(Ti-6A1-2Sn-4Zr-2Mo-0.l Si) was selected as the program alloy. This alloy is
similar to Ti-64 (Ti-6A1-4V) but has a slightly higher operating temperature
and is expected to be used increasingly in jet engines in coming years. Shear
bands are common in a+6 titanium alloys such as Ti-6242 and Ti-64. The Ti-6242
was supplied by Wyman-Cordon Company of North Grafton, Massachusetts, and met
the AMS specification for forging bar stock. The material had been forged
at 954 C (1750 F) and heat treated at 968 C (1775 F) yielding a microstruc-
ture of equiaxed a in a transformed S matrix, hereafter referred to as the
a+8 microstructure (Figure 1). Some of this material was heat treated at
1010 C (1850 F) for 30 minutes and air cooled to produce a transformed,
acicular basketweave microstructure, hereafter referred to as the 8 micro-
structure (Figure 1). The 0 transus had been specified as 988 C (1810 F).
Compression Tests
Isothermal compression testing was used to characterize the stress-
strain behavior of the program alloy. Compression testing was selected to
provide stress-strain data at large strains for deformation analyses and
I

5
(a) I(a) IBar Axis
(b)
FIGURE 1. (a) a+O and (b) $ Microstructures of Ti-6242
Program Alloy (500X)
__ -~i

6
because computer programs and verified analytical techniques exist at Battelle
for accurate interpretation of the results. A test fixture with superalloy
tooling was constructed with Battelle funds to run the hot, isothermal comn-
pression tests on an MTS machine (Figure 2). All testing was performed with
test specimens precoated with glasses to provide lubrication and protection
from the atmosphere. Specimens of both microstructures (a+6 and 6) were tested
at constant true strain rates of 0.001, 0.1, 1.0, and 10.0 sec.-. The ci+
microstructure was tested at 816, 871, 913, 954, and 1010 C (1500, 1600, 1675,
1750, and 1850 F). The microstructure was characterized only at the first
four of these temperatures since at 1010 C (1850 F), both microstructures
revert to the single-phase bce micros tructure.
The compression data exhibited a marked difference in basic be-
havior between ai+$ and 0 microstructure material. The ci+a load-stroke curves
increased monotonically, whereas the load-stroke curves were generally
decreasing or constant with respect to stroke. Due to the non-increasing
nature of the 6 load-stroke curves, compression specimens of this structure
tended to deform non-uniformily, an observation similar to that made in(1)mechanical-press-compression tests on this alloy for the disk program
The difference in load-stroke curves for the two microstructures carried
over to the stress-strain curves. The B stress-strain curves generally
showed much larger degrees of flow softening (2 ) than the ci+O stress-strain
curves, an effect which was later found to be very important in the develop-
ment of shear bands, particularly in isothermal forging.
Modeling of the deformation processes under investigation required
knowledge of the flow stress as a function of strain, strain rate, and
temperature. For this reason, the stress-strain data at a given strain rate
were cross-plotted in terms of stress versus temperature at given levels of
strain. Because of deformation heating, however, flow stress values at the
higher strain levels for a test at a given nominal test temperature are
actually representative of the deformation resistance at somewhat higher
temperatures. The temperature rises were calculated assuming 95 percent of
the deformation work (area under the stress-strain curve) was converted into
heat. Sample stress-temperature data corrected for adiabatic heating are
shown in Figure 3. It is seen that data for the at+$ microstructure fall

7
0 z 6 a .0 C.'.l,''
FIGURE 2. Hot-Isothermal Compression Test Fixture. (1 -superalloy compressiondie, 2 - superalloy die retainer ring, 3 - superalloy die support, 4 -stainless steel support ret kiner ring 5 -ceramic insulator, 6 mstain-less steel compression too., ~ base -resistance furnace, 8 -two-post die set.)

8
'EM0E0A'v0lm 0,++P. 'EM i t f t9 00 '600 '700 O8Cs. '900, 90. O'C ,o, -+ .
-- 0.03"0 (.00
0 000 60o 00050
400 6.u C 40 o.,I
, 0..
200 3D o
20
'00
0 01W ,,0 901 90 000 S "OC 9C 9,c oo:
TE MPERATUIE (C) TEMPERA T
UR
E .,C9
(a) (b)
'rPE"Alu9E (f)TEMPERA'TUE FI is0 W 00 700 '800 '900
.6CC eo 7100 '800 s
F=;500 -T 7.5
f.0 -0 o.00
*0om -~ V.00
so,+
&300
20
800 ax0 90 990 o~
TEMPERATURE IQC
(C)- oo so 990 000.TEMPERATURE (C)
(d)
FIGURE 3. Flow Stress as a Function of Temperature after Correction for AdiabaticHeating: (a) a+$ Microstructure, t - 0.1 Sec. -l, (b) a+8 Microstructure?- 1.0 Sec. - I , (c) $ Microstructure, e - 0.1 Sec.- I , and (d) B Micro-
structure, - 1.0 Sec.- .
- - -. Y 4.
SQ
on the same trend line except for low temperature-high strain rate combinations.
The major conclusion is that a truly isothermal high strain rate hot compression
test for this structure would yield a steady state flow stress dependent only
on temperature and strain rate, but not strain except at low temperatures and
high strain rates where there is still a non-neglibible amount of initial
work hardening in the flow curves. The trend lines for the crlf structure
were used in modeling the deformation and unstable flow behavior to be discussed
subsequently.
Sample temperature-corrected data for the B structure are also shown
in Figure 3. Whereas adiabatic heating was found to be the major source of the
observed flow softening for the ct+B structure, the "corrected" data for the
structure demonstrated that an additional source of softening exists for the
Widmanstatten structure. It is believed that changes in the morphology of the
Widmanstatten colonies and a reduction of dislocation density from a high non-
equilibrium value in the as-$ annealed condition are the source of the additional(3)softening which has also been observed in other HCP metals . Because a
technique for quantitatively estimating the level of softening could not be
found, modeling of the deformation and unstable flow behavior of $ structure
was done using sets of trend curves such as those in Figure 3.
The flow stress data in compression were used in obtaining strain
rate sensitivity exponents (m in a - M. The values determined were applied
in deformation analyses to be discussed subsequently.
Tensile Tests andThermal Property Characterization
Tensile tests were also run at 816, 913, and 982 C (1500, 1675, and
1800 F) to obtain flow stress data to support the compression flow stress data,
which were used in the deformation analyses. These tests were also run in an
MTS (at nominal strain rates of 1.5 and 15 per second), and the flow stress
data so obtained showed good agreement with the compression flow stress data.
The program materials were also characterized from the standpoint of
their thermal properties. To do this, specific heat values were estimated from
the published literature and tests, performed under this program, in which the
temperature rises caused by deformation heating were actually measured. In

10
addition, "static" heat transfer experiments in which a hot Ti-6242 sample was
placed in contact with room temperature IN-100 dies were performed to obtain
values of thermal diffusivity. The thermal properties so obtained were used
in the analysis stages of this research program.
Instability Criterion
Torsion Tests
Constant rotation rate torsion tests were run to develop an in-
stability criterion and to establish the occurrence of shear bands in the program
alloy under conditions of nominally isothermal, pure shear. To this end, an
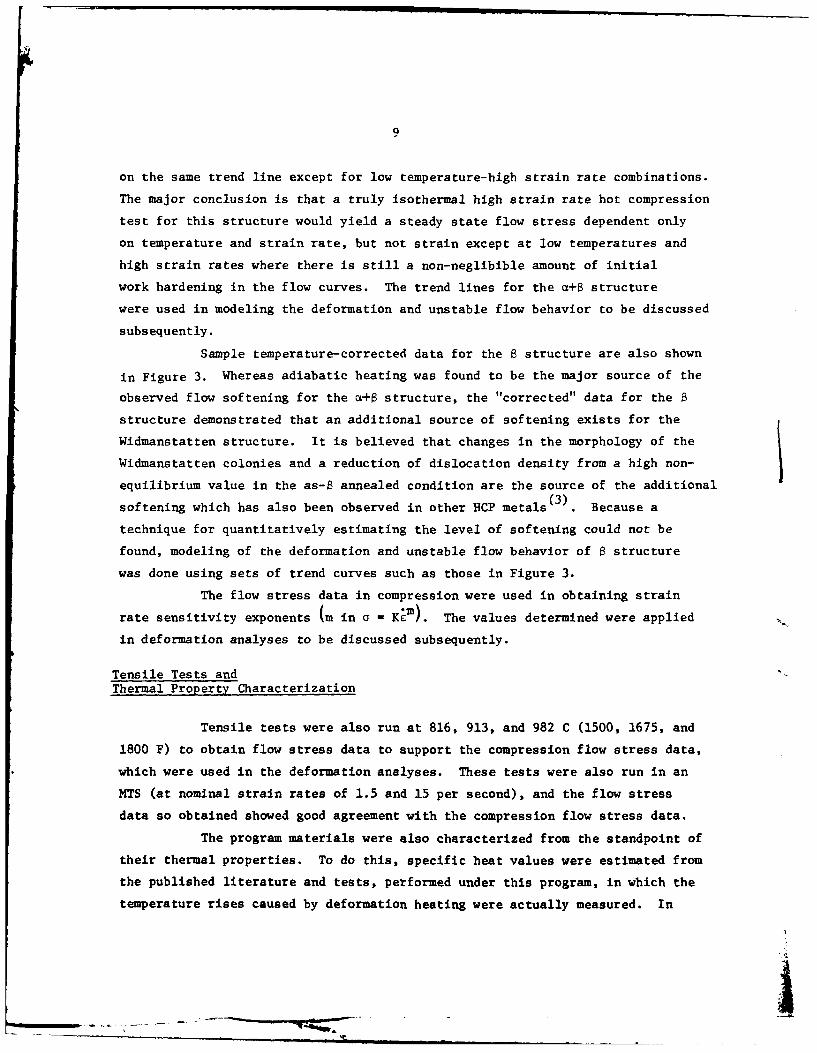
MTS machine was modified (Figure 4). It was fitted with a hydraulic motor to
which was attached an incremental optical encoder which provided closed loop
feedback for rotation rate control. In addition, tensile or compressive axial
loads could be provided through a linear actuator to counterbalance axial loads
which are sometimes produced during torsion as well as to separate specimen
halves after fracture. Tubular specimens were induction heated to test tempera-
tures between 816 C (1500 F) and 1010 C (1850 F) and held between specially
designed water-cooled grips which allowed rotation.
Similar to the compression results, torsion results showed a marked
difference for a+$ and 8 microstructures (Figures 5 and 6). The torque-twist
curves for 8 specimens tended to drop off more rapidly than the cd-6 torque-
twist curves. Moreover, the uniformity of deformation as evidenced by scribe
line measurements was much greater for ci+B specimens. Shear bands in torsion
were indicated by regions in which the angle between the twisting axis and the
scribe line were much greater than elsewhere. Such regions were not observed
for ai+$ specimens. On the other hand, they were quite prevalent for $ speci-
mens, which show marked flow softening in isothermal compression tests. For
the 8 specimens, the scribe line angle outside the shear band was measured
to obtain an estimate of the strain c at the onset of the shear localization
through the formula c, = y/i*** . tan Measurements of these strains showed
that 8 torsion specimens went unstable at very small strains [0(0.10)1. These
strains are of the same order as the strains at the peaks in the 8 stress-strain

12
30
250
25 "
£ 2009z20 LJ
wo ]150 cr
X 0 EXPERIMENT oi- 15 - THEORY
100
-0 I 2 3 4 5 6TWIST (RADIANS)
(a)
125
12.5-"0
10.0- In
75 17'.5 - w
0
" 5.0 -EXPERIMENTlI.- II1 THEORY
-22.5 25
C., I I .0 ,,
0 I 2 3 4 5 6 7TWIST (RADIANS)
(b)
FIGURE 5. Comparison of Experimental and Theoretical Troque-Twist Curvesfor a+a Microstructure Hot Torsion Specimens Tested at (a) Surfaee 3.3 Sec. -
, T - 816 C (1500 F) and (b) Surface i-2 0.9 Sec.-T - 913 C (1675 F).
nl C
F011
o I ;101+1
2
16 3I
4
17 17
66
_I?
8
I1.
FIGURE 4. MTS Machine Modified for Combined Torsion and Axial Loading. (I - uppercrosshead, 2 - tension load cell, 3 - torque cell adapter #1, 4 = torquecell, 5 - torque cell adapter #2, 6 - water cooled grip, 7 - specimenholder, 8 - specimen, 9 - inductiin coil, 10 - ram, 11 - lower crosshead,12 - linear [tension-compression] actuator, 13 - torque reaction plate,14 - hydraulic motor, 15 - incremental optical encoder, 16 - electricalleads, 17 - water lines, 18 - hydraulic lines)

13
30
250
25-
20020.
0a 150
0 EXRIMENTIis- THEORY 0
100
0 0.5 '.0 15 20 2,5 30 35TWIST (RADIANS)
(a)
150
125
250 AG (SEC-'
) '00 -
2100.00
75
5050 [, EXPERIMENTI
L--THEORY
25 25
0 - 3 4 5 6 ? !0
TWIST (RADIANS)
(b)
125
125
1000
0
50so EXPEiRIMENT
2.5 25
0 1 2 t 4 5 6 7TWIST (RADIANS)
(c)
FIGURE 6. Comparison of Experimental and Theoretical Torque-Twist Curvesfor 8 Microstructure Hot Torsion Specimens Tested at (a) Surface
= 0.9 Sec.-1 , T - 816 C (1500 F), (b) Surface E 2 0.2 and 0.96ec.- 1 [Avg. 0.16 and 0.7 Sec.-1 ], T - 913 C (1675 F), and(c) Surface t 0.9, T - 954 C (1750 F).
14
curves from compression tests. Furthermore, the onset of instability and the
development of flow localization in a torsion tests was used to explain why
deformationt-heat-transfer-analysis predictions were in good agreement with
a+6 torque-twist curves (Figure 5), but not $ torque-twist curves (Figure 6).
Instability/Flow Localization Criterion
In analogy with the tensile instability criterion, ()it was thought
that a necessary condition for torsional instability was a torque maximum, or
dM -0. Inspection of the data from the torsion tests revealed that the torque-
twist curves of both microstructures and at all temperatures and strain rates
used passed through maxima early in the deformation. Hence, additional analysis
was needed to explain why only certain of the specimens exhibited true in-
stability and flow localization. This analysis ()demonstrated that after the
torque maximum the rate of twist (or flow) localization, 1/ ,L is directly
proportional to the "torque softening" rate (a M d) heeM toqe
e - twist, e - twist rate, and inversely proportional to the strain rate
sensitivity.
Parametric studies were done to compare the tendency of the ax+6
and a microstructures to undergo localized flow in torsion. Using the deformation-
heat transfer model, constant twisting rate torsion was simulated on the computer,
and torque-twist curves for uniform, stable deformation were generated from
hot compression data. Examples of the results for torsion at 913 C (1675 F)
are shown in Figure 7. It is obvious from such plots that the 8 microstructure
shows much more "torque softening" than the cz+B microstructure. This is reasonable
in view of the flow softening trend in hot compression. It is believed that this
explains why the 8 microstructure showed flow localization in torsion at the
strain rates and temperatures studied, and the a+$ structure did not. The
analysis also shows that the localization tendency for the a microstructure is
greatest at low strains, which was supported by observation. Lastly, the analysis
established the level of the rates of softening which were needed to cause
noticeable flow localization (i.e., shear bands) under nominally isothermal hot
working conditions. These levels were identical to those found necessary to
activate shear bands in isothermal forging, results for which are to be dis-
cussed next.

15
AVERAGE EFFECTIVE STRAIN0 0.1 0.2 0.3 0.4 0.5
-200
.150
205.0
50
55
_0 I 2 3 4 5 6 7TWIST (RADIANS)
FIGURE 7. Torque Twist Curves Predicted from Numerical Model andMeasured Compression Flow Stress Data. Data for Test-
ing at 913 C (1675 F) and Various Average EffectiveStrain Rates. (Avg. Effective Strain Rate -0.6 xSurface Effective Strain Rate).

16
Shear Band Occurrence and Prediction in Isothermal Forging
Shear Band Occurrence
The objective of this phase of the program was to establish the inter-
relation of mechanics and material behavior on shear band development where
temperature gradients are minimal. The objective was achieved by comparing
analytical predictions with measurements to establish the effects of strain,
strain rate, and temperature on the formation of shear bands in isothermally
forged Ti-6242. Isothermal sidepressing was selected as the forging operation
because it involves a flow field which appears highly susceptible to shear
band formation. Cylindrical specimens measuring 0.71 cm. (0.280 in.) diameter
x 2.54 cm. (1.00 in.) long were deformed in an MTS machine at constant cross-
head speeds of 0.08, 9.14, and 63.5 mm/sec. (0.0032, 0.36, and 2.5 in./sec.)I
at temperatures of 843, 913, and 982 C (1550, 1675, and 1800 F). Using the
hot, isothermal compression fixture constructed during the first year's pro-
gram (Figure 2), the specimens were compressed to various levels of deformation
to detect shear band initiation.
For ct+B microstructure sidepressings, shear bands were observed
only for the highest deformation rate at the 843 C (1550F) test temperature.
In contrast, shear bands in the 6 microstructure, were observed for all
three deformation rates at temperatures of 843 and 913 C (1550 and 1675 F)
and for the two higher deformation rates at the test temperature of 982 C
(1800 F). In all cases, the shear bands began as regions of intense de-
formation In the form of X's, the legs of which rotated away from the primary
compression axis with increasing deformation. With further deformation, the
intersecting shear straining led to the formation of "flat" regions of intense
deformation at the center of the specimens, which eventually bowed toward
one of the die surfaces with further deformation. Examples of this process
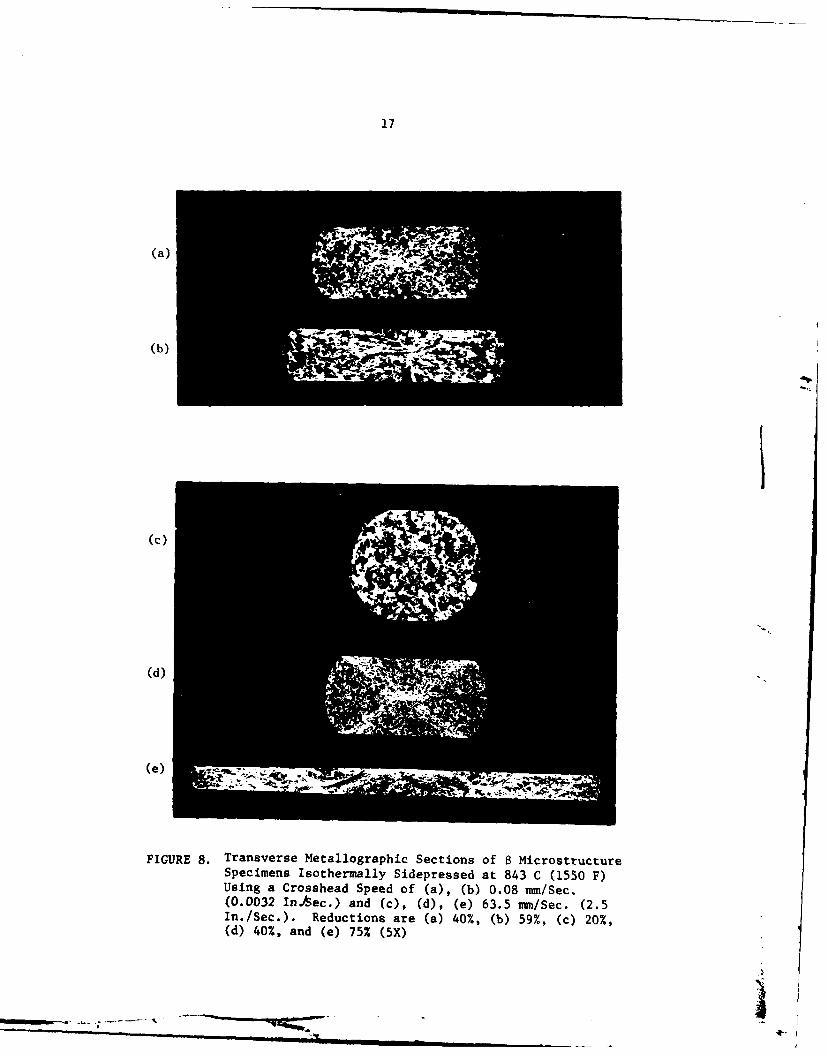
for the B microstructure are shown in Figure 8, and a schematic of the overall
process is given in Figure 9. A geometric construction was used to obtain an
idea of the deformation level at shear band initiation, (6 ) and it was found
that these strains were between 0.3 and 0.5, which corresponded to height
reductions (relative to the initial diameter of the sidepressed cylinders)
of between 25 and 35 percent.
17
(a)
(b)
(c)
(d)
FIGURE 8. Transverse Metallographic Sections of 8 MicrostructureSpecimens Isothermally Sidepressed at 843 C (1550 F)Using a Crosshead Speed of (a), (b) 0.08 mm/Sec.(0.0032 In~iec.) and (c), (d), (e) 63.5 mm/Sec. (2.5In./Sec.). Reductions are (a) 40%, (b) 59%, (c) 20%,(d) 40%, and (e) 75% (5X)

18
I-.Izt0
D- L
Bad ora on In IstemlSIerslg
wz
FIGURE 9. Schematic Representation of the Mechanism of ShearBand Formation in Isothermal Sidepressing.
19
Shear Band occurrencePredictions/Workability Maps
The occurrence of shear bands in isothermal forging is strongly
dependent on factors such as material properties, geometry, and friction.
In all tests, friction was minimal and test geometry was identical. Hence,
it is not surprising that the shear bands that were observed followed similar
directions in all cases. In fact, these directions are identical to those
predicted by slip line field theory. ()The effect of material propertieson the tendency to form flow localizations during isothermal forging has
been discussed in a paper based on work from this program. (6) Using an
instability criterion, it was shown that the tendency to form flow localizations
along directions of maximum shear stress depends on a, the ratio of the non-
dimensional work softening rate to the strain-rate-sensitivity parameter.
Jonas, et al.,(8 suggest that materials with a parameters of 5
or greater are particularly susceptible to perisitent flow localizations.
The observations for Ti-6242 supported this hypothesis. The a parameters
for this material were calculated from flow curves (not corrected for defor-
mation heating) and strain-rate sensitivitits measured at various temperatures
and strain rates. From these calculations, temperature and strain-rate regimes
in which a was equal to or greater than 5 for at least one strain level were
determined. This procedrue formed the basis for the development of work-
ability diagrams for the two Ti-6242 microstructures (Figure 10). Analogous
to workability diagrams for other kinds of defects found in hot working, these
diagrams delineate temperature and strain-rate domains in which shear bands
would not be expected (the "SAFE" domains) and domains in which they should
be expected ("FAIL"' domains). For the most part, the shear band observations
supported the theoretical predictions of the workability diagrams (Figure 10).
The major discrepancies occurred in observations taken near the bourdaries
between the SAFE and FAIL regions and may have been due to the use of a
equal to 5 rather than some other value. On the other hand, however, the degree
of localization did indeed vary with temperature and strain rate for the 8
microstructure in the manner suggested by the magnitude of the flow locali-
zation parameters.
Application of the a-parameter concept to predict shear band initia-
tion strains was unsuccessful. in contrast, process simulation, using an
advanced computer code, worked quite well.j

20
1000 a 0 Microstructure0 0 1800
o-950 W~
D SAFE -1700
S9000 0.1
2 1600 2LU w
850 0 AIL FAIL
I, 1500
16 , 16, 100 to 1 10z
STRAIN RATE (sec")(a)
1000 - 6 Microstructure0 9 SAFE o -1800
0170004cr900-m
. FAILF 16008 0
f- 850 1500
,10 102 101 1o0 10 102
STRAIN RATE (sec')
(b)
FIGURE 10. Workability Maps for Occurrence of Shear Bands inHot Forging of Ti-6242 with (a) a+$ Microstructureand (b) 0 Microstructure. Workability Predictions(-) and Forging Conditions in which Shear BandsWere (e) and Were Not (o) Observed are Noted

21
Shear Band Simulation
Advanced finite element models were applied to simulate the de-
formation in isothermal sidepressing and thus validate an analytical method
for prediction of shear bands in arbitrary forging situations. The general
purpose program ALPID developed by Oh(9 ) was employed for this purpose, and
it gave extensive insight into the behavior of metals during isothermal
forging.
Isothermal Sidepressing Simulations at 913 C (1675 F). Isothermal
sidepressing of specimens of both microstructures was simulated at 913 C
(1675 F) and crosshead speeds of 9.14 and 63.5 mm/sec. (0.36 and 2.5 in./sec.)
using the program ALPID. From the experimental observations, it was known
that these conditions would provide variations in deformation uniformity.
The c+B specimens had been found to deform uniformly and the $ specimens
developed shear bands under these test conditions. Predicted and measured
load-stroke curves from all of the simulations agreed well. The excellent
correlation suggested that the simulation of the process was accurate.
Insight into the detailed applicability of the simulation was obtained
from looking at predicted grid distortions and strain rate fields. Predicted
grid distortions in specimens with a+8 microstructure deformed at 913 C (1675 F)
were not severe even at large reductions, suggesting that the deformation was
fairly uniform. This was consistent with the experimental observation.
Further, the strain rate contours did not show large gradients across the cross
section [Figure 11 for crosshead speed of 9.14 mm/sec. (0.36 in./sec.)]*.
In contrast, the grid distortions in B specimens were considerably
non-uniform across the cross section. In addition, the strain rate contours
(for example, those in Figure 11) indicated large gradients and the possibility
of flow localization along the lines of velocity discontinuity in slip line
fields. For the 9.14 mm/sec. crosshead speed, the high strain rate region
begins to rotate away from the ordinate at a reduction between 20 and 30
percent (in good agreement with the reduction at which shear bands were observed
to initiate experimentally). After 50 percent reduction in height, the
* Because of symmetry considerations, it was only necessary to analyze one-
fourth of the cylinder deformation in sidepressing. Hence, deformation and
strain rate fields are shown for only the upper right-hand quadrant ofthe cylinder cross section.I|
-- - ' q;i I

22
Reduction Reduction4- in Height 4- in Height
10% I- 10%
0.2
25 10
3.0 1. 0.1 0.3
0 500 24 6 0 2 4 6
6,1020% 1. 20%
0 2 4 624
0 .4 0 _ _0_ _ _ __s o_ _
30% 30%
12.
3 1N 005
OD S 001
.5 0.150O 0-0 2 4 6 0 2 4 6
2 40 ?0
2 4 0 "6 0
2
0 2 4 6 0__ _2_ _4_ _ 6
2 -50% 2 0 to 50%
0 OJI 2 (mm) 4w/2 (mm)W/2 (MM)
ALPHA__+BETA BETA
FIGURE 11. Predicted Strain-Rate Contour Plots for Isothermally SidepressedTI-6242 with a+$ and 0 Microstructures. Specimen Temperature-913 C (1675 F), Crosshead Speed - 9.14 mm/sec. (0.36 in./sec.)

23
predicted deformation pattern became so non-uniform, especially near the
center of the specimen, that further computer simulation was not possible
without remeshing. At this stage, the predicted strain rate concentration in
the 6 microstructure was twice as high as that in the a+6 microstructure.
This concentration of strain rate was considered to represent flow localiza-
tion and formation of shear bands in a material.
Parametric Study of Isothermal Sidepressing. In order to obtain
an in-depth idea of the capabilities of the computer code, sidepressing
simulations were run from a parametric viewpoint using a wide range of hypo-
thetical material properties typical of hot-forged metals. Most flow stress
data in the hot-working regime lie between two extremes (Figure 12). One
of these is a flow curve which shows an initial work-hardening interval
followed by a flow-stress plateau (Curve A, Figure 12). This curve is typical
of much of the a+$ microstructure data. The other extreme is a curve, showing
little or no initial work-hardening followed by a large amount of flow
softening (Curve B, Figure 12), which is typical of much of the B micro-
structure flow stress data. Strain-rate sensitivity parameters m were set
at 0.0, 0.125, or 0.30 in the simulation. With these properties,S-(.1 do )/mI for the hypothetical materials ranged between 0 and ,
suggesting a wide range of tendencies to form shear bands. In all cases,
an arbitrary crosshead speed of 9.14 mm/sec. (0.36 in./sec.) was selected.
The crosshead speed was not important because (1) the flow curves had pre-
selected ranges of rate sensitivity m, and (2) the effects of speed and heat
transfer on flow properties are implicitly included in the flow curves measured
(or postulated) at the constant strain rates in nominally-isothermal-compression
tests.
Shown in Figure 13, predicted grid distortions for five different
cases show a strong influence of the material properties. For instance, the
two cases for which a is less than 5 (Case I, a - 0 and Case II, a - 4.2)
exhibit relatively uniform deformation at reductions of 25, 37.5, and 47.5
percent. The simulation of these two cases was taken to 75 percent reduction,
with only minor non-uniformities appearing in the second case at reductions
greater than 40 percent. For Case III (a undefined), Case IV (a - 10), and
Case V (a - c), grid distortions are increasingly non-uniform with increasing

24
b
(nO.
0. 0.90+022 0.46 0..6 0.8
TRUE STRAIN.
FIGURE 12. Non-Dimensionalized Flow Curves for Metals Deformed inthe Hot-Working Regime (Not Corrected for DeformationHeating). Curves Show Extremes of No Flow Softening(Curve A) and Large Amount of Flow Softening (Curve B)

25
REDUCTION IN HEIGHT (Percent)
25 37.5 475
CASE!: 2 2t(l,' .oo /
m -031
0 2 4 0 2 4 0 2 4 '
CASE Ul: 2 2 2a - 4.2I1I 1.25)I \ mO~:.31 ' o'
0-o 2 4 2 4
CASE M: E2 2a Undefinedb'l • m• 0.0)
0. , 0 i 0.'0 2 4 0 0 4
CASE M: 2 2 2
a . 10.0
m :0.125)
2 4 0 2 4 6
CASE 3t: 2 2-QI'. COzs
mI~ : 0-0) ~: ~o 006
0 o 2 4 0 2 46
w/2 (mm)
FIGURE 13. Predicted Grid Distortions for Hypothetical Metals with VaryingDegrees of Flow Softening (Iy~) and Strain-Rate Sensitivity (m)
________________________I__I__II
26
a at a given reduction, on the one hand, and with increasing reduction for a
given at on the other. For Cases IV and V, deformation became so non-uniform
after approximately 50 percent reduction that continuation of the simulation
was impossible. The grid distortions in Figure 13 also pinpoint the regions
of higher-than-average deformation. These may be noted by looking at changes
in the angles between intersecting grid lines from which it is observed that
deformation is indeed predicted to localize along the directions observed
in metallographic sections (Figure 8).
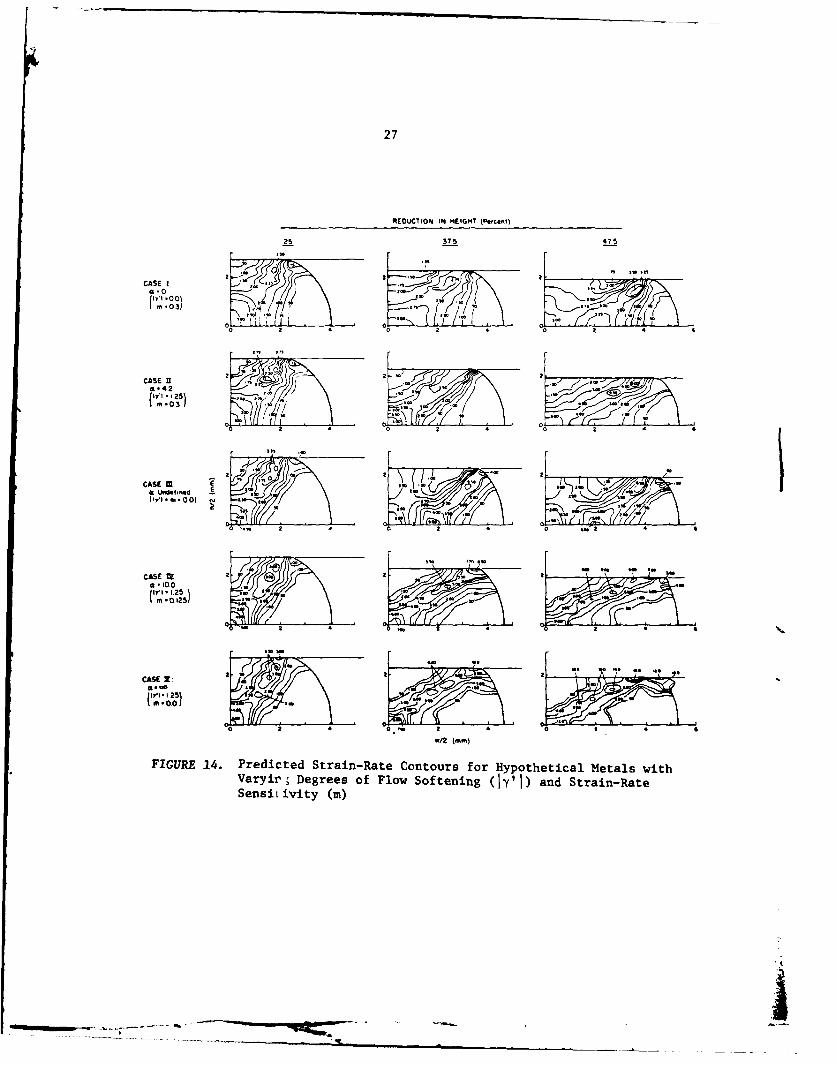
Predicted effective-strain-rate contours (Figure 14) exhibit a trend
similar to that for the grid distortions. Strain-rate concentrations increase
with increasing a. Modest ones are seen in Cases II and III and strong ones
in Cases IV and V. In addition, localizations observed in Cases IV and V
occur along lines which rotate toward the abscissa with increasing reduction.
For these two cases (and for the others as well), regions of highest strain
rate lay at 45 degrees to the ordinate at a reduction of 25 percent. Rotation
of these regions occurs at higher reductions. Hence, the initiation event
(marked by the reduction at which the angle between intersecting flow localiza-
tions deviates from 90 degrees) has been predicted to occur at reductions
greater than 25 percent. Another interesting observation is the tendency of
the flow localizations to form "flats" near the center of the specimen, much
like those actually observed. This can be seen by comparing the 47.5 per-
cent reduction patterns f or Cases IV and V to observations in Figure 8. A
related phenomenon is seen in Case III, in which the strain-rate localiza-
tion even moves away from the center. These and other phenomena are highly
suggestive of the block shearing required for shear band occurrence. Velocity
maps for these cases further confirm and illustrate the physical situation
involved in shear band formation and persistence.
Comparison of at Parameter andSimulation Predictions
The simulation results for the wide range of material properties
just discussed allow a more complete evaluation of the accuracy of the a-
parameter method of predicting shear bands in isothermal forging. As shown
by simulation, intense shear bands should definitely be expected when a is
27
REDUCTION IN HEIGHT (Percent)
25 375 475
CASE I 2,a"a . 2
/O / , a I
It, :0a
2 1 0 25) 4
CASE n 2 a
4 2 4 °0 2 4
Un" f.idened 2-6 ,t .L '
2 -2Do
)
NGIN
00
CASE 21 aa*
(14: 125)
0.0
W/2 (mi)
FIGURE 14. Predicted Strain-Rate Contours for Hypothetical Metals withVaryir; Degrees of Flow Softening (I-'I) and Strain-RateSensitivity (m)
* - ____ ___I

28
10 or greater. Furthermore, modest localizations may be expected for a's
between 4 and 10. Thus, the use of a - 5 as a critical value for shear band
occurrence is a useful rule of thumb to obtain a first-order idea of when
intense shear bands may be expected. However, it must be kept in mind that
it is only approximately valid and that at best it indicates the degree of
tendency toward localization, and not the occurrence per se.
Another feature illustrated by the process simulation results is
the fact that flow localization is a process and not an event. Strain and
strain rate concentrations do not occur instantaneously. For this reason,
flow localization cannot be expected to occur when a first reaches some
critical value (such as 5) at some point in the flow field. Application of
this premise for Cases IV and V, for example, would require flow localization
to be noticed at the reduction at which some material element has undergone
an effective strain of E 0.05, which, because of inhomogeneous deformation,
should occur at a reduction less than that corresponding to an effective
thickness strain of 0.05. Simulation shows though that localizations are
first developed at a reduction between 25 and 37.5 percent, which corresponds
approximately to effective thickness strains between 0.33 and 0.54 which is
in good agreement with observations.
Shear Band Occurrence and Prediction in Non-Isothermal Forging
Results
The generation of shear bands in non-isothermally forged Ti-6242
was documented with the objective of establishing the effects of die chilling
on shear band development. This task was an extension of the work on iso-
thermal forging to include heat transfer effects. To this end, 1.02 cm
(0.4 in.) diameter, 1.52 cm (0.6 in.) high cylinders of a+B and B micro-
structures were upset in a mechanical press (; 10 sec.- ) between diesheated to 204 C (400 F). The cylinders were themselves preheated to tempera-
tures of 913 C (1675 F) or 954 C (1750 F). This work offered insight in
the development of shear bands in axisymmetric conventional forging operations.
To gain insight into shear band development in plane-strain conventional
forging operations, 1.02 cm (0.4 in.) diameter, 10.16 cm (4.0 in.) long

29
cylindrical preforms of both microstructures were non-isothermally side-
pressed in either a mechanical press (c z 20 sec.- ) or a hydraulic press
[ - 0 (1 sec.- )]. Specimens (both lubricated and unlubricated) were pre-
heated to either 913 or 982 C (1675 or 1800 F). They were then forged on
dies preheated to either 191 or 343 C (375 or 650 F) after dwell times of 0
or 10 secs. (mechanical press) or 4 or 14 secs. (hydraulic press).
In non-isothermal compression, it was found that early deformation
is characterized by the formation of "chill caps". This chilling leads to
working loads which are somewhat to much higher than those for isothermal
deformation (Figure 15), depending in particular on the amount of chilling and
the materials' flow stress dependence on temperature. After the formation of
chill caps, a band of localized shear passing through the corners of the
specimen develops between the caps and the less highly deformed metal in the
rest of the specimen (Figure 16). Metal then begins to "flow" along the shear
bands. In particular, the specimen edges fold by shearing along the region
of localized deformation, a phenomenon which is very common in cold compres-
sion tests with poor lubrication(I0 . These observations are helpful in the
understanding of shear band formation in more complex hot forging situations.
However, it should be noted that the shear bands in non-isothermal compression
do not always pass totally through the thickness of the sample. Hence, so-
called block shearing does not occur unless a drastic change in deformation
mode from axisymmetry to plane strain can be accomplished. This explains
why shear localizations are usually more severe in plane-strain modes of
deformation as compared to axisymmetric ones. As an aside, it has been noted
that when severe shear bands and deformation mode changes do occur in nom-
inally axisymmetric deformation, fracture usually ensues.1 1 )
Load-stroke curves (Figure 17) and deformation features observed
metallographically were similar for the two microstructures when they were
non-isothermally sidepressed under identical conditions of working speed,
preheat temperature, dwell time, lubrication, and reduction. From metal-
lography, it was seen that shear bands initiated and developed according to
the same scheme noted in isothermal sidepressing (Figure 9), indicating the
important influence of geometry on development of the defects. They occurred
in almost all non-isothermal trials with the severity of localization de-
pending on heat transfer and die chilling (the levels of which are determined
by processing conditions).__ _ _

30
STROKE (in.)0 0.05 0.10 0.15 0.20 0.25 0.30
50- Measured Data, A
-- Predicted Load- Stroke for 10Isothermal Compression
40 ot B: 954C (1750F) and A
C. 9t3 C (1675SF) 8
z 30-
060-o - - - --- '" / . . . B. .. s
0202
10 -2r -
0 . I I I ,I . I 0
0 I 2 3 4 5 6 7
STROKE (mm)
FIGURE 15. Measured Load-Stroke Data (A) for Non-Isothermal Compression of1.02 cm Diameter, 1.52 cm High a+8 Microstructure Sample Preheatedto 954 C (1750 F) and Deformed in a Mechanical Press Between DiesHeated to 204 C. Data are Compared to Load-Stroke Curves Pre-dicted for Isothermal Compression at (B) 954 C (1750 F) and(C) 913 C (1675 F).
..... -_ _ 'I

31
Top Die
(a)
(b)%V
/IIFolded Edge Shear Band "Chill Cap"
FIGURE 16. 5X Macrograph (a) and 100 X Micrograph (b) of cx+B MicrostructureCompression Specimen Non-Isothermally Deformed in a MechanicalPress ( c 10 Sec.-I). Preheat Temperature 913 C (1675 F),Die Temperature 204 C (400F), Dwell Time 5 Secs.

32
STROKE (in.)0 010 0.20 0.30 0.40
1 W I ,I I I 1 ,350NON-ISOTHERMAL SIDEPRESSING /
MECHANICAL PRESSA 300
1250 * Die Temperature: 191C (375F) D
Specimen Dwell Time. I 25
Curve: Temp., C (F) sec /50
i000 A - 913 (1675) 0 / /B - 913 (9675) 10 /C--- 982 (1800) 0 200 2D--- 982 (1800) 1 10
//< 750-
500/ 100
0/ /(a) - / , 5
,/
250 50
00 2 4 6 8 10
STROKE (mm)
STROKE (in.)0 0.05 0.10 0.15
I I I- II
NON-ISOTHERMAL SIDEPRESSING1400 HYDRAULIC PRESS
300,.
e Crossheod Speed: 4.7 mm/sec (0.19 in/sec)1200 * Die Temperature: 191C (375F)
-250Specimen Dwell Time, 250
I000 Curve: Temp., C (F) secA - 913 (1675) 4200B - 913 (1675) 14
(b) £ 800 C--- 982 (1800) 4"-- 982 (1800) 1 14 1 A
-1500600 B0
4000
C_
_
100
200 50
0 00 i 2 3 4 5
STROKE (mm)
FIGURE 17. Load-Stroke Curves for Non-Isothermal Sidepressing of 1.02 cm (0.40 in.)Diameter, 10.16 cm (4.0 in.) Long Lubricated Preforms of a+B Micro-structure in (a) Mechanical Press (z 20 Sec.-l) and (b) Hydraulic
Press (U _ 1 Sec.1).
__ __ _ _ - .-- ''---** * " 4-.

33
For forging in the mechanical press, the degree of localization
increased with increasing reductions, lower preheat temperatures, longer dwell
times, poorer lubrication, and lower die temperatures, with the first three
variables exerting much more of an influence than the last two (Figure 18).
Shear band observations from mechanical press forging were similar when bars
were sidepressed in blade forging dies (Figure 19). Comparison of these
observations with those from the hydraulic press established working speed
(through its effect on contact time and heat transfer) as the most important
process variable, over the evaluated ranges of speed and dwell time investi-
gated. Not only were the shear bands more intense, they were also the source
of many fractures during metalworking in the hydraulic press (Figure 20).
Fractures typically occurred at reductions between 30 and 50 percent. This
contrasts to results from the mechanical press in which no fractures were
observed even at reductions as high as 80 percent.
Discussion of Results
The formation of flow localizations in the form of shear bands in
non-isothermal compression and sidepressing is also a manifestation of an
instability phenomenon depending on a maximum in stress o [(= a(e, ,T)] at
some point or points in the flow field. It was found that the development
of strain-rate gradients (de/dx) in the flow field depends on (i) the thermal-
softening characteristics (1/ E) and strain-rate sensitivity (m) of
the material and (ii) the imposed thermal gradients () in the workpiece.This dependence was found to be:
(ad . T CE dT/dx .(1)
dx m
Since the materials terms in this expression are similar for the a+$ and B
microstructures and dT/dx is similar when forging parameters are identical,
it is seen that the flow localization tendencies for the two microstructures
should be similar. Observation bore this out.
Attempts to simulate the formation of shear bands in non-isothermal
forging were made using a modification of the ALPID finite-element program,

34
(a)
(b ,,. " - --
(d)
(e) -
(f)
FIGURE 18. Transverse Metallographic Sections of Lubricated c+B MicrostructureSpecimens Non-Isothermally Sidepressed in a Mechanical Press(Z - 20 Sec.-). Die Temperature 191 C (375 F), Dwell Time 0 Secs.,Specimen Preheat Temperature: (a), (b), (c) 913 C (1675 F), (d),(e), f) 982 C (1800 F). Reductions are (a) 14 pct., (b) 54 pct.,(c) 77 pet., (d) 21 pct., (e) 57 pct., and (f) 79 pct. (4X)
.4

35
(a)(b)
(c)
FIGURE 19. Transverse Metallographic Sections from (a) Near End, (b) AtMidspan, and (c) Near Root of a Blade Non-Isothermally Forgedfrom a Lubricated a~ Microstructure Cylindrical Preform In aMechanical Press (c 20 Sec.71 ). Preheat Temperature 913 C(1675 F), Die Temperati're 191 C (375 F), Dwell Time 0 Secs.(3-1/2X)

36
(a)
(b)
FIGURE 20. (a), (b) Transverse Metallographic Sections(4X) and (c) Micrograph (1OOX) of Region withShear Band and Crack from Section Shown in (b)of Lubricated a+$ Microstructure Specimens Non-Isothermally Sidepressed in a Hydraulic Press(ti Sec.-l). Preheat Temperature 913 C (1675 F),Die Temperature 191 C (375 F), Dwell Time 14 Secs.Reductions are (a) 25% and (b) 53%

37
which takes into account heat generation and heat transfer effects. These
attempts were not successful. An alternate analytical technique, the upper-
bound-method, in which a heat transfer analysis was included, (12 ) was therefore
employed to interpret the experimental results. Although detailed strain and
strain-rate information could not be gained from this kind of analysis, it
gave insight temperature gradients and load behaviors that could be expected.
The upper-bound analysis, which was written for axisyinmetric de-
formations, was applied to the problem of simple compression of cz+B micro-
structure, Ti-6242 cylinders (measuring 7 mm (0.28 in.) diameter and 10 mm
(0.39 in.) high) deformed in either a hydraulic press I sec.- ) or a
mechanical press (c 20 sec.- ) . Analytical results showed that very large
temperature gradients are set up in hydraulic press deformations as compared
to mechanical press deformations (Figure 21). Thus, in view of the large
temperature sensitivity of the flow stress (Figure 3) and Equation (1), it
is not surprising that observed shear bands were much more severe in hydraulic
press forging (Figures 18, 20). Moreover, the generally lower temperatures
experienced during hydraulic press forging, as predicted in Figure 21,
probably explain the fracture phenomena observed in sidepressing since it has
been found that the workability of Ti-6242 drops off greatly below 816 C
(1500 F.(3
Inspection of the predicted temperature magnitudes (Figure 21)
and the flow stress dependence on temperature also explains why forging loads
were predicted (Figure 22) to be subsgtantially higher in hydraulic press
forging, despite the slower deformation rate. This trend is similar to that
for the sidepressing results shown in Figure 17, which incidentally also show
unusual inflection points in the hydraulic press load-stroke behavior similar
to those predicted for hydraulic press non-isothermal compression in Figure 22.
Effect of Shear Bands on Service Properties
The bulk of the research in the final year of the program concentrated
on establishing the effects of shear bands in hot-forging of Ti-6242 on mechani-
cal properties in tension, creep, and fatigue. This was thought to be an
important area of investigation since others have found degradation of mechani-
cal properties resulting from the presence of shear bands. For example,
........ L

38
AXIAL DISTANCE FROM CENTER OF SAMPLE (in.)
0 0.05 0.10 0.15'000 -800
1600
(a ) 8 0 14 0 0
900
12006000
I- I21% REDUCTION 1200
600
0 I 2 3 4AXIAL DISTANCE FROM CENTER OF SAMPLE (mm.)
AXIAL DISTANCE FROM CENTER OF SAMPLE (in.)
0 0.05 0.10I It
1000- -1800
(b) C
a: 8000, 0 4
,,i w
I-0000-II,
b)-
700-- 4REDUCTION
I--1200
0% 2 3
AXIAL DISTANCE FROM CENTER OF SAMPLE (mm.)
FIGURE 21. Predicted Symmetry Axis Temperature Profiles for (a) 21 pct. and (b)49 pct. Reduction in Height. Cases I and II are for Compression inHydraulic Press (R - I Sec.-l). Cases III and IV are for Compressionin Mechanical Press (I ' 20 Sec.-l). Specimen Preheat Temperatureswere 913 C (Case I and 111) or 982 C (Cases II and IV). Dies were
Assumed to be Heated to 190 C Initially.
- 4.

39
STROKE (mm)
O I 2 3 4 5 6 7I I I I I I
45 -- 0I
40
35
30
z625
0 -. . . 4J
0.j
20
4
I5
0 0
0 10 20 30 40 50 60 70
REDUCTION IN HEIGHT (percenl)
FIGURE 22. Predicted Load-Reduction Curves for Non-Isothermal Compression Cases I,II Hydraulic Press (i 1 1 Sec.- 1) and Cases III,IV Mechanical Press( - 20 Sec.-l). Specimen Preheat Temperatures were 913 C (Cases Iand III) or 982 C (Cases II and IV). Dies were Assumed to be Heatedto 190 C Initially.

40
Pepe has noted that shear bands developed in hydrostatic extrusion of various
ferrous, magnesium, and aluminum alloys can severely limit subsequent per-
formance under tensile loading. (14 ,15)
Generations of Shear Bands underControlled Conditions and Effect ofHeat Treatment on Shear Bands
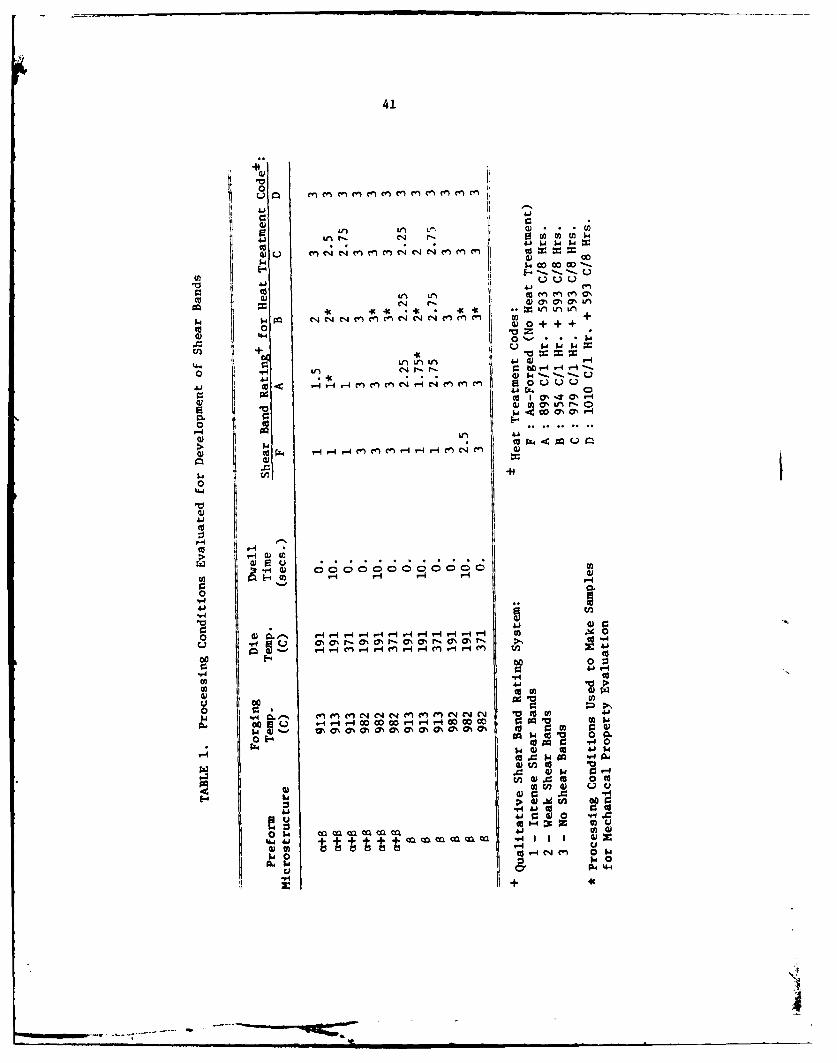
Under this phase, 1.52 cm (0.6 in.) diameter, 7.62 cm (3.0. in.) long bars
of Ti-6242 of az+$ and 8microstructures were forged (i.e., sidepressed) in
a mechanical press Ce 20 sec.- ) to determine conditions which lead to
shear banding and conditions in which shear banding is avoided. Previous
experimental work was helpful in selecting a range of forging temperatures,
die temperatures, and dwell times to obtain forged microstructures with and
without shear bands (Table 1). In addition, the just-discussed-process-
simulation results on non-isothermal forging which were completed under this
task, gave insight into the severity of the flow localizations to be expected
in hot-forged Ti-6242 samples. For example, process simulation results
suggested that raising the preheat temperature of az+$ or a preform micro-
structure samples to just below the transus temperature (- 988 C (1810 F))
was effective in keeping the sample temperature during forging out of the
regime in which the flow stress is most sensitive to temperature, i. e., out Of
the regime in which shear banding is most severe (Figure 21).
After forging, samples were heat treated to determine the effect of
post-forging heat treatment on shear band morphology. Samples were solution-
annealed over a range of temperatures between 899 and 1010 C (1650 to 1850 F)
and then aged for 8 hours at 593 C (1100 F). The solution treatment tempera-
tures span those commonly used commercially, and the aging treatment is typical
for the Ti-6242 alloy which contains 0.1 Si. Following heat treatment, it
was found that only beta solution annealing could totally eliminate evidence
of shear bands (Table 1, Figures 23 and 24). The other heat treatments,
although not totally eliminating the shear bands, had a tendency to "diffuse"
or make less severe the localized irregularities in the microstructure caused
by the development of shear bands in hot-forging. This was especially evident
for heat treatments involving higher temperature, subtransus solution annealing.
41
41a
4J
eqL- e'. m- m m 4 C m MM c
ON 01 0%
00
0 0) LM UL% 4
0 C'4 r- -
44 .. 4K7 1 70% M r
0a) 0 C; C; C; C
414
a)0L) 0% m
-0 a) 00000003
4.) ad ~ 1
u0 0
0) , 0
". "0 C U cciw
04 0d 00.$0 00 -4 A4
u-4 t40 0 cc31
W~ 01 C~-
61 9: ) 0 0q0
cc -4~ Dc Z
0 1 V- .33u) 0
1.40 to -4IN m 01$4 1 4 0
U 044ow

42
(a) ~J e) - --
(b)
Cc)
(d)
() ~ Pt.
fl
FIUE2.Tases(eahor)i etoso ~BPrfr irsrcueFa
FoMns rfr eprtr/i eprtr/wl iewr ae
91 C19 Cb eC.,(fj)98 C11 /l Scs, k-) 82C/MWC
0( eskarsru)rs(~~)ar sFre. Ohe ognswr
Soui(Anaemo 1Hu Pirt gngTeteto 9 /
9r13 at19 C/10l 89cs, (chJ) 954C/9 C/1 s, (dko 979 CC/e37)10 C.
(3.5X)

43
(b)
(c) - ~
(1)-
FIUE2. rnvrs ealgrpi ecin f(erfr)McotucueFa
Fog(shrf) epeaueDeTmeaue/vl iewr ae
91(k) /OScs,(-)92C19 /OSc. k-)92C31C
FIGUR 0 2.Tasese Maostrture Sectfons are As-ford Othroutrgig Fere
Solution-Annealed for 1 Hour (Prior to Aging Treatment of 593 C/8Hrs.) at (b,g,l) 899 C, (c,h,m) 954 C, (d,i,n) 979 C, (e,j,o) 1010 C.(3.5X)

44
As a result of this work, two forging-heat treatment conditions
which led to shear bands of different severity and two which led to micro-
structures with little, if any, shear localization were selected for each
preform microstructure (Table 1). Additional flat forgings for mechanical
property characterization were then made by sidepressing 1.52 cm (0.6 in.)
diameter, 7.62 cm (3.0 in.) long preforms in the mechanical press using the
various combinations of preform-preheat temperature, die temperature, and
dwell time.
Evaluation of Tensile Properties
The effects of shear bands on tensile properties were evaluated to
establish whether they may have deleterious effects on service performance.
These and subsequent mechanical tests were performed at 510 C (950 F) since
this is the design operating temperature of many Ti-6242 jet engine compressor
parts, which are among the main applications of the alloy.
Duplicate flat tensile specimens, each with a 1.52 cm (0.6 in.)
long, 0.64 cm (0.25 in.) wide gage section, were cut from each of two perpen-
dicular directions in the forging for each forging-heat treatment condition.
One of the directions was parallel to the preform bar axis (the nominal plane-
strain direction in sidepressing) and is denoted as the "longitudinal" (L)
direction in subsequent discussion. When loaded axially, these specimens
would develop no shear stress on shear bands which may have been introduced
during forging. The other test direction, denoted as "transverse" (T) in
subsequent discussion, was perpendicular to the preform bar axis and is parallel
to the long direction in the so-called transverse metallographic sections
shown In Figures 23 and 24. Under axial loading along this direction, shear
bands in the microstructure would have shear stress components imposed along
them. During tensile specimen machining, approximately 0.25 mm (0.010 in.)
was removed by milling and light mechanical polishing from each surface in
order to eliminate alpha case as well as to make the surfaces flat and parallel.
This was done, of course, for creep and fatigue specimens as well. After
machining, tensile specimens were induction heated to test temperature and
pulled in an MTS machine run at a constant crosshead speed of 0.51 cm/min.
(0.2 in./min.). Some of the specimens were pulled to failure and others
just short of it.

45
Tensile data (Table 2) demonstrated that the effect of shear bands
on tensile properties is quite small. This is particularly evident when com-
paring L and T (longitudinal and transverse) data for a particular condition.
First of all, it is seen that yield and ultimate strength data are comparable
f or L and T tests. This is as expected even for conditions with shear bands
since defects, such as inclusions, usually have a noticeable effect only on
fracture-related properties such as elongation and reduction in area. How-
ever, even the elongation data do not show a large effect that can be at-
tributed to shear bands. The elongation values in samples with shear bands
are comparable to ones reported previously for Ti-6242 alloy forgings A*~
Furthermore, the data for samples without shear bands suggest that differences
in L and T data for samples with shear bands should be attributed to other
sources such as data scatter or microscopic mechanical fibering.
Metallography supported the conclusions. In no cases could shear
bands be associated in some systematic way with localized necking or fracture
(Figures 25, 26, 27). It was found that In no samples were fracture paths
found to lie along shear bands. One explanation for this may lie in hard-
ness data taken on the mechanical property samples (Table 3). These hard-
ness readings were taken inside and outside the gage section both in the
bulk as well as within the shear bands themselves. Although there was a
systematic variation of hardness between the shear bands and the bulk, the
data taken in the gage section were almost identical to those outside the
gage section, suggesting a minimal amount ot work-hardening. However, the
data do show a definite trend that suggests the shear bands are harder than
the surrounding bulk. This would explain perhaps why localized necks, and
hence, the fractures resulting from the necks, occur in regions not as-
sociated with shear bands or in regions in which the resolved shear stress
component is low along the shear band.
Evaluation of Creep Properties
The evaluation of the effects of shear bands on creep properties
was performed with the objective of establishing service performance charac-
teristics when this failure mode is operative. Flat creep specimens similar
to the tensile specimens were prepared from forgings and tested in air under

46
U~C ko- %04 "44 r- I c
1-40 6-40
I. w w ItP4V4r N r, %- e. m .r,- %0
-4
ll n0U O C C 0 . 0!O rCi 0 .
-4, - %-0 ,-4H H
-41
to 0) 0
m- tou P - H" 3P AHP 4 AHP -
a)4 WwU
o vto
4.1 00L
03 WOO-s W.
1-44ul.7
U) 4) 0 en 004.1 "4'. fU .0rI l -
1411 - F- ~ r40OV-4 4 y-4 p " " -4to I ON ac Nr * l m m m mmft
00 E-4 m m m m N (4 m m m m N N-r4 a) 4 H -
01.4 &
044
03w
$-4
+0
01.4 mmm. - 0

47
(b) "... .. .
(c) -:. ;
(e) ,.. 5-.
Samples Cut from Forgings. Forging Temperatures were (a-e) 913 C,(f-i) 982 C; Die Temperatures were (a-g) 191 C, (h,i) 371 C; DwellTimes were (a-g) 10 Secs., (h,i) 0 Secs. Solution Treatment (Priorto Aging Treatment of 593 C/8 Hrs.) was Performed for 1 Hour at(a-c) 899 C or (d-i) 954 C. Tensile Axis Directions were (a,d,f,h)Longitudinal or (b,c,e,g,i) Transverse. 3X)
MMM mana MMMM -*

48
(b)- . .- -
(d)
FIGURE 26. Tensile Axis Sections of 8 Preform Microstructure 510 C TensileSamples Cut from Forgings. Forging Temperatures were (a-d) 913 C,(e-h) 982 C; Die Temperatures were (a-f) 191 C, (g,h) 371 C; DwellTimes were (a-f) 10 Secs., (g,h) 0 Secs. Solution Treatment (Priorto Aging Treatment of 593 C/8 Hrs.) was Performed for 1 Hour at(a,b) 899 C or (c-h) 954 C. Tensile Axis Directions were (a,c,e,g)Longitudinal or (b,d,f,h) Transverse. (3X)

49
TensileAxis
FIGURE 27. Micrograph at Fracture of Transverse 510 C Tensile Sample ShowingFracture Path and Shear Band. Sample was Cut from a+ Micro-structure Forging (Preheat Temperature 913 C, Die Temperature191 C, Dwell Time 10 Secs.) which had been Solution Treated at899 C for 1 Hour and Aged at 593 C for 8 Hours. (10OX)

50
w m 0o
rI4 r- r- o~
0) 0 wU" 0 m m ml
a) 00C1
0 ~0)C,4 04r 00o
0 V0 H w -
0c = ) 4-'-'
0 0
01 41
Cd.7E-4W
0
.74w0 u 0 00 0 0
0) E- 74 H f4 H I
0 0 w
w 04.
w

51
constant load conditions (constant nominal stress) ir a resistance furnace.
Creep curves (F~igures 28 and 29) and rupture life data (Table 4) were obtained
at 510 C (950 F) using standard techniques.
Creep data on samples with shear bands demonstrated that creep per-
formance can be definitely affected deleteriously. Inspection of the data
shows that the effects of L vs. T loading are noticeable in creep rates and
rupture lives, with T properties being poorer. The total magnitude of the
effect, however, is not realized until the data for-samples without shear
bands are also examined. In these data, L properties are inferior to T
properties, suggesting other mechanical texturing effects. Therefore,
without these additional mechanical texturing effects, data for the samples
with shear bands might have been expected to show even greater divergence
in L vs. T properties.
The source of the effect of shear bands on crt~ep properties was
not evident from metallographic observations (Figures io, 31, 32). As with
the tensile data, in T samples with shear bands, the fracture path was not
found to lie along the shear bands. The only other possible explanation for
the observations thus must lie with some microscopic process such as enhanced
diffusion along shear bands, diffusion which may be further increased by the
action of imposed shear stresses (in T specimens) in creep. This would
explain the increased creep rates as well as perhaps the shorter rupture
lives of T samples containing shear bands. This hypothesis needs to be
justified with further research though.
Evaluation of Fatigue Properties
The evaluation of the effects of shear bands on fatigue properties
was performed with the objective of establishing service performance charac-
teristics when this failure mode is operative. Flat fatigue specimens similar
to the tensile and creep specimens were prepared from forgings and tested in
air in load-control, tens4 'n-tension fatigue in an MTS machine at 510 C
(950 F). Initially, strain-controlled fatigue tests were planned, but when
it was found that the alloy shows negligible cyclic hardening or softening
at 510 C (950 F), (17 ) it was decided to perform load-control tests because
these would not require special devices to prevent buckling. The actual

52
C
Ca
cre Stress: SO 451 1552 "pal
(a) 14,(1) Forging cond.lions. a. Preorm, Mlicrovir..cowe*PrU#lrm Yo-era~ft-re 1675F 1913C)*Die TOMp.rotor*: 375F 1IS9C0
rx_____ Deail TUiIO 10 Seconds;2 12) Solution Treatment, Temperature
6* C. 0 OF (15 c)(31 Lon"riq bDeton
* , &.: L 1LO~gilu.Cnoll0, D,:
Transverse)
0 0 160 240 320 400Time (Hours)
24
CL
(b) Creep Sirwi so KS) (552 Mtol(1) Forging Conditions:
E a.p Protorm Ulerestructurs
Zg * Di. Temprature: 7OOF (371C0* C Dweti Time: 0 Seconds
(2) solution Treatment Temaperature : ITIOF (54c)
(31 Loading Direction* :L (Lonlitudinal)
T T ransverse)
00 W 1160 240 320 400Time (Hours)
FIGURE 28. Constant-Load Creep Data for Samples Cut from a+6Preform Microstructure Forgings in which (a) ThereWere and (b) There Were Not Shear Bands.
4A

53
"D A C
0£0
: 6 -CrT S."e. Oes 17SF3 6Pm
. . Trt.. To.."Mt... ..
_____ DieJ T.mQ~r 50 S 166.0 e)
z 8
'7S "ISOF (eCIJ •C. D . I 'OP ISl*aCI
131 t.04l airoclo: AC: LIL Iltg4.eo.ll
..D. t:T ITrentver")
0 80 160 240 320 400 480
Tim, (Hours)
Creep Stres 6 ?S (51 I? MPo: A, AC24 __ - eoso S1(SS210po) C.0I24
(1) Forging Coditions: Ae i Priefto MicrostructlreC e Preform Tempreture: 1800 F IS2C)
Cis Temperoture 700 F (371 Cl0. CeOll Time, 0 Second*. (2) Solution Treatment Temperetere: IT7OF (054C)
16 - 931 Looding DirectionM A, C; L (Longiltuinall0 S,.0: T (ronoaerul
(b)
0
08s 160 240 320 400
Tim (Hours)
FIGURE 29. Constant-Load Creep Data for Samples Cut from 8Preform Microstructure Forgings in which (a) ThereWere and (b) There Were Not Shear Bands.

54
0
z
~~ -4
0
0
1.4.1 -CC
00
o0 +
w) 0 I- )01 -H P-11
EE-4
$4 0%
01~~~ C0 0000 0000 0V-4 V-1 w-4'-S-V-4 C)00'"4 V-4 -4 - -4 000 CD
, %. - . %. -1 % -% .-- % - S, , -- -1 - . C
E- E-0nM e nMe nV 4C 4C. 01 V1-4 ONO O %0 O %ONm 0 a i %%~ 41
to.0 x 4 i..k.4 0 0
0 s0
01 + +4 +4
41(A(

55
(a)
FIGURE 30. Creep Axis Sections of ca+ Preform Microstructure 510 CCreep Samples Cut from Forgings. (Nominal Creep Stress:552 MPa (80 KSI)). Forging Temperatures were (a-e) 913 C,(f,g) 982 C; Die Temperatures were (a-e) 191 C, (f,g)371 C; Dwell Times were (a-e) 10 Secs., (f,g) 0 Secs.Solution Treatment (Prior to Aging Treatment of 593 C/8Hrs.) was Performed for 1 Hour at (ab) 899 C or (c-g)954 C. Creep Axis Directions were (a,c,f) Longitudinalor (b,d,e,g) Transverse. (3X)
_f)
(gFIUE3.CepAi etoso atPeomMcotutr 1
Cre ape u fo,,gns Nmia re tes
552---- w----~na (8 KSI,) Forin Temeraure were nmm 913 C

56
(h)
FIGURE 31. Creep Axis Sections of 6 Preform Microstructure 510 C CreepSamples Cut from Forgings (Nominal Creep Stress: (a,b,h,i)517 MPa (75 KSI), (c-g,j,k) 552 MPa (80 KSI)). ForgingTemperatures were (a-g) 913 C, (h-k) 982 C; Die Temperatureswere (a-g) 191 C, (h-k) 371 C; Dwell Times were (a-g) 10 Secs.,(h-k) 0 Secs. Solution Treatment (Prior to Aging Treatment of593 C/8 Hrs.) was Performed for 1 Hour at (a-d) 899 C or Ce-k)954 C. Creep Axis Directions were (ac,eh,j) Longitudinal or(b,d,f,g,ik) Transverse. (3X)

57
N N
CreepAxis
FIGURE 32. Micrograph at Fracture of Transverse 510 C Creep Sample(Creep Stress - 379 MPa (55 KSI)) Showing Fracture Pathand Shear Band. Sample was Cut from a+6 MicrostructureForging (Preheat Temperature 913 C, Die Temperature 191C,Dwell Time 10 Secs.) which had been Solution Treated at899 C for 1 Hour and Aged at 593 C for 8 Hours. (10OX)

58
fatigue tests were run using induction heating with an R value (ratio of
minimum to maximum stress) of +0.1 and and cyclic frequency of 5 Hz.
Fatigue data (Table 5) established no clear-cut effect of shear
bands on fatigue lives. Although the L lives were usually longer than
the T lives in samples with shear bands, the difference was small and must
be considered to be due to the data scatter inherent in fatigue testing.
Also in support of this conclusion, is the fact that samples without shear
bands showed data scatter as well and no pattern of L properties being
either better or worse than T properties. Furthermore, metallography
demonstrated that neither fracture initiation sites nor fracture paths
could be associated with shear bands (Figures 33 and 34).
One plausible explanation of the lack of an effect of shear bands
may be that the shear bands are harder than the bulk (Table 3) and that it
is thus easier to initiate and propagate a crack in the bulk. If this were
the case, L and T properties in samples with shear bands would be both rep-
resentative of bulk properties, especially since the tests were run in load
control. It is conceivable that the results would be different if fatigue
testing were done in strain control since T samples with shear bands might
have shorter effective gage lengths because of the hardness effect.

59
U0
144z -4o E4E-4j .
to J
o~ ~ d 4 rrr- o- w ww.rw--c
0
0 -+H V- 'mm- q4 Ne nc
.1.,- C)000r- q
T- 4 4r- -v-4 9- r49fr4r - -
0 w
CIw

60
(d)..
FIGURE 33. Fatigue Axis Sections of a+$ Preform Microstructure 510 CFatigue Samples Cut from Forgings (Fatigue Stress: 483 MPa(70 KSI)). Forging Temperatures were (a-d) 913 C, (e,f)982 C; Die Temperatures were (a-d) 191 C, (e,f) 371 C; DwellTimes were (a-d) 10 Secs., (e,f) 0 Secs. Solution Treatment(Prior to Aging Treatment of 593 C/8 Hrs.) was Performed forI Hour at (a,b) 899 C or (c-f) 954 C. Fatigue Axis Di-rections were (a,c,e) Longitudinal or (b,d,f) Transverse.(3X)
kC
_o__
24

61
(a) xI. ""
FIGURE 34. Fatigue Axis Sections of 6 Preform Microstructure 510 CFatigue Samples Cut from Forgings (Fatigue Stress: 483 MPa(70 KSI)). Forging Temperatures were (a-d) 913 C, (e,f)
982 C; Die Temperatures were (a-d) 191 C, (e,f) 371 C;Dwell Times were (a-d) 10 Secs., (e,f) 0 Secs. SolutionTreatment (Prior to Aging Treatment of 593 C/8 Hrs.) wasperformed for 1 Hour at (a,b) 899 C or (c-f) 954 C.Fatigue Axis Directions were (ac,e) Longitudinal or(b,d,f) Transverse. (3X)
________

62
CON~CLUSIONS
The results of this program provide a unique understanding of
required practices and precision attainable without the occurrence of shear
band defects for isothermal forging (typically done in "show" hydraulic
presses) and conventional forging (done in mechanical and hydraulic presses).
In isothermal forging, low working speed is beneficial from the viewpoints of
lower working loads, the generally higher strain-rate sensitivity of materials
hot worked at low strain rates, and the minimization of deforma,-on-induced
heating and thermal softening. It has been demonstrated that large rate
sensitivities and small levels of flow softening both counteract the tendency
to form shear bands under nomina ly isothermal conditions. In non-isothermal
forging, it has been shown that heat transfer can have a significant effect
on forgeability. This is important since large amounts of heat transfer can
lead to working at temperatures at which the material has inherently low
workability. In addition, large temperature gradients across the workpiece
may be developed. These gradients may lead to large deformation gradients
and hence, shear bands in materials with flow stresses which are heavily
termperature dependent, such as titanium alloys. It is significant to note
that near-net shape or precision forging of titanium alloy parts is normally
only done conventionally in mechanical presses or isothermally in hydraulic
presses. Further development of the presented simulation capabilities for
use on other forging geometries could provide a quantitative basis for deter-
mining the necessary conditions (including required die temperatures) for
forging shapes in mechanical and hydraulic presses In order to minimize loads
and avoid defects. This technical Input would be critical for producing
acceptable quality forgings at the lowest possible cost.
This program has also established the effect of shear bands on
service properties for TI-6242 forgings. Although the effect is small or'
negligible f or tensile and fatigue loadings, creep properties way be notice-
ably degraded by shear bands. Mechanisms by which this degradation occurs
have been suggested, but further research is needed to verify them.

63
PRESENTATIONS AND PUBLICATIONS
" S. L. Semiatin and G. D. Lahoti, "Unstable Flow in Hot
Forging of Titanium Alloys", presentation at Fall Meeting,
TMS-AIME, Milwaukee, Wisconsin (September, 1979).
• S. L. Semiatin and G. D. Lahoti, "Shear Band Development
in Hot Working of Titanium Alloys", presentation at AIME
Annual Meeting, Chicago, Illinois (February, 1981).
" G. D. Lahoti and S. L. Semiatin, "Application of Process
Modeling to Predict Microstructural Response in Hot Forging
of a Two-Phase Titanium Alloy", paper presented at and pub-
lished in proceedings of Ninth AIMTDR Conference, December,
1980.
" S. L. Semiatin and G. D. Lahoti, "Deformation and Unstable
Flow in Hot Torsion of Ti-6A1-2Sn-4Zr-2Mo-O.1Si", Met.
Trans. A, 1981, Vol. 12A, p 1719.
" S. L. Semiatin and G. D. Lahoti, "Deformation and Unstable
Flow in Hot Forging of Ti-6A1-2Sn-4Zr-2Mo-O.lSi", Met.
Trans. A, 1981, Vol. 12A, p 1705.
" S. L. Semiatin and G. D. Lahoti, "Forging of Metals",
Scientific American, 1981, Vol. 245, No. 2, p 98.
" S. L. Semiatin and G. D. Lahoti, "The Occurrence of Shear
Bands in Isothermal, Hot Forging", Met. Trans. A, 1982,
Vol. 13A, p 275.
* S. L. Semiatin and G. D. Lahoti, "The Occurrence of Shear
Bands in Non-Isothermal, Hot Forging", paper in preparation
for submission to Met. Trans.
" S. L. Semiatin and G. D. Lahoti, "The Effect of Shear Bands
on Service Properties of Ti-6242 Forgings", paper in prep-- aration for submission to Met. Trans.
o C. R. Thompson and S. L. Semiatin, "The Occurrence of Shear
Bands in Isothermal, Hot Forging", exhibit prepared for 1980
International Metallographic Exhibit (sponsored by IMS and ASM). I- .-

64
LIST OF PERSONNEL
(1) Dr. S. L. Semiatin, Metalworking Section
(2) Dr. G. D. Lahoti, Metalworking Section
(3) Dr. S. I. Oh, Metalworking Section
(4) Dr. A. L. Hoffmanner, Metalworking Section
(5) Dr. T. Altan, Engineering & Manufacturing Technology Department
COUPLING
Personnel at AFWAL (A. M. Adair and H. Gegel) have been kept
aware of progress on the present project. They have been receiving preprints
of the papers resulting from the program. In addition, the results have
been presented at the Processing Science Program Workshops (July, 1980,
August, 1981), at which various AFWAL, University, and industrial people
were in attendance. Several presentations on project results have also been
given at AFWAL. These project reviews met with favorable reaction from
AFWAL personnel.
The engineers who worked on this project (S. L. Semiatin and
G. D. Lahoti) have also worked closely together on the Dual Property Disk
Program, and the results of the two projects have been coupled to enhance
the significance of each program.
REFERENCES
1. G. D. Laboti and T. Altan, Report AFML-TR-79-4156, Battelle-ColumbusLaboratories, Columbus, Oh., 1979.
2. J. J. Jonas and M. J. Luton, Advances in Deformation Processing,J. J. Burke and V. Weiss, Editors, Plenum Press, N.Y., 1978.p 215.
3. D. J. Abson and J. J. Jonas, Met Techn , 1977, Vol. 4, p 462.
4. W. A. Backofen, Deformation Processing, Addison-Wesley Publishing Co.,Reading, Ma., 1972, Chap. 10.

65
REFERENCES (Continued)
5. S. L. Semiatin and G. D. Lahoti, Met. Trans. A, 1981, Vol. 12A, p 1719.
6. S. L. Semiatin and G. D. Lahoti, Met. Trans A, 1982, Vol. 13A, p 275.
7. S. Kobayashi, C. H. Lee, and S. C. Jain, Report AFML-TR-70-90, Universityof California, Berkeley, Ca., 1970.
8. J. J. Jonas, R. A. Holt, and C. E. Coleman, Acta Met., 1976, Vol. 24,p 911.
9. S. I. Oh, Inter. J. Mech. Sci., 1982, Vol. 24 (in press).
10. M. N. Janardhana and S. K. Biswas, Inter J. Mech. Sci., 1979, Vol 21,p 699.
11. S. L. Semiatin, Unpublished Research For USAF (Contract F33615-78-C-5025)and Aerojet Ordnance Corp., Battelle-Columbus Laboratories, Columbus,Oh., 1979.
12. G. D. Lahoti and T. Altan, J. Eng. Materials and Techn., Trans. ASME,
1975, Vol. 97, p 113.
13. C. C. Chen, Report RD-77-110, Wyman Gordon Co., North Grafton, Ma., 1977.
14. J. Pepe, Technical Report WVT-7217, Watervliet Arsenal, Watervliet, N.Y.,1972.
15. J. Pepe, Met Trans., 1973, Vol. 4, p 2455.
16. G. D. Lahoti and T. Altan, Report AFMIL-TR-80-4162, Battelle-ColumbusLaboratories, Columbus, Ohio, 1980.
17. J. E. Allison, J. C. Williams, S. L. Semiatin, Unpublished Research forUSAF (Contract F33615-78-C-5025), Carnegie-Mellon University, Pittsbur&n,Pa., and Battelle-Columbus Laboratories, Columbus, Ohio, 1981.
I