AD-A268 374 - Defense Technical Information Center · AD-A268 374 UNCLASS IFIlED ... FILD GOUP...
104
AD-A268 374 UNCLASS IFIlED SECURITY CLASSIFICATION OF THIS PAGE PAGEv~ I.- REP& T4J4.fITATION__PAGE _________________ "'TTO"SIP D lCT b. RESTRICTIVE MARKINGS 28. SECURITY CLASSIFICATION AU TYU I * 3. DISTRIBUTION /AVAILABIUTY OF REPORT Approved for public release lb. OICLASSIFICATION/OOWNGý SCH10OUl Distribution unlimited 4. PERFORMING ORGANIZATION REPORT NUMBEM 5. MONITORING ORGANIZATION REPORT NUMBER(S) USAF- -3-92 I 66. NAME OF PERFORMIING ORGANIZATION 6b. OFFICE SYMBOL 7s. NAME OF MONITORING ORGANIZATION (KI. ADDRESS (City, Scat% aMW Zip Cods) 7b. ADDRESS (city, State. aWW Zip Cods) Department of Physics, University College, Galway, Ireland Box 14, FP0 NY 09510 86U. NAME OF FUNDING /SPONSORING 8b. OFFICE SYMBOL 9. PROCUREMENT INSTR~UMENT IDENTIFICATION NUMBER Bc. ADRESS (~r~. Sat., ad ZIP ods)-10. SOURCE OF FUNDING NUMBERS _____ Bof4 PROGRAM PROJECT ITASK IWORK UNIT FP0 New York 09510 ELEMENT No. No. NO. ACESSION No. 61102 P 2301 D1 I1I. TITLE (kciud Secudly Clauiflctlon)IE Spectroscopy of crystalline, glass, and ceramic media doped with cobalt and nickel. 12. PERSONAL AUTHOR(SMlnToa .9 .. i '~ 136. TYPE OF REPORT 13b. TIME COVERED 14. DATE OF REPORT 9 - 8 6 'Final FROM 8 / 9 / 30 T0 92/f/29 92.5.3 II E~ 16.. SUPPLEMENTARY NOTATIONIM J FILD GOUP SUB4OUP Tunable laser media, optical spectroscopy, crystalline Studies of Media doped With Ni, Col Cr ions, aimed at identifying new materials for tunable laser aplications, are prestnted. With Co 2 +-doping, some new possibilities, based mainly on tetrahedrally- coriated a sytm h cordatdCo2+ ions and emission from higher excited states of othedrally-coorditd sytm, hve t been documented. The range of Nt2-doped materials studied included MgNb 2 O,, ZnNb 2 O. and Mg~iO 4 j (in which the luminescence is thermally quenchied) and the spinels LiAI 5 Ot and ZnAI 2 O 4 (which show I I evidence of high Q.E. at room temperature). Excited state absorption measurements will'be necessay to j assess fully these materials. Cr-doped media, added later to the prqect brief, included materials doped with Cr+ Cr4+ (and both). None of the Cr"-doped samples Y 2 Si0 5 , GdzSiOs, and Ca 3 (VO4)2hadal luminescence Q.E. comparable to that of forstente. Two samples doped with Cr3+ ions, BiG&%and LaSr 2 Gaj 1 0m show some promise for laser applications but their potential region of operation overlaps ta already covered by Ti:sapphire. A novel pumping possibility is described for BiGaO 3 , 20 " N UI N AA A NT O BT AT2 .A SNA 22s NAE F AOVAILABIUTY OF ABSRL 22..~_12b TILIIF64O9 C E Dr. Eimu Davies AL0-ý49 22 T SY,0=?LMBOL 00 Form 1473, JUN 84 Pmss.sn v bsiv.SCUBII GASSC&TIOh OF DXI PAEM 3 93 ii0O 9
Transcript of AD-A268 374 - Defense Technical Information Center · AD-A268 374 UNCLASS IFIlED ... FILD GOUP...

AD-A268 374
UNCLASS IFIlEDSECURITY CLASSIFICATION OF THIS PAGE PAGEv~
I.- REP& T4J4.fITATION__PAGE _________________"'TTO"SIP D lCT b. RESTRICTIVE MARKINGS
28. SECURITY CLASSIFICATION AU TYU I * 3. DISTRIBUTION /AVAILABIUTY OF REPORTApproved for public release
lb. OICLASSIFICATION/OOWNGý SCH10OUl Distribution unlimited
4. PERFORMING ORGANIZATION REPORT NUMBEM 5. MONITORING ORGANIZATION REPORT NUMBER(S)
USAF- -3-92
I 66. NAME OF PERFORMIING ORGANIZATION 6b. OFFICE SYMBOL 7s. NAME OF MONITORING ORGANIZATION
(KI. ADDRESS (City, Scat% aMW Zip Cods) 7b. ADDRESS (city, State. aWW Zip Cods)
Department of Physics,University College, Galway, Ireland Box 14, FP0 NY 09510
86U. NAME OF FUNDING /SPONSORING 8b. OFFICE SYMBOL 9. PROCUREMENT INSTR~UMENT IDENTIFICATION NUMBER
Bc. ADRESS (~r~. Sat., ad ZIP ods)-10. SOURCE OF FUNDING NUMBERS _____
Bof4 PROGRAM PROJECT ITASK IWORK UNITFP0 New York 09510 ELEMENT No. No. NO. ACESSION No.
61102 P 2301 D1
I1I. TITLE (kciud Secudly Clauiflctlon)IESpectroscopy of crystalline, glass, and ceramic media doped with cobalt and nickel.
12. PERSONAL AUTHOR(SMlnToa .9 .. i '~136. TYPE OF REPORT 13b. TIME COVERED 14. DATE OF REPORT 9 - 8 6
'Final FROM 8 /9 /30 T0 92/f/29 92.5.3 II E~16.. SUPPLEMENTARY NOTATIONIM
J FILD GOUP SUB4OUP Tunable laser media, optical spectroscopy, crystalline
Studies of Media doped With Ni, Col Cr ions, aimed at identifying new materials for tunable laseraplications, are prestnted. With Co2+-doping, some new possibilities, based mainly on tetrahedrally-
coriated a sytm hcordatdCo2+ ions and emission from higher excited states of othedrally-coorditd sytm, hve
t been documented. The range of Nt2-doped materials studied included MgNb 2O,, ZnNb2O. and Mg~iO4j (in which the luminescence is thermally quenchied) and the spinels LiAI5Ot and ZnAI2O4 (which show
I I evidence of high Q.E. at room temperature). Excited state absorption measurements will'be necessay to jassess fully these materials. Cr-doped media, added later to the prqect brief, included materials doped withCr+ Cr4+ (and both). None of the Cr"-doped samples Y2Si0 5, GdzSiOs, and Ca3(VO4)2hadalluminescence Q.E. comparable to that of forstente. Two samples doped with Cr3+ ions, BiG&%andLaSr 2Gaj1 0m show some promise for laser applications but their potential region of operation overlaps taalready covered by Ti:sapphire. A novel pumping possibility is described for BiGaO3 ,
20 " N UI N A A A NT O BT A T2 .A SNA22s NAE F AOVAILABIUTY OF ABSRL
22..~_12b TILIIF64O9 C EDr. Eimu Davies AL0-ý49 22 T SY,0=?LMBOL
00 Form 1473, JUN 84 Pmss.sn v bsiv.SCUBII GASSC&TIOh OF DXI PAEM
3 93 ii0O 9

INTRODUCTION
Rapid advances are being made in the development of new solid-state laser systems in the
near infrared (0.7 - 2.5 Irm) - based mainly on crystalline materials which are doped with
one or more optically active ions (e.g. Ho, Tm, Cr:YAG). At the visible end of this spectral
region, the Ti:sapphire laser is now commercially available but, further into the IR, most
systems are based on rare-earth ions. Transition metal ions with their strong coupling to
their environment offer the possibility of broadband tunable operation but despite many
studies, centered mainly on Co20 and Ni2+-doped (and more recently Cr4+-doped) materials,
only a couple of efficient room temperature laser media, based on these dopant ions, have
been developed. The aim of this project is to carry out further studies in this area, toinvestigate the spectroscopy of existing materials, and suggest guidelines or limitations on
the development of new materials for tunable operation in the near infrared. The plan of
research was simply to investigate the luminescence properties of new media doped with Ni,
Co, (and eventually Cr) ions with the aim of identifying materials with suitable properties
for this application.
The organisation of this report is as follows. Chapter 1 provides some general theoretical
and background information to the project and is intended to provide the context and
rationale for the project work. While the experimental results obtained with a wide range
of glasses and ceramics were not very encouraging, this part of the work is summarised
briefly in Chapter 2. The data on the various Co and Ni-doped materials is gathered together
in Chapters 3 and 4, respectively. Chapter 5 is devoted to materials doped with chromium
(Cr3+, Cr 4+). Copies of various publications arising from the project are contained in the
appendix, which follows the Conclusion.
DTIC QUALT INSPE'TMD S
AcCgesiofl For
NTIS CRA&IOTIC TAIJU;IasJ;,oun)cedJiistificdtion
BlyOistr ibution t
Avadafbeiiy CodesAvadllit , eaer id i/w
Disl Avaul
2.
* • • • • • • le- mi- J ..b..imnm

CHAPTER I
1.1 Introduction.
The development of new tunable solid-state lasers (e.g. Cr-doped forsterite and alexandrite,
Ti-doped sapphire) has stimulated a search for new materials doped with transition metal ions
which emit efficient phonon-terminated broadband luminescence at room temperature. The
principal results of this research are summarised in Tables 1-5, which also summarize the
materials and important results identified in the present study. These tables indicate that the
vibronic laser materials based on the transition metal ions are made mostly from oxide orfluoride single crystals doped with Ti3+, Cr3+, Cr4+, Co2+, or Ni2+ ions. The Cr4+ has
emerged only in the last few years as a worthwhile laser centre in its own right which can
extend the range beyond that of Cr3+ in the infrared and new crystal hosts are being sought
w'iich can stabilise this oxidation state. Because the outer (3d) electrons, responsible for the
optical properties of these materials, are strongly influenced by the local environment, the
optical transitions usually take place between levels which have different coupling to the
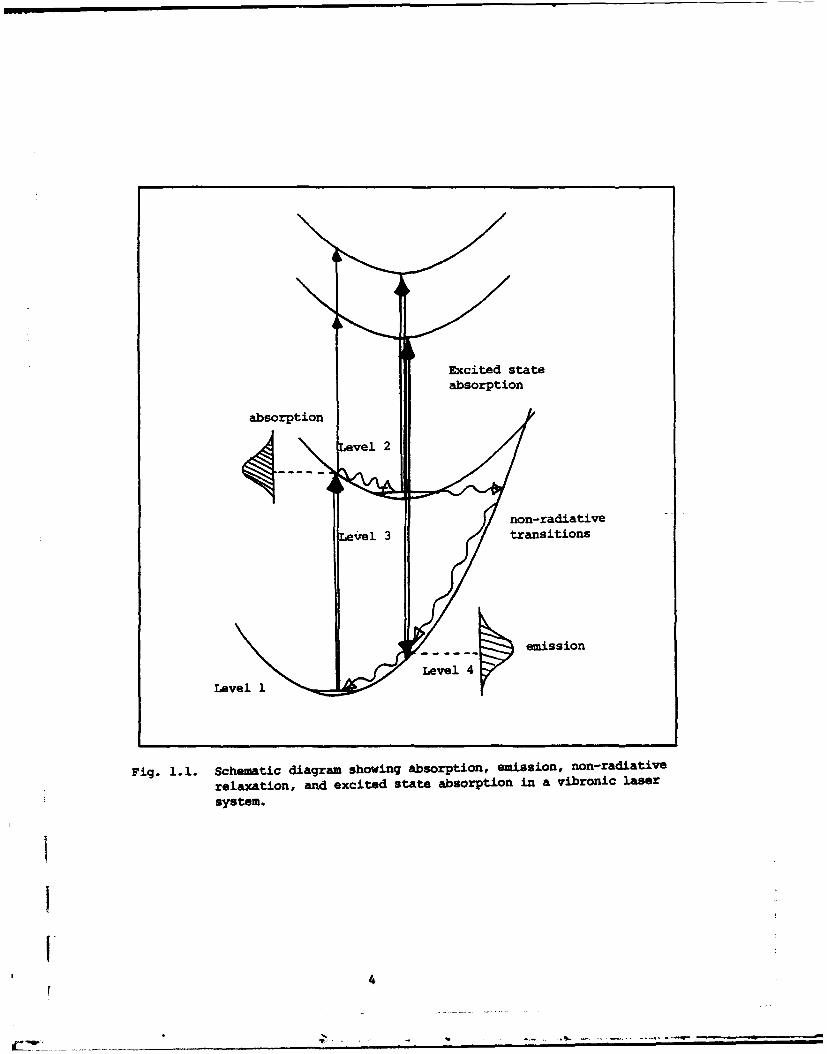
lattice and this usually results in broadband emission (Fig. 1.1). The potential laser
transition usually corresponds to emission from the lowest excited state to phonon levels of
the ground state. Tables 1-5 provide a useful listing of all the systemsl'-4 which have been
considered in recent years for tunable laser action as well as, for those which have already
lased, their tuning range.
j Some general comments can be made on the results presented in these tables.
1. The effective tuning range (except for Ti3O, Co2+ systems) is generally much reduced
compared with that expected from the emission spectrum - mainly due to excited state
absorption.2. A large number of Cr-doped systems have lased fairly efficiently at room
temperature. The most famous are GSGG, alexandrite, and forsterite, and these have
been marketed commercially.
3. Systems doped with Ni2+ or Co2+ are much less numerous, because (i) there are not
so many materials which can accept these divalent ions, and (ii) they give rise (in
octahedral coordination, to lower energy emissions which are more likely to be
quenched by non-radiative processes. Thus, these systems will often only lase at low
temperatures (5 100 K).
Again, summarising these results in another way, Fig. 1.2 shows the emission domains which
can be expected with each of these ions. Although Ti3+ and V2+ systems have been included
for completeness in our review up to now, only Co2÷, Ni2+, and Cr-doped systems were
investigated in this work. From Fig. 1.2, it should be possible to find laser systems which
I
Excited stateabsorption
absorption
non-radiativeLevel 3 transitions
emission
Level 4
Fig. 1.1. Schematic diagram showing absorption, emission, non-radiative
relaxation, and excited state absorption in a vibronic laser
system.
II
!-4
Y..-

TABLE 1.1 Cr-doged systems1- 4
Host matrix Emission range Tuning range (Atm)(;Lm) at room temp.
Y 3GaSO 1 2 (YGG) 0.65 - 0.87 0.73Gd3Ga5Q12 (GGG) 0.65 - 0.9 0.74 - 0.84Gd3(Sc,Ga)5012 (GSGG) 0.67 - 0.9 0.74 - 0.84
Gd3Sc2AI3O12 (GSAG) 0.67 - 0.92 0.78BeA120 4 (alexandrite) 0.67 - 0.83 0.70 - 0.82
CaY2Mg2Ge3O1 2 (Camgar) 0.71 - 0.85Ca 3Al2Ge3 O1 2 0.7 - 0.8MgY 2Mg 2Ge3O, 2 0.71 - 0.9
Be3AI2(SiO 3)6 (emerald) 0.67 - 0.85 0.73 - 0.81Mg2SiO4:Cr'4 1.0 - 1.4 1.21 - 1.26
ZnWO4 0.8 - 1.3 1.03
LaMgAIl0 19 (LMA) 0.65 - 0.9MgAl 20 4 0.7- 1.2
Ci 3Ga2Ge4O1 2 0.87- 1.2La3Ga 5.5Tao.5014 0.92 - 1.24La3Ga5GeO14 0.88- 1.22La 3Ga 5SiO, 4 0.82 - 1.12
KZnF3 0.71 - 0.9 0.76 - 0.86Na3Ga2Li3F12 0.74 - 0.84SrAIF5 0.72 - 1.05 0.85 - 0.95LiCaAIF 6 0.65 - 1.0 0.72 - 0.84K2NaScF6 0.67 - 0.95Rb2KGaF6 0.69 - 0.80Cs2NaYCI6 0.83- 1.25
New Materals
BiGaO3 0.68 - 0.75Mg2SiO4:Cr 3+ 0.68 - 0.85LaSr 2Ga,,OA:Cr3+ 0.69 - 1.1Y2SiOS:Cr4+ (YSO) 1.15 - 1.5Gd2SiOS:Cr 4+ (GSO) 1.2 - 1.6GdSc2Gaol,2 :Cr4 + (GSGG)Ca3(VO4) 2:Cr4+ (CVO) 1.16- 1.40
I !5

TABLE 1.2 - Ni2+-doped systems. 14-29
Host matrix Emission range Tuning range (Jrm)(;Lm) at LN2 temp.
MgF2 1.5- 1.95 1.61 - 1.74MgO 1.2- 1.5 1.316 - 1.409CaY2Mg2Ge3Ol 2 1.3- 1.8 1.46Mg2GeO 4 1.35- 1.9MgAI20 4 1.1 - 1.5
KMgF 3 1.53- 1.95KZnF3 1.53-2.0LaMgAlI1Oi 9 (LMA) 0.95 - 1.4LaMgGakAll.1 O19 (LMGA) 1.0 - 1.6GGG 1.3 - 1.8LaGaO 3 (LGO) 1.1 - 1.5YA1O 3 (YALO) 0.95 - 1.3
SRbCdF3 1.8 - 1.95MgC12CdCI2
CsMgC13CsCdCI3
NewmateilMgNb 20 6 1.65-1.8ZnNb 2O6 1.65 - 1.8ZnAl20 4 1.05- 1.5LiA15Os 0.90- 1.50Mg2SiO4 0.80 - 1.5 (two bands)
TABLE 1.3 - Ti3+-doped systems.0 32
A120% 0.6- 1.2 0.68- 1.2
YA1O 3 0.5 - 0.9
!6ii
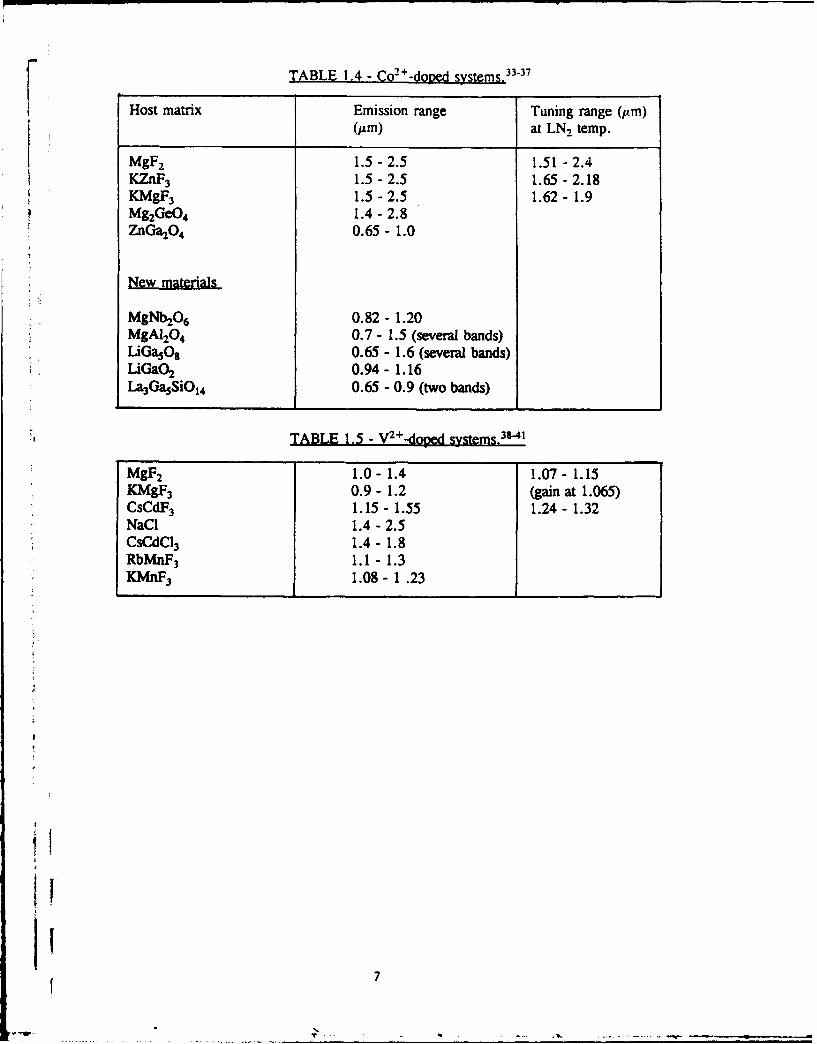
F TABLE 1.4 - Co 2+-doied sys•temS, 33-37
Host matrix Emission range Tuning range (pm)(Cm) at LN, temp.
MgF 2 1.5 - 2.5 1.51 - 2.4KZnF 3 1.5-2.5 1.65 - 2.18KMgF 3 1.5 - 2.5 1.62 - 1.9Mg2GeO4 1.4-2.8ZnGa2O4 0.65 - 1.0
Ne-materia1L
MgNb 2O6 0.82 - 1.20MgA120 4 0.7 - 1.5 (several bands)LiGasOs 0.65 - 1.6 (several bands)LiGaO2 0.94- 1.16La3Ga5SiO14 0.65 - 0.9 (two bands)
TABLE 1.5 - V2 +-doped systems,3"1
MgF2 1.0-1.4 1.07-1.15KMgF3 0.9-1.2 (gain at 1.065)CsCdF3 1.15-1.55 1.24-1.32NaCI 1.4- 2.5CsCdC13 1.4- 1.8RbMnF 3 1.1- 1.3KMnF 3 1.08- 1.23
I7
ii
ii

+1CNJ
I CNL- C:
C7 -TlI II-
- S1
C))
CCD-4 +
L-4-
+ LaU
X L
C~CD

F operate from about 1.1 to 1.9 Am with Ni2+, from 0.7 to 2.5 Am with Co+, and from 0.65
to 1.4 Am for Cr doping, including tetrahedral coordination for Co2 + and the possibility ofCr4& doping (also in tetrahedral sites).
1.2 Solid-state lasers vs tunable dye lasers
Research into new solid-state lasers in recent years has been driven by the followingadvantages42 which these systems can offer over dye lasers (besides their availability inwavelength regions which are not attainable at all by dye lasers).I. Better photochemical stability under laser or flashlamp pumping.2. Simpler to handle - no solvents or complicated flushing procedures.
3. Slope efficiencies of 10 - 60 %, better than many dye lasers.
4. They are true 4-level systems, which means lower laser thresholds.
5. They have broadband absorption spectra throughout the visible region, allowing
pumping by flashlamps or other lasers.
Given the results shown in Tables 1-5, it is surprising that only a few of these laser systemsare commercially available (Cr-doped alexandrite, GSGG, forsterite ; Ti-sapphire ; and
MgF2:Co2+). There are several reasons for this anomaly.
1. Materials growth problems of congruency, stoichiometry, and dopant solubility which
can make the optical quality unacceptable or the cost prohibitive.
2. Thermally-induced lensing or birefringence can degrade the laser performance.
3. Excited state absorption at the laser wavelength and non-radiative relaxation processes
to the ground state.
It is clearly worthwhile, therefore, to continue the search for new materials by exploring the
spectroscopy of new media, and re-examining previously discarded materials, so that
luminescent processes in solids may be more deeply understood and reliable ground rules
may be developed to guide in crystal growth programs.
While laser action has been achieved in several Co and Ni-doped materials at low
temperatures, quenching mechanisms such as non-radiative relaxation and excited state
absorption have prevented all systems based on these ions (except MgF2:Co) from operating
at room temperature. The purpose of this research project was to search for new tunable
solid-state laser materials.
1.3 Tleoretical background
The Tanabe-Sugano diagrams43, which give the energy levels as a function of the (octahedral)
L [crystal field strength, are shown in Fig. 1.3 for the important laser ions. The abscissa is
the ratio Dq/B, where Dq is the local crystal field, assuming a point charge model, and B
9

CN
Ea CN
C4U
8cc
0
0~_ 0 0 0
- 0254)
-4~C 04 -0 0-
$4 4
-4 I
0o0 0 0
4flf
(N4 5 CNr-4 -4 E- 54 CN
(N
++
q +
0
0-4
01

is the Racah parameter which measures the intra-ion electron repulsion. These diagrams only
give a crude estimate of the true situation since covalency effects, spin-orbit coupling, andSlower symmetry fields at the impurity ion site, are not included. Although only
approximations, they provide some insight and guidance in the search for laser media. Forsystems doped with Cr3+ and V21, the crossing point of the 2E and 4T2 levels takes place
when Dq/B = 2.3 ; below this value, we have "low-field" systems in which the emitting
state is the 4T7 state and its coupling to the lattice is very different from that of the ground
(4A2 ) state, resulting in broad-band (tunable) emission. When Dq/B < 2.3, we have "high-
field" behaviour (e.g. ruby) characterised by sharp fine emission from the 2E level to the
ground state. Many broad-band laser systems correspond to the low-field case but where
the 4T2 - 2E separation is so small that the quartet level is populated at room temperature.
In this way, the long-lived 2E level provides storage for the 4T2 level with which it is in
thermal equilibrium. (GSGG, alexandrite, and emerald are examples of this behaviour).
For systems doped with Ni2+ or Co2+, the Dq/B values in typical hosts are such that the
emission from the lower excited states are almost always in the form of broad bands at room
temperature.
1.3.1 Non-radiative Processes
The non-radiative relaxation rate W, , which, together with the radiative rate,
influences the overall fluorescence lifetime, is a complicated function of the Huang-Rhys
parameter S, and of the frequency P, and the average number (Na) of the modes involved in
the transition" (see Chapter 3). It also depends on the matrix element < r./I'pffb > where
r•a, rb are the irreducible representations characterising the ground and the excited states
respectively and rp is the representation characterising the interacting phonon modes.
Considering this matrix element alone, some comments can be made for particular
combinations of active ion and host lattice. The lower energy optical transitions occur
between orbital states A2 and T 2 in the case of Ni2 + and V2+ in low-field systems while they
occur between stazs T, and T2 in the case of CO2+ (see Fig. 1.3). Thus group theory
analysis of the above matrix element for ions in octahedral site symmetry shows that only
TI, promoting modes can be efficient in the case of Ni2+, Cr3 + and V2+ ions while Azg, Es,
TI, and/or T, can act in the case of Con+. Knowing that coupling to TI, modes, which
correspond to a simple rotation of the immediate ligands, is usually very weak, we canS conclude, in agreement with experimental observations, that the non-radiative processes are
much more efficient in the case of Co2+ than in the case of the other ions. In other words,
the fluorescence quenching occurs at lower temperatures (generally < 100 K), in the Co2+-
*i doped systems (53] than in the same hosts doped by Ni2+, Cr3+ or V2+ ions. Similar
i+ 11

symmetry considerations can be used to understand the increased non-radiative processes in
the systems with lower local site symmetry, thus systems in which a larger range of phononmode types can be involved. This is illustrated by the fact that the quenching temperatures
of the infrared fluorescence lifetimes for Ni2+ or V2+ in cubic systems such as MgO and
KMgF 3 are higher than for other hosts (MgF 2) where there is a tetragonal local site
distortion. Although one might infer that cubic systems with octahedral local site symmetry
should be preferable for laser purposes, considerations such as the oscillator strength of the
transitions, are generally more important in the case of low symmetry systems, so that
accunate predictions of the importance of the non-radiative processes in the laser properties
of these. materials still remain rather uncertain. Also the absence of possible Tjg distortions
in somot Crý * doped perovskites has led 45 to the inclusion of other T:g-type modes involving
complex motions of the ligands which are effective in promoting radiationless transitions, so
that the above selection-rule is not very strict either for cubic systems.
Multiphonon non-radiative transition rates can be explained quite well, for trivalent
lanthanide ions, in terms of well-known semi-empirical models, which describe the process
in terms of the energy gap between the initial and final states, and empirical (lattice-
dependent) constants. 46-4 For example, a great deal of attention has been given to the
determination of the radiative and nonradiative branching ratios out of the various levels of
the 5D manifold of Eu3+ in solids. As a result, much is known about both the nature of
excited-state interactions in such systems and the physical factors that influence them. In
contrast, our understanding of the radiative and non-radiative transitions occurring between
excited states of transition metal ions is poor. This is due mainly to the fact that the stronger
interaction of these ions with their environment greatly complicates the problem of describing
electron-phonon coupling. Unlike the trivalent lanthanides, the degree of electron-phonon
coupling may also vary significantly among the different electronic states of the ion, resulting
in dramatic differences in the nature of the interactions (both radiative and non-radiative)
between different pairs of electronic states. This makes it impossible to generalize the
description of the behaviour of multiphonon transitions in these systems in terms of "lattice
constants". Also, relatively little detailed experimental information about transitions between
excited states of 3d ions is available. For example, although excited-state absorption (ESA)
processes in solid-state laser materials are important, in that they may adversely affect laser
output, it is only recently that careful ESA measurements have beena performed on 3d ionsother than Cr3+. The ESA of Ni2+ in MgF2
18 and MgO,'"'49 and V2 + in MgF 239 and
KMgF 339 have now also been reported. Information on transitions between excited states of
Ti2 + in MgCI2 was obtained using excited-state excitation (ESE) measurements." Still,these
studies provide information only on radiative transitions between these excited states. From
a practical standpoint, accessing information about non-radiative transitions between excited
12
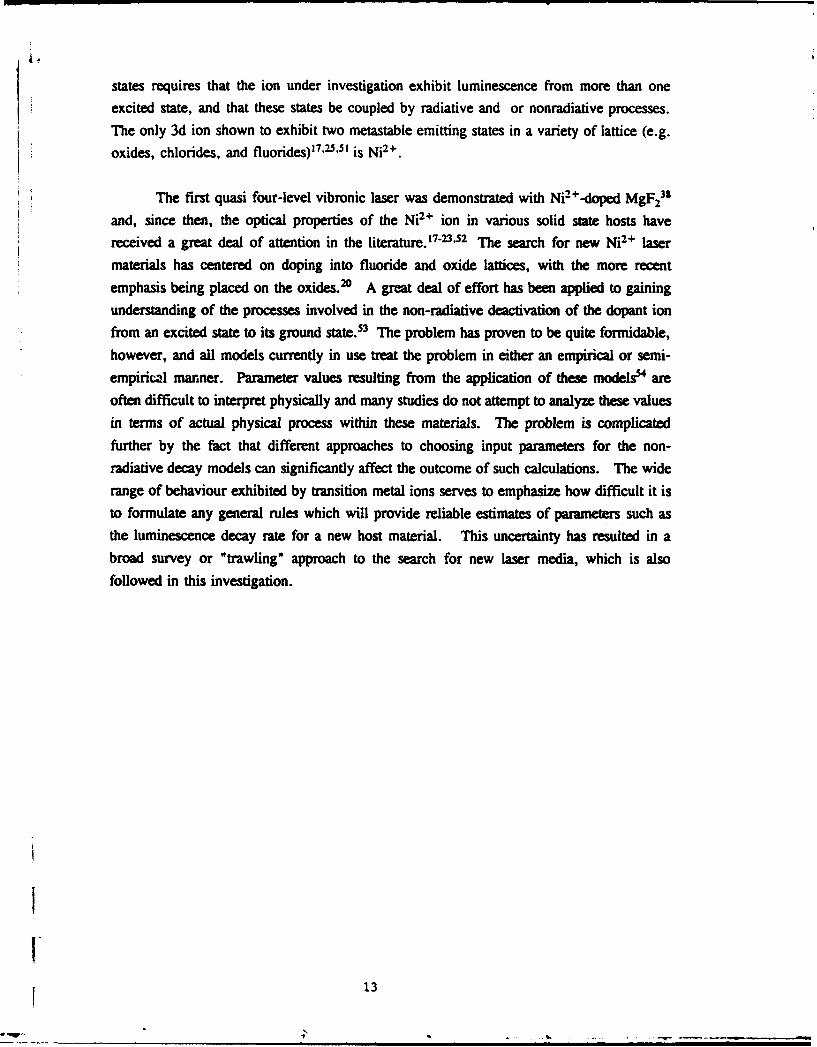
states requires that the ion under investigation exhibit luminescence from more than oneexcited state, and that these states be coupled by radiative and or nonradiative processes.The only 3d ion shown to exhibit two metastable emitting states in a variety of lattice (e.g.oxides, chlorides, and fluorides)' 7 .5' is Ni2+.
The first quasi four-level vibronic laser was demonstrated with Ni2+-doped MgF 23s
and, since then, the optical properties of the Ni2+ ion in various solid state hosts havereceived a great deal of attention in the literature.17-2'5 2 The search for new Ni2+ lasermaterials has centered on doping into fluoride and oxide lattices, with the more recent
emphasis being placed on the oxides.20 A great deal of effort has been applied to gainingunderstanding of the processes involved in the non-radiative deactivation of the dopant ionfrom an excited state to its ground state.5 3 The problem has proven to be quite formidable,
however, and all models currently in use treat the problem in either an empirical or semi-empirical manner. Parameter values resulting from the application of these models"5 areoften difficult to interpret physically and many studies do not attempt to analyze these valuesin terms of actual physical process within these materials. The problem is complicatedfurther by the fact that different approaches to choosing input parameters for the non-radiative decay models can significantly affect the outcome of such calculations. The wide
range of behaviour exhibited by transition metal ions serves to emphasize how difficult it isto formulate any general rules which will provide reliable estimates of parameters such asthe luminescence decay rate for a new host material. This uncertainty has resulted in abroad survey or "trawling" approach to the search for new laser media, which is also
followed in this investigation.
1I-
! 13

CHAPTER 2
GLASSES AND GLASS-CERAMICS
2. 1 Introduction.
Although most of this report describes results obtained with crystalline media, we also
investigated various amorphous materials (glasses/ceramics) doped with Co, Ni, and Cr ions.
Glasses and ceramics appeared to offer the possibility of tailoring the luminescent properties
of the material by variation of the composition and by suitable heat treatment. While this
approach had not been successful with Cr ions, the reason for this failure is now well
understood and it seemed that the possibility of obtaining efficient luminescence from
amorphous materials doped with Co and Ni should be explored.55 Thus, in the early stages
of the project we initiated the preparation of various Co- and Ni-doped glasses and
glass-ceramic materials and surveyed a range of different glass types for useful emission
properties. While these early glass preparation efforts were somewhat "hit-or-missu, we
hoped that the results of our broad initial surveys in both the glassy and crystalline media
would provide sufficient guidance to enable us to suggest glass composition and fabrication
procedures (thermal treatment, etc.) which would be likely to yield useful emissions and high
luminescence efficiency. At that point, we planned to prepare and evaluate new doped
glasses to provide continuous feedback for further trials. Our experiences in this area are
summarised in this chapter.
2.2 Initial approach
A selection of glasses and ceramics were ordered from another institution (University of
Limerick, Ireland) with expertise in glass fabrication techniques. This institution is
technology-oriented and had an ongoing research programme devoted to the fabrication and
testing of oxy-nitride glass-ceramics for engineering applications. The first batch of glasses
and ceramics were doped with Co2+, Ni2+, and Cr 3+ ; undoped control samples were also
provided. They were cut into suitable sizes for optical absorption and laser-excited
photoluminescence experiments and their spectroscopic behaviour was investigated.
Our approach was based on the experiences of Coming Glass Works (U.S.A.), where
Cr3+-doped silicate glass ceramics had been fabricated as potential luminescent solar
concentrators." In these materials, micro-crystals of the spinel (ZnAI20 4) are precipitated
out of the mainly silica "mother" glass to form a glass-ceramic of high optical quality. At
about the same time, efficient luminescence had been obtained from Ni-doped crystalline
14

materials with the spinel structure.2° Guided by these results, we ordered also a range of
glasses with - 60% silica and the remainder an equimolar mixture of Al20 3 and ZnO with
other minor constituents to aid the glass-forming process. Nickel and cobalt doped versions
of the glasses were obtained by diluting the ZnO content with small additions of either NiOor CoO. If a glass mixture, providing efficient IR emission, could be reproducibly fabricatedit should have been possible to prepare the material in fibre form and develop a tunable fibre
laser based on gas laser pumping or, in the ideal case, pumping by a diode laser. The broadabsorption bands of the Coll and Ni2+ ions would allow matching with one of the many
diode laser wavelengths currently available.
At this time also, we requested funding from the University Development Fund to purchase
a furnace and associated utensils (platinum crucibles, moulds, etc) to enable us to have more
control over the development of new materials and to speed up the process of fabrication and
characterisation. The principal investigator also spent a week in the University of Utrecht
(Holland) in May 1989 with the aim of (i) acquiring some expertise in glass fabrication, and
(ii) obtaining information and guidance on the best choice of furnace and utensils for the
purposes of our studies. He also visited the University of Lyon (France), which has an
ongoing research programme on luminescent material fabrication and characterisation. The
possibility of growing some glasses, and ceramics for our studies and the feasibility of
purchasing glass samples from this source, were explored while in Lyon. We also had useful
discussions on the most promising crystalline materials for our studies.
1.3 Initial results
Within the first year, a range of silicate, phosphate, and borate glasses as well as oxy-nitride
glasses and ceramics were acquired from various sources. Initially, the difficulty ofobtaining such samples prompted us to consider setting up glass fabrication facilities within
the department. During visits to the University of Utrecht and the Philips Laboratories in
Holland, several glasses were prepared and the techniques for glass fabrication were studied.
However, the results were generally disappointing and only very weak luminescence was
detected from these materials and even then not in all the samples. A range of oxy-nitrideglass/ceramics doped with Ni2+, Co+, and Cr3+ were obtained from the University of
Limerick (Ireland). These materials were made from one of the following mixtures, 5
(a) Y203 , A120 3, Si3N4 , AIN, SiOl, YN.(b) MgO, A120 3, Si3N4, AIN, SiO 2, Mg3N2IDepending on the composition and heat treatment, various crystalline phases may be
1l- 15

precipitated in the ceramic. In type (a) YAG is a common crystalline constituent while in
type (b) the main crystallisation products are forsterite, MgSiO3, and MgAl20 4 (spinel).
Four different samples were obtained for each dopant ion. Here the results were more
encouraging as almost all the samples showed some luminescence in the 0.8 -. 1.8 rm
spectral region. Some representative spectra are shown in Fig 2.1. A particularly strong
band, centred at - 1.55 lm, was observed in all the materials - even in the nominally
undoped samples of each batch. It does not occur in samples deliberately doped with Nd.
At this point, plans to fabricate glasses in-house were postponed and it was decided to
concentrate on glass-ceramics for the future as these seem to offer more likely hosts. We
ordered a further set of such materials from the facility in the University of Limerick. These
were based on silicate glass ceramics (from a melt containing A120 3, SiO2, and ZnO) in
which the crystalline phase, doped with cobalt or nickel, was expected to have the gahnite
spinel structure. This was suggested by the success achieved by GTE Labs-" in obtaining
high-quality Cr-doped ceramics for luminescent applications based on this mixture.
Although we have examined more than 30 different glass compositions, we have not
observed any strong luminescence features in these materials that we could definitely ascribe
to emission to the dopant TM ions. The strong emission band observed in many of the
oxy-nitride glasses at 1.5 um is not associated with the TMI dopant and may be due to
contamination of the starting materials by rare earth elements.
Some fluoride glasses doped with Ni and Co ions were obtained from La Verre Fluorein Rennes (France) and these samples provided the best luminescence signals obtained to date
from glasses. We are hoping to pursue this avenue and obtain long fluoride glass fibres
doped with these ions and explore the possibility of obtaining amplification over the long path
lengths involved. We suggest that any future investigations on glassy host materials should
be confined to fluoride glasses.
16

SiAIONGlass0. 1% NiO
Gain x 5
32K
Ceramic 290K
SiAlON13lass /%
0.1% Cr2 03
32K
Ceramic
0.6 0.8 1.0 1. . .6
WAVELENGTH (Pm)
Fig. 2.1 Selected luminescence spectra of oxynitride glasses and ceramics.
I1i .....
S.. . ... . ,_ _. -- . .... . .. . . .. . . _ - . . . . .

CHAPTER 3
Co-DOPED MEDIA
3.1 Introduction
The stimulus for this project was the encouraging preliminary results52 - obtained
with LiGa5 8O doped with Ni2+ and Co2+. Encouraged by the AFOSR support, we continued
our investigation of the basic spectroscopy of these materials. Since our earlier studies, we
acquired a sensitive Ge detector which allowed us to look at all the Co2+ emission bands
with the same detector. (In our previous experiments, three different detector systems were
used to record the various emission bands). The complete room temperature spectrum
recorded with the Ge detector is shown in Fig 3.1. Although the emission is dominated by
the highest energy band, this system is important and interesting in that it provides several
broad transitions in the near IR which could be used to obtain tunable laser action in this
region. Pumping with an argon ion laser in a configuration similar to that used for
Ti:sapphire may be feasible. However, the quality of our materials, flux grown samples
from the Bell Labs (1965), was poor - showing non-uniform blue coloration. Very beautiful
samples obtained from Stanford University were found to be colored only on the surface.
In the meantime, we investigated our own samples in more detail via FLN studies of the
4 sharp zero-phonon line at 650 nm at low temperature. An unusually large ground state
splitting of - 30 cm-1 was observed which we ascribed to the low symmetry at the Co+
site and the small 4A 2 - 4T2 separation, as well as significant inhomogeneous broadening
which masked the splitting in the non-narrowed emission spectrum. The latter is probablydue to lattice strain and charge compensation effects. This work was reported at the
Dynamical Processes in Solids Conference (Atlanta, GA) and was published in J.
Luminescence. (Appendix 1). A more detailed analysis of the spectroscopy of this material,
including ODMR-MCD studies by co-workers in the University of Lehigh, was subsequently
carried out in order to fully characterise this interesting material. A complete report,
including a detailed theoretical analysis of the crystal field levels of the Co+ ion in this
material and identification of the nature of the impurity environment, was published recently
in Physical Review (Appendix 2). Meanwhile, we searched for new Co-doped materials and
our results are gathered in the following sections.
3.2 Opticai spectroscopy of MgNb2 O(:Co2 +
3.2.1 Crystal Structure of the Host Material : Magnesium Niobate has the same structureas the mineral columbite (Nb 2(Fe,Mn)O'9. Columbite has a tetra-molecular orthorhombic
cell of the dimensions a,-14.238A, b.-5.730A and co-5.082A. It's spwce group is
18

C4
0 02
o .2
7-C5
(.119
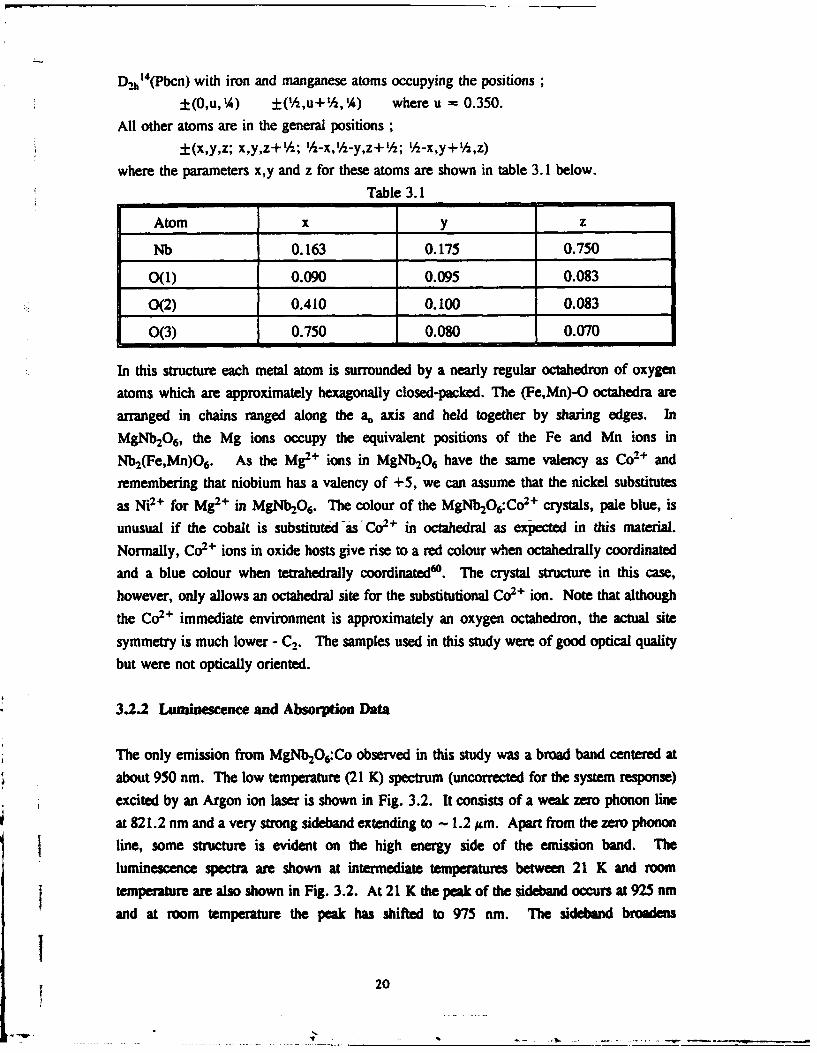
D•' 4(Pbcn) with iron and manganese atoms occupying the positions;
±(0,u, 'A) (1/2,u+1/1, 'A) where u = 0.350.
All other atoms are in the general positions
±(x,y,z; x,y,z+'/z; 'h-x,'h-y,z+/; '/-x,y+½/,z)
where the parameters x,y and z for these atoms are shown in table 3.1 below.
Table 3.1Atom x y z
Nb 0.163 0.175 0.750
0(1) 0.090 0.095 0.083
0(2) 0.410 0.100 0.083
0(3) 0.750 0.080 0.070
In this structure each metal atom is surrounded by a nearly regular octahedron of oxygen
atoms which are approximately hexagonally closed-packed. The (Fe,Mn)-O octahedra are
arranged in chains ranged along the ak axis and held together by sharing edges. In
MgNb2O6, the Mg ions occupy the equivalent positions of the Fe and Mn ions in
Nb2(Fe,Mn)0 6. As the Mg2+ ions in MgNb 20 6 have the same valency as Co2 + and
remembering that niobium has a valency of +5, we can assume that the nickel substitutes
as Ni2+ for Mg2+ in MgNb2O6. The colour of the MgNb2O 6 :Co2 + crystals, pale blue, is
unusual if the cobalt is substituted-as-Co2+ in octahedral as expected in this material.
Normally, Co2+ ions in oxide hosts give rise to a red colour when octahedrally coordinated
and a blue colour when tetrahedrally coordinatede. The crystal structure in this case,
however, only allows an octahedral site for the substitutional Co+ ion. Note that although
the Co2+ immediate environment is approximately an oxygen octahedron, the actual site
symmetry is much lower - C2. The samples used in this study were of good optical quality
but were not optically oriented.
3.2.2 Luninescence and Absorption Data
The only emission from MgNb2O6:Co observed in this study was a broad band centered at
about 950 nm. The low temperature (21 K) spectrum (uncorrected for the system response)
excited by an Argon ion laser is shown in Fig. 3.2. It consists of a weak zero phonon line
at 821.2 nm and a very strong sideband extending to - 1.2 1m. Apart from the zero phonon
line, some structure is evident on the high energy side of the emission band. The
luminescence spectra are shown at intermediate temperatures between 21 K and room
temperature are also shown in Fig. 3.2. At 21 K the peak of the sideband occurs at 925 nm
and at room temperature the peak has shifted to 975 nm. The sideband broadens
2

E-44 E-4 -4 -
adC
17U
Ln 0 0
~ OT)
C.'4
o4 E
C484
rii
Y --

considerably and extends beyond 1.3 Am at room temperature. The integrated intensity of
the emission as a function of temperature is shown in Fig. 3.3. As can be seen from the
figure, the intensity remains relatively constant up to 160 K and then falls off rapidly. This
fall off in intensity is attributed to an increase in the non-radiative decay rate at higher
temperatures.
The absorption spectrum for MgNb2O6:Co at 85 K is shown in Fig. 3.4. The spectrum is
very similar to that observed for Co2+ in octahedral sites in other oxide hosts&', and based
on the assignments in these references, we assign the 6500 cm"' and 13500 cm" absorption
bands of MgNb2O6:Co to the 4TeF) -- 4T2 (F) and 4TeF) -- 2(4 F) transitions,
respectively, of octahedrally coordinated Co2+. We attribute the 18000 cm-1 absorption to
the 4T 1(4F)-*4T(4P) transition. By solving the secular determinants for the lowest crystal
field levels of this system, we obtain expressions" for these level energies in terms of the
crystal field parameter Dq and Racah parameter B. A best fit to these energies is obtained
for the following values : Dq = 727 cm-n and B = 800 cm- ; Dq/B = 0.9 (see Fig. 2.3)
In most Co24 doped materials luminescence occurs from the first excited state 4T2(4F)
to the 4A2(4F) ground state only3".W. Thus in MgNb2O6:Co2" we would expect the4T2(4F)-.4'T(4F) emission to occur around 1.8 Am (6500 cm-'). We were unable to
investigate this region of the spectrum with the detectors available. We assign the observed
emission at -1 m to the 4 A2 (eF)-'4TI(4 F) transition. The resulting energy level scheme
showing both absorption and luminescence transitions is shown as an inset in Fig. 3.2.
3.2.3 Lifetime Measurements and Discussion.
The decay time of the observed infra-red luminescence band was measured as a function
of temperature between 30 K and 320 K. At low temperature (31 K) the decay time was
found to be 4.48 As. This very short decay time is consistent with our assignment of the
luminescence to the spin-allowed 4A,-*_T transition. As the Co2 + ion site lacks inversion
symmetry, the transition is also parity-allowed. Fig. 3.3 shows how the observed decay time
varies as the temperature is increased. The decay time remains almost constant up to 200
K, and then decreases rapidly. Since the temperature dependencies of the integrated intensity
and of the decay time are very similar, we attribute the fall off in the observed decay time
, with increasing temperature to the growth of non-radiative decay processes. The observed
decay rate W is given by W-Wr+W, where W, is the radiative decay ratc and W., the
non-radiative decay rate. We assume that the contribution from vibronic processes to the
emission is negligible so that Wr is independent of temperature. For the analysis which
follows we also assume the energy level positions do not vary with temperaure.
22

1~000
00
00
0
0 0N0
C44 4)
bp)
0
o23

21.
i 1.8
1.7
1.6
1.5
1.4 -i- 1.3
Z 1.2z
am 1.14 1
z 0.90 0.8 -4 F (4•) ._.T2(4•)
-o 0.7 60
4 0.5
0.4
0.3 -T, 1p)_"&2 1•'
0.2
0.1 -
0.1
4 6 8 10 12 14 16 18 20 22 24(ThwsandS)
IAVELE• IA(WV•UWIS)
Fig. 3.4 The absorption spectum for MgNb2O6Co at 85K. The arrow indicatesa discontinuity which results from a change of detector.
' 24
1i ?
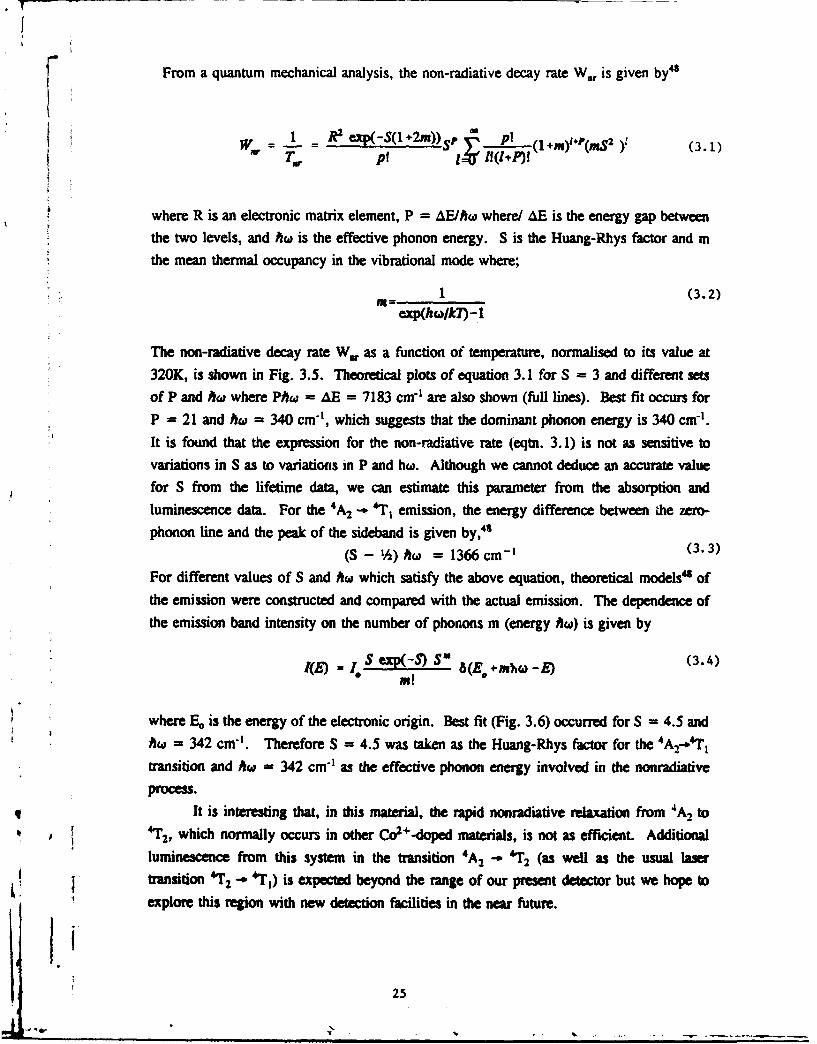
F From a quantum mechanical analysis, the non-radiative decay rate W., is given by4
- 1 R1 ex ( S l . 2 ) y P l (I +m )'(mS2 )Y (3.1)
where R is an electronic matrix element, P = AE/hw where/ AE is the energy gap between
the two levels, and hw, is the effective phonon energy. S is the Huang-Rhys factor and m
"the mean thermal occupancy in the vibrational mode where;
1 (3.2)exp(hcu/kl) -1
The non-radiative decay rate W1, as a function of temperature, normalised to its value at
320K, is shown in Fig. 3.5. Theoretical plots of equation 3.1 for S = 3 and different sets
of P and bw where Phc = AE = 7183 cm"' are also shown (full lines). Best fit occurs for
P = 21 and hw = 340 cm'1, which suggests that the dominant phonon energy is 340 cmnf.
It is found that the expression for the non-radiative rate (eqtn. 3. 1) is not as sensitive tovariations in S as to variations in P and hw. Although we cannot deduce an accurate value
for S from the lifetime data, we can estimate this parameter from the absorption and
luminescence data. For the 4A 2 - '4T, emission, the energy difference between the zero-
phonon line and the peak of the sideband is given by,"S
(S - /2) hct = 1366 cm- (3.3)
For different values of S and hw which satisfy the above equation, theoretical models" of
the emission were constructed and compared with the actual emission. The dependence of
the emission band intensity on the number of phonons m (energy At) is given by
S Sep(-S) S (E*+m)-E) (3.4)
where E, is the energy of the electronic origin. Best fit (Fig. 3.6) occurred for S 4.5 and
hw = 342 cm-'. Therefore S = 4.5 was taken as the Huang-Rhys factor for the 4A,-I'T,
transition and hc - 342 cm"1 as the effective phonon energy involved in the nonradiative
process.. It is interesting that, in this material, the rapid nonradiative relaxation from 4A2 to
S'4T 2, which normally occurs in other Co2+-doped materials, is not as efficient. Additionalluminescence from this system in the transition 4A2 -0 4T2 (as weil as the usual laser
transition 4T 2 -, 4T1 ) is expected beyond the range of our present detector but we hope to
explore this region with new detection facilities in the near future.
25

0.8
0.7
0.6
0.5
00.4
P"14 fie-SOOc•l
0.2
P"16 fi,,4S30=71
0.1 - / - A,,340cm'l
P"18 fiu-4OOcmu' P-21 -/"S.u250cm-1
o n P•290 ' V7'1 *1 I I 1 '1I1 I i
20 60 100 140 180 220 260 300
Fig. 3.5. The non-radiative rate (normalised at 320 K) as a function
of temperature for MgNb2 O6 :Co2 +. The full lines are the theoretical
plots of eqtn. 3.1, for S = 3 and for different values of P and hc
26

4
o2
H
E-4
E--
0 2 4(Thouains)
SHIFT from NO-PHONON LINE (cm"')
Mig. 3.6. Best fit between the observed emission and eqtn. 3.4
occurred for Ace = 342 cm-I and S = 4.5. Individual points indicate
a plot of eqtn. 3.4 for discrete values of m.
27

3.3 Luminescence from tetrahedral Co2' ion in MgAI2O4
Our previous studies of the luminescence properties of tetrahedrally coordinated
Co02 (d7) ion in LiGaOs was one of the reasons for embarking on this project and we
searched for other materials in which the Co"' ion occupied a tetrahedral site. A similar
luminescence pattern was found in MgA120 4:Co2'. Absorption bands in this material at
7200, 17000 and 21000 cm"1 are assigned to transitions from the 4A2 (4F) ground state to the4Ti (4F), 4T, (OP) and 2T (2OP) excited states of tetrahedrally coordinated Co+, respectively.
The crystal field parameters Dq-400 cm"', B=730 cm" and C =3500 cm-1 are estimated for
a Co+ ion a site of pure Td symmetry. Saturation of Co2+ absorption at 540 nm was
measured and the peak absorption cross section for the 4A 2 (4F) -- 4T, P) transition was
estimated to be 4 x 10-"19 cm2. The broad luminescence bands observed in the visible at 660
"nm and in the near infrared at 880 nm and 1290 nm are assigned to transitions from the4T,(4 p) excited level to the lower lying 4A20), 4T2eF) and 4T&F) levels, respectively. Thelow-temperature spectrum is shown in Fig. 3.7. In contrast to LiGa5Os, however, the
luminescence intensity falls rapidly with increasing temperature and, at room temperature,
the luminescence quantum yield was estimated to be less than 1%. The luminescence decay
was shown to be non-exponential and dependent on the temperature and the concentration of
Co2+ ions, providing evidence that luminescence quenching is due to both intra-ionic
nonradiative decay processes and energy transfer. No spectroscopic evidence for
octahedrally coordinated Co2+ has been observed. This work will be reported at the
International Conference on Luminescence (Storrs, Ct., USA) 1993.
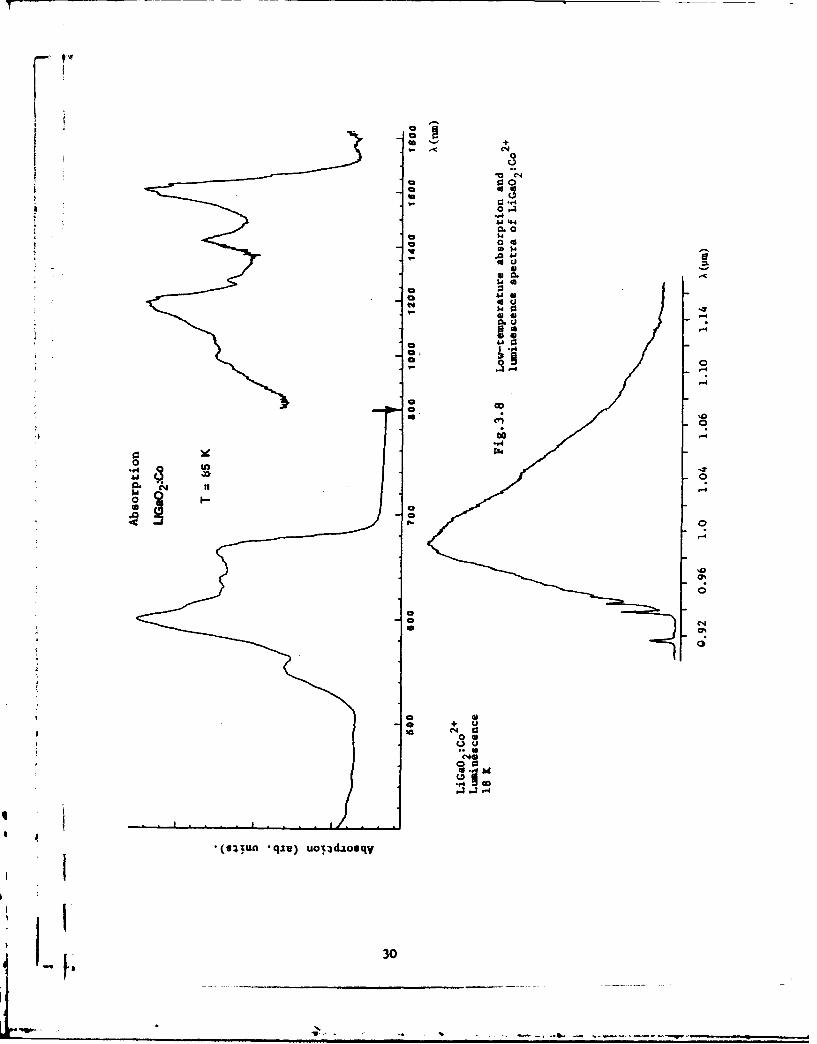
3.4 LiGaO%:Co2 +
LiGaO2 can crystallise in two stable phases. In the a-phase, the Co2+ ions,
substituting for Ga3+ ions, are octahedrally coordinated ; in the A-phase, the Co coordination
is tetrahedral. High quality samples of this material were obtained from the University of
Georgia. It is not possible to distinguish the crystal phase on the basis of the optical
absorption spectrum, shown in Fig. 3.8, although it is very similar to that observed in
LigaOs, in which the Co2+ site is tetrahedral. However, the luminescence does not fit in
with this assignment. It is possible that some cobalt enters as Co+ or that some small
Sregions of a-phase are present, which would allow octahedrally-coordinated Co+. Very
weak emission is observed at low temperature (Fig. 3.8) but we hope to explore beyond 1.8
,um in this material also. With the new detection facilities, we plan to re-examine other
,Co-doped materials which we studied in our preliminary survey in year 1.
.I28
'V _ _-.*.

f'0
'-4
-t
-4
4,4,00U
'0
0U4,0o
.04,
'5 *�
4,
00 4,
*1
�00 '54, '.44, )4
4,UU
'5U4,* 0.
-4 4,
0U4,
$
U
4,
4,
-4
144,
'4a0
�1
0'0
(s3Jun *qz,) k�;wu. 3 u1
29
4
0
a~ 000 WE
oo1
0 CE
Eu
gOD
;or
10
4i 0
30

"3.5 Luminescence spectra of La3Ga.SiO1 4:Co2 +
These samples, yellow in colour, were obtained from A. Kaminskii (Academy of
Sciences, Moscow). Laser action has been obtained in a broad band around I jtm in the
Cr3+ version of this material. The low-temperature luminescence spectrum of the Co+-
doped system is shown in Fig. 3.7. It consists of at least two bands which resemble the
higher energy bands in LiGasOs and MgAI20 4 (Figs. 3.1, 3.7). The lifetime of this
luminescence is - 2.1 its, which suggests that the Co2+ occupies a tetrahedral site.
3.6. Conclusion.Although the MgF 2:Co2 + laser is the only commercial laser system based on Co or
Ni ions, attempts to repeat this success in other media have not been successful. As in the
*, case of Ni+ doping, excited state absorption processes and nonradiative relaxation
mechanisms are the main obstacles to laser action at room temperature. Operation at longer
wavelengths, however, may be possible if efficient luminescence from the excited state
occurs (as in MgNb2O0 or if luminescence from the 4T1 ('P) state can be obtained without
thermal quenching (as in LiGaO 8). The importance of ESA in these materials at room
temperature has yet to be carefufly evaluated.
3I1
'F 31

CHAPTER 4
Ni-DOPED MEDIA
4.1 Introduction
The spectroscopy of the Ni ion incorporated as an impurity in various host materials has been
well studied.16"9.SI Investigations of Ni+ in MgO, MgF2, KMgF3,5' and in fluoro-
zirconate glass" show that luminescence in the visible (green and red) and infrared is
observed from the Ni2+ ions in these materials. Referring to the schematic energy-level
diagram shown in Fig. 4.1, which is typical of the Ni+ ion in oxide and fluoride crystals,
the strongest absorption transitions in the Ni ion are 3A2 -- 3Te(3P) (blue), 3A2 --
3T&F)
(red) and 3A2 -- 3T2 in the near infrared. The visible emission originates in transitions from
IT2 to two lower levels (3 T2 , 3A2) and the infrared emission is from the lowest excited state
S(32) to the ground state 3A2 . In all these materials the fluorescence lifetime and quantum
efficiency fall off rapidly with increasing temperature due an increase in the non-radiative
multi-phonon relaxation rate, which competes with the radiative decay process.
In more recent work on various chloride hosts", additional transitions from 'T 2 to the lower
levels 1E and 3T1 have been reported. It is possible that these transitions also take place in
many oxides but have not been reported because, in the oxides, they can occur in about the
same wavelength regions as the main transitions mentioned above. The relative weakness
of the 'E - IT transition compared to the 3 T2.- T and 3T1 .- 'T7transitionsisquite
puzzling, since it seems to defy the spin selection rule. In absorption, the three "spin-
forbidden' transitions, 3A2., 3T2g, 3T2g, are of approximately equal dipole strengths, while
the "spin-allowed" 'E. -- IT2g transition is considerably weaker. The same basic analysis
applies for the Ni2+ :CsMgCI3 emission spectrum (although here the 'Es *- IT2. transition
is somewhat stronger than in Ni2+ :CsCdCI3), and, in the emission spectra of Ni2 +:CdC12
and Ni2+:MgCI2, and tEs,.- 1T2s emission cannot be distinguished at all.29 Although it is
almost certain that both the 1T74 and the IE states have considerable mixed spin character(both are close to triplet states) it is difficult to rationalize the apparent reversal of spin
selection rules solely on this basis. Absorption transitions in this system, for example,
adhere quite well to the spin selection rule, with spin-forbidden transitions being
approximately an order of magnitude weaker than those which are spin-allowed. In this
chapter, we present results on two Ni-doped oade in which the crystal field is closer to that
which occurs in fluorides and chlorides and in which additional transitions from IT2 are also
3

ILiGaO s:Ni 2 + MgO:Ni 2 + MgF7:Ni 2 +
3T 1 ( 3 P)
25. 3 T 1 ( 3 P) 3 T 1 ( 3 P)
'T
20
3 T 1 (3 F)1
S15 - (T1(3 F)E-o 1 3 T 1 ( 3 F)
I-E
01
0 10- 3 T2
3 T
5
3A2 3AZ 3AZ
2+Fig. 4 .1. Energy-level diagrams for NIi in (a) LiGa 5O8 ,
(b) MV0, and (c) MgF2. The luminescence transitions
are shown by vertical lines.
I
---- 33
V ____

7In contrast to this trend, there is only one luminescence transition in Ni2 -doped LiGa 5Os,
a spinel-type crystal in which Ni2+ replaces Ga3 + on octahedral sites.52 This is the 3T2 --3A, transition indicated in Fig. 4.1, which consists of a broad band centered at 1.3 j&m.
Furthermore, the lifetime of the Ni2+ luminescence remains effectively constant from 15 Kto above room temperature, with a decay time of 650 js. As the temperature is raised above
about 350 K, we observe a decrease in the intensity and a corresponding decrease in lifetime.
The theoretical formula for the non-radiative decay rate, based on the single configurational
coordinate model, provides a quantitatively correct explanation for the temperature variation
of the lifetime52 and is strong evidence for a high luminescence quantum efficiency. Thismaterial is interesting in that (i) all the emission occurs in the near infrared, and (ii) the
emission has a high quantum efficiency at room temperature. Our samples were flux-grown,showed non-uniform green coloration, and were of poor optical quality. With good quality
samples, we felt that tunable laser operation in the region of 1.3 jm should be possible.
Using the laser-heated-pedestal growth technique, better quality samples of this material havebeen grown and unsuccessful attempts were made to obtain laser action in this system, using
a diode laser operating at 904 nm. We subsequently requested better quality flux-grownsamples of this material, but it is quite difficult to grow. However, the material LiAJ5Os
doped with Ni2+ is much easier to grow. Samples of this material have been obtainedrecently and preliminary measurements show that it also has only one luminescence band.
Similar behaviour was found in ZnA120 4:Ni2+. These results will be presented in later
sections of this chapter.
4. 2 The Optical Spectroscopy of MgNb2O6:Ni.
The crystals of MgNb2O6:Ni obtained for the present study were growth by the flame
fusion (Verneuil) method. They were straw coloured and of poor optical quality. The
particular sample used for most measurements had one polished front surface and was not
oriented. An additional face, through which the excitation beam entered, was cut andpolished perpendicular to the existing polished surface. The sample measured approximately
1.5mm X 1.5mm X 0.5mm. The crystal structure has been described in chapter 3.
The infra red luminescence spectrum for MgNb2O6:Ni at 22K is shown in Fig.4.2. This
spectrum is corrected for the response of the Ge detector and spectrometer. It consists of
three main bands at 900 nm, 1.2utm and 1.7 Am. Fig.4.3 shows all three bands in more
detail. The 900 nm band in this figure was taken using an S-I photomultiplier. It consists
of a zero-phonon line at 7704 A (12981 cm-n) with a sideband extending to 1.1 Atm. The
higher energy side of the sideband shows some structure. The 1.21&m band consists of a no-
phonon line at 11688 A (8556 cm-') with a well structured sideband extending to 1.27p&m.
The 1.7pam emission is the most intense of the infra red bands. The zeorOhonon line is at
34i~i-

, 26
3 3
24 - T 1 (3P)
20-
22 -T216
20
-12 "3 3
16i -8
33
M 2
14 14 Z
< 4u'-2
az 0 1'
z
6
4
2
0*
0.7 0.9 1.1 13 1.5 1.7
VALVRBM Celca'm)
Fig. 4.2. The infrared luminescence bands of MgNb2O6:Ni2+. The energy
level diagram shown in the inset was derived from the absorption and
j luminescence data.
35r ________________
m.. m mmm m~m mm mmm m m mmm - ---

26
a4
120
e
6. 1i 4 10.0,14.0 14 .G 1-.0
04
S12
t~
04-
.S
1 1. 11.2 "16.4 16. 16.6 17t 17. 17.4 17. 17.t 16
m.S
0.2-
0.50
3.3.
a.4
!11
Ji, 36
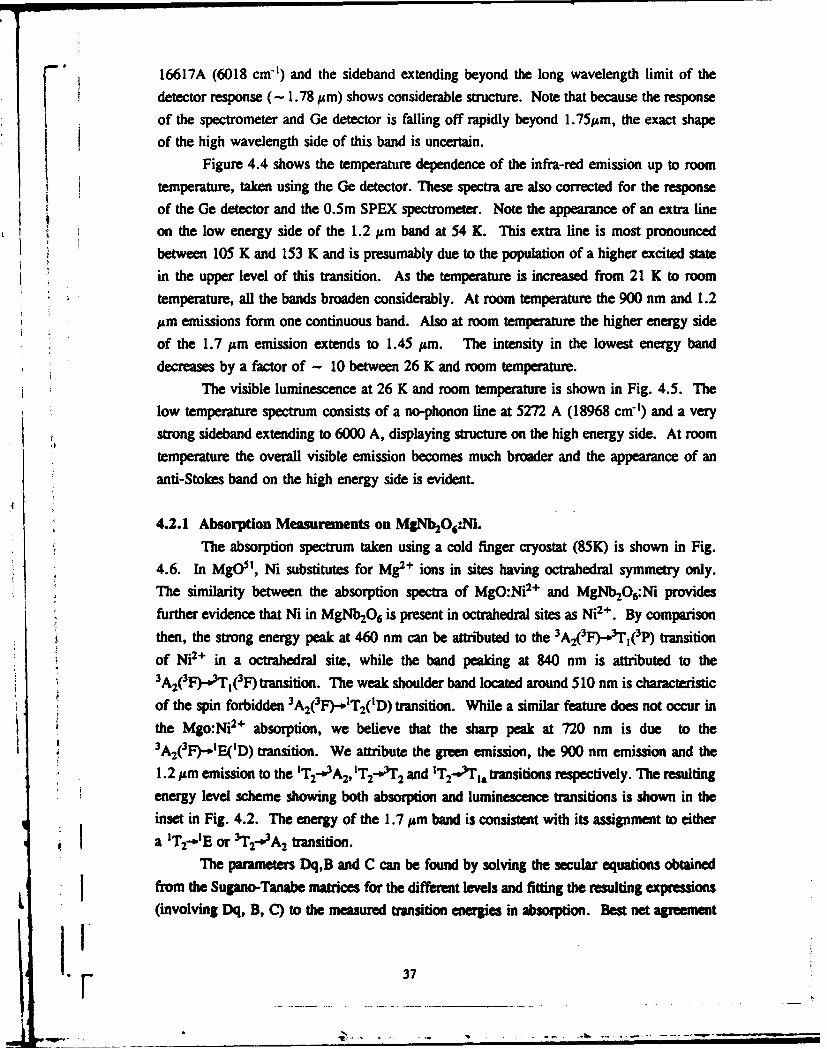
16617A (6018 cm") and the sideband extending beyond the long wavelength limit of the
detector response (- 1.78 ,m) shows considerable structure. Note that because the response
of the spectrometer and Ge detector is falling off rapidly beyond 1.75&m, the exact shape
of the high wavelength side of this band is uncertain.
Figure 4.4 shows the temperature dependence of the infra-red emission up to room
temperature, taken using the Ge detector. These spectra are also corrected for the response
of the Ge detector and the 0.5m SPEX spectrometer. Note the appearance of an extra line
on the low energy side of the 1.2 ;tm band at 54 K. This extra line is most pronounced
between 105 K and 153 K and is presumably due to the population of a higher excited state
in the upper level of this transition. As the temperature is increased from 21 K to room
temperature, all the bands broaden considerably. At room temperature the 900 nm and 1.2
;&m emissions form one continuous band. Also at room temperature the higher energy side
of the 1.7 urn emission extends to 1.45 ;&m. The intensity in the lowest energy band
decreases by a factor of - 10 between 26 K and room temperature.
The visible luminescence at 26 K and room temperature is shown in Fig. 4.5. The
low temperature spectrum consists of a no-phonon line at 5272 A (18968 cm"') and a very
strong sideband extending to 6000 A, displaying structure on the high energy side. At room
temperature the overall visible emission becomes much broader and the appearance of an
anti-Stokes band on the high energy side is evident.
4.2.1 Absorption Measurements on MgNb2O6:Ni.
The absorption spectrum taken using a cold finger cryostat (85K) is shown in Fig.
4.6. In MgOal, Ni substitutes for Mg2e ions in sites having octrahedral symmetry only.
The similarity between the absorption spectra of MgO:Ni2+ and MgNb2O6:Ni provides
further evidence that Ni in MgNb2O6 is present in octrahedral sites as Ni2 +. By comparison
then, the strong energy peak at 460 nm can be attributed to the 3 A2(3F)-.IrT( 3P) transition
of Ni2+ in a octrahedral site, while the band peaking at 840 nm is attributed to the3A2 (3F)-r3T1 (3F) transition. The weak shoulder band located around 510 nm is characteristic
of the spin forbidden 3A2 (3F)-.iT2('D) transition. While a similar feature does not occur in
the Mgo:Ni2+ absorption, we believe that the sharp peak at 720 nm is due to the3A2 (3F)-iE('D) transition. We attribute the green emission, the 900 nm emission and the
1.2 Am emission to the IT2-,3A 2,1T2-,3"T 2 and IT2-,,Tl. transitions respectively. The resultingenergy level scheme showing both absorption and luminescence transitions is shown in the
inset in Fig. 4.2. The energy of the 1.7 ism band is consistent with its assignment to either
a IT2 -IE or 3T 2.-•A 2 transition.The parameters Dq,B and C can be found by solving the secular equations obtained
from the Sugano-Tanabe matrices for the different levels and fitting the resulting expressions(involving Dq, B, C) to the measured transition energies in absorption. Best net agreement
[- 37

I44O
00
IMI38 0

seems to occur for Dq = 721 cm-', B = 823 cml and C = 3704 cm"1. Therefore, C/B =
4.50 and Dq/B-0.88. The Sugano-Tanabe diagram for the case of Ni2+(d) with C/B =
4.50 is shown in Fig. 4.7. The vertical line at Dq/B=0.88 indicates values for the energy
levels calculated for MgNb,0 6:Nri2 .
4.2.2 Lifetime Studies.
Attempts were made to measure the luminescence decay times for the green, 900 nm, and
1.2 pm emissions at low temperatures, initially using the EG&G multichannel scaler which
had a minimum bin width of 2 As. It was not possible to measure the decay time of 1.7/pm
band as it occurred outside the wavelength regime of the S-1 or S-20 photomultiplier tubes.
The large instrument time constant (- 1.2 ms) of the Ge detector made it unsuitable for
measuring lifetimes. Initial lifetime measurement efforts indicated that the low temperature
lifetimes of all three measurable bands were < 6 ps. Using an acousto-optic modulator to
chop the exciting beam, the lifetime of the green emission was found to be < 60 ns at 18K.
As we were approaching the limit of our apparatus, only an approximate value could be
determined. The measured value is very short compared to the estimated lifetimes of the
green emissions in MgO:Ni2+, KZnF 3 and MgF2 of 48 As, 580 As and 400 As, respectively.
Although the Ni2 + site lacks inversion symmetry so that transitions are parity allowed, thetransitions are spin forbidden, which makes the estimated low temperature lifetime for the
green emission even more puzzling. The room temperature lifetime was too short to be
measured. The fact that the three emissions have lifetimes < < 6 js, and seem to have the
same lifetime, is consistent with our energy level assignments that all three transitionsoriginate from the IT2 level.
4.2.3. Phase Sensitive Detection and Selective Excitation using a Ti-Sapphire Laser.
Phase sensitive detection techniques can be used to separate out overlapping luminescence
components which have different decay times. It was found that by chopping the Ar+ laser
excitation beam at 1kHz and by nulling out the 900 nm and 1.2 pm emissions, the 1.7 pm
band still remained but was reduced in intensity (see Fig. 4.8). This suggests that the 1.71m
band has a different lifetime time, and because the chopping frequency was 1 kHz, has a
* lifetime of the order of 1 ms. This also suggests that the assignment of the 1.7 pm emissionto the 3T2--3A2 transition is correct.I
It was found also that, by exciting the sample at 800 nm (12500 cm') (ie. below the 'T2
level) using a Ti-Sapphire laser, the 1.7 pm band was almost identical to that obtained using
argon laser excitation. The ratio of the two largest peaks (IA/Is), is reduced for Ti-sapphire
|- 39

Absorption 85K MgNb20 6 Ni
I I • .1 , * . i , , , ' . . .4 IJI,,
0.4 0.5 0.6 0.7 0.8 0.9 1.2 1.4Wavelength (Pm)
Fig.4.6. Low temperature absorption spectrum of MgNb 2 06 : NiNote change of wavelength scale at arrow.
T10 'T8 3Tl (3 p)
T I (F)
E
3 TfB2
IE
0 0.2 0.4 0.6 0.8 1 1.2 1.4 1.6 1.8 2
Dq/B
Fig. 4.7. The Sugano-Tanabe diagram for Mg~b 2O06 -N12 with C/B 4.50.
4
40

0.0009
0.0008
0.0003-C'
z
z0.0002-
I(b
'•0.0004
I-
w 0.000)z' I
-0.0002
I, -0.0001 "
4 6 8 10 12 14 18 AS
(T1UMWkSVAVW1rA)
Fig. 4.8 Phase sensitive detection spectra for the near IR emission of
MgNbýO,:Ni2 ÷ at 22 K. Spectrum (a) is nulled at 11694 A and spectrumj• (b) is its quadrature.
41

laser excitation. Again this supports the assignment of the 1.7 /m band to the 3T2-, 3A2
transition rather than the 'T,-IE transition. Using Ti-Sapphire excitation, the ratio of the
largest peak intensity to the second largest peak intensity of the 1.7 ;Lm emission was less
than for the case of Ar+ excitation. A possible explanation for this is that when excited into
the 'T 2 level using Ar+ excitation an additional luminescence component occurs in the 1.7,%m
band with a strong zero phonon line occurring at the same position as the zero-phonon line
of the 3T 2-. 'A2 emission and a very weak sideband, and this additional luminescence
component could be due to the 'T2-. 'E transition.
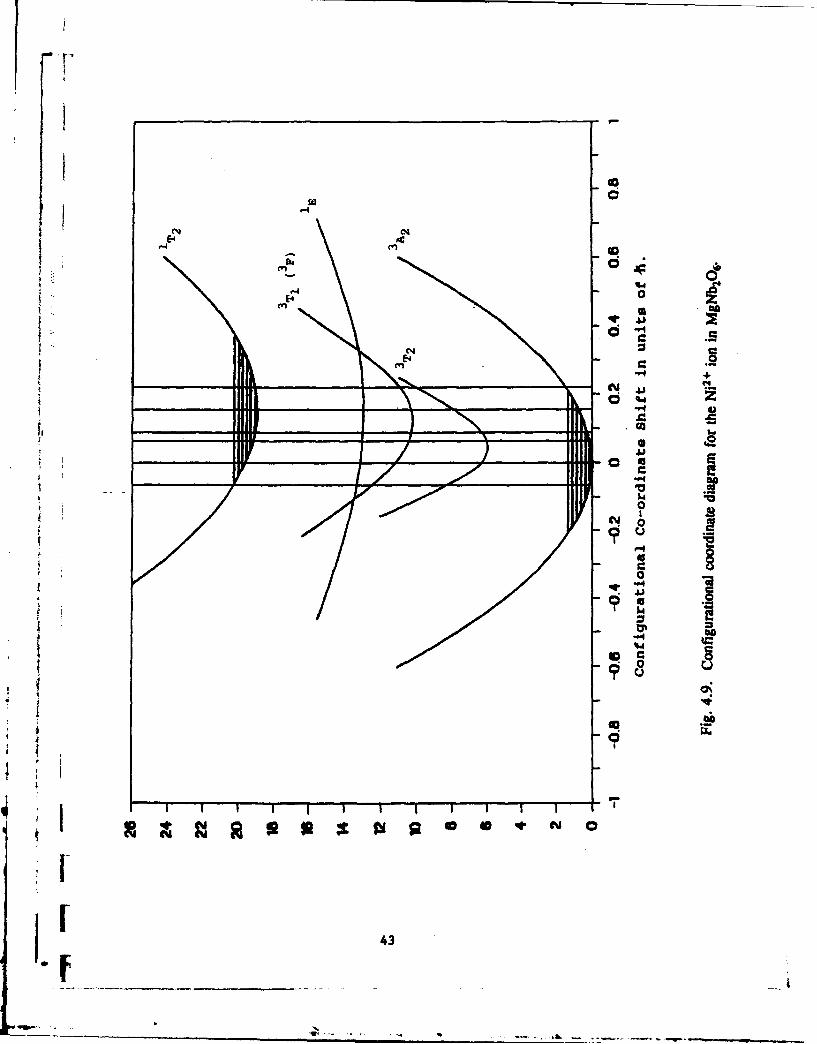
As in the case of the Co+ doped material, values for the Huang-Rhys parameters S and
configurational coordinate offsets AQ can be evaluated from the shapes of the various bands
in absorption and luminescence. The resulting single configurational co-ordinate diagram is
shown in Fig. 4.9.
4.3 Luminescence of NO+ centers in forsterite (Mg2SIO4).
Stimulated by the discovery of tunable infra-red laser emission from Cr-doped forsterite and
subsequent extensive studies of this material"6, we have studied other 3d-ion centers in
forsterite, such as Fe and Ni' 2 , which also emit IR luminescence. Here we present emission
and excitation spectra and lifetime measurements of Ni-doped (2% Ni) Mg2SiO 4 at various
temperatures down to 15 K.
In common with Ni2+ centers in some other oxide host crystals, we observe at least three
separate emission bands; two of these (Fig. 4.10) are in the infra-red and what appears to
be a composite band is observed in the visible (green). Below about 150 K, the dominant
emission is a band peaking at about 1.5/tm (6,700 cmz) with (at 15 K) a strong zero-phonon
line at 1.37 #m (7280 cm-f) and a lifetime of 1.2 ms. The phonon sideband shows somestructure and the Huang-Rhys factor is in the range 1.5 - 2.0. Excitation spectra of this band
(Fig. 4.11(a)), assigned to the 3" 2 -, 3A2 transition of Ni2 +, show considerable splitting of
the 3T2 level due to distortions from octahedral symmetry and indicate that the emission is
from the lowest split component. This emitting level is further split into three components
by spin-orbit interaction as shown by three zero-phonon features. Due to Bolztmann factors,
the two spin-orbit components at higher energy are only seen at low intensity in emission at
temperatures around 100 K. The emission is thermally quenched at about 150 K, as shown
Sin Fig. 4.11(b), which is a plot of the decay time of the emission against temperature. Onthe same plot is shown the variation of the emission intensity over the same temperature
range, which confirms the lifetime data. The other infra-red band at around 1000 am,
assigned to the transition 'T2 -. 3T2, is broad and featureless (even at low temperaM e), is
•r
9 E-;
'.r4
03
Q41
CY
43'

V
Mg2 SiO4 :Ni 2+
I Luminescence
116 K
I I
0.84 1.04 1.24 1.44 1-64WAVELENGTH (pjm)
Fig. 4. 10 Luminescenwcsetrum (at 116 K)of Mg2SiO4:Ni excited by an argon ion 1w.jCoreto for the sectral respone of the detector has not been included.
4
!4
1.1 _
__ __ _
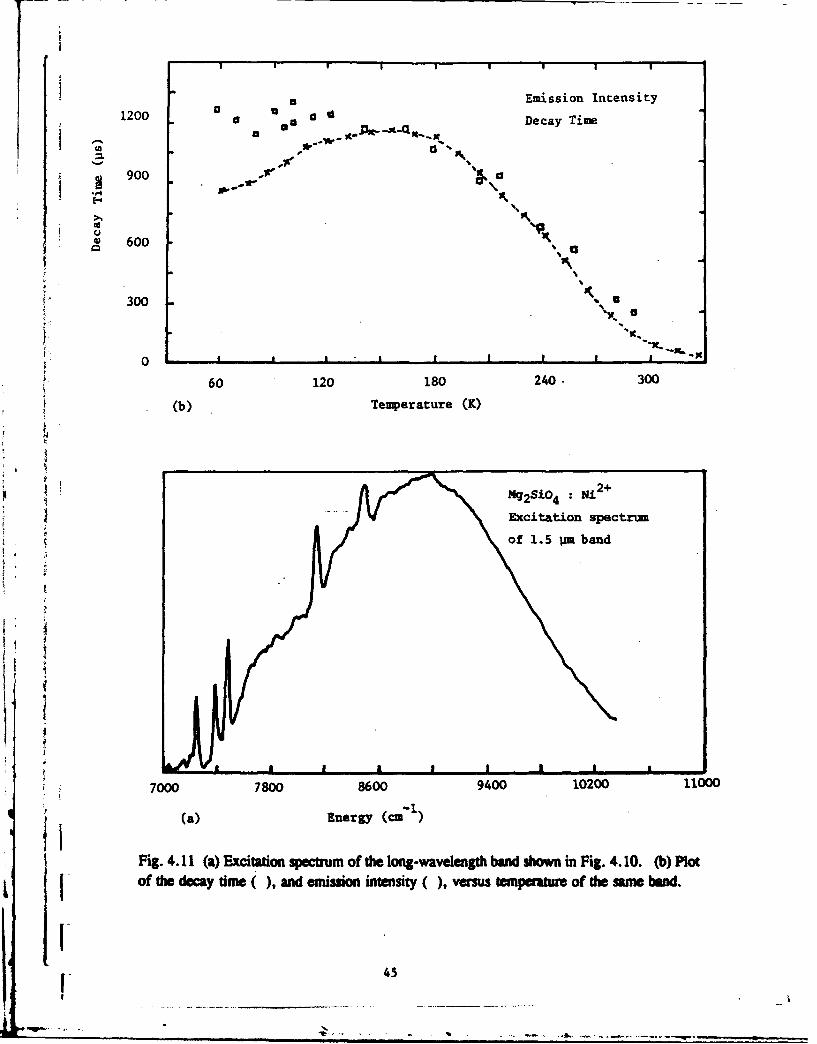
agEmission Intensity12000 am -it-Decay Time
900 i
E-4
600
*" 300
i- K
0
60 120 180 240. 300
* (b) Temperature (K)
S~M92SiO4 :Ni2
Excitation spectrum
of 1.5 jim band
7000 7800 8600 9400 10200 11000
(a) Energy (cm"1)
Fig. 4.11 (a) Excitation spectrum of the long-wavelength band shown in Fig. 4.10. (b) Plotof the decay time (), and emission intensity (), versus tempeature of the same band.
I

not temperature quenched to the same extent as the 1.4 Lm band, and is in fact the dominantband at room temperature. We are continuing our studies of this material. We have
requested samples of Co-doped forsterite for our survey but have not yet received deliveryof same. The visible emission, though comparatively weak, consists of two broad
components at low temperatures which may indicate that two emitting states are involved.
Although there are two possible metal cation sites which the NiO ions can occupy (both of
which are distorted octahedral sites), the data suggests that the Ni2' ions populate only one
of these sites and this is most probably the smaller (M1) site, in agreement with electronspin
resonance studies.6
4.4 Optical spectroscopy of ZnNb2 O6 :Nl3 +
The spectroscopic behaviour of this material is very similar to that observed for
MgNb2O6 except for slight shifts in the positions of the various absorption and luminescence
bands. The lifetime of the 'T2 state is again very short (- 100 ns), and the temperature
dependence of all the bands take the same form as in the MgNb2O6 samples. Somerepresentative spectra are shown in Fig. 4.12.
These materials are very interesting as they are the only oxides in which the crystal
field at the Ni2 + site is sufficiently small that the various transitions are clearly resolved.
j In this respect, their spectra are similar to those reported for several Ni2+-doped chloridesreported recently, except that the IT2 lifetime is mysteriously very short. The short lifetime
does explain, however, why the green emission band is still unquenched at room temperature
as the radiative rate is clearly comparable to, or faster than, the nonradiative rate in these
materials at room temperature. Unfortunately, the lowest-energy IR band, the maincandidate for laser action, is strongly temperature- teed in these materials.
4 4.5 ec of ZnA 4O4:N*O÷ and LUMOs.0 +Our results on these materials will be presented together because of their similar
behaviour. Both samples crystallize in the spinel structure and the Ni2+ ion occupies anapproximately octahedral site in each case. The actual site symmetry is trigonal in the zinc
aluminate; in the lithium spinel the Ni2+ the deviation from octahedral symmetry is moresevere due to rhombic component in the local field. Th ZnAI2O4 crystals were flux grown,pale green in colour, and of good optical quality. The LiAJ602 crystals were grown by the
laser heated pedestal technique at the University of Georgia (Athens,GA). Absorption and
luminescence spectra for these materials are shown in Figs. 4.13. These materials have
similar optical properties to LiGajO., in that the luminescence consists of only one band (rT2-3A)sand the lifetime of this emission changes very little from 20 K (340 ps for LiA)O0
j I- to 300 K (270 ps for LiAlsOO. This suggests that the quantum efficiency of diis systems isquite high, although we are not able to estimate this quantity directly. In contrast to
-46
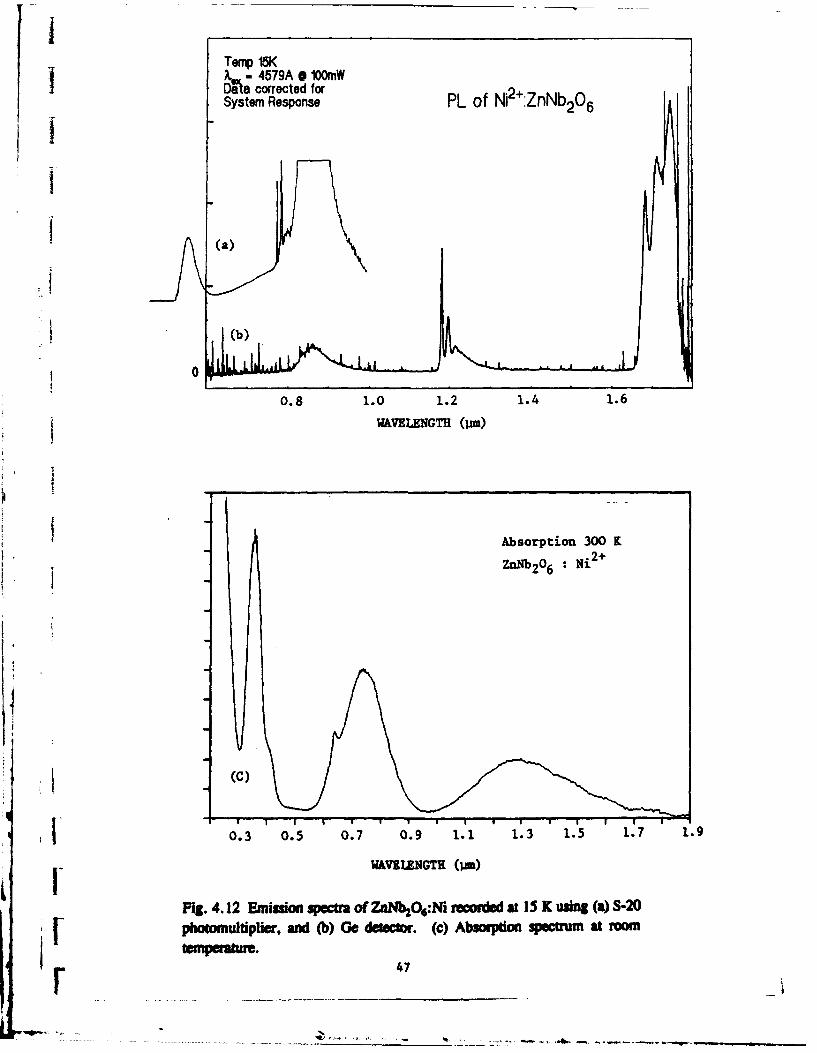
SI -4579A 100MWIDI corrected forSystem Response PL of Ni'+:ZnNb206II
(a)
0
0.8 1.0 1.2 1.4 1.6
WAVELENGTH ()IMn)
Absorption 300 K
ZnNb20 6 Ni
I (C)
t0.3 0.5 0.7 0.9 1.1 1.3 1.5 1.7 1.9
WAVELENGTH (usm)
Fig. 4.12 Emision sM of Zntb 2&O:Ni recored at 15 X using (a) S-20[• photomultiplier, and (b) Ge detector. (c) Ab=sorpton spectnr m at room
47
r,-- ~

11.
26KI LiAIsO8 Ni2 +
Cr
Cr
Roomn Temp,
.50 .75 too 1.25 .t5o 1.75
Wavelength (pm)
Room Temp
ZnA12 04 Ni 2 +
Cr
19K
1 .5 10o 1.5 2.0
S.41. Wavelength (pm)
Pig. 4.13. M 3T2 -3A2 band in emission reorded at low tempatumr- and at room temperature for (a) UAISOS:Ni2+ and (b) ZnA1204:Ni+
"1 48

ILiGasOs, both materials show a sharp zero-phonon line and significant structure in the broad
accompanying sideband. (In both materials, there are some additional sharp features which
can be definitely assigned to luminescence from trace amounts of Cr3+ impurities). The
j crucial question, the answer to which will decide the usefulness of these matcoals as laser
media, is whether excited state absorption is a limiting factor. Although we are not equipped
J to answer this question, we are attempting (in collaboration colleagues in the University of
Georgia and in the Bell labs) to obtain samples of such quality that such measurements can
be made. Our initial interest was in LiGa5O,, but it is difficult to grow good quality samples
of this material because of the volatility of the gallium oxide. The aluminate was much
easier to grow and the sample whose spectra are presented here was a product of our
I program to obtain better samples. There is a general trend, however, that ESA is less likely
to be a problem the greater the crystal filed at the Ni2 site. If this is so, then LiAl5 O,
shows definite promise as a potential tunable laser medium in the future. We propose to
carry out a more detailed analysis of this material to assess the likelihood of ESA before
I embarking on a major growth program.
4.6. Conclusion
The data presented in this chapter emphasises that our understanding of the
spectroscopy of the Ni2' ion in solid hosts is still incomplete. There are wide variations in
the characteristics (lifetime, relaxation mechanisms, etc.) of the luminescence, even among
materials with very similar structures. It is clearly worthwhile to study these materials in
greater depth in order to deepen our understanding of the interaction of transition metal ions
with crystalline host materials. While some of the materials described in this chapter show
promise as tunable solid-state media, excited state absorption measurements must be carried
out to characterise these materials more completely.
I49

CHAPTER 5
Cr-DOPED MEDIA.
5.1 Introduction.The development of the alexandrite laser system64, based on the spin allowed 4T2 -
4A2 transition on the Cr'+ ion in BeAlO 4, has led to a search for analogous Cr-dopedcrystalline materials in which the 2E and 4T2 levels are sufficiently close to allow significantpopulation of the latter at room temperature. These studies have led to other laser materialssuch as GSGG:Cz3+ and ZnWO4:Cr3+, which are pumped (using either flashlamps or otherlasers) in the strong absorption bands of the Cr3+ ion. In this chapter, we present opticalmeasurements of the crystalline material BiGaO3:Cr3+ and LaSr 2Ga 11O:•:Cr 3+ which showmany of the properties required for a laser medium. In the former, the existence of energytransfer from the Bi3+ ions to the Cr3+ ions allows the possibility of more efficient excitationby broadband sources. A large amount of research has also being devoted recently to thestudy of Cr4+ systems, since the assignment of the laser transition of Cr-doped forsterite tothe lowest energy transition (3T2 -_ 3AI) of the Cr4+ ion in a tetrahedral site. In this chapter,we describe also the results of our measurements on several materials in which Cr (as Cr4+)is substituted on tetrahedral sites.
5.2 Optical Spectroscopy of BIGaO 3
The samples of BiGaO3 used in this study were flux-grown in the Bell Labs. Theundoped samples were pale yellow ; the Cr-doped samples were a light green colour. Whenexamined in a polarising microscope, the samples were found to be uniaxial and to have amultidomain structure. Many oxide materials with the general formula AB03 adopt theperovskite structure (Fig. 5.1), or some distortion of this structure. For example, BiFeO3 hasbeen reported to have a structure derived from perovskite by a rhombohedral distortion."Because of the similarity in the ionic radii of Fe3+ and Ga3+ we expect the structure of thismaterial to be a good guide to the likely structure of BiGaO3.
Raman scattering experiments were carried out on BiGaO3 in an attempt to determinethe space group for this structure. At 80 K, 23 Raman modes were observed ; at roomtemperature only 16 definite modes were identified. Due to the multidomain nature of thesamples, it was not possible to determine the symmetry of the observed Raman modes.
I From the Raman data, BiGaO 3 cannot have a structure like that of the low temperature formof s•riO3 (D,4b) since this would result in 5 Raman modes. The structure of PrAl% (R3C)
S [- has only 8 Raman modes. The space group (R3C) for BiFeO3 results in 13 Raman-allowedmodes. As these 13 Raman modes are also IR active, each mode will be split into a doubly-
I-5- - *.5

t • • A -ion
S B- ion
0 ion
Fig. 5.1(a). Cubic ABO3 perovskite structure
'/,,
o Bi ion
. Fe ion
1 0 0 ion
IFig. 5.1(a). Distorted perovskite structure of BiFeO3 -
L
! 51

degenerate transverse optic (TO) mode and a non-degenerate longitudinal optic (LO) mode,i.e. 26 Raman-allowed modes altogether. The observation of 23 Raman modes in BiGaO3
is consistent with a space group assignment of R3C for this structure.In the rhombohedrally-distorted perovskite structure of BiFeO3, the Fe3+ ions are
displaced from the centre of the FeO6 octahedra and the oxygen octahedra are rotated abouttheir three-fold axes (Fig. 5.1 (b)). This material is both piezoelectric and ferroelectric. Its
space group is the same as that of LiNbO3 , whose useful nonlinear properties have led to itsoptical properties being studied in some detail." Above a certain temperature the B ions (inthis case Nb) return to the centre of the oxygen octahedral which, however, are still rotated
slightly about their threefold axes. Thus above 1490 K the LiNbO3 crystal is again centro-
symmetric.
5.2.1 Luminescence
The luminescence from Cr03 impurities in BiGaO3 was observed over the temperaturerange 10 - 550 K and spectra recorded at 10 K, 80 K and room temperature are presentedhere in Fig. 5.2. At 10 K the luminescence consists of a single sharp line at 14124 cm-t and
a weak relatively featureless sideband extending to - 13500 car'. The intensity of thissharp line relative to that at the peak of the sideband is - 8.5. This line at 14124 cm7I has
a half width of - 12 cm-I at 10 K and there is a marked asymmetry in the shape on the lowenergy side. At 80 K this sharp line has shifted to 14119 car', its half-width is - 15 cnr-
and the asymmetry in the line shape is still in evidence. A second sharp line has begun toappear at 14286 cm-' and the sideband structure shows very little difference from that
observed at 10 K. The spectrum changes considerably between 80 K and room temperature,the feature B at 14286 cm-' growing in intensity relative to the line A at 14119 cm'. Both
lines broaden considerably and shift to lower energy with increasing temperature. In the
room temperature spectrum the two lines, A and B, and the sideband are all sitting on a
broad band extending from - 14800 cmrI to - 11800 cmul with a peak at - 13400 cm'1.From the temperature dependence of the intensity ratio In/IA, it was clear that A and B are
the R-lines, corresponding to the 2E - 4A2 transition. The large R-line splitting indicates that
the luminescence originates on Cr3+ ions in sites with a large low-symmetry crystal field.
When compared with other systems containing Cr? ions in distorted octahedral sites,the half-width of the R, line at low temperatures is very large. (cf. the half width of the R,
line in A 20 : Cr3+ at low temperatures - 0.5 cm with - 12 cm"' in BiGaO3 : Cr3'.)The large half-width may be related to the asymmetry in the R, line-shape. It was noted also
that the position of the R-line shifted by - 55 cnr' between 10 - 300 K. Such line shiftsin the luminescence from impurity ions in crystals can usually be explained by taking into
account the coupling of the ions to the lattice vibrations.
"52
,'FS,'+ ' • • . . .. ,.. .+

LU"
CL.i-
0r--
00
r -4 4
0LI
CO)
LLI
U2
Cy)
t 53

LAU
Q wLLU ,
U),
C:0 0-n
I-
0
+
LA) W--
LUL
w
0-
CD, UJ'ULA's
(ALA
C11
54
..... .. ...

IAbove room temperature, the broad band grows in intensity relative to the R-lines (Fig. 5.3)
until, at 550 K, these lines have almost disappeared. The appearance of such broad
luminescence bands with increasing temperature in many of d3 systems is attributed to 4 T2"A2 luminescence. Only a very small population is necessary in the 4'T, level for the 'T 24 A2 transition to be observed in luminescence. The ratio of the populations of the 4T2 and
2E states in such a system is 3 exp(-A/kT) where A is the energy difference between the zero
vibrational levels. Thus, the observed luminescence from BiGaO3:Cr3+ is due to the small
value of A since the broadband emission dominates the spectrum at temperatures < 500 K.
The radiative lifetime on the R, line at 10 K was measured to be - 200 s. (Similarshort lifetimes are observed in GSGG, due to mixing of the 2E and 4T2 levels' 7). At room
temperature the lifetime was too short to be measured by the multichannel analyser. The
decay rate observed at low temperatures indicates an electric dipole process. If the 2E -, 'A 2
transition is occurring via an electric dipole process then the environment of the chromium
ion in the crystal must lack inversion symmetry. This conclusion is in agreement with the
suggested space group R3C for the structure since the gallium ions would be shifted off
centre with respect to the surrounding oxygen octahedral in this space group. The very short
lifetime observed at room temperature can be explained by the presence of the spin-allowed
4T2 broad luminescence band at this temperature.The excitation spectrum of chromium in BiGaO3 was recorded at 77 K and was used
to obtain the energies of the absorption bands in this material. Using the Sugano-Tanabe
energy matrices for a d3 system, values were estimated for the parameters, B, C and Dq
which would fit the theoretically predicted energy levels to the excitation spectrum. The best
fit was obtained for Dq = 1570 cm-1, B = 660 cm'1 and C = 3100 ciW1. The value of Dq
obtained for BiGaO3:Cr3+ is considerably smaller than the values reported for MgAI 20 4 and
A1203. However, it is larger than that reported for LiNbO3. This is consistent with the
suggested interpretation of the observed luminescence; in LibO3, the smaller value of Dq
results in the 'T2 being the lowest excited state and the observed luminescence consists of a
broad band."9
Since the zero-phonon line of the 4T2 band was not observed in excitation, no accurate
estimate of A, the energy difference between the ground vibrational levels of the 'T 2 and 2E
states, could be made. However, from the excitation spectrum, we estimate that it should
be - 350 cm-1 at 77 K. This '172 level is expected to shift downward with increasing
temperature. In ruby the shift has been estimated to be - 1.4 kT. If we assume that the
magnitude of the shift will be similar in this case then the variation of the 4T2 - 2E energy
difference as a function of temperature may be expressed as
AM - A((0)- 1.4 kT
and, on this basis, we would expect the 4T2 level to begin to overlap the 2E level at a
temperature of - 380K. However, the 2E level is also moving to lower energy' and has
55-S . - -

IIIII
BiGaO3
Host luminescence
I S~300 K
S77K
21000 19000 17000 15000 13000
Energy (c-1)
I Fig. 5.4. Broadband luminescence, excited by an argon laser, of the
BiGaO3 crystal.
t56
| 56

LaSr 2 Ga1 1 0202 : Cr3
Luminescence
/ 300 K
168 K
77 K
ZlT I
680 760 840 920 1000 1.080
Wavelength (rim)
Fig. 5.5. Luminescence spectra of LaSr2GallO20 Cr adifen tmeate.
1'7
/5

overlapping R-lines. Phase resolved luminescence spectra have been used to resolve partially
the emission from the two sites. The decrease in the lifetime with increasing temperature
is probably due to changes in the 2E, 41T2 mixing rather than a reduction in fluorescence
efficiency.
5.4 Mg2SiO4:Cr
Forsterite (Mg2SiO4), like alexandrite, is a member of the olivine family, with an
orthorhombic crystal structure. When doped with Cr ions, it can support laser action over
a limited spectral range around 1.2 1&m. 71,7 However, there was some controversy
concerning both •'• Cr valence state, the sites occupied by the Cr ion in this material, andthe possibility of lawx pumping by transfer from Cr3+ to Cr4+ ions. For this reason, we
investigated the spectroscopy of this material doped with various levels of chromium. The
complete luminescence spectrum, which is quite sensitive to the wavelength and the
polarisadion of the excitation71 is shown in Fig. 5.6. At low temperatures, it consists of
several sharp features at around 700 nm, some broad bands at about 800 nm and 1000 nm,
and further sharp features at 1100 nm. The latter broaden with increasing temperature (seeFig. 5.7) and develop into the lasing band at room temperature. The sharp line emission in
the 700 nm region corresponds to the 2E -, 4A 2 transition on Cr3+ ions which replace Mg2+
ions in distinct octahedral sites, one with inversion symmetry (Ml) and one with mirror
symmetry (M2), as well as a perturbed MI site, possibly arising from charge compensation.
Cr3+ ions in such sites have distinct ground splittings, measured using E.P.R.,73 which areresolved in the R, emission at low temperature and which clearly identify the Cr3+ site. The
energy-level strcture for the Cr3+ ions is similar to that in alexandrite [1] and with
"increasing temperature the higher-lying 4T2 level becomes populated so that emission fromthis level dominates the spectrum at room temperature (Fig. 5.7). The lifetime varies from
8.9 ms at low temperature to 340 •s at room temperature and can be fitted to a purely
radiative model for the emission. The variation of the lifetime can be fitted to theS1 f, 3f . P{ -AI/H)
1.3ezp(-I: + 3 eqp(-A/k7)
with values of 114 s-' and 10' s" for the radiative rates fT, from the 2E and 4T2 levels,
respectively, and 450 cm-1 for the energy separation a between 2E and 4T2 . We find no
evidence for any energy transfer from Cr3+ ions to the IR lasing centre, which was suggestedby other workers, 7" or for any nonradiative component in the emission from these ions up
to room temperature. The spectroscopy of the Cr3+ emission is described in more detail intwo publications in Appendices 3,4. In an attempt to understand the host material more
fully, we investigated Fe-doped forsterite also. Details of our results are contained in a
58

0
0I 0
04 oj
A i010
048
cIa
I low0 C°Joo - i..'
0~$ 44.
, U.
4-15
o .", 6
:W .4
1,4
04.
595

00~ In 4m'9.-~C LO( C4A
* a4
,1n44
1*41
14
-41"ua
UNI
pr
600
VIPa

publication in Appendix 5.
Despite its high efficiency, this system is prevented from lasing due to absorption by another
center (now generally accepted to be in tetrahedra Si sie', which is the basis for
the demonstrated laser action in this material in a band centred at 1.2 pm. (The latter may
be pumped almost anywhere in the visible and even at 1.06 pm). The energy level diagram
for Cr4+ in a tetahedral site is similar to that for Ni2+ in an octahedral site (see Fig. 1.3)
and the lasing emission has been tentatively assigned to a transition from the lowest crystal-
field split component of the 3T2 state to the 3A2 ground state in this system.n The structured
low-temperature spectrum shown in Fig. 5.6 becomes a broad band at room temperature and
it peaks at different wavelengths around 1.1 pm depending on the excitation wavelength and
on the Cr concentration (Fig. 5.8). Emission in this wavelength region, and the measmuedlifetime of 2.5 gs at room temperature, is difficult to reconcile with the known
properties of Cr3+ ions in oxide crystals. The identification of the lasing centre in this
material remains an interesting problem for further study. We note that similar laser action,
with a tuning range of more than 300 nm and extending to beyond 1.2 pm in some cases,
has recently been reported by Kaminskii74 in a range of Cr-doped oxide crystals. If indeed
these results are due to Cr4+ then this ion may prove to be a worthwhile laser centre in its
own right which can extend the range beyond that of Cr3+ in the infrared and new crystal
hosts were sought which can stabilise this oxidation state. Some of the results are described
in the next section.
5.5 Spectrscoplc measurements of Cr4+-doped media.
Although laser action in Cr-doped forsterite and YAG crystals is attributed to Cr4 +
in a distorted tetrahedral site, a number of other materials with Cr4+ in tetrahedral sites have
not exhibited stimulated emission at room temperature. 75 This may be due to low quantum
efficiency in these media resulting from intraionic nonradiative decay processes and energy
transfer to traps. To address this problem (in collaboration with the University of Belarus,
Minsk) we have investigated the spectroscopic properties of different hosts containing Cr4+
; ions in tetrahedral sites, namely Y2SiOS (YSO), Gd2SiOs (GSO), and Ca3(VO42 (CVO). Asshown in Fig. 5.9, the broadband luminescence from these materials at low temperatur wasin the 1.1-1.7 prm region with peaks at about 1.25, 1.32, and 1.17 pm in YSO, GSO, and
CVO, respectively, and was assigned to 3T2 -. 3 A2 transitions on C 4+ ions in etrahedral
sites (see Fig. 1.3). At least two types of the near infrared emitting centers were observed
in YSO. The dominant strong absorption bands with peaks at about 16700 and 14000 cm',weak absorption at about 1000 ci"' and broad emission band with peak at 1250 nm are
assigned to transitions on Cr04 ions, substituting for the Si in distored teahedrna sites. The
temperat/u dependence of two zer-phonon lines observed at 1148.7 nm and 1144.3 nm
61
Y - . - - -,-- - -

Ii
f Mg2SiO4 :Cr
290K...-- 0D13o/0I
*X" "" - 0.027%.. 0.085 o/a
f *
. I.
: \
- :; i II
0.8 1.0 1.2 1.4
wavelength (p~m)
I Figure 5.8. The near-infrared emission band in chremiuvr-doped forsterite fordifferent concentrations of chromium excited by an argon-ion laserat 290 K (all lines). Tunable laser operation has been obtained
S~over about 75 um centred on 1.2 Uam (12).
I 62

'0(00
&- 400
00
000
>- 0
In
0 0
(si~un l~su'IL
Ci) 63

indicated the 33.5 cm" splitting in excited state of this centers. Fluorescence decay time
excited by 578 nm pumping varied from 11.5 sm at 77 K to 0.9 is at 300 K. A decreasing
of emission intensity was observed with increasing temperature, providing evidence for
strong non-radiative processes. Another type of emitting center in YSO had weak absorption
bands at about 20500 and 13000 cm-1 and fluorescence band with peak at about 1.2 jm. The
emission lifetime at 77 K was found to be 5.2 •is and extremely strong temperature
quenching of the fluorescence was observed for this center.A broad near infrared emission band peaking at 1.32 ;Lm was observed in GSO with
a lifetime of 1.7 ,s at 77 K. At room temperature the fluorescence intensity and lifetime was
two orders of magnitude smaller than that at 77 K. The emission lifetime at lowtemperatures was shorter than that observed in forsterite and varied from 11.5 jusin YSO to
"1.8 ps in GSO. The temperature dependence of the emission lifetime and of the integrated
intensity (Fig. 5.10) were measured for these materials over a range of Cr?+ doping levels.The results indicated that intraionic nonradiative relaxation processes are strongly affecting
the emission from the 3 T2 excited state of tetrahedral Cr+ at room temperature.
In all of these materials, the integrated intensity in the emission band decreased bya factor of 15-20 on warming up to room temperature. The spectroscopy of Cr4+-dopedmaterials is still very poorly understood and much work remains to be done if this potentiallaser center is to be fully exploited.
5.6 Conclusion
Since interest was renewed in Cr-doped media by the achievement of laser action in
alexandrite, and subsequently forsterite, many new Cr-doped media have been reported (seeTable 1.1) and Cr4 + has been recognised as a new lasing ion. The results of our
measurements on materials doped with either Cr3+ and Cr4 + ions (or both) have been
reported in this chapter. Although many materials, containing Cr4+ ions in tetrahedral sites,
have recently been explored, none have been found which a quantum efficiency at roomtemperature comparable to that obtained in forsterite. Interest in Cr3+-doped materials has
decreased since the commercialisation of the Ti:sapphire laser system.
I6
S64- ., -b .. _ _ _ _

0 ED
0 4.0
20
44444440
0 0 0
00 0
-,4
65+

CONCLUSION.
Although there are very few commercial laser systems based on TMI-doped materials,
the data presented in this report suggests that many possible dopant-host combinations remain
to be explored. Some novel behaviour for TM! in various host materials has been discoveredin this study, e.g. emission from higher excited state in MgNb 2O6:Co 2+, energy transfer
from host material in BiGaO3:Cr3+, and anomalous lifetime of the 'T 2 state in
MgNb2O6:Ni2 + and ZnNb2 O6:Ni2+. The luminescence behaviour of the latter systems isvery similar to that of several Ni-doped chlorides reported recently. In CsCdCI3:Ni2+,
evidence is presented for a nonradiative pathway from the IT 2 state direct to the ground state.Such processes are difficult to detect since they can only be observed easily when two
emitting levels are connected by radiative and/or nonradiative transitions, a situation whichrarely occurs for TM! centers. Thus very little is known about the nonradiative branching
ratios involved in multiphonon relaxation from higher excited states. It is possible that
multiphonon relaxation pathways which do not follow a "cascade" route of successive stepsbetween adjacent levels are much more common in TM! systems, although very difficult to
detect. MgNb2O6:Ni2 + is an important material since it allows more detailed investigation
of the excited state dynamics of such systems. This material also shows an unusually strong
and sharp absorption from the ground state into the IE level. The reason for this effect mayshed some light on the nature of the singlet- triplet mixing in Ni-doped materials. Both
LiAI5 ,0 and ZnAl20 4 doiped with Ni2+ show potential as tunable laser media, although ESA
studies have yet to confirm this possibility.
This study has not uncovered an alternative to MgF2:Co2+, the only Co-doped
commercial laser system, although some new possibilities based mainly on tetrahedrally-coordinated Co2 ions and emission from higher excited states of octahedrally-coordinated
systems have been explored. ESA and nonradiative relaxation effects are major potential
drawbacks in all Co-doped materials but careful trawling of new materials may be a source
of new laser media.
The growth of Cr-doped crystals has taken a new direction in recent years with the
realisation that Cr?' is also a lasing ion and with the identification and growth of crystalline
hosts which can accept this ion in tetrahedral sites. The search continues also for new Cr3+-doped media with high quantum efficiency in the 'T2 -_ 4A 2 transition at room temperature.
Much work remains to be done to understand (i) why forsterite is the only host in which
Cr4+ emits with significant quantum efficiency at room temperature, (ii) the unusual
temperature dependence of the emission lifetime in this material, (iii) why Cr enters this host
as Cr4+ in tetrahedral sites. Our studies of other Cr-doped silicates may provide answers to
some of these questions.
66

- The possibility of obtaining laser action in glasses doped with TMI was explored
briefly, without success, early in the project. The most encouraging results were obtained
with fluoride glasses doped with Co and Ni. Given the preference for randomly connected
tetrahedral complexes in silicate glasses, and the ease with which Cr has been incorporated
in tetrahedral sites in various crystalline silicates, it may yet be posvible to fabricate glasses
doped with Cr4+ ions which would have suitable properties for IR lasers. The potential of
constructing fibre amplifiers in the 1.3- 1.5 Itm region is an attractive possibility.
* : 6
I-.
I*
: 67

REFERENCES
1. B. Struve, G. Huber, I.A. Scherbakov, E.V. Zharikov, Appli Phys. B 30, 117
(1983).
2 J. Drube, B. Struve, G. Huber, Qpt. Comm. 50, 45 (1984).
3. S.T. Lai, M.L. Shand. L.A.P. 54, 5642 (1983)4. J. Buchert, A. Katz, R.R. Alfano. IEEE J.L 19, 1477 (1983)
5. V. Petricevic, S.K. Gayen, R.R. Alfano, K. Yamagishi, H. Anzai, Y. Yamaguchi.
S IAbsyL•Le.dl 52, 1040 (1988).
6. K. Peterman, G. Huber, LJ.Lmin. 31/32, 71 (1984)
7. B. Viana, A.M. Lejus, B. Vivien, V. Poncon, G. Boulon. J.Sol. State Chem. 71, 77
(1987).8. C. Marco de Lucas, F. Rodriguez, J.M. dance, M.Moreno, and A. Tressaud, L
Lumin. 48/49, 553 (1991)
9. S.T. Lai, B.H.T. Chai, M. Long, M.D. Shinn. JULLQLL 24, 1922 (1988).
10. U. Brauch, U.Durr, _QpLJL9, 441 (1984)
11. S.A. Payne, L.L. Chase, H.W. Newkirk, L.K. Smith, W.F. Krupke. IEELQLL24 (11), 2243 (1988).
12. L.J. Andrews, A. Lempicki, B.C. McCollum, J.C. Giunta, R.H. Bartram, J.F.
Dolan. Phys.Rev. B34, 2735 (1986).
13. R. Knockenmuss, Ch. Rever, M.V. Rajasekharn, H.U. Gudel. J. Chem. Phys 85,
4280 (1986).
14. S.A. Payne, L.L. Chase, W.F. Krupke. JChm.by& 86 3455 (1987)
15. P.F. Moulton, A. Mooradian. AMl. Phys. Lett. 35, 838 (979)
16. L.F. Johnson, H.J. Guggenheim, B. Bahnck, A.M. Johnson. QPLe.L 8, 371 (1983)
17. M.V. Iverson, W.A. Sibley, J. Lumin. 20, 311 (1979).
18. R. Moncorge, T. Benyattou. Phys. Rev. B37, 9186 (1988) and refs. therein.
19. P.F. Moulton. EJ.jQI 18, 1185 (1982)
20. T. Benyattou, R. Moncorge, J.M. Breteau, F. Auzel. Cryst. La. Def. and Amorph.
LaLt 15, 157 (1987).
21. R. Moncorge, T. Benyattou, D. Vivien, A.M. Lejus. J. Lumin. 35, 199 (1986)
22. R. Moncorge, J. Thery, D. Vivien, J. Lumin. 43, 167 (1989)
23. U. Oetiker, M.J. Riley, P.S. May and H.U. Gudel. Coord. Chem. Rev. 111, 125
(1991).
24. H. Manm, R. Moncorge, QO. L uant. Elect. 22, S219 (1990).
25. P.S. May and H.U. Gudel, Chem. lPvs. 164, 612 (1989).
J 26. R. Alcala, J. Gonzalez, B. Villacampa, P.J. Alonso, 1. Luhmi. 48/49, 569 (1991)
27. P.S. May ana i-.J. Gudel, L Limin. 46, 277 (1990).
68
-- .b

28. J. Koetke, G. Huber, and K. Petermann, J. Lumin., 48/49, 564 (1991).
29. P.S. May and H.U. Gudel, J. Chem, Phy 95, 6343 (1991).
30. P.F. Moulton, A B3(1), 125 (1986)
31 A. Sanchez, A.J. Strauss, R.L. Aggarwal, R.E. Fahey, IEELQ.L 24, 995 (1988)
and refs therein.
32. R. Moncorge, G. Boulon, D. Vivien, A.M. Lejus, R. Collongues, V. and K.
Djevahirdjian, R. Cagnard, IEEEJ,.QL 24, 1049 (1988)
33. U. Brauch, U.Durr, W. Knierim, and C. Shiller. TSSL conferen La Jolla Ca
(USA) June 1984. SdngCr.VdU 47, 20 (1985).
34. D. Welford and P.F. Moulton, QZ Le 13, 975 (1988)
35. W.Kuinzel, W.Knierim, and U. Dfirr, Qpt. Comm., 36, 383 (1981).
36. M.D. Sturge, Phys. Rem, B8, 6 (1973)
37. P.F. Moulton, IEEE J. Ouant. Elec, QE-21, 1582 (1986).
38. L.F. Johnson, H.J. Guggenheim, J.A.P. 38, 4837 (1967).
39. R. Moncorge, T. Benyattou. Phys. Rey. B37, 9177 (1988).
40. U. Brauch, U.Durr, QZ Comm, 55, 35 (1985).
41. W. Knierim, A. Honold, U. Brauch, U.Durr, J. Op. Soc. Am. B3, 119 (1986).
42. P.F. Moulton, Laser fcus. Aug. 1987, p.56.
43. Y. Tanabe, S. Sugano, H.Kamimura in Multiplets of transition Metal Ions in
Crysal ed. Acad. Press N.Y. (1970).
44. F. Auzel, Luminescence of Inorganic Solids, ed. B. Di Bartolo (Plenum Press, new
York) 1978.
45. R.M. Bartram, J.C. Charpie, L.J. Andrews, A. Lempicki. Phyl. Rey. B34, 2741
(1986) and refs therein.
46. R. Reisfeld and C.K. Jorgensen, in Handbook on the Physics and Chemistry of Rare
Earbt, edited by K.A. Gschneider and L. Eyring (Elsevier, New York, 1987) 9, p. 1 .
47. J.M.F. van Dijk and M.F.H. Schuurmans, J.Chem.P-I, 78, 5317 (1983).
48. B. Henderson and G.F. Imbusch, Optical Spectroscopy of Inor•anic Solids,
(Clarendon Press, Oxford, 1989).
49. S.A. Payne, Ph. Rey. B41, 6109 (1990).
50. S.M. Jacobsen and H.U. Gudel, J. Lumin, 43, 125 (1989).
51. W.E. Vehse, K.H. Lee, S.I.Yun and W.A.Sibley, . Lumin., 10, 149 (1975)
52. J.F. Donegan, F.J.Bergin, T.J. Glynn, G.F. Imbusch, J.P. Remeika, J.Lumin. 35,
57 (1986).
S53. Radiaionless Processes, Nato Advanced Study Institutes Series B-62; ed. B.
DiBartolo (Plenum, New York, 1979).
69

54. C.W. Struck, W.H. Fonger, LJ.aimin. 10, 1 (1975).
55. Y. Suzuki, W. A. Sibley, O.H. El Bayaumi, T. M. Roberts, and B. Bendon,
Phys. Rev. M, 4472 (1987).
56. L.J. Andrews et al, Report DOE/ER/04996-4, U.S. Department of Energy (1983).
57. S. Hampshire, R.A.L. Drew, K.H. Jack, Phys. Chem. Glasses 26, 182 (1985).
58. J.F. Donegan, F.J. Bergin, G.F. Imbusch, and J.P. Remeika, J. Lumin. 31/32, 378
(1984).59. R.J. Wyckoff, Crstal Structures Vol, I (Interscience, New York, 1965) p. 362.
60. Pappalardo, D.L. Wood, R.C. Linares, J.hem.PhyL 35, 2041 (1961)
61. W. Jia et al, Phys. Rev, B43, 5234 (1991).
62. G. walker and T.J. Glynn, J. Lumin. 54, 131 (1992) 131.
63. H. Rager, S. Hosaya, and G. Weiser, Phys. Chem. Minerals 15, 383 (1988).
64. J.C. Walling, O.G. Peterson, H.P. Jenssen, R.C.Morris, and E. Wayne O'Dell,
IEEE J. Quantum Electron. OE-16, 1302 (1980).
65. J.M. Moreau, C. Michel, R. Gerson, and W.J. James, J. Phys. Chem. Solids 32,
1315 (1971)
66. A.S. Barker, Jr. and R. Loudon, Phys. Rev, 158, 433 (1967)
67. S.M. Healy, C.J. Donnelly, T.J. Glynn, G.F. Imbusch and G.P. Morgan, J. Lumin.
44, 65 (1989).
68. A.M. Glass, I P 50, 1501 (1969)
69. C.J. Donnelly, S.M. Healy, T.J. Glynn, G.F. Imbusch, and G.P. Morgan, J. LLmin.
42, 119 (1988).
70. A.A. Kaminskii, Laser Crystals: their physics and pr rtes, Springer-verlag (1990).
71. Petricevic, S.G. Gayen, and R.R. Alfano, A0l. Phys. Left. 53, 2590
(1988) Also QMLMJ 14, 612 (1989).
72. H.R. Verdun, L.M. Thomas, D.M. Androuskas, T.McCollum and A. Pinto,
A l.Phys. Let.t 53, 2593 (1989).73. H. Rager, Phys. Chem. Minerals 1, 371 (1977).
74. A. Kaminskii, in Proc. International School on Excited States of Transition Elements
(Poland, 1988) World Scientific 669 (1988).
75. L.D. Merkle et al, O.Mat. 1 (1992) 91.
70
i

Appendix 1
Journal of Luminescence 45 (1990) 23-25 23North-Holland
FLN STUDY OF LiGa 5O8 :Co2 +
J.F. DONEGAN, T.J. GLYNN and G.F. IMBUSCH
Department of Physics. University College, Galway. Ireland
Absorption, luminescence, and lifetime measurements have been carried out on LiGasO :Co2
+. The emission consists ofthree broad bands, peaking at 675 nm, 950 nm, and 1.2 trm, which are assigned to spin-allowed transitions between the4T,(4P) state and lower crystal field levels of the Co
2 * ions in tetrahedral sites. The radiative decay rate. common to all theemission, is - 200 ns, even up to room temperature. FLN techniques were used to study the zero-phonon line of the visibletransition, which occurs at 15157 cm-1. These studies reveal fine structure in the inhomogeneously broadened line and aground-state splitting of - 20 cm-', indicating that the cobalt ions occupy rather distorted tetrahedral sites.
1. Introduetion tron beam microprobe measurements on one samplegave 0.5% for the dark blue core region of the sample
The Co2' ion has been studied as a dopant ion in and 0.12% in the pale blue outer edges [6].many host materials, in which it can occupy sites ofoctahedral symmetry, for example in MgF2 [I], or sitesof tetrahedral symmetry, for example in ZnO [2]. How- 2. Spectroscopic measurementsever, given a choice of sites this ion shows a strongpreference for the tetrahedral site [3.4]. LiGa5 Os con- By comparison with the absorption spectra fromtains both types of site but absorption, luminescence, dopant Co2+ ions in tetrahedral sites in other materialsand lifetime data [5] indicate that the cobalt substitutes [3.4] we have assigned the three main luminescencefor Ga3 + ions as Co2? and only in tetrahedral sites. We bands from this material - at 675 nm, 950 nm, and 1200find no spectroscopic evidence for cobalt ions in any nm - to transitions from the 4T1( 4P) level to 4A2( 4F),valence state in octahedral sites. The dopant cobalt 4T,( 4 F), and 4T( 4 F), respectively. A summary of theshows two zones of concentration in this material. Elec- relevant spectra is shown in fig. 1. The visible emission
LiGa 0 C 2 ÷
508' 20-15 K E (10
3cm-I)
2E
2 G- I 4T(4
p)
i
Excitation I M( F)
4F 4 4A2
L k•.inescence
650 850 1050 1250wavelength (nm)
Fig. I. Energy level structure along with excitation and luminescence spectra of Co2+ ions in tetrahedral sites in LiGaO1 at 15 K.0022-2313/90/$03.50 L Elsevier Science Publishers R.V.(North-Holland)
I !S

IF. Donegan etaL / FLN study ofLiGa5O8 :Co2 25
* nally, if the laser frequency coincides with transitions the excited state makes it unsuitable for flashlampfrom the two components of the ground state to the pumping, but suggests a potentially high gain in the
k lower level of the 4 T,( 4 P) state, situations illustrated in infrared depending on the branching ratio between thefig. 3(c) and (d), then we would expect to obtain a true various transitions. These data suggest that similar sys-FLN signal as we are resonantly exciting the lowest tems based on Co2 + ions in tetrahedral coordinationlevel of the excited state. The expected emission in this may find application as tunable solid-state laser mediacase is a pair of lines equally spaced from the exciting in the near infrared.laser frequency. Again referring to fig. 2 we observe thatthe emission shown in spectra (f) and (g) does in factconsist of a pair of sharp lines, which we interpret as Acknowledgementstransitions to the two components of the ground 4A 2 (4 F)state. The separation between the laser frequency and Research sponsored by the Air Force Office of Sci-one of these components gives the ground state splitting entific Research. Air Force Systems Command. USAF,which we measure to be approximately 20 cm-I in this under Grant Number AFOSR 88-0355. The US
case. The separation between the exciting laser and theSrather broad emission in spectrum (a) in fig. 2 should by Government is authorised to reproduce and distribute
4 4 reprints for Governmental purposes notwithstandinganalogy give the excited state splitting of the 4 Tj( 4P) any copyright notation thereon.level. This splitting is measured to be - 35 cm- 1. Some
of the sideband features also became much narrower -3 cm _ when the luminescence was excited by thelaser within the zero-phonon line. References
III L.F. Johnson. R.E. Dietz and H.J. Guggenheim, Appl.4. Conclusion Phys. Lett. 5 (1964) 21.
121 R. Pappalardo, D.L. Wood and R.C. Linares Jr., J. Chem.
FLN experiments show an amount of fine structure Phys. 35 (1961) 2041.
P in the inhomogeneously broadened 4 T,( 4 P)- 4A2 ( 4 F) [31 D.L. Wood and J.P. Remeika. J. Chem. Phys. 46 (1967)3595.
luminescence transition in LiGasO: Co2+ and reveal a 141 J. Ferguson, DL. Wood and L.C. Van Uitert. J. Chem.ground state splitting of approximately 20 cm 1. This is Phys. 511 969) 2904.
a large value for the 4A 2 (4 F) level, indicating that the 151 .F. Donegan5 F1 . Bergin. G.F. Imbusch and .P. Remeika,
distortion of the tetrahedral site is large, due perhaps to J. Lumin. 31 & 32 (1984) 278.local charge compensation effects. The short lifetime of 161 R.M. MacFarlane and J.C. Vial. Phys. Rev. B34 (1986) 1.
lIi
1I
!9 ........ .. .......... ... ... _ _

Appendix 2
PHYSICAL REVIEW B VOLUME 45, NUMBER 2 1 JANUARY 1992-11
Optical and magnetic-circular-dichroism-opticaily-detected-magnetic-resonance studyof the Co2+ ion in LiGa5Os
* J. F. DoneganDepartment of Experimental Physics, University College, Galway, Ireland;
Optronics Ireland Research Centre and Department of Pure and Applied Physics, Trinity College, Dublin 2, Ireland;and Sherman Fairchild Laboratory and Physics Department, Lehigh University, Bethlehem, Pennsylvania 18015
F. G. Anderson* Department of Experimental Physics, University College, Galway, Ireland
and Sherman Fairchild Laboratory and Physics Department, Lehigh University, Bethlehem, Pennsylvania 18015
F. J. Bergin, T. J. Glynn, and G. F. ImbuschDepartment of Experimental Physics, University College, Galway, Ireland
(Received 19 June 1991)
Optical and magnetic-circular-dichroism-optically-detected-magnetic-resonance studies have beencarried out on Co-doped LiGasOs. The Co ions are found to be predominantly in the 2+ charge stateand to substitute for tetrahedrally coordinated Ga3+ in the LiGa5Og lattice, in sites which are shown tohave C 3 point-group symmetry. The strong absorption bands from the ground state 4 A 2(4F) to the ex-cited states 4TO(4P) and 4TO(4F) are each split by the low-symmetry C3 field. A combination of the low-symmetry field and spin-orbit coupling is responsible for the ground-state splitting of 19.5±0.5 cm - ob-served by fluorescence line narrowing. Strong broadband luminescence is observed from the 4 T,(0P) lev-
'el to three lower levels, 4A 2 ('F), 4 T2 (4F), and 4 T,( 4F), with a lifetime that is constant at 200 ns from
10 K up to room temperature. The optically-detected magnetic-resonance studies show that the Co2+ions are in sites which have axial symmetry along ( 111 )-type axes of the unit cell, indicative of the C3symmetry present in these substitutional sites. We give a detailed crystal-field model for the Co2 + ion inthe C3 site in LiGa5Og and deduce the crystal-field parameters from our experimental data.
I. INTRODUCTION AND BACKGROUND Co2 + and Co3 + ions, mainly in distorted tetrahedral en-vironments. The tetrahedral Co 3
+ spectrum observed inWhen cobalt (Co) is added as a dopant to wide band- the garnet material YAG is dominated by a broad
gap oxide materials, they acquire a characteristic color double-peaked band centered near 9000 cm- . On thedue to electronic transitions on the Co ions in the visible other hand, the tetrahedral Co2+ spectrum in YAGregion of the spectrum. The cobalt ions are generally shows three absorption regions. The strongest absorptionfound in the 2+ and 3+ charge states in these oxide occurs in the visible peaking near 16000 cm-', giving thehosts. In 1961, Pappalardo, Wood, and Linares' carried YAG:Co samples a characteristic blue color, and two ab-out a study of the spectroscopic properties of cobalt in a sorption bands occur in the near infrared, peaking atnumber of oxide crystals. They -!vestigated cobalt dop- 7100 and 4700 cming of MgO and ZnO, which offer full octahedral and The material LiGa 5Os crystallizes with the spineltetrahedral symmetry for the dopant Co ions, respective- (MgAI20 4) structure, which is adopted by a large numberly. These are therefore ideal test systems to establish the of compounds whose general formula is XY 20 4. In gen-
] spectroscopic properties of dopant Co ions in oxide ma- eral, two types of spinel are distinguished: "normal" andterials. The simplicity of the observed spectra allowed "inverse," and the cube in Fig. I represents the unit cellPappalardo et al. 1 to perform a detailed crystal-field of normal spinel. For convenience, the cell is dividedanalysis of the spectra. These researchers also carried into octants, and the arrangements of ions in two of theout investigations of cobalt-doped spinel (MgAi20 4) and octants are shown. These arrangements are repeated inYAG (Y3AI.O, 2), each of which offer both tetrahedral alternate octants. The octahedral and tetrahedral sitesand octahedral environments for the dopant Co ions. On may be distinguished in this figure. Whereas in normal"the basis of the work in MgO:Co2+ and ZnO:Co2 +, they spinel the octahedral and tetrahedral sites are occupiedfound that their spinel and YAG samples were dominat- by trivalent and divalent ions, respectively, in inverseed by Co24 spectra and that, given a choice, the Co2+ spinel one-half of the trivalent ions occupy tetrahedralions greatly preferred tetrahedral to octahedral coordina- sites while the other half, together with the divalent ions,tion in these materials. A subsequent study of Co absorp. occupy octahedral sites, and the structure can betion spectra in garnet hosts was carried out by Wood and represented by the formula Y(XY)0 4.Remeika 2 in 1967. The observed spectra were ascribed to The LiGaSO5 arrangement is a variation of the inverse
[45 563 01992 The Ameriaa Phyical Soiey
r

564 DONEGAN, ANDERSON, BERGIN, GLYNN, AND IMBUSCH 45
- .- , - - - --- Co2 + ions substitute for Ga 3+ at these sites in LiGa5Os.. :" - There are four possible inequivalent Co2+ sites in the unit
cell, with C 3 axes along (11 10 -type directions. The crys-
tal structure of LiGa5 O8 has been described in detail by:' 4A 1 II Gorter .4
.----- In the past, extensive optical spectroscopic studies
have been carried out on Cr3 +, Mn 4 +, Fe 3 +, and Ni2 +tAr '- ions in LiGa5O 8 . 5 -9 In this study we have combined op-" r'' tH tical and magnetic-circular-dichroism-optically-
detected-magnetic-resonance (MCD-ODMR) spectros-•-- .. .. . - -copies to obtain a detailed account of the electronicI , •" I -- C 2-----.- .... , .. • structure and environment of the ion in LiGa508.
The experimental results are consistent with the C 3 site-------- .symmetry expected for substitutional Co2 ÷ in theFIG. 1. Schematic diagram of the unit cell of normal spinel tetrahedrally coordinated sites in this material. A
(MgAI204). For clarity, only two octants of the unit cell are te eeshown. The large open circles are the oxygen !ons, the small crystal-field model is developed for the Co2 + ion in
open circles are the tetrahedrally coordinated ions, and the LiGa5Os, and values for the crystal-field parameters are
hatched circles are the octahedrally coordinated ions. Atoms A derived from the data.
and B in the figure are in tetrahedrally coordinated environ- iments. I. EXPERIMENTAL DETAILS
spinel structure and contains 4 formula units in the cubic The luminescence and excitation measurements werecell shown in Fig. I. The monovalent Li + ions and carried out in an Air-Products flow cryostat with temper-three-fifths of the Ga3+ ions are distributed among the atures in the range 10-300 K. An Aviv spectrophotome-octahedral sites in an ordered manner so that each row of ter was used for the absorption experiments along with aoctahedral ions in a ( 110 s-type direction contains a lithi- cold-finger cryostat with liquid-N 2 cooling. For theum ion in every fourth position.3 This distribution of Li luminescence work, an Ar+ laser with 100-mW power ations results in the arrangement shown in Fig. 2 for the 514.5 nm was employed. The excitation spectra weresecond-nearest-neighbor shell of cations about a gallium recorded using a cw dye laser with DCM or RG6 as theion in the tetrahedrally coordinated site. The nearest- active dye medium. Both photomultipliers (with S20 andneighbor oxygen ions are not shown. The Li ions are ar- GaAs photocathodes) and a liquid-N 2-cooled Ge detectorranged symmetrically about the [ 111 ] direction of the were used to monitor the light signals.cell. This arrangement of the Li ions means that the site The MCD and ODMR experiments are illustrated insymmetry for the tetrahedrally coordinated Ga3+ ions is Fig. 3. In this illustrative example, the ground and excit-
reduced from Td to C 3 , and, as we will see later, the
2
Excited State
2I
2.-_oGround State
2
1 --- -FIG. 2. Environment of the Co2
+ion in LiGa,0g showing OR 1.)uthe shell of second-nearest-neighbor cations. This cube in this
figure is shifted by a distance equal to half the cube edge with irespect to the cube in Fig. I (so that the atom marked B in Fig.I is now at the center of the cell) and the oxygen nearest- FIG. 3. An illustrative example of MCD with the groundneighbor ions are omitted for clarity. The solid circle is the and excited states both described by S - f. Thke lower ZeemanCo2 1 ion and the hatched circles are the octahedrally coordi- level in flhe ground state iR more heavily populated than the Inated second-nearest-neighbor ions. The circles marked X are upper state at low temperature, giving rise to a MCD signal.the Li " ions. The C3 symmetry axis for the C+2 ion in the The ODMR transition in the ground state is indicated by ajcenter ofthe shell is the [ITII direction. dashed line. II

45 OPTICAL AND MAGNETIC-CIRCULAR-DICHROISM- ... 565
ed states are spin doublets, and these are each split into The samples of LiGa5O8 used in this study were growntwo by the magnetic field. The two circularly polarized by the flux method, and the dopant cobalt ions exhibitabsorption transition, aL and ag, are shown. These are two zones of concentration in the material: a deep bluetransitions in which the light travels along the direction core and an outer pale blue region. Electron microprobe
of the magnetic field. The oscillator strength of the two measurements of the cobalt concentration in one sampletransitions are equal, but the absorption strength will de- gave 0.5% in the core and 0.12% in the pale area.' 0 AllI pend on the populations in the ground-state sublevels. In measurements were carried out on samples cut from thethis case, where there is a greater population in the lower lightly doped region. For the magnetic resonance experi-level, in accordance with the Boltzmann formula, then ments a small sample (dimensions I mmX 1 mm X 1.5aL will be greater than aR and the MCD signal, which is mm) was cut so that it could be positioned in the mi-proportional to (aL -aR ), will be nonzero. crowave cavity with the magnetic field in the (WIT) plane.
If now the sample is irradiated with microwave powerat a frequency corresponding to the Zeeman splitting of IlL EXPERIMENTAL RESULTSI the ground state, this will tend to equalize the popula-tions in the two levels and there will be a decrease in the The LiGasOs:Co2+ system shows two regions of strongMCD signal. Thus, the ground-state resonance condition absorption, and their spectra recorded at 85 K are shownshows up as a change in the optical signal and this consti- in Fig. 4. These spectra show a very strong similarity toI tutes the optically-detected-magnetic-resonance signal. those of Co2+ ions in tetrahedrally coordinated environ-
The MCD-ODMR experiments were carried out at ments in Y 3AI50 12 and ZnAl20 4.2 1," A Tanabe-Sugano
1.6 K in an Oxford Instruments SM-3 superconducting energy level diagram for the lowest energy levels of a d7
magnet cryostat. The sample was mounted at the center ion in a tetrahedral crystal field is also given in Fig. 4,of a 35-GHz TEa11 microwave cavity having optical ac- and we assign the visible absorption band to thecess. A Hinds SM-3 quartz modulator produced alternat- 4A 2(4F)--,4T,( 4P) transition and the infrared band toing left and right circularly polarized light at 50.3 kHz. the 4 A2 (4F)---,4T1 (F) transition. A third absorption
The MCD signals were detected using both Si and Ge transition due to the 4 A2( 4F) - a4 T2(4F) transition, ex-detectors combined with standard lock-in techniques. pected to lie in the region of 4000 cm-, could not be, For the ODMR experiments, -50 mW of microwave detected even in samples with nominal Co concentration
i power was introduced into the cavity. For the case in of 1%. The weak band in Fig. 4 with a zero-phonon linewhich the absorption coefficients 0 L and oR are small, at 13 580 cm- is tentatively assigned to Co3+ in the oc-the MCD signal is given by tahedrally coordinated site in LiGasOs by comparison
S MCD=(L -- R ) • (I--L) (1) with previous studies of Co-doped Y3A150 12.2
' IOn inspection of Fig. 4 we see that both absorptionwhere IL and IR are the transmitted intensities for left bands are split; the band in the visible has two broadand right circularly polarized light, components at 15 400 and 16 600 cm I, while the band in
20- 2 , L.%Oe:C02 +E 2 T
o A ,) T 85 K,F Ii 4A2 41,(41p)
. .... .. .. .
50OO 10000 1 Soo0 20000 25000i ~ENEMYG (Wra"1
FIG. 4. The absorption spectrum of LiGasO,.tTo'* recorded at 85 K showing the 4•24)-*T(P n the 4AtF--•T(F
i transitions. The inset shows a Tanabe-Sugpno energy-level scheme for Wo'+ in LiGa$08. The absorption transitions are indicated onthe energy-level schemne.
I'

566 DONEGAN, ANDERSON, BERGIN, GLYNN, AND IMBUSCH 45
Energy (cm 1 ) TABLE I. Comparison of the sideband features (in cm -) in
'1M 12000 am0 luminescence and excitation of the 4 A2 (4F)l-.4 TI( 4p) transi-
tions for Co2 + ions in LiGa5 O s.
UGaO8:Co2-+ Lunscence Luminescence Excitation
4T, (4p) -4A2(
4F), 4T2 ('F), 4T1 (4 F) 46
63149 146185 188
277333 340
30H374 378474 460520 507564 565
630 626
7 657714 704
600 1000 1400 768
Wavelength (nrm)
FIG. 5. The luminescence spectrum of LiGa5 O8 :Co2+
recorded at 20 K and room temperature showing the three the first luminescence transition in the red is muchluminescence transitions. An Ar+ laser with 100-mW power stronger than the other two. The zero-phonon line of thewas used for excitation. The luminescence transitions are indi- first luminescence transition at 15 157 cm - recorded atcated on the energy-level scheme in Fig. 4. 15 K coincides with the first sharp peak of the visible ab-
sorption band in Fig. 4. All three luminescence bands ofthe near infrared has two broad components at 7210 and Fig. 5 are found to have the same excitation spectrnm6300 cm-'. A similar splitting was observed by Wood [recorded at 15 K and shown in Fig. 6(a)] and the sameand Remeika in the corresponding Co2
+ spectra in lifetime. Therefore, these are assigned to transitions orig-
Y 3A15 0 1 2. 2 There is some sharp-line structure evident in inating on the same 4 TI( 4 P) level. The red luminescenceboth transitions, which makes it difficult to unambiguous- is the 4 TI( 4P)-- 4 A 2 (4F) transition (see the energy-levelly distinguish between electronic and vibrational fine diagram in Fig. 4) while the two near-infrared lumines-structure. cence transitions in Fig. 5 are assigned to the
Using Ar+ laser excitation at 514.5 nm, three lumines-cence transitions are observed and the complete lumines-cence spectrum at 20 K and room temperature are shownin Fig. 5. This spectrum was recorded using a Ge detec-tor and is not corrected for the system response. We note (a)
that, as the Ge detector has a poor response in the visible,
LiGa 501:Co• 2 +
zz\ a) z
LlG
a )2 4F T 'T
11 p ) 4 A 2 (4 F
15800 15000 14200 4006080lieccy.7(aT) WVELENGTH (nm)
FIG 6. (a) Th 4 Tn(eP)gyG5cm) 2
::FG .()Teexcitation spectrum of all three lintene FG7.a)TeA(F.-T(4 absorption transition
*, transitions shown in Fig. S recorded at 15 K and (b) the recorded at 85 K. (b) The wavelength dependence of the MCD
'T 1(4P)-'.4 A 2 (4 F) Iunisseacence translition recorded at 15 K. signal for the 4A 2(4F).-.-'T 1(4P) transition recorded at 1.6 K.
The se two spectra are clearly mirror Im ge of one another The sharp dip in the M CD si na at 566 nm ia aacribed to a
apart from the features marked x,y}, and z in the figure. Fano antiresonance elfect.
(b)i

45 OPTICAL AND MAGNETIC-CIRCULAR-DICHROISM-... 567
(100] [11l] [011]1.2
I-• 1.0
.J0u_
Y 0.84A2 (4 F)-TI(4 F) LiGs 5 0N:Co 2* 0.
2 06z
z 0.6-LU
u 0" 30' 60' 90'ANGLE IN (01)T PLANE
FIG. 10. The angular dependence of the ODMR signal with1000 1400 1800 i(OIT). The C 3 symmetry for the Co2+ impurity is evident
WAVELENGTH (nm) from the spectrum. The solid points are due to increases in the
FIG. 8. (a) The A2(4F)-_ 4T,'OF) absorption transition MCD signals at resonance and the open circles are due to de-creases in the MCD signals at resonance. The splitting of the
recorded at 85 K. (b) The wavelength dependence of the MCD cReases ne MCD is at resoan T splig ofsignal for the 4 A2(4F)-_ 4 T,( 4 F) transition recorded at 1.6 K. ODMR lines near [100] is due to a small misalignment (-2) of
the LiGa5 Og:Co 2+ crystal.
"1 4 T (4P)--,472(4F) and 4 T( 4 P )--4 4 T, (4F) transitions, re-
spectively. The lifetime of all the luminescence bands at10 K was found to be 200±20 ns. This lifetime is con-' a)stant up to room temperature within experimental error.
The red luminescence transition, recorded in greaterdetail at 15 K, is shown in Fig. 6(b) along with the
->" 0 luminescence excitation spectrum in Fig. 6(a). The twospectra in Fig. 6 are clearly mirror images of one another
z except for the features marked x, y, and z in the excita-SW tion spectrum. The frequencies (with respect to theI- zero-phonon line at 15 157 cm -) of all the fine-structurefeatures in the spectra of Fig. 6 are given in Table I. The
, extra fine-structure lines in the excitation spectrum are ato(b) 46, 63, and 277 cm- from the zero-phonon line position.
_0E_ I I In Figs. 7 and 8 we present the MCD spectra recordedBI 1[0111 at B = 1.64 T and T = 1.6 K for the LiGa5Og:Co2 + sys-
tem along with the corresponding absorption transitionsat T=85 K. The MCD spectra have not been correctedfor the system response. The MCD band in Fig. 8(b) con-tains a great wealth of fine structure at this temperature,even more than is evident at 85 K in the absorption spec-
0 trum in Fig. 8(a). In the MCD spectrum of Fig. 7(b)there is a rather interesting feature at 566 nm. It is seen
S0 05 1.0 1.5 to be a "dip" in the MCD signal at this point. This
MAGNETIC FIELD (T) feature is also observed as & dip in absorption strength inFIG. 9. The magetic-field dependence of the MCD signal the absorption spectrum of Fig. 7(a).
along the (a) (1001, (b) [I(1), and (c) (011] directions recorded at The magnetic field variation of the MCD signal takenthe arrowed wavelength position (1400 nm) in Fig. 8. Forcom- at X=1400 nm along the [100], [111], and [0111 direc-parison the scaling of the y axis for the three signals is the tions is shown in Fig. 9. We note that the intensity of thesam. The dips and peas i the spectra are due to ODMR MCD signal is not isotropic, as it would be if the Co2 +tso Note the "positive" ODMI transition for the ion was at a site of full Td symmetry. We find instead[ [I 1-oriented spectrum, that it shows a maximum along the [III] direction [Fig.
|_

568 DONEGAN, ANDERSON, BERGIN, GLYNN, AND IMBUSCH 45 19(b)], suggesting an axis of symmetry along this direction. fivefold degeneracy of the d states splits the 4F term inioIn this figure we also show the ODMR transitions, three manifolds: 4 A 2 , 4T2, and T, (4F). The 4 p termidentified as peaks and dips in the MCD signals. It is in- spans the manifold 4 T, (4P). These splittings are shownteresting to note that the high-field ODMR transition in Fig. 11, which indicates schematically the effect ofalong [ 111 ] shows an increase in the strength of the MCD various perturbations on the Co2+ ion in LiGa5 Og. Theband. many-hole (Ms = 3-) states for these manifolds are given
The angular variation of the Co2+ ODMR transitions by
with the magnetic field B in the (011) plane is shown inFig. 10. The solid points are due to ODMR transitions 4A2=(917110 Iwhich show an increase in the total MCD signal (positiveODMR), and the open points are due to transitions 4 T2=(e, ',g) ,which show a decrease in the MCD signal (negative (2)ODMR). The "positive" ODMR signal is strongest 4Ti 2(
4F)=l/V/5[(T,71,0)+2(g,O,)] ,
along [111] and weakens quickly as the crystal is rotated 4Tl,(4p)=l/•/•[2(ý,,7,0)_(ý,OE)]towards either the [100] or (011] direction. The splittingof the ODMR lines near [100] is due to a small misalign- where (X,,X 2,X 3 ) denotes the Slater determinant of thement (-2°) of the LiGa5 Og:Co2+ crystal; the small size orbitals X1, X 2, and X3. In addition, the tetrahedralof the sample making alignment difficult. crystal field gives rise to a mixing between the 4 T,(OF)
and 4 T, (4P) manifolds, resulting in the repulsion of theseIV. CRYSTAL-FIELD MODEL levels, as shown in the middle of Fig. 11.
In this section we describe our crystal-field model forthe Co 2+ center in LiGa50s. This model includes a full 2. C3 componenttreatment of the C3 crystal field which acts upon the The second component of the crystal-field potential is aCo2+ ion. We start with the electron-electron interac- component of C3 symmetry. The second shell of neigh-tion, and then include the crystal-field interaction. Last-ly, we consider the spin-orbit interaction, which gives rise bors around the Co 2+ impurity consists of nine galliumo we csplittinger the spin-orbitaintera. in T his h leads nesrse ions and three lithium ions arranged as shown in Fig. 2.
to a splitting of the ground state. This leads to an expres- If all the ions in the second shell were identical, i.e., galli-sion for the fine-structure parameter D for the ground um ions in this case, then the site symmetry would be Td.
It is the three lithium ions that are responsible for lower-A. Et i ing the symmetry to C 3 . Contrary to a note by Macfar-
lane,' 3 there is a distinction between C 3 and C 3, poten-The Co2+ impurity in LiGa5Os has the d 7 tials, though, like the C 3, potentials, the C3 potential
configuration, which we treat as a three-hole splits each orbital triplet into an orbital singlet and an or-configuration. In accordance with Hund's rule, the bital doublet. [We consider an expansion of the potentialground-state term is a VF term. There is a second spin in terms of spherical harmonics. The linear combinationquadruplet, a 'p term. In the case of a free Co2+ ion, the of L --4 spherical harmonics (neglecting the M =0 har-4p term is the first excited term, lying approximately15 500 cm-1 above the ground term.' 2 The 4P.4F split-ting is reduced for the case of the Co2+ impurity in crys-tals, as a result of the greater extent of the wave functions 7 Awhen the ion is in a crystalline environment. We denote 4 4T.(
4p) -4EPthe 4P-vF splitting, which can be expressed in terms of -
the Racah parameter B, by the single parameter A.
B. crystal-Roml Interaction T T(F) A
1. Td component 4T2 ID
We decompose the crystal-field potential into two com- IODq Edponents, which we treat separately. The first component A . . _....
is a field of Td symmetry, resulting primarily from thefirst shell of neighbors that consists of four oxygen ions in (a) (b) (c)tetrahedral coordination about the Co2+ ion as shown in FIG. 1I. Energy-level diagram showing the splittings of theFig. I. In addition, the third shell of neighbors consists d' configuration for the Co2+ impurity in LiGasO,, due to (a)of four gallium ions also in tetrahedral coordination the electron-electron interaction, (b) the tetrahedral componentabout the Co2 + ion. These gallium ions are located in the of the crystal field, and (c) the C3 component of the crystal field.corners of the left-hand octant in Fig. 1. The tetrahedral The C3 crystal field splits each orbital triplet (T,, 7T) into acrystal field splits the one-hole d states so that the t 2- doublet (E) and a siglet (A). The energies ED and £s used insymmetry holes are lower in energy than the e-symmetry the determination of the fine-structure paramneter D are alsoholes by an amount IODq. The partial removal of the shown.

45 OPTICAL AND MAGNETIC-CIRCULAR-DICHROISM-... 569
monic) which describes a C3U potential is (iY43 - Y4 3 ), prescribed the one-hole matrix elements of a C3 potentialwhich is proportional to cos(34s), '3 where 4$ is measured within a basis of d holes. The nature of this potential isabout the three-fold axis with 4=0 defining one of the better understood if we make a change of basis for the t2three reflection planes. Reflections through these planes states that reflects the axial nature ((I 1 )-type direc-change 0, but not cos(30). In lowering the symmetry to tions) of the C3 potential. Consider the basis set definedC3, an additional term must be added to the potential byand this term does not remain unchanged with reflectionsthrough these three planes but retains the three-fold ra- t2-- I //3( t2g + t2,9 +t2ý)tional symmetry. The linear combination V Y4 3 + Y4 -3),which is proportional to sin(30), is such a term. This ad- t l/V( 2t2ý - t2 9 -t 2,q) , (5)ditional term is the distinction between the C 3, and theC3 potentials.' 4] t2 -- /v2(t2-t2,1)
We write the one-electron C3 potential within d statesin terms of operators which span irreducible representa- In the basis set of d states (02., t2, t2• , e,e), the one-tlions of the Td point group. We find hole matrix elements of the C3 potential are
VC -= aA ,- V( T2T• Y) W ( TI.+ Tly- T i,) " 2v/3 0 0 0 0
7 (3) 0 -v/3 0 V' Wwhere a, V, and W are constants. Analytic expressions W = 0 0 -- v/3 - w v' (6)
for these constants can be derived, for example, by as- 0 v' -- w 0 0suming a point-ion model. However, we proceed by treat- 0 I v' 0 0ing these as parameters. We note that it is the last termin Eq. (3) which distinguishes this potential from one of" ~From Eq. (6), we readily see the difference in how the Ch,SC3, symmetry. We define the following reduced matrixeesymmentsry. We defne the following rand C 3 potentials act within d states. The parameter v'
mixes the t 20,2, states with ee, states in one sense, while
the parameter w mixes these states in the opposite sense.( t2i t2i = a•, The matrix elements of the C 3 potential taken between(eklVC led=a, the many-hole states of the four manifolds prescribed in(eklVc 31ek--ae Eq. (2) are readily determined from the one-hole matrix
elements given in the previous paragraph. This results in(t 2iIVc31t 2j)=v/3 (i=Aj) (4) a lOXl0matrix. This matrix can be reduced in to a 4X4
le2• 3e)= =V2/v' block and a 6 X 6 block through a change of basis for the(' 2 j VC3 orbital-triplet manifolds like that given in Eq. (5). Within
St V e v 3.the basis set 14 A2, 4Tr1( 4F), 4T 22 , 'r 1 2 (4P)I, the many-C2; Ie, V hole matrix elements of the full crystal-field interaction
and the electron-electron interaction are
The parameters a, and a, give a contribution, in additionto that of the tetrahedral component of the crystal field, -- 6G I -2. 21to the splitting between the t2 and e holes. We therefore I 3G +2L -4K -2G +2Nincorporate this additional contribution into the parame- 2J -4K -- G +2H 2Kter lODq. The parameters v and v', which result from the 21 -2G +2N 2K F+2MT2g + T2, + T2; operator, are defined following Macfar-lane.' 3 The parameter w results from the T1, + Tly + T1,operator, and so does not appear as a parameter for a C3, Within the basis set 14T1e( 4F), 4T,,(4F), 4T20, 4T T( 4P),"potential. Using these parameters and Eq. (3) in conjunc- 4T,,,(P) , the many-hole matrix elements of the crystal-tion with the Wigner-Eckart theorem, we have exactly field and electron-electron interaction are
3G -L 0 2K -P -2G -N -J0 30 -L P 2K J -2G -N
S2K P -G-IH 0 -K -Q-P 2K 0 -G -H Q -K (8)
-2G -N J -K Q F-M 0
-1 -2G -N -Q -K 0 -

570 DONEGAN, ANDERSON, BERGIN, GLYNN, AND IMBUSCH 45
The variables F, G,H..... Q given above are defined by where X is the many-electron spin-orbit parameter. Forthe free Co2+ ion, X is approximately - 180 cm- 1. For
F=A, L =1/5(3v/2+2v/2v'), the ion in a crystalline environment, X is somewhat re-
G=2Dq, M=I5(v-2V2v'), duced (typically to 0.8 of the free-ion value) from thisvalue.
H = v/6, N =1/5( - v1/3 + 3V2v'/2), The ground-state fine-structure parameter denoted D is= ,P /v(v(v/2+v)9) a measure of the splitting between the two Kramers dou-
blets within the ground A,2 manifold. We now include
J =w/V/2, Q =I/v' (-v +v'/V2), the mixing of the 4T 2 manifold with the other orbital-K =w/V . triplet manifolds. We define the fraction of the 4T 2 wave
function within the ith (i = 1,2,3) orbital doublet to be
From Eqs. (7) and (8), we can show that, as required by fli, and the fraction of the 4T 2 wave function in the ith
symmetry, the C 3 potential splits the orbital triplets into orbital singlet (neglecting the 4A 2) to be aj. We find then
an orbital singlet and an orbital doublet, as shown in Fig. that D is given by
11, and we can also show how the differences between the D = 3C 3 and C3l, potentials affect the mixing of the orbital trip- 2 ( )lets. Diagonalizing the matrices in Eqs. (7) and (8) yields _3_ 3 ithe many-hole energy levels and eigenstates for the Co 2
+ =4X'2 Eo- aIE . (14) iimpurity in the site of C 3 symmetry.
C. Spin-orbit Interaction Since the fine-structure splitting is large compared withthe Zeeman splitting as measured here by ODMR, we
The spin-orbit interaction has the effect of splitting in can treat the two Kramers doublets resulting from thefirst order each of the orbital doublets into four Kramers 4A 2 manifold independently, with each doublet being de-doublets. (Note that S = -. ) In addition, the spin-orbit scribed by an effective spin S'= 1. The effective-spininteraction in second order splits the orbital singlets into Hamiltonian for each of the doublets istwo Kramers doublets. We concentrate on the splittingof the A 2 ground manifold. e=/LBB'g'S' . (15)
The spin-orbit interaction mixes the 4A 2 ground mani-fold with the 4T2 manifold. The many-hole matrix ele- The g tensor has two independent components: g,, (along
ments of the orbital angular momentum L taken between the three-fold axis) and gi (perpendicular to the three-
the states of these two manifolds is characterized by fold axis). In first order, the g values in the ±2 manifoldare g1 = 3g, (ge = 2.0023) and g, =0. The g values in first
(T2LIA)=2i i=V---. (10) order in the ±1 manifoldareg,,=g, andg,=2ge.'16SDepartures of the experimental g values from these
This matrix element is unchanged if we transform to the theoretical values within the M1 - ±-L manifold are ex-basis set for the 4T 2 manifold defined by Eq. (5) and per- plained using the usual second-order corrections involv-form a similar transformation on the orbital momentum ing the spin-orbit interaction and the orbital Zeeman in-operators. For example, we define L, by teraction. As with the fine-structure splitting, the mixing
with excited states involves the states of the 'T 2 mani-L, = I/x/3(L,, +Ly +L ), (11)fold. We find that
which yields 3 /Es
(T 2bILI[ A 2 2=2i (12) g/ Ige-8i=a
and similarly for T 20 and T2, with L; and L;, respective- 3 1(16)ly. g, =2 g'--8k. IE•iEo •
We neglect for the moment the mixing of the 4T2 man- I =I
ifold with the other orbital-triplet manifolds, but consider The results in Eq. (16) have a similar form to those in Eq.only the splitting, due to the C 3 symmetry field, of this (14). Indeed, we can relate the g values to the fine-manifold into an orbital doublet, at an energy ED above structure parameter by Ithe A 2 manifold, and an orbital singlet, at an energy Esabove the 'A 2 manifold. The spin-orbit interaction be- g, /2-gl = -2D/A . (17)
tween the 4T 2 and 4'A 2 manifolds splits the 4A 2 manifoldinto two Kramers doublets. One doublet is comprised of V. ANALYSIS OF RESULTS AND DISCUSSIONthe M,=±-! states, the second of the M,=±- states.The second-order energies of these two doublets are given We now proceed with the analysis of our experimentalby data in light of the theory developed in the previous sec-
tion and of the assignments made for the observed optical
E(±!)=-3 3k2(3/Es+ 2 /ED), transitions in Sec. II1. We noted that both absorption(13) transitions in Fig. 4 show a splitting into two bands; this
E( ±) -)2( !/Es + l4/Eo), splitting is due to the C 3 crystal field present at the Co2 +
=ni - ---

45 OPTICAL AND MAGNETIC-CIRCULAR-DICHROISM-... 571
site. The additional band with a peak at 18 200 cm-' in glasses.'8 "-9 Consulting the Tanabe-Sugano diagram for aFig. 4 is most likely due to higher-lying levels arising d7 ion in tetrahedral symmetry,17 we find that there are afrom the 2G free-ion level as shown in the energy-lying di- number of levels originating on the free-ion 2G levelagram in Fig. 4.17 Values for A and lODq can be estimat- which are expected to lie in this general spectral region.ed by fitting the average energies of the 4A 2(4F) We are unable to make any definitive electronic assign--- )
4T T(4)P) and 4 A 2(4F)-,4T, (4F) transition. The exper- ment for the antiresonahce feature.
imental positions we choose for the fitting process are at The width of the zero-phonon 15 157-cm line of the6300, 7210 cm-' for the 4A2( 4F)-.4 4 T( F) transition 4TTI(P) level in luminecence is 24 cm-' (full width atand 15400, 16600 cm - for the 4 A 2(4F)--,4 TO(4P) tran- half maximum) at 15 K. A series of nonresonant fluores-sition. Choosing these positions is somewhat difficult due cence line narrowing (FLN) experiments were performedto the presence of much vibrational structure in these in order to investigate structure hidden within this largespectra. Values for v, v', and w are then chosen and the inhomogeneous profile. The detailed results of this inves-matrices in Eqs. (7) and (8) are diagonalized iteratively tigation have been published elsewhere.2° From theseuntil a good fit to the experimental positions is found. FLN measurements, the ground-state splitting due to aThe following values are found from our analysis: combination of the C3 crystal field and spin-orbit cou-
S-10 781 cm- 1, v = + 1362 cm- pling is 19.5 cm-', from which we obtain D =9.75 cm-1.The optical spectra in Figs. 4-8 show a considerable
lODq = +3770 cm-1, v'= -10 cm- , (18) number of sharp-line features. As indicated above, eachI of the crystal-field levels is further split by spin-orbit cou-
+20 cm-i pling, the doublet into four components and the singletThese values give an excellent fit to the experimental po- into two components. As a result the 4A 2(4F )- 4 T, (4p)sitions. Hund's rule requires that the ground state be the absorption spectrum in Fig. 4 should contain six electron-VF term; so we require A to be positive. The strong ic components among a large number of vibrational side-tetrahedral component of the crystal field, coming pri- band features. It is difficult to identify transitions tomarily from the four nearest-neighbor oxygen ions, deter- these electronic levels in the absorption spe,.tra shown inmines the sign of lODq. These oxygen ions are negatively Fig. 4 which were taken at 85 K. However, in the excita-charged. The lobes of the t 2-symmetry hole orbitals are tio:n spectrum of the 4T,( 4P)-. 4 A2(4F) luminescencecloser to the oxygen ions than the lobes of the e- transition shown in Fig. 6(a), recorded at 15 K undersymmetry hole orbitals. Hence, the t2-symmetry holes much higher resolution, the features labeled x,y,z areare lower in energy than the e-symmetry holes, making clearly electronic as they are not observed in the corre-lODq positive. Setting the signs of these parameters we sponding luminescence spectrum. We tentatively identifyfind that the signs of v and v' are determined to be posi- the line at 15 157 cm-1 and the features at 46, 63, andtive and negative, respectively. The fit to the data is in- 277 cm- above 15 157 cm as the spin-orbit split com-sensitive to the sign of w. This fitting procedure suggests ponents of the orbital doublet level coming from 4 T, (4P).that, for each orbital triplet, the doublet is shifted down The possible presence of levels arising from the 2G free-in energy and the singlet shifted up in energy by the C3 ion level in this spectral region is a complicating factorcrystal field. making our identification rather tentative. The
The positive sign of v is physically reasonable. In an 4 A 2(4F )-, 4T (4F) transition in Figs. 4 and 8 is particu-ionic model, the gallium ions possess a + 3e charge and larly rich is spectral features making identification of thethe lithium ions a + le charge. Hence, the perturbation six expected electronic components very difficult. Never-potential resulting from the lithium ions is that of three theless, we can reasonably assign the lines at 6060 andnegatively charged ions in a C3 symmetry configuration. 7140 c.n to electronic transitions.The lobes of the t 2, hole orbital lie in a plane perpendicu- The very fast radiative decay time of the luminescencelar to the C3 symmetry axis and the lobes of the t 2 9 and transitions at low temperature indicates that these transi-
t 2, hole orbitals, are therefore closer to the lithium ions. tions have a strong electric dipole character and, conse-Hence, these latter two orbitals have a lower energy than quently, have a large oscillator strength. This comesthe t2, orbital. Equation (6) therefore implies that v is about because, in the tetrahedral site (in which the sitepositive, symmetry is C3), in LiGa5Os the odd-parity crystal field
The signs of v' and w are much harder to explain in mixes the 3d states of Co2+ with higher-energy states ofphysical terms. We note, however, that, in the point-ion opposite parity, and this mixing is responsible for themodel for this defect, v' is predicted to have a sign oppo- electric-dipole character of this transition. The lack ofsite to that of v, and w is predicted to have the same sign discernible change in the lifetime up to room temperature
Sas v. We recall that the sign of w is not determined in our indicates the absence of a competing nonradiative decayfit. In any event, both v' and w are found to be small in process for this level and strongly suggests that theour case. luminescence process is very efficient. The room-
An interesting feature of this Co2 + system is the sharp temperature luminescence spectrum in Fig. 5 shows threedip observed at 566 nm in the absorption spectrum in broadbands which have high luminescence efficiency. InFig. 7(a) and in the MCD signal of Fig. 7(b). We believe contrast to both ZnO:Co' (Ref. 21) and ZnAI2O4 :Co
that the dip is due to Fano antiresonance effect such as (Ref. 11), the luminescence bands in Fig. 5 originate onhas been observed in KMgF3:V 2+ and in Cr3+ doped the 4 T,( 4p) level rather than the 2E level. From the
* .. .* , *

572 DONEGAN, ANDERSON, BERGIN, GLYNN, AND IMBUSCH 45
Tanabe-Sugano diagram17 we find that luminescence of the fine-structure parameter D is positive from Eq.
transitions originating on the 4T, P)are very broad due (14). As g,/2 >g,,, we are again led to the conclusionto the sensitivity of the 4 TI( 4P) level to the crystal-field from Eq. (16) that the orbital doublets arising from the
environment. Luminescence transitions from the 2 E level orbital triplet manifolds are lower in energy than the or-
consist of sharp lines due to its insensitivity to the crystal bital singlets. At the low temperatures of the MCD-field. The three luminescence transitions observed in ODMR experiments the population of the ±+ levels iLLiGa5O. Co2+ are also spin allowed, which contributes very small and so no signals were observed in this dou-to their large oscillator strength. The combination of blet. From Eq. (17) we estimate the spin-orbit constant to 1broad luminescence transitions coupled with a large oscil- be X -193 cm- 1. We can also estimate X from Eq.lator strength makes LiGa5O 8:Co + an ideal candidate (14). In doing this we use the theoretical estimate for thefor a tunable solid-state laser in the visible and near in- positions of the 4 T 2 doublet and singlet split levels and infrared. this case we find X =- 190 cm-1. Both values are quite
The "positive" ODMR lines in Figs. 9 and 10 are an similar but somewhat surprising as we would normallyinteresting feature of these samples. We would intuitive- expect to see a reduction in X from the free-ion case.ly feel that the ODMR transition should equalize the Both the ODMR and the optical zero-phonon Ipopulations of the ground-state levels as illustrated in linewidths are quite broad. The ODMR linewidth is 20Fig. 3 and thereby cause a reduction of the MCD signals mT and exhibits no resolved hyperfine structure associat-in Fig. 9. Along the [100] directior. the four Co2+ sites in ed with the 57Co nucleus (100% abundant) which has athe unit cell all make the same angle with the applied nuclear spin of I = - We noted earlier that the inhomo- Imagnetic field B. We therefore see only a single ODMR geneous optical zero-phonon transition linewidth is 24transition as in Fig. 9(a0. When the applied magnetic cm-I so that the large ground-state splitting could not be -field is along the [111] direction, the four (Illl-type resolved. The Co2 + ion substitutes for Ga3+ in the lat-centers are no longer equivalent; the center aligned along tice and some charge compensation is thus required tothe magnetic field is distinguished from the other three. maintain charge neutrality. Both of these broadIn this case we expect to see two ODMR transitions as linewidt1 hs are probably due to a distribution of positionsobserved in Fig. 9(b). The low-field ODMR transition for the lharge compensating ions which would result in a Ishows a reduction in the MCD signal as expected. On distribution of strains at the sites of the substitutionalthe other hand, the high-field ODMR transition appears Co2+ ions in the LiGa5Og lattice. At present we do not -to show an increase in the total MCD signal. The total know what species is providing the charge compensationMCD signal observed is a combination of the parallel for the Co 2 . It is interesting to note that the behaviorMCD signal and the MCD signals from the other three shown in Fig. 10 is consistent with the C 3 symmetry de-centers. The MCD signal for the parallel center must duced from the crystal structure, and this \')Lild implytherefore be opposite in sign to that from the other that either the charge compensating ion is far away from 1centers. For the example shown in Fig. 3, this would the Co2+ ion or located along a ( Il1 )-type direction.mean that the Zeeman splitting of the ground or excitedstates for the parallel center is opposite to that for the VI. CONCLUSIONS Iother three centers. We find that, as the magnetic field is 2
rotated away from the [111] direction, the intensity of the The optical spectra of Co2 + in LiGa5Os provide clear"positive" ODMR lines weakens (Fig. 10) and eventually evidence that the Co2 + ions substitute for tetrahedrallythe ODMR lines become negative. This result is a fur- coordinated Ga3+ ions in this lattice and therefore occu-ther demonstration that the site occupied by the Co2+ py sites of C 3 symmetry, as illustrated in Fig. 2. We haveion has an axis of symmetry along ( Ill )-type directions. presented a detailed crystal-field model for the Co2+ ionAlong the [ 111 ] direction the coupling between the Kra- in this site, and we have deduced the crystal-field parame- 1mers doublets participating in the MCD signal with all ters. Strong luminescence with a lifetime of 200 ns is ob-the other Kramers doublets within the d 7 shell is at a served to three lower levels from the 4T, (4p) level. In aminimum. P.otating the magnetic field B away from previous publication this system was suggested as a possi-[ 111] results in an admixture into the ground and excited ble candidate as a visible-infrared laser system.9 Further 1states which eventually leads to a reversal of the Zeeman experiments to look at excited-state absorption effectssplitting as the margnetic field approaches the [1001 and would have to be undertaken to determine the potential -
[0111 directior., .,'ig 10). This effect was also observed of LiGa5 O8 :Co2÷ as a laser system. Within the accuracyby Ahlers et al. 22 for tho 710( ) center in KCI. While of the ODMR experiment, the site symmetry of the Co2 +this give a qualitac. e explatiotima for the observed effect, ion is C3, suggesting that charge compensating ions arethe microscopic origin for this reversal of the Zeeman either far removed from the Co2+ or are along the C3splitting has not been determined. axis. 1
The ODMR line positions in Fig. 10 can be fitted to
the spin Hamiltonian in Eq. (15) with the two indepen-dent g values, g, =2.215, gi =4.628. The fit to the exper- ACKNOWLEDGMENTSimental data is shown as the solid lines in Fig. 10. These 1g values indicate that the observed ODMR transitions are We would like to express our gratitude to Professor G.within the ±t1 levels of the ground qtate and so the sign D. Watkins of Lehigh University where the MCD ]
4l

45 OPTICAL AND MAGNETIC-CIRCULAR-DICHROISM- ... 573
ODMR measurements were performed. This work was Office of Naval Research, under Grant No. N00014-90-
supported in part by Optronics Ireland, a division of EO- J-1264 and by the National Science Foundation under
LAS, and by the Air Force Office of Scientific Research, Grant No. DMR-85-20269. The Ge detector was ob-
Air Force Systems Command, USAF, under Grant No. tained through a grant from the University College Gala-
AFOSR 88-0355. The work carried out at Lehigh Uni- way Development Fund which we gratefully acknowl-
versity (by FGA and JFD) was supported by the U.S. edge.
IR. Pappalardo, D. L. Wood, and R. C. Linares, Jr., J. Chem. 85.Phys. 35, 2041 (1961. 13R. M. Macfarlane, J. Chem. Phys. 39, 3118 (1963).
2 D. L. Wood and J. P. Remeika, J. Chem. Phys. 46, 3595 (1967). 14The authors would like to thank Professor F. S. Ham for help-3T. J. Glynn, L. Kelleher, G. F. Imbusch, D. M. Larkin, F. R. ful discussions on this point.
Merritt, and M. J. Berggren, J. Chem. Phys. 55, 2925 (1971). 15J. S. Griffith, The Theory of Transition-Metal Ions (Cambridge4 E. W. Gorter, Philips Res. Rep. 9,295 (1954). University, Cambridge, 1961), p. 4 3 7 .5T. J. Glynn, J. P. Larkin, G. F. lmbusch, D. L. Wood, and J. P. I1G. E. Pake and T. L. Estle, The Physical Principles of Electron
Remeika, Phys. Lett. 30A, 189 (1969). Paramagnetic Resonance (Benjamin, London, 1973), p. 127.bT. Abritta, N. V. Vugman, F. de Souza Barros, and N. T. 17B. Henderson and G. F. Imbusch, Optical Spectroscopy of
Melamed, J. Lumin. 31&32, 281 (1984). Inorganic Solids (Oxford Science, Oxford, 1989), p. 130.'C. McShera, P. J. Colleran, T. J. Glynn, G. F. Imbusch, and J. 18M. D. Sturge, M. J. Guggenheim, and M. H. L. Pryce, Phys.
P. Remeika, J. Lumin. 28, 41 (1983). Rev. B 2, 2459 (1970).sJ. F. Donegan, F. J. Bergin, T. J. Glynn, G. F. Imbusch, and J. 19A. Lempicki, L. Andrews, S. J. Nettel, and B. C. McCollum.
P. Remeika, J. Lumin. 35, 57 (1986). Phys. Rev. Lett. 44, 1234 (1980).4J. F. Donegan. G. P. Morgan, T. J. Glynn, and G. Walker, J. 20J. F. Donegan, T. J. Glynn, and G. F. lmbusch, J. Lumin. 45,
Mod. Opt. 37, 769 (1990). 23(1990).")R. M. Macfarlane and J.-C. Vial, Phys. Rev. B34,1 (1986). 2 1R. M. Macfarlane and J.-C, Vial, Mater. Sci. Forum 10-12,"J.. Ferguson, D. L. Wood, and L. G. Van Uitert, J. Chem. 845 (1986).
Phys. 51, 2904 (1969). 22F. J. Ahlers, F. Lohse, J.-M. Spaeth, and L. K. Mollenauer,'2C. E. Moore, Atomic Energy Levels, Natl. But-. Stand. (U.S.) Phys. Rev. B 28, 1249 (1983).
Circ. No. 467 (U.S. GPO, Washington, D.C., 1952). Vol. IH, p.

Appendix 3
Journal of Luminescence 48 & 49 (1991) 541-544 541North-Holland
iLuminescence from Cr3+ centres in forsterite (Mg 2Si0 4)
T.J. Glynn, G.F. Imbusch and G. Walker'Department of Physics, University College, Galway, Ireland
Laser action, tunable around 1.2 aLm, has been reported in Cr-activated forsterite (Mg 2SiO 4). We have examined theemission from this material in the region 650-850 nm via photoluminescence, excitation and lifetime studies over a range oftemperature. Our measurements indicate that the emission in this region can be assigned to transitions on CrP ions inhigh-field octahedral sites. The emission from the MI site is clearly identified. We propose a simple model to account forthe temperature dependence of the luminescence.
1. Introduction 2. Experimental results
When doped with chromium ions, forsterite Oriented samples of Cr-doped fosterite, Czoch-(Mg 2SiO4 ) has been shown to support laser action ralski-grown and cc, r, (A) 0.013%, (B)over a limited spectral range around 1.2 pjm [1-4]. 0.027% and (C) 0.08'.. "r b, w',' ght, were used inHowever, although several studies have concen- our studies. Previous f' R .ý-jrements by Ragertrated on this system, there is still some doubt [5] on sample (A) showed .;Izarly the presence ofabout the Cr valence state responsible for the lasing Cr3" ions in M I and M2 sites in the ratio M l : M2 -
transition and about the exact nature of the par- 3:2. The ground-state splitting, obtained from theticular sites occupied by these Cr ions. Forsterite EPR data, was 2.2 cm- in MI and 1.4 cm-' in M2.has an orthorhombic crystal structure with twoinequivalent octahedral sites occupied by Mg2"
o Forsttrite:Crions, one with inversion symmetry (M l) and one c0 027%.
with mirror symmetry (M2). Although the initial breport ascribed the lasing band at room ;em-perature to the 'T2 -
4A2 transition on Cr3 + ions inA such sites [ I ], more recent investigations [3,4] have MV
assigned the lasing emission to transitions on Cr4 "ions in tetrahedral sites (replacing the Si ions). The C 32 Kcomplete luminescence spectrum of Cr-doped for- a
sterite is shown in fig. I and consists of many Mloverlapping bands, which extend from 650 nm to Mt
beyond 1.4 gLm, and the relative intensities of thesebands vary with the wavelength and polarization J. I 2•-Kof the excitation source. In this investigation, we 680 720 , _ , t _ _ 2_ K
have concentrated on the emission in the region 600 100 1o00
650-850 nm which we ascribe to Cr3+ centres indistorted octahedral sites. Fig. I. The low-temperature emission from Mg 2SiO. (forsterite)
doped with chromium excited by an argon-ion laser (all lines).The sharp features around 700 nm are shown at higher resolu-
Permanent address: Dept. of Pure and Applied Physics, lion. These spectra are not corrected for the response of theUMIST, P.O. Box 88, Manchester M60 lQD. UK. germanium diode detector.
0022-2313/91/$03.50 © 1991 - Elsevier Science Publishers B.V (North-Holland)
-..........

fI
542 Ti. Glynn et al./ Luminescence from Cr-* centres in forsterite (Mg2 SiO4)
The low temperature luminescence spectrum all the features depend on the excitation wave-around 700 nm for sample (B) is shown in the inset length and polarisation, and on the Cr doping level.in fig. I and for samples (B) and (C), at higher The M1 site has inversion symmetry, and theresolution, in fig. 2. It consists of a sharp electronic measured lifetime at low temperature of the R,transition at about 14 437 cm-' and an associated line is 8.8 ms, consistent with a magnetic dipolephonon sideband. Based on the splitting of transition in the R, line and a vibronic process - an2.2 cm•' observed in this line at low temperature, electric dipole transition induced by odd-parityit is assigned to the R,-iine transition from the vibrations - in the sidebands. We expect thelowest 2E level to the 4A2 ground state of the Cr 3* vibronic sideband process to dominate the MIion in the MI site. Additional sharp lines at 14 295 emission at low temperatures. Assuming that theand 13 967 cm- ' (indicated by M l' and M l") show Ml' and M l" sites do not have inversion symmetry,splittings of 2.15 and 1.8 cm-', respectively, and both their R, lines and sidebands should be electricmay be due to emission from M l sites perturbed dipole processes, and the R, to sideband ratioby neighbouring charge-compensating vacancies, should be much larger for these centres than forSome additional satellite features on the M1 line the MI sites [6]. The sideband shown in fig. 2 ismay have a similar origin. These satellite lines are therefore due mainly to emission from M1 sites.more clearly evident in the spectrum of the (C) From the variation with temperature of thesample (0.08% Cr) shown in fig. 2 and an addi- luminescence spectrum (fig. 3), and from excita-tional band appears in this sample at about tion studies, the R1-R 2 separation of the MI and12900cm' (775 nm), which may be due to Ml'centres were measured to be 196 and 265 cm-,different Cr3' centres for which the 4T2 level lies respectively. The R2 line from the M I" centre couldlowest at low temperature (i.e. low-field sites). not be located with certainty. The splittings of bothEven at low doping, additional broad bands are the 2E and 'A, levels of Cr3+ ions in MI and MI'observed at about 850 and 1050 nm (fig. 1) whose sites are unusually large and indicate significantorigin is also uncertain. The relative intensities of distortion of the octahedral environment of these
sites.The energy level structure for the Cr 3
1 ions inS Forsternte Cr3* forsterite is similar to that in alexandrite [7] and,
as the temperature is increased, the higher-lying4T, level becomes populated and emission fromthis level dominates the spectrum at room tem-
perature (fig. 3). Since the transition from the 4T,0 -290 K level is spin-allowed, it will have a higher oscillator
strength and the overall lifetime will decrease. Thevariation of the lifetime of the principal emission
26 lines with temperature is shown in fig. 4. Thelifetime of the M! line varies from 8.8 ms at lowtemperature to 340 jis at room temperature.
008%Assuming that non-radiative relaxation does notoccur, and ignoring the splittings in the 2E and 4T,
I"- "levels, the variation of the lifetime 7 with tem-
perature is given by [71S0 027% 26 K
. _ ___-- ______ 1 fE+3fTexp(-A/kT)s ENERGY(0 3c13t) 1 1+3exp(-4/kT) (1)
Fig. 2. The luminescence from Cr3* centres in forsterite samples wheref, f- are the radiative rates from the 2E and(B) and (C) (see text). An argon ion laser (all lines) was used 'T 2 levels, .espectively, and A is the energy separa-
for excitation. The photomultiplier response was S20. tion between 2E and 4
T2 . A value of 114s-t is
Siii
L. ... ..... .. ...... ... .. . . . . . ...... _

ITJ. Glynn et al. / Luminescence from Cr3
÷ centres in forsiente (MgWSi0 4) 543
Mg2 Si04 :Cr 3 +
Forsterite)
f _ 106 K
175 K
PL30 K k~202 K
155 K25K
15 14. 13 15 14. 13S~ Energy (103 c4n)
Fig. 3. The luminescence from Cr÷ centres in sample (B) (0.027% Cr) at various temperatures. The dotted lines indicate the assumedseparation of the broad band and sharp-line features in the emission.
obtained forfE from the low temperature lifetime.
i Ml ForsteriteCr3 The ratio of the intensities I. in the broad band_ 1 0-027 % (" 2 -,
4A2) and Is in the sharp (M 1) line (2E -_ 4A2)
should vary with temperature approximately as [8]8\
MOODEL: a z450cni IB/IsOC3 (fT/fE) exp(-A/kT), (2)
f 7*T = I x104 s4 and so a plot of ln(IB/ Is) versus I/T should givei = 114 s"1 a straight line with slope A. The ratio IB/Is was
ti(ms) calculated as a function of temperature from the5 4T2--. spectra in fig. 3 by inferring the relative contribu-
, * 2
E tions from 2E and rT2 from the shape of the total£. Ml luminescence spectrum (indicated by dotted lines
fi T in fig. 3). When fitted to eq. (2) a value of 420 cm-'
S3 - was indicated for A. Using this value as a guide,M' A 2 ithe parameters in eq. (1) were varied until a best
2 - fit to the data in fig. 4 was obtained. The calculatedvariation is shown as the solid line in fig. 4, with
I * the parameter values shown in the figure. In spite
of the crudeness of the model, the agreement is0 t00 200 300 excellent. (There is a similar decrease in the life-
Stemperature JK) time of the MI' and MI" centres, indicating inFig, 4. The variation of the lifetime with temperature for the these cases also the presence of an adjacent 41T2
principal features in the luminescence spectrum. The solid curve state.) At the concentration of Cr in sample (B),is a plot of eq. (I) using the parameters shown in the figure. there is no evidence for any energy transfer from
1V
' ,mm ..-m:-:

544 TJ. Glynn et al./ Luminescence from Cr3
÷ centres in forsterite (Mg2SiO4 )
Cr3` ions to the lasing centre which emits at 1.2 gm, of Athens (Georgia), for helpful discussions andwhich was suggested by other workers [2], or for for communicating his results on this material priorany non-radiative component in the emission from to publication. The Ge detector was obtainedthese ions up to room temperature. The above through a grant from the University Collegeanalysis suggests that the radiative quantum Galway Development Fund which we acknowl-efficiency of the system is high and the energy-level edge with gratitude. This research work was sup-structure and lifetimes make it a suitable candidate ported in part by the Air Force Office of Scientificfor tunable operation in the near IR. However, Research, Air Force Systems Command, USAF,Cr-doped forsterite contains many complex under grant number AFOSR-88-0355.centres [9] and, at low doping levels, the centreresponsible for laser action at longer wavelengthsseems to be dominant. This centre absorbs References
throughout the visible and near IR and appears toprevent lasing on the Cr 3 ÷ centres described above. [i] V. Petncevic, S.G. Gayen, R.R. Alfano, K. Yamagishi,
H. Anzai and Y. Yamaguchi, Appl. Phys. Lett. 52 (1988)1040.
(2] V. Petricevic, 1 SG. Gayen and R.R. Alfano, Appl. Phys.3. Conclusion Lett. 53 (1988) 2590.
V. Petncevic, S.G. Gayen and R.R. Alfano, OSA Proc. on
The nature of the lasing centre in forsterite:Cr Tunable Solid State Lasers, Vol. 5, eds. M.L. Shand and
is still not established with certainty and much H.P. Jenssen (1989) p. 77.[3] H.R. Verdun, L.M. Thomas, D.M. Androuskas, T. McCol-
work remains to be done in unravelling the many lum and A. Pinto, App). Phys. Lett. 53 (1989) 2593.
complex centres in this material. We have concen- [4] H.R. Verdun, L.M. Thomas and D.M. Androuskas, OSA
trated on identifying the emission from Cr3 + ions Proc. on Tunable Solid State Lasers, Vol. 5, eds. M.L. Shand
in various sites so that their role in the lumines- and H.P. Jenssen (1989) p. 85.
cence of the forsterite system can be clearly estab- [5] H. Rager, Phys. Chem. Minerals 1 (1977) 371.[6] J.F. Donegan, T.J. Glynn, G.F. Imbusch and J.P. Remeika,
isdJ. Lumin. 36 (1986) 93.
[7] J.C. Walling, O.G. Peterson, H.P. Jenssen, R.C. Morris and
E. Wayne O'Dell, I EEE J. Quantum Electron. QE- 16 (1980)
Acknowledgements 1302.[8] B.D. MacCraith, T.J. Glynn, G.F. Imbusch and C.
McDonagh, J. Phys. C 13 (1980) 4211.We wish to thank H. Rager, University of M~ng,1 hs 3(90 21[9] R. Moncorge, D.J. Simkin, G. Cormier and J.A.
Marburg, FRG, for several samples of forsterite Capobianco, OSA Proc. on Tunable Solid State Lasers,used in these studies, and W.M. Yen, University Vol. 5, eds. M.L. Shand and H.P. Jenssen (1989) p. 93.
I_

Appendix 4
JOURNAL OF MODERN OPTICS, 1990, VOL. 37, NO. 4, 769-777
New materials for tunable lasers in the near infrared
J. F. DONEGAN, G. P. MORGAN, T. J. GLYNNand G. WALKERt
Physics Department, University College, Galway, Ireland
Abstract. There has been considerable recent effort aimed at realising tunablenear-infrared laser action in solid-state media. Beyond 1 pm Ni2 * and Co 2
+emisasona have been mainly studied, and laser action has been achieved in severalmaterials doped with these ions although usually only at low temperatures.Luminescence from Co' and Ni2' in the host material LiGasO5 is describedand evidence is presented for a high quantum efficiency, even up to roomtemperature. We describe also the results of our lifetime and luminescencemeasurements on the various active centres in the Mg 2SiO,: Cr laser system.
1. IntroductionRenewed activity in development of solid-state lasers operating in the 0"7-2-0 Pm
region of the spectrum has been stimulated by the achievement of laser action inalexandrite (BeAI20 4 : Cr3O), the first tumable solid-state laser to operate at roomtemperature (1]. The success of this system, tunable from 700 to 800 nm, has led to arevival of research on such phonon-,terminated solid-state lasers (2, 3]. Efforts toextend the range covered directly by primary tunable laser systems further into thei.r. are driven by specific needs for such systems, for example, semiconductorcharacterisation, remote sensing, integrated optics, communications and medicalapplications.
Much work has been concentrated on Co2+ and Ni 2+-doped materials aspotential laser media, and indeed laser action has been achieved in the range 15-1"8 pm for systems based on Ni2 [4] and in the range 1"5-2-4 pm for systems basedon Co2 + [5]. With one exception, these lasers operate only at low temperature andextension to room temperature has been inhibited by luminescence quenching (dueto non-radiative effects) and by excited state absorption (ESA) (4]. Thus the searchfor more efficient laser materials for the near i.r. region will entail the investigation ofnew host materials, the elucidation of the non-radiative processes and accuratespectrcopic analyses to identify the levels and transitions responsible for ESA. Inthis paper, we give details of the spectroscopic properties of LiGa5O,: Co 2' andLiGasO: Ni2 ÷ which are potential tunable laser media for room-temperatureoperation in the near i.r. We will also present preliminary measurements on the latestchromium-doped laser system, MgSiO4 : Cr.
tDepartment of Pure and Applied Physics, UMIST, P.O. Box 83, ManchesterM60 IQD, England.
o' 05-430 00 a• 09 Tsyiw & Prodm La
IV

770 J. F. Donegan et a].
CI:U-) C),
zi48
0+
0l 01 - z
M _V CL)
U)
MIC,
LL
- S ~ -C4

New materials for tunable lasers 771
"I *
A
CVC
, c, , a.- -' U-.04I.
$ *.a
4-4-41
C m
...
x4
G.
a.5
LA C5

772 J. F. Donegan et al.
2. Experimental results
2.1. LiGasOs:Ni2 *The spectroscopy of the Nil + ion incorporated as an impurity in various host
materials has been well studied [4,6]. Investigations of Ni2+ in MgO, MgF 2, I
KMgF 3, [6] and in fluorozirconate glass [7] show that luminescence in the visible(green and red) and infrared is observed from the Nil + ions in these materials.Referring to the schematic energy-level diagram shown in figure 1, which is typicalof the Nil' ion in oxide crystals, the strongest absorption transitions in the Ni"÷ ion 1are 3Tt( 3 P)- 3 A2 (blue), 3 T,( 3F) _-3 A 2 (red) and 3 T2 +-_3 A 2 in the nearinfrared. The visible emission originates in transitions from 1 T2 to two lower levels('T 2, 3 A 2) and the infrared emission is from the lowest excited state (3T 2) to the Iground state 3
A 2. In all these materials the fluorescence lifetime and quantumefficiency fall off rapidly with increasing temperature. This has been ascribed to anincrease in the non-radiative relaxation rate, due to multiphonon relaxation from theemitting state, which competes with the radiative decay process. In contrast to thistrend, there is only one luminescence transition in Ni2 +-doped LiGasOs, a spinel-type crystal in which Ni2 + replaces Ga3" on octahedral sites [8]. This is the3 T 2 _-.
3 A 2 transition indicated in figure 1, which consists of a broad band centredat -3 tun. Furthermore, the lifetime of the Ni2
+ luminescence remains effectivelyconstant from 15 K to above room temperature, with a decay time of 650 ps. As thetemperature is raised above about 350 K we observe a decrease in the intensity and Icorresponding decrease in lifetime. The theoretical formula for the non-radiativedecay rate, based on the single-configurational-coordinate model, provides aquantitatively correct explanation for the temperature variation of the lifetime [8]and is strong evidence of a high luminescence quantum efficiency. This material is, toour knowledge, unique in that (1) all the emission occurs in the near infrared, and (2)the emission has a high quantum efficiency at room temperature. Our samples wereflux-grown, showed non-uniform green colouration, and were of poor optical Iquality. With good quality samples, tunable laser operation in the region of 1-3 lunshould be possible.
2.2. LiGasOg :Co'2
Whereas the Ni2 ÷ ion has a strong preference for octahedral coordination, theCo02 ion has been studied in both octahedral and tetrahedral coordination [9,10]. IFor a Co2
+ ion (d7) in octahedral coordination, the fluorescence is usually from thelowest excited state (4T2) to the ground state ('T1 ) [9]. At low temperatures, thisemission is strong and provides the basis for low-temperature laser action in several ICo2'÷-doped materials, for example, MgF2 . As in the case of Nil ÷, however, theintensity falls off drastically with increasing temperature. In tetrahedral sites [10] (asin ZnO, ZnAI2O,) non-radiative relaxation among excited states is again sufficientlyrapid to make the transition from the lowest excited state, 4" 2, to the ground state, 14A2 , the most likely emission process. In tetrahedral symmetry, this transition isforbidden by electric dipole radiation. Again, our recent studies have shown that thematerial LiGasOs doped with Co2 ÷ is unusual in that emission occurs in three idistinct transitions from a higher crystal field level in this material. The emission intwo of these bands has been briefly describea previously [11]. The completeluminescence spectrum, recorded using a germanium detector, extends from 650 m-to beyond 1500 nm and is shown in figure 2. Referring to the schematic energy-level
L-

New materials for tunable lasers 773
diagram in figure 2, the crystal field in most Co2+-doped systems with tetrahedral
coordination is such that the 'E level lies lower than the 'Tr (4 P) level. However, inLiGasOs: Co2 + the 4Tt (4p) level lies below 2E and the spin-allowed transitions"Tt(4P)--'T 1 (4F), 4 T•l(P)--•4T2(4F), and '1T('P)--,A 2 ('F) can compete success-fully with the non-radiative relaxation processes from this level. At room tempera-ture, the peak wavelengths for the three fluorescence signals are respectively 685 nm,950 nm and 1-25 jun. The low-temperature lifetime of the luminescence is approxi-mately 200 ns, a very fast lifetime for a transition metal ion, and is a consequence ofthe lack of inversion symmetry in the tetrahedral site. It remains relatively constantup to room temperature but decreases rapidly between 300 K and 500 K, as does theoverall intensity of the luminescence. This system is important and interesting inthat it provides several broad transitions in the near infrared, with a common upperlevel, which could be used to obtain tunable laser action in this region.
2.3. Mg 2Sii 4 :CrForsterite (Mg2SiO4 ), like alexandrite [1], is a member of the olivine family, with
an orthorhombic crystal structure. When doped with Cr ions, it can support laseraction over a limited spectral range around 1-2 pm [12,13]. However, there is somecontroversy concerning both the Cr valence state and the sites occuppied by the Crions in this material. We have investigated the spectroscopy of this material dopedwith various levels of chromium. The complete luminescence spectrum, which isquite sensitive to the wavelength and the polarisation of the excitation [12] is shownin figure 3. At low temperatures, it consists of several sharp features at around700 nm, some broad bands at about 800 nm and 1000 am, and further sharp featuresat ll00nm. The latter broaden with increasing temperature (see figure 3) anddevelop into the lasing band at room temperature. The sharp line emission in the700nm region corresponds to the 'E--'A 2 transition on Cr 3
+ ions which replaceMg2 + ions in distinct octahedral sites, one with inversion symmetry (Ml) and onewith mirror symmetry (M2), as well as a perturbed Ml site, possibly arising fromcharge compensation. Cr` + ions in such sites have distinct ground-state splittings,measured using electron parametric resonance (EPR) [14], which areresolved in the R 1 emission at low temperature and which clearly identify the Cr3 +site. The energy-level structure for the Cr3 I ions is similar to that in alexandrite [1]and with increasing temperature the higher-lying 4T 2 level becomes populated sothat emission from this level dominates the spectrum at room temperature (figure 4).The lifetime varies from 8"9 ms at low temperature to 340 is at room temperatureand can be fitted to a purely radiative model for the emission. The variation of the
.[lifetime r can be fitted to the expressionV 1 fs+3fTexp(-AIkT)
T 1+3ezp(-4dkT)
with values of 1l4s -and l04 s-'forthe radiative ratesfs andfT from the 2E and 'Tzlevels, and 450cm- for the energy separation A between 2E and 'T2 . We find noevidencc for any energy transfer from Cr3÷ ions to the i.r. lasing centre, which wassuggested by other workers (12], or for any non-radiative component in the emissionfrom these ions up to room temperature. Despite its high efficiency, this system isprevented from lasing due to absorption by another centre (assigned by severalworkers to Cr'÷ in tetrahedral Si sites [12,13]) which is the basis for the
II
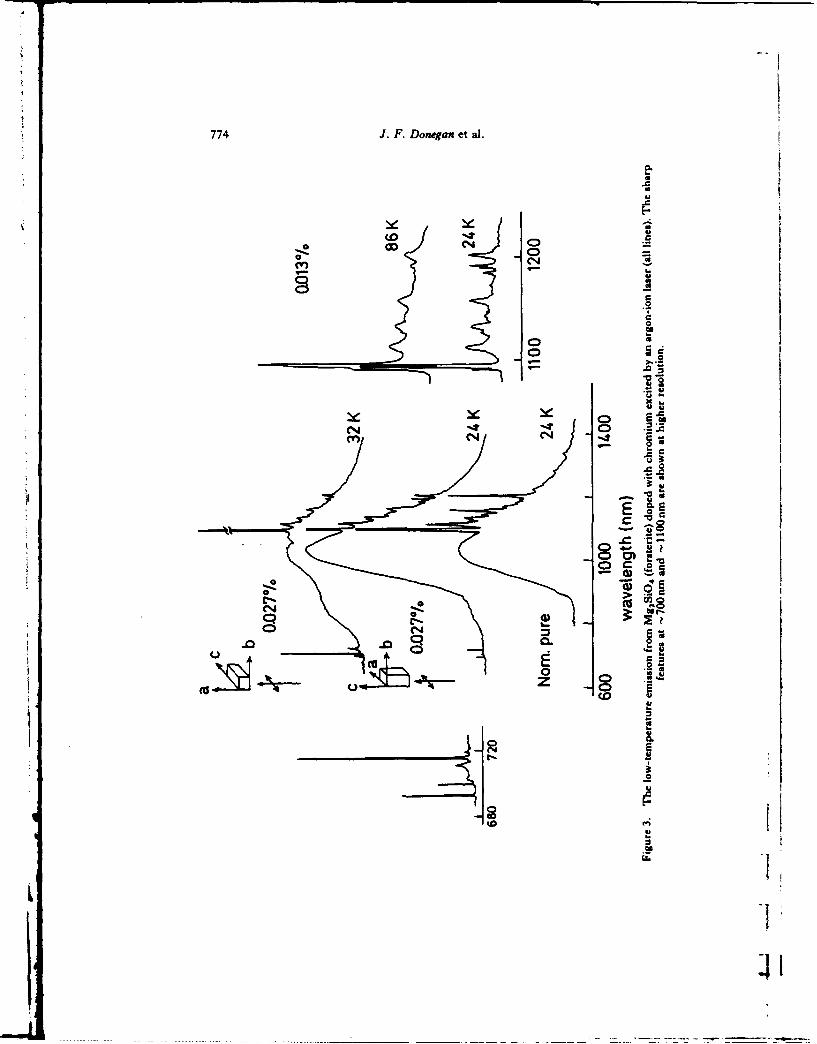
774 J.F. Donegan et al.
- S
too
(00
00
(N CD
0)
o0 >C--
.0 C-
0 Cz 0 *m C0
2

New materials for tunable lasers 775
C~CL
VV 0
CM
CD UIULn0
r
an
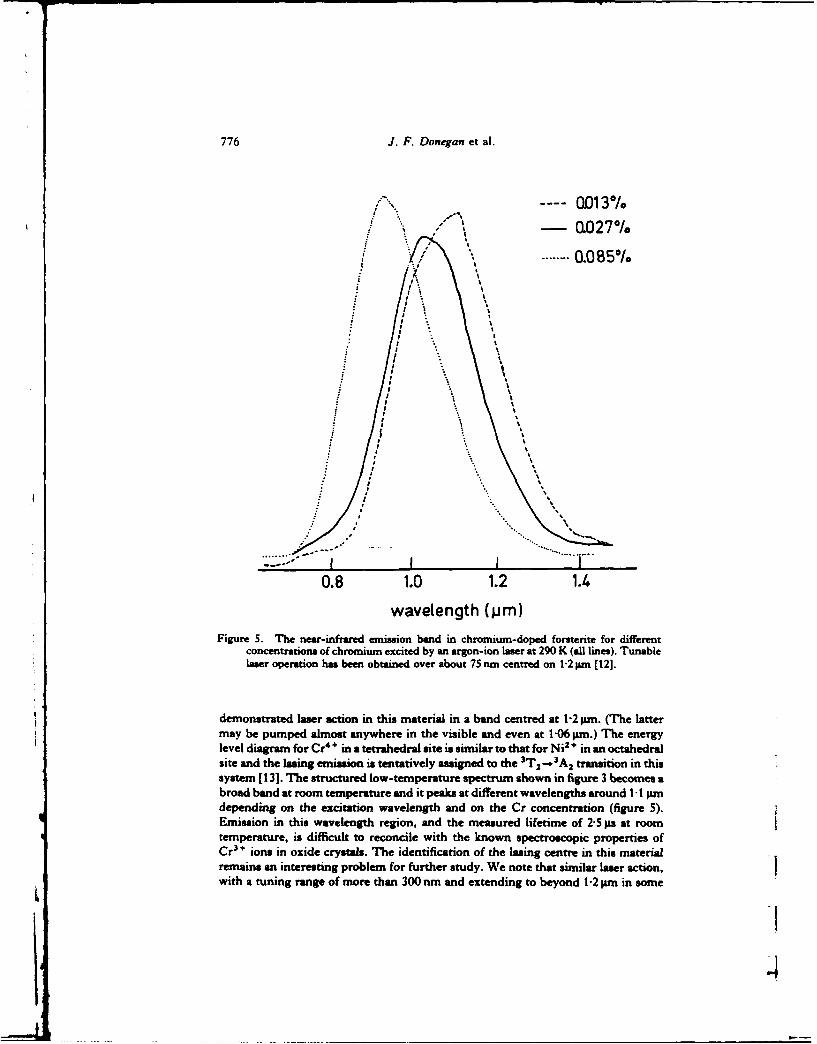
776 J. F. Donegan et al.
0013%.-0.027%I
........ 0.085"/6' "'
..... .
/ - "
0.8 1.0 1.2 1.4
wavelength (p.m)Figure 5. The near-infrared emission bend in chromium-doped foratenite for different
concentrations of chromium excited by an argon-ion laser at 290 K (all lines). Tunablelaser operation has been obtained over about 75 nm centred on 1-2 pm (121.
demonstrated laser action in this material in a band centred at 1-2 pm. (The lattermay be pumped almost anywhere in the visible and even at 1-06 pm.) T7he energylevel diagram for Cr4 * in a tetrahedral site is similar to that for NO in an octahedralsite and the lasing emission is tentatively assigned to the 3T2 _+3 A2 transition in thissystem (13]. T7he structured low-temperature spectrum shown in figure 3 becomes abroad band at room temperature and it peaks at different wavelengths around I11 pmndepending on the excitation wavelength and on the Cr concentration (figure 5).Emission in this wavelength region, and the measured lifetime of 2-5 pAs at roomtemperature, is difficult to reconcile with the known spectroscopic properties of
Cr3 ions in oxide crystals. The identification of the lasing centre in this materialremains an interesting problem for further study. We note that similar laser action,
with a tuning range of more than 300 nm and extending to beyond 1-2 pmn in some
" ] "*1
/4

New materials for tunable lasers 777
cases, has recently been reported by Kaminskii [15] in a range of Cr-doped oxide
crystals. If indeed these results are due to Cr'+ then this ion may prove to be aworthwhile laser centre in its own right whiLn can extend the range beyond that ofCr3 + in the infrared and new crystal hosts should be sought which can stabilise this
oxidation state.
3. ConclusionThe spectroscopy of three materials with potential as laser media in the near
infrared has been described. For the systems based on LiGa5 Os, further improve-ments in sample quality and additional spectroscopic studies will be necessary toassess their viability as tunable laser systems. The nature of the lasing centre inforsterite: Cr is still not established with certainty and much work remains to bedone in unravelling the many complex centres in this material. Such studies, in thisrelatively simple lattice, will provide guidance in interpreting the spectroscopy of the
more complex chromium-doped materials recently reported [15].
AcknowledgmentsThis research work was supported m part by the Air Force Office of Scientific
Research, Air Force Systems Command, USAF, under grant number AFOSR-88-0355. The Ge detector was obtained through a grant from the University CollegeGalway Development Fund which we acknowledge with gratitude. Wc wish tothank Dr H. Rager, Universitit Marburg, West Germany, for several samples offorsterite used in these studies.
References
[1] WALLING, J. C., PrTERSON, 0. G., JErssv., H. P., Momais, R. C., and O'DELL,E. WAYNE, 1980, IEEE J. quant. Electron., 16, 1302.
[2] CAIRD, J. A., PAYNE, S. A., STAYER, P. R., RAMPoNI, A. I., CHASE, L. L., and KaUPKE,W. E., 1988, IEEE J. quant. Electron, 24, 1077.
[3] MOULTON, P. F., 1986, Laser Handbook edited by M. Bass and M. L. Stitch (New York:Elsevier), pp. 203-285.
[41 JOHNSON, L. F., GUGGiENHiM, H. J., BAHNcx, D., and JOHNSON, A. M., 1983, OpticsLett., 8, 371.
[5] MOULTON, P. F., 1986, IEEE J. quant. Electron., 21, 1582.[6] VEHsE, W. E., Lia, K. H., YUN, S. I., and SiaIzy, W. A., 1975, J. Lumin., 10, 149.[7] SuzuKI, Y., SIai•x, W. A., EL BAYAUMI, 0. H., RomErs, T. M., and BENDON, B., 1987,
Phys. Rev. B, 35, 4472.[8] DONEGAN, J. F., BERGIN, F. J., GLYNN, T. J., IMaUSCH, G. F., and RamzrAc, J. P., 1986,
J. Lumin., 35, 57.[9] MOULTON, P. F., 1982, IEEE J. quant. Electron., 18, 1185.
[10] FERGUSON, I., WOOD, D. L., and vAN Urrirr, L. G., 1969, J. chem. Phys., 51, 2904.[111 DoNEGAN, J. F., BERGIN, F. J., IMsuscsi, G. F., and RaZMiKA, J. P., 1984, J. Lunun.,
31/32, 278.(12] PErTuczVaC, V., GAYEN, S. G., and ALuANo, R. R. 1,988, AppI. Phys. Lett., 53, 2590;
1989, Optics Lett., 14, 612.[13] VERDUN, H. R., THOMAS, L. M., AlNaousKAs, D. M., MCCOLLUM, T., and P-rro, A.,
1989, Appl. Phys. Lett., 53, 2593.[14] RAcGm, H., 1977, Phys. Chem. Miewals, 1, 371.[15] KAMINSKII, A., 1988, Proceedins, of the International School on Excited States of
Transition Elements (Poland, 1985) (New York: World Scientific), pp. 669-701.
t~~~__

Appendix 5
jOURNAL OFJournal of Luminescence 54 11992) 131-137North-Holland LUMINESCENCE
Infra-red luminescence of iron-doped synthetic forsterite
G. WalkerDepartment of Pure and Applied Physics. UMIST. Manchester M60 IQD. UK
T.J. GlynnPhysics Departmnnt, University College, Galway. Ireland
Received 29 January 1992Revised 23 March 1992Accepted 25 March 1992
Luminescence spectra of an iron-doped (0.2%) synthetic crystal of forsterite have been measured at low temperature (15 K).These show several zero-phonon lines at 813. 1025, 1093 and 1134 nm, all with phonon side bands. The emission at 1093 nm isdue to chromium (Cr'÷) and occurs also in both nominally pure crystals and chromium-doped samples. However, the 813 nmline is ascribed to Fe * ions, probably in tetrahedral (Si) sites, on the basis of the measured lifetime (15.5 ± 0.5 ms) and theanalysis of excitation spectra. The 1025 and 1134 nm lines have measured lifetimes of 8.4 and 5.7( ± 0.5) pa respectively at 20Kand are similar in other respects. It is suggested that these lines may be due to Fe-* ions in octahedral (Mg) sites.
1. Introduction naturally occurring feldspars, usually substitutingfor Al3 + or Ga 3 . Luminescence from tetrahedr-
Recently, chromium-doped forsterite (Mg 2SiO,) ally coordinated Fe3 + is more common [8-11], buthas been shown to exhibit tunable laser action in emission from octahedrally coordinated Fe3 ' hasthe near infra-red, in the range I100-1300nm, and also been reported (12-14]. On the other hand,consequently has been the subject of extensive stud- reports of Fe2 + luminescence are comparativelyies [ 1-6]. Although Cr3
+ emission is evident in this rare; emission from tetrahedrally coordinated Fe" +material, the emission responsible for laser action in 111-V semiconductors has been reported atin the near infra-red is thought to be due to Cr'÷, around 3000nm [15,16] but emission bands as-an unusual valence state of chromium, substituting cribed to Fe" +in various other host materials mayfor Si (1-6]. Apart from a detailed study of Mn2 have other origins. However, absorption spectra ofluminescence in forsterite (7], there are few, if any, Fe2" in olivines (of which forsterite is a relativelyreports of luminescence of other transition-metal iron-free variety) have been studied in detailions in this host material. Here we present spectra [17,18] but usually in samples with high concentra-of an iron-doped forsterite (0.2 wt% Fe) and pro- tions of iron ranging from a few percent to overvide evidence of infra-red emission from both Fe 90%. Strong broad absorption bands in the rangeand Fe÷ ions in this material. 800-1400 nm have been assigned to Fe2 ÷ ions in
Fe3 ÷ is known to exhibit emission in the red or both metal cation sites (M I and M2; the mostnear infra-red in a variety of materials, including prominent peak close to I •ma is due to Fel * in M2
sites.
Coe""Poeme to. Dr. 0. Walk.. epe"ma 0f Pure AM Olivines show very weak absorption in the rangeApplied Physics. UMIST. Manchester M60 IQD. UK. 550-800 nm, but show strong absorption in the
0022-2313/92/S(0.00 r. 1992 - LMvias Saesc• Pubsishm RV, All rights remrved

132 (G WIalker. F.J. Glynn Inlra-red hunmnesc'nce of iron-doped .Ynthem"l oIrsterite
blue and UV due to charge transfer bands. There cathodoluminescence. Luminescence emissionare also some sharp spin-forbidden transitions in spectra were measured at various temperaturesthe blue region which have been assigned to both down to about 15 K using a closed-cycle heliumFe2 and Fe3 ÷ by various authors. cryostat. Excitation was by means of either an
argon-ion laser (458, 488 or 515 nm lines) or anargon-ion pumped dye laser (616 nm), at powerlevels ranging from 50-500 mW. A I m grating
2. Cation site symmetries spectrometer was used and detection was by either
Both the degree and type of distortion exhibited a cooled germanium detector (North Coast Optical
by the available cation sites in forsterite from Co.) or by a cooled photomultiplier with an SI typesimple cbilc a stetrahe sa or fotahedral)sterterom photocathode. Lock-in amplification was em-simple cubic (tetrahedral or octahedral) symmetry ployed for spectral measurements but photon-
have a pronounced effect on the energy levels of coutn tech uan asmuntscaue analyse
substitutional transition-metal impurities. The counting techniques and a multichannel analyserwere used for lifetime measurements with the SIcrystal structure of forsterite is well-known and has photomultiplier. Excitation spectra of the long-
been described many times elsewhere (19,20]. It lived emission were determined using a "double-
belongs to the orthorhombic space group Pbnm chper echnique a nd a sxno a oubg-
and consists of separate silica tetrahedra linked by sten-halogen lamp as a continuum source as de-
divalent metal cations (Mg2 + in the case of pure sced elsew [7].
forsterite) in two inequivalent, distorted octahedral scribed elsewhere [7].
sites. The smaller of these, usually designated Ml,retains its centre of symmetry and has Ci pointsymmetry. The slightly larger M2 site retains a mir- 4. Emision and excitation spectra of Fe" inror plane and is of C2 symmetry although a C2, forsteritepseudosymmetry has been found to be useful inspectroscopic analyses of polarised spectra of When excited by 200mW of the 488 nm argon-Mnz÷ [7]. The Si tetrahedral site is also of C2 ion line, the overall emission spectrum between 700symmetry, but is much smaller than the octahedral and 1400 nm at 15 K shows what appears to be atM I and M2 sites in terms of bond lengths [20]. The least four separate zero-phonon lines plus phononremoval of degeneracy from the E and T states of side bands. In addition there is a very broad emis-simple cubic symmetry is therefore to be expected sion band underlying these with a maximum atand in view of the degree of distortion quite large around 1100 nm (9100 - '). The first of thesesplittings may occur. apparent zero-phonon lines with side band is at
813nm (12300cm-') and is shown in detail infig. 1(a); it persists with decreasing intensity up to
3. Experimental at least 200 K. Lifetime measurements at 20K re-veal that this emission line and its phonon side
The iron-doped single crystal studied was kindly band have a lifetime of 15.5 ± 0.5 ms. However,provided by Dr. Rager of the University of lifetime measurements and phase-tuning experi-Marburg, Germany. The crystal was clear with a ments in which the strong zero-phonon line isslight yellow tinge and measured approximately phase-tuned out to give a zero or even negative3 x 4 x 7 mm after cutting and polishing; the crys- signal show that there are two other weaker peakstallographic axes were roughly parallel to the crys- at 850 and 866 nm (11770 and 11550 cm- 1) whichtai edges. A similar undoped colourless crystal was are buried in the phonon side band of the 813 ronalso studied for comparison purposes and found peak (fig. I(b)). These weaker peaks have muchto contain trace amounts of chromium and manga- shorter lifetimes and, although these are difficult tonese which gave rise to luminescence emission measure accurately, they are certainly of the orderalthough the manganese was only evident in of I ins.
I

G.J.Wk. riJ. (;-inn Ifra-rcd h, siiecenc'e oIiron-doped s.inthet"i ufrrsterite 133
relative to the lower energy component withincreasing temperature indicates that excited
15K state splitting rather than ground state splitting isresponsible. In view of the large number of knownphonon modes in forsterite [21], it is difficult to
'OKA. determine whether the side band contains severalphonon replicas or is a single-phonon side band.However, since nearly 40% of the emission inten-sity is in the zero-phonon line, the Huang-Rhysfactor is around unity and the side band is probably
, 812 s single-phonon. The long lifetime is clearly indica-tive of a spin-forbidden transition; there are threeobvious impurity ions which could be responsible,namely Cr 3", Mn 2` and Fe' 4 . However, the813 nm line and side band are not evident in thespectra of nominally pure (i.e. undoped) sampleswhich show evidence of trace amounts of chro-
__mium and manganese, nor in chromium or nickel-800 8so 90Onm doped samples. We therefore assign this emission
to Fel +, although the Huang-Rhys factor is unusu-b)-• ally low for a d-d ion. Electron spin resonance
Kmeasurements carried out on this and similar crys-50Ktals [22.,23] indicate that Fe" is present in both
octahedral (mainly M2) and tetrahedral (Si) sites, inroughly equal amounts. The spectral position of theemission suggests that either the Fe3 + ion is ina small tetrahedral site or a large octahedral site; i.e.the emission could be due to Fe3 in either of the
j .. sites in which it has been detected by ESR. In order800 850 9OOnm to gain more information on this point a lumines-
Fig. L (a) Emission spectrum of Fe÷ at 15 K showing a strong cence excitation spectrum of this emission was de-zero-phonon peak at 813 nm. 200rmW of 488 nm excitation was termined and is shown in fig. 2 The spectrum, al-used, chopped at a frequency of 7Hz. The insert shows the though showing many of the sharp features asso-zero-phonon peak to be a temperature dependent doublet at this ciated with d' ions, does not give the usual dearresolution (0.2 nm). The phonon side band overlaps two further indication as to the site occupancy of the d' ion.zero-phonon peaks indicated by arrows at 850 and 866 nun.These peaks are more evident when the excitation is modulated However, the very strong sharp peak at 405 nmat a higher frequency (e.g. 90 Hz) for which the main emission (24 690cm - ') which shows signs of being a doublet,suffers attenuation. (b) Phase-tuned spectra in which the main is similar to the dominant 'E(D) peak present inzero-phonon peak is almost phase-tuned out on the lock-in the excitation spectra of tetrahedrally coordinatedamplifier giving a small negative signaL The 850 and 865nm Fe' in feldspars, aluminates and other material&peaks show a positive signal indicating a significantly different
lifetime from the main emission. The problem is locating the 4E(G), 4A1 (G) stateswhich do not give rise to very sharp peaks in thespectra of tetrahedrally coordinated Fe 3
+ as theydo in spectra of octahedrally coordinated Fe3 andMn 2 ÷ [10,13]. The sharp features at 616nm
Higher resolution spectra show that the primary (16230cm'-) are unlikely to be associated withzero-phonon line at 813 am is at least a doublet: these states: the depression of the Racah pant-the higher energy component increases in intensity meters B and C from their free-ion values would
L

134 G. WL aiker. TJ. GI mn Iorta-re'd I,,iinescence ,, iropi-daped wrzhetic forsterfte
S[ 0 -
S"~,:ixoo
0F
2042
+2X10 4 A 42 ýE
+2 E (kKi [4
400 Soo 600 700 800 nm |n
Fig. 2. Excitation spect--u of the Fe3 ÷ f813 n,,m) ei-iion. Thespectrum is corrected for spectral variations in excitation inten-sity. and was evaluated from spectra using either a xenon arc or 0 .tungsten halogen source. A photomultiplier with an extended 0 2 I. 6 8 10 100q (kKI
S20 response was used for detection with either a Wratten 87filter or 820nm interference filter (FWHM 40nm). Fig. 3. A d- ligand-field diagram for Fe3÷ in forsterite with
Racah parameter values of B= 726 cm - I and C = 2470 cm. -',and evaluated using cubic strong-field matrices. A best fit toexperimental values is obtained at 10Dq = 8000 cm -. (The
have to be very large indeed. If the emission was in unit I kK = 1000 cm - 1.) However, because of distortions fromfact due to Fe3 + in the large octahedral M2 sites, cubic symmetry, the T states ame split and the positions of thea large depression from free-ion values would not lowest split levels for the first two excited states are shown, thebe expected. For example, the 'E (G), 4 A I (G) peaks double-ended arrow indicating the transition energy of the zero-in the absorption spectrum of Fe3 in andradite phonon line as measured in emission and excitation. Another
arrow shows the position of the probable zero-pbonon line ofgarnet occur at about 450 nm .(22 200 cm - () [24], the lowest component of the 'T2 (G) state as shown in excitationand even in tetrahedral sites the corresponding spectra (see fig. 2).transitions occur in the region 450-480 tm(22200-20800cm- t ) [8-11]. In view of the smallHuang-Rhys factor the sharp peaks at 616 nm may The possibility that the excitation spectrum ofbe zero-phonon lines connected with the split 'T 2 fig. 2 could be a composite one, involving morelevel. The d- spectrum could then be that of Fe3 ÷ in than one type of centre, was also explored by usinga tetrahedral (Si) site. A best fit to a ds ligand-field different isolation filters, different optical choppingdiagram was therefore attempted using cubic, frequencies and looking for any temperature de-strong-field matrices on the basis of the assignment: pendence of the spectrum, no evidence was found to'E(D)-405 nm (24690cm-), "'A, 'E(G)- 510 nm support this contention. A further possibility is that(19610cm- '). Such an analysis gave values for the some of the features on the excitation spectrumRacah parameters B and C of 726 and 2470 cm may be due to Cr"' absorption, since the 1093 nm
* respectively and a ligand-field strength 10 Dq of (9150acm-') fine in the emission spectrum has beenaround 8000 cm - I using "centre of gravity" values ascribed to this ion (see below). Nevertheless, nonefor the positions of the split 4T, and 4T2 states of of the major sharp spectral features in this spectrum13300 and 17200cm-' respectively (see fig. 3). can be correlated with such features in the Cr'*
Attempts to obtain a reasonable fit using several absorption spectrum [4,5]. As for the other appar-other possible assignments proved unsuccessful. In ent zero-phonon fines at 850 and 866 nm, theseparticular, it proved difficult to make a sensible could be either satellite lines due to crystal in-assignment that yielded a value of 10Dq high homogeneities or tetrahedrally-coordinated Fe3 'enough to be compatible with octahedral coordina- adjacent to point defects. However there is also thetion of Fe3 *. possibility that one or both could be associated
*_l.
Imi t ll la " I _ m • i I .. I

G. Walker. T.J. Glvin Inilra-red Ianines'ence of iron-doped switletc fortIerite 135
with Fe3 ions in octahedral coordination. The at 20 K suggesting that these are spin-allowed850 nm line also shows doublet character at higher transitions and therefore are unlikely to originatetemperatures (fig. l(c)) but the somewhat shorter- from Fe3 ions. Electron spin resonance measure-lived 866 nm line disappears at such temperatures. ments suggest that most of the iron present in the
crystal is in fact in the Fe2 + rather than the Fe3
valence state [23] and, as already mentioned, Fe2
ions are to be found in both M l and M2 sites.5. Emission spectra of Fe-doped forsterite in the Emission from Fe2
+ ions in any host material is notregion 900-1300 nm a common event. Nevertheless, the luminescence is
in a spectral region where Fe2 + emission might beAt temperatures below around 100 K there ap- expected on the basis of known absorption spectra
pear to be at least three zero-phonon peaks with of Fe2 + in olivines. We might expect emission from
side bands and an underlying broad emission band Fe2+ in the M2 site to be the more intense on
between 900 and 1300 nm (see fig. 4). The peak at account of the lack of inversion symmetry. It is1093 nm can be recognized as the emission which tempting to ascribe the 1025 and 1134 nm emissionhas been ascribed to chromium (in fact to Cr4 + in lines to Fe" in MI and M2 sites. However, al-Si sites [1-6]). This peak is, as previously shown though the evidence suggests that these emissions[4], at least a triplet. It also occurs in spectra of the may be due to Fe" + in octahedral sites, the actualnominally -pure" crystal as well as in chromium- sites of occupation cannot as yet be ascertained.doped crystals. The underlying broad band may Further evidence that Fe2
+ centres may be respon-also be due to chromium - possibly Cr3
+ in low- sible is found by varying the wavelength of excita-field sites. However, the other sharp peaks at 1025 tion. The 1025 and 1134rnm emission lines are effi-and 1134 nm (9756 and 8818 cm-') are peculiar to ciently excited by the 458 nm Ar* line whereas thethe iron-doped crystal. Decay time measurements chromium emission at 1093 nm is difficult to detectyield lifetimes of 8.4 and 5.7 ( + 0.5) js respectively at this excitation wavelength. Excitation at 488 nm
is less efficient but the Fe-related emission lines arestill much stronger than the chromium line (seefig. 4). However, with 515 nmn excitation the chro-mium line is stronger than the Fe-related lines
1 K which are now much less efficiently excited (-2 cf.
488 nm excitation) although the relative intensitiesof the 1025 and 1134 nrm lines appear to be indepen-dent of excitation wavelength in this region. Usingdye laser excitation at 616 nut the 1025 and
C 1134 nm emission lines are entirely absent from thespectrum which is then dominated by Fe3
+ andchromium emission. Fe' 2 absorption is very weakat this wavelength and increases as the wavelengthbecomes shorter, in agreement with the knownabsorption spectrum of Fe2 + in olivines. Excitation
1000 1100 1200 am spectra, particularly polarised spectra, of the 1025
Fig. 4. The emission spectrum of Fe-doped rorsterite at 15K in and 1134nm lines would be very helpful but thesethe range 1000-1250 nm using 488 nm excitation. The peak due are difficult to obtain using techniques presentlyto chromium is not evident if 458 nm excitation is used instead available.but becomes the dominant peak when 515 nm excitation is High-resolution emission spectra of the zero-ema.ployed. A cooled germanium detector was used. Intensitiesare not corrected for spectral response of the instrumentation phonon lines were measured at different temper-but the latter shows only a weak spectral dependence over this atures between 15 and 100 K. The 1134 nm line was
range. found to have at least four components but may
I
!

)3h G. |i iia•al'r. T.. G(vnn Inltra-r'd olhiIt'tc/lce i ronl-dopet'd sintlh Ior.mlerl•t
ED5E D}- 5Ty,,D). However, there is evidence fromIa) absorption spectra that the degeneracy of both the
5E and 5T 2 states are removed by the distortionsfrom octahedral symmetry and, as previously in-dicated, this is to be expected from the known sitesymmetries. Excitation spectra of Mn 2- in M2 sitesin forsterite also indicate appreciable splitting of
70K octahedral states in this site [7]. Furthermorespin-orbit splitting of both excited and groundstate could result in a large number of components.
15K Both excited and ground states are quintets butalthough the spectra indicate a possible quintetexcited state, they give no indication of appreciableground-state splitting. There is little in the literat-
1130 1132 M43. n. ure that is of help: Fez + ions in III-V semiconduc-tors are in tetrahedral coordination aWv hence the
W ground state and first excited state are re,r-rdwith respect to octahedral coordination. However,a detailed analysis of the 'E-'T 2(D) luminescencetransition of tetrahedrally coordinated Cr2 inGaAs at 1476 nm has been done [25]. This analysis
/ 0 makes it clear that only very high resolutionspectra at very low temperatures can resolve thefine details of spin-orbit split states. Nevertheless,
5K'ý there is a degree of similarity in the splitting found.The phonon side band of the 1025 nm line has only
1023 1025 1027 nm. one clearly discernible peak at about 160cm-t.
Fig. 5. Fine structure of (a) the 1135 nm and (b) the 1025 nm However, the side band of the 1134 nm line is morezero-phonon emissions showing the variation with temperature detailed with apparent phonon modes at 140, 170,of the intensity ratios or'component peaks. Note the similarity of 210, 340 and 440 cm As mentioned before, it is
(a) and Mb) although the overall splitting is larger in (al. difficult to deduce much from the phonon sidebands on account of the many possible modes inforsterite except to note that modes of frequencyhigher than about 400 cm -I do not involve metal
contain more features which are unresolved (fig. 5). cations but are vibrational modes of the silicaThe increase in relative intensity of the higher tetrahedra.energy (shorter wavelength) components with in-crease in temperature indicates excited-state split- Iting rather than ground-state splitting. In fact. thereis little evidence of any appreciable ground-state 6. Conclusions
splitting at this resolution (2 cra-t). The 1025 nm Iline appears to have a similar excited-state splitting The 813 nm emission line and associated phononbut the resolution of the spectrum reveals only side band are due to Fe" ions, most probably inthree definite components although there is a hint tetrahedral (Si) sites, the long luminescence lifetimethat four or five components may be present as in being indicative of the spin-forbidden nature ofthe 1134nm line. transitions on d' ions. The excitation spectrum of
The transition responsible for the emission in this emission is consistent with that of a d' ion inFe2 in the pure octahedral case would be a tetrahedral site and calculation of the cubic
I1

G. Walker. TJ. Glown Infra-red lumnnestence ti irrn-doped synthetic /orsterle 137
ligand-field parameter 10 Dq based on likely band College Galway Development Fund which weassignments provides further evidence that Fe 3
+ gratefully acknowledge.ions are responsible. Although the zero-phononline persists up to around 200 K. it is not evident atroom temperature and the emission suffers temper- Referencesature 4 uenching, as is usual for Fe 3 +, beginning atabout 100 K.
Well-defined phonon modes in the single- [I] V. Petricevic, S.K. Gayen and R.R. Alfano. Appl. Phys.Lett. 53 (1988) 2590.phonon side band up to 700 cm •' are compatible [2] H.R. Verdun. LM. Thomas. D.M. Andrauskas, T. McCol-
with tetrahedral coordination in a Si site. Other lurn and A. Pinto, Appl. Phys. Lett. 53 (1988) 2593.minor emission peaks, which are masked by the [3] R. Moncorge. G. Cormier. DJ. Simpkin and J.A.side band, are also probably due to Fe3
+ in other Capobianco. OSA Proc. Tunable Solid State Lasers, 15(1989) 93; IEEE J. Quantum Electron. 27 (1991) 114.environments, the lifetimes also being fairly long [4] W. Jig, H.L. Liu, S. Jaffe and W.M. Yen, Phys. Rev. B 43
(- ms). (1991) 5234.The origins of the 1025 and 1134nm lines and [5] H. Rager. M. Taran and V. Khomenko, Phys. Chem.
side bands are less certain but the experimental Minerals 18 (1991).evidence so far points to the possibility that Fe2 * [6] TJ. Glynn, G.F. Imbusch and G. Walker, J. Lumin. 48&49
ions in octahedral sites may be responsible, The (1991) 541.[7) G.R. Green and G. Walker. Phys. Chem- Minerals 12
two emission lines have a number of features in (1985) 271.common, similar but not identical lifetimes, [8] G.T. Port and B.D. McNicol, J. Chem. Phys. 56 (1972)similar spectral absorption characteristics, and 5246.
similar, but again not identical, zero-phonon split- [9] CZ Van Doom. D.J. Schipper and P.T. Bolwijn. J.ting patterns. These are in contrast to the com- Electrochem. Soc. 119 (1972) 85.pletely different properties of the Fe3 emission in [10] DJ. Teller and G. Walker, Nature 258 (1975) 694; ModernpeyGeology 6 (1978) 199.these respects. [11) C. McShera, PJ. Colleran, TJ. Glynn. G.F. Imbusch and
J.P. Remeika, I. Lumin. 28 (1983141.[12] G.T. Port and B.D. McNicol. J. Lumnin. 6 (1973) 225.[13] DJ. Teller and G. Walker, J. Lumin. 11 (1976) 315.
Acknowledgements [14] G. O'Connor, C. McDonagh and TJ. Glynn, J. Lumin.48&49 (1991) 545.
We are greatly indebted to Dr. H. Rager of the [15] W.H. Koschel. U. Kaufmann and S.G. Bishop, Solid State
University of Marburg, Germany, for the provision Comm. 21 (1977) 1069.rforstep o "(16] SG. Bishop, DJ. Robbins and PJ. Dean. Solid State
of both doped and undoped crystals of forsterite, Comm. 33 (1980) 119.and for ESR spectra and other information regard- [17] R.G. Burns, Mineralogical Applications of Crystal Fielding these crystals. We thank Prof. G.F. Imbusch for Theory (CUP, 1970).
encouragement and helpful discussions and [18] WA. Runciman. D. Sengupta and J.R. Gourley, Amer.Mineral. 58 (1973) 451; 59 (1974) 630.Dr. G. Morgan for discussions regarding exper- [19) J.D. Birle, G.V. Gibbs. P.B. Moore and J.V. Smith. Amer.
mental lifetime measurements. We are also grateful Mineral 53 (1968) 807.to B. Kelly, D. Staunton and P. McBride for experi- [20] JR. Smyth and R.M. Hazen. Amer. Mineral. 58 (1973) 588.mental assistance at various stages of the work. [21) K. lishi. Amer. Mineral. 63 (1978) 1198.
This work was supported in part by the U.S. Air [22) J.M. Gaite and S.S. Hafner. J. Chem. Phys. 80(1984) 2247.Force Office of Scientific Research under grant [23] H. Rape. private communcation.
[24) 1.G. Burns. Can. Spectrosc. 17 (1972) 51.number AFOSR-88-0335. The germanium detector [25] F. Voillot. J. Barrau. M. Brousseau and J.C. Brabant.was provided through a grant from the University Phys. Stat. Sol. (a) 64 (1981) K39.

t4AMUNOTliC
THIS DOCUMENT IS BEST
QUALITY AVAILABLE. THE COPY
FURNISHED TO DTIC CONTAINEDA SIGNIFICANT NUMBER OF
PAGES WHICH DO NOT
REPRODUCE LEGIBLY.