
AD-A194 438 EFFECTS OF RATING DELAY AND TRUE HALO …Rating Delay Borman (1983) reviewed and...
55
AD-A194 438 EFFECTS OF RATING DELAY AND TRUE HALO IN LABORATORY-BASED PERFORMANCE EVALUATIONS(U) AIR FORCE INST OF TECH WRIGHT-PATTERSON AFB OH R S TALLARIGO UNCLASSIFIED 1987 F/G 5/8 NL EhllllllllllE EllhllllhllllE EIIIIIIIIIIIIE ElllIhllIIII
Transcript of AD-A194 438 EFFECTS OF RATING DELAY AND TRUE HALO …Rating Delay Borman (1983) reviewed and...

AD-A194 438 EFFECTS OF RATING DELAY AND TRUE HALO INLABORATORY-BASED PERFORMANCE EVALUATIONS(U) AIR FORCEINST OF TECH WRIGHT-PATTERSON AFB OH R S TALLARIGO
UNCLASSIFIED 1987 F/G 5/8 NLEhllllllllllEEllhllllhllllEEIIIIIIIIIIIIEElllIhllIIII

1111 1.0as.
I'L1.6
INE ,

00m QILL4
EFFECTS OF RATING DELAY AND TRUE HALO
IN LABORATORY-BASED PERFORMANCE EVALUJATIONS
Richard S. Tallarigo
Air Force Institute of Technology/
Bowling Green State University
RUNN"NG HEAD: RATING DELAY S EL C 0
1 8842-- -P-ll

Author Notes
The guidance and assistance of William K. Balzer throughout this
project is gratefully acknowledged. Many helpful comments and
suggestions provided by Sebastiano Fisicaro are also appreciated.
Leslie Hamier's diligent help with data collection was
instrumental in the timely completion of one phase of this study.
Special thanmbs are due Dr. Nancy Shafer of the Bowling Green
State University Statistical Consulting Center for her expert data
analysis programiing assistance.
This paper is based on a research project by the author as part
Of graduate studies in Industrial/Organizational Psychology, Bowling
Gr~en State University.
Commerit. and conclusions in this paper are those of the author
and do not reprt.sent official positions of the United States Air0Force.
4.
Acuession For
NTIS G~R&DTIC TAB 0Uuannounaed 0
IF Avalpbiit Codes
Avall aav/orDIst Special
% r*~% .j

2Rating Delay
Abstract
Intervals of rating delay (immediate, one-day, two-day, seven-day)
and levels of true halo (i.e., the median intercorrelations among
criterion scores on the performance dimensions) were examined for
effects on rater errors, rater accuracy Cronbach, 1955), and
c'n\'ergent/discrimi narit validity. Raters were 293 undergraduates.
Relationships among rating outcomes were also examined. Interactions
betweern delay intervals and true halo (TH) were found for
Differential Elevation (DEL) accuracy, and the rater errors of
Obsern d Halo (OH) and Restriction of Range (ROR). These
interactions suggested that (a) TH was positively correlated with
DEL in the one-week delay condition but not in shorter intervals,
Cbi with increased rating delay, the correlation between TH and OH
decreased, and (c) with increased rating delay, the correlation
between TH and ROR decreased. Additional analyses indicated that TH
s positively correlated with and predicted convergent validity.
Relationships among rater error and rater accuracy scores indicated
that observed leniency, OH, and ROR were not uniformly related to
accuracy in predicted directions. It was concluded that the delay
intervals studied had minimal independent influences on rating
outcomes and that rater "error" measures could not in all cases
serve as meaningful measures of rating inaccuracy. Levels of true
halo in rated performances need to be considered as well.
I

3Rating Delay
Effects of Rating Delay and True Halo
in Laboratory-based Performance Evaluations
An important aspect of performance ratings is their dependence
on a rater's memory for ratee work performance (Barmes-Farrell &
Couture, 198.1; Bernardin & Beatty, 1984; Murphy, Balzer, Lockhart, &
.iennkin, 1985; Nathan & Lord, 1983; Smither & Reilly, 1987). The
imiprtance of studying memory-based ratings is evident considering
typical rating environments, where evaluative ratings can be made-- a
days, weeks, or months after observed performance (Landy & Farr,
1980). A numnbr of' rating outcomes could likely be affected when a
A' ,rater depends upon his/her memory for a ratee's performance. These
=a-."t include rater errors surh as systematic distortion (SD), leniency,HNrfstriction of range, and halo. Other outcomes such as interrater
a'
agreement/convergent validity and discriminant validity may alsoa.
logically he affected by reliance on memory for performance.
Moreover, when criterion scores for ratee performance are available,
it becomes possible to estimate (a) rating accuracy, (b) levels of
halo and leniency error (as deviations from true halo and true
leniency), and (c) the relative influence of implicit covariance
theorieg versus true levels of performance on performance ratings.
In addition, when multiple sets of ratees are evaluated by multiple
' sets of raters, true intercorrelation among the rating dimensions
(i.e., true halo) becomes a variable and its effects on rating
accuracy and rater errors may be examined.
etg *~p ~ aa ~

4
Rating Delay
Systematic Distortion (SD) is a rater error which refers to
biases in memory-based ratings such that correlations between rated
dimensions occur in the direction of the implicit covariance theory
(IMT) of the rater (Borman, 1983; Cooper, 1981a, 1981b). ICT is an
individual characteristic which describes a rater's inferences or
beliefs about how performances in specific rating categories are
likely to covary among ratees. ICT has its roots irn implicit
personality theory research and early studies of halo and logical
error (Borman, 1983; Bruner & Tagiuri, 1954; Ilgen & Favero, 1983;
Npweoimb, 1931; Schneider, 1973; Thorndike, 1920). While SD has been
found most frequently when ratings are made under difficult memory
conditions, lack of job knowledge and/or ratee familiarity (e.g.,
XozlIowski & Kirsch, 1987; Kozlowski, Kirsch, and Chao, 1986) have
also lee, associated with the presence of SD. It is not clear,
however, w:hat minimum intervals of rating delay are necessary for SD
to occur. In studies which have reported SD effects, rating delays
have ranged from one-day (Murphy & Balzer, 1986) to several weeks
(Shweder, 1975), to six months (Kozlowski & Kirsch, 1987).
An outcome thought to be the source of SD of ratings is halo
0 (Cooper, 1981a). Although its conceptual definition as a failure to
discriminate among rating dimensions is relatively consistent (Saal,
Downey, and Lahey, 1980), its operational definitions are numerous.
U Pulakos, Schmitt, and Ostroff (1986) showed that, as measures of
halo, the average standard deviation across rating dimensions is
equivalent to the average interdimension correlation when ratings
are first standardized within dimensions. They recommended the use
I4

* 5* Rating Delay
of each rater's average observed intercorrelation among the
dimensions as a measure of halo. As Pulakos et al. (1986) pointed
out, this measure of halo will always be perfectly correlated with
halo error, with halo error defined as the difference between
ob .rved and true dimension intercorrelations. True dimension
intercorrelations are computed using criterion true scores for each
rate--, on each of several performance dimensions. True halo is a
constant when all raters view the same ratees. It is not clear,
though, what general relationship may hold between observed halo and
halo error when raters view different sets of ratees, and the
relatiynships are examined across all raters. Furthermore, because
halo errors may be either positive or negative, another meaningful
measure of halo is the absolute value of halo error, or absolute
halo error (AHE; Fisicaro, 1987). AHE provides an overall index of
the amount of halo error present in ratings independent of direction
of the error. Halo Error, on the other hand, provides information
about both the direction (positive or negative) and the intensity of
the halo error.
The rater error measures of leniency and restriction of range
* have also been commonly applied to performance ratings. Leniency has
"N usually been defined as mean ratings above the scale midpoint. The
*central idea of leniency, according to Saal, Downey, and Lahey
* (1980), is that ratings are consistently too high or too low
(severity). Restriction of range is commonly defined as the average
of the standard deviations of ratings across ratees (Saal, Downey,
and Lahey, 1980). Where leniency reflects a level effect, range
." U" p m - . ,

6Rating Delay
restriction reflects a rater's ability to discriminate among
different ratees.
Additional rating outcomes relevant to performance ratings
include convergent and discriminant validity. Convergent validity
indicates the overall amount of agreement on ratees across raters
ari, dimt. nisioxis; and discriminant. validity indicates the extent to
w,'hich raters distinguish among performance dimensions (Kavanagh,
-iacEinne.-, arid Wolins, 1971).
* Rat er acuracy measures examined in the present study were
dr-scribed by (ronhach (1955) and Gage and Cronbach (1955) and used
erequentl. in performance evaluation research when criterion true
.cores are available. Cronbach (1955) demonstrated that. a measure of
th,. overall distance from criteria when a rater evaluates multiple
ratees onm multipl- dimensions consists of four components: Elevation
(El-), Differ'ential Elevation (DEL), Stereotype Accuracy (SA), and
Diffrent ial A-curacy (DA). In general terms, EL is a measure of the
closeness of a rater's grand mean of ratings to the grand mean of
criterion scores. DEL reflects how closely a rater's overall ranking
of ratees corresponds to the ranking based on criterion scores. SA
indicates how accurately a rater ranks the dimensions across ratees.
Finally, DA indicates hot, accurately a rater can distinguish among
ratees within each dimension. Operational definitions of all the
rating outcomes used in this study are presented below in the Method
Vsection.

7
Rating Delay
With the exception of Systematic Distortion, the rater error
and accuracy measures described above are frequently used and their
measurement is rather well standardized. Tht SD measure, however,
has not been frequently utilized as a rater error measure per se;
and its measurement varies from study to study. Consequently,
add itional lackground to the SD concept is presented below and a
measuremert meth(. is described in some detail.
What is Systematic Distortion?
The s\vstematic distortion hypothesis (SDH) predicts that traits
which are semantically or conceptually similar will be recalled as
if' they c.ovaried (Shweder & D'Andrade, 1979). In numerous studies,
wher judgmental ratings were made after varying retention intervals,
the covariance structure of the memory-based ratings (average across
raters) was more similar to the raters' averaged pre-existing
covariance beliefs than to the actual covariance structure of the
target behaviors (D'Andrade, 1974; Shweder, 1975, 1977, 1980, 1982,
1983; Sht.weder & D'Andrade, 1979, 1980; cf. Lamiell, 1980).
Similar results were found in studies of leadership behavior
ratings (Lord, Foti, & DeVader, 1984). Subjects distorted leadershipratings to be consistent with the memory schemata manipulated by the
experimenters (Phillips & Lord, 1982). In these studies, SD was
explained in terms of the schematic memory of the rater (Foti,
Fraser, & Lord, 1982; Nathan & Lord, 1983; Phillips & Lord, 1981).
* Cooper (1981a, 1981b) and Borman (1983) presented evidence
suggesting that SD occurs in performance ratings, Cooper (1981b),
using Shweder and D'Andrade's (1980) method had subjects directly
4..j

8Rating Delay
rate the perceived interdimension similarities of performance
dimensions. These interdimension similarity ratings were averaged
across subjects and resulted in a single interdimension similarity
matrix. In two studies, the similarity matrices correlated
significantly with rated behavior matrices. In a third study, Cooper
V' used x ideotapes and true scores developed by Borman (cited in
.- Cooper, 1981b). Although the rated behavior matrix again correlated
(r = .55) with the similarity matrix, it correlated even more
strongly with the true score interdimension matrix (r = .89). This
pattern did not follow the typical SD pattern in which memory-based
ratings relate mor strongly with implicit theory beliefs than to
criterion ratings.
One reason for Cooper's (1981b) failure to detect SD may have
been that the rated behavior matrix consisted of ratings made
inmdiat ely after viewing each videotape instead of after a
4' significant delay. Furthermore, Kozlowski and Kirsch (1987)
suggested that the use of criterion true score/videotape methods are
inappropriate for studying SD because the pooled expert judgmentsJ'
.from which criterion scores are derived may be subject to the same
0 cognitive distortion processes as the observed ratings. This may
result from inconsistency among studies in how criterion true scores
are developed (Sulsky & Balzer, 1987). As discussed below, however,
the procedures used by Borman et al. (1978) to develop criterion
true scores are designed to minimize memory demands and job and
ratee unfamiliarity on the part of the expert raters.
.4

9Rating Delay
Borman (1983) reviewed and reanalyzed data from previous
studies (Borgatta, Cottrell, & Mann, 1958; Mann, 1959; cited in
Borman, 1983) and concluded that performance ratings can be
distorted by semantic similarity beliefs. He offered two major
criticisms, how.ever, of SD research. First, using different raters
t,, generate the similarity, criterion, and memoiy-based performance
ratings produces differing frames-of-reference in interpreting the
rating dimensions. This problem is reduced greatly if the same
raters provide all ratings using standardized dimension definitions.
The second criticism concerned methods for assessing the true
* intercrrelations among performance categories (i.e., true halo).
For examplet, the Shtceder and D'Andrade (1980) used behavior
freqii.-rncy ratings or judgmental ratings with minimal time-delay
betw.een observation and rating. As research has demonstrated, suchj-J
.- '- behavior frequency and judgmental ratings are subject to the same
impression-based biases as memory-based ratings (Murphy et al.,
1982).T"rThe Borman et al. (1978) method for constructing criterion true
scores consisted of prucedures to validate expert ratings of
6 videotaped performances. Essentially, experts estimated means,
standard deviations, and interdimension correlations of job
performance on behaviorally-anchored rating scales. Based on these
expert estimates, "intended" true scores were established, scripts
*were written, and performance videotaped for each ratee. Final true
scores were then obtained from experts who studied the videotapes
-, and assigned performance evaluation ratings. These final true scores
wN l , ... ...
10
Rating Delay
were validated by (a) correlating them with the intended true
scores, (b) measuring interrater agreement among the experts, and
(c) analysis of convergent and discriminant validity in which the
ratee main effect indicated convergent validity and the ratee x
dimension interaction indicatee discriminant validity. If such
statistical validation is acceptable (in terms of interrater
agreement, convergent and discriminant validity), one then uses the
,eans of the expe*rt ratings as criterion true scores (Borman et al.,
1978) in the computation of accuracy scores (e.g, EL, DEL, SA and
I)..\; Cline, 11,64; Cronbach, 1955).
Measuring Systematic Distortion
The usual test for SD is based upon comparisons among a co-
occurrence (or ICr) matrix, a criterion intercorrelation matrix, and
an intercorrelation matrix of the rated performance categories. The
typical comparison indicates a higher correlation between the co-
occurrence matrix and the performance ratings matrix than between
the performance ratings matrix and the criterion matrix. As depicted
. in Figure 1, the correlation between the co-occurrence matrix and
the performance ratings matrix represents the extent to which the
* eorrelation ,katrix of performance category ratings covaries with
implicit theo~ries abo~ut those category interrelations.
Insert Figure 1 about here
'I...,
05

PRating Delay
This correlation can be denoted as a Systematic Distortion Index
(SDI). Moreover, the correlation between the performance rating
intercorrelations and the criterion score intercorrelations can be
denoted as an index of Correlational Structure Accuracy (CYSTAC). If
SDI exceeds COSTAC, the result is interpreted to mean that
performance ratings are more similar to implicit notions of rating
pcategory covariance than to the actual covariance in the categories.
Cooper (1981b) recommended that further investigations of systematic
distortion in memory-based performance ratings should elicit
similarity and performance rating matrices from each rater, rather
*than single matrices based upon group averaged ratings. Such an
individual-level approach to studying systematic distortion was
applied by Kozlow.ski and Kirsch (1987). The present study applied
both an individual and group-level analysis of SD.
Are Systematic Distortion, Halo and Accuracy Related?
Recent empirical evidence suggests a link between SD, halo and
rating accuracy. Murphy and Balzer (1986) found that one-day delayed
performance ratings contained higher mean interdimension
correlations and higher SA and DA than immediate ratings. Cooper
(1981a, 1981b), however, proposed that inflated correlational
structures of memory-based ratings contain illusory halo - - a
source of inaccuracy (Cooper, 1981a, 1981b; Thorndike, 1920). Murphy
and Balzer (1986) explained the increased accuracy within memory-
Pbased ratings in terms of raters' reliance on accurate schematic
memory via the SD process.
'p
I

12Rating Delay
Kozlowski and Kirsch (1987) found that their SDI measure (i.e.,
conceptual similarity-rating covariation) significantly and
positively correlated with observed halo (the "standardized" average
variance measure); and that halo positively correlated with DA and
negatively with SA. Moreover, ratee familiarity appeared to
influenfce the direction of significant correlations of SDI with SA
and T)DA.
In discussing the paradoxical weak positive correlations
betwee ! halo and accuracy reported in a number of studies, Cooper
(1981a, 1981b) suggested that some raters use their implicit
covariance matrix as a heuristic which aids their accuracy (Cooper,
1981a, p. 239). While such may have been the case in the two studies
reported above, others have concluded on the basis of the empirical
literature that commonly used rater error measures have little or no
, relationship to rating accuracy (Becker & Cardy, 1986). Of course,
the typical usage of rater error measures, as their name implies,
presuies a negative relationship with rating accuracy.
Conclusions and Research Objectives
*: Rating delay intervals have been associated with the rater
error of Systematic Distortion (SD). The SD effect, in turn, has
been associated both theoretically and empirically with increased
halo. And finally, halo has been associated with both increased and
decreased accuracy in some studies. Effects of true halo have not
been studied as extensively, but prior research (Smither & Reilly,
1987) suggested that increased true halo may aid some forms of
rating accuracy. The primary objective of the present study was to
O-0

13Rating Delay
investigate the independent and joint effects of rating delay and
true halo on several rater errors, rater accuracy, convergent and
discriminant validity. A second objective w~s to examine
correlations among the rating outcomes for comparison with previous
research.
Method
Stimulus Materials and True Scores
Videotapes. Eight videotapes of classroom lectures produced and
used in prior research (Murphy & Balzer, 1981, 1986; Murphy et al.,
198-1; Murphy et al., 1982) were used in the present study. Four
drama students role-playing graduate students in psychology were
videotaped with each presenting two five to seven minute lectures on
the topics of Self-fulfilling Prophecies and Crowding and Stress. As
with the Bormian et al. (1978) tapes, predetermined varying levels of
effectiveness were scripted into each lecture. The eight lectures
represented varying levels of clarity and organization (good or
bad), presentation style (dynamic or hesitant), and responsiveness
to questions (responsive or evasive, Murphy et al., 198.4).
Evaluation Rating Scale. The performance rating scale developed
by Murphy and colleagues in the development of the videotapes was
used in this study. This scale consisted of eight performance
dimensions (e.g., Thoroughness of Preparation, Grasp of Material)
which are rated on a scale from 1 (Ver, Ba) to 5 (Vry ) In
the present study, each rating form included a photograph of the
ratee along with the lecture topic as a means of identifying the
ratees for the subjects/raters. Coefficient alpha for this scale in
If

14
Rating Delay
the present study was .94, reflecting a high degree of
intercorrelation among the dimensions in subjects's ratings.
Performance Category Co-Occurrence Rating Form. A Performance
Category Co-Occurrence Rating Form was developed to measure raters'
implicit covariarice theories regarding typical classroom lecturer
performance. This rating format was similar to those typically used
ir, multidimensional scaling, implicit personality theory, and
systematic distortion research (Cooper, 1981b; Schneider, 1973;
Schultz & Siegel, 1964; Shweder, 1975). Each subject rated, on a
scale of 0 (Not Likely to Co-Occur) to 7 (Very Likely to Co-Occur),
the extent to which similar levels of performance on all 56 possible
pairs of the eight dimensions are likely to be found together. Each
subject's implicit covariance theory was thus defined in terms of
the rated likelihood that paired performance categories covary in
the general college classroom lecturer population.
Criterion scores. Murphy et al. (1984) obtained criterion
scores on the performance evaluation scale rating dimensions for
each of the eight videotaped performances in a manner following
Borman et al. (1978). The intraclass coefficient for the ratee main
effect in a rater by ratee by dimension analysis of variance was
.70, and the ratee x dimension interaction intraclass coefficient
was .47. As measures of convergent and discriminant validity,
respectively, these values compare well with studies reporting rater
x ratee x dimension analyses of performance ratings (cf. Borman,
1978; Kavanagh, MacKinney, & Wolins, 1972; Lee, Malone, & Greco,
1981). The mean expert ratings also converged with the intended true
6

15S. Rating Delay
-. r,- - ndi-ated by a median correlation (across tapes) of .84
Muwph. I & Bal.'r,. 1981).
E\perimental .tanipulation
Four ex- rimental delay conditions were created to examine the
effects of delay between observing and rating performance on the
strength of systematic distortion. The four delay groups included an
i mm,.-ddate-rating group , whose members rated the tapes immediately
after viewing the four tapes; a one-day delay group, whose members
returntd the following day to rate the tapes; a two-day delay group,
whos. members returned after two days to rate the tapes; and a seven-
day delay group whose members returned after seven days.
Subjects
Three-hu-dred and thirty-seven subjects completed the study.
These consisted of 333 introductory psychology undergraduates who
axrticipated in exchange for course credit, and four volunteer
graduate students in Business Administration. Fifty-two of these
subjects participated under slightly different conditions than the
remainder of the subjects: Instead of viewing a random sample of
four of the eight videotapes, they viewed a specific set of four
*O tapes. Because the analysis below utilizes measures of true halo,
only a random sample of eight subjects from these 52 are utilized
for this analysis as a means of equating the delay groups on the
true halo levels contained in the stimulus videotapes. Of the 293
subjects in the present sample, the mean age was 19, ranging from 17
to 47 years of age; approximately two-thirds of the sample was
female.
01111'1

16
Procedures
Students who volunteered for this study were informed that they
may be asked to return to provide memory-based ratings. Upon arrival
for the initial session, subjects were given a description of the
general nature of the study. Subjects participated in small groups
of 1-4 arid were randomly assigned as a group to one of the four
delay condition--. Following an explanation of each of the
performance rating dimensions, subjects completed the co-occurrence
rat ings-.
All subjects (with the exceptions noted above) were then shown
a randomly-selected sample of four of the eight videotapes, subject
to the constraint that only one lecture by each actor was viewed.
This procedure resulted in 14 (out of 16 possible) tape combinations
viewed by raters. While viewing the tapes, raters were not permitted
to take notes. After v-iewing the tapes, inmediate-rating subjects
were asked to provide performance ratings for each lecturer.
Subjects assigned to the delayed rating conditions were told where
and when to return to make their memory-based performance ratings.
These delay condition subjects were given written instructions to
* return to a specified room after either a 24 hour interval, a 48
hour interval, or a one-week interval. Subjects returned to make
their ratings at an hour as close as possible to the desired
interval. When the delayed condition subjects returned for the
V second part of the experiment, they were provided with a rating
packet (which included instructions and materials for the rating
* task), completed their memory-based ratings, and returned their
17Rating Delay
ratings to a designated location. Subjects were provided with either
an oral (for immediate group) or written (for delay groups)
debriefing of the experiment.
Measures
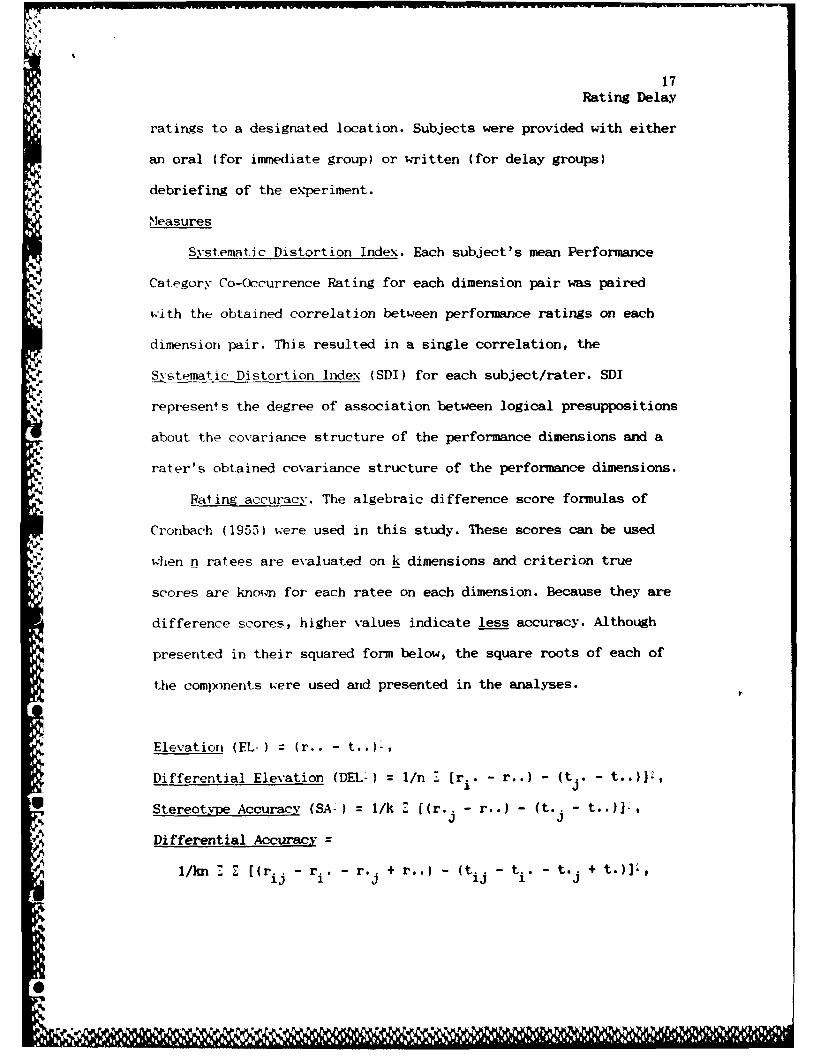
Systematic Distortion Index. Each subject's mean Performance
Category Co-Occurrence Rating for each dimension pair was paired
with the obtained correlation between performance ratings on each
dimension pair. This resulted in a single correlation, the
Systematic Distortion lndex (SDI) for each subject/rater. SDI
represents the degree of association between logical presuppositions
about the covariance structure of the performance dimensions and a
rater's obtained covariance structure of the performance dimensions.
Rating accuracy. The algebraic difference score formulas of
Cronbach (1955) were used in this study. These scores can be used
when n ratees are evaluated on k dimensions and criterion true
scores are known for each ratee on each dimension. Because they are
difference scores, higher values indicate less accuracy. Although
presented in their squared form below, the square roots of each of
the components w~ere used and presented in the analyses.
Elevation (EL-) = (r.. - t..)-
Differential Elevation (DEL-) = 1/n 7r.. - r..) - (t . - t..)]4
Stereotype Accuracy (SA-) = 1/k Z [(r.. - r..) - (t.. -t. ,~J a
Differential Accuracy
1/kn Z .r r r. . + r..) - (t ij - t.. - t.. + t.)J,O 13 1
O,.

18
Rating Delay
where r.. and t.. = rating and true score for ratee i on dimension
j; r., and t.. = mean rating and mean true score for ratee i; r..
and t. = mean rating and mean true score for dimension j; and r..
and t.. = mean rating and mean true score over all ratees and
dimensions.
Rater errors. Observed Halo (OH) was computed as the median
interdimension correlation of each rater's performance ratings
across the four ratee videotapes viewed by each rater. Halo Error
(HE) w4as computed for each rater by subtracting the median true
score interdimension correlation for the tapes viewed by a rater
*- from the rater's Off. Absolute Halo Error (AHE) is the absolute value
cF HF (Fisioaro, 1987). Observed Leniency (OL) was computed as the
differen(ce obtained by subtracting the scale midpoint (3.0) from the
me-at, ratings within ratees, averaged across ratees. Leniency Error
(E) utilized the mean true score instead of the scale midpoint.
(Absolii e Leniency Error is equa] to Elevation Accuracy, and was
therefore not computed.) Restriction of Range (Th9R) was computed as
thle standard deviation of ratings across ratees, averaged across
dimensions. Higher values indicate greater variability in ratings
across ratees and less restriction in range.
Convergent/discrimi nant validity. Procedures described by
Kavanagh, %acKinney, and Wolins (1971) were used to obtain
Sintraclass correlation coefficients associated with the ratee main
effect (convergent validity) and ratee x dimension interaction
(discriminant validity). The intraclass correlation formula
estimated the reliability of an individual rater's ratings, and

19Rating Delay
included between rater variance in the error term. The intraclass
indices were computed for subjects who viewed the same ratee tapes
in the same rating delay condition. The sampling procedures involved
in assigning ratees to raters resulted in 39 rater groups who viewed
unique tape combinations in the four rating delay conditions. One
tape combination was viewed by only one rater and thus was not
included in the convergent/discriminant validity analyses.
Results
Per forimance Category Co-Occurrence Ratings
With eight performance dimensions, there are two sets of 28
pairs of performance dimension co-occurrence ratings. Each set is a
sytymetrical opposite of the other. The mean of each of the
symmetrical opposites .-as taken as the implicit theory measure for
each pair of performance dimensions, resulting in Z8 implicit theory
ratings for each subject. Table 1 presents the overall means on each
of these 28 performance dimension pairings. These scores suggested
that the subjects's preconceived notions about the covariance of the
performance categories were rather restricted.
0Insert Table I about here
The values ranged from 3.11 (Rapport with Audience / Responsiveness
to Questions) to 6.07 (Speaking Ability / Organization and Clarity)
with an overall mean of 4.89 and standard deviation of .66.
Considering the eight point (0 - 7) scale used, the size of the
standard deviations associated with each covariance estimate (less
10 1

20Rating Delay
than 2.0) suggested good agreement among the subjects in those
estimates. The overall mean indicated that as a group, the subjects
thought the "likelihood of co-occurrence" of the performance
dimensions was just slightly above the midpoint of the 0 - 7 scale
of co-occurrence likelihood. In addition, the mean co-occurrence
ratings for each of the 28 pairs was calculated for each rating
delay group in order to assess the equivalence of the implicit
theories across groups. Table 2 presents the group intercorrelations
of these mean ratings. The results suggested a very high degree of
agreement among the groups in how they viewed the likely co-
cXcurrence of the performance categories.
Insert Table 2 about here
Relationships among Rating Outcomes
Table 3 includes descriptive statistics for all rating outcomes
(excluding convergent and discriminant validities) for the combined
and separate rating delay groups.
Insert Table 3 about here
A number of observations are noteworthy in Table 3. First, the
overall and within-group mean levels of True Halo are extremely
high. In Pearson correlation form, the overall True Halo was
approximately .95. Second, the interpretation of halo and leniency
* differs depending on whether true scores are considered. For
'L
@1A
21- Rating Delay
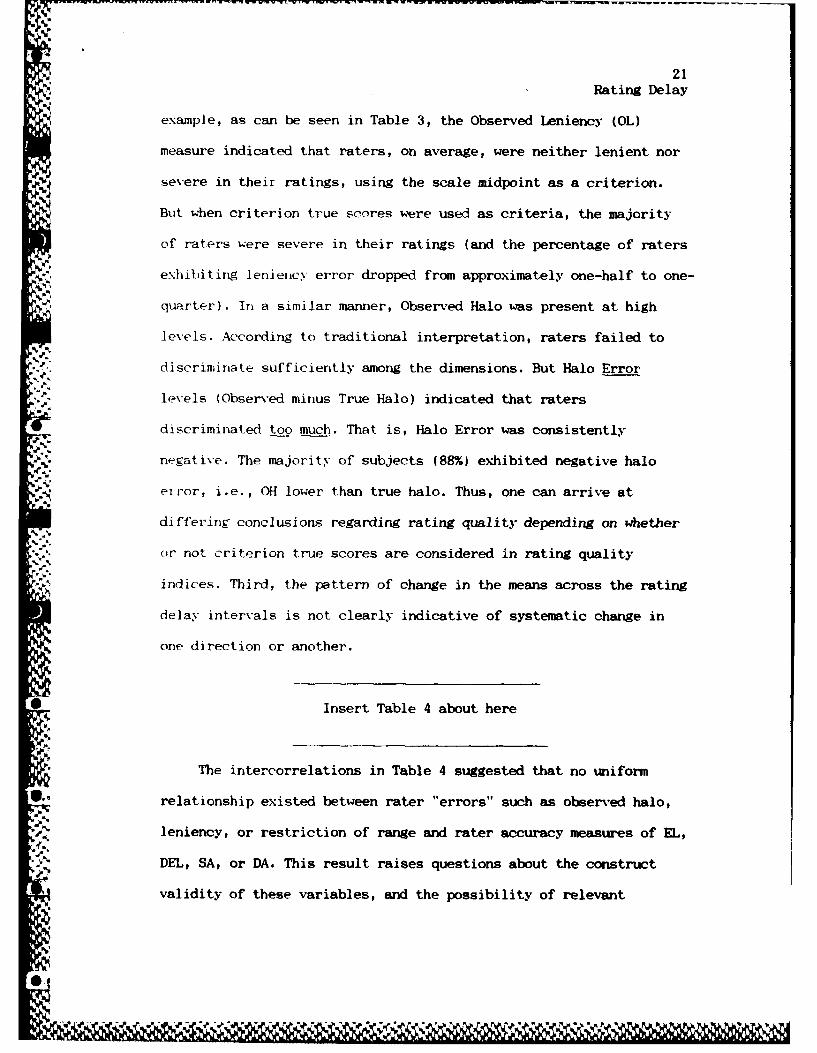
example, as can be seen in Table 3, the Observed Leniency (OL)
measure indicated that raters, on average, were neither lenient nor
sex-ere in their ratings, using the scale midpoint as a criterion.
But when criterion true scores were used as criteria, the majority
of raters were severe in their ratings (and the percentage of raters
exhibiting leniency error dropped from approximately one-half to one-
quarter). In a similar manner, Observed Halo was present at high
levels. According to traditional interpretation, raters failed to
discriminate sufficiently among the dimensions. But Halo Error
levels (Observed minus True Halo) indicated that raters
discriminated too much. That is, Halo Error was consistently
not-gatix-e. The majority of subjects (88%) exhibited negative halo
error, i.e., OH lower than true halo. Thus, one can arrive at
differing conclusions regarding rating quality depending on whether
* or not criterion true scores are considered in rating quality
indices. Third, the pattern of change in the means across the rating
delay intervals is not clearly indicative of systematic change in
one direction or another.
* Insert Table 4 about here
* The intercorrelations in Table 4 suggested that no uniform
relationship existed between rater "errors" such as observed halo,
% leniency, or restriction of range and rater accuracy measures of EL,
DEL, SA, or DA. This result raises questions about the construct
* validity of these variables, and the possibility of relevant

22
Rating Delay
variables, not considered in the bivariate relationship, which may
be important.
Table 4 also indicates the lack of relationship between the
systematic distortion index (SDI) and all other measures, including
all of the halo measures. SD cannot be considered as a likely
correlate of observed halo in the present data. A more likely
influene-e on halo may be true halo, which correlated significantly
.ith Observed Halo, Halo Error, and Absolute Halo Error.
Effects of Rating_Delay and True Halo on Rating Outcomes
Prior to testing effects of true halo, an analysis of group
* differences in true halo was performed. The one-way ANOVA indicated
no differences among the four rating delay groups (E(3,289) = .62, p
> .10). The effects of rating delay and true halo were tested in a
series of eight two-way analyses of variance (ANOXIA; see Table 5).
Insert Table 5 about here
Each ANOVA was considered significant only if the overall F
statistics met the Bonferroni-adjusted criterion of ,- = (.05 / 8)
. .006. This produced an upper bound overall error rate of .048. The
results indicated that rating delay and true halo had joint effects
on the rating outcomes of Differential Elevation (DEL) accuracy,
Observed Halo (OH), and Restriction of Range (]ROR). In essence, this
means that the correlations between True Halo and these outcomes
change as a function of rating delay interval. Inspection of the
correlations in Table 4 helps to clarify the nature of these
N P

23Rating Delay
relationships. The correlations between True Halo and DEL change
from nonsignificance to positive indicating that in the seven-day
delay condition higher levels of True Halo are associated with
increased DEL accuracy. This result may suggest that when a rater
depends heavily on memory to rate performances, the true patterns of
perform-nuce among dimensions may serve as aids. That is, when these
jxatt. rn- are similar (i.e., true halo is high), raters are better
able to detoct overall strengths and weaknesses among ratees,
averagirig across dimensions. In the cases of predicting ROR and OH,
the effects of True Halo are present in the immediate and one-day
dolay iriter~als and absent in the longer interval conditions.
.temnatic Distorl ion
There was no evidence from the analysis of variance in Table 5
that systematic distortion increased over the range of rating delay
inter'vals. An additional analysis (Table 6)
Insert Table 6 about here
examined the relative difference between the SDI and COSTC over
time. This relationship was examined at both the individual and
group levels of analysis. Table 6 lists the matrix
intercorrelational data (as referenced in Figure 1) in testing the
6SDH across each delay group in each level of analysis. For
individual-level analysis, a SDI and COSTAC score was computed for
each rater. The means of these scores are presented in the table at
the individual-level of analysis. For the group-level analysis, a
....... 202 d

24
Rating Delay
single SDI and COSTAC score was computed for each rating delay group
based on group mean co-occurrence ratings and the group means of the
true score and rating intercategory correlations. Recall that'S.
systematic distortion is indicated when SDI exceeds CX)STAC; and this
increment in SDI should expand over time according to the SDH.
As the Talbh 6 data indicate, however, the increment betweenS.
the mean SDI and cOSTAC scores did not increase with rating delay at
either level of analysis as one would expect if SD in the direction
. of implicit theories were occurring. None of the differences across
groups were statistically significant (all z's < 1.96); and the
• median SDI scoure across all analyses (.18) was less than the median
OOSTAC score (.26). Figure 2 depicts the pattern of the SDI -
C OS.AC values across rating delay conditions for both individual-
S.and group-level analyses. The lack of a systematic increase in SD is
readily apirent.
Insert Figure 2 about here
Effects of delay and true halo on convergent and discriminant
0 v.aIidityv
Table 7 lists the results of two-way ANOVAs testing the effects
of True Halo and Rating Delay on 39 indices of convergent validity
and discriminant validity. Not every delay group was represented in
every level of true halo, and several of the delay group-true halo
.cells had as few as two raters. Consequently, true halo was
dichotomized at the median (z 1.98). Likewise, the immediate and
% Ws .V. b

'.
25Rating Delay
one-day groups were combined into one group, and the two-day and
seven-day groups combined. This resulted in a 2 (Low/High True Halo)
x 2 (Short/Long Rating Delay Interval) ANOVA for convergent validity
and discriminant validity.
Insert Table 7 about here
Intraclass indices for the ratee main effect (convergent
validity/interrater agreement) and ratee x dimension interaction
(discriminant validity), as described in Kavanagh et al. (1971),
were converted to Fisher's z for these analyses. A strong main
effect for True Halo was found for predicting convergent validity.
K"' The correlation between convergent validity and True Halo (r(37)
.56, p < .001; see Table 8) indicated that raters were better able
A- to agree on the overall ratee performance when unique information
contributed by individual dimensions was minimized (i.e., dimensions
highly correlated under conditions of high true halo). Across the 39
rater groups, the average convergent validity intraclass correlation
was .82 with a standard deviation of .47. The average discriminant
* validity index was nearly zero (-.06), with standard deviation of
.13. The negative intraclass indiceted that the mean square due to
the ratee x dimension interaction was, on average, less than the
S., model mean square error. The virtual absence of discriminant
validity indicated that raters were not able to reliably
.'S- 'S discriminate differences in performance on dimensions within ratees
on the videotapes used in this study.
i.-,
, *V 4L X 1

'I' Validity of Rater Error and Rater Accuracy Measures
Rating outcome measures were averaged within each of the thirty-
nine unique groups of raters and correlated with the Convergent
N. Validity and Discriminant Validity indices for the respective
groups. The correlations presented in Table 8 can be interpreted as
d validity coefficients for the rater error and rater accuracy
measures commonly used in rating research. The positive correlation
betwseen Observed Halo and Convergent Validity provides further
N evidence that Observed Halo cannot serve as a measure of rater
N error. Whien observed halo is corrected for true halo (Halo Error) or
treated as an indicator of absolute deviation from true halo
(Absolute Halo Error), however, the paradoxical relationship with
convergent validity disappears. Relationships between Restriction of
Range and convergent validity, and Elevation and Differential
Elevation accuracy and convergent validity are in expected
directions. The positive correlation betweeen Leniency Error and
convergent validity may at first appear paradoxical. This
relationships, however, is due to the fact that most leniency error
was negative, that is, most raters rated below the true level of
* performance. As a result, the higher (i.e., less negative) the
leniency error score, the more accurate the rater was likely to be.
The proper interpretation of the Leniency Error measure, then, must
consider the true levels of performance in the rated behavior.

* . 27Rating Delay
Discussion
Effects of Rating Delay and True Halo
The conditional effects of rating delay on rater errors and
rater accuracy added to mixed results from previous research which
found increased accuracy over delay periods of one-day (Murphy &
Balzpr, 1986), decreased accuracy over periods of one week (Heneman
& Wt4xley, 1983; using the overall D-squared measure of accuracy) and
no clear effect of rating delay for a two-day delay (Nathan & Lord,
1983). A similarly mixed picture exists for the effects of rating
delay on observed halo. Integretive research and reviews are needed
"*- wihich cumulate findings taking into careful consideration the
operatiorializations of rater error and rater accuracy. As argued by
Becker arid Cardy (1986) and Smither and Reilly (1987), true halo may
enhance rating accuracy. This was the case in the present data as
reflected in the interaction between Rating Delay and True Halo in
predicting Differential Elevation. This result differs from Smither
and Reilly (1987), who did not detect significant interactions
between true halo and delay; and found instead a main effect for
true halo on Differential Accuracy (and overall accuracy, D-
@ squared). Their smaller sample (N z 90), however, may have lessened
*the ability to detect significant interactions.
The videotaped stimulus behaviors used in the present study
$'" pointed out the pitfalls of evaluating behavior characterized by
high levels of true halo. The ability of raters to differentiate
among the eight rating dimensions was virtually nil; but yet the
inflated true halo levels may have aided interrater agreement.
V.5%

28
Rating Delay
Systematic Distortion. The present study tested the SDH at both
individual and group levels of analyses, and found what had been
interpreted as SD in previous studies: SDI greater than OSTAC in (2-
day) delayed rating conditions (see Table 6). When viewed in the
context of a continuum of rating delay, however, SD did not increase
a-, exrwcted by the SDH in neither the group nor individual-level
analysis. One possibility is that this study represented a
"'aseline" at the lower boundary of conditions likely to elicit SD.
For example, the rating delay intervals in the present study may
have been insufficient to provoke and systematically increase the SD
respxnse. Kozlowski and Kirsch (1987), for example, found SD effects
A- when performance ratings were rendered up to six months after the
target. performances. Also, unfortunately, no measures were taken in
the present study of subjects' familiarity with ratees or the job of
N.A classroom lecturer. However, subjects in the present study, as
students, were likel. to be highly familiar with the job of
classroom lecturer, which would have also reduced the likelihood ofN,
detecting SD. An additional consideration is that subjects in the
present study had great difficulty in discriminating differences in
ratee performance among the performance dimensions, as indicated by
the extremely low discriminant validities and the low variance found
for DA and SA compared to EL and DEL. Because SD, as operationalized
S here, is dependent upon covariance patterns among the performance
dimensions (in measuring the SDI), the use of videotapes
characterized by positively skewed true halo may inhibit the ability
to detect SD by restricting the range of values in the "rated

29
Rating Delay
category" and "criterion category" intercorrelation matrices (see
Fig. 1). Thus, the present study may be viewed as a demonstration of
the lower bound conditions for SD, with the most parsimonious
interpretation of the levels and trends of SD in Figure 2 being
straight lines with silI = 0 through the plots for individual and
group analyses. Tests of the SD hypothesis which seek to relate
intei ,ity of SD to intervals of delay should utilize greater
retention intervals, measure raters' familiarity with the ratees and
with the jobs being evaluated, and consider the effects of range
re.O riction on correlations among the covariance matrices.
Tritepretabitity of Rater Error Measures
The correlations in Tables 4 and 8 illustrate the problems
confront ing the researcher, particularly in applied settings, who
wishes to evaluate the quality of observed performance ratings. It
, clear that, for the most part, observed halo, observed leniency,
and restriction in range were not associated, in strength or
ex-pected directions, with rating accuracy or validity. The single
most useful observed rater error appeared to be Restriction of
Range, which correlated negatively with Elevation Accuracy,
Stereotype Accuracy, and Convergent Validity. It was positively
correlated, however, with Differential Elevation. Modifying the
observed rater errors by their deviations from true scores did not
improve interpretability of the rater error measures with the
possible exception of Absolute Halo Error, which correlated
negatively with Differential Elevation, Stereotype Accuracy, and
Differential Accuracy.
*1

30ERating Delay
'Final Comment
This study suggested that true halo in rated performance may
influence rating outcomes in conjunction with rating delay
intervals; and may exert independent effects on convergent validity.
As Cooper (1981a, 1981b) observed, real world performance in many
jobs is likely to contain true halo. Although true halo and true
levels of performance in jobs may be difficult to determine,
theoretical models relating rater errors with other outcomes must
confront the reality of negatively skewed true halo in certain
performance evaluation environments. To be useful, performance
evaluation methods, instrumentation, and rating effectiveness
criteria must be interpretable when true performance variance is
restricted and true performance levels are inflated and
uriidimensional. These conditions may occur when a workforce has been
subjected to highly competitive selection and retention criteria.
Implications also exist, for the design of appraisal formats and
feedbach systems under such circumstances. The use and
interpretation of commonly-used rater errors such as halo, leniency,
and range restriction under these, and perhaps most circumstances,
0is not a simple and direct matter.
The data suggest that paradoxical as well as expected
relationships can occur between rater error and rater accuracy
measures and that links among rater errors and with rater accuracy
need to be further explicated and reconciled with prior studies
which have examined those relationships. For example, Hozlowski and
Kirsch (1987), among others, found a different pattern of relations
- 'i v~ v* * *. N ,

31Rating Delay
between rater error and rating accuracy and between halo and the
systematic distortion index than found in the present study. The
construct validity of commonly used measures of rater error and
accuracy apparently needs more systematic research.
This qtudy demonstrated the difficulty of obtaining a clearly
'interpretable picture of the complex interrelationships among rating
conditions and outcomes. Future research should consider using more
poiwerful modeling techniques such as structural relations analysis
(Joreskog & Sorbom, 1986) to explore prediction of rating outcomes
and to identify substantive and generalizable relationships. Large
sample studis which test the influence of exogenous variables such
.2,. as rating delay, ratee/job familiarity, true halo, etc. on rating
errors and accuracy are needed. For example, more powerful tests are
needed of furictional relationships between halo, systematic
distortion, and accuracy. Another example is suggested by the
present correlational results among true halo, rating accuracy, and
observed halo. Does observed halo mediate the effects of true halo
on rating accuracy? What are the implications of possible
relationships between true halo and convergent validity for the
design of rating instrtunents? The continued examination of bivariate
correlations and univariate functional relationships can add little
to the further understanding of these issues.
4.

32
References
Barnes-Farrell, J, & Couture, K. (1984). Effects of appraisal
salienl t on im.ue-diate and memory-based judgments. (Report
No. 84-I). Arlington, VA: Office of Naval Research. (DrIC AD
No. A140334).
Becker, B., & Cardy, R. (1986) Influence of halo error on
appraisal effectiveness: A conceptual and empirical
reconsideration. Journal of Applied Psychology, 7-1, 662-671.
Bornman, W. (1983). Implications of personality theory and
research for the rating of work performance in
organizations. In F. Landy, S. Zedeck, and J. Cleveland
(Eds.), Performance measurement and theory. Hillsdale: Erlbaum
Borman, W., Hough, L, & Dunnette, M. (1978). Performance ratings:
Ar, investigation of reliability, accuracy, and relationships
between individual differences and rater errors. (Report No.
TR-78-A12). Alexandria, VA: Army Research Institute for the
Vi Behavioral and Social Sciences. (DTIC AD No. A061149).
Brunei, J., & Tagiuri, R. (1954). The perception of people. In G.
Lindzey (Ed.), Handbook of social psychology. Cambridge, MA:
Addison-Wesley.
Cline, V. (1964). Interpersonal perception. B. A. Maher (Ed.),
Progress in e.xerimental personality research, Vol. 1. (pp.
221-284). New York, NY: Academic Press.
Cooper, W. (1981a). Ubiquitous halo. Psychological Bulletin, 90,
218-244.
U

33
Cooper, W. (1981b). Conceptual similarity as a source of illusory
halo in job performance ratings. Journal of Applied
Applied Psychology, 66, 302-307.
Cronbach, L. (1955). Processes affecting scores on "understanding
of others" and "assumed similarity". Psychological Bulletin,
52, 177-193.
D'Anch-ade, R. (1974). Memory and the assessment of behavior. In
H. M. Blalock, Jr. (Ed.), Measurement in the social sciences.
Chicago: Aldine.
Fisicaro, S. (1987). A re-examination of the relationship between
halo error and accuracy. Manuscript submitted for publication.
Foti, R., Fraser, S., & Lord, R. (1982). Effects of leadership
labels and prototypes on perceptions of political leaders.
Journal of Applied Psychology, 67, 326-333.
Gage, N., & Cronbach, L. (1955). Conceptual and methodological
problems in interpersonal perception. Psychological Review,
62, 411-422.
Ilgen, D., & Favero, J. (1983). Methodological contributions of
person perception to performance appraisal. (Report No. 83-4),
Arlington, VA: Office of Naval Research. (DTIC AD No.
A1228638).
Joreskog, K., & Sorbom, D. (1986). LISREL: Analysis of linear
structural relationships by the method of maximum likelihood. .
User's Guide, version VI. Mooresville, Scientific Software.
Kavanagh, M., MacKinney, A, & Wolins, L. (1971). Issues in
managerial performance: Multitrait - multimethod analyses of
ratings. Psychological Bulletin, 75, 34-49.
34
Kozlo..ski, S., & Kirsch, M. (1987). The systematic distortion
hypothesis, halo, and accuracy: An individual-level analysis.
Journal of Applied Psychology, 72, 252-261.
Kozlowski, S., Kirsch, M., & Chao, G. (1986). Job knowledge,
ratee familiarity, conceptual similarity and halo error: An
exploration. Journal of Applied Psychology, 71, 45-49.
Lamiell, J. (1980). On the utility of looking in the "wrong"
direction. Journal of Personality, 48, 82-88.
Landy, F., & Farr, J. (1980). Performance rating. Psychological
Bulletin, 87, 72-107.
Landy, F., & Farr, J. (1983). The measurement of work:
Methods, theory, and applications. New York: Academic Press.
Lee, R., Malone, M., & Greco, S. (1981). Multitrait-multimethod-
multirater analysis of performance ratings for law enforcement
personnel. Journal of Applied Psychology, 66, 625-632.
Lnrd, F., Foti, R., & DeVader, C. (1984). A test of leadership
categorization theory: Internal structure, information
processing, and leadership perceptions. Organizational
Behavior and Human Performance , 34, 343-378.
Murphy, K., & Balzer, W. (1981). Rater errors and rating
accuracy. Paper presented at the American Psychological
Association annual convention, Los Angeles, CA.
Murphy, K., & Balzer, W. (1986). Systematic distortions in
memory-based behavior ratings and performance evaluations:
Consequences for rating accuracy. Journal of Applied
Psychology, 71, 39-44.
Murphy, K., Balzer, W., Kellam, K., & Armstrong, J. (1984).
oV
: " : .. . . ..... ...

35
Effects of the purpose of rating on accuracy in observing
teacher behavior and evaluating teaching performance. Journal
of Educational Psychology, 76, 45-54.
Murphy, K., Balzer, W., Lockhart, M., & Eisenman, E. (1985).
Effects of previous performance on evaluations of present
performance. Journal of Applied Psychology, 70, 72-84.
Murphy, K., Martin, C., & Garcia, M. (19821. Do Behavioral
Obser-ation Scales measure observation? Journal of Applied
Psychology, 67, 562-567.
Nathan, B., & Lord, R. (1983). Cognitive categorization and
dimensional schemata: A process approach to the study of halo
i1L p.erformirice ratings. Journal of Applied Psychology, 68,
102-114.
Newcomb, T. (1931). An experiment designed to test the validity
of a rating technique. Journal of Educational Psychology, 22,
279-289.
Phillips, J., & Lord, R. (1981). Causal attributions and
perc eptions of leadership. Organizational Behavior and Human
Performance, 28, 143-163.
Phillips, J., & Lord, R. (1982). Schematic information processing
and perceptions of leadership in problem-solving groups.
Journal of Applied Psychology, 67, 486-492.
Pulakos, E., Schmitt, N., and Ostroff, C. (1986). A warning about
the use of a standard deviation across dimensions within
ratees to measure halo. Journal of Applied Psycholoty, 71,
29-32.
Schneider, D. (1973). Implicit personality theory: A review.
I

36
Psvchological Bulletin, 79, 294-309.
Schultz, D., & Siegel, A. (1964). The analysis of job performance
by multidimensional scaling techniques. Journal of Applied
Psychology. 48, 329-335.
Shweder, R. (1975). How, relevant is an individual difference
theory of personality? Journal of Personality, 43, 455-484.
Shw.edk.er, R. (1977). Likeness and likelihood in everyday thought:
Miagical thinking in judgments about personnality. Current
-Anthrpolog., 18, 637-658.
Shweder, R. (1980). Factors and fictions in person perception:
\ rply to Lamiell, Foss, and Cavenee. Journal of Personalit,
48, 74-81.
Shitedoi,, R. (1982). Fact and artifact in trait perception: The
systernatic distortion hypothesis. In B. A. Maher and W. B.
,Iahor (Fds.-1, Progress in exN]erimental personality research,
(vol 2). New York: Academic Press.
Shledpr, R. (1983). In defense of surface structure. In F. Landy,
S. 2ed .k, and J. Cleveland (Eds.), Performance measurement
anti theory. Hillsdale, N.J: Erlbaum.
SSheder., R., & D'.Andradp, R. (1979). Accurate reflection or
\systematic distortion? A reply to Block, Weiss, and Thorne.
Journal of Personality and Social Psychology, 37, 1075-1084.
Shw"Ader, R., & D'Andrade, R. (1980). The systematic distortion
process. In R. A. Shweder and D. W. Fiske (Eds.), New
directions for methodology of social and behavioral science,
(vol. 4). San Francisco: Jossey-Bass.
Smither, J., & Reilly, R. (1987). True intercorrelation among job

37
components, time delay in rating, and rater intelligence as
determinants of accuracy in performance ratings.
Organizational Behavior and Human Decision Processes, 40, 369-
391.
Sutsky, L., & Balzer, W. (1987). The meaning and measurement of
performance rating accuracy: Some methodological and
theoretical concerns. Manuscript submitted for publication.
Thorndike, E. (1920). A constant error in psychological ratings.
Journal of Applied Psychoto%:, 4, 25-29.
A'
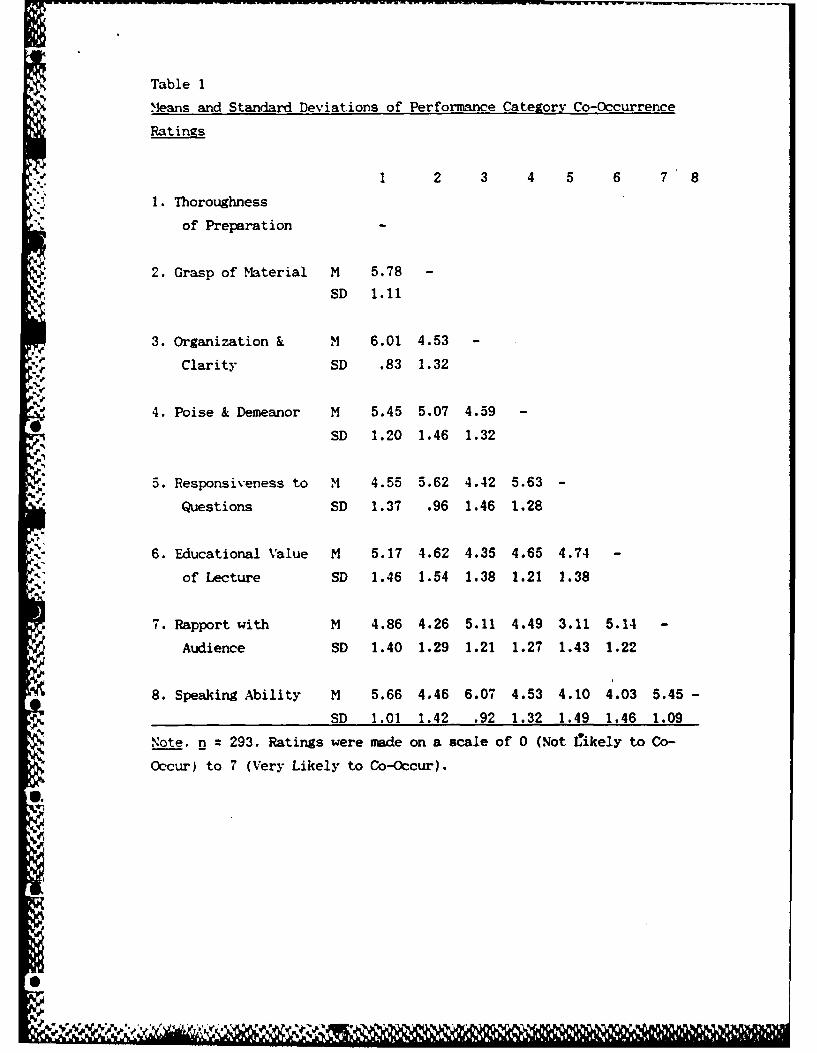
Table 1
Means and Standard Deviations of Performance Category Co-Occurrence
Ratings
1 2 3 4 5 6 7 8
-, 1. Thoroughness
of Preparation -
2. Grasp of Material M 5.78 -
SD 1.11
3. Organization & M 6.01 4.53 -
Clarity SD .83 1.32
4. Poise & Demeanor M 5.45 5.07 4.59
SD 1.20 1.46 1.32
5. Responsiveness to M 4.55 5.62 4.42 5.63 -
Questions SD 1.37 .96 1.46 1.28
6. Educational Value M 5.17 4.62 4.35 4.65 4.74 -
of Lecture SD 1.46 1.54 1.38 1.21 1.38
7. Rapport with M 4.86 4.26 5.11 4.49 3.11 5.14 -
Audience SD 1.40 1.29 1.21 1.27 1.43 1.22
8. Speaking Ability M 5.66 4.46 6.07 4.53 4.10 4.03 5.45 -
SD 1.01 1.42 .92 1.32 1.49 1.46 1.09
Note. n = 293. Ratings were made on a scale of 0 (Not Jikely to Co-
Occur) to 7 (Very Likely to Co-Occur).
S.

Table 2
Means, Standard Deviations, and Correlations for Mean Performance Category
Co-Occurrence Ratings among the Delay Groups
M SD 1 2 3 4
1. Immediate-group 4.79 .68
2. One-day delay group 4.99 .62 .982
3. Two-day delay group 4.89 .71 .977 .975
4. Seven-day delay group 4.81 .75 .963 .977 .976
Note. n = 28. Ratings were made on a scale of 0 (Not Likely to Co-Occur)
to 7 (Very Likely to Co-Occur).
p.,
.'
"p.
et
/ p .k

Table 3Descriptive Statistics for Rating Outcomes and True Halo for Combined andDelay Groups
Combined Immediate 1-day 2-day One-weekn 293 80 79 80 54
Elevation M .37 .33 .38 .36 .45SD .30 .26 .27 .30 .38
Differential Elevation M .60 .58 .53 .66 .61SD .30 .29 .24 .35 .30
Stereotype Accuracy M .33 .33 .34 .33 .33SD .11 .12 .11 .12 .09
Differential Accuracy M .53 .52 .53 .54 .52SD .12 .11 .13 .12 .13
Obser-ed Leniency M .01 .02 .01 -.05 .10SD .39 .38 .35 .44 .39
Leniency Error M -.28 -.22 -.30 -.24 -.38SD .39 .36 .35 .40 .46
Restriction of Range M 1.10 1.11 1.14 1.12 1.02SD .29 .30 .29 .28 .30
Observed Halo M 1.07 1.07 1.13. 1.08 1.00SD .57 .60 .55 .56 .30
Halo Error M -.76 -.82 -.64 -.79 -.81SD .70 .65 .51 .79 .85
Absolute Halo Error N .88 .91 .70 .94 .99SD .55 .51 .43 .59 .63
True Halo M 1.83 1.89 1.76 1.86 1.81* SD .63 .67 .60 .66 .58
Systematic Distortion M .13 .15 .12 :16 .08Index (SDI) SD .24 .25 .22 .23 .24
Note. Halo and SDI values are in Fisher z form. Higher accuracy score valuesindicate lower levels of accuracy. Higher Restriction of Range valuesindicate lower levels of range restriction.
0.

Table - 4
Correlations for Combined and Delay Grous
ELa DELa SA a DA a OH AHE TH SDI
1. Elevation(El)
2. Differential C 01Elevation DO -07
(DEL) D1 04D2 10D7 -05
J, 3. St ereotypie C 16** -05Accuracy DO~ 26* -16
(SA) Dl 15 28**D2 18 -13D7 01 -14
4. Differential C 10 06 2*
Accuracy DO 01 14 31**(DA) DI 22* 09 1*
D2 01 -02 21W D 18 05 41**
5. Observed C 25** -23** 28** 45***Halo DO 17 -33** 46*** 44***(OH) DI 37*** -18 20* 37***
D2 17 -22* 26* 58***D7 30* -20 11 3*
6. Absolute C -07 02 -19*** -35*** -48***
Halo DO -13 29** -23* -31** -42***Error D1 01 04 -20** -40*** -41***(.AHE) D2 02 -17 -23 -39*** -49***
D7 -17 13 -08 -35*** -60***
7. True Halo C 15** 00 05 03 33*** 44****(TH-) DO 13 01 18 12 49*** 48***
D1 28** -02 03 03 60*** 38***D2 21 -16 00 06 18 39**D7 -05 39** -07 -16 -10 2*
8. Systematic C 00 03 -03 -13* -05 -04 -09
Distortion DO -10 07 -09 -29** -16 09 -04
Index DI -02 09 08 05 02 -14 -03(SDI) D2 -07 09 -12 -21 -06 01 -14
D7 13 -16 06 -05 02 -19 -21
(Table continue.)
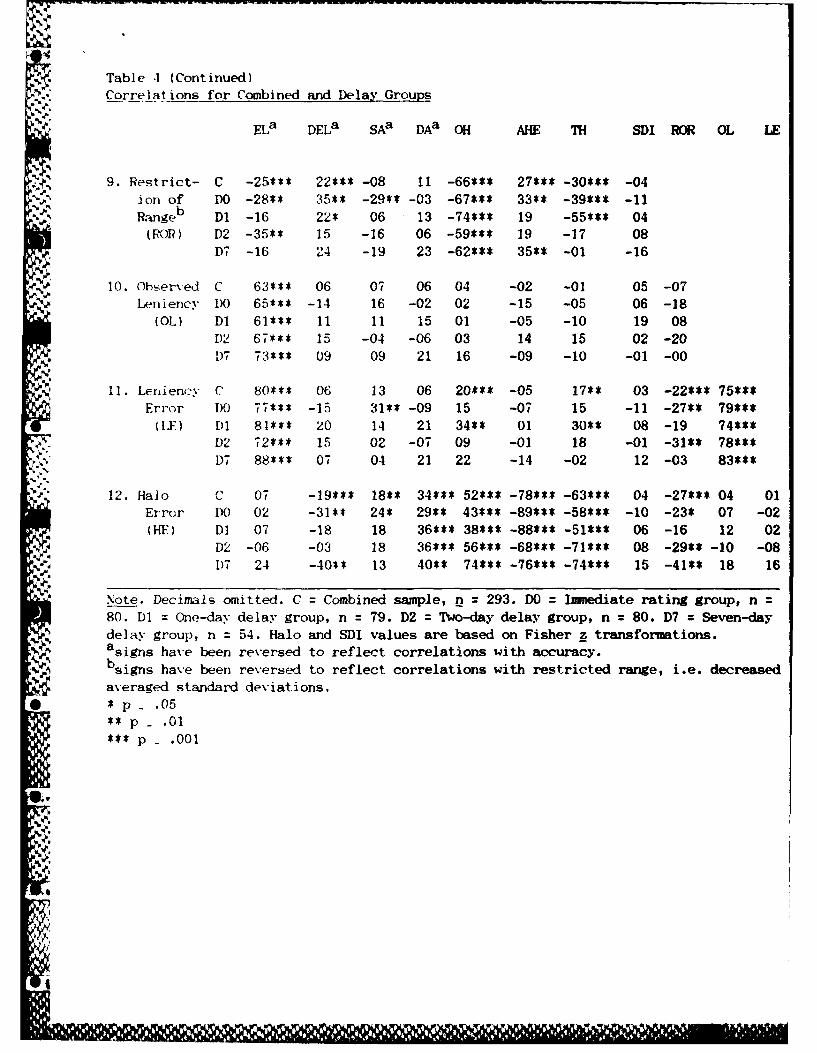
Table -1 (Continued)Co-rrelations for Combined and Delay Group
EUa DELa Sea DAa OH AHE TH SDI 1R)R OL LE
9. Restrict- C -25*** 22*** -08 11 -66*** 27*** -30*** -04ion of DO -28** 35** -29** -03 -67*** 33** -39*** -11Rangeb D1 -16 22* 06 13 -74*** 19 -55*** 04
(RO)R) D2 -35** 15 -16 06 -59*** 19 -17 08D7 -16 244 -19 23 -62*** 35** -01 -16
10. Observed C 63*4* 06 071 06 04 -02 -01 05 -07Leniency DO 65*** -14 16 -02 02 -15 -05 06 -18
(OL) D1 61*** 11 11 15 01 -05 -10 19 081)2 6-1*** 15 -04 -06 03 14 15 02 -20D7 73*** 09 09 21 16 -09 -10 -01 -00
11. Leniency C 80*** 06 13 06 20*** -05 17** 03 -22*** 75$*Error DO 77*** -15 31** -09 15 -07 15 -11 -27** 79***([Y) D)1 8-4*** 20 14 21 34** 01 30** 08 -19 74***
M D 72*** 15 02 -07 09 -01 18 -01 -31** 78***D-1 88*** 071 04 21 22 -14 -02 12 -03 83***
12. Hlo C 07 -19*** 18** 34*** 52*** -78*** -63*** 04 -27*** 04 01Error DO 02 -31** 24* 29** 43*** -89*** -58*** -10 -23* 07 -02HE.) D1 07 -18 18 36*** 38*** -88*** -51*** 06 -16 12 02
NJD2 -06 -03 18 36*** 56$** -68*** -71*** 08 -29** -10 -08D7 24 -40** 13 40** 74*** -76*** -74*** 15 -41** 18 16
A Note. Decimals omitted. C =Combined sample, n =293. DO =Immnediate rating group, n=80. D1 One-day delay group, n =79. D2 = To-day delay group, n = 80. D7 z Seven-daydelay group, n =54. Halo and SDI values are based on Fisher z transformations.asigns haebeen reversed to reflect correlations with accuracy.bsigns have been reversed to reflect correlations with restricted range, i.e. decreasedaveraged standard deviations.
* p .05*p -. 01**p - .001
I

Table 5
Two-Way Analyses of Varian-e: Effects of Rating Delay and True Halo
on Rating Outcomes
Dependent
Variables Source df ms F Fa R*
Elevation Delay 3 .07 .76 2.32 .05
True Halo 1 .38 4.41
True Halo x Delay 3 .10 1.18
Error 285 .09
Differential Delay 3 .28 3.30* 2.91** .07
Elevation True Halo 1 .10 1.13
True Halo x Delay 3 .32 3.84*
Error 285 .08
Stereotype Delay 3 .01 .61 .47 .01
Accuracy True Halo 1 .00 .34
True Halo x Delay 3 .01 .77
Error 285 .01
Differential Delay 3 .01 .89 .50 .01
Accuracy True Halo 1 .00 .01
True Halo x Delay 3 .01 .82
Error 285 .02
Observed Delay 3 1.54 5.59** 8.77*** .18
Halo True Halo 1 7.32 26.52***
True Halo x Delay 3 2.03 7.36***
Error 285 .28
!.9

Table 5 (continued)
Tvwo-1Way Analyses of Variance: Effects of Ratin ]Delay and True Halo
on Rating Outcomes
Dependent
Variables Source df ms F Fa R"
Observed Delay 3 .28 1.84 1.13 .03
Leniency True Halo 1 .02 .16
True Halo x Delay 3 .18 1.17
Error 285 .15
Range Delay 3 .21 2.74* 7.13*** .15
Restriction True Halo 1 1.79 23.81***
True Halo x Delay 3 .33 4.35**
Error 285 .08
Systematic Delay 3 .02 .36 1.20 .03
Distortion True Halo 1 .17 3.16
*Index True Halo x Delay 3 .03 .48
Error 285 .06
afor overall model with 7 and 285 degrees of freedom.
P p< .05 *p < .01 *** p< .0001

Table 6
Systematic Distortion amonU the Delay Groups: Individual and Group-
level Analyses
Level of Analysis n Delay Grou a STACb
Individual c 80 Immediate .15 .13
Individual c 79 One-day delay .12 .15
Individual c 80 To-day delay .16 .08Individual c 54 Seven-day delay .08 .10
Group 28 Immediate .65 .41
Group 28 One-day delay .29 .41
Group 28 Two-day delay .59 .37
Group 28 Seven-day delay .25 .42
Note. All correlation values are in Fisher j form. None of the
- .correlational differences across groups (within levels of analysis)
are significantly different.aSDI = systematic distortion index.
bCOSTAC correlational structure accuracy.
cSDI and COSTAC values for individual level analysis represent means.

Table 7
Effects of Rating Delay and True Halo on Convergent and
Discriminant Validity Indices
Dependent Variable: Convergent Validity Index
Source df us F Model R.; -Model F
True Halo 1 3.15 21.29*** .39 7.438*8
Delay Interval 1 .02 .13
True Halo x
Delay Interval 1 .02 .12
Error 35 .148
Dependent Variable: Discriminant Validity Index
Source df ms F Model R.* Model
True Halo 1 .004 .22 .02 .22
2?Delay Interval 1 .003 .13
True Halo x
Delay Interval 1 .007 .37
Error 35s .019
***p< .0001

Table 8
Group-Level Correlat ions
True Covergent Discriminant
Halo Validity Validity
True Halo
Convergent
Validity .56*** -
Diseriminant
Validity -.04 .20 -
Observed
Halo .62**** .66**** .12
Halo Error -.86**** -.28 .13
Absolute Halo
Error .68$*** .16 -.08
V Restrictionof Range (ROR) -.56*** -.57**** .18
Observed Leniency -.01 -.05 .04
k Leniency Error .34* .52*** .29
Elevation (EL) .31 .51*** .25
Differential
Elevation (DEL) .05 .51** .36*
Stereotype
Accuracy (SA) .27 .21 .46*
Differential
Accuracy (DA) .04 .09 .23
Note. n = 39. Signs of correlations with BO1 and El, DEL, SA
and DA were reversed to reflect range restriction and accuracy.
* p < .05 *$p ( .01 $i*p < .001 ***p < .0001

Figure Caption
Fiture 1. Correlational matrices in the analysis of systematic distortion
effects.
-*

Category Similarity or Co-Oocurrence Matrix
Systematic Distortion
Index (SDI)
Criterion Category Rated Category
Intercorrelation Intercorrelation
Matrix Matrix
Correlational Structure Accuracy (COST;A
of Performance Ratings

Figure CaptionFigre 2. Systematic Distortion Trends for Individual and Group-LevelN-ynI)ses.
85
-I
'U *" " r 1 ' "' ! " '''',i, b' "! r'" ,

-- -- -- -
.25,
.20'
SDI ) OSTAC .15'
.10!
0.00?
-05;
SDI < COSTA'C -1
5..Inediate One-Day Two-Day Seven-Day
Ratings Delay Delay Delay
= Group-level
* z Individual-level
w
I'.
FI
IU