ACXIOM ANNOUNCES SECOND QUARTER RESULTS …...Nov 06, 2013 · ACXIOM ANNOUNCES SECOND QUARTER...
18
For more information, contact: Katharine Boyce Acxiom Investor Relations 501-342-1321 [email protected] EACXM ACXIOM ANNOUNCES SECOND QUARTER RESULTS Successfully Launches Acxiom Audience Operating System™ LITTLE ROCK, Ark. – November 6, 2013 Acxiom® (Nasdaq: ACXM), an enterprise data, analytics and software-as-a-service company, today announced financial results for its second quarter ended September 30, 2013. Revenue was $276 million, down slightly compared to $277 million for the prior-year period. Income from operations decreased to $20 million in the current quarter, compared to $30 million in the prior year. Excluding unusual items, operating income for the quarter decreased 7 percent to $28 million as compared to $30 million in the prior year. Marketing and Data Services revenue increased 1 percent to $201 million in the quarter, compared to $199 million; IT Infrastructure Management revenue decreased 5 percent to $67 million in the current quarter compared to $70 million. Earnings per diluted share attributable to Acxiom stockholders were $0.13 in the current quarter compared to $0.21 in the prior-year quarter. Excluding unusual items, diluted earnings per share of $0.20 decreased slightly as compared to $0.21. Operating cash flow was $170 million for the trailing twelve months, down 4 percent compared to $176 million for the comparable period a year ago. Free cash flow to equity was $69 million for the trailing twelve-month period, compared to $159 million for the comparable period. Free cash flow to equity for the prior-year trailing twelve-month period included $73 million in proceeds from the sale of the company’s background screening business. Free cash flow to equity is a non-GAAP financial measure. A reconciliation to the comparable GAAP measure, operating cash flow, is attached. A schedule is attached to this release outlining the impact of the unusual items on the current and prior- year results. “We are at an inflection point and starting the next chapter in our journey,” said Acxiom CEO Scott Howe. “We are a new company. Over the past two years we have worked to build a better business and to drive innovation. While it’s early, we are pleased with our launch of the Acxiom Audience Operating System and the resulting customer reaction and support.” 1
Transcript of ACXIOM ANNOUNCES SECOND QUARTER RESULTS …...Nov 06, 2013 · ACXIOM ANNOUNCES SECOND QUARTER...
For more information, contact:
Katharine Boyce Acxiom Investor Relations
501-342-1321 [email protected]
EACXM
ACXIOM ANNOUNCES SECOND QUARTER RESULTS
Successfully Launches Acxiom Audience Operating System™
LITTLE ROCK, Ark. – November 6, 2013 Acxiom® (Nasdaq: ACXM), an enterprise data, analytics and software-as-a-service company, today announced financial results for its second quarter ended September 30, 2013. Revenue was $276 million, down slightly compared to $277 million for the prior-year period. Income from operations decreased to $20 million in the current quarter, compared to $30 million in the prior year. Excluding unusual items, operating income for the quarter decreased 7 percent to $28 million as compared to $30 million in the prior year. Marketing and Data Services revenue increased 1 percent to $201 million in the quarter, compared to $199 million; IT Infrastructure Management revenue decreased 5 percent to $67 million in the current quarter compared to $70 million. Earnings per diluted share attributable to Acxiom stockholders were $0.13 in the current quarter compared to $0.21 in the prior-year quarter. Excluding unusual items, diluted earnings per share of $0.20 decreased slightly as compared to $0.21. Operating cash flow was $170 million for the trailing twelve months, down 4 percent compared to $176 million for the comparable period a year ago. Free cash flow to equity was $69 million for the trailing twelve-month period, compared to $159 million for the comparable period. Free cash flow to equity for the prior-year trailing twelve-month period included $73 million in proceeds from the sale of the company’s background screening business. Free cash flow to equity is a non-GAAP financial measure. A reconciliation to the comparable GAAP measure, operating cash flow, is attached. A schedule is attached to this release outlining the impact of the unusual items on the current and prior- year results. “We are at an inflection point and starting the next chapter in our journey,” said Acxiom CEO Scott Howe. “We are a new company. Over the past two years we have worked to build a better business and to drive innovation. While it’s early, we are pleased with our launch of the Acxiom Audience Operating System and the resulting customer reaction and support.”
1
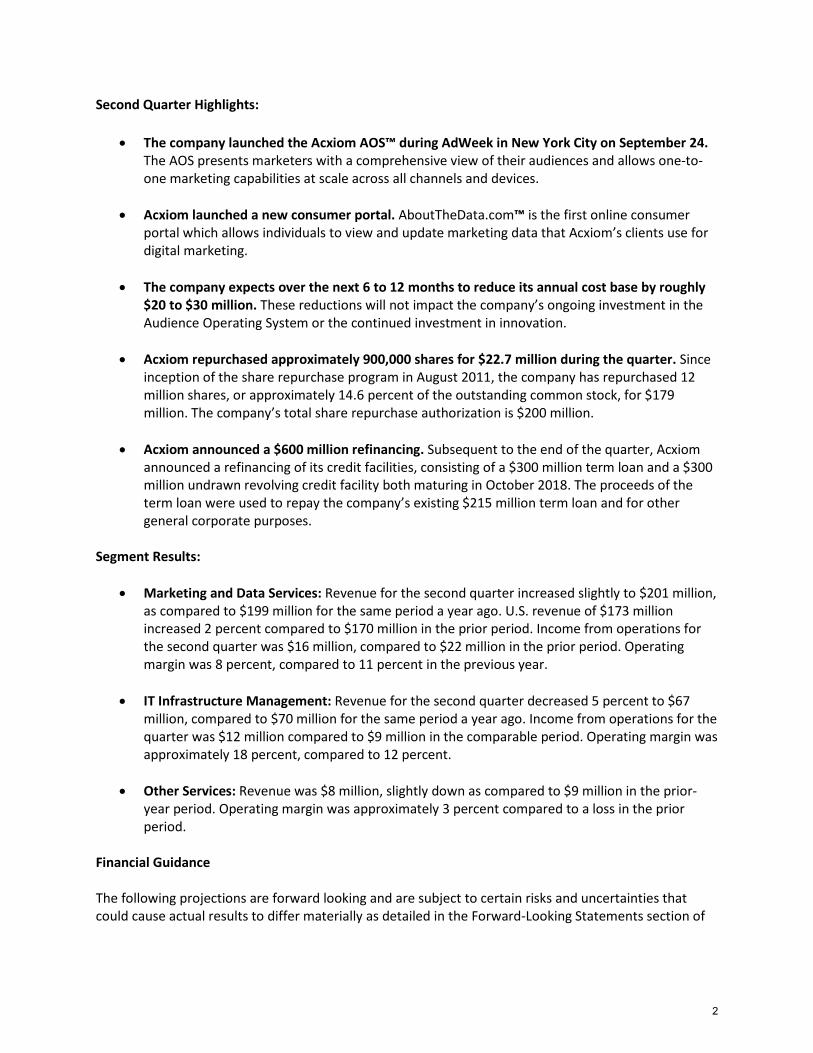
Second Quarter Highlights:
• The company launched the Acxiom AOS™ during AdWeek in New York City on September 24. The AOS presents marketers with a comprehensive view of their audiences and allows one-to-one marketing capabilities at scale across all channels and devices.
• Acxiom launched a new consumer portal. AboutTheData.com™ is the first online consumer portal which allows individuals to view and update marketing data that Acxiom’s clients use for digital marketing.
• The company expects over the next 6 to 12 months to reduce its annual cost base by roughly $20 to $30 million. These reductions will not impact the company’s ongoing investment in the Audience Operating System or the continued investment in innovation.
• Acxiom repurchased approximately 900,000 shares for $22.7 million during the quarter. Since inception of the share repurchase program in August 2011, the company has repurchased 12 million shares, or approximately 14.6 percent of the outstanding common stock, for $179 million. The company’s total share repurchase authorization is $200 million.
• Acxiom announced a $600 million refinancing. Subsequent to the end of the quarter, Acxiom announced a refinancing of its credit facilities, consisting of a $300 million term loan and a $300 million undrawn revolving credit facility both maturing in October 2018. The proceeds of the term loan were used to repay the company’s existing $215 million term loan and for other general corporate purposes.
Segment Results:
• Marketing and Data Services: Revenue for the second quarter increased slightly to $201 million,
as compared to $199 million for the same period a year ago. U.S. revenue of $173 million increased 2 percent compared to $170 million in the prior period. Income from operations for the second quarter was $16 million, compared to $22 million in the prior period. Operating margin was 8 percent, compared to 11 percent in the previous year.
• IT Infrastructure Management: Revenue for the second quarter decreased 5 percent to $67 million, compared to $70 million for the same period a year ago. Income from operations for the quarter was $12 million compared to $9 million in the comparable period. Operating margin was approximately 18 percent, compared to 12 percent.
• Other Services: Revenue was $8 million, slightly down as compared to $9 million in the prior-year period. Operating margin was approximately 3 percent compared to a loss in the prior period.
Financial Guidance The following projections are forward looking and are subject to certain risks and uncertainties that could cause actual results to differ materially as detailed in the Forward-Looking Statements section of
2
this press release. Our guidance excludes unusual items. Acxiom’s estimates for fiscal 2014 are as follows:
• We now expect revenue for the fiscal year to be down slightly as compared to $1.099 billion in fiscal 2013. The slight revenue decrease is driven principally by an expected decline in IT Infrastructure Management.
• We continue to expect earnings per diluted share attributable to Acxiom shareholders to be roughly flat.
Conference Call Acxiom will hold a conference call at 4:00 p.m. CST today to further discuss this information. Interested parties are invited to listen to the call, which will be broadcast via the Internet at www.acxiom.com. A slide presentation will be referenced during the call and can be accessed here. Web Link to Financials You may link to http://www.acxiom.com/FY14_Q2_Financials for the detailed financial information we typically attach to our earnings releases. About Acxiom Acxiom is an enterprise data, analytics and software-as-a-service company that uniquely fuses trust, experience and scale to fuel data-driven results. For over 40 years, Acxiom has been an innovator in harnessing the most important sources and uses of data to strengthen connections between people, businesses and their partners. Utilizing a channel and media neutral approach, we leverage cutting-edge, data-oriented products and services to maximize customer value. Every week, Acxiom powers more than a trillion transactions that enable better living for people and better results for our 7,000+ global clients. For more information about Acxiom, visit Acxiom.com. Forward-Looking Statements This release and today’s conference call may contain forward-looking statements including, without limitation, statements regarding expected levels of revenue and earnings per share for fiscal 2014, statements regarding cost base reductions, and statements regarding future investments, new customers and new product launches and capabilities. Such forward-looking statements are subject to certain risks and uncertainties that could cause actual results to differ materially. The following are factors, among others, that could cause actual results to differ materially from these forward-looking statements: the possibility that certain contracts may not generate the anticipated revenue or profitability or may not be closed within the anticipated time frames; the possibility that significant customers may experience extreme, severe economic difficulty or otherwise reduce the amount of business they do with us; the possibility that we will not successfully complete customer contract requirements on time or meet the service levels specified in the contracts, which may result in contract penalties or lost revenue; the possibility that data suppliers might withdraw data from us, leading to our inability to provide certain products and services to our clients, which could lead to decreases in our operating results; the possibility that we may not be able to attract, retain or motivate qualified technical, sales and leadership associates, or that we may lose key associates; the possibility that we
3
may not be able to adequately adapt to rapidly changing computing environments, technologies and marketing practices; the possibility that we will not be able to continue to receive credit upon satisfactory terms and conditions; the possibility that negative changes in economic conditions in general or other conditions might lead to a reduction in demand for our products and services; the possibility that there will be changes in consumer or business information industries and markets that negatively impact the company; the possibility that the historical seasonality of our business may change; the possibility that we will not be able to achieve cost reductions and avoid unanticipated costs; the possibility that the fair value of certain of our assets may not be equal to the carrying value of those assets now or in future time periods; the possibility that unusual charges may be incurred; the possibility that changes in accounting pronouncements may occur and may impact these forward-looking statements; the possibility that we may encounter difficulties when entering new markets or industries; the possibility that we could experience loss of data center capacity or interruption of telecommunication links; the possibility that new laws may be enacted which limit our ability to provide services to our clients and/or which limit the use of data; and other risks and uncertainties, including those detailed from time to time in our periodic reports filed with the Securities and Exchange Commission, including our current reports on Form 8-K, quarterly reports on Form 10-Q and annual reports on Form 10-K, particularly the discussion under the caption “Item 1A, RISK FACTORS” in our Annual Report on Form 10-K for the year ended March 31, 2013, which was filed with the Securities and Exchange Commission on May 29, 2013. With respect to the provision of products or services outside our primary base of operations in the United States, all of the above factors apply, along with the difficulty of doing business in numerous sovereign jurisdictions due to differences in scale, competition, culture, laws and regulations. We undertake no obligation to update the information contained in this press release or any other forward-looking statement. Acxiom is a registered trademark of Acxiom Corporation. To automatically receive Acxiom Corporation financial news by email, please visit www.acxiom.com and subscribe to email alerts.
4
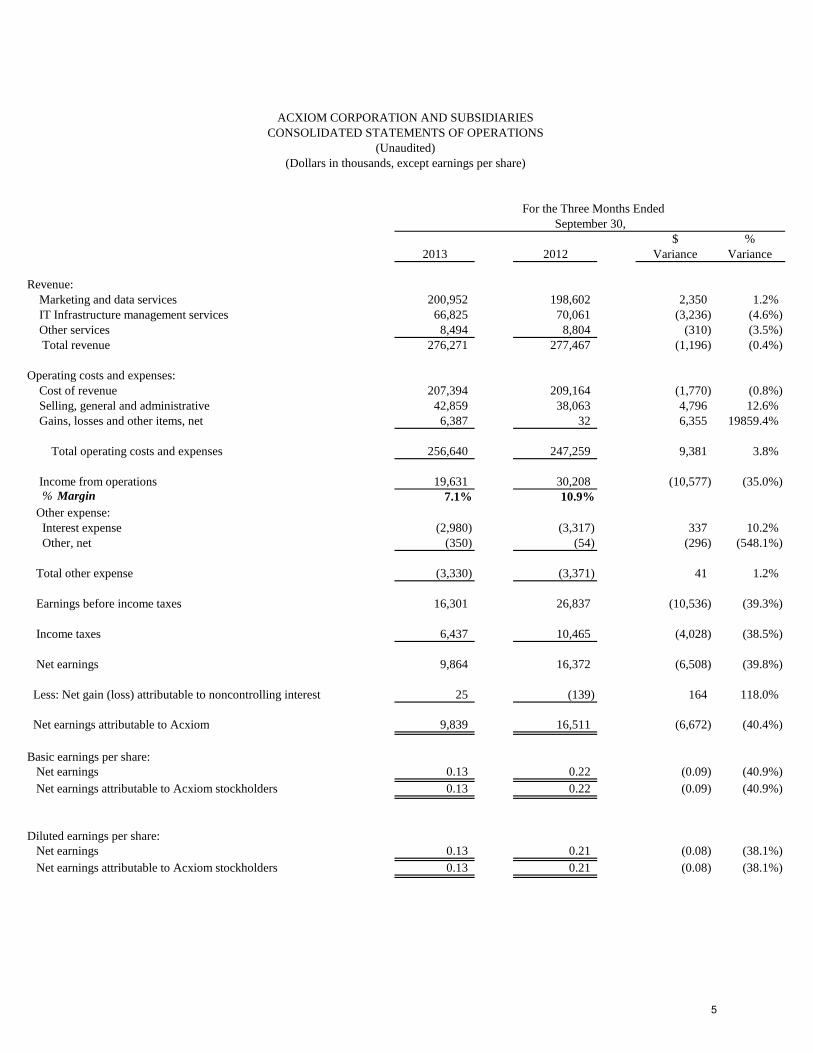
$ %2013 2012 Variance Variance
Revenue: Marketing and data services 200,952 198,602 2,350 1.2% IT Infrastructure management services 66,825 70,061 (3,236) (4.6%) Other services 8,494 8,804 (310) (3.5%) Total revenue 276,271 277,467 (1,196) (0.4%)
Operating costs and expenses: Cost of revenue 207,394 209,164 (1,770) (0.8%) Selling, general and administrative 42,859 38,063 4,796 12.6% Gains, losses and other items, net 6,387 32 6,355 19859.4%
Total operating costs and expenses 256,640 247,259 9,381 3.8%
Income from operations 19,631 30,208 (10,577) (35.0%) % Margin 7.1% 10.9% Other expense: Interest expense (2,980) (3,317) 337 10.2% Other, net (350) (54) (296) (548.1%)
Total other expense (3,330) (3,371) 41 1.2%
Earnings before income taxes 16,301 26,837 (10,536) (39.3%)
Income taxes 6,437 10,465 (4,028) (38.5%)
Net earnings 9,864 16,372 (6,508) (39.8%)
Less: Net gain (loss) attributable to noncontrolling interest 25 (139) 164 118.0%
Net earnings attributable to Acxiom 9,839 16,511 (6,672) (40.4%)
Basic earnings per share: Net earnings 0.13 0.22 (0.09) (40.9%) Net earnings attributable to Acxiom stockholders 0.13 0.22 (0.09) (40.9%)
Diluted earnings per share: Net earnings 0.13 0.21 (0.08) (38.1%) Net earnings attributable to Acxiom stockholders 0.13 0.21 (0.08) (38.1%)
For the Three Months EndedSeptember 30,
ACXIOM CORPORATION AND SUBSIDIARIESCONSOLIDATED STATEMENTS OF OPERATIONS
(Unaudited)(Dollars in thousands, except earnings per share)
5
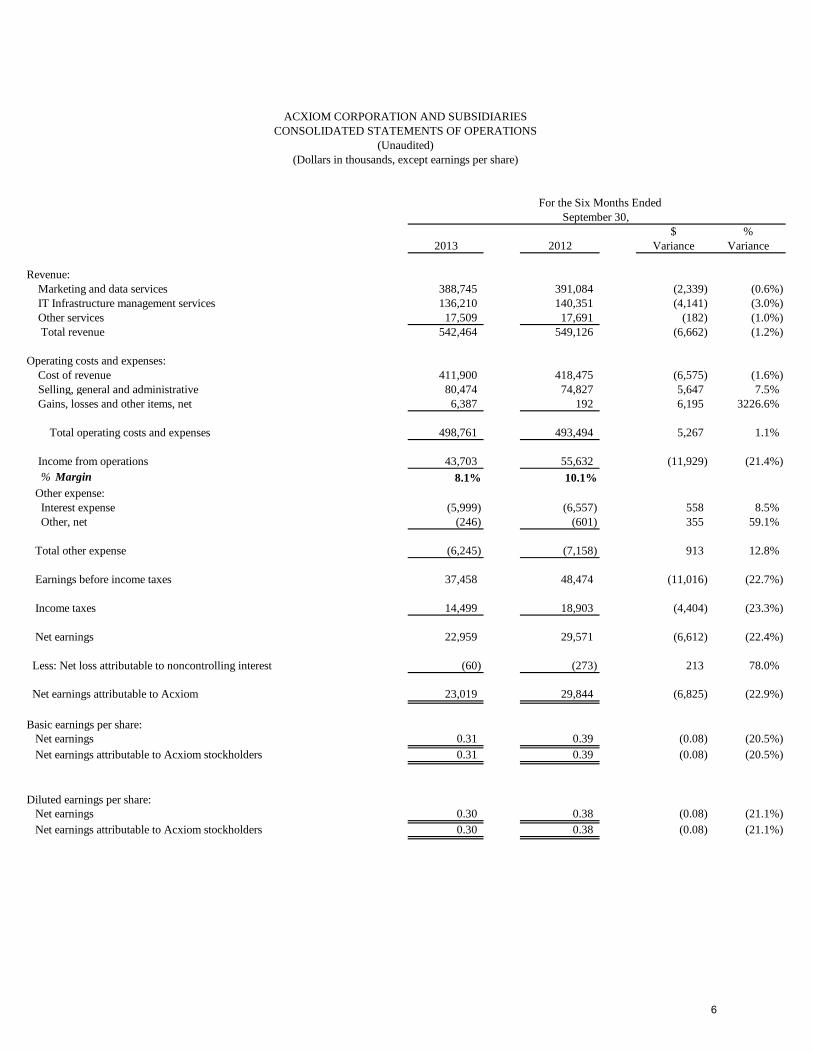
$ %2013 2012 Variance Variance
Revenue: Marketing and data services 388,745 391,084 (2,339) (0.6%) IT Infrastructure management services 136,210 140,351 (4,141) (3.0%) Other services 17,509 17,691 (182) (1.0%) Total revenue 542,464 549,126 (6,662) (1.2%)
Operating costs and expenses: Cost of revenue 411,900 418,475 (6,575) (1.6%) Selling, general and administrative 80,474 74,827 5,647 7.5% Gains, losses and other items, net 6,387 192 6,195 3226.6%
Total operating costs and expenses 498,761 493,494 5,267 1.1%
Income from operations 43,703 55,632 (11,929) (21.4%) % Margin 8.1% 10.1% Other expense: Interest expense (5,999) (6,557) 558 8.5% Other, net (246) (601) 355 59.1%
Total other expense (6,245) (7,158) 913 12.8%
Earnings before income taxes 37,458 48,474 (11,016) (22.7%)
Income taxes 14,499 18,903 (4,404) (23.3%)
Net earnings 22,959 29,571 (6,612) (22.4%)
Less: Net loss attributable to noncontrolling interest (60) (273) 213 78.0%
Net earnings attributable to Acxiom 23,019 29,844 (6,825) (22.9%)
Basic earnings per share: Net earnings 0.31 0.39 (0.08) (20.5%) Net earnings attributable to Acxiom stockholders 0.31 0.39 (0.08) (20.5%)
Diluted earnings per share: Net earnings 0.30 0.38 (0.08) (21.1%) Net earnings attributable to Acxiom stockholders 0.30 0.38 (0.08) (21.1%)
September 30,
ACXIOM CORPORATION AND SUBSIDIARIESCONSOLIDATED STATEMENTS OF OPERATIONS
(Unaudited)(Dollars in thousands, except earnings per share)
For the Six Months Ended
6
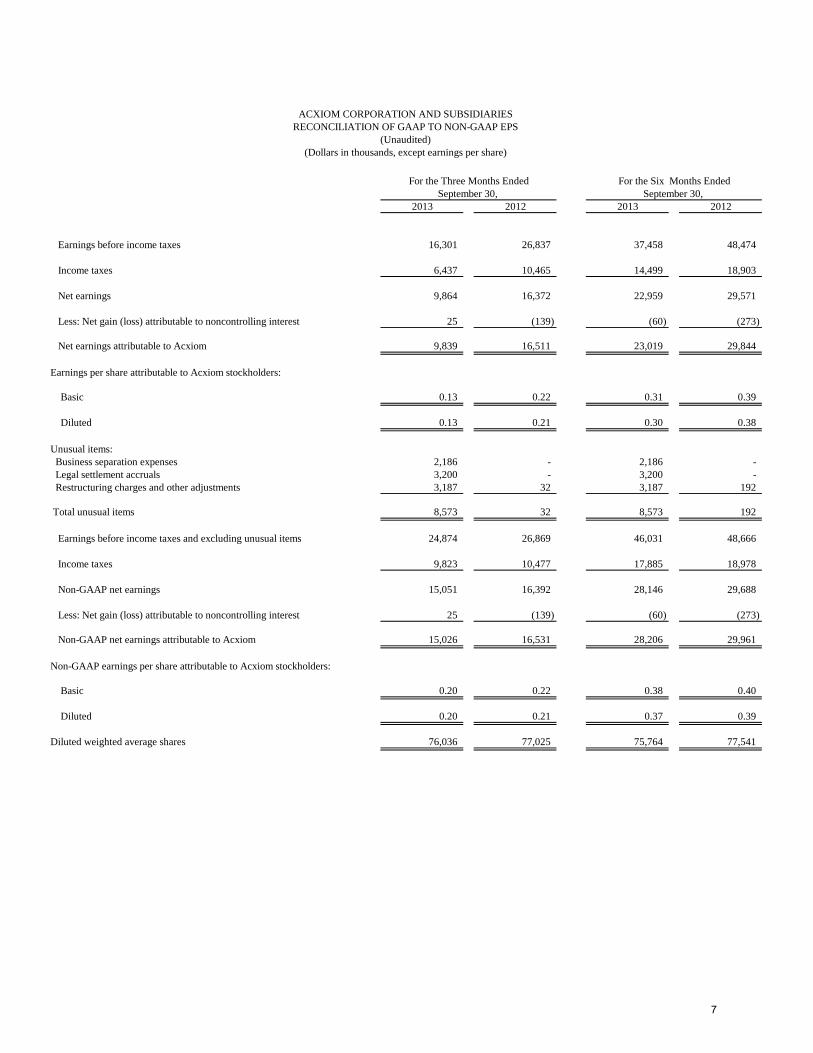
ACXIOM CORPORATION AND SUBSIDIARIESRECONCILIATION OF GAAP TO NON-GAAP EPS
(Unaudited)(Dollars in thousands, except earnings per share)
2013 2012 2013 2012
Earnings before income taxes 16,301 26,837 37,458 48,474
Income taxes 6,437 10,465 14,499 18,903
Net earnings 9,864 16,372 22,959 29,571
Less: Net gain (loss) attributable to noncontrolling interest 25 (139) (60) (273)
Net earnings attributable to Acxiom 9,839 16,511 23,019 29,844
Earnings per share attributable to Acxiom stockholders:
Basic 0.13 0.22 0.31 0.39
Diluted 0.13 0.21 0.30 0.38
Unusual items: Business separation expenses 2,186 - 2,186 - Legal settlement accruals 3,200 - 3,200 - Restructuring charges and other adjustments 3,187 32 3,187 192
Total unusual items 8,573 32 8,573 192
Earnings before income taxes and excluding unusual items 24,874 26,869 46,031 48,666
Income taxes 9,823 10,477 17,885 18,978
Non-GAAP net earnings 15,051 16,392 28,146 29,688
Less: Net gain (loss) attributable to noncontrolling interest 25 (139) (60) (273)
Non-GAAP net earnings attributable to Acxiom 15,026 16,531 28,206 29,961
Non-GAAP earnings per share attributable to Acxiom stockholders:
Basic 0.20 0.22 0.38 0.40
Diluted 0.20 0.21 0.37 0.39
Diluted weighted average shares 76,036 77,025 75,764 77,541
For the Three Months Ended For the Six Months EndedSeptember 30, September 30,
7
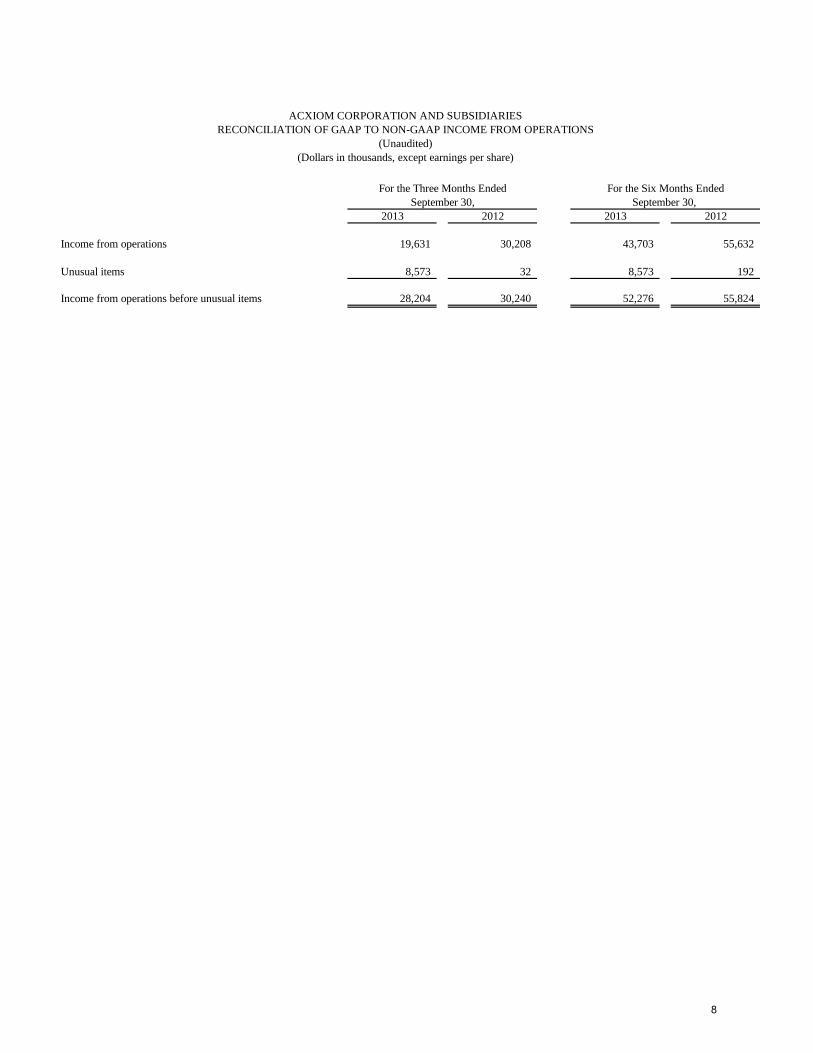
ACXIOM CORPORATION AND SUBSIDIARIESRECONCILIATION OF GAAP TO NON-GAAP INCOME FROM OPERATIONS
(Unaudited)(Dollars in thousands, except earnings per share)
2013 2012 2013 2012
Income from operations 19,631 30,208 43,703 55,632
Unusual items 8,573 32 8,573 192
Income from operations before unusual items 28,204 30,240 52,276 55,824
For the Three Months Ended For the Six Months EndedSeptember 30, September 30,
8

September 30, September 30, 2013 2012
Basic earnings per share: Numerator - net earnings 9,864 16,372 Denominator - weighted-average shares outstanding 73,778 75,009 Basic earnings per share 0.13 0.22
Basic earnings per share - net earnings attributable to Acxiom stockholders: Numerator - net earnings attributable to Acxiom 9,839 16,511 Denominator - weighted-average shares outstanding 73,778 75,009 Basic earnings per share - net earnings attributable to Acxiom stockholders 0.13 0.22
Diluted earnings per share: Numerator - net earnings 9,864 16,372 Denominator - weighted-average shares outstanding 73,778 75,009 Dilutive effect of common stock options, warrants and restricted stock 2,258 2,016
76,036 77,025
Diluted earnings per share 0.13 0.21
Diluted earnings per share - net earnings attributable to Acxiom stockholders: Numerator - net earnings attributable to Acxiom 9,839 16,511 Denominator - weighted-average shares outstanding 73,778 75,009 Dilutive effect of common stock options, warrants, and restricted stock 2,258 2,016
76,036 77,025
Diluted earnings per share - net earnings attributable to Acxiom stockholders 0.13 0.21
For the Three Months Ended
ACXIOM CORPORATION AND SUBSIDIARIESCALCULATION OF EARNINGS PER SHARE
(Unaudited)(In thousands, except earnings per share)
9
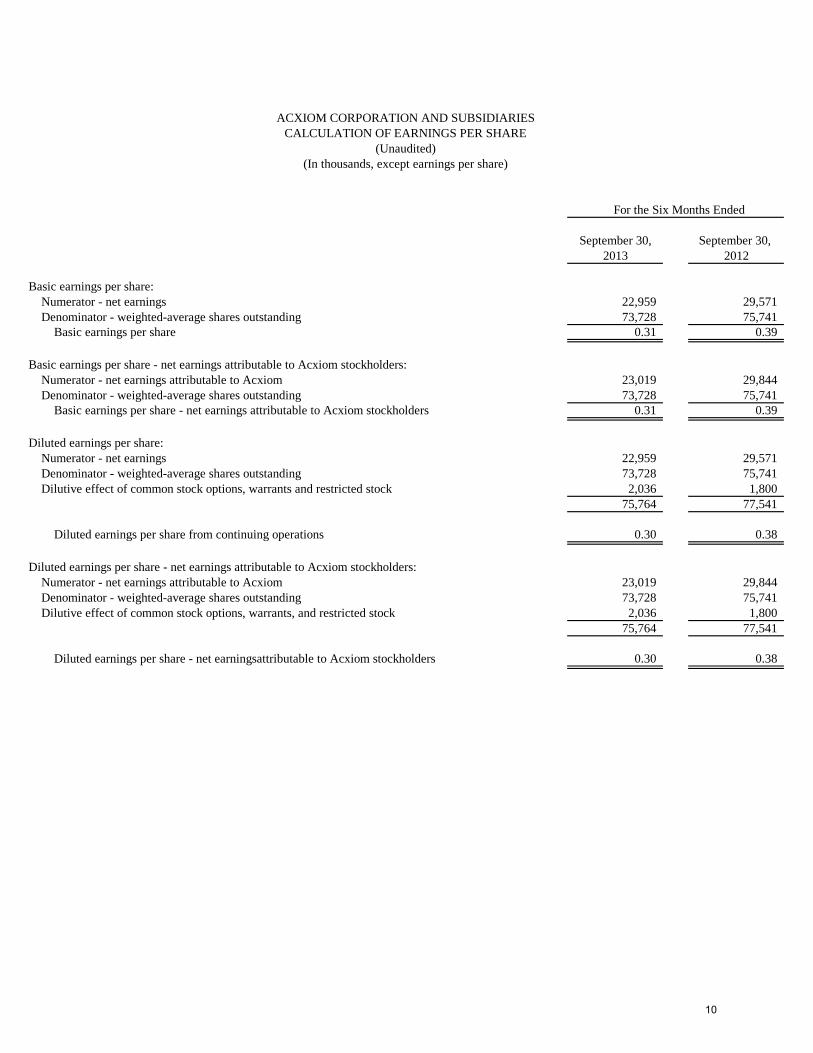
September 30, September 30, 2013 2012
Basic earnings per share: Numerator - net earnings 22,959 29,571 Denominator - weighted-average shares outstanding 73,728 75,741 Basic earnings per share 0.31 0.39
Basic earnings per share - net earnings attributable to Acxiom stockholders: Numerator - net earnings attributable to Acxiom 23,019 29,844 Denominator - weighted-average shares outstanding 73,728 75,741 Basic earnings per share - net earnings attributable to Acxiom stockholders 0.31 0.39
Diluted earnings per share: Numerator - net earnings 22,959 29,571 Denominator - weighted-average shares outstanding 73,728 75,741 Dilutive effect of common stock options, warrants and restricted stock 2,036 1,800
75,764 77,541
Diluted earnings per share from continuing operations 0.30 0.38
Diluted earnings per share - net earnings attributable to Acxiom stockholders: Numerator - net earnings attributable to Acxiom 23,019 29,844 Denominator - weighted-average shares outstanding 73,728 75,741 Dilutive effect of common stock options, warrants, and restricted stock 2,036 1,800
75,764 77,541
Diluted earnings per share - net earningsattributable to Acxiom stockholders 0.30 0.38
ACXIOM CORPORATION AND SUBSIDIARIESCALCULATION OF EARNINGS PER SHARE
(Unaudited)(In thousands, except earnings per share)
For the Six Months Ended
10
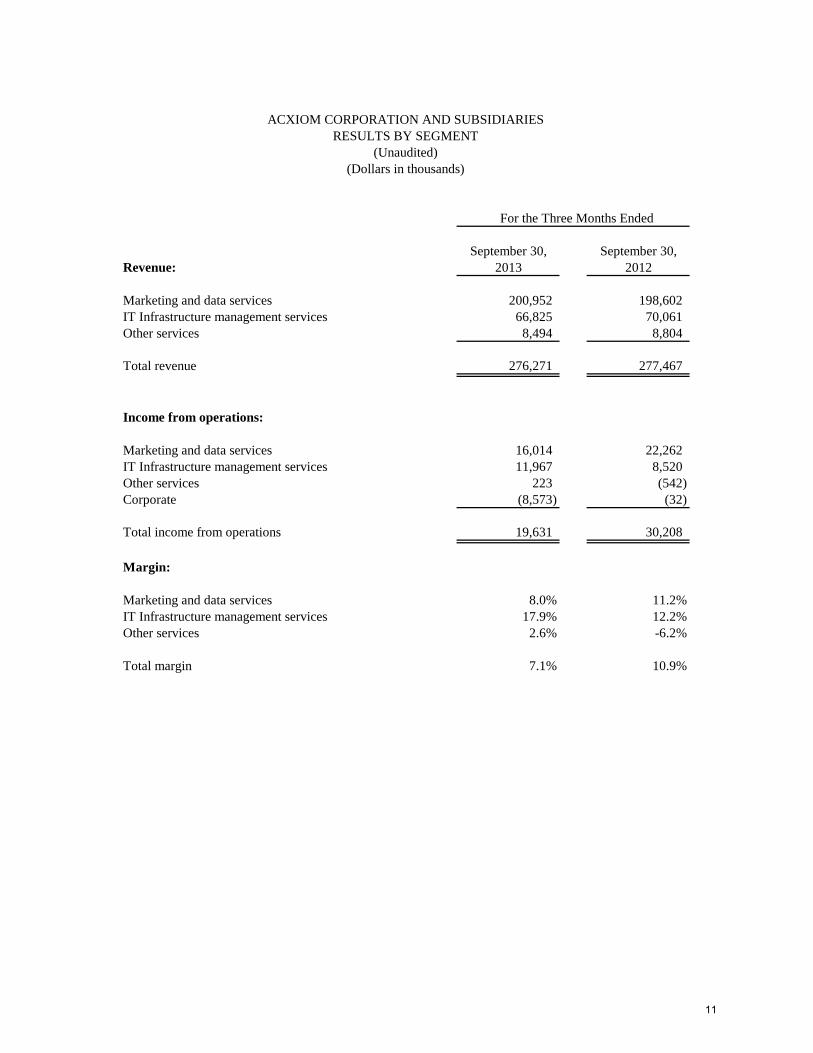
September 30, September 30,Revenue: 2013 2012
Marketing and data services 200,952 198,602IT Infrastructure management services 66,825 70,061Other services 8,494 8,804
Total revenue 276,271 277,467
Income from operations:
Marketing and data services 16,014 22,262IT Infrastructure management services 11,967 8,520Other services 223 (542)Corporate (8,573) (32)
Total income from operations 19,631 30,208
Margin:
Marketing and data services 8.0% 11.2%IT Infrastructure management services 17.9% 12.2%Other services 2.6% -6.2%
Total margin 7.1% 10.9%
ACXIOM CORPORATION AND SUBSIDIARIESRESULTS BY SEGMENT
(Unaudited)(Dollars in thousands)
For the Three Months Ended
11

September 30, September 30, Revenue: 2013 2012
Marketing and data services 388,745 391,084IT Infrastructure management services 136,210 140,351Other services 17,509 17,691
Total revenue 542,464 549,126
Income from operations:
Marketing and data services 28,671 40,965IT Infrastructure management services 22,728 17,351Other services 877 (2,492)Corporate (8,573) (192)
Total income from operations 43,703 55,632
Margin:
Marketing and data services 7.4% 10.5%IT Infrastructure management services 16.7% 12.4%Other services 5.0% -14.1%
Total margin 8.1% 10.1%
ACXIOM CORPORATION AND SUBSIDIARIESRESULTS BY SEGMENT
(Unaudited)(Dollars in thousands)
For the Six Months Ended
12
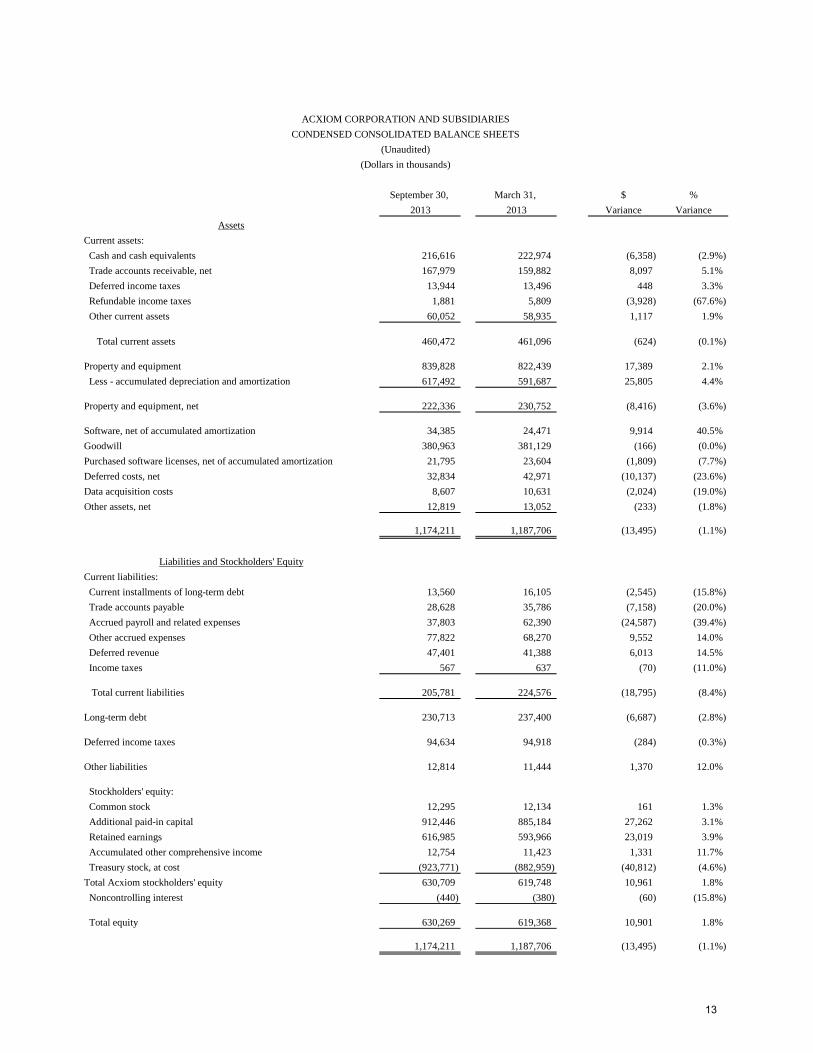
ACXIOM CORPORATION AND SUBSIDIARIESCONDENSED CONSOLIDATED BALANCE SHEETS
(Unaudited)(Dollars in thousands)
September 30, March 31, $ %2013 2013 Variance Variance
AssetsCurrent assets: Cash and cash equivalents 216,616 222,974 (6,358) (2.9%) Trade accounts receivable, net 167,979 159,882 8,097 5.1% Deferred income taxes 13,944 13,496 448 3.3% Refundable income taxes 1,881 5,809 (3,928) (67.6%) Other current assets 60,052 58,935 1,117 1.9%
Total current assets 460,472 461,096 (624) (0.1%)
Property and equipment 839,828 822,439 17,389 2.1% Less - accumulated depreciation and amortization 617,492 591,687 25,805 4.4%
Property and equipment, net 222,336 230,752 (8,416) (3.6%)
Software, net of accumulated amortization 34,385 24,471 9,914 40.5%Goodwill 380,963 381,129 (166) (0.0%)Purchased software licenses, net of accumulated amortization 21,795 23,604 (1,809) (7.7%)Deferred costs, net 32,834 42,971 (10,137) (23.6%)Data acquisition costs 8,607 10,631 (2,024) (19.0%)Other assets, net 12,819 13,052 (233) (1.8%)
1,174,211 1,187,706 (13,495) (1.1%)
Liabilities and Stockholders' EquityCurrent liabilities: Current installments of long-term debt 13,560 16,105 (2,545) (15.8%) Trade accounts payable 28,628 35,786 (7,158) (20.0%) Accrued payroll and related expenses 37,803 62,390 (24,587) (39.4%) Other accrued expenses 77,822 68,270 9,552 14.0% Deferred revenue 47,401 41,388 6,013 14.5% Income taxes 567 637 (70) (11.0%)
Total current liabilities 205,781 224,576 (18,795) (8.4%)
Long-term debt 230,713 237,400 (6,687) (2.8%)
Deferred income taxes 94,634 94,918 (284) (0.3%)
Other liabilities 12,814 11,444 1,370 12.0%
Stockholders' equity: Common stock 12,295 12,134 161 1.3% Additional paid-in capital 912,446 885,184 27,262 3.1% Retained earnings 616,985 593,966 23,019 3.9% Accumulated other comprehensive income 12,754 11,423 1,331 11.7% Treasury stock, at cost (923,771) (882,959) (40,812) (4.6%)Total Acxiom stockholders' equity 630,709 619,748 10,961 1.8% Noncontrolling interest (440) (380) (60) (15.8%)
Total equity 630,269 619,368 10,901 1.8%
1,174,211 1,187,706 (13,495) (1.1%)
13
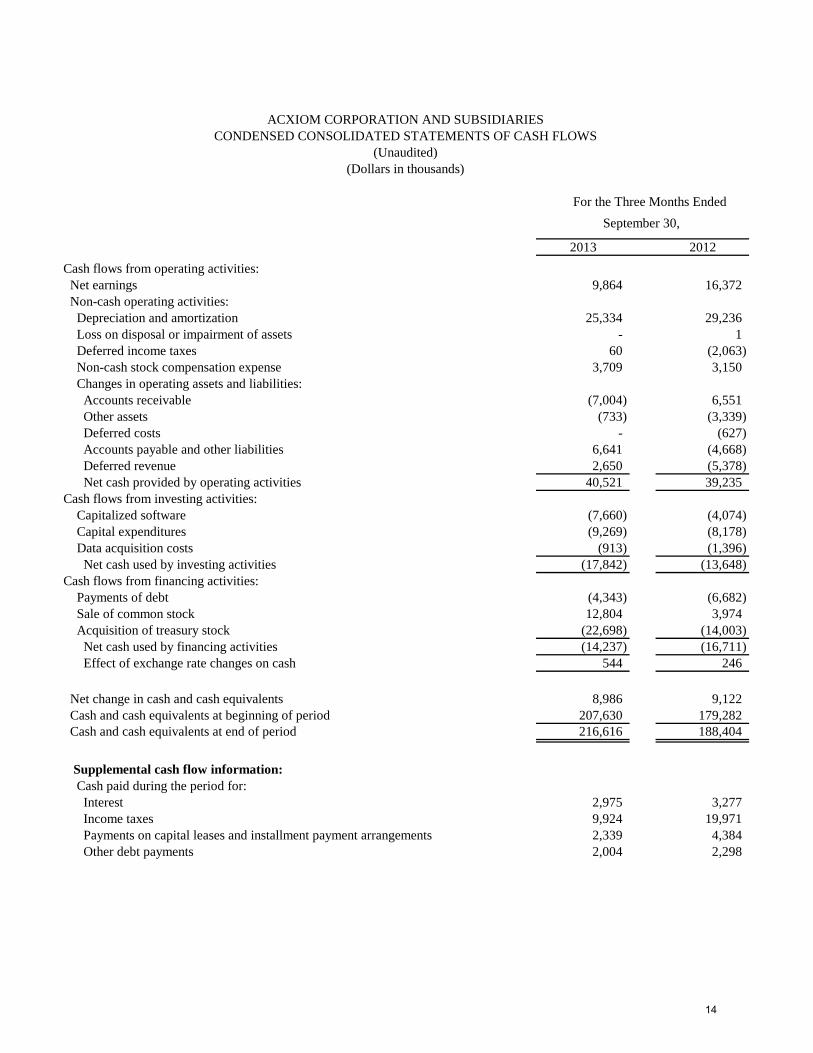
For the Three Months EndedSeptember 30,
2013 2012Cash flows from operating activities: Net earnings 9,864 16,372 Non-cash operating activities: Depreciation and amortization 25,334 29,236 Loss on disposal or impairment of assets - 1 Deferred income taxes 60 (2,063) Non-cash stock compensation expense 3,709 3,150 Changes in operating assets and liabilities: Accounts receivable (7,004) 6,551 Other assets (733) (3,339) Deferred costs - (627) Accounts payable and other liabilities 6,641 (4,668) Deferred revenue 2,650 (5,378) Net cash provided by operating activities 40,521 39,235 Cash flows from investing activities: Capitalized software (7,660) (4,074) Capital expenditures (9,269) (8,178) Data acquisition costs (913) (1,396) Net cash used by investing activities (17,842) (13,648)Cash flows from financing activities: Payments of debt (4,343) (6,682) Sale of common stock 12,804 3,974 Acquisition of treasury stock (22,698) (14,003) Net cash used by financing activities (14,237) (16,711) Effect of exchange rate changes on cash 544 246
Net change in cash and cash equivalents 8,986 9,122 Cash and cash equivalents at beginning of period 207,630 179,282 Cash and cash equivalents at end of period 216,616 188,404
Supplemental cash flow information: Cash paid during the period for: Interest 2,975 3,277 Income taxes 9,924 19,971 Payments on capital leases and installment payment arrangements 2,339 4,384 Other debt payments 2,004 2,298
ACXIOM CORPORATION AND SUBSIDIARIESCONDENSED CONSOLIDATED STATEMENTS OF CASH FLOWS
(Unaudited)(Dollars in thousands)
14
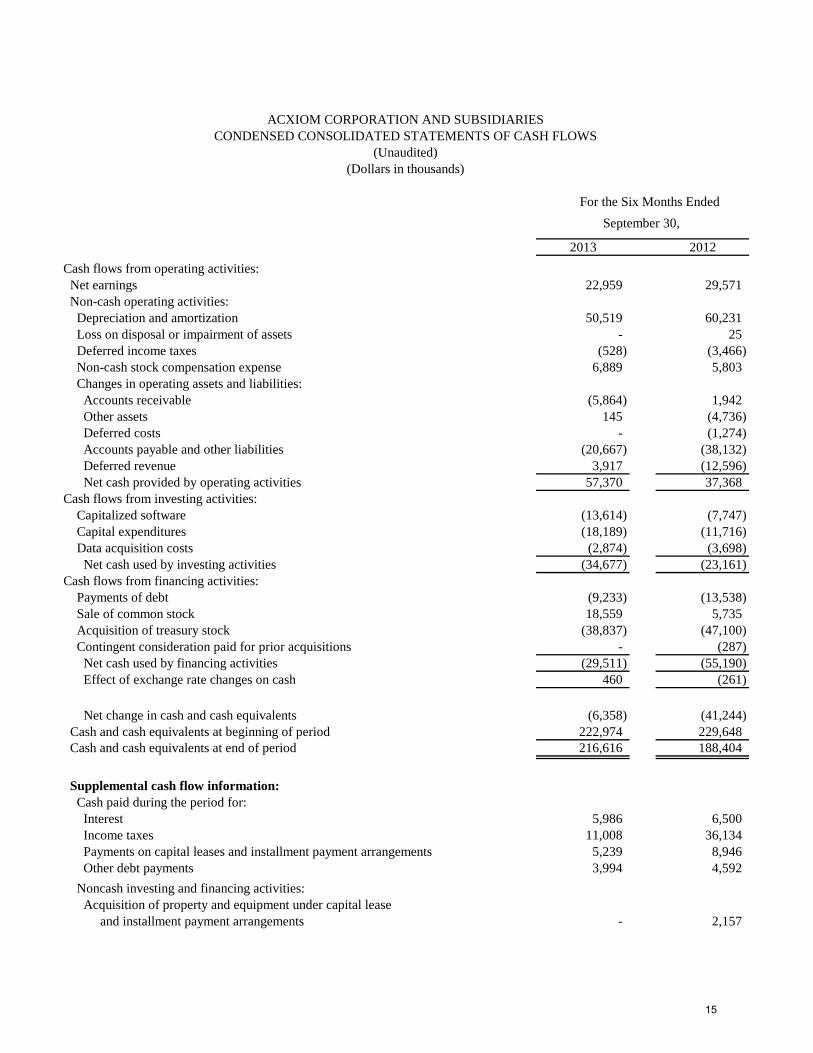
For the Six Months EndedSeptember 30,
2013 2012Cash flows from operating activities: Net earnings 22,959 29,571 Non-cash operating activities: Depreciation and amortization 50,519 60,231 Loss on disposal or impairment of assets - 25 Deferred income taxes (528) (3,466) Non-cash stock compensation expense 6,889 5,803 Changes in operating assets and liabilities: Accounts receivable (5,864) 1,942 Other assets 145 (4,736) Deferred costs - (1,274) Accounts payable and other liabilities (20,667) (38,132) Deferred revenue 3,917 (12,596) Net cash provided by operating activities 57,370 37,368 Cash flows from investing activities: Capitalized software (13,614) (7,747) Capital expenditures (18,189) (11,716) Data acquisition costs (2,874) (3,698) Net cash used by investing activities (34,677) (23,161)Cash flows from financing activities: Payments of debt (9,233) (13,538) Sale of common stock 18,559 5,735 Acquisition of treasury stock (38,837) (47,100) Contingent consideration paid for prior acquisitions - (287) Net cash used by financing activities (29,511) (55,190) Effect of exchange rate changes on cash 460 (261)
Net change in cash and cash equivalents (6,358) (41,244) Cash and cash equivalents at beginning of period 222,974 229,648 Cash and cash equivalents at end of period 216,616 188,404
Supplemental cash flow information: Cash paid during the period for: Interest 5,986 6,500 Income taxes 11,008 36,134 Payments on capital leases and installment payment arrangements 5,239 8,946 Other debt payments 3,994 4,592 Noncash investing and financing activities: Acquisition of property and equipment under capital lease and installment payment arrangements - 2,157
ACXIOM CORPORATION AND SUBSIDIARIESCONDENSED CONSOLIDATED STATEMENTS OF CASH FLOWS
(Unaudited)(Dollars in thousands)
15
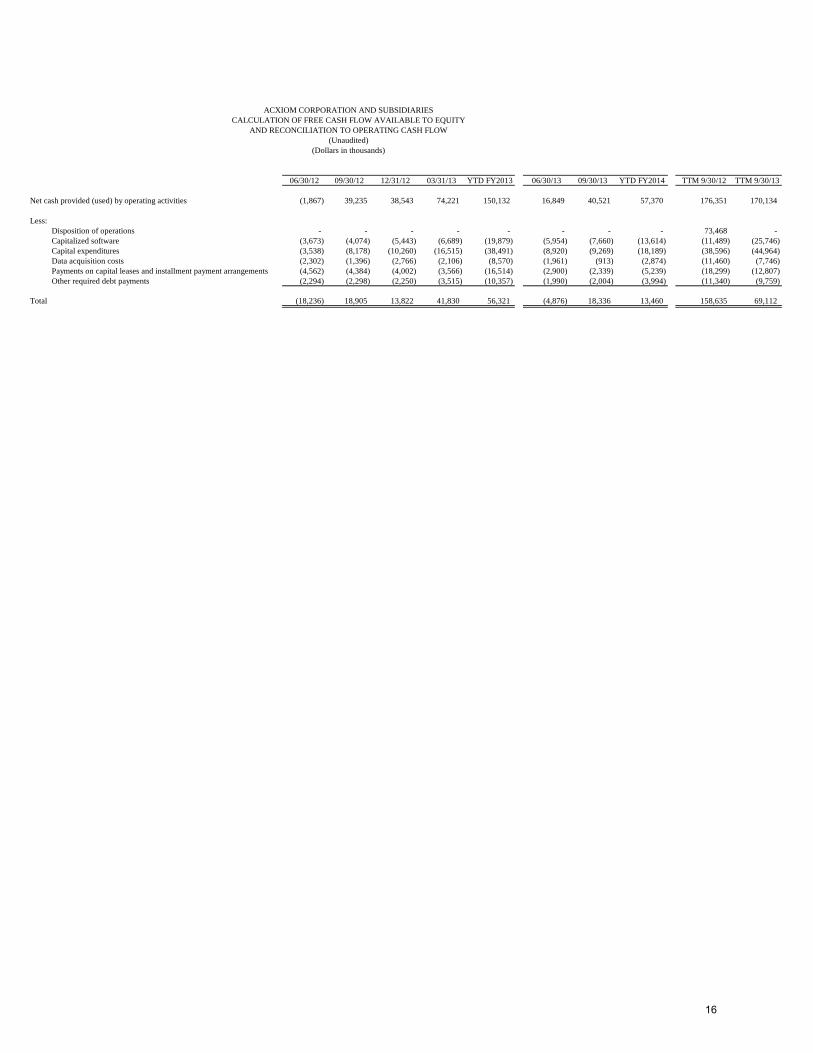
06/30/12 09/30/12 12/31/12 03/31/13 YTD FY2013 06/30/13 09/30/13 YTD FY2014 TTM 9/30/12 TTM 9/30/13
Net cash provided (used) by operating activities (1,867) 39,235 38,543 74,221 150,132 16,849 40,521 57,370 176,351 170,134
Less: Disposition of operations - - - - - - - - 73,468 - Capitalized software (3,673) (4,074) (5,443) (6,689) (19,879) (5,954) (7,660) (13,614) (11,489) (25,746) Capital expenditures (3,538) (8,178) (10,260) (16,515) (38,491) (8,920) (9,269) (18,189) (38,596) (44,964) Data acquisition costs (2,302) (1,396) (2,766) (2,106) (8,570) (1,961) (913) (2,874) (11,460) (7,746) Payments on capital leases and installment payment arrangements (4,562) (4,384) (4,002) (3,566) (16,514) (2,900) (2,339) (5,239) (18,299) (12,807) Other required debt payments (2,294) (2,298) (2,250) (3,515) (10,357) (1,990) (2,004) (3,994) (11,340) (9,759)
Total (18,236) 18,905 13,822 41,830 56,321 (4,876) 18,336 13,460 158,635 69,112
ACXIOM CORPORATION AND SUBSIDIARIESCALCULATION OF FREE CASH FLOW AVAILABLE TO EQUITY
AND RECONCILIATION TO OPERATING CASH FLOW(Unaudited)
(Dollars in thousands)
16

06/30/12 09/30/12 12/31/12 03/31/13 YTD FY2013 06/30/13 09/30/13 YTD FY2014 % $Revenue:
Marketing and data services 192,482 198,602 195,146 202,510 788,740 187,793 200,952 388,745 1.2% 2,350IT Infrastructure management services 70,290 70,061 69,916 65,202 275,469 69,385 66,825 136,210 -4.6% (3,236)Other services 8,887 8,804 8,040 9,419 35,150 9,015 8,494 17,509 -3.5% (310) Total revenue 271,659 277,467 273,102 277,131 1,099,359 266,193 276,271 542,464 -0.4% (1,196)
Operating costs and expenses:Cost of revenue 209,311 209,164 208,848 213,317 840,640 204,506 207,394 411,900 -0.8% (1,770)Selling, general and administrative 36,764 38,063 37,482 41,681 153,990 37,615 42,859 80,474 12.6% 4,796Gains, losses and other items, net 160 32 (126) 1,944 2,010 - 6,387 6,387 19859.4% 6,355
Total operating costs and expenses 246,235 247,259 246,204 256,942 996,640 242,121 256,640 498,761 3.8% 9,381
Income from operations 25,424 30,208 26,898 20,189 102,719 24,072 19,631 43,703 -35.0% (10,577) % Margin 9.4% 10.9% 9.8% 7.3% 9.3% 9.0% 7.1% 8.1%Other expense Interest expense (3,240) (3,317) (3,178) (2,959) (12,694) (3,019) (2,980) (5,999) 10.2% 337 Other, net (547) (54) 565 188 152 104 (350) (246) -548.1% (296)Total other expense (3,787) (3,371) (2,613) (2,771) (12,542) (2,915) (3,330) (6,245) 1.2% 41
Earnings before income taxes 21,637 26,837 24,285 17,418 90,177 21,157 16,301 37,458 -39.3% (10,536)Income taxes 8,438 10,465 9,836 4,319 33,058 8,062 6,437 14,499 -38.5% (4,028)
Net earnings 13,199 16,372 14,449 13,099 57,119 13,095 9,864 22,959 -39.8% (6,508)
Less: Net gain (loss) attributable to noncontrolling interest (134) (139) (76) (139) (488) (85) 25 (60) 118.0% 164
Net earnings attributable to Acxiom 13,333 16,511 14,525 13,238 57,607 13,180 9,839 23,019 -40.4% (6,672)
Diluted earnings per share - net earnings attributable to Acxiom stockholders 0.17 0.21 0.19 0.18 0.75 0.17 0.13 0.30 -38.1% (0.08)
CONSOLIDATED STATEMENTS OF OPERATIONS(Unaudited)
(Dollars in thousands, except earnings per share)
Q2 FY14 to Q2 FY13
17
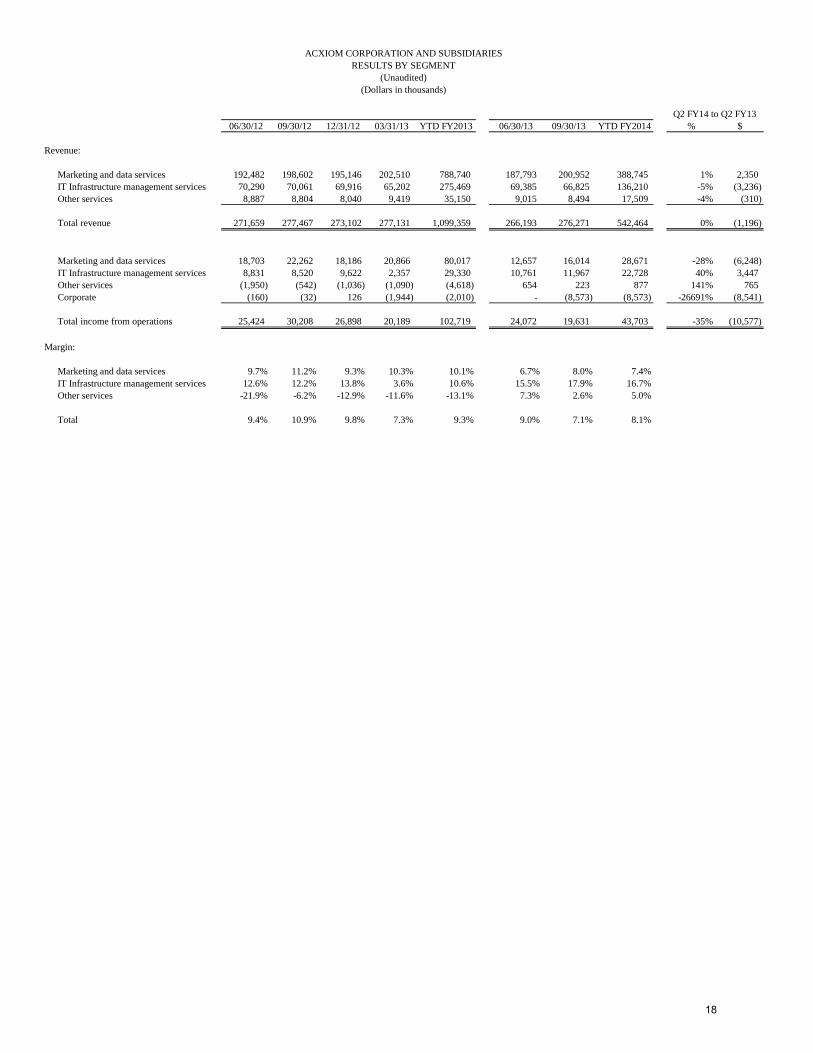
ACXIOM CORPORATION AND SUBSIDIARIES
Q2 FY14 to Q2 FY1306/30/12 09/30/12 12/31/12 03/31/13 YTD FY2013 06/30/13 09/30/13 YTD FY2014 % $
Revenue:
Marketing and data services 192,482 198,602 195,146 202,510 788,740 187,793 200,952 388,745 1% 2,350IT Infrastructure management services 70,290 70,061 69,916 65,202 275,469 69,385 66,825 136,210 -5% (3,236)Other services 8,887 8,804 8,040 9,419 35,150 9,015 8,494 17,509 -4% (310)
Total revenue 271,659 277,467 273,102 277,131 1,099,359 266,193 276,271 542,464 0% (1,196)
Marketing and data services 18,703 22,262 18,186 20,866 80,017 12,657 16,014 28,671 -28% (6,248)IT Infrastructure management services 8,831 8,520 9,622 2,357 29,330 10,761 11,967 22,728 40% 3,447Other services (1,950) (542) (1,036) (1,090) (4,618) 654 223 877 141% 765Corporate (160) (32) 126 (1,944) (2,010) - (8,573) (8,573) -26691% (8,541)
Total income from operations 25,424 30,208 26,898 20,189 102,719 24,072 19,631 43,703 -35% (10,577)
Margin:
Marketing and data services 9.7% 11.2% 9.3% 10.3% 10.1% 6.7% 8.0% 7.4%IT Infrastructure management services 12.6% 12.2% 13.8% 3.6% 10.6% 15.5% 17.9% 16.7%Other services -21.9% -6.2% -12.9% -11.6% -13.1% 7.3% 2.6% 5.0%
Total 9.4% 10.9% 9.8% 7.3% 9.3% 9.0% 7.1% 8.1%
RESULTS BY SEGMENT(Unaudited)
(Dollars in thousands)
18