ACUTE AND CHRONIC EFFECTS OF COMBINED ENDURANCE …
71
ACUTE AND CHRONIC EFFECTS OF COMBINED ENDURANCE AND STRENGTH TRAINING ON BLOOD LEUKOCYTES IN UNTRAINED HEALTHY MEN Jevgenia Lasmanova Master’s Thesis Exercise Physiology Spring 2014 Department of Biology of Physical Activity University of Jyväskylä Research supervisors: Satu Pekkala, Moritz Schumann, Johanna Stenholm, Enni Hietavala Seminar supervisors: Heikki Kainulainen Antti Mero
Transcript of ACUTE AND CHRONIC EFFECTS OF COMBINED ENDURANCE …
ACUTE AND CHRONIC EFFECTS OF COMBINED
ENDURANCE AND STRENGTH TRAINING ON BLOOD
LEUKOCYTES IN UNTRAINED HEALTHY MEN
Jevgenia Lasmanova
Master’s Thesis
Exercise Physiology
Spring 2014
Department of Biology of Physical
Activity
University of Jyväskylä
Research supervisors: Satu Pekkala, Moritz
Schumann, Johanna Stenholm, Enni
Hietavala
Seminar supervisors: Heikki Kainulainen
Antti Mero

ABSTRACT
Lasmanova, Jevgenia 2014. Acute and chronic effects of combined endurance and strength training on blood leukocytes in untrained healthy men. Department of Biology of Physical Activity, University of Jyväskylä. Master’s Thesis in Exercise Physiology.71 pp.
The alterations in white blood cell (WBC) count are seen in individuals engaged in regular endurance training. Whereas no substantial changes in total or differential WBC count has been observed in strength trained individuals. For healthy adults it is recommended to participate in both endurance and strength training. The effects of independent endurance and strength exercises performed on separate occasions are studied profoundly. However, there are considerably less studies investigating the effects of combined endurance and strength (E+S) exercise training on WBCs. Therefore, the purpose of the present study was to examine the acute and chronic effects of combined E+S training on WBCs in healthy young men.
Twenty-two untrained subjects (30.5 ± 6.9 years) were selected to examine the acute effects of combined E+S exercise bout. The chronic effects of 12-week combined E+S training were examined using the data from 16 subjects (30.3 ± 6.7 years). Additionally, the cellular stress induced by the E+S exercise bout was studied by measuring 72 kDa heat shock protein transcripts (HSPA1A) prior to and following the 12-week training programme (n=6, 29.6 ± 9.1 years). Total and differential WBC count was determined using an automated haematology analyser. HSPA1A mRNA content in peripheral blood mononuclear cells (PBMC) was detected using a real-time quantitative PCR.
Combined E+S exercise bout induced substantial leukocytosis (48%, p≤0.001) in the circulation of untrained men. The greatest increase was observed in neutrophil count (65%, p≤0.001), followed by mixed cell count (monocytes, eosinophils, basophils) (24%, p≤0.05). Total WBC count decreased during the 12 week training period, from6.61 ± 1.24 ·109/L to 5.99 ± 1.06 ·109/L (p≤0.05). Neutrophil count declined from 3.53 ± 1.14 · 109/L to 2.85 ± 0.58 · 109/L (p≤0.05) following the training period. The relative increase in leukocytes in response to acute E+S exercise bout was greater after the training period. After the 12-week training period HSPA1A mRNA content increased at rest and decreased in response to acute exercise bout (p≤0.05).
In conclusion, acute E+S exercise bout elicits leukocytosis in untrained men similar to leukocytosis seen in independent endurance or strength exercises. Twelve weeks of combined E+S training affected total and differential leukocyte count significantly. An adaptation to training was manifested in decrease in number of total WBCs and neutrophils at rest. The relative exercise-induced leukocytosis was greater following the combined E+S training when compared to pre-training exercise bout. In addition HSPA1A mRNA content increased at rest after 12-week combined E+S training period.According to the results of the study it can be said that regular combined E+S training alters peripheral immune system beneficially.
Keywords: combined training, leukocytosis, white blood cells, neutrophils, HSPA1A
CONTENTS
ABSTRACT
1 INTRODUCTION ................................................................................................ 5
2 THE IMMUNE SYSTEM..................................................................................... 6
2.1 Innate immune system........................................................................................... 6
2.2 Cells of the innate immune system ........................................................................ 7
2.3 Adaptive immune system .................................................................................... 10
2.4 Cells of the adaptive immune system................................................................... 11
3 STRESS RESPONSE.......................................................................................... 13
3.1 Stress proteins ..................................................................................................... 14
3.2 The roles of HSPs ............................................................................................... 15
3.3 HSP70 family...................................................................................................... 17
4 IMMUNE SYSTEM AND EXERCISE STRESS ................................................ 19
4.1 Exercise as a stress model ................................................................................... 19
4.2 Acute responses to endurance and strength exercise ............................................ 22
4.3 HSPA1A and acute exercise................................................................................ 24
4.4 Chronic effects of endurance and strength exercise training................................. 25
4.5 HSPA1A and chronic exercise training ............................................................... 27
4.6 Exercise and hormones........................................................................................ 28
5 PURPOSE OF THE STUDY .............................................................................. 30
6 METHODS AND MATERIALS......................................................................... 32
6.1 Subjects and recruitment ..................................................................................... 32

6.2 Study design ....................................................................................................... 33
6.3 Basal measurements ............................................................................................ 34
6.4 Acute E+S loadings............................................................................................. 36
6.5 Training intervention........................................................................................... 36
6.6 Blood sampling and analysis ............................................................................... 376.6.1 Venous blood sampling ............................................................................... 376.6.2 Separation of PBMCs from whole blood...................................................... 386.6.3 RNA extraction, cDNA synthesis and real-time quantitative PCR................ 39
6.7 Statistics.............................................................................................................. 41
7 RESULTS........................................................................................................... 42
7.1 Physical fitness parameters.................................................................................. 42
7.2 Immediate effects of acute E+S loading .............................................................. 42
7.3 HSPA1A expression in PBMCs ........................................................................... 46
7.4 Immediate responses to acute E+S loading following training ............................. 47
7.5 Chronic effects of combined E+S exercise training ............................................. 47
7.6 Hormones and leukocytes.................................................................................... 50
8 DISCUSSION..................................................................................................... 51
8.1 Immediate responses to acute E+S loading in untrained men............................... 51
8.2 Immediate responses to acute E+S loading following exercise training................ 53
8.3 Chronic effects of combined E+S training ........................................................... 54
8.4 HSPA1A responses to combined E+S loading and training .................................. 56
8.5 Leukocyte and hormone interactions ................................................................... 57
8.6 Strengths and weaknesses of the study ................................................................ 58
8.7 Summary, conclusions and practical applications ................................................ 60
9 REFERENCES ................................................................................................... 62

1 INTRODUCTION
The exercise immunology
1990s together with the progress in new technologies that enabled studying
immunological parameters. Exercise has been accepted as a model of the general
immune response to environmental stress, as there are many similarities between
strenuous exercise and stress that are linked through the stress hormones.
Hoffman-Goetz 2000, Shephard 2010
immune system cell number and function
have been studied widely.
To maintain a good health and decrease the
risk of getting a chronic disease, adults
should engage in regular physical training.
Being habitually physically active influences
the immune system favourably. In order to
reduce the risk of a disease, an exercise
training intensity and volume should remain
moderate, as excessive intensive training
may lead to suppression of immune system
and increase the occurrence of diseases
(Figure 1). (Nieman 2012,
2011.)
In order to stay in good health, it is recommended to participate in both
strength type activities several times a week
purpose of present thesis is to investigate how the combination
physical activities performed in one session two time
immune system cells in peripheral circulation of healthy young recreationally active
men.
INTRODUCTION
The exercise immunology as a sub-discipline of exercise sciences appeared in early
1990s together with the progress in new technologies that enabled studying
immunological parameters. Exercise has been accepted as a model of the general
immune response to environmental stress, as there are many similarities between
enuous exercise and stress that are linked through the stress hormones.
Goetz 2000, Shephard 2010.) Nowadays the effects of physical exercise on
immune system cell number and function
studied widely.
To maintain a good health and decrease the
risk of getting a chronic disease, adults
should engage in regular physical training.
Being habitually physically active influences
vourably. In order to
reduce the risk of a disease, an exercise
training intensity and volume should remain
moderate, as excessive intensive training
may lead to suppression of immune system
and increase the occurrence of diseases
(Nieman 2012, Neto et al.
In order to stay in good health, it is recommended to participate in both
strength type activities several times a week (Haskell et al. 2007)
purpose of present thesis is to investigate how the combination of recommended
physical activities performed in one session two times a week for 12 weeks influence
cells in peripheral circulation of healthy young recreationally active
FIGURE 1. Training and immune system (
from Neto et al. 2011).
5
appeared in early
1990s together with the progress in new technologies that enabled studying
immunological parameters. Exercise has been accepted as a model of the general
immune response to environmental stress, as there are many similarities between
enuous exercise and stress that are linked through the stress hormones. (Pedersen &
Nowadays the effects of physical exercise on
In order to stay in good health, it is recommended to participate in both endurance and
(Haskell et al. 2007). Therefore, the
of recommended
s a week for 12 weeks influence
cells in peripheral circulation of healthy young recreationally active
Training and immune system (adapted
6
2 THE IMMUNE SYSTEM
The immune system, one of the organ systems in human body, is crucial for survival
(Parham 2009, 1). It is an organization of organs, molecules and cells that are dedicated
to defend the organism against the invaders. In the absence of functioning defence
system, minor infections can become fatal to the host organism. (Delves & Roitt 2000a,
Parham 2009, 1, Wood 2006, 1.)
2.1 Innate immune system
Innate immune system reacts first when body’s physical and chemical barriers have
been breached. Innate i.e. natural immunity is determined completely by the genes that
individual inherits from parents. This pre-existing mechanism is designed to prevent the
entry of pathogens and eliminate trespassed invaders. The above mentioned barriers are
part of innate immune system, and in addition white blood cells i.e. leukocytes
participate in defending the organism. (Parham 2009, 9, Wood 2006, 19.) Innate
immunity depends upon mononuclear phagocytes, such as macrophages, dendritic cells
and monocytes, and polymorphonuclear phagocytes, including neutrophils, basophils
and eosinophils (Beutler 2004). In addition, mast cells and natural killer (NK) cells also
bear germline-encoded recognition receptors and contribute to innate immune defences
(Janeway & Medzhitov 2002).
Innate immune defence against pathogens consists of two parts – recognition and
destruction. First of all presence of the pathogen has to be recognized. (Parham 2009,
9.) For recognition, innate immune system relies on the particular molecules that are
common to pathogens but are absent in the host (Alberts et al. 2002). Soluble receptors
in the blood, members of complement and cell-surface receptors, such as members of
Toll-like receptor family, bind to pathogen or to altered self-cells (Alberts et al. 2002,
Parham 2009, 9). Detection of the pathogen triggers an immune response which is
expressed as inflammation of the infected area. During the inflammatory response cells
of the innate immune system become activated, differentiate into effector cells and try
to eliminate the invader.
elicited by the innate immune system is characterized by pain, redness, heat and
swelling of the site of infection (Alberts et al. 2002)
symptoms are not due to infection caused by the pathogen but to organism’s response to
it (Parham 2009, 9).
Phagocytic cells such as macrophages, neutrophils and monocytes
pathogen via the engulfment
immune system release signalling molecules, e.g. cytokines and interferons that
contribute to the inflammatory response. After the pathogen has been phagocytised,
toxic substances are released into intracellular vesicle c
(Alberts et al. 2002.) Majority of infections are cleared efficiently by the innate immune
system and do not lead to
immunity will face a third line of defence, i.e. adap
68.)
2.2 Cells of the innate immune system
Monocytes and macrophages
progenitor cell. They are released from the bone marrow into the peripheral circulation
where they circulate for several days. Monocyte volume in peripheral circulation is 5
10% of all circulating leukocytes. After entering the tissue they develop into tissue
resident macrophages. In addition to macrophages, monocytes give rise also to dendritic
cells and osteoclasts. (rev
FIGURE 2. Illustration of m
invader. (Janeway & Medzhitov 2002.) The inflammatory response
elicited by the innate immune system is characterized by pain, redness, heat and
swelling of the site of infection (Alberts et al. 2002). These generally necessary
symptoms are not due to infection caused by the pathogen but to organism’s response to
Phagocytic cells such as macrophages, neutrophils and monocytes
pathogen via the engulfment (Delves & Roitt 2000a). The components of innate
immune system release signalling molecules, e.g. cytokines and interferons that
contribute to the inflammatory response. After the pathogen has been phagocytised,
toxic substances are released into intracellular vesicle called phagosome to kill it.
) Majority of infections are cleared efficiently by the innate immune
system and do not lead to the disease. The minority of pathogens that escape innate
immunity will face a third line of defence, i.e. adaptive immune system. (Parham 2009,
Cells of the innate immune system
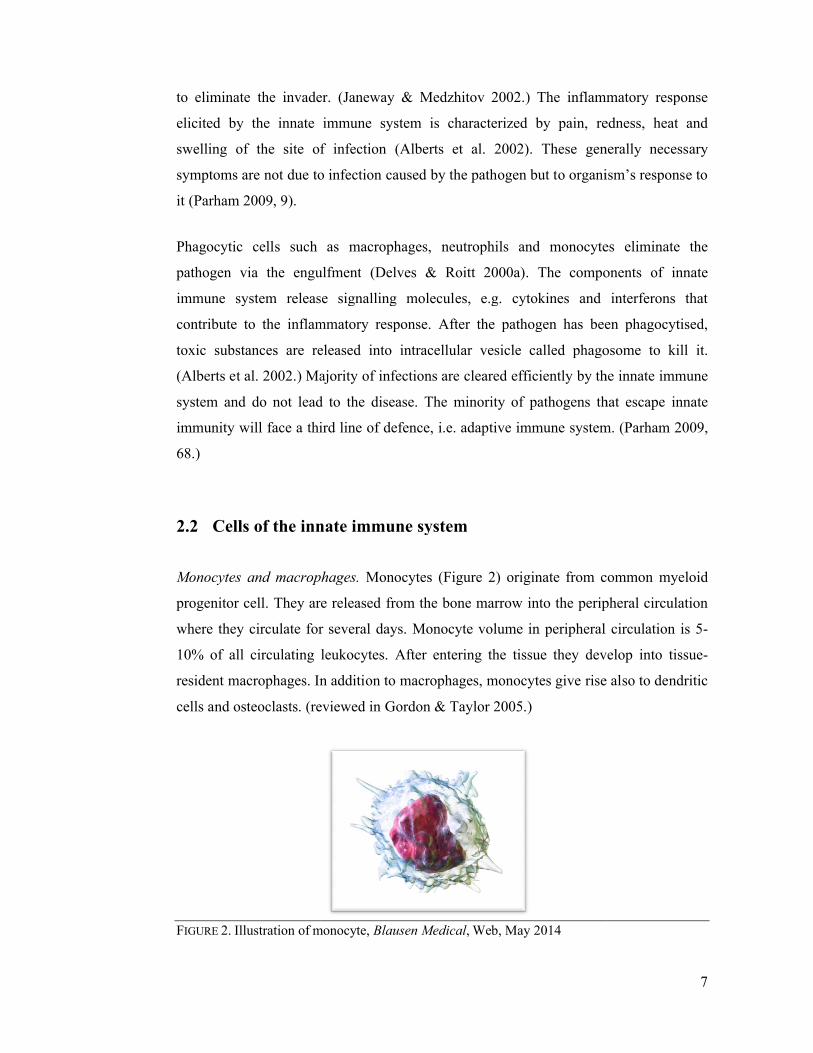
Monocytes and macrophages. Monocytes (Figure 2) originate from common myeloid
progenitor cell. They are released from the bone marrow into the peripheral circulation
circulate for several days. Monocyte volume in peripheral circulation is 5
10% of all circulating leukocytes. After entering the tissue they develop into tissue
resident macrophages. In addition to macrophages, monocytes give rise also to dendritic
(reviewed in Gordon & Taylor 2005.)
monocyte, Blausen Medical, Web, May 2014
7
The inflammatory response
elicited by the innate immune system is characterized by pain, redness, heat and
. These generally necessary
symptoms are not due to infection caused by the pathogen but to organism’s response to
Phagocytic cells such as macrophages, neutrophils and monocytes eliminate the
The components of innate
immune system release signalling molecules, e.g. cytokines and interferons that
contribute to the inflammatory response. After the pathogen has been phagocytised,
alled phagosome to kill it.
) Majority of infections are cleared efficiently by the innate immune
disease. The minority of pathogens that escape innate
tive immune system. (Parham 2009,
) originate from common myeloid
progenitor cell. They are released from the bone marrow into the peripheral circulation
circulate for several days. Monocyte volume in peripheral circulation is 5-
10% of all circulating leukocytes. After entering the tissue they develop into tissue-
resident macrophages. In addition to macrophages, monocytes give rise also to dendritic
Macrophages are present in all tissues, where they patrol, engulf and kill microbes.
addition, they synthesize and release chemotactic substances that attract other immune
cells, in particular neutrophils, to the site of infection. (Beutler 2004
macrophages include clear
reuse, removing cellular debris during tissue remodelling and clear
undergone apoptosis (Mosser & Edwards 2008)
Neutrophils. These polymorphonuclear leukocytes represent
total circulating leukocyte pool
3) have essential role in the defence against bacterial and fungal infections (Monteseirin
2009) since they are one of the first cells to cross the endothelium and arrive at the site
of an infection (Witko-
infected area attract neutrophils to the site
phagocytize invaders (Gabriel & Kindermann 1997)
the pathology of several
due to incomplete phagocytosis
FIGURE 3. Illustration of neutrophil,
Basophils and eosinophils
peripheral blood are represented by granulocytes called basophils (Figure
These cells are normally found in circulation and not in tissues. (Marone et al. 2005
The role of basophils in innate
Basophils are activated via aggregation of surface
which leads to degranulation and release of various mediators that promote elimination
of the invader. (reviewed in
Macrophages are present in all tissues, where they patrol, engulf and kill microbes.
synthesize and release chemotactic substances that attract other immune
cells, in particular neutrophils, to the site of infection. (Beutler 2004.) Other functions of
clearance of erythrocytes, recycling the iron and haemoglobin for
cellular debris during tissue remodelling and clearing
(Mosser & Edwards 2008).
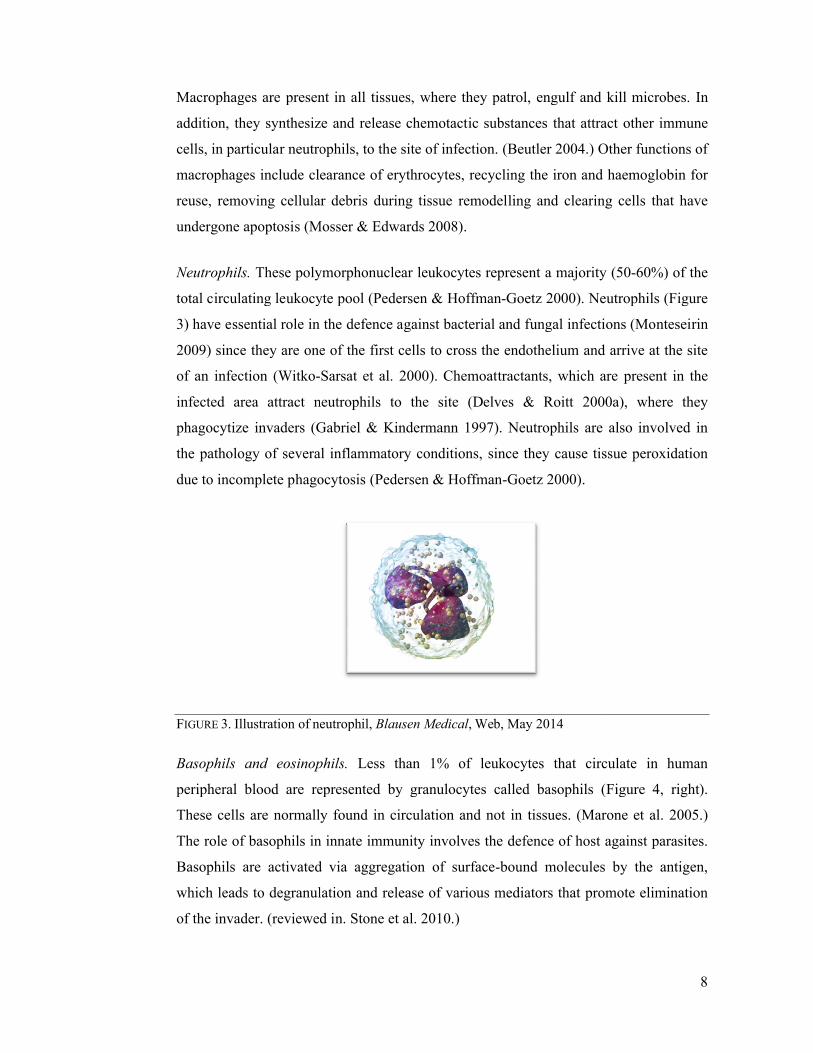
These polymorphonuclear leukocytes represent a majority (
total circulating leukocyte pool (Pedersen & Hoffman-Goetz 2000). Neutrophils (Figure
) have essential role in the defence against bacterial and fungal infections (Monteseirin
2009) since they are one of the first cells to cross the endothelium and arrive at the site
Sarsat et al. 2000). Chemoattractants, which are present in the
infected area attract neutrophils to the site (Delves & Roitt 2000a)
(Gabriel & Kindermann 1997). Neutrophils are also involved in
the pathology of several inflammatory conditions, since they cause tissue peroxidation
due to incomplete phagocytosis (Pedersen & Hoffman-Goetz 2000).
neutrophil, Blausen Medical, Web, May 2014
Basophils and eosinophils. Less than 1% of leukocytes that circulate in human
peripheral blood are represented by granulocytes called basophils (Figure
These cells are normally found in circulation and not in tissues. (Marone et al. 2005
The role of basophils in innate immunity involves the defence of host against parasites.
Basophils are activated via aggregation of surface-bound molecules by
which leads to degranulation and release of various mediators that promote elimination
iewed in. Stone et al. 2010.)
8
Macrophages are present in all tissues, where they patrol, engulf and kill microbes. In
synthesize and release chemotactic substances that attract other immune
Other functions of
nd haemoglobin for
ing cells that have
a majority (50-60%) of the
. Neutrophils (Figure
) have essential role in the defence against bacterial and fungal infections (Monteseirin
2009) since they are one of the first cells to cross the endothelium and arrive at the site
Sarsat et al. 2000). Chemoattractants, which are present in the
(Delves & Roitt 2000a), where they
. Neutrophils are also involved in
they cause tissue peroxidation
Less than 1% of leukocytes that circulate in human
peripheral blood are represented by granulocytes called basophils (Figure 4, right).
These cells are normally found in circulation and not in tissues. (Marone et al. 2005.)
immunity involves the defence of host against parasites.
bound molecules by the antigen,
which leads to degranulation and release of various mediators that promote elimination

Another subpopulation of granulocytes, eosinophils (Figure
of the leukocytes, is found in human peripheral circulation. Upon diverse stimuli these
cells are recruited from blood into the site of inflammation
Parham 2009, 15.) Their main function is to produce cytotoxic granule proteins. An
increase in eosinophil count refers to a presence of allergic diseases such as atopic
asthma or a helminthic infection
FIGURE 4. Illustration of eosinophil (
2014
Mast cells. These large mononuclear immune cells are distributed in all vascularized
tissues, especially at the interfaces with the external environment,
respiratory, gastrointestinal and genitourinary tracts (Marone et al. 2005). As mast cells
are located in association with blood vessels and at epithelial surfaces they respond to
signals of innate immunity with immediate and delayed release of inflammatory
mediators. In addition, m
hypersensitivity and autoimmune diseases.
Dendritic cells. Dendritic cells constitute a family of various cells around the body that
have one common role, i.e. initiation of immune response. In skin epidermal tissue, at
least two members of dendritic cell family are present, Langerhans cells and dermal
dendritic cells. Dendritic cells can also be found in thymus, liver and peripheral blood.
They pick up antigens, phagocyt
adaptive immune system
system cells. (Chung et al. 2004
Another subpopulation of granulocytes, eosinophils (Figure 4, left), representing 1
is found in human peripheral circulation. Upon diverse stimuli these
cells are recruited from blood into the site of inflammation. (Rothenberg & Hogan 2006,
Their main function is to produce cytotoxic granule proteins. An
increase in eosinophil count refers to a presence of allergic diseases such as atopic
asthma or a helminthic infection. (reviewed in Stone et al. 2010.)
Illustration of eosinophil (left) and basophil (right), Blausen Medical
These large mononuclear immune cells are distributed in all vascularized
tissues, especially at the interfaces with the external environment,
respiratory, gastrointestinal and genitourinary tracts (Marone et al. 2005). As mast cells
ed in association with blood vessels and at epithelial surfaces they respond to
signals of innate immunity with immediate and delayed release of inflammatory
In addition, mast cells are involved in the pathogenesis of immediate
and autoimmune diseases. (reviewed in Stone et al. 2010
Dendritic cells constitute a family of various cells around the body that
have one common role, i.e. initiation of immune response. In skin epidermal tissue, at
dendritic cell family are present, Langerhans cells and dermal
dendritic cells. Dendritic cells can also be found in thymus, liver and peripheral blood.
pick up antigens, phagocytize them and migrate to areas rich in cells from
adaptive immune system; subsequently dendritic cells activate naïve adaptive immune
system cells. (Chung et al. 2004.)
9
), representing 1-6%
is found in human peripheral circulation. Upon diverse stimuli these
(Rothenberg & Hogan 2006,
Their main function is to produce cytotoxic granule proteins. An
increase in eosinophil count refers to a presence of allergic diseases such as atopic
Blausen Medical, Web, May
These large mononuclear immune cells are distributed in all vascularized
tissues, especially at the interfaces with the external environment, such as skin,
respiratory, gastrointestinal and genitourinary tracts (Marone et al. 2005). As mast cells
ed in association with blood vessels and at epithelial surfaces they respond to
signals of innate immunity with immediate and delayed release of inflammatory
ast cells are involved in the pathogenesis of immediate
Stone et al. 2010.)
Dendritic cells constitute a family of various cells around the body that
have one common role, i.e. initiation of immune response. In skin epidermal tissue, at
dendritic cell family are present, Langerhans cells and dermal
dendritic cells. Dendritic cells can also be found in thymus, liver and peripheral blood.
them and migrate to areas rich in cells from
activate naïve adaptive immune

10
Natural killer cells. NK cells recognize and kill abnormal host cells. Their cell-mediated
cytotoxicity is directed against virus-infected and tumour cells. (Delves & Roitt 2000a,
Gabriel & Kindermann 1997.) NK cells are considered to be components of innate
immune system as they lack specific surface receptors. However, in contrast to all other
innate immune system cells which originate from myeloid progenitor cell, NK cells
origin from lymphoid progenitor cell in bone marrow and express many lymphoid
markers. Thus based on morphology, NK cells can be classified as subpopulation of
lymphocytes. (Vivier et al. 2011.)
2.3 Adaptive immune system
There are several ways for pathogens to avoid elimination by innate immune system.
For instance they do not express pathogen-specific or foreign molecules, and therefore
may remain undetected. In this case, cells with more specific receptors, which are able
to recognize particular invaders, are recruited. Receptors present on the lymphocytes
have much better ability to detect trespassed pathogens or pathogen specific molecules
(Wood 2006, 42), as they are not encoded in the germ-line but are created de novo in
each organism (Iwasaki & Medzhitov 2010).
Innate immune system instructs the adaptive immune system about an ongoing
pathogenic challenge (Janeway & Medzhitov 2002). Adaptive immune response
comprises the proliferation and differentiation of antigen-specific lymphocytes, T and B
cells. Specialized cells, known as antigen-presenting cell are able to display particles of
the pathogen that has been killed to T lymphocytes in major histocompatibility complex
molecules. (Iwasaki & Medzhitov 2010.) Further, T cell activation leads to B cell
activation, which in turn increases the efficacy and focus of the immune response
against specific pathogen (Parham 2009, 10).
During the primary immune response, i.e. first encounter of adaptive immune system
with the antigen, two types of T and B cells are generated, both effector and memory
lymphocytes. Generation of memory cells enables the organism to have quantitatively
and qualitatively better secondary immune response during subsequent encounter with
the same pathogen. The secondary immune response is faster as relative number of

memory lymphocytes to naïve lymphocytes is greater, and they are also more easily
activated. (Delves & Roitt 2000a
immunological memory allows responding to each encounter with pathogen on the basis
of past interaction (Delves & Roitt 2000a, McFall
2.4 Cells of the adaptive immune system
Lymphocytes. The lymphoid progenitor cell gives rise to lymphoid lineage of
leukocytes. Two distinct lymphocyte subpopulations can be distinguished, large
granular lymphocytes, i.e. NK
(Figure 5) comprise several subpopulations that have different cell
roles in adaptive immune response. (Parham 2009,
FIGURE 5. Illustration of small lymphocytes
Small lymphocytes develop from progenitor cells in the bone m
within bone marrow for whole developmental period
immature stage, migrate to thymus and
development, both T and B cells produce antigen
antigen recognition, i.e. variable
receptor requires process of random rearrangement and splicing of mu
segments. (Parkin & Cohen 2001
combination of gene segments, thus about 10
produced from fewer than 400 genes
ymphocytes to naïve lymphocytes is greater, and they are also more easily
(Delves & Roitt 2000a.) Thus having an adaptive immune system and
immunological memory allows responding to each encounter with pathogen on the basis
Delves & Roitt 2000a, McFall-Ngai 2007).
Cells of the adaptive immune system
The lymphoid progenitor cell gives rise to lymphoid lineage of
leukocytes. Two distinct lymphocyte subpopulations can be distinguished, large
i.e. NK cells and small lymphocytes. The small lymphocytes
) comprise several subpopulations that have different cell-surface receptors and
immune response. (Parham 2009, 16.)
of small lymphocytes, Blausen Medical, Web, May 2014
Small lymphocytes develop from progenitor cells in the bone marrow
within bone marrow for whole developmental period, whereas T cells leave at an
immature stage, migrate to thymus and finish the maturation
development, both T and B cells produce antigen-specific receptors. As the region of
, i.e. variable region is highly specific, production of T or B cell
receptor requires process of random rearrangement and splicing of mu
(Parkin & Cohen 2001.) Each individual lymphocyte uses different
combination of gene segments, thus about 1015 different variable regions can be
duced from fewer than 400 genes (Delves & Roitt 2000a).
11
ymphocytes to naïve lymphocytes is greater, and they are also more easily
Thus having an adaptive immune system and
immunological memory allows responding to each encounter with pathogen on the basis
The lymphoid progenitor cell gives rise to lymphoid lineage of
leukocytes. Two distinct lymphocyte subpopulations can be distinguished, large
cells and small lymphocytes. The small lymphocytes
surface receptors and
Web, May 2014
arrow. B cells remain
whereas T cells leave at an
maturation there. During
specific receptors. As the region of
is highly specific, production of T or B cell
receptor requires process of random rearrangement and splicing of multiple DNA
Each individual lymphocyte uses different
different variable regions can be

12
T cells can be divided into several subpopulations according to the markers on their
surface and functions. For example CD4 marker positive cells function as helper cells
and provide signals to enhance the functions of other lymphocytes and phagocytes.
CD8+ T cells are cytotoxic killer cells that have role in removal of pathogen by killing
virally-infected cells. In addition, T cells regulate immune responses by limiting the
scale of tissue damage during inflammation. (Bonilla & Oettgen 2010, Delves & Roitt
2000b.)
B cells require help from T cells to complete differentiation into effector plasma cells
and acquire ability to produce and release antigen-specific antibodies (Delves & Roitt
2000b). Five different types of antibodies can be distinguished, namely IgG, IgA, IgM,
IgD and IgE. Each type has different functions and can be secreted as circulating
molecule or as stationary molecule on the membrane of B cell. (Delves & Roitt 2000a.)
Antibodies can directly neutralize invader’s toxins, prevent the pathogen adhering to
host mucosal surfaces, activate other immune defences and tag bacteria for phagocytosis
(Parkin & Cohen 2001).
13
3 STRESS RESPONSE
According to Hungarian scientist Hans Selye (1907–1982), the father of biological
stress concept, the stress can be defined as nonspecific response of the body to any
demand (Selye 1973).
Selye conducted several experiments with rodents using different noxious agents such
as exposure to cold, surgical injury, spinal shock, excessive muscular exercise and
intoxicants with sublethal doses. He noticed the appearance of typical pattern in
response to different noxious agents, which was independent of the nature of the
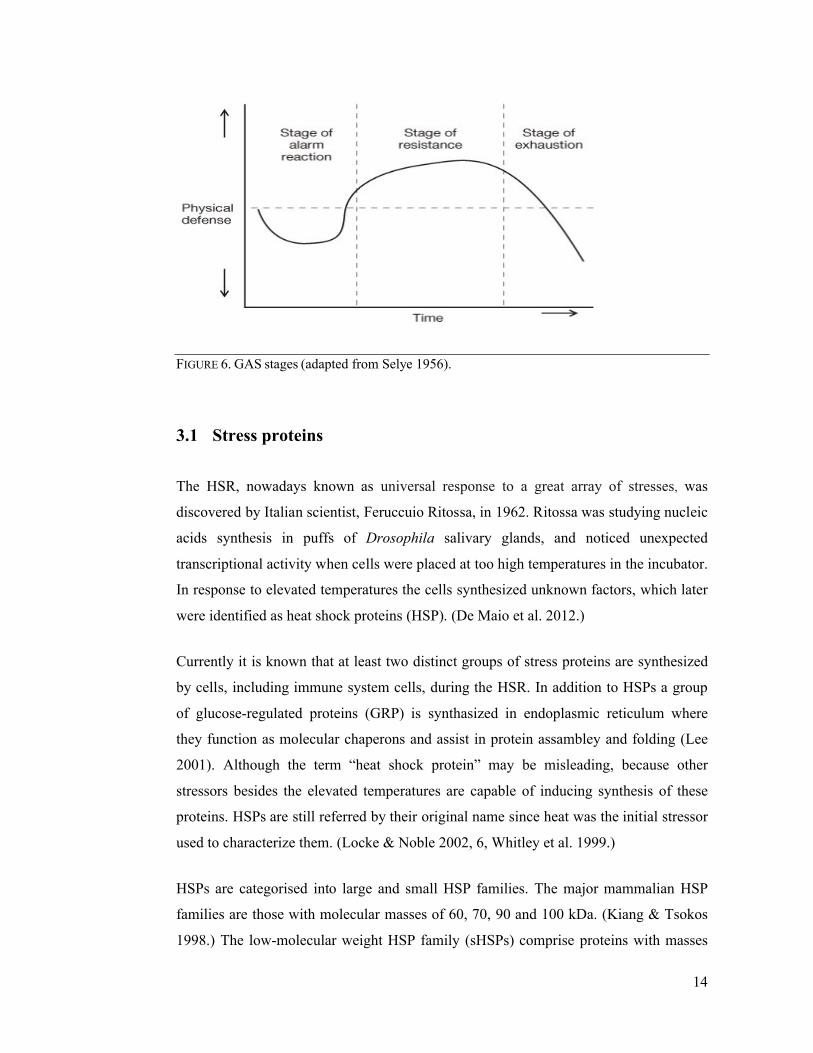
damaging agent. It led him to the development of “General Adaptation Syndrome”
(GAS) concept, which describes three stages of an organism’s response to applied stress
(Figure 6). During the brief first stage, so called “alarm reaction stage”, an organism
tries to restore disturbed homeostasis. In the second, more prolonged stage, known as
“resistance development stage”, an organism resists the stress. In Selye’s experiments
rats built up resistance to damaging agents so that functions of their organs were
practically normal. However, if stress’s intensity or duration exceeds organism’s
resistance capabilities, the third stage – “exhaustion stage”, occurs. In this terminal
stage the organism cannot cope with the stress and death may ensue. (Locke & Noble
2002, 3, Selye 1998.) Because organisms responded to different stresses with similar
pattern, the Selye’s GAS paradigm may be applied to describe organisms’ response to
various stresses, including the exercise (Locke & Noble 2002, 3).
One of the cells survival promoting responses is heat shock response (HSR), an
evolutionarily conserved mechanism designed to protect cells (Asea & Pedersen 2010,
Fulda et al. 2010). This biochemical response is activated to counteract not only
elevations in temperature but also many other potentially damaging stimuli, such as
oxidative (Cajone et al. 1989) and psychological stress (Fleshner et al. 2004). HSR
consists of transient modifications in gene expression and synthesis of different stress
proteins, which further help the organism to cope with noxious stimuli (Asea &
Pedersen 2010).
14
FIGURE 6. GAS stages (adapted from Selye 1956).
3.1 Stress proteins
The HSR, nowadays known as universal response to a great array of stresses, was
discovered by Italian scientist, Feruccuio Ritossa, in 1962. Ritossa was studying nucleic
acids synthesis in puffs of Drosophila salivary glands, and noticed unexpected
transcriptional activity when cells were placed at too high temperatures in the incubator.
In response to elevated temperatures the cells synthesized unknown factors, which later
were identified as heat shock proteins (HSP). (De Maio et al. 2012.)
Currently it is known that at least two distinct groups of stress proteins are synthesized
by cells, including immune system cells, during the HSR. In addition to HSPs a group
of glucose-regulated proteins (GRP) is synthasized in endoplasmic reticulum where
they function as molecular chaperons and assist in protein assambley and folding (Lee
2001). Although the term “heat shock protein” may be misleading, because other
stressors besides the elevated temperatures are capable of inducing synthesis of these
proteins. HSPs are still referred by their original name since heat was the initial stressor
used to characterize them. (Locke & Noble 2002, 6, Whitley et al. 1999.)
HSPs are categorised into large and small HSP families. The major mammalian HSP
families are those with molecular masses of 60, 70, 90 and 100 kDa. (Kiang & Tsokos
1998.) The low-molecular weight HSP family (sHSPs) comprise proteins with masses
15
20 to 30 kDa, such as heme oxygenase (Hsp32), αB-crystallin and HSP20, additionally
there are very small weight proteins, for example ubiquitin – an 8 kDa protein (Kregel
2002, Whitley et al. 1999). Within each gene family there are members that are
constitutively expressed, inducibly regulated, targeted to different subcellular
compartments, or a combination of all of these (Schmitt et al. 2007).
3.2 The roles of HSPs
Stress proteins have a critical role in the maintenance of normal cellular homeostasis
(Whitley et al. 1999). The members of HSP families are highly conserved between
species from Eubacteria to humans and the inter-species homology varies between 50%
and 90% (Pockley et al. 2008, Prohaszka & Fust 2004).
The functions of stress proteins depend on many factors, including the family it belongs
to, the localization to the different cellular compartments inside the cell and in
extracellular environment, as well as the regulation of the protein, e.g. constitutive or
inducible (Schmitt et al. 2007). Housekeeping function is the main intrinsic activity of
constitutive HSPs, as HSPs present in the cell in the absence of any stress ensure the
correct folding of newly formed polypeptides (Whitley et al. 1999). In addition, HSPs
have a role in the regulation of cellular redox state, cellular differentiation and growth.
HSPs participate in cellular metabolism, apoptosis and activation of enzymes and
receptors. (Prohaszka & Fust 2004, Richter et al. 2010.) The individual functions of
HSP families and members are described in Table 1.
TABLE 1. Main functions of HSPs (Calderwood et al. 2007, Kregel 2002, Whitley et al. 1999, Pockley 2001, Morton et al. 2009).
Stress protein FunctionsUbiquitin part of non-lysosomal protein degradation pathwayHSP70 molecular chaperones, cytoprotectionHSP60 molecular chaperones, pro-apoptoticHSP90 part of steroid receptor complexHSP100 protein foldingαB-crystallin molecular chaperone, stabilization of cytoskeletonHsp27 microfilament stabilizationHsp32 haeme catabolism
16
HSPs synthesized by the cells in response to harmful event, i.e. inducible proteins,
function as molecular chaperones (Morimoto 1998), and the stressors activating heat
shock gene transcription are presented in Table 2. Predominantly five HSP families,
members of which have molecular masses of 100, 90, 70, 60 kDa and sHSPs comprise a
class of molecular chaperones (Richter et al. 2010). These HSPs prevent the unwanted
interactions to occur by binding to the denatured proteins in energy dependent manner
(Tavaria et al. 1996), and mediating the transport of these proteins to the target
organelles for final packaging, degradation or repair (Kiang & Tsokos 1998). Molecular
chaperones recognize non-native, partially or totally unfolded protein through increased
exposure of hydrophobic amino acids (Richter et al. 2010).
The above-mentioned functions of HSPs are conducted inside the cell but besides strong
cytoprotective effects HSPs also have some roles in extracellular environment. The
members of HSP70 and 90 families have been found in extracellular medium where
their functions are mainly immunogenic. (Schmitt et al. 2007.) Extracellular HSPs
possess powerful immunological properties, and therefore can be perceived as being
inflammatory mediators and “danger signals” for the immune system (Pockley et al.
2008, Prohaszka & Fust 2004). In addition, they serve as antigen carriers and stimulate
subpopulations of leukocytes to secrete inflammatory cytokines (Moseley 2000).
TABLE 2. Stressors that activate heat shock gene transcription (Morimoto 1998, Kregel 2002, De
Maio 1999, Whitley et al. 1999).
Environmental pathogenic physiological/metabolicelevated temperature viruses glucose starvationnicotine bacteria hyperthermiaheavy metals parasites hypothermiaethanol reactive oxygen speciessurgical stress reactive nitrogen speciesozone acidosisnitric oxide hypoxiarestraint hyperoxiaexercise anoxia
ischemiatissue injury and repairaginghypertrophyfever

17
3.3 HSP70 family
Genetic analyses carried out in lower organisms, such as E. coli have shown that HSP70
family members are essential for growth at all temperatures, which indicates a crucial
role for these proteins in normal cellular physiology (Lindquist & Craig 1988). This is
the one of the best characterized HSP families containing many of highly-related protein
isoforms varying in size from 66 kDa to 78 kDa. In humans, there are at least 11 distinct
genes encoding HSPs. (Tavaria et al. 1996.)
The most studied members are proteins with molecular masses of 73, 75, 78 and 72
kDa. These proteins are divided into constitutive and inducible isoforms (Tavaria et al.
1996). The first three members (73, 75 and 78 kDa proteins) are present in cell in the
absence of stress. The fourth member a 72 kDa protein is synthesized in response to
stressful stimuli, although 73 kDa protein levels may also slightly increase during stress.
(De Maio 1999.) The nomenclature of HSP70 family proteins in the literature is
inconsistent and several terms are used when describing a single protein. In this thesis
the nomenclature guidelines provided by Kampinga et al. (2009) will be used to
describe HSP70 family members, and HSPA1A term stands for the 72 kDa protein
encoded by HSPA1A gene.
HSPA1A, a highly inducible isoform of HSP70 family has critical physiological
functions (Yamada et al. 2008, Liu et al. 2006). The levels of this protein are very low
in absence of stress, but they increase rapidly in response to potentially dangerous
stimulation (Kiang & Tsokos 1998). The increase in HSPA1A content have been
detected in response to stress in various human and rodent tissues, including brain,
heart, liver (Campisi et al. 2003), skeletal muscle (Febbraio & Koukoulas 2000) and
leukocytes (Fehrenbach et al. 2000a). The stress-induced synthesis of HSPA1A is
generally cytoprotective (Asea 2007); it blocks the apoptotic pathway of the cell at
different levels and is able to rescue cells in the later phase of apoptosis (Schmitt et al.
2007).
The induction of HSPA1A in leukocytes is a protective mechanism against heat and
other stresses. Leukocyte subpopulates, monocytes and granulocytes synthesize

18
HSPA1A to protect themselves from noxious molecules they produce (Fehrenbach et al.
2000b). The content of this protein in leukocytes can be an indicator of the extent of
previous stress and provide tolerance against subsequent stimuli. The concentration of
HSPA1A in humans or rodents may also indicate an adaptation to stress in
immunocompetent cells (Fehrenbach et al. 2001).
There are several factors that may affect HSP synthesis in the cell. Rao et al. (1999)
demonstrated that age affects the ability of leukocytes subpopulation to synthesize
HSPA1A. The HSPA1A induction in response to stress was substantially greater in
lymphocytes of young (16-29 years) individuals as compared to old (76-84 years)
individuals. In addition to age, nutrition has also been shown to affect HSP production.
Nutritional antioxidant, such as vitamin C supplementation for 8 weeks suppressed
lymphocytes’ ability to express HSPA1A in response to exogenous oxidative stress
(Khassaf et al. 2003). The gender has no effect on HSPA1A content or expression in
leukocytes in response to physical stress (Simar et al. 2004).
19
4 IMMUNE SYSTEM AND EXERCISE STRESS
4.1 Exercise as a stress model
Muscular exercise as a prototype of stress was already used by H. Selye. It was one of
the nonspecific aversive stimuli and elicited the same symptoms as did surgical injury
and exposure to cold. (Selye 1998.) Additionally, exercise represents a quantifiable
model of physical stress as the patterns of hormonal and immunological responses have
many similarities with other clinical stressors (Hoffman-Goetz & Pedersen 1994).
Physical exercise diverts many organ systems to adapt to a new state (Mastorakos &
Pavlatou 2005).
The cellular stress response during an exercise is induced by several factors, e.g.
increase in metabolic by-products and stress hormone levels, hyperthermia, energy
depletion, oxidative phosphorylation, ischemia and pH alterations (McNaughton et al.
2006, Yamada et al. 2008). These events lead to transcriptional activation of heat shock
transcription factor (HSF) which then undergoes stress-induced oligomerization, i.e.
transits from a monomer to a trimer and acquires DNA-binding activity (Ali & Imperiali
2005, Sarge et al. 1993). Subsequently, formed trimers bind to heat shock element
(HSE) on the promoter site of the gene. The binding of a trimer to HSE results in
transcription of messenger RNA (mRNA) which is translated eventually into HSPA1A
(Figure 7) (Kregel 2002, Yamada et al. 2008).
In vivo (exercise stress) and in vitro (exogenous heat shock) stress induces HSP
transcription and translation in leukocytes of individuals with different physical activity
background. However, exercise stress induces more prolonged elevation in HSPA1A
protein expression, suggesting that besides increase in body temperature, other
endogenous factors are related to exercise-induced HSPA1A expression. (Schneider et
al. 2002.)
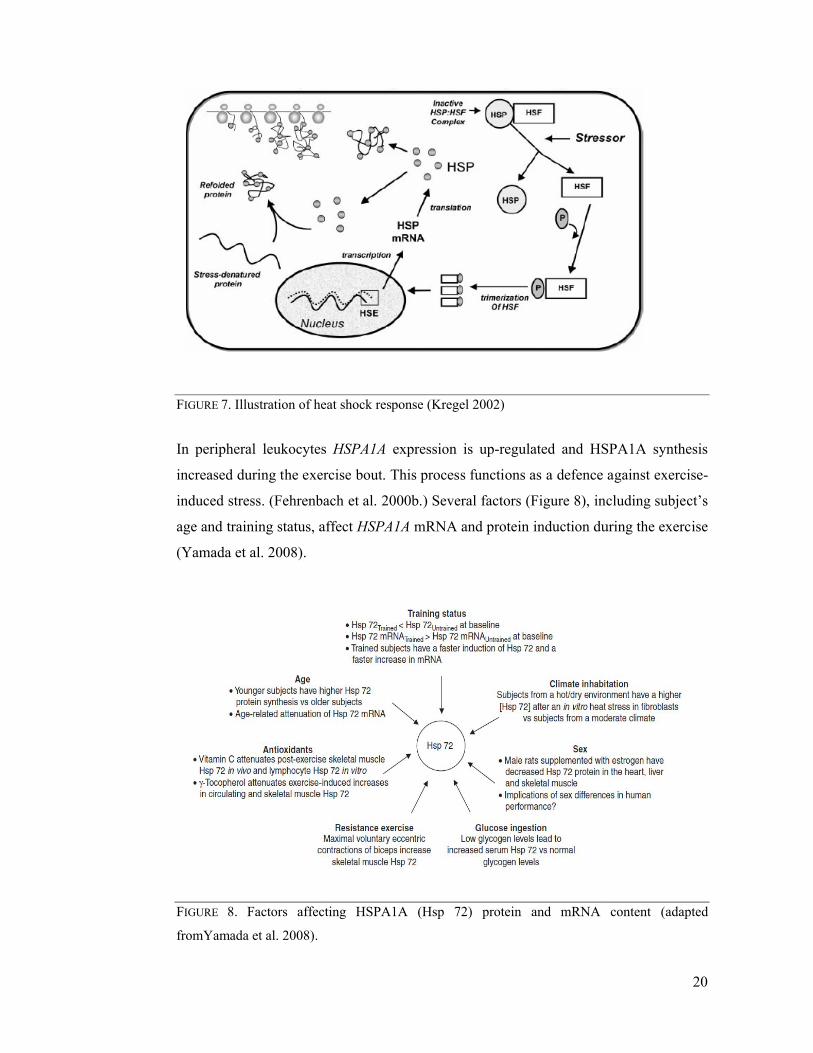
FIGURE 7. Illustration of heat shock response (Kregel 2002)
In peripheral leukocytes
increased during the exercise bout
induced stress. (Fehrenbach et al. 2
age and training status, affect
(Yamada et al. 2008).
FIGURE 8. Factors affecting
fromYamada et al. 2008).
Illustration of heat shock response (Kregel 2002)
In peripheral leukocytes HSPA1A expression is up-regulated and HSPA1A
increased during the exercise bout. This process functions as a defence against exercise
(Fehrenbach et al. 2000b.) Several factors (Figure 8), including subject’s
age and training status, affect HSPA1A mRNA and protein induction during the exercise
Factors affecting HSPA1A (Hsp 72) protein and mRNA
20
HSPA1A synthesis
efence against exercise-
), including subject’s
induction during the exercise
protein and mRNA content (adapted

21
The biological tissues display five qualitative adaptive responses to physical stress
including decreased tolerance (e.g. atrophy), maintenance, increased stress tolerance
(e.g. hypertrophy), injury or death. The physical stress levels that are in the range of
tissues’ ability to cope with applied stimuli, e.g. maintenance zone, result in no apparent
changes. Whereas physical stress levels lower than maintenance range result in
decreased tolerance to subsequent stress, and higher stress levels will increase tissue
tolerance to subsequent stresses. These principles describe the relative effects of regular
exercise training, in which appropriate overloading stimulates musculoskeletal,
cardiovascular/pulmonary and neuromuscular systems to adapt to physical demands and
increase their tolerance. (Mueller & Maluf 2002.)
In general it is believed that regular moderate intensity exercise training has beneficial
effects on immune system and excessive amounts of exercise may rather have negative
consequences (Walsh et al. 2011b). Physical activity is associated with lower
concentration of inflammatory markers, e.g. circulating leukocyte levels. Individuals
who are little to moderately active during their leisure time frequently have 10% lower
white blood cell (WBC) counts than sedentary individuals. (Pitsavos et al. 2003.)
It has been shown that monocyte and neutrophil counts are associated with individual’s
maximal oxygen uptake (VO2max) (Michishita et al. 2008), which is a parameter defining
the ability of person’s cardiorespiratory system to transport oxygen from the air to the
tissues at given level of physical conditioning and oxygen availability (Hawkins et al.
2007). Michishita et al. (2008) reported an association between cardiorespiratory fitness
and leukocyte content, as monocyte and neutrophil counts were higher in women with
low VO2max compared to those with higher physical fitness.
Similar findings were observed by Metrikat and colleagues (2009), who analysed the
associations between inflammatory markers and physical fitness in more than 10 000
young men. The cardiorespiratory fitness was determined by the physical working
capacity at a heart rate of 170 bpm (PWC 170) and subjects were divided into three
groups according to heart rate results. Leukocyte count was inversely associated with
fitness level, as men in high physical fitness group had lower levels of WBCs than men
with poorer aerobic capacity.
22
Kim et al. (2005) obtained similar result in apparently healthy Korean men. Researchers
classified 8241 men in range of 16-79 years (median 48) dividing them into three
groups based on their WBC counts. Subjects also performed graded exercise test on the
treadmill to determine their peak oxygen uptake. An inverse association between
leukocyte count and cardiorespiratory fitness was found. The results of the study
suggest that greater physical fitness has a beneficial effect by reducing the subclinical
inflammation, as men with higher cardiorespiratory fitness had lower total WBC counts.
These cross-sectional studies suggest that good physical fitness is associated with lower
levels of inflammatory markers, represented by the number of circulating leukocytes, in
very different populations, as both overweight older women and healthy men confirmed
beneficial effects of physical conditioning.
4.2 Acute responses to endurance and strength exercise
Acute exercise affects the number and the function of circulating cells of both innate
and adaptive immune system (Walsh et al. 2011b). In 1932, Edwards and Wood
described leukocytosis, an increase in total white blood cell count, in response to hard
muscular work and increase seemed to be proportional to intensity and duration of the
exercise. They described 200-300% leukocytosis in American football players
immediately after the match. Authors also reviewed the results of the other researchers,
who detected leukocytosis in athletes after marathon run and shorter distance runs.
(Edwards & Wood 1932.)
The response of leukocyte subpopulations to an acute exercise bout is very stereotyped
and can be divided into two phases (Figure 9). The rise of the neutrophil, lymphocyte
and monocyte counts starts during the first minutes of endurance type exercise.
Immediately after cessation of the exercise neutrophil count continues to increase,
whereas lymphocyte and mature monocyte values drop below the pre-exercise levels
and they stay low for 2h after the exercise. The leukocyte values return to resting levels
within 24 hours after the end of the exercise bout that lasts less than two hours. (Gabriel
& Kindermann 1997, Moyna et al. 1996, Pedersen & Hoffman-Goetz 2000.) The first
increase in neutrophil count is caused by demargination due to shear stress and increase

in catecholamine concentration
levels such as cortisol during the exercise may also be responsible for monocytosis in
peripheral circulation
immediately after the exercise is caused by the actions of catecholamines, especially
epinephrine (Walsh et al. 2011b)
FIGURE 9. Exercise-induced leukoc
Similarly to acute endurance exercise bout, resistance exercise induces rapid
leukocytosis in healthy men (Hulmi et al. 2010). Total leukocytes, lymphocyte,
monocyte and neutrophil numbers increase during and immediately after the resistance
exercise (Kraemer et al. 1996). Monocyte and in particular neutrophil counts may
remain elevated up to 2 hours post
decline rather quickly to baseline or below baseline values
Volek 2012). The major contributors to resistance exercise induced leukocytosis are
lymphocytes, especially NK cells
It seems that previous resistance training background does not affect the response to an
acute resistance exercise bout in young and older men. For instance, Hulmi et al
did not find substantial differences in WBC counts in response to acute resistance
exercise bout in subjects who underwent 21
programme. Likewise, previous regular endurance training (running, cycling,
in catecholamine concentration (McCarthy et al. 1992a). Increase in stress hormone
levels such as cortisol during the exercise may also be responsible for monocytosis in
peripheral circulation (Okutsu et al. 2008). Lymphocytosis observed during and
mediately after the exercise is caused by the actions of catecholamines, especially
(Walsh et al. 2011b).
induced leukocytosis (adapted from Rowbottom & Green 2000)
Similarly to acute endurance exercise bout, resistance exercise induces rapid
leukocytosis in healthy men (Hulmi et al. 2010). Total leukocytes, lymphocyte,
monocyte and neutrophil numbers increase during and immediately after the resistance
mer et al. 1996). Monocyte and in particular neutrophil counts may
remain elevated up to 2 hours post-exercise, whereas lymphocytes, including NK cells
decline rather quickly to baseline or below baseline values (reviwed in
major contributors to resistance exercise induced leukocytosis are
lymphocytes, especially NK cells (Ramel et al. 2003, Simonson & Jackson 2004)
It seems that previous resistance training background does not affect the response to an
cise bout in young and older men. For instance, Hulmi et al
did not find substantial differences in WBC counts in response to acute resistance
exercise bout in subjects who underwent 21-week total-body resi
programme. Likewise, previous regular endurance training (running, cycling,
23
. Increase in stress hormone
levels such as cortisol during the exercise may also be responsible for monocytosis in
. Lymphocytosis observed during and
mediately after the exercise is caused by the actions of catecholamines, especially
Rowbottom & Green 2000).
Similarly to acute endurance exercise bout, resistance exercise induces rapid
leukocytosis in healthy men (Hulmi et al. 2010). Total leukocytes, lymphocyte,
monocyte and neutrophil numbers increase during and immediately after the resistance
mer et al. 1996). Monocyte and in particular neutrophil counts may
exercise, whereas lymphocytes, including NK cells
iwed in Freidenreich &
major contributors to resistance exercise induced leukocytosis are
(Ramel et al. 2003, Simonson & Jackson 2004).
It seems that previous resistance training background does not affect the response to an
cise bout in young and older men. For instance, Hulmi et al. (2010)
did not find substantial differences in WBC counts in response to acute resistance
body resistance training
programme. Likewise, previous regular endurance training (running, cycling,

24
swimming) for a minimum of 30 minutes three times a week does not affect the
magnitude and composition of leukocytosis in response to acute aerobic exercise bout
(Moyna et al. 1996).
4.3 HSPA1A and acute exercise
Fehrenbach and co-workers (2000b) have studied the expression of HSPA1A in
circulating leukocyte subpopulations of endurance trained athletes after a half-marathon,
and showed increased HSPA1A content in the cytoplasm of leukocytes immediately
after the half-marathon until the 24h post-competition. Additionally, applying a heat-
shock in vitro (2 h, 42°) to the leukocytes of trained and untrained subjects at rest
showed more pronounced increase in HSPA1A mRNA in leukocytes of trained athletes
(Fehrenbach et al. 2000a).
The effects of half-marathon on HSPA1A protein and mRNA levels were studied also
by Schneider et al. (2002) and compared to effects of heat-shock in vitro. An increase in
protein and mRNA levels was observed after both stresses, but HSPA1A expression
remained up-regulated for longer time in leukocytes after physical stress in vivo (half-
marathon).
Leukocytes of trained men and women were also studied by Shastry and others (2002),
who did not detect the increase in HSPA1A levels in response to endurance exercise
bout. They examined expression of HSPA1A in trained individuals after moderate-to-
heavy exercise. 11 trained subjects ran on a treadmill for one hour at 70% of VO2max.
HSPA1A levels were measured prior to the exercise, 15 and 24 hours following the
exercise. The lack of significant increase was explained by individual variation: seven
of 11 subjects showed an increase in HSPA1A levels, two showed no changes and two
subjects showed a decrease; suggesting a genetic variability in HSPA1A expression.
Also it is possible that duration and intensity of the exercise was not sufficient enough
to stimulate the increase in endurance trained subjects’ leukocytes.
Shin et al. (2004) investigated HSPA1A mRNA and protein expression in response to
endurance type exercise in not only trained but also untrained subjects’ leukocytes. Ten
endurance-trained and 10 untrained young men ran on a treadmill for one hour at 70%
25
of their heart rate reserve. Immediately after and 30 minutes post exercise HSPA1A
protein concentration increased significantly in both groups, slightly more in untrained
subjects compared to endurance trained men. HSPA1A mRNA in the other hand was
expressed more in trained men compared to untrained.
The three studies described above used exercise of relatively long duration. In contrast,
Sakharov and his group (2009) used short duration exercise test to determine HSPA1A
expression in trained skiers. Four young trained skiers performed an incremental
treadmill test lasting approximately 15 minutes. This highly intense physiological stress
was sufficient to increase mRNA levels on average 1.5 times.
4.4 Chronic effects of endurance and strength exercise training
The effects of chronic exercise training on the cells of immune system are not well
known. Horn and colleagues (2010) analysed blood tests of more than 1000 elite male
athletes which were collected over a 10-year period in 14 different sports disciplines
(Figure 10). The lowest total WBC and neutrophil counts were found in athletes who
were engaged in individual, highly aerobic sports such as cycling and triathlon. The
highest WBC counts were observed in team sports, namely rugby and water polo.
Significant relationship between aerobic content of a sport and WBC counts was
detected. Authors of the article did not consider plasma volume expansion as a cause for
low neutrophil count due the fact that neutropenia was rather substantial (20%) in
endurance disciplines compared to other sports.

FIGURE 10. Total WBC and neutrophil counts in athletes, adapted from
Saygin et al. (2006) compared total WBC values in sedentary individuals, volley ball
players and long distance running athletes. The highest total WBC count was found in
volley ball players, followed by sedentary individuals, while the endurance athletes had
the lowest leukocyte count. Michishita et al
previously sedentary women to an endurance exercise study. Result of this longitudinal
study showed that six weeks of training lowered f
these longitudinal and cross
have lower total leukocyte levels and aerobic training may decrease WBC in previously
sedentary individuals.
WBC counts of young res
in study of Ramel et al.
least three times a week for six months or more
Total WBC and neutrophil counts in athletes, adapted from Horn et al.
compared total WBC values in sedentary individuals, volley ball
players and long distance running athletes. The highest total WBC count was found in
volley ball players, followed by sedentary individuals, while the endurance athletes had
lowest leukocyte count. Michishita et al. (2010) recruited overweight and
previously sedentary women to an endurance exercise study. Result of this longitudinal
study showed that six weeks of training lowered fasting total WBC count. Data from
these longitudinal and cross-sectional studies show that endurance type athletes tend to
have lower total leukocyte levels and aerobic training may decrease WBC in previously
WBC counts of young resistance trained men were compared to untrained male subjects
(2003). Men who performed resistance type exercise training at
least three times a week for six months or more, had slightly lower total leukocyte,
26
Horn et al. (2010).
compared total WBC values in sedentary individuals, volley ball
players and long distance running athletes. The highest total WBC count was found in
volley ball players, followed by sedentary individuals, while the endurance athletes had
recruited overweight and
previously sedentary women to an endurance exercise study. Result of this longitudinal
asting total WBC count. Data from
sectional studies show that endurance type athletes tend to
have lower total leukocyte levels and aerobic training may decrease WBC in previously
istance trained men were compared to untrained male subjects
Men who performed resistance type exercise training at
had slightly lower total leukocyte,
27
neutrophil, monocyte and lymphocyte levels compared to not resistance trained men.
However, 70% of the resistance trained men also took part in aerobic exercise 2-3 times
per week, which may have affected the resting leukocyte levels.
Chronic strength training alone without endurance exercise does not seem to elicit
significant changes in basal leukocyte count. Hulmi et al. (2010) studied the effects of
21-week resistance training in which young and middle-aged healthy men participated
in total-body heavy workouts twice a week. Likewise, Cardoso et al. (2012) compared
basal levels of WBC at rest in women who took part in resistance training at local
fitness centre as a minimum two times per week for last two years and sedentary
controls. No differences were found in WBC counts at rest between sedentary and
resistance trained women.
4.5 HSPA1A and chronic exercise training
Adaptations to endurance type exercise down-regulate HSPA1A protein expression at
the baseline and in response to exercise in humans (Yamada et al. 2008). Shastry et al.
(2002) found that endurance trained athletes have significantly lower levels of HSPA1A
in leukocytes at rest. The same pattern was observed in several other studies
(Fehrenbach et al. 2000a, Selkirk et al. 2009, Shin et al. 2004) where the counts of
HSPA1A-positive leukocytes were lower in trained athletes compared with untrained
subjects’ leukocytes. Trained subjects had slightly lower HSPA1A levels in response to
same relative intensity exercise bout than untrained subjects.
While trained subjects tend to have lower HSPA1A protein levels at rest, the mRNA
levels are usually higher at the baseline in leukocytes of endurance trained athletes
compared with sedentary (Yamada et al. 2008). The content of mRNA measured in two
studies yielded the same results – trained individuals have higher mRNA levels
compared to untrained (Fehrenbach et al. 2000a) or sedentary controls (Shastry et al.
2002).
One explanation to differences in HSPA1A protein and mRNA content in relation to
training background can lay in thermoregulation. Endurance trained athletes may have
better thermoregulation, they sweat more than untrained subjects and have lower
28
increase in body temperature which leads to lower HSPA1A protein content (Shin et al.
2004). Additionally, higher mRNA content at rest in athletes provides enough
transcripts for immediate translation into protein whenever necessary (e.g. after stress
exposure) (Fehrenbach et al. 2000a). Thus the increased mRNA levels allow athletes to
have lower protein levels at rest; as mRNA can be translated rapidly into protein
(Yamada et al. 2008).
4.6 Exercise and hormones
In response to exercise stress the release and concentration of numerous hormones,
including norepinephrine, epinephrine, growth hormone (GH) (Kindermann et al. 1982)
cortisol, β-endorphin, adrenocorticotropic hormone (ACTH), (Gabriel & Kindermann
1997) and testosterone (Meckel et al. 2009) is altered. Several of these stress-induced
hormones elicit substantial changes in total number and relative proportions of blood
leukocytes (Dhabhar 2008).
Catecholamines. Epinephrine and norepinephrine have roles in mediating body’s
physiological responses to physical stressors such as endurance or strength exercise
bout. Catecholamines stimulate cardiac, respiratory, thermoregulatory functions (Zouhal
et al. 2008), as the activation of sympathetic nervous system results in increased heart
rate, cardiac output and systemic arterial pressure, and bronchodilation (Zouhal et al.
2013). The correlation between exercise-induced catecholamine increase and
leukocytosis is strong (Shephard 2003). Increase in circulating neutrophil, monocyte
and lymphocyte, in particular NK cell, number in response to an acute exercise bout can
be caused due to shear stress and release of catecholamines (McCarthy et al. 1992b,
Walsh et al. 2011a).
Anabolic hormones. GH secretion by acidophilic cells of anterior pituitary is increased
during physical activity from to two to ten-fold (Kraemer & Ratamess 2005; Ranabir &
Reetu 2011). GH levels in plasma increase significantly in response to strength exercise
bout (Vissing et al. 2011) and acute aerobic exercise session (Wideman et al. 2002)
promoting tissue anabolism (Kraemer & Ratamess 2005). An increase in GH
29
concentration, in addition to catecholamines, mediates the acute exercise effects on
blood neutrophils (Pedersen & Toft 2000).
Testosterone is an anabolic hormone produced primarily by Leydig cells located in
testes, it is important for muscle mass development and maintenance. It serves as a
major promoter of muscle hypertrophy and increase in strength in response to strength
training. (Vingren et al. 2010.) Testosterone levels in serum increase also in response to
prolonged endurance exercise bout (Daly et al. 2005). The relationship between
exercise-induced testosterone increase and leukocytosis has not been studied
extensively. At the baseline, Brand et al. (2012) found an inverse association between
total WBC, in particular granulocyte count and testosterone levels in middle-aged and
older men. In addition, higher sex hormone values were associated with lower
inflammatory markers.
Stress hormone cortisol activates catabolic and anti-anabolic processes which are
essential for adaptation in stress situations. Its’ metabolic effects include creation of free
pool of amino acids for protein synthesis. (Viru & Viru 2004.) Moderate to high
intensity 30 minutes endurance exercise bout elicits a significant increase in circulating
cortisol levels (Hill et al. 2008). Likewise, high intensity resistance exercise bout causes
greater cortisol response than moderate intensity strength exercise session (Raastad et
al. 2000). Cortisol exerts its effects on circulating leukocytes with a time lag and do not
play a major role in acute exercise leukocytosis (Pedersen & Hoffman-Goetz 2000).
More likely cortisol is responsible for sustained post-exercise lymphopenia and
neutrophilia (Pedersen & Toft 2000). In the study of Risøy et al. (2003) strength
exercise-induced increase in cortisol had no correlation with post-exercise neutrophilia,
but endurance exercise bout induced increase showed association with late neutrophilia.
30
5 PURPOSE OF THE STUDY
The main purpose of the present study was to examine and describe acute and chronic
effects of single session combined endurance and strength (E+S) training on peripheral
blood leukocytes in healthy untrained men. Additionally, the evaluation of acute and
chronic strain of concurrent training by means of studying the expression of HSPA1A
mRNA in peripheral blood mononuclear cells (PBMC) was planned.
Research questions:
1) Is the total WBC count affected by the combined E+S training (acute and chronic
responses)?
2) Is the differential WBC count, i.e. neutrophil, lymphocyte and mixed cell counts,
affected by combined E+S training (acute and chronic responses)?
3) Are there changes in HSPA1A mRNA levels after 12 weeks of training and in
response to an acute E+S exercise bout in PBMC?
4) Are there associations between physical fitness parameters such as endurance or
strength, exercise-induced hormones and circulating WBCs?
Research hypothesis:
The hypotheses to the proposed research question are as follows:
Hypothesis 1: Independently, acute endurance or strength exercise bout induces
leukocytosis, thus analogous increase in immune system cells will be seen in response
to combined E+S bout. While regular endurance training is associated with lower
leukocyte counts, regular strength training does not elicit the same changes. As
combined training contains both endurance and strength exercises at equal proportion,
31
there will be no change or slight decrease in total leukocyte count after 12 weeks of
training.
Hypothesis 2: Neutrophil, lymphocyte and mixed cell counts increase during endurance
and strength exercise bouts. Combined E+S exercise session will increase the levels of
these leukocyte subpopulations.
Hypothesis 3: Endurance-trained individuals have higher HSPA1A mRNA levels at rest,
thus combined E+S exercise training will increase baseline HSPA1A mRNA in subjects’
PBMC. HSPA1A mRNA levels increase in PBMC in response to an acute exercise bout.
Hypothesis 4: Serum concentration of anabolic and stress hormones increases in
response to an acute exercise bout. Anabolic and stress hormone levels will increase
during the combined E+S exercise bout and show an association with circulating
leukocytes.
32
6 METHODS AND MATERIALS
6.1 Subjects and recruitment
Twenty-two healthy men aged 18-40 from the Jyväskylä region were recruited to
participate in the study. Subjects were recruited via advertisements in newspapers and
public places, e.g. libraries and gyms. Ads were posted on the website of University of
Jyväskylä, university staff and student e-mail lists and the city of Jyväskylä. To
participate in the experiment, subjects needed to be recreationally active but without
prior participation in systematic and progressive endurance or strength exercise training
for a minimum of 12 months’ prior to the start of the study. Recreational activity
included light walking, occasional ball games (football) or cycling. In addition,
requirements for participation included the subjects to be free of acute illnesses and
injuries, abstain from smoking for at least 12 months prior to the study as well as to
have the body mass index (BMI) below 31kg/m2. Individuals with metabolic syndrome,
glucose tolerance impairments, cardiovascular or musculoskeletal diseases that may
limit the participation in exercise training were excluded.
All participant candidates completed a phone interview concerning their general health
aspects and attended resting electrocardiogram (ECG) screening as well as blood
pressure testing conducted by project staff. The ECG and blood pressure results were
analysed and approved by cardiologist. Approved subjects participated in a meeting
with project staff where study design, measurements, procedures, possible benefits and
risks were carefully explained. All subjects who agreed to participate signed the
informed consent forms prior to the start of the study. Study was approved by the
Ethical Committee at the University of Jyväskylä and conducted in accordance with the
Declaration of Helsinki.
33
6.2 Study design
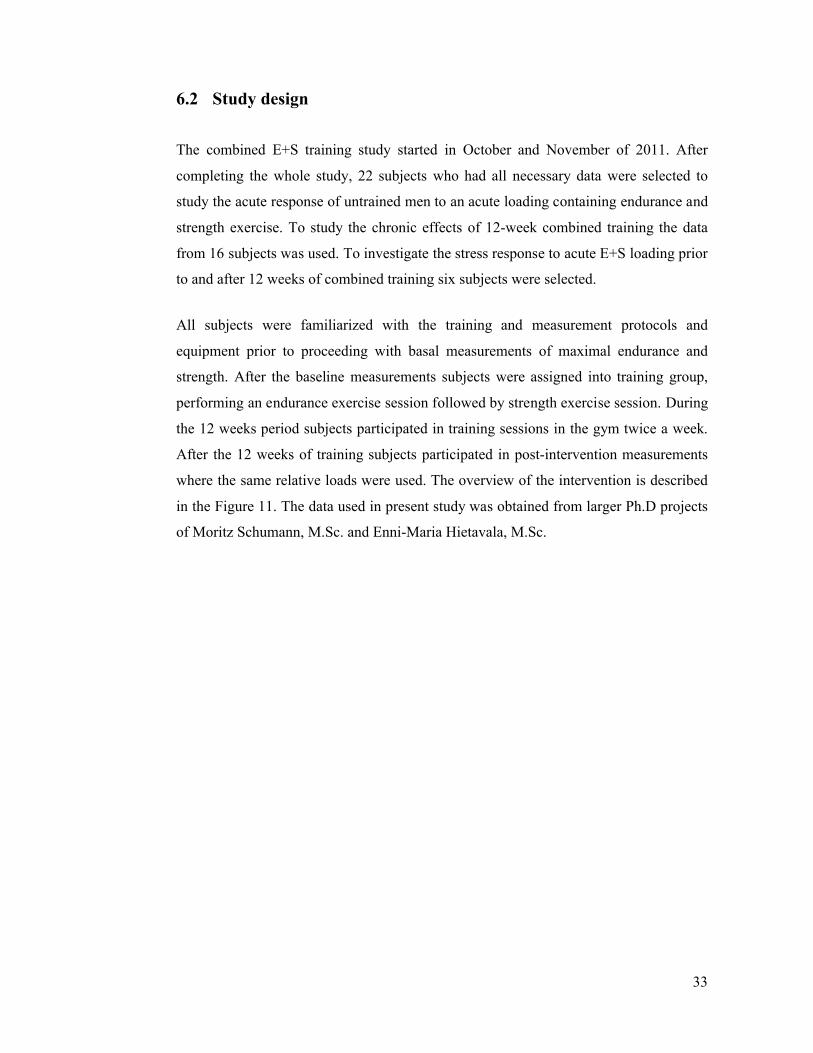
The combined E+S training study started in October and November of 2011. After
completing the whole study, 22 subjects who had all necessary data were selected to
study the acute response of untrained men to an acute loading containing endurance and
strength exercise. To study the chronic effects of 12-week combined training the data
from 16 subjects was used. To investigate the stress response to acute E+S loading prior
to and after 12 weeks of combined training six subjects were selected.
All subjects were familiarized with the training and measurement protocols and
equipment prior to proceeding with basal measurements of maximal endurance and
strength. After the baseline measurements subjects were assigned into training group,
performing an endurance exercise session followed by strength exercise session. During
the 12 weeks period subjects participated in training sessions in the gym twice a week.
After the 12 weeks of training subjects participated in post-intervention measurements
where the same relative loads were used. The overview of the intervention is described
in the Figure 11. The data used in present study was obtained from larger Ph.D projects
of Moritz Schumann, M.Sc. and Enni-Maria Hietavala, M.Sc.
FIGURE 11. Scheme of the study
6.3 Basal measurements
The anthropometric characteristics of the subjects are represented in Table
was measured by tape measure fastened on the wall (accuracy 0.1 cm) with subject
standing upright, feet shoulder with apart, heel against the wall and chin in neutral
position during the measurement. Weight was measured with a digital scale (accuracy
0.1 kg) after the 12 hours fast, heavy clothing and shoes removed. BMI was calculated
as body mass in kilograms divided by the square of the height in meters.
Scheme of the study.
Basal measurements
characteristics of the subjects are represented in Table
was measured by tape measure fastened on the wall (accuracy 0.1 cm) with subject
standing upright, feet shoulder with apart, heel against the wall and chin in neutral
measurement. Weight was measured with a digital scale (accuracy
0.1 kg) after the 12 hours fast, heavy clothing and shoes removed. BMI was calculated
as body mass in kilograms divided by the square of the height in meters.
34
characteristics of the subjects are represented in Table 3. Height
was measured by tape measure fastened on the wall (accuracy 0.1 cm) with subject
standing upright, feet shoulder with apart, heel against the wall and chin in neutral
measurement. Weight was measured with a digital scale (accuracy
0.1 kg) after the 12 hours fast, heavy clothing and shoes removed. BMI was calculated
as body mass in kilograms divided by the square of the height in meters.
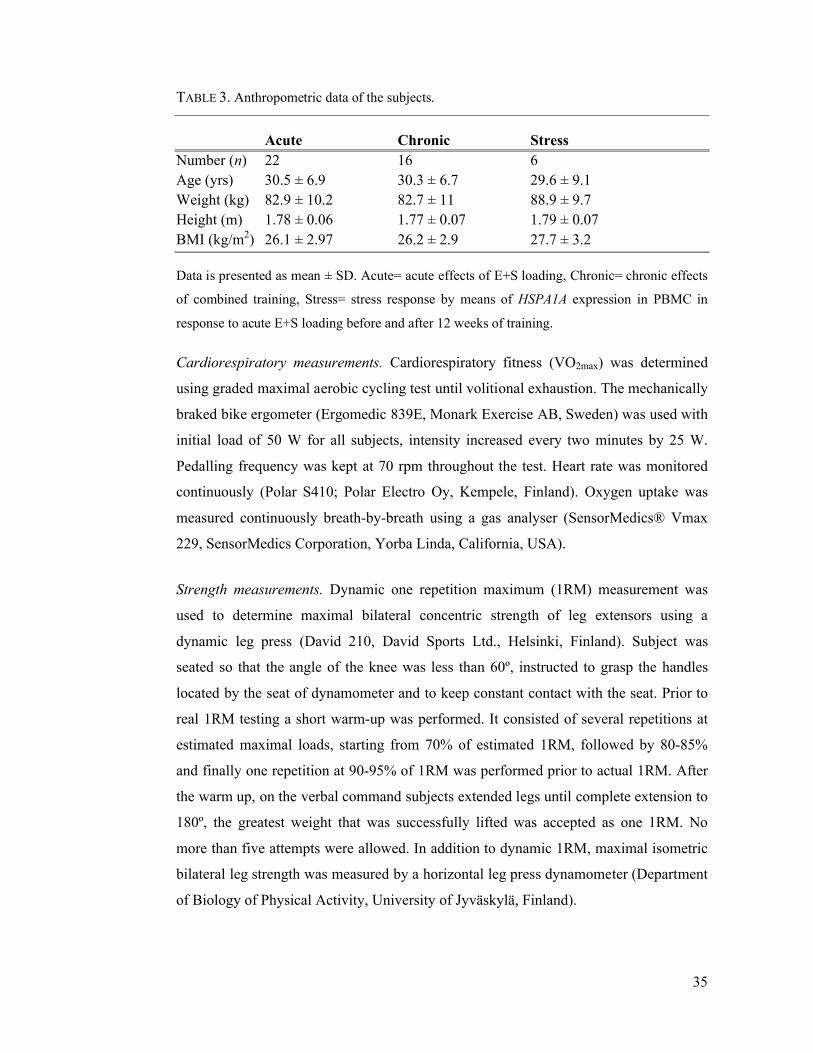
35
TABLE 3. Anthropometric data of the subjects.
Acute Chronic StressNumber (n) 22 16 6Age (yrs) 30.5 ± 6.9 30.3 ± 6.7 29.6 ± 9.1Weight (kg) 82.9 ± 10.2 82.7 ± 11 88.9 ± 9.7 Height (m) 1.78 ± 0.06 1.77 ± 0.07 1.79 ± 0.07BMI (kg/m2) 26.1 ± 2.97 26.2 ± 2.9 27.7 ± 3.2
Data is presented as mean ± SD. Acute= acute effects of E+S loading, Chronic= chronic effects
of combined training, Stress= stress response by means of HSPA1A expression in PBMC in
response to acute E+S loading before and after 12 weeks of training.
Cardiorespiratory measurements. Cardiorespiratory fitness (VO2max) was determined
using graded maximal aerobic cycling test until volitional exhaustion. The mechanically
braked bike ergometer (Ergomedic 839E, Monark Exercise AB, Sweden) was used with
initial load of 50 W for all subjects, intensity increased every two minutes by 25 W.
Pedalling frequency was kept at 70 rpm throughout the test. Heart rate was monitored
continuously (Polar S410; Polar Electro Oy, Kempele, Finland). Oxygen uptake was
measured continuously breath-by-breath using a gas analyser (SensorMedics® Vmax
229, SensorMedics Corporation, Yorba Linda, California, USA).
Strength measurements. Dynamic one repetition maximum (1RM) measurement was
used to determine maximal bilateral concentric strength of leg extensors using a
dynamic leg press (David 210, David Sports Ltd., Helsinki, Finland). Subject was
seated so that the angle of the knee was less than 60º, instructed to grasp the handles
located by the seat of dynamometer and to keep constant contact with the seat. Prior to
real 1RM testing a short warm-up was performed. It consisted of several repetitions at
estimated maximal loads, starting from 70% of estimated 1RM, followed by 80-85%
and finally one repetition at 90-95% of 1RM was performed prior to actual 1RM. After
the warm up, on the verbal command subjects extended legs until complete extension to
180º, the greatest weight that was successfully lifted was accepted as one 1RM. No
more than five attempts were allowed. In addition to dynamic 1RM, maximal isometric
bilateral leg strength was measured by a horizontal leg press dynamometer (Department
of Biology of Physical Activity, University of Jyväskylä, Finland).

36
6.4 Acute E+S loadings
Endurance loading (E) consisted of 30 minutes of continuous cycling on the bike
ergometer with electrical resistance (Ergomedic 839E, Monark Exercise AB, Sweden).
Subject pedalled at the pace of 70 rpm, the workload was 65% of maximal workload
determined during basal measurement. A 5-minute light intensity warm-up was
performed before actual endurance loading. Strength loading (S) followed endurance
loading and was conducted using a dynamic leg press (David 210, David Sports Ltd.,
Helsinki, Finland). Explosive, maximal and hypertrophic strength was measured using
the 1RM loads determined during basal strehgth measurements. The time between two
loadings did not exceed 15 minutes and subjects were allowed to drink 2dl of water.
6.5 Training intervention
Training consisted of progressive and periodized combined single session E+S training.
All subjects completed a session of combined training prior to the beginning of the
experimental training period. During this preparatory training phase subjects trained
with light resistance and low intensity. In actual training intervention endurance
training, performed on the cycle ergometer was followed by whole body strength
training. Total training duration averaged between 60 and 120 minutes, and all training
sessions were supervised by project staff.
Endurance training intensity was based on heart rate zones calculated from subject’s
aerobic and anaerobic thresholds. Thresholds were determined during graded maximal
cycling test. Polar® heart rate monitors were used to control the intensity of the
endurance training which was performed on a bicycle ergometer. Continuous and
interval training modes were used in cycling sessions lasting 30-50 minutes.
Strength training was initiated with light resistance and performed as circuit training to
prepare subjects for subsequent resistive exercise training and to verify correct
technique. Following the initial phase, strength training programme focused on muscle
hypertrophy. Subsequently, mixed hypertrophic and maximal strength training was
performed. During the last phase subjects completed maximal strength and explosive
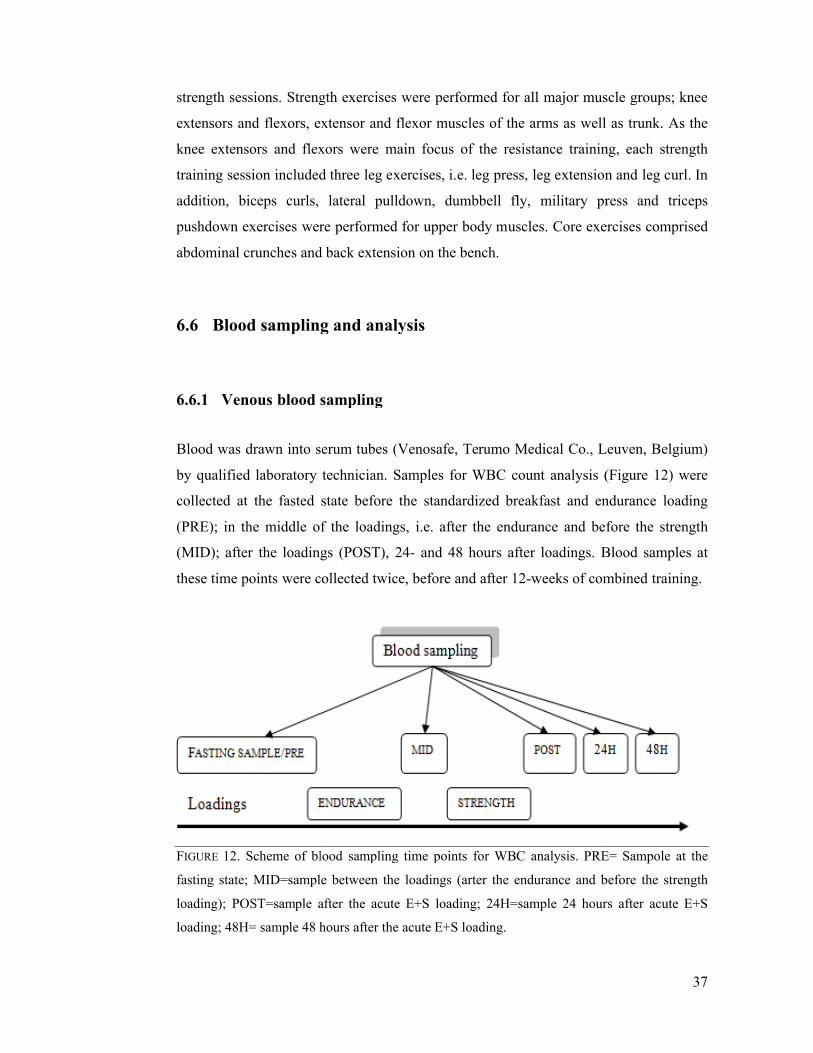
strength sessions. Strength exercises were performed for all major muscle groups; knee
extensors and flexors, extensor and flexor muscles of the arms as well as trunk. As the
knee extensors and flexors were main f
training session included three leg exercises, i.e. leg press, leg extension and leg curl. In
addition, biceps curls, lateral pulldown, dumbbell fly, military press and triceps
pushdown exercises were performe
abdominal crunches and back extension on the bench.
6.6 Blood sampling and analysis
6.6.1 Venous blood sampling
Blood was drawn into serum tubes (
by qualified laboratory technician. Samples for WBC count analysis (Fig
collected at the fasted state before the standardized breakfast and endurance loading
(PRE); in the middle of the loadings, i.e. after the endurance and before the strengt
(MID); after the loadings (POST), 24
these time points were collected
FIGURE 12. Scheme of blood sampling time points
fasting state; MID=sample between the loadings (arter the endurance and before the strength
loading); POST=sample a
loading; 48H= sample 48 hours after the acute E+S loading.
strength sessions. Strength exercises were performed for all major muscle groups; knee
extensors and flexors, extensor and flexor muscles of the arms as well as trunk. As the
knee extensors and flexors were main focus of the resistance training, each strength
training session included three leg exercises, i.e. leg press, leg extension and leg curl. In
addition, biceps curls, lateral pulldown, dumbbell fly, military press and triceps
pushdown exercises were performed for upper body muscles. Core exercises comprised
abdominal crunches and back extension on the bench.
Blood sampling and analysis
Venous blood sampling
Blood was drawn into serum tubes (Venosafe, Terumo Medical Co., Leuven, Belgium)
by qualified laboratory technician. Samples for WBC count analysis (Fig
collected at the fasted state before the standardized breakfast and endurance loading
(PRE); in the middle of the loadings, i.e. after the endurance and before the strengt
(MID); after the loadings (POST), 24- and 48 hours after loadings. Blood samples at
these time points were collected twice, before and after 12-weeks of combined training.
Scheme of blood sampling time points for WBC analysis. PRE
fasting state; MID=sample between the loadings (arter the endurance and before the strength
loading); POST=sample after the acute E+S loading; 24H=sample 24 hours after acute E+S
loading; 48H= sample 48 hours after the acute E+S loading.
37
strength sessions. Strength exercises were performed for all major muscle groups; knee
extensors and flexors, extensor and flexor muscles of the arms as well as trunk. As the
ocus of the resistance training, each strength
training session included three leg exercises, i.e. leg press, leg extension and leg curl. In
addition, biceps curls, lateral pulldown, dumbbell fly, military press and triceps
d for upper body muscles. Core exercises comprised
Venosafe, Terumo Medical Co., Leuven, Belgium)
by qualified laboratory technician. Samples for WBC count analysis (Figure 12) were
collected at the fasted state before the standardized breakfast and endurance loading
(PRE); in the middle of the loadings, i.e. after the endurance and before the strength
and 48 hours after loadings. Blood samples at
weeks of combined training.
PRE= Sampole at the
fasting state; MID=sample between the loadings (arter the endurance and before the strength
fter the acute E+S loading; 24H=sample 24 hours after acute E+S

38
WBC count was determined with Sysmex KX-21N (TOA Medical Electronics Co., Ltd,
Kobe, Japan). Of the WBC neutrophils, lymphocytes and mixed cells (monocytes,
basophils, eosinophils, immature precursor cells) were analysed. Whole blood was
centrifuged at 2500 rpm (Megafuge 1.0R, Heraeus, Germany) for 10 minutes after
which serum was removed and stored at −80°C until further hormonal analysis. Serum
testosterone, cortisol, GH levels were measured using chemical luminescence
techniques (Immulite 1000, DCP Diagnostics Corporation, Los Angeles, California,
USA) and hormone specific immunoassay kits (Siemens, New York, NY, USA). The
sensitivity for testosterone, cortisol and GH assays were: 0.5 nmol·l−1, 5.5 nmol·l−1,
0.026 mlU·l−1respectively.
6.6.2 Separation of PBMCs from whole blood
Blood from antecubital vein for HSPA1A expression analysis was collected into CPT
tubes (BD Vacutainer ®CPT™ 8ml Sodium Citrate/Ficoll, Becton Dickinson
Vacutainer®Systems, N.J. USA) at various time points (Figure 13). Blood was mixed
immediately 8-10 times by inverting the tube. Samples were centrifuged within 30
minutes (Megafuge 1.0 R; Heraeus, Germany) at 1700 x g for 30 minutes at room
temperature. PBMCs were collected with Pasteur pipette and transferred to 15 ml
conical tube. 10 ml of PBS was added to tube, and the cells were mixed by inverting the
tube 5 times. Samples were centrifuged at 300 x g for 15 minutes at room temperature.
Supernatant was discharged, cell pellet resuspended by tapping the tube with index
finger. 10 ml of PBS was added, cells were mixed by inverting the tube 5 times.
Samples were centrifuged at 300 x g for 10 minutes at room temperature. Supernatant
was discharged and the pellet was pipetted into an Eppendorf tube containing 1 ml of
TRIzol®Reagent and stored at −80°C for further analysis.
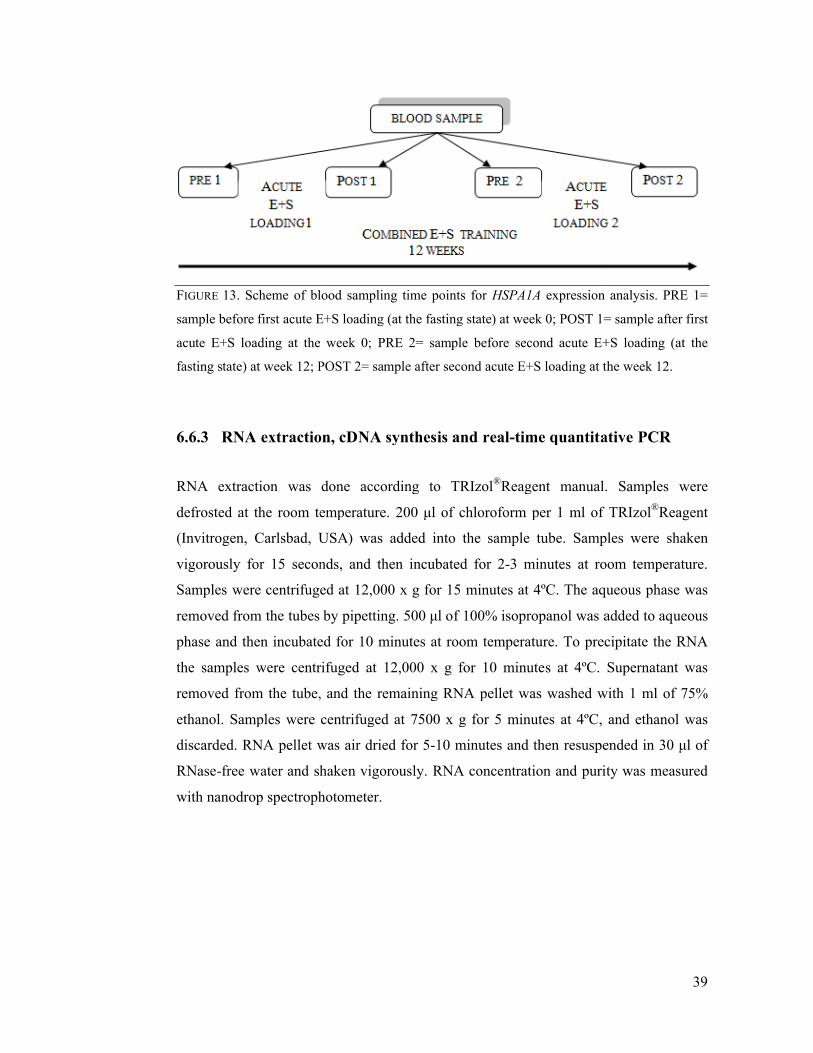
FIGURE 13. Scheme of blood sampling
sample before first acute E+S loading (at the fasting state) at week 0; POST 1= sample after
acute E+S loading at the
fasting state) at week 12; POST 2= sample after second
6.6.3 RNA extraction, cDNA synthesis and real
RNA extraction was done according to TRIzol
defrosted at the room temperature. 200 μl of chloroform per 1 ml of TRIzol
(Invitrogen, Carlsbad, USA
vigorously for 15 seconds
Samples were centrifuged at 12,000 x g for 15 minutes at 4ºC. The aqueous phase was
removed from the tubes by pipetting. 500 μl of 100% isopropanol was added
phase and then incubated for 10 minutes
the samples were centrifuged at 12,000 x g for 10 minutes at 4ºC. Supernatant was
removed from the tube,
ethanol. Samples were centrifuged at 7500 x g for
discarded. RNA pellet was air dried for 5
RNase-free water and shaken vigorously.
with nanodrop spectrophotometer.
lood sampling time points for HSPA1A expression
acute E+S loading (at the fasting state) at week 0; POST 1= sample after
acute E+S loading at the week 0; PRE 2= sample before second acute E+S loading (at the
eek 12; POST 2= sample after second acute E+S loading at the week 12.
xtraction, cDNA synthesis and real-time quantitative PCR
was done according to TRIzol®Reagent manual. Samples were
defrosted at the room temperature. 200 μl of chloroform per 1 ml of TRIzol
, Carlsbad, USA) was added into the sample tube. Samples were shaken
vigorously for 15 seconds, and then incubated for 2-3 minutes at room temperature.
Samples were centrifuged at 12,000 x g for 15 minutes at 4ºC. The aqueous phase was
removed from the tubes by pipetting. 500 μl of 100% isopropanol was added
incubated for 10 minutes at room temperature. To precipitate the RNA
samples were centrifuged at 12,000 x g for 10 minutes at 4ºC. Supernatant was
removed from the tube, and the remaining RNA pellet was washed with 1 ml of 75%
ethanol. Samples were centrifuged at 7500 x g for 5 minutes at 4ºC, and ethanol was
discarded. RNA pellet was air dried for 5-10 minutes and then resuspended in 30 μl of
free water and shaken vigorously. RNA concentration and purity
spectrophotometer.
39
expression analysis. PRE 1=
acute E+S loading (at the fasting state) at week 0; POST 1= sample after first
acute E+S loading (at the
acute E+S loading at the week 12.
time quantitative PCR
Reagent manual. Samples were
defrosted at the room temperature. 200 μl of chloroform per 1 ml of TRIzol®Reagent
was added into the sample tube. Samples were shaken
3 minutes at room temperature.
Samples were centrifuged at 12,000 x g for 15 minutes at 4ºC. The aqueous phase was
removed from the tubes by pipetting. 500 μl of 100% isopropanol was added to aqueous
To precipitate the RNA
samples were centrifuged at 12,000 x g for 10 minutes at 4ºC. Supernatant was
remaining RNA pellet was washed with 1 ml of 75%
5 minutes at 4ºC, and ethanol was
resuspended in 30 μl of
and purity was measured
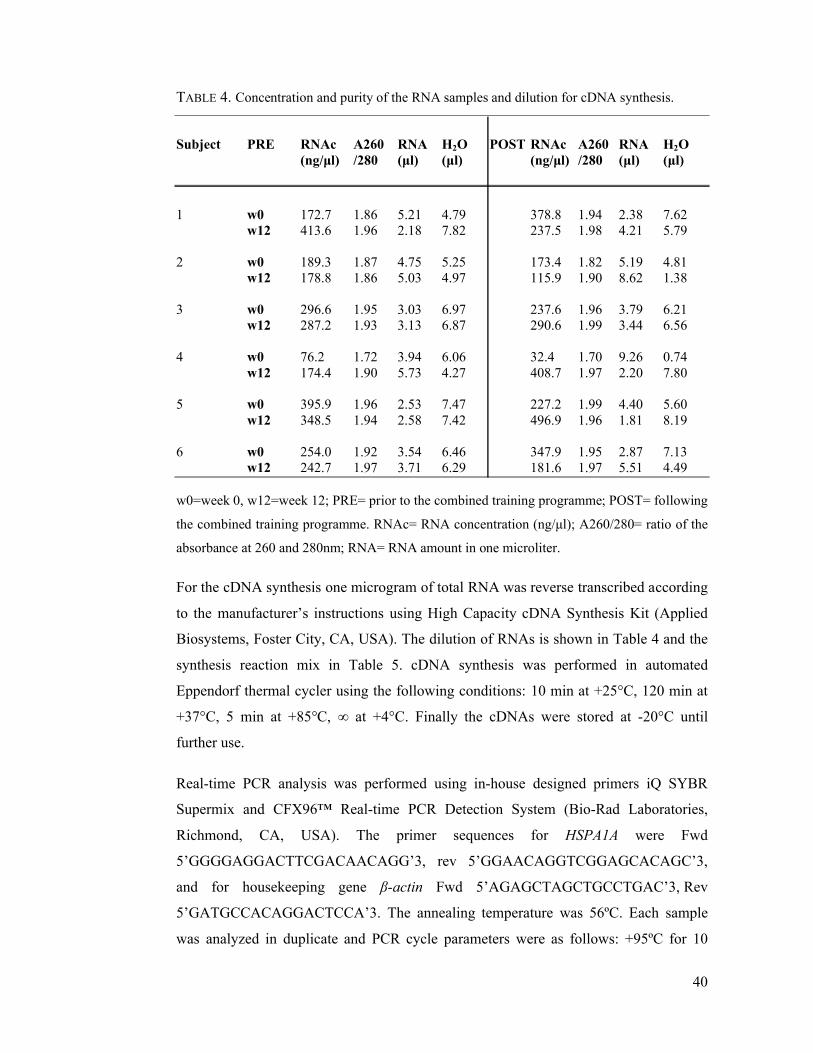
40
TABLE 4. Concentration and purity of the RNA samples and dilution for cDNA synthesis.
Subject PRE RNAc A260 RNA H2O POST RNAc A260 RNA H2O(ng/μl) /280 (μl) (μl) (ng/μl) /280 (μl) (μl)
1 w0 172.7 1.86 5.21 4.79 378.8 1.94 2.38 7.62w12 413.6 1.96 2.18 7.82 237.5 1.98 4.21 5.79
2 w0 189.3 1.87 4.75 5.25 173.4 1.82 5.19 4.81w12 178.8 1.86 5.03 4.97 115.9 1.90 8.62 1.38
3 w0 296.6 1.95 3.03 6.97 237.6 1.96 3.79 6.21w12 287.2 1.93 3.13 6.87 290.6 1.99 3.44 6.56
4 w0 76.2 1.72 3.94 6.06 32.4 1.70 9.26 0.74w12 174.4 1.90 5.73 4.27 408.7 1.97 2.20 7.80
5 w0 395.9 1.96 2.53 7.47 227.2 1.99 4.40 5.60w12 348.5 1.94 2.58 7.42 496.9 1.96 1.81 8.19
6 w0 254.0 1.92 3.54 6.46 347.9 1.95 2.87 7.13w12 242.7 1.97 3.71 6.29 181.6 1.97 5.51 4.49
w0=week 0, w12=week 12; PRE= prior to the combined training programme; POST= following
the combined training programme. RNAc= RNA concentration (ng/μl); A260/280= ratio of the
absorbance at 260 and 280nm; RNA= RNA amount in one microliter.
For the cDNA synthesis one microgram of total RNA was reverse transcribed according
to the manufacturer’s instructions using High Capacity cDNA Synthesis Kit (Applied
Biosystems, Foster City, CA, USA). The dilution of RNAs is shown in Table 4 and the
synthesis reaction mix in Table 5. cDNA synthesis was performed in automated
Eppendorf thermal cycler using the following conditions: 10 min at +25°C, 120 min at
+37°C, 5 min at +85°C, ∞ at +4°C. Finally the cDNAs were stored at -20°C until
further use.
Real-time PCR analysis was performed using in-house designed primers iQ SYBR
Supermix and CFX96™ Real-time PCR Detection System (Bio-Rad Laboratories,
Richmond, CA, USA). The primer sequences for HSPA1A were Fwd
5’GGGGAGGACTTCGACAACAGG’3, rev 5’GGAACAGGTCGGAGCACAGC’3,
and for housekeeping gene β-actin Fwd 5’AGAGCTAGCTGCCTGAC’3, Rev
5’GATGCCACAGGACTCCA’3. The annealing temperature was 56ºC. Each sample
was analyzed in duplicate and PCR cycle parameters were as follows: +95ºC for 10
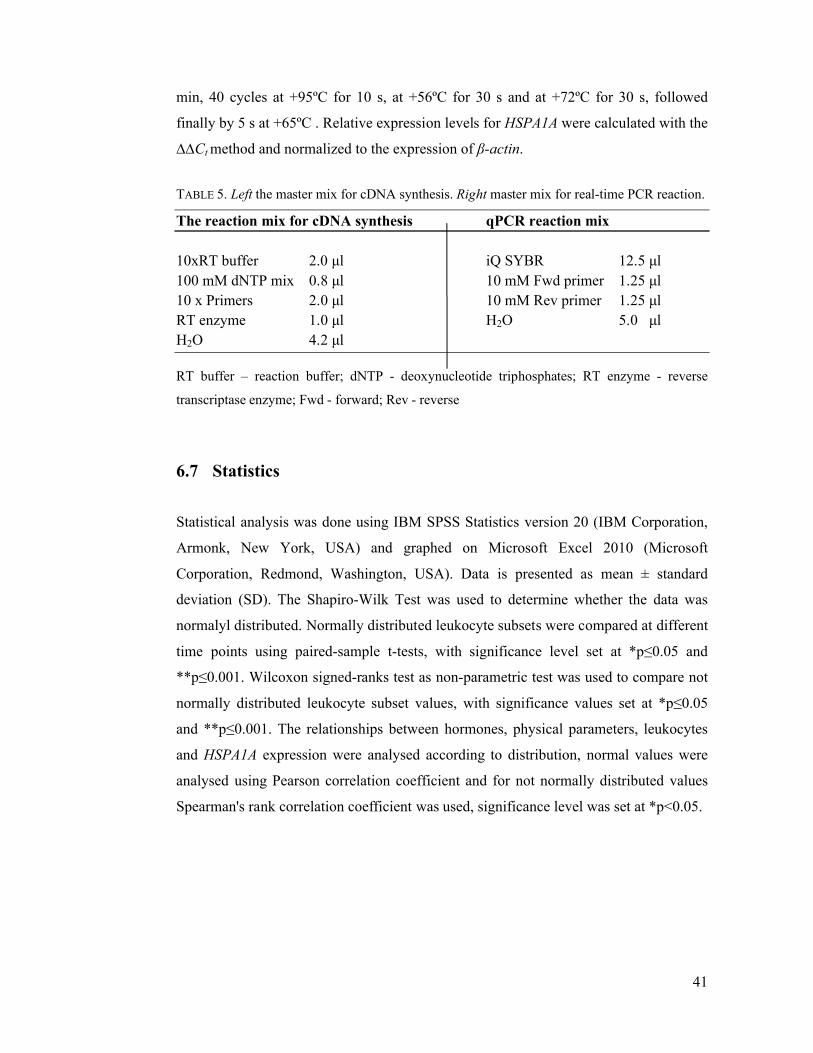
41
min, 40 cycles at +95ºC for 10 s, at +56ºC for 30 s and at +72ºC for 30 s, followed
finally by 5 s at +65ºC . Relative expression levels for HSPA1A were calculated with the
∆∆Ct method and normalized to the expression of β-actin.
TABLE 5. Left the master mix for cDNA synthesis. Right master mix for real-time PCR reaction.
The reaction mix for cDNA synthesis qPCR reaction mix
10xRT buffer 2.0 μl iQ SYBR 12.5 μl100 mM dNTP mix 0.8 μl 10 mM Fwd primer 1.25 μl10 x Primers 2.0 μl 10 mM Rev primer 1.25 μlRT enzyme 1.0 μl H2O 5.0 μlH2O 4.2 μl
RT buffer – reaction buffer; dNTP - deoxynucleotide triphosphates; RT enzyme - reverse
transcriptase enzyme; Fwd - forward; Rev - reverse
6.7 Statistics
Statistical analysis was done using IBM SPSS Statistics version 20 (IBM Corporation,
Armonk, New York, USA) and graphed on Microsoft Excel 2010 (Microsoft
Corporation, Redmond, Washington, USA). Data is presented as mean ± standard
deviation (SD). The Shapiro-Wilk Test was used to determine whether the data was
normalyl distributed. Normally distributed leukocyte subsets were compared at different
time points using paired-sample t-tests, with significance level set at *p≤0.05 and
**p≤0.001. Wilcoxon signed-ranks test as non-parametric test was used to compare not
normally distributed leukocyte subset values, with significance values set at *p≤0.05
and **p≤0.001. The relationships between hormones, physical parameters, leukocytes
and HSPA1A expression were analysed according to distribution, normal values were
analysed using Pearson correlation coefficient and for not normally distributed values
Spearman's rank correlation coefficient was used, significance level was set at *p<0.05.

42
7 RESULTS
7.1 Physical fitness parameters
12-week combined E+S training did not cause significant changes in weight or BMI of
the study participants (Table 6). Significant increase in dynamic 1RM (p=0.003) and
decrease in maximal oxygen consumption VO2max (p=0.028) was observed after 12
weeks of training.
TABLE 6. Combined E+S training effects on physical parameters.
Time weight (kg) BMI (kg/m2) 1RM (kg) VO2max (ml/kg/min)
Week 0 81.2 ± 9.8 26.1 ± 2.9 167 ± 28 33.2 ± 4.6
Week 12 80.7 ± 8.6 25.9 ± 2.5 178 ± 23* 31.9 ± 5.1*
Data presented as mean ± SD; 1RM – dynamic one repetition maximum, *p≤0.05 week 12 vs.
week 0; n=16.
7.2 Immediate effects of acute E+S loading
The baseline values of total blood leukocytes, lymphocytes, neutrophils and mixed cells
(monocytes, basophils, eosinophils, immature precursor cells) were within normal
clinical range (Table 7). Acute loading, containing endurance and strength exercise,
induced substantial leukocytosis in untrained healthy men. The greatest increase was
observed in neutrophil subpopulation. Lymphocytes increased in the first phase of the
loading, which was followed by the decrease. All leukocyte subsets returned to the
baseline level 24 hours after the acute loading.

TABLE 7. Blood leukocyte count of untrained men
Leukocyte
Total WBC countLymphocyte count Neutrophil countMixed cell count
The values given are means ± SD in 10
loading; **p≤0.001, *p≤0.05
Total WBC count increased 33
when compared to baseline
strength protocol resulting in total increase of 48
increased 11%, from 8.44 ± 2.10
E) to 9.39 ± 2.44 · 109/L
WBC count returned to baseline level 24 hours after the acute loading
change 48 hours after the loading, 6.26 ± 0.98 · 10
respectively.
FIGURE 14. Total WBC count measured before (PRE) acute loading, after the endurance
protocol (AFTER E), after strength protocol (AFTER S), 24 and 48 hours post acute loading
prior to the 12-week training period, **p
Blood leukocyte count of untrained men before and after acute loading
PRE POST
6.35 ± 1.02 9.39 ± 2.44**2.46 ± 0.71 2.79 ± 0.873.24 ± 1.03 5.34 ± 2.15**0.66 ± 0.21 0.81 ± 0.19*
The values given are means ± SD in 109/L, PRE – before acute loading, POST
≤0.001, *p≤0.05 PRE vs POST; % of ↑ - percent of increase; n=22.
increased 33% (p≤0.001) after the cycling part of the acute loading
when compared to baseline (Figure 14). The WBC count elevation continued with
lting in total increase of 48% (p≤0.001). Total l
increased 11%, from 8.44 ± 2.10 · 109/L measured after the endurance loading (AFTER
/L measured after the strength loading (AFTER S) (p
WBC count returned to baseline level 24 hours after the acute loading
change 48 hours after the loading, 6.26 ± 0.98 · 109/L and 6.10 ± 0.93 · 10
Total WBC count measured before (PRE) acute loading, after the endurance
protocol (AFTER E), after strength protocol (AFTER S), 24 and 48 hours post acute loading
week training period, **p≤0.001 vs PRE, n=16.
43
before and after acute loading.
% of ↑
48%13%65%24%
before acute loading, POST – after acute
=22.
≤0.001) after the cycling part of the acute loading
). The WBC count elevation continued with
Total leukocyte count
measured after the endurance loading (AFTER
measured after the strength loading (AFTER S) (p≤0.05). Total
WBC count returned to baseline level 24 hours after the acute loading and did not
/L and 6.10 ± 0.93 · 109/L
Total WBC count measured before (PRE) acute loading, after the endurance
protocol (AFTER E), after strength protocol (AFTER S), 24 and 48 hours post acute loading

Lymphocyte count increased 25%
2.46 ± 0.71 · 109/L and 3.07 ± 1.01· 10
started to decline during the strength loading, when
the cycling. Lymphocyte count ret
loading (2.26 ± 0.63 · 10
0.43 · 109/L)
FIGURE 15. Changes in lymphocyte count measured before (PRE) acute loading, after the
endurance protocol (AFTER E), after strength protocol (AFTER S), 24 and 48 hours post acute
loading prior to the 12-week training period, *p
Blood neutrophils (Figure
compared to baseline, from 3.24 ± 1.02 · 10
Elevation continued, reaching 6
(5.34 ± 2.15 · 109/L) (p≤0
(3.23 ± 0.87 · 109/L) after the loading with no further changes.
Lymphocyte count increased 25% from the baseline following the endurance protocol,
/L and 3.07 ± 1.01· 109/L (p≤0.05) (Figure 15). Lymphocyte levels
ne during the strength loading, when compared to levels measured after
the cycling. Lymphocyte count returned near baseline level 24 hours after the acute
loading (2.26 ± 0.63 · 109/L) and remained unchanged 48 hours after the loading (2.24 ±
Changes in lymphocyte count measured before (PRE) acute loading, after the
endurance protocol (AFTER E), after strength protocol (AFTER S), 24 and 48 hours post acute
week training period, *p≤0.05 vs PRE, n=16.
gure 16) increased 42% during the endurance loading when
compared to baseline, from 3.24 ± 1.02 · 109/L to 4.61 ± 1.80 · 10
Elevation continued, reaching 65% measured after the strength phase of the loading
≤0.001). Neutrophil count dropped to the baseline level 24 hours
/L) after the loading with no further changes.
44
from the baseline following the endurance protocol,
. Lymphocyte levels
compared to levels measured after
urned near baseline level 24 hours after the acute
/L) and remained unchanged 48 hours after the loading (2.24 ±
Changes in lymphocyte count measured before (PRE) acute loading, after the
endurance protocol (AFTER E), after strength protocol (AFTER S), 24 and 48 hours post acute
) increased 42% during the endurance loading when
/L to 4.61 ± 1.80 · 109/L (p≤0.001).
% measured after the strength phase of the loading
Neutrophil count dropped to the baseline level 24 hours
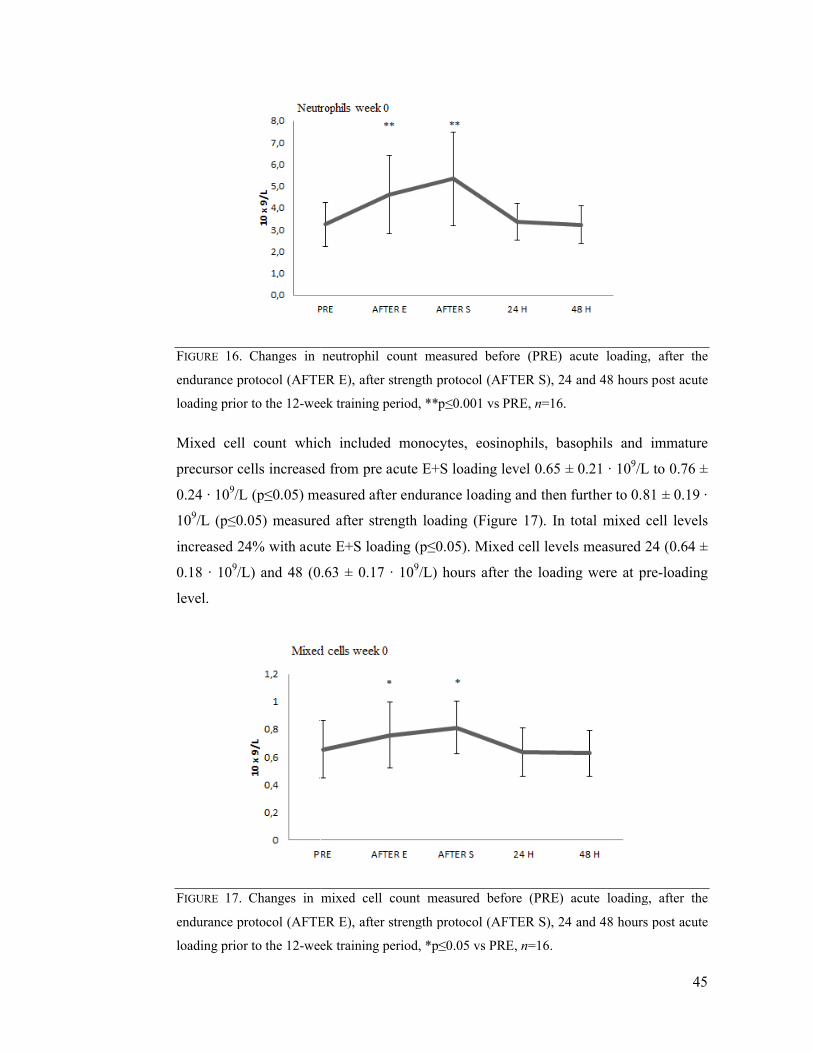
FIGURE 16. Changes in neutrophil count measured before (PRE) acute loading, after the
endurance protocol (AFTER E), after strength pr
loading prior to the 12-week training period, **p
Mixed cell count which included monocytes,
precursor cells increased from pre acute
0.24 · 109/L (p≤0.05) measured after endurance loading and then further to 0.81 ± 0.19 ·
109/L (p≤0.05) measured after strength loading
increased 24% with acute
0.18 · 109/L) and 48 (0.63 ± 0.17 · 10
level.
FIGURE 17. Changes in mixed cell count measured before (PRE) acute loading, after the
endurance protocol (AFTER E), after strength protocol (AFTER S), 24 and 48 hours post acute
loading prior to the 12-week training period, *p
Changes in neutrophil count measured before (PRE) acute loading, after the
endurance protocol (AFTER E), after strength protocol (AFTER S), 24 and 48 hours post acute
week training period, **p≤0.001 vs PRE, n=16.
Mixed cell count which included monocytes, eosinophils, basophils
increased from pre acute E+S loading level 0.65 ± 0.21 · 10
05) measured after endurance loading and then further to 0.81 ± 0.19 ·
05) measured after strength loading (Figure 17). In total mixed cell levels
increased 24% with acute E+S loading (p≤0.05). Mixed cell levels measured 24 (0.64 ±
/L) and 48 (0.63 ± 0.17 · 109/L) hours after the loading were
in mixed cell count measured before (PRE) acute loading, after the
endurance protocol (AFTER E), after strength protocol (AFTER S), 24 and 48 hours post acute
week training period, *p≤0.05 vs PRE, n=16.
45
Changes in neutrophil count measured before (PRE) acute loading, after the
otocol (AFTER S), 24 and 48 hours post acute
eosinophils, basophils and immature
0.65 ± 0.21 · 109/L to 0.76 ±
05) measured after endurance loading and then further to 0.81 ± 0.19 ·
. In total mixed cell levels
ed cell levels measured 24 (0.64 ±
/L) hours after the loading were at pre-loading
in mixed cell count measured before (PRE) acute loading, after the
endurance protocol (AFTER E), after strength protocol (AFTER S), 24 and 48 hours post acute
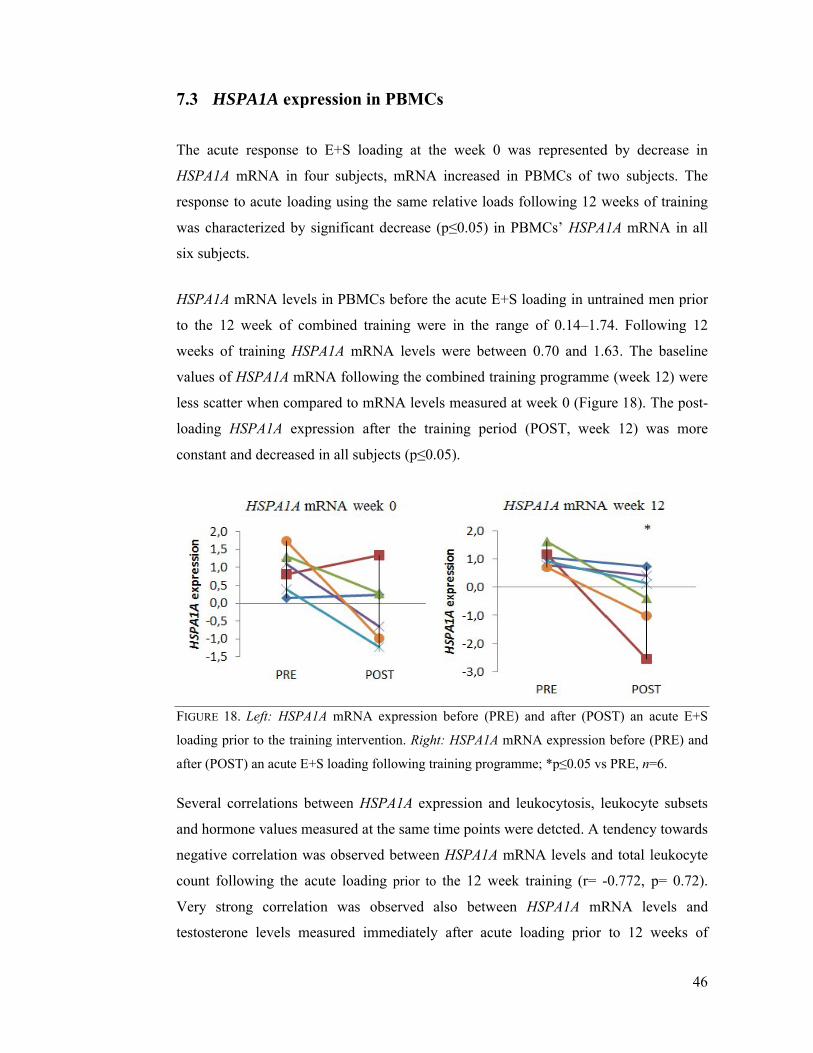
7.3 HSPA1A expression
The acute response to
HSPA1A mRNA in four subjects, mRNA increased in PBMCs of two subjects. The
response to acute loading using the same relative loads following 12 weeks of training
was characterized by significant decrease (p
six subjects.
HSPA1A mRNA levels
to the 12 week of combined training
weeks of training HSPA1A
values of HSPA1A mRNA
less scatter when compared to mRNA levels measured at week 0
loading HSPA1A expression after the tr
constant and decreased in all subjects
FIGURE 18. Left: HSPA1A
loading prior to the training intervention.
after (POST) an acute E+S loading following training programme; *p
Several correlations between
and hormone values measured a
negative correlation was observed between
count following the acute loading
Very strong correlation was observed also between
testosterone levels measured immediately after acute loading prior
expression in PBMCs
The acute response to E+S loading at the week 0 was represented by decrease in
mRNA in four subjects, mRNA increased in PBMCs of two subjects. The
response to acute loading using the same relative loads following 12 weeks of training
ed by significant decrease (p≤0.05) in PBMCs’ HSPA1A
in PBMCs before the acute E+S loading in untrained men prior
combined training were in the range of 0.14–1.74. Following 12
HSPA1A mRNA levels were between 0.70 and 1.63. The baseline
mRNA following the combined training programme (week 12)
compared to mRNA levels measured at week 0 (Figure
expression after the training period (POST, week 12) was
in all subjects (p≤0.05).
HSPA1A mRNA expression before (PRE) and after (POST) an acute E+S
the training intervention. Right: HSPA1A mRNA expression before (PRE) and
after (POST) an acute E+S loading following training programme; *p≤0.05 vs PRE
between HSPA1A expression and leukocytosis, leukocyte subsets
values measured at the same time points were detcted. A tendency towards
negative correlation was observed between HSPA1A mRNA levels and total leukocyte
count following the acute loading prior to the 12 week training (r= -
elation was observed also between HSPA1A mRNA levels
testosterone levels measured immediately after acute loading prior
46
loading at the week 0 was represented by decrease in
mRNA in four subjects, mRNA increased in PBMCs of two subjects. The
response to acute loading using the same relative loads following 12 weeks of training
HSPA1A mRNA in all
in untrained men prior
1.74. Following 12
mRNA levels were between 0.70 and 1.63. The baseline
following the combined training programme (week 12) were
(Figure 18). The post-
aining period (POST, week 12) was more
mRNA expression before (PRE) and after (POST) an acute E+S
mRNA expression before (PRE) and
05 vs PRE, n=6.
leukocytosis, leukocyte subsets
tendency towards
and total leukocyte
-0.772, p= 0.72).
mRNA levels and
testosterone levels measured immediately after acute loading prior to 12 weeks of
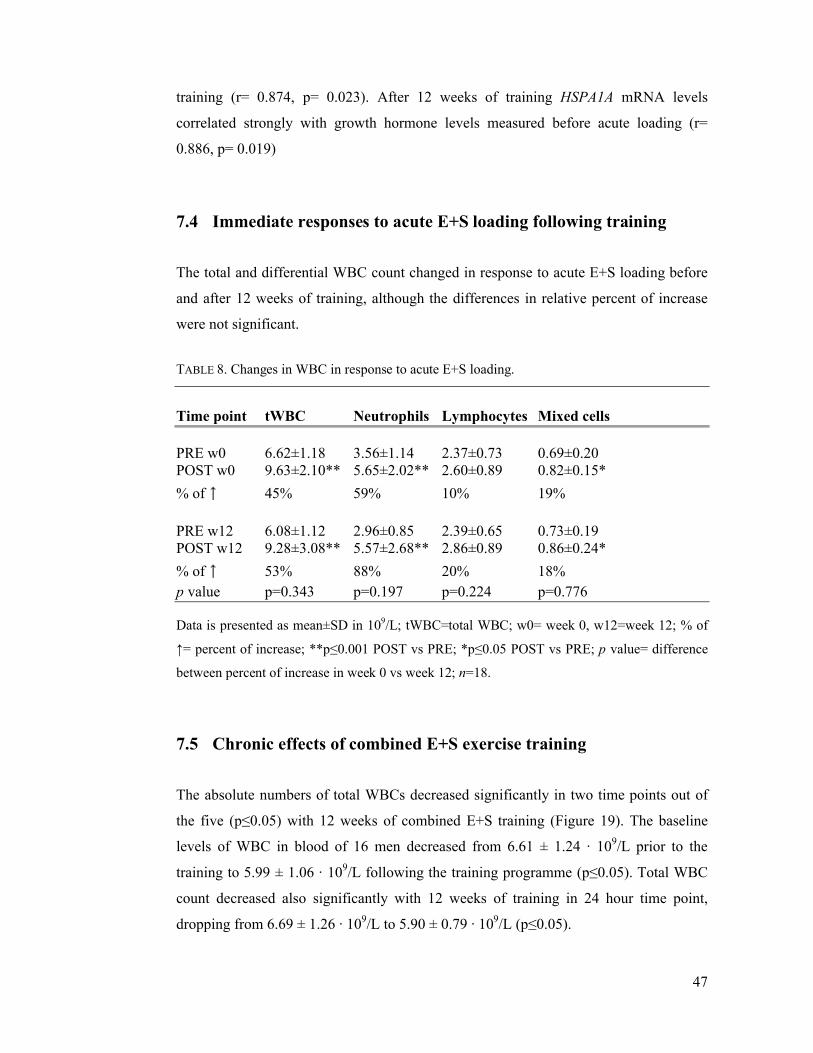
47
training (r= 0.874, p= 0.023). After 12 weeks of training HSPA1A mRNA levels
correlated strongly with growth hormone levels measured before acute loading (r=
0.886, p= 0.019)
7.4 Immediate responses to acute E+S loading following training
The total and differential WBC count changed in response to acute E+S loading before
and after 12 weeks of training, although the differences in relative percent of increase
were not significant.
TABLE 8. Changes in WBC in response to acute E+S loading.
Time point tWBC Neutrophils Lymphocytes Mixed cells
PRE w0 6.62±1.18 3.56±1.14 2.37±0.73 0.69±0.20POST w0 9.63±2.10** 5.65±2.02** 2.60±0.89 0.82±0.15*
% of ↑ 45% 59% 10% 19%
PRE w12 6.08±1.12 2.96±0.85 2.39±0.65 0.73±0.19POST w12 9.28±3.08** 5.57±2.68** 2.86±0.89 0.86±0.24*
% of ↑ 53% 88% 20% 18%p value p=0.343 p=0.197 p=0.224 p=0.776
Data is presented as mean±SD in 109/L; tWBC=total WBC; w0= week 0, w12=week 12; % of
↑= percent of increase; **p≤0.001 POST vs PRE; *p≤0.05 POST vs PRE; p value= difference
between percent of increase in week 0 vs week 12; n=18.
7.5 Chronic effects of combined E+S exercise training
The absolute numbers of total WBCs decreased significantly in two time points out of
the five (p≤0.05) with 12 weeks of combined E+S training (Figure 19). The baseline
levels of WBC in blood of 16 men decreased from 6.61 ± 1.24 · 109/L prior to the
training to 5.99 ± 1.06 · 109/L following the training programme (p≤0.05). Total WBC
count decreased also significantly with 12 weeks of training in 24 hour time point,
dropping from 6.69 ± 1.26 · 109/L to 5.90 ± 0.79 · 109/L (p≤0.05).
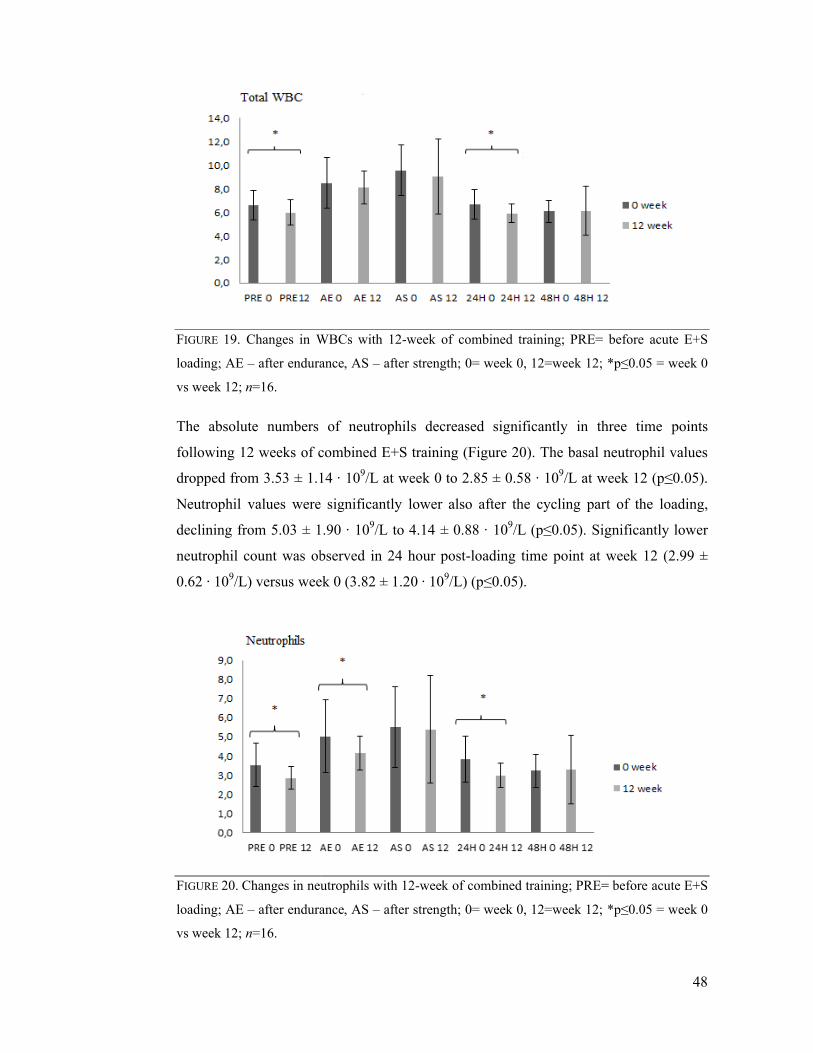
FIGURE 19. Changes in WBCs
loading; AE – after endurance, AS
vs week 12; n=16.
The absolute numbers of n
following 12 weeks of combined
dropped from 3.53 ± 1.14 · 10
Neutrophil values were s
declining from 5.03 ± 1.90 · 10
neutrophil count was observed in 24 hour post
0.62 · 109/L) versus week 0 (3.82 ± 1.2
FIGURE 20. Changes in neutrophils
loading; AE – after endurance, AS
vs week 12; n=16.
WBCs with 12-week of combined training; PRE= before acute E+S
after endurance, AS – after strength; 0= week 0, 12=week 12;
The absolute numbers of neutrophils decreased significantly in three
combined E+S training (Figure 20). The basal neutrophil values
dropped from 3.53 ± 1.14 · 109/L at week 0 to 2.85 ± 0.58 · 109/L at week 12 (p
were significantly lower also after the cycling part of the loading,
from 5.03 ± 1.90 · 109/L to 4.14 ± 0.88 · 109/L (p≤0.05). Significantly lower
nt was observed in 24 hour post-loading time point at week 12 (2.99 ±
) versus week 0 (3.82 ± 1.20 · 109/L) (p≤0.05).
neutrophils with 12-week of combined training; PRE= before acute E+S
endurance, AS – after strength; 0= week 0, 12=week 12;
48
PRE= before acute E+S
*p≤0.05 = week 0
three time points
). The basal neutrophil values
/L at week 12 (p≤0.05).
also after the cycling part of the loading,
Significantly lower
loading time point at week 12 (2.99 ±
PRE= before acute E+S
*p≤0.05 = week 0
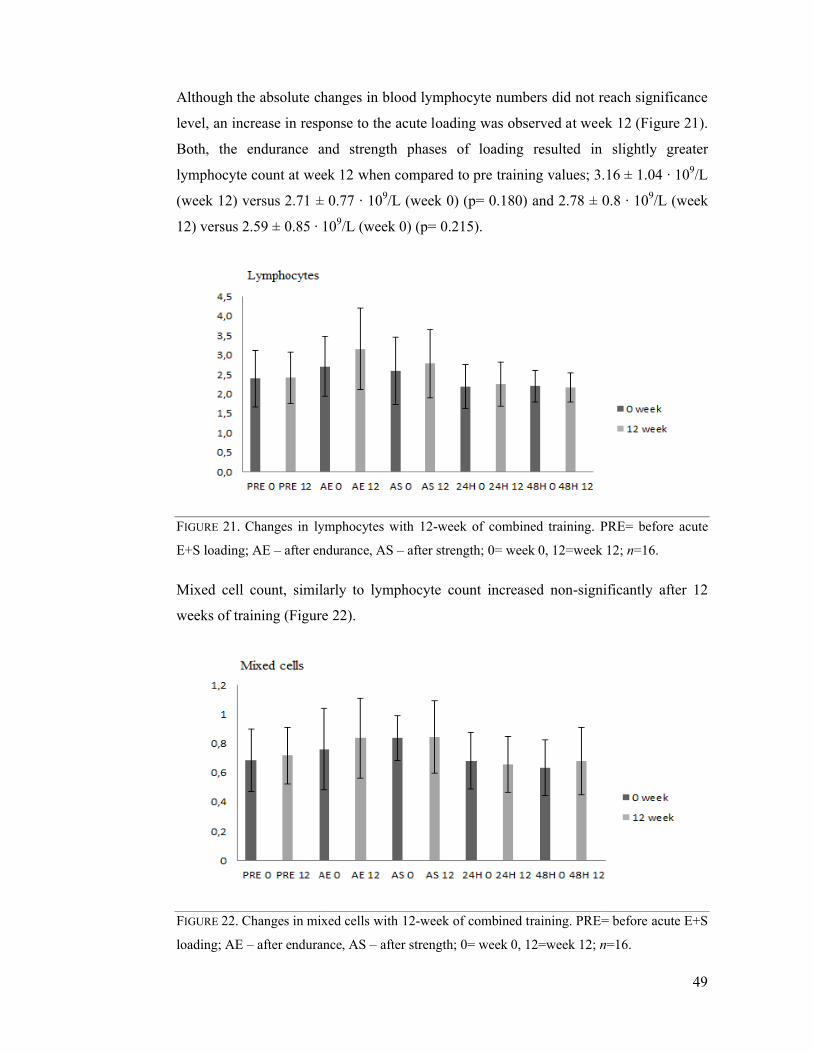
Although the absolute changes in blood lymphocyte
level, an increase in response to the acute loading was observed at week 12 (Figure
Both, the endurance and strength phases of loading resulted in
lymphocyte count at wee
(week 12) versus 2.71 ± 0.77
12) versus 2.59 ± 0.85 · 10
FIGURE 21. Changes in lymphocytes
E+S loading; AE – after endurance, AS
Mixed cell count, similarly to lymphocyte count increased non
weeks of training (Figure
FIGURE 22. Changes in mixed cells
loading; AE – after endurance, AS
changes in blood lymphocyte numbers did not reach significance
level, an increase in response to the acute loading was observed at week 12 (Figure
Both, the endurance and strength phases of loading resulted in
lymphocyte count at week 12 when compared to pre training values; 3.16 ± 1.04
(week 12) versus 2.71 ± 0.77 · 109/L (week 0) (p= 0.180) and 2.78 ± 0.8
· 109/L (week 0) (p= 0.215).
lymphocytes with 12-week of combined training. PRE= before acute
endurance, AS – after strength; 0= week 0, 12=week 12;
Mixed cell count, similarly to lymphocyte count increased non-significantly after 12
weeks of training (Figure 22).
mixed cells with 12-week of combined training. PRE= before acute E+S
ndurance, AS – after strength; 0= week 0, 12=week 12; n
49
did not reach significance
level, an increase in response to the acute loading was observed at week 12 (Figure 21).
slightly greater
k 12 when compared to pre training values; 3.16 ± 1.04 · 109/L
(week 0) (p= 0.180) and 2.78 ± 0.8 · 109/L (week
PRE= before acute
0= week 0, 12=week 12; n=16.
significantly after 12
PRE= before acute E+S
n=16.

50
7.6 Hormones and leukocytes
GH concentration increased significantly in response to acute E+S loading at week 0
and week 12 (p≤0.001), whereas cortisol and testosterone levels did not change
significantly with exercise bout (Table 10). Testosterone levels increased at the baseline
with 12 weeks of combined training (p≤0.001).
TABLE 10. Serum hormone concentration.
w0 PRE w0 POST w12 PRE w12 POST
GH (μg/L) 0.89 ± 0.35 10.29 ± 2.19** 2.17 ± 1.05 7.34 ± 1.21**Cortisol (nmol/L) 496 ± 24 496 ± 56 500 ± 21 497 ± 36Testosterone (nmol/L) 13.82 ± 1.07 14.60 ± 1.28 15.38 ± 0.98# 16.70 ± 1.15
Data is presented as means ± SD; GH – growth hormone, w0= week 0, w12= week 12, PRE=
before acute loading, POST= after acute loading, **p≤0.001 pre vs. post; # p≤0.001 pre at week
0 vs. pre at week 12; n=16.
Several significant correlations between GH and blood leukocytes were detected at the
same time points during the acute loadings before and after 12-week combined E+S
training. The insignificant correlation data is not presented. Prior to the beginning of 12-
week training intervention a negative correlation was observed between mixed cell
count and GH at the fasting state (r= -0.527, p= 0.025). Tendency towards positive
correlation was detected between total WBC count and GH concentration after the acute
E+S loading (r= 0.417, p= 0.108). Following 12 weeks of training a negative correlation
was detected between mixed cell count and GH at the fasting state (r= -0.558, p=
0.025). Positive correlation was detected between total WBC count and GH levels
following the acute loading (r= 0.612, p= 0.012).
51
8 DISCUSSION
The purpose of the current study was to examine and describe the effects of acute E+S
loading and combined E+S training on the total and differential leukocyte count. The
main finding of the study demonstrated that acute E+S loading induced substantial
leukocytosis in the blood of untrained healthy men and 12 weeks of combined E+S
training caused a decrease in basal leukocyte values. Additionally, enhanced response to
an acute E+S loading was observed in several leukocyte subsets following the training
programme. The levels of HSPA1A mRNA transcripts at the baseline increased after
combined E+S training. Noteworthy, combined E+S training programme did not change
substantially either the weight or BMI of the subjects, but significant improvement in
strength parameters was observed.
8.1 Immediate responses to acute E+S loading in untrained men
Acute exercise bout induces general leukocytosis (Gabriel & Kindermann 1997) and
affects differential counts of immune system cells, as changes in leukocyte subsets are
often seen already during and immediately after the exercise bout (Pedersen &
Hoffman-Goetz 2000). Independently, endurance (Natale et al. 2003) and strength
(Simonson 2001) exercise bouts induce leukocytosis in untrained subjects, whereas the
effects of concurrent endurance and strength exercise bouts on immune system
parameters are less known. Combined exercise bout results in dual (endurance and
resistance) responses that may interact and interfere with each other (Arazi et al. 2011).
Arazi et al. (2011) reported a leukocytosis in strength-trained male university students
that was induced by concurrent exercise bout. These findings are in agreement with the
findings of the present study, where substantial leukocytosis was detected in untrained
men following an acute E+S loading protocol. In present study blood samples were
obtained also between the endurance and strength phases of the loading. If performed on
separate occasions, continuous moderate intensity endurance exercise induces greater
leukocytosis than the circuit of resistance exercises (Natale et al. 2003). In current
52
combined bout, cycling exercise at 65% of the maximal workload for 30 minutes
increased leukocyte levels at the greater extent than did subsequently performed
strength protocol. Although, the impact of strength loading phase on blood leukocytes
can not be assessed separately and the second phase of the loading comprises the
combined effects of both exercise modes. Therefore, it can be said that cycling-induced
leukocytosis continued into the strength loading but the initial elevation of total and
differential WBC counts was greater.
The data concerning the effects of the mode, duration and intensity of the exercise on
leukocytosis is controversial. Gimenez et al. (1986) reported that endurance exercise-
induced leukocytosis was more related to the intensity than duration; in contrast Natale
et al. (2003) found that prolonged exercise caused greater leukocytosis than high
intensity short exercise and resistance exercise bout. In present study, both protocols
lasted about 30 minutes and the relative physical strain of the protocols were analogous,
thus seems that mode of the exercise (continuous endurance versus intermittent
resistance) affected the leukocytosis.
Physical exercise is characterized by biphasic alterations in circulating leukocyte counts
where instant mobilization of leukocytes is followed by transient lymphopenia below
the resting levels and prolonged neutrophilia. Leukocyte numbers return to baseline
values within couple of hours (2-4 hours) after cessations of the exercise, although the
homeostasis may not be achieved after the high intensity long duration exercise.
(Hansen et al. 1991, Rowbottom & Green 2000.) However, in present study the blood
sampling time points did not allow to examine whether the acute E+S loading elicits the
phenomenon of biphasic leukocytosis. Blood samples obtained 24 and 48 hours after the
acute E+S loading demonstrated that homeostasis in immune system cells was achieved,
as total and differential leukocyte count returned to the baseline values.
Prolonged aerobic exercise, and to the slightly lesser extent resistance exercise, induce
substantial neutrophilia (Natale et al. 2003). In current study, cycling was performed
first and induced great netrophilia, strength loading performed afterwards added to
cycling-induced neutrophilia. Neutrophils contributed to total leukocytosis the most
when compared to other immunocompetent cells, and this finding is in agreement with
the results from other studies (McCarthy & Dale 1988, Natale et al. 2003). In Natale et
53
al. (2003) study prolonged aerobic exercise, short peak aerobic exercise and circuit
resistance exercise induced significant leukocytosis due to increase in circulating
neutrophil and monocyte quantity.
Lymphocyte numbers increased during the first phase of acute E+S loading, but
following the cessation of cycling exercise lymphocyte count started to decline. The
initial lymphocytosis can be due to recruitment of all lymphocyte subsets to the blood
(Pedersen & Hoffman-Goetz 2000) and the subsequent decline, already during the
exercise, can be caused by the increase in cortisol levels (Shinkai et al. 1996). In present
study the correlation analysis did not reveal any associations between lymphocyte count
variations and cortisol levels. Lymphocyte values started to decline during the strength
exercise but they did not drop below the baseline level by the end of the acute E+S
loading. The fall below the pre-values can not be excluded as the blood samples were
not obtained in recovery period, i.e. 2-4 hours after the exercise when lymphopenia is
the most prominent (McCarthy & Dale 1988, Pedersen et al. 1998).
Mixed cell count, including monocytes, eosinophils and basophils, increased
continuously during the acute E+S loading. Likewise, Hulmi et al. (2010) as well as
Risøy et al. (2003) reported the increase in mixed cell count following a resistance
exercise bout in men. Natale et al. (2003) described substantial increase in monocyte
count in response to the prolonged and short aerobic and resistance type exercise.
Gabriel and Kindermann (1997) observed great increase in eosinophil count in response
to anaerobic and short-term highly intensive exercise and mild increase in response to
aerobic exercise. The number of basophils in peripheral circulation is very low and this
cell type seems to be unresponsive to exercise stress (Simonson & Jackson 2004). Thus,
in present study it might have been that eosinophils and monocytes contributed to
exercise-induced increase seen in mixed cell count.
8.2 Immediate responses to acute E+S loading following exercise
training
The effects of an acute exercise bout following regular exercise training on circulating
leukocytes are not studied much. In current study, the acute E+S loading was used to

54
examine the effects of combined E+S training programme on blood leukocytes, as the
same relative load in acute E+S loading was used before and after the 12-week training
programme. Even though the difference in relative percent of increase did not reach
significance levels, neutrophil count increased more in response to acute E+S loading
following the training than it did prior training intervention. Lymphocytosis and general
leukocytosis was also slightly more substantial after the training, whereas there were
almost no changes in mixed cells response. Neutrophils contributed to general
leukocytosis during acute E+S loading in both time points the most, whereas the
contribution of other cells changed. Namely, lymphocytes increased more during the
second acute E+S loading and mixed cell count increase diminished at the same time
point. In contrast, longitudinal endurance and resistance studies examining blood
leukocytes redistribution before and after the training interventions did not report any
substantial changes. In Rhind et al. (1996) study 12 weeks of endurance training did not
alter the proportion of the cells contributing to leukocytosis. Similarly, no changes were
detected in previously untrained men after 21 weeks of resistance training (Hulmi et al.
2010).
The increased neutrophilia in response to second acute E+S loading can not be
explained by increase in GH concentration, which is known to affect neutrophil count
(Pedersen & Toft 2000), as GH increase was lower than in the first acute E+S loading.
In addition to GH, catecholamine levels during the exercise affect the neutrophil count
(McCarthy et al. 1992b). Although norepinephrine and epinephrine levels were not
measured in present study, it can be speculated that concentration of these hormones
may have altered the exercise-induced neutrophilia.
8.3 Chronic effects of combined E+S training
The effect of the chronic exercise training on immune cell number is rather modest
(Mackinnon 2000, Gleeson 2007). Nevertheless, in cross-sectional study of Horn et al.
(2010) lower basal total leukocyte count in elite athletes who are engaged in aerobically
oriented sports such as cycling or triathlon were reported. In longitudinal study
conducted by Michishita et al. (2010) individuals participating regularly in endurance
training had lower baseline total WBC count. The results of current study are in
55
agreement with above mentioned studies, as 12 weeks of combined E+S training
lowered subjects’ resting total WBC count.
As reported by Hulmi et al. (2010) and Cardoso et al.(2012) participating regularly in
strength training does not affect resting leukocyte values. In the present study strength
training was combined with endurance training in one session, and therefore it can be
speculated that endurance part of the combined E+S training might be responsible for
lowering basal leukocyte values in healthy men. Similar tendency was observed in
Ramel et al. (2003) study, where the subjects who participated in aerobic training in
addition to resistance training (on separate occasions) had lower resting WBC values.
The lower resting WBC counts may represent an anti-inflammatory adaptation induced
by regular exercise training rather than pathological response (Horn et al. 2010).
In addition to lower total WBC count in this study, combined E+S training resulted in
lower resting neutrophil values. Similar finding was reported in elite endurance athletes
in Horn et al. (2010) study. In a contrary, volley ball players and long-distance runners
in Saygin et al. (2006) study and orienteers in Risøy et al. (2003) study had higher
neutrophil values at rest than sedentary controls. Interestingly, 21 weeks of strength
training did not induce any changes in resting neutrophil count in young or old men
(Hulmi et al. 2010), but results of the current study show that strength training in
combination with endurance training decreases neutrophils values in healthy men at
rest. Similarly to decrease observed in total WBC count, decrease in neutrophil count
may reflect adaptive anti-inflammatory response to exercise training (Horn et al. 2010).
Regular endurance type exercise training does not affect the number of lymphocytes at
rest (Moyna et al. 1996). In the present study, lymphocyte count did not change
noticeably following 12 weeks of combined E+S training. Likewise, two weeks of
strength training did not change lymphocyte numbers at rest in recreationally active men
and blood lymphocyte count in young orienteers did not differ from sedentary controls
(Risoy et al. 2003). Resting lymphocyte concentration did not differ between physically
active men and women and sedentary subjects in Moyna et al. (1996) study. Only in
Ferry et al. (1990) study young cyclists had higher lymphocyte count compared to
sedentary controls at rest. Similarly to lymphocyte count, mixed cell count including
monocytes, eosinophils and basophils, did not change with 12 weeks of training. No

56
changes in mixed cell count or independent monocyte count in response to training were
observed in the other longitudinal resistance (Hulmi et al. 2010, Risoy et al. 2003) or
endurance (Ferry et al. 1990) exercise studies.
8.4 HSPA1A responses to combined E+S loading and training
During the exercise, several biophysical and biochemical stimuli work together to
induce rapid up-regulation in immediate early genes, including HSPA1A. The changes
in this group of genes are already seen as early as 10 minutes after the stimulus. (Simon
et al. 2006). In present study, the HSPA1A gene expression in response to an acute E+S
loading containing cycling and strength exercises yielded unexpected results. In contrast
to elevation of HSPA1A mRNA content reported in literature, levels of HSPA1A
transcripts decreased in response to acute exercise bout in present study.
The increase in HSPA1A expression in leukocytes or PBMC has been reported mainly
after endurance type of exercise of different durations and intensities (Connolly et al.
2004, Fehrenbach et al. 2000a, Sakharov et al. 2009, Schneider et al. 2002, Shin et al.
2004). HSPA1A expression response to resistance exercise has mostly been studied in
skeletal muscle tissue (Liu et al. 2000, Liu et al. 2004), and results of the studies
implying strength protocols describe an increase in gene expression. Additionally, the
strain of the exercise plays a role in HSPA1A expression, as moderate and intense
exercise induces greater up-regulation (Yamada et al. 2008). Collectively, sufficient
intensity endurance and resistance exercise protocols performed separately elicit an
increase in HSPA1A expression.
In this study, HSPA1A mRNA content in PBMCs increased in two subjects and
decreased in four subjects in pre training measurements. Following 12 weeks of training
HSPA1A mRNA levels decreased in all six subjects in response to acute loading.
Although an up-regulation in HSPA1A expression was expected, long and inconsistent
nature of the acute loading may have been the reason for such results. The timing of the
blood samples did not allow to examine whether there was an increase in HSPA1A
mRNA after the cycling part of the loading and if the strength loading phase was the
reason of the HSPA1A down-regulation. In addition, the overall intensity of the acute
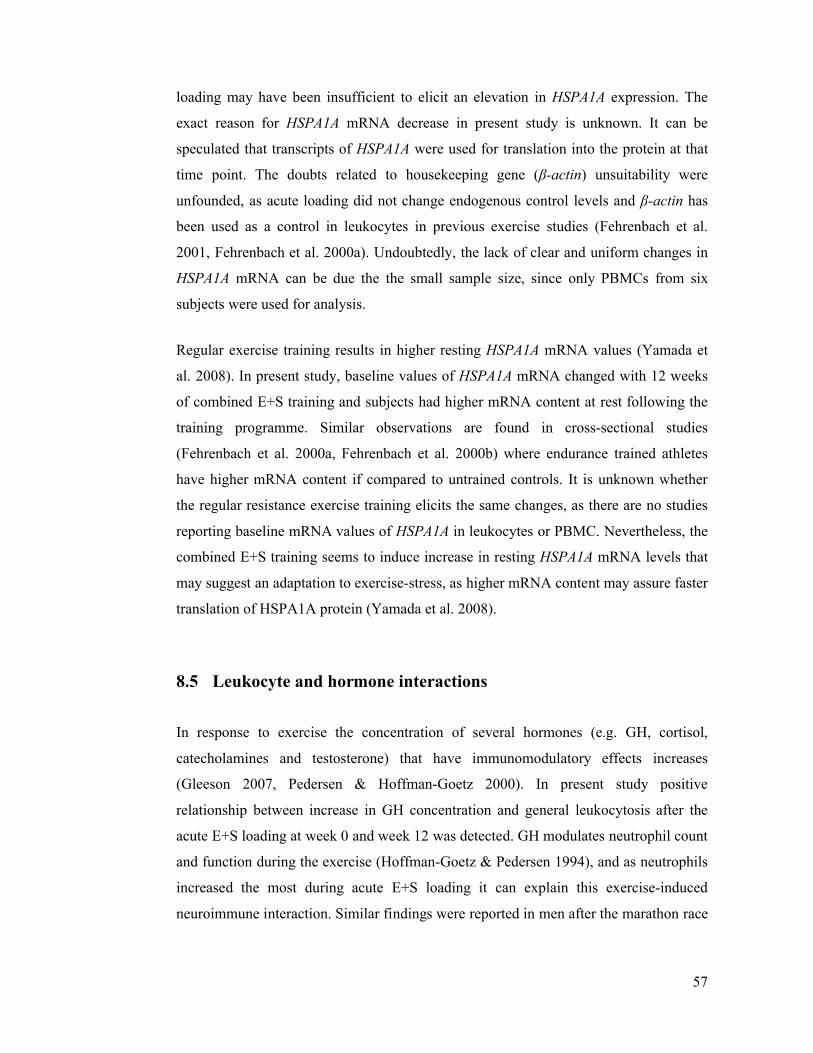
57
loading may have been insufficient to elicit an elevation in HSPA1A expression. The
exact reason for HSPA1A mRNA decrease in present study is unknown. It can be
speculated that transcripts of HSPA1A were used for translation into the protein at that
time point. The doubts related to housekeeping gene (β-actin) unsuitability were
unfounded, as acute loading did not change endogenous control levels and β-actin has
been used as a control in leukocytes in previous exercise studies (Fehrenbach et al.
2001, Fehrenbach et al. 2000a). Undoubtedly, the lack of clear and uniform changes in
HSPA1A mRNA can be due the the small sample size, since only PBMCs from six
subjects were used for analysis.
Regular exercise training results in higher resting HSPA1A mRNA values (Yamada et
al. 2008). In present study, baseline values of HSPA1A mRNA changed with 12 weeks
of combined E+S training and subjects had higher mRNA content at rest following the
training programme. Similar observations are found in cross-sectional studies
(Fehrenbach et al. 2000a, Fehrenbach et al. 2000b) where endurance trained athletes
have higher mRNA content if compared to untrained controls. It is unknown whether
the regular resistance exercise training elicits the same changes, as there are no studies
reporting baseline mRNA values of HSPA1A in leukocytes or PBMC. Nevertheless, the
combined E+S training seems to induce increase in resting HSPA1A mRNA levels that
may suggest an adaptation to exercise-stress, as higher mRNA content may assure faster
translation of HSPA1A protein (Yamada et al. 2008).
8.5 Leukocyte and hormone interactions
In response to exercise the concentration of several hormones (e.g. GH, cortisol,
catecholamines and testosterone) that have immunomodulatory effects increases
(Gleeson 2007, Pedersen & Hoffman-Goetz 2000). In present study positive
relationship between increase in GH concentration and general leukocytosis after the
acute E+S loading at week 0 and week 12 was detected. GH modulates neutrophil count
and function during the exercise (Hoffman-Goetz & Pedersen 1994), and as neutrophils
increased the most during acute E+S loading it can explain this exercise-induced
neuroimmune interaction. Similar findings were reported in men after the marathon race
58
where concurrent elevation in GH and neutrophilia were suggested to be related (Suzuki
et al. 2000).
GH concentration measured in the morning after 12 hours of fasting correlated
negatively with mixed cell count prior to and following the training programme. The
negative relationship between these variables has not been reported elsewhere in
literature so far. It is known that GH is released into circulation at the pulsatile manner
and GH secretion increases at night during the sleep (Muller et al. 1999). Mixed cell
count comprises primarily monocytes, eosinophils and basophils, therefore it can be
speculated that one or more of the three cell types might be affected by GH
concentration at this specific time point.
In cross-sectional studies (Kim et al. 2005, Metrikat et al. 2009, Michishita et al. 2008)
the association between physical parameters, such as VO2max, and leukocyte count was
seen, as higher VO2max values were associated with lower total or differential WBC
counts. In this longitudinal study no such association was detected, and the number of
immune cell decreased but no significant improvement in VO2max was observed. The
lack of improvement in cardiorespiratory parameter may be the reason why no
relationship between leukocyte counts and physical parameters established. Up to date
there is no information about leukocyte and strength parameter associations. In current
study increase in 1RM was substantial but now correlations between strength and
WBCs were observed.
8.6 Strengths and weaknesses of the study
Description of the combined E+S exercise bout (acute E+S loading) induced
leukocytosis can be considered the main strength of the present study. In literature
predominantly separate endurance and strength type exercise bouts have been employed
to evaluate the effects on peripheral leukocytes. Thus for the first time, as known to the
author of this thesis, effects of concurrent exercise modes performed in one session by
recreationally active young men have been studied and defined.
The potential weakness of the present study was the absence of a control group, which
would have allowed excluding other possible factors that may have affected leukocyte
59
count during the study period. One reason for the absence of the control group is the
fact that data used in this thesis was a part of the larger research project, and control
subjects’ data was not collected during specific time period used in current study.
Although, the total WBC count seems to relatively stable across the seasons, with
exception during the time of an acute infections which leads to the increase in
leukocytes (Maes et al. 1994), the rise in WBCs count may occur during the winter
months (Gidlow et al. 1983). In current study, training intervention ended in the winter
and decrease in WBC count during the winter months provides the support to the
finding of exercise-induced adaptations in immune system cells. However, in the future
a control group should be included into experiments to confirm the results of a present
study.
The absence of catecholamine measurements can be seen as a shortcoming, it is known
from other studies that these hormones do affect leukocyte count during the exercise.
However, similarly the reason for this shortcoming was the fact that no catecholamine
data was needed in the main project. In subsequent combined training studies, the
concentration of these hormones should be measured to examine the interaction
between leukocytes and catecholamines. Additionally, the number of the subjects used
for HSPA1A mRNA measurements was small, as only six participants had the blood
sample drawn at corresponding time points. In the prospect experiments more subjects
should be included to measure HSPA1A mRNA expression in response to combined
exercise bout, plus additional samples in post-exercise time point should be collected
for HSPA1A protein measurements. Larger sample size would have resulted in stronger
correlations between immune system cells, HSPA1A mRNA, hormones or physical
performance parameters.
Total and differential WBC count in present study was measured using automated
haematology analyser. Generally, the estimates of WBC counts obtained using
automated analysers are accurate (Buttarello 2004). In addition, automated haematology
analyser provides fast, accurate and reliable readings when compared to manual
microscopic blood examination (Ike et al. 2010). However, in the literature a flow
cytometry method has been used to accurately measure differential WBC counts. For
instance, the automated haematology analysers are not as precise in differentiating
basophils when compared to fluorescence-based flow cytometry (Ducrest et al. 2005).
60
The use of haematology analyser in present study can be explained by the fact that total
and differential WBC count analysis was not the main purpose of the larger research
project. In prospective exercise immunology studies a flow cytometry should be
employed for precise differential leukocyte measurements.
8.7 Summary, conclusions and practical applications
In this thesis the impact of combined E+S exercise and training on the number of
immune system cells was examined. The acute E+S exercise bout elicited leukocytosis
in untrained men similar to leukocytosis seen in independent endurance or strength
exercises. The decrease in number of total WBCs and neutrophils at rest following the
combined E+S training period was observed. The exercise-induced leukocytosis was
greater following the 12-week combined E+S training when compared to pre-training
exercise bout. In addition HSPA1A mRNA content increased at rest after the combined
E+S training period. Two noteworthy associations between GH and leukocytes were
observed, namely total WBC count correlated positively with GH levels measured after
the exercise bout, and an inverse correlation appeared between GH and mixed cell count
prior to the acute E+S loadings.
According to the results of the study it can be said that regular combined E+S training
alters peripheral immune system beneficially, since the number of total leukocytes and
neutrophils decreased during the 12-week combined E+S training period. An amplified
response of blood leukocytes to second acute E+S loading performed following
combined E+S training period was detected. Together these alterations may suggest an
adaptation of immune system cells to regular physical exercise, as cells can be
mobilized rapidly in response to stressful stimuli and maintained low in absence of the
stress. The content of stress protein HSPA1A transcripts at rest in PBMC increased
during combined E+S training period which refers to an adaptation to physical stress at
the intracellular level, since higher level of transcripts permits rapid stress protein
synthesis. The exact reason for HSPA1A mRNA decrease in response to the exercise
bout is unknown. It can be speculated that subjects’ interindividual variation in response
to an exercise stress might have affected the results.

61
In practical terms it can be concluded that intensity, mode and volume of the exercise
training used in current study altered peripheral immune system beneficially and
combined E+S training can be recommended to previously untrained individuals. The
alterations in total and differential leukocyte counts were within clinical range and
increase in HSPA1A mRNA at the baseline is consistent with adaptation to regular
training reported in literature.

62
9 REFERENCES
Alberts, B., Johnson, A., Lewis, J., Raff, M., Roberts, K. & and Walter, P. 2002. Molecular Biology of the Cell. 4th edition. (4th edition) New York: Garland Science.
Ali, M. H. & Imperiali, B. 2005. Protein oligomerization: how and why. Bioorganic & medicinal chemistry 13 (17), 5013-5020.
Arazi, H., Damirchi, A. & Mostafaloo, A. 2011. Variations of hematological parameters following repeated bouts of concurrent endurance-resistance exercises. Journal of Jahrom University of Medical Sciences, 9 (2), 54.
Asea, A. 2007. Mechanisms of HSP72 release. Journal of Biosciences 32 (3), 579-584.
Asea, A. A. A. & Pedersen, B. K. 2010. Heat Shock Proteins and Whole Body Physiology. (1st Edition edition) Dordrecht Heidelberg London New York: Springer.
Beutler, B. 2004. Innate immunity: an overview. Molecular immunology 40 (12), 845-859.
Bonilla, F. A. & Oettgen, H. C. 2010. Adaptive immunity. Journal of Allergy and Clinical Immunology 125 (2, Supplement 2), S33-S40.
Brand, J. S., van der Schouw, Y. T., Dowsett, M., Folkerd, E., Luben, R. N., Wareham, N. J. & Khaw, K. T. 2012. Testosterone, SHBG and differential white blood cell count in middle-aged and older men. Maturitas 71 (3), 274-278.
Buttarello, M. 2004. Quality specification in haematology: the automated blood cell count. Clinica chimica acta; international journal of clinical chemistry 346 (1), 45-54.
Cajone, F., Salina, M. & Benelli-Zazzera, A. 1989. 4-Hydroxynonenal induces a DNA-binding protein similar to the heat-shock factor. The Biochemical journal 262 (3), 977-979.
Calderwood, S. K., Mambula, S. S. & Gray, P. J.,Jr 2007. Extracellular heat shock proteins in cell signaling and immunity. Annals of the New York Academy of Sciences 1113, 28-39.
Campisi, J., Leem, T. H., Greenwood, B. N., Hansen, M. K., Moraska, A., Higgins, K., Smith, T. P. & Fleshner, M. 2003. Habitual physical activity facilitates stress-induced HSP72 induction in brain, peripheral, and immune tissues. American journal of physiology.Regulatory, integrative and comparative physiology 284 (2), R520-30.

63
Cardoso, A. M., Bagatini, M. D., Roth, M. A., Martins, C. C., Rezer, J. F., Mello, F. F., Lopes, L. F., Morsch, V. M. & Schetinger, M. R. 2012. Acute effects of resistance exercise and intermittent intense aerobic exercise on blood cell count and oxidative stress in trained middle-aged women. Brazilian journal of medical and biological research, 45 (12), 1172-1182.
Chung, N. P., Chen, Y., Chan, V. S., Tam, P. K. & Lin, C. L. 2004. Dendritic cells: sentinels against pathogens. Histology and histopathology 19 (1), 317-324.
Daly, W., Seegers, C. A., Rubin, D. A., Dobridge, J. D. & Hackney, A. C. 2005. Relationship between stress hormones and testosterone with prolonged endurance exercise. European journal of applied physiology 93 (4), 375-380.
De Maio, A. 1999. Heat shock proteins: facts, thoughts, and dreams. Shock (Augusta, Ga.) 11 (1), 1-12.
De Maio, A., Santoro, M. G., Tanguay, R. M. & Hightower, L. E. 2012. Ferruccio Ritossa's scientific legacy 50 years after his discovery of the heat shock response: a new view of biology, a new society, and a new journal. Cell stress & chaperones 17 (2), 139-143.
Delves, P. J. & Roitt, I. M. 2000a. The immune system. First of two parts. The New England journal of medicine 343 (1), 37-49.
Delves, P. J. & Roitt, I. M. 2000b. The immune system. Second of two parts. The New England journal of medicine 343 (2), 108-117.
Dhabhar, F. S. 2008. Enhancing versus Suppressive Effects of Stress on Immune Function: Implications for Immunoprotection versus Immunopathology. Allergy, asthma, and clinical immunology : official journal of the Canadian Society of Allergy and Clinical Immunology 4 (1), 2-11.
Ducrest, S., Meier, F., Tschopp, C., Pavlovic, R. & Dahinden, C. A. 2005.Flowcytometric analysis of basophil counts in human blood and inaccuracy of hematology analyzers. Allergy 60 (11), 1446-1450.
Edwards, H. T. and W.,W.B 1932. A study of leukocytosis in exercise. Arbeitsphysiologie 6 (1-2), 73-83.
Febbraio, M. A. & Koukoulas, I. 2000. HSP72 gene expression progressively increases in human skeletal muscle during prolonged, exhaustive exercise. Journal of applied physiology (Bethesda, Md.: 1985) 89 (3), 1055-1060.
Fehrenbach, E., Niess, A. M., Schlotz, E., Passek, F., Dickhuth, H. H. & Northoff, H. 2000a. Transcriptional and translational regulation of heat shock proteins in leukocytes of endurance runners. Journal of applied physiology (Bethesda, Md.: 1985) 89 (2), 704-710.
Fehrenbach, E., Niess, A. M., Veith, R., Dickhuth, H. H. & Northoff, H. 2001. Changes of HSP72-expression in leukocytes are associated with adaptation to exercise under

64
conditions of high environmental temperature. Journal of leukocyte biology 69 (5), 747-754.
Fehrenbach, E., Passek, F., Niess, A. M., Pohla, H., Weinstock, C., Dickhuth, H. H. & Northoff, H. 2000b. HSP expression in human leukocytes is modulated by endurance exercise. Medicine and science in sports and exercise 32 (3), 592-600.
Ferry, A., Picard, F., Duvallet, A., Weill, B. & Rieu, M. 1990. Changes in blood leucocyte populations induced by acute maximal and chronic submaximal exercise. European journal of applied physiology and occupational physiology 59 (6), 435-442.
Fleshner, M., Campisi, J., Amiri, L. & Diamond, D. M. 2004. Cat exposure induces both intra- and extracellular Hsp72: the role of adrenal hormones. Psychoneuroendocrinology 29 (9), 1142-1152.
Freidenreich, D. J. & Volek, J. S. 2012. Immune responses to resistance exercise. Exercise immunology review 18, 8-41.
Fulda, S., Gorman, A. M., Hori, O. & Samali, A. 2010. Cellular stress responses: cell survival and cell death. International journal of cell biology 2010, 214074.
Gabriel, H. & Kindermann, W. 1997. The acute immune response to exercise: what does it mean? International Journal of Sports Medicine 18 Suppl 1, S28-45.
Gidlow, D. A., Church, J. F. & Clayton, B. E. 1983. Haematological and biochemical parameters in an industrial workforce. Annals of Clinical Biochemistry 20 (Pt 6) (Pt 6), 341-348.
Gimenez, M., Mohan-Kumar, T., Humbert, J. C., De Talance, N. & Buisine, J. 1986. Leukocyte, lymphocyte and platelet response to dynamic exercise. Duration or intensity effect? European journal of applied physiology and occupational physiology 55 (5), 465-470.
Gordon, S. & Taylor, P. R. 2005. Monocyte and macrophage heterogeneity. Nature reviews.Immunology 5 (12), 953-964.
Haskell, W. L., Lee, I. M., Pate, R. R., Powell, K. E., Blair, S. N., Franklin, B. A., Macera, C. A., Heath, G. W., Thompson, P. D. & Bauman, A. 2007. Physical activity and public health: updated recommendation for adults from the American College of Sports Medicine and the American Heart Association. Medicine and science in sports and exercise 39 (8), 1423-1434.
Hawkins, M. N., Raven, P. B., Snell, P. G., Stray-Gundersen, J. & Levine, B. D. 2007. Maximal oxygen uptake as a parametric measure of cardiorespiratory capacity. Medicine and science in sports and exercise 39 (1), 103-107.
Hill, E. E., Zack, E., Battaglini, C., Viru, M., Viru, A. & Hackney, A. C. 2008. Exercise and circulating cortisol levels: the intensity threshold effect. Journal of endocrinological investigation 31 (7), 587-591.

65
Hoffman-Goetz, L. & Pedersen, B. K. 1994. Exercise and the immune system: a model of the stress response? Immunology today 15 (8), 382-387.
Horn, P. L., Pyne, D. B., Hopkins, W. G. & Barnes, C. J. 2010. Lower white blood cell counts in elite athletes training for highly aerobic sports. European journal of applied physiology 110 (5), 925-932.
Hulmi, J. J., Myllymaki, T., Tenhumaki, M., Mutanen, N., Puurtinen, R., Paulsen, G. & Mero, A. A. 2010. Effects of resistance exercise and protein ingestion on blood leukocytes and platelets in young and older men. European journal of applied physiology 109 (2), 343-353.
Ike, S. O., Nubila, T., Ukaejiofo, E. O., Nubila, I. N., Shu, E. N. & Ezema, I. 2010. Comparison of haematological parameters determined by the Sysmex KX - 2IN automated haematology analyzer and the manual counts. BMC clinical pathology 10, 3-6890-10-3.
Iwasaki, A. & Medzhitov, R. 2010. Regulation of adaptive immunity by the innate immune system. Science (New York, N.Y.) 327 (5963), 291-295.
Janeway, C. A.,Jr & Medzhitov, R. 2002. Innate immune recognition. Annual Review of Immunology 20, 197-216.
Kampinga, H. H., Hageman, J., Vos, M. J., Kubota, H., Tanguay, R. M., Bruford, E. A., Cheetham, M. E., Chen, B. & Hightower, L. E. 2009. Guidelines for the nomenclature of the human heat shock proteins. Cell stress & chaperones 14 (1), 105-111.
Khassaf, M., McArdle, A., Esanu, C., Vasilaki, A., McArdle, F., Griffiths, R. D., Brodie, D. A. & Jackson, M. J. 2003. Effect of vitamin C supplements on antioxidant defence and stress proteins in human lymphocytes and skeletal muscle. The Journal of physiology 549 (Pt 2), 645-652.
Kiang, J. G. & Tsokos, G. C. 1998. Heat shock protein 70 kDa: molecular biology, biochemistry, and physiology. Pharmacology & therapeutics 80 (2), 183-201.
Kim, D. J., Noh, J. H., Lee, B. W., Choi, Y. H., Jung, J. H., Min, Y. K., Lee, M. S., Lee, M. K. & Kim, K. W. 2005. A white blood cell count in the normal concentration range is independently related to cardiorespiratory fitness in apparently healthy Korean men. Metabolism: clinical and experimental 54 (11), 1448-1452.
Kindermann, W., Schnabel, A., Schmitt, W. M., Biro, G., Cassens, J. & Weber, F. 1982. Catecholamines, growth hormone, cortisol, insulin, and sex hormones in anaerobic and aerobic exercise. European journal of applied physiology and occupational physiology 49 (3), 389-399.
Kraemer, W. J., Clemson, A., Triplett, N. T., Bush, J. A., Newton, R. U. & Lynch, J. M. 1996. The effects of plasma cortisol elevation on total and differential leukocyte counts in response to heavy-resistance exercise. European journal of applied physiology and occupational physiology 73 (1-2), 93-97.
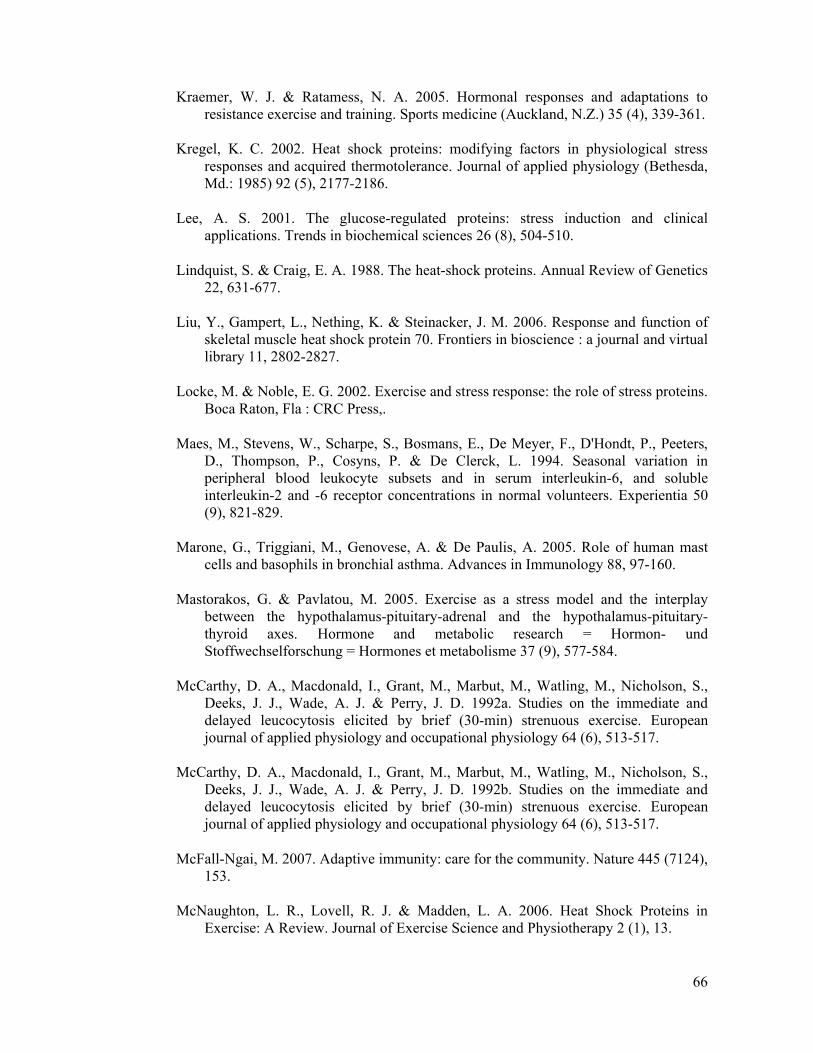
66
Kraemer, W. J. & Ratamess, N. A. 2005. Hormonal responses and adaptations to resistance exercise and training. Sports medicine (Auckland, N.Z.) 35 (4), 339-361.
Kregel, K. C. 2002. Heat shock proteins: modifying factors in physiological stress responses and acquired thermotolerance. Journal of applied physiology (Bethesda, Md.: 1985) 92 (5), 2177-2186.
Lee, A. S. 2001. The glucose-regulated proteins: stress induction and clinical applications. Trends in biochemical sciences 26 (8), 504-510.
Lindquist, S. & Craig, E. A. 1988. The heat-shock proteins. Annual Review of Genetics 22, 631-677.
Liu, Y., Gampert, L., Nething, K. & Steinacker, J. M. 2006. Response and function of skeletal muscle heat shock protein 70. Frontiers in bioscience : a journal and virtual library 11, 2802-2827.
Locke, M. & Noble, E. G. 2002. Exercise and stress response: the role of stress proteins. Boca Raton, Fla : CRC Press,.
Maes, M., Stevens, W., Scharpe, S., Bosmans, E., De Meyer, F., D'Hondt, P., Peeters, D., Thompson, P., Cosyns, P. & De Clerck, L. 1994. Seasonal variation in peripheral blood leukocyte subsets and in serum interleukin-6, and soluble interleukin-2 and -6 receptor concentrations in normal volunteers. Experientia 50 (9), 821-829.
Marone, G., Triggiani, M., Genovese, A. & De Paulis, A. 2005. Role of human mast cells and basophils in bronchial asthma. Advances in Immunology 88, 97-160.
Mastorakos, G. & Pavlatou, M. 2005. Exercise as a stress model and the interplay between the hypothalamus-pituitary-adrenal and the hypothalamus-pituitary-thyroid axes. Hormone and metabolic research = Hormon- und Stoffwechselforschung = Hormones et metabolisme 37 (9), 577-584.
McCarthy, D. A., Macdonald, I., Grant, M., Marbut, M., Watling, M., Nicholson, S., Deeks, J. J., Wade, A. J. & Perry, J. D. 1992a. Studies on the immediate and delayed leucocytosis elicited by brief (30-min) strenuous exercise. European journal of applied physiology and occupational physiology 64 (6), 513-517.
McCarthy, D. A., Macdonald, I., Grant, M., Marbut, M., Watling, M., Nicholson, S., Deeks, J. J., Wade, A. J. & Perry, J. D. 1992b. Studies on the immediate and delayed leucocytosis elicited by brief (30-min) strenuous exercise. European journal of applied physiology and occupational physiology 64 (6), 513-517.
McFall-Ngai, M. 2007. Adaptive immunity: care for the community. Nature 445 (7124), 153.
McNaughton, L. R., Lovell, R. J. & Madden, L. A. 2006. Heat Shock Proteins in Exercise: A Review. Journal of Exercise Science and Physiotherapy 2 (1), 13.

67
Meckel, Y., Eliakim, A., Seraev, M., Zaldivar, F., Cooper, D. M., Sagiv, M. & Nemet, D. 2009. The effect of a brief sprint interval exercise on growth factors and inflammatory mediators. Journal of strength and conditioning research / National Strength & Conditioning Association 23 (1), 225-230.
Metrikat, J., Albrecht, M., Maya-Pelzer, P. & Ortlepp, J. R. 2009. Physical fitness is associated with lower inflammation, even in individuals with high cholesterol – An alternative to statin therapy? CVD Prevention and Control 4 (3), 149-156.
Michishita, R., Shono, N., Inoue, T., Tsuruta, T. & Node, K. 2010. Effect of exercise therapy on monocyte and neutrophil counts in overweight women. The American Journal of the Medical Sciences 339 (2), 152-156.
Michishita, R., Shono, N., Inoue, T., Tsuruta, T. & Node, K. 2008. Associations of monocytes, neutrophil count, and C-reactive protein with maximal oxygen uptake in overweight women. Journal of cardiology 52 (3), 247-253.
Monteseirin, J. 2009. Neutrophils and asthma. Journal of investigational allergology & clinical immunology 19 (5), 340-354.
Morimoto, R. I. 1998. Regulation of the heat shock transcriptional response: cross talk between a family of heat shock factors, molecular chaperones, and negative regulators. Genes & development 12 (24), 3788-3796.
Morton, J. P., Kayani, A. C., McArdle, A. & Drust, B. 2009. The exercise-induced stress response of skeletal muscle, with specific emphasis on humans. Sports medicine (Auckland, N.Z.) 39 (8), 643-662.
Moseley, P. 2000. Stress proteins and the immune response. Immunopharmacology 48 (3), 299-302.
Mosser, D. M. & Edwards, J. P. 2008. Exploring the full spectrum of macrophage activation. Nature reviews.Immunology 8 (12), 958-969.
Moyna, N. M., Acker, G. R., Weber, K. M., Fulton, J. R., Goss, F. L., Robertson, R. J. & Rabin, B. S. 1996. The effects of incremental submaximal exercise on circulating leukocytes in physically active and sedentary males and females. European journal of applied physiology and occupational physiology 74 (3), 211-218.
Mueller, M. J. & Maluf, K. S. 2002. Tissue adaptation to physical stress: a proposed "Physical Stress Theory" to guide physical therapist practice, education, and research. Physical Therapy 82 (4), 383-403.
Neto, J. C., Lira, F. S., de Mello, M. T. & Santos, R. V. 2011. Importance of exercise immunology in health promotion. Amino acids 41 (5), 1165-1172.
Nieman, D. C. 2012. Clinical implications of exercise immunology. Journal of Sport and Health Science 1 (1), 12-17.
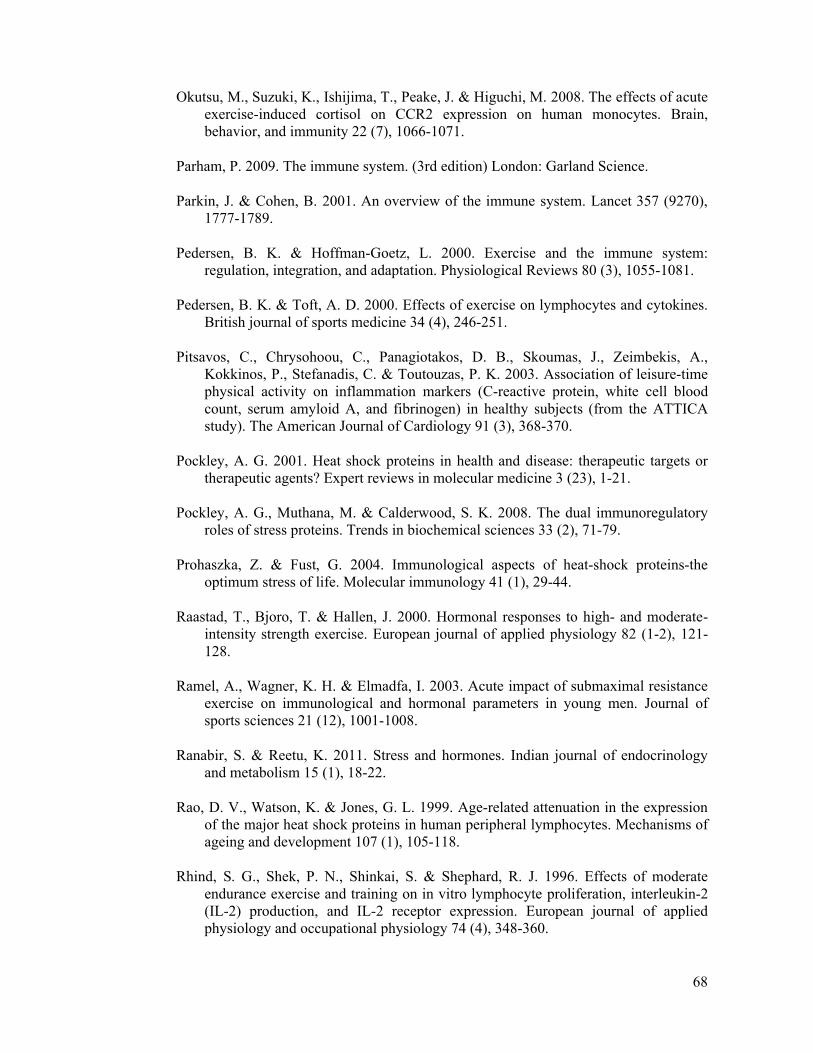
68
Okutsu, M., Suzuki, K., Ishijima, T., Peake, J. & Higuchi, M. 2008. The effects of acute exercise-induced cortisol on CCR2 expression on human monocytes. Brain, behavior, and immunity 22 (7), 1066-1071.
Parham, P. 2009. The immune system. (3rd edition) London: Garland Science.
Parkin, J. & Cohen, B. 2001. An overview of the immune system. Lancet 357 (9270), 1777-1789.
Pedersen, B. K. & Hoffman-Goetz, L. 2000. Exercise and the immune system: regulation, integration, and adaptation. Physiological Reviews 80 (3), 1055-1081.
Pedersen, B. K. & Toft, A. D. 2000. Effects of exercise on lymphocytes and cytokines. British journal of sports medicine 34 (4), 246-251.
Pitsavos, C., Chrysohoou, C., Panagiotakos, D. B., Skoumas, J., Zeimbekis, A., Kokkinos, P., Stefanadis, C. & Toutouzas, P. K. 2003. Association of leisure-time physical activity on inflammation markers (C-reactive protein, white cell blood count, serum amyloid A, and fibrinogen) in healthy subjects (from the ATTICA study). The American Journal of Cardiology 91 (3), 368-370.
Pockley, A. G. 2001. Heat shock proteins in health and disease: therapeutic targets or therapeutic agents? Expert reviews in molecular medicine 3 (23), 1-21.
Pockley, A. G., Muthana, M. & Calderwood, S. K. 2008. The dual immunoregulatory roles of stress proteins. Trends in biochemical sciences 33 (2), 71-79.
Prohaszka, Z. & Fust, G. 2004. Immunological aspects of heat-shock proteins-the optimum stress of life. Molecular immunology 41 (1), 29-44.
Raastad, T., Bjoro, T. & Hallen, J. 2000. Hormonal responses to high- and moderate-intensity strength exercise. European journal of applied physiology 82 (1-2), 121-128.
Ramel, A., Wagner, K. H. & Elmadfa, I. 2003. Acute impact of submaximal resistance exercise on immunological and hormonal parameters in young men. Journal of sports sciences 21 (12), 1001-1008.
Ranabir, S. & Reetu, K. 2011. Stress and hormones. Indian journal of endocrinology and metabolism 15 (1), 18-22.
Rao, D. V., Watson, K. & Jones, G. L. 1999. Age-related attenuation in the expression of the major heat shock proteins in human peripheral lymphocytes. Mechanisms of ageing and development 107 (1), 105-118.
Rhind, S. G., Shek, P. N., Shinkai, S. & Shephard, R. J. 1996. Effects of moderate endurance exercise and training on in vitro lymphocyte proliferation, interleukin-2 (IL-2) production, and IL-2 receptor expression. European journal of applied physiology and occupational physiology 74 (4), 348-360.
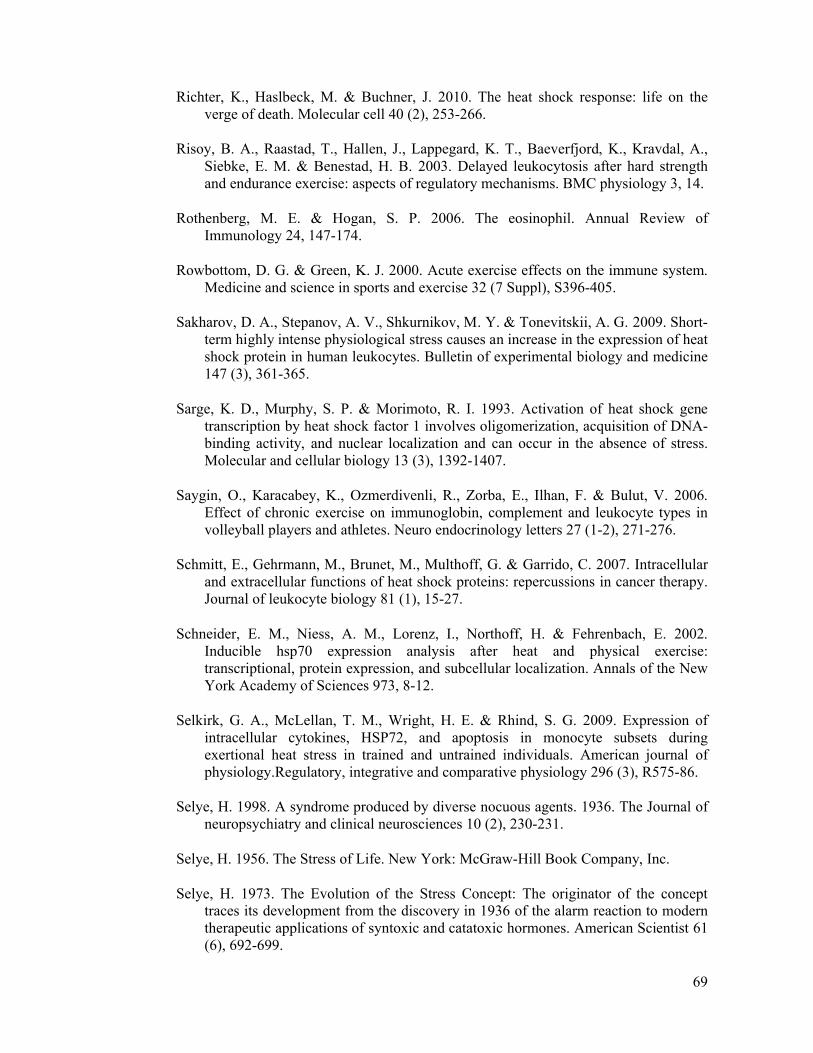
69
Richter, K., Haslbeck, M. & Buchner, J. 2010. The heat shock response: life on the verge of death. Molecular cell 40 (2), 253-266.
Risoy, B. A., Raastad, T., Hallen, J., Lappegard, K. T., Baeverfjord, K., Kravdal, A., Siebke, E. M. & Benestad, H. B. 2003. Delayed leukocytosis after hard strength and endurance exercise: aspects of regulatory mechanisms. BMC physiology 3, 14.
Rothenberg, M. E. & Hogan, S. P. 2006. The eosinophil. Annual Review of Immunology 24, 147-174.
Rowbottom, D. G. & Green, K. J. 2000. Acute exercise effects on the immune system.Medicine and science in sports and exercise 32 (7 Suppl), S396-405.
Sakharov, D. A., Stepanov, A. V., Shkurnikov, M. Y. & Tonevitskii, A. G. 2009. Short-term highly intense physiological stress causes an increase in the expression of heat shock protein in human leukocytes. Bulletin of experimental biology and medicine 147 (3), 361-365.
Sarge, K. D., Murphy, S. P. & Morimoto, R. I. 1993. Activation of heat shock gene transcription by heat shock factor 1 involves oligomerization, acquisition of DNA-binding activity, and nuclear localization and can occur in the absence of stress. Molecular and cellular biology 13 (3), 1392-1407.
Saygin, O., Karacabey, K., Ozmerdivenli, R., Zorba, E., Ilhan, F. & Bulut, V. 2006. Effect of chronic exercise on immunoglobin, complement and leukocyte types in volleyball players and athletes. Neuro endocrinology letters 27 (1-2), 271-276.
Schmitt, E., Gehrmann, M., Brunet, M., Multhoff, G. & Garrido, C. 2007. Intracellular and extracellular functions of heat shock proteins: repercussions in cancer therapy. Journal of leukocyte biology 81 (1), 15-27.
Schneider, E. M., Niess, A. M., Lorenz, I., Northoff, H. & Fehrenbach, E. 2002. Inducible hsp70 expression analysis after heat and physical exercise: transcriptional, protein expression, and subcellular localization. Annals of the New York Academy of Sciences 973, 8-12.
Selkirk, G. A., McLellan, T. M., Wright, H. E. & Rhind, S. G. 2009. Expression of intracellular cytokines, HSP72, and apoptosis in monocyte subsets during exertional heat stress in trained and untrained individuals. American journal of physiology.Regulatory, integrative and comparative physiology 296 (3), R575-86.
Selye, H. 1998. A syndrome produced by diverse nocuous agents. 1936. The Journal of neuropsychiatry and clinical neurosciences 10 (2), 230-231.
Selye, H. 1956. The Stress of Life. New York: McGraw-Hill Book Company, Inc.
Selye, H. 1973. The Evolution of the Stress Concept: The originator of the concept traces its development from the discovery in 1936 of the alarm reaction to modern therapeutic applications of syntoxic and catatoxic hormones. American Scientist 61 (6), 692-699.
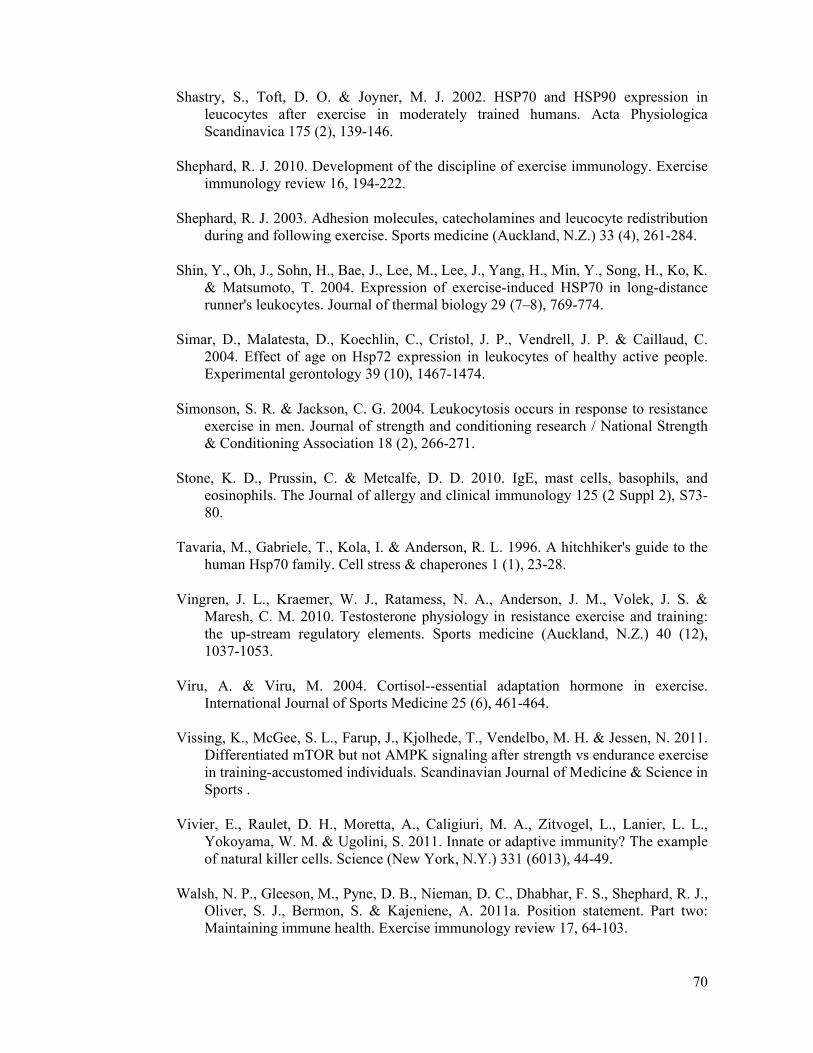
70
Shastry, S., Toft, D. O. & Joyner, M. J. 2002. HSP70 and HSP90 expression in leucocytes after exercise in moderately trained humans. Acta Physiologica Scandinavica 175 (2), 139-146.
Shephard, R. J. 2010. Development of the discipline of exercise immunology. Exercise immunology review 16, 194-222.
Shephard, R. J. 2003. Adhesion molecules, catecholamines and leucocyte redistribution during and following exercise. Sports medicine (Auckland, N.Z.) 33 (4), 261-284.
Shin, Y., Oh, J., Sohn, H., Bae, J., Lee, M., Lee, J., Yang, H., Min, Y., Song, H., Ko, K. & Matsumoto, T. 2004. Expression of exercise-induced HSP70 in long-distance runner's leukocytes. Journal of thermal biology 29 (7–8), 769-774.
Simar, D., Malatesta, D., Koechlin, C., Cristol, J. P., Vendrell, J. P. & Caillaud, C. 2004. Effect of age on Hsp72 expression in leukocytes of healthy active people. Experimental gerontology 39 (10), 1467-1474.
Simonson, S. R. & Jackson, C. G. 2004. Leukocytosis occurs in response to resistance exercise in men. Journal of strength and conditioning research / National Strength & Conditioning Association 18 (2), 266-271.
Stone, K. D., Prussin, C. & Metcalfe, D. D. 2010. IgE, mast cells, basophils, and eosinophils. The Journal of allergy and clinical immunology 125 (2 Suppl 2), S73-80.
Tavaria, M., Gabriele, T., Kola, I. & Anderson, R. L. 1996. A hitchhiker's guide to the human Hsp70 family. Cell stress & chaperones 1 (1), 23-28.
Vingren, J. L., Kraemer, W. J., Ratamess, N. A., Anderson, J. M., Volek, J. S. & Maresh, C. M. 2010. Testosterone physiology in resistance exercise and training: the up-stream regulatory elements. Sports medicine (Auckland, N.Z.) 40 (12), 1037-1053.
Viru, A. & Viru, M. 2004. Cortisol--essential adaptation hormone in exercise. International Journal of Sports Medicine 25 (6), 461-464.
Vissing, K., McGee, S. L., Farup, J., Kjolhede, T., Vendelbo, M. H. & Jessen, N. 2011. Differentiated mTOR but not AMPK signaling after strength vs endurance exercise in training-accustomed individuals. Scandinavian Journal of Medicine & Science in Sports .
Vivier, E., Raulet, D. H., Moretta, A., Caligiuri, M. A., Zitvogel, L., Lanier, L. L., Yokoyama, W. M. & Ugolini, S. 2011. Innate or adaptive immunity? The example of natural killer cells. Science (New York, N.Y.) 331 (6013), 44-49.
Walsh, N. P., Gleeson, M., Pyne, D. B., Nieman, D. C., Dhabhar, F. S., Shephard, R. J., Oliver, S. J., Bermon, S. & Kajeniene, A. 2011a. Position statement. Part two: Maintaining immune health. Exercise immunology review 17, 64-103.
71
Walsh, N. P., Gleeson, M., Shephard, R. J., Gleeson, M., Woods, J. A., Bishop, N. C., Fleshner, M., Green, C., Pedersen, B. K., Hoffman-Goetz, L., Rogers, C. J., Northoff, H., Abbasi, A. & Simon, P. 2011b. Position statement. Part one: Immune function and exercise. Exercise immunology review 17, 6-63.
Whitley, D., Goldberg, S. P. & Jordan, W. D. 1999. Heat shock proteins: a review of the molecular chaperones. Journal of vascular surgery 29 (4), 748-751.
Wideman, L., Weltman, J. Y., Hartman, M. L., Veldhuis, J. D. & Weltman, A. 2002. Growth hormone release during acute and chronic aerobic and resistance exercise: recent findings. Sports medicine (Auckland, N.Z.) 32 (15), 987-1004.
Witko-Sarsat, V., Rieu, P., Descamps-Latscha, B., Lesavre, P. & Halbwachs-Mecarelli, L. 2000. Neutrophils: molecules, functions and pathophysiological aspects. Laboratory investigation; a journal of technical methods and pathology 80 (5), 617-653.
Wood, P. 2006. Understanding immunology. (2nd edition) Harlow ; New York: Pearson Prentice Hall.
Yamada, P., Amorim, F., Moseley, P. & Schneider, S. 2008. Heat shock protein 72 response to exercise in humans. Sports medicine (Auckland, N.Z.) 38 (9), 715-733.
Zouhal, H., Jacob, C., Delamarche, P. & Gratas-Delamarche, A. 2008. Catecholamines and the effects of exercise, training and gender. Sports medicine (Auckland, N.Z.) 38 (5), 401-423.
Zouhal, H., Lemoine-Morel, S., Mathieu, M. E., Casazza, G. A. & Jabbour, G. 2013. Catecholamines and obesity: effects of exercise and training. Sports medicine (Auckland, N.Z.) 43 (7), 591-600.