Actuarial Valuation Reports - Texas · 2020-02-19 · Purpose of Actuarial Valuation • Snapshot...
211
As of August 31, 2019 Prepared by Gabriel Roeder Smith & Company Actuarial Valuation Reports Funding f or Pension Plans Administered by ERS
Transcript of Actuarial Valuation Reports - Texas · 2020-02-19 · Purpose of Actuarial Valuation • Snapshot...

As of August 31, 2019 Prepared by Gabriel Roeder Smith & Company
Actuarial Valuation ReportsFunding for Pension Plans Administered by ERS

Copyright © 2019 GRS – All rights reserved.
Actuarial Valuations of the ERS Retirement
Funds as of August 31, 2019
Ryan Falls, FSA, EA, MAAA
Joe Newton, FSA, EA, MAAA
Tom Bevins, ASA, MAAA
December 10, 2019

Agenda
• Impact of Asset Returns• Actuarially Determined Funding• ERS Funding Valuation Results• LECOSRF and JRS2 Funding Valuation Results• Accounting Results at August 31, 2019
2

Purpose of Actuarial Valuation
• Snapshot as of August 31, 2019 using member data, financial data, benefit and contribution provisions, actuarial assumptions and methods as of that date
• Purposes:– Measure the actuarial liabilities and funding levels– Determine adequacy of current statutory contributions– Provide other information for reporting
GASB 67/68, Comprehensive Annual Financial Report– Explain changes in actuarial condition of the plans– Track changes over time– Analyze future outlook
3

Where are we headed now?• Outlook is similar to last year as all three trust funds are
projected to run out of money and the funds would not be able to pay earned benefits to current members during retirement – ERS trust is projected to run out of money in ≈ 50 years– LECOSRF trust is projected to run out of money in ≈ 25 years– JRS2 trust is projected to run out of money in ≈ 50 years
• Changes are required to limit risks to benefit security• Legislature missed opportunities to make necessary changes
– Delay makes adjustments more costly
4

5
Impact of Asset Returns

Asset Experience• Actual rate of return on market was ≈ 3.0%• Actuarial metrics primarily based on smoothed value of
assets (actuarial value, or AVA), not market value• Actuarial value only reflects a portion of the actual market
returns over the past five years– Recognize 20% of the unexpected asset gain/loss each year
• 5 year smoothed return on AVA was 6.9% in FY 2019• $709 million in net deferred losses, not yet recognized
– $393 million deferred gain from last year fully recognized– Will be recognized over next four years
6

Estimated Historical Yields Based on Market Value of Assets
7
1 year 5 years 10 years 15 years 20 years 30 years*Market 3.0% 6.0% 8.1% 6.8% 5.8% 7.8%
0%1%2%3%4%5%6%7%8%9%
7.50%
* The 30-year return is provided as a gross return due to data limitations.

Assumptions vs Funding
• If the investment experience had met the current assumptions over the last 20 years, ERS would effectively be fully funded– Actual returns have not been available in the market to meet the
assumption• The assumption is supposed to be a starting point, useful for
decision making• For the successful program, contributions have to adapt as
experience unfolds to make up shortfall• While historical investment returns have been a significant source
of the solvency issues facing ERS today, the actual cause is a funding strategy that has not reacted appropriately
8

9
Actuarially Determined Funding

Plan Funding – Fixed Rate• Pensions plans in Texas (including ERS) have traditionally been funded via
a negotiated fixed contribution rate• This rate can only change again in the future via another budget
negotiation– For ERS, that can only occur every 2 years– With this setup, it is up to the membership and the retirement system to
initiate the negotiation, with the status quo being an insufficient contribution amount
• With all current stakeholders wanting to maintain their current provisions, negotiations usually end up with inappropriate funding targets
• While the other systems in the State must now maintain a 40 year funding period, the legislature does not have that requirement for ERS and TRS
10

Actual vs. Actuarial Contributions* (ERS)(% of Payroll, by Fiscal Year)
11
*Actuarially Sound Contribution defined as normal cost plus 31-year amortization of unfunded

Peer Comparison
40%50%60%70%80%90%
100%110%
1999 2002 2005 2008 2011 2014 2017
Fund
ed R
atio
ERS Peer System
Both Systems actually earned approximately 6.5%
ERS has had net benefit cuts throughout the period, along with increases in the member rate
The peer system has had a net increase in benefits during the period
12
Both Systems assumed 8% prospectively

40%50%60%70%80%90%
100%110%
1999 2002 2005 2008 2011 2014 2017
Fund
ed R
atio
ERS Peer System
Both Systems actually earned approximately 6.5%
ERS has had net benefit cuts throughout the period, along with increases in the member rate
The peer system has had a net increase in benefits during the period
Peer Comparison
13
Both Systems assumed 8% prospectively
ERS' funding mechanism hasnot reacted as changeswere needed
The peer system has a20 year actuariallydetermined funding strategy

Funding Policies for Fixed-Rate Pension PlansIssued by the Texas Pension Review Board in 2019
14
Public Pension Plans in Texas
Fixed Rate plans have lagged significantly behind Actuarially Funded Plans

Plan Funding – Actuarially Determined
• Conversely, a funding policy that is actuarially determined will have a pre-defined formula that will calculate the contributions
• Does not necessarily have to change each year, but change has to occur when change is needed– Can be revenue and/or liabilities
• Successful programs generally have the formulas set by the Board, with consultation from their actuary
• The plan sponsor has no discretion– If the plan sponsor believes relief is needed, the burden is on the plan
sponsor to initiate the negotiation, with the status quo being an appropriate contribution amount
15

Plan Funding – Actuarially Determined
• Many effective strategies are available to providing benefit security and support the funded status
• However, some strategies can provide substantial contribution rate volatility
• There are some rate stabilization techniques being utilized in the industry to provide relief, but they all force change when change is needed– Examples include the funding corridors in the City of Houston
policies from the 2017 legislative session or floating approaches utilized by the States of Utah and South Carolina
16

Takeaway
• The more short term the decision making, meaning the more the decision impacts the decision maker, the worse the decisions are and the less sustainable the program
• There needs to be a pre-defined policy for automatic adjustments as experience unfolds– Can either be contributions or liabilities, but must occur
automatically and without discretion• Doing nothing cannot be an option
17

18
ERS
Funding Valuation Results
at August 31, 2019

Funded Status (ERS)($ in millions)
19
AVA MVA
Actuarial Accrued Liability $39,801 $39,801AVA / MVA 28,060 27,351Unfunded Accrued Liability $11,741 $12,450Funded Ratio 70.5% 68.7%Funding Period Never Never
AVA MVA
Actuarial Accrued Liability $38,989 $38,989AVA / MVA 27,360 27,753Unfunded Accrued Liability $11,629 $11,236Funded Ratio 70.2% 71.2%Funding Period Never Never
Actuarial Valuation as of August 31, 2018
Actuarial Valuation as of August 31, 2019

Funding Guidelines
• Board approved the Pension Funding Priorities and Guidelines on May 23, 2018
• Policy laid out a multi-level funding period goal to gradually achieve funding on sound actuarial principles1. Avoid trust fund depletion,2. Meet current statutory standard of a 31-year funding period, and3. Match funding period to the average years of service at retirement
once a 31-year funding period is achieved, and closed.• With projected depletion date in 56 years, none of the Board’s
funding period goals are being met
20

Actuarially Sound Contribution (ERS)
21
9.50%
0.00% 0.00%
9.50%
0.00% 0.00%
0.50%
0.00% 0.00%
13.76% 13.76%
9.50%12.61%
0%
4%
8%
12%
16%
20%
24%
28%
FY 2020 Actual19.50%
FY 2020 ASC23.26%
FY 2020 Decrease UAAL26.37%
Employee State Employer Normal Cost 31-Yr Payment to UAAL Decrease UAAL
Shortfall3.76%

22
Funded Ratio Projections (ERS)
Projections assume no changes to current assumptions and except actual asset returns, as noted, all other assumptions are met and future contributions continue at current levels.
100% funded in 2054
“Tread water” scenario
Fund depleted in 2075
Fund depleted in 2056 0%
20%
40%
60%
80%
100%
2019 2024 2029 2034 2039 2044 2049 2054 2059 2064 2069
6.5% Return Scenario 7.5% Return Scenario
8.5% Return Scenario 8.0% Return Scenario

23
Funded Ratio Projections (ERS)
Historical Scenario
Projections assume no changes to current assumptions and except actual asset returns, as noted, all other assumptions are met and future contributions continue at current levels.
Fund depleted in 2075
Fund depleted in 2056
Fund depleted in 2046

24
Funded Ratio Projections (ERS)
Probability of Solvency
Projections assume no changes to current assumptions and except actual asset returns, as noted, all other assumptions are met and future contributions continue at current levels.
Stochastic Projections based on 7.5% median return expectation and 11.6% standard deviation
This represents the probability of the trust fund having assets at the beginning of each year

25
LECOSRF and JRS2
Funding Valuation Results
at August 31, 2019

LECOSRF and JRS2 Results
• LECOSRF had a reduction in funded status– Contributions are not sufficient to sustain the plan– Projected depletion date in 24 years
• JRS2 had a reduction in funded status– Judicial pay changes negatively impacted plan– Despite 2% increase in member contribution rate,
contributions are not sufficient to sustain the plan– Projected depletion date in 57 years
26

Funded Status($ in millions)
27
LECOSRF JRS2
Actuarial Accrued Liability $1,483 $535Actuarial Value of Assets 968 468Unfunded Accrued Liability $515 $67Funded Ratio 65.3% 87.5%Funding Period Never Never
LECOSRF JRS2
Actuarial Accrued Liability $1,453 $488Actuarial Value of Assets 953 447Unfunded Accrued Liability $500 $41Funded Ratio 65.6% 91.7%Funding Period Never 69
Actuarial Valuation as of August 31, 2018
Actuarial Valuation as of August 31, 2019

Actuarially Sound Contribution (LECOSRF)
28
0.50%
0 0
0.50%
0 0
0.77%
0 0
2.08% 2.08%
1.83%2.35%
0%
1%
2%
3%
4%
5%
FY 2020 Actual1.77%*
FY 2020 ASC3.91%
FY 2020 Decrease UAAL4.43%
Employee State Court Fees Normal Cost 31-Yr Payment to UAAL Decrease UAAL
Shortfall2.14%
*Court fees received by LECOSRF are projected to be about $17.1 million for FY2020 and beyond, based on actual FY19 amounts. This amount it equivalent to 0.77% of pay for the next 31 years.

Actuarially Sound Contribution (JRS2)
29
9.39%
0
0
15.663%
0
0
23.14% 23.14%
4.70% 5.50%
0%
5%
10%
15%
20%
25%
30%
FY 2020 Actual25.053%
FY 2020 ASC27.84%
FY 2020 Decrease UAAL28.64%
Employee State Normal Cost 31-Yr Payment to UAAL Decrease UAAL
Shortfall2.787%

30
Accounting Results as of
August 31, 2019

Accounting Valuation Results
• ERS adopted GASB 67 for plan year ending August 31, 2014
• GASB 68 measures were included in Texas state reporting starting in fiscal year ending August 31, 2016 – State has elected to utilize one year reporting lag
GASB 67/68 valuation as of August 31, 2018 used for August 31, 2019 reporting
• GASB 73 outlines reporting for JRS131

Determining Discount Rate
• Discount rate used in determining the Total Pension Liability (TPL) is a blend of two rates– Long-term expected rate of return on pension plan investments
(7.50% based on current investment policy) Can be used to discount plan obligations as long as there are
projected assets sufficient to pay projected plan benefits– Yield or index rate for a 20-year, tax-exempt general obligation
municipal bond (2.63% as of August 31, 2019) Used to discount plan obligations after the projected assets have been
extinguished– JRS1 uses municipal bond rate since there are no trust assets
32

Accounting Valuation Results($ in millions)
33
August 31, 2019 ERS LECOSRF JRS2 JRS1Single Discount Rate (SDR) 4.42% 3.29% 5.45% 2.63%Total Pension Liability $57,336 $2,609 $648 $245Plan Fiduciary Net Position 27,351 944 456 0Net Pension Liability (NPL) 29,985 1,665 192 245
August 31, 2018Single Discount Rate (SDR) 5.69% 4.48% 7.50% 3.69%Total Pension Liability $47,944 $2,150 $487 $255Plan Fiduciary Net Position 27,753 967 453 0Net Pension Liability (NPL) 20,191 1,183 34 255
With stronger funding strategy, NPL could immediately drop to:
ERS: $12.4 billionLECOS: $539 millionJRS2: $78 million

34
Summary

Summary
• For ERS, LECOSRF, and JRS-2, current contribution levels are not sufficient to sustain the system– Without an increase of contributions over the
current schedules, or a reduction of benefits, the funded status will continue to decline
35

Summary• Scheduled to review investment return assumption
again before the next actuarial valuation– All current results currently based on 7.50% investment
return assumption– Return expectations for peer systems and from investment
professionals have continued to decline since the last ERS review in the summer of 2017
– Current general guidance is that 2020 capital market expectations from investment professionals will be the lowest yet
36

Disclaimers
• This presentation is intended to be used in conjunction with the actuarial valuation reports issued in December 2019. This presentation should not be relied on for any purpose other than the purpose described in the valuation reports.
• This presentation shall not be construed to provide tax advice, legal advice or investment advice.
37

Employees Retirement System of Texas Annual Actuarial Valuation - Funding As of August 31, 2019

December 4, 2019
Board of Trustees Employees Retirement System of Texas 200 East 18th Street Austin, TX 78701 Re: Actuarial Valuation for Funding Purposes as of August 31, 2019
Members of the Board:
We certify that the information contained in this report is accurate and fairly presents the actuarial position of the Employees Retirement System of Texas (ERS) as of August 31, 2019. This report was prepared at the request of the Board and is intended for use by ERS staff and those designated or approved by the Board. This report may be provided to parties other than ERS only in its entirety and only with the permission of the Board.
Actuarial Valuation
The primary purposes of the actuarial valuation report are to determine the adequacy of the current State and employer contribution rates, describe the current financial condition of ERS, analyze changes in the condition of ERS, and provide various summaries of the data.
The current financial outlook for ERS is very poor. It is important to understand that the currently scheduled contributions are not expected to accumulate sufficient assets in order to pay all of the currently scheduled benefits when due. Based on current expectations and assumptions, ERS is projected to remain solvent until the year 2075. However, based on volatility in the financial markets, there is a strong possibility that ERS will become insolvent in a 30 to 40 year timeframe which is within the current generation of members. Contributions must materially increase in the next legislative session to secure the benefits for current members.
Plan Provisions
Our actuarial valuation as of August 31, 2019 reflects the benefit and contribution provisions set forth in Chapters 811 through 815 of the Texas Government Code. The current plan provisions are outlined in Section E of this report.
Actuarial Assumptions and Methods
The assumptions and methods applied in this actuarial valuation were adopted by the Board of Trustees on August 23, 2017 based on the experience investigation that covered the five-year period from September 1, 2011 through August 31, 2016. Additionally, this actuarial valuation incorporates the notable

Board of Trustees December 4, 2019 Page 2
across-the-board pay increases budgeted by the State Legislature when they are granted for the current biennium. The current actuarial assumptions and methods are outlined in Section F of this report.
Data
The valuation was based upon information as of August 31, 2019, furnished by ERS staff, concerning system benefits, financial transactions, plan provisions and active members, terminated members, retirees and beneficiaries. We checked for internal and year-to-year consistency, but did not audit the data. We are not responsible for the accuracy or completeness of the information provided by ERS staff.
Certification
All of our work conforms with generally accepted actuarial principles and practices, and to the Actuarial Standards of Practice issued by the Actuarial Standards Board. In our opinion, our calculations also comply with the requirements of, where applicable, the Internal Revenue Code and ERISA.
The signing actuaries are independent of the plan sponsor. Mr. Falls, Mr. Newton and Ms. Woolfrey are Enrolled Actuaries and Fellows of the Society of Actuaries, and all of the undersigned are Members of the American Academy of Actuaries, and meet the Qualification Standards of the American Academy of Actuaries. Finally, each of the undersigned are experienced in performing valuations for large public retirement systems.
Respectfully submitted,
Gabriel, Roeder, Smith & Company
R. Ryan Falls, FSA, EA, MAAA Joseph P. Newton, FSA, EA, MAAA
Senior Consultant & Actuary Pension Market Leader & Actuary
Dana Woolfrey, FSA, EA, MAAA Thomas J. Bevins, ASA, MAAA
Consultant & Actuary Actuary

Employees Retirement System of Texas
Table of Contents
Section
Cover Letter
Section A Executive Summary
Section B Discussion
Section C Tables
1 - Development of Employer Cost
2 - Actuarial Present Value of Future Benefits
3 - Analysis of Normal Cost
4 - Historical Summary of Active Member Data
5 - Reconciliation of Plan Net Assets
6 - Development of Actuarial Value of Assets
7 - History of Investment Return Rates
8 - History of Cash Flow
9 - Total Experience Gain or Loss
10 - Solvency Test
11 - Historical Contribution Rates
Section D Risks Associated with Measuring the Accrued Liability and Actuarially Determined Contribution
Section E Summary of Plan Provisions
Section F Summary of Actuarial Assumptions and Methods
Section G Detailed Summaries of Membership Data
Section H Glossary
Section I Law Enforcement and Custodial Officer (LECO) Plan Accounting

SECTION A
EXECUTIVE SUMMARY

Employees Retirement System of Texas A - 1
Executive Summary
2019 2018
Membership
• Number of
- Active members 141,865 141,535
- Retirees and beneficiaries 115,155 111,361
- Inactive, vested 15,425 15,842
- Inactive, nonvested 110,510 103,894
- Total 382,955 372,632
• Valuation Payroll 6,984,576,697$ 6,875,886,920$
Statutory contribution rates FY 2020 FY 2019
• Members 9.50% 9.50%
• Employers 0.50% 0.50%
• State 9.50% 9.50%
• Total 19.50% 19.50%
Actuarially Sound Rate (funds normal cost
and amortizes unfunded accrued liability
over 31 years, per Section 811.006 of the
Texas Government Code)
• Current valuation date 23.26% 23.12%
• Projected for 2022-23 Biennium 23.97% 22.97%
Assets
• Market value (MVA) 27,351,224,157$ 27,753,334,784$
• Actuarial value (AVA) 28,060,120,223$ 27,359,943,116$
• Return on market value (gross) 3.04% 9.58%
• Return on market value (net) 3.00% 9.54%
• Return on actuarial value 6.9% 7.9%
Actuarial Information on AVA (smoothed)
• Normal cost % 13.76% 13.86%
• Total normal cost 961,077,754$ 952,997,927$
• Actuarial accrued liability 39,801,358,678$ 38,989,263,562$
• Unfunded actuarial accrued
liability (UAAL) 11,741,238,455$ 11,629,320,446$
• Funded ratio 70.5% 70.2%
• Funding period (years) Never Never
Actuarial Information on MVA
• Unfunded actuarial accrued
liability (UAAL) 12,450,134,521$ 11,235,928,778$
• Funded ratio 68.7% 71.2%
• Funding period (years) Never Never
Item

Employees Retirement System of Texas A - 2
The following chart illustrates the recent history and outlook of the funded status of ERS over the next five years:
August 31, 2015 2016 2017 2018 2019 2020 2021 2022 2023 2024
Funded
Ratio
76.3%
75.2%
70.1%
70.2%
70.5%
69.7%
68.8%
67.9%
67.0%
66.5%
UAAL
(in billions) $8.0 $8.7 $11.3 $11.6 $11.7 $12.4 $13.2 $13.9 $14.7 $15.3
ASC 19.62% 19.88% 23.21% 23.12% 23.26% 23.51% 23.74% 23.97% 24.20% 24.29%
The projections beyond 2019 are based on the same assumptions, methods and provisions used for the August 31, 2019 valuation, which include the notable across-the-board pay increases budgeted by the State Legislature when they are granted. Additionally, the market value of assets is expected to earn 7.5% per year.
It is important to understand that the currently scheduled contributions are not expected to accumulate sufficient assets in order to pay all of the currently scheduled benefits when due. Based on current expectations and assumptions, ERS is projected to have money in the trust fund until the year 2075. After which, the funding would revert to a pay-as-you-go status. When ERS reverts to a pay-as-you-go status, the required Legislative appropriation for ERS will immediately quadruple (i.e., increase by 4 times), and remain at that level, in order to ensure all retirees continue to receive their promised benefit. This time could come even sooner. Based on volatility in the financial markets, there is a 40% probability of assets being depleted by 2060, which is only 40 years away, and a 25% probability of being depleted by 2050, which is only 30 years away. Both of these timeframes are within the current generation of members.
Given this outlook, we recommend the Legislature increase the contribution rates to ERS. Each successive biennium that ERS receives the currently scheduled contribution rates, the unfunded actuarial accrued liability (UAAL) is projected to increase by approximately $1.0 billion and the ASC is projected to increase by approximately 0.20% of payroll resulting strictly from a deficiency in contributions.
50%
55%
60%
65%
70%
75%
80%
85%
90%
95%
100%
2015 2016 2017 2018 2019 2020 2021 2022 2023 2024
Historical and Future Projected Funded Ratios As of August 31

SECTION B
DISCUSSION

Employees Retirement System of Texas B - 1
Discussion
Introduction The results of the August 31, 2019 actuarial valuation of the Employees Retirement System of Texas (ERS) are presented in this report. The primary purposes of this actuarial valuation report are to determine the adequacy of the current State and employer contribution rates, describe the current financial condition of ERS, analyze the changes in the condition of ERS, and provide various summaries of the data. The total contribution rate for the current fiscal year exceeds the normal cost by 5.74% of payroll, which, on both an actuarial and market value of assets basis, is not sufficient to amortize the unfunded liability over a finite period of time. Based on current expectations and assumptions, ERS is expected to remain solvent until the year 2075, after which the funding would revert to a pay-as-you-go status. All of the tables referenced in the following discussion appear in Section C of this report. Plan Provisions House Bill 2384 restructured the compensation and retirement benefits for State judges. This restructuring impacted the compensation used to determine benefits upon retirement for Elected Class members. There were no other changes to the plan provisions during the past year. The current plan provisions are outlined in Section E of this report. Actuarial Assumptions and Methods The assumptions and methods applied in this actuarial valuation were adopted by the Board of Trustees on August 23, 2017 based on the experience investigation that covered the five-year period from September 1, 2011 through August 31, 2016. We believe the assumptions are internally consistent and are reasonable, based on the actual experience of ERS. House Bill 2384 also prompted a change to the long term growth assumption for the State base salary of a district judge from 2.75% to 2.50%. All other assumptions and methods are the same as the prior valuation. The actuarial valuation as of August 31, 2019 incorporates the notable across-the-board pay increases budgeted by the State Legislature when they are granted for the current biennium. Specifically, employees were assumed to receive no across-the-board increase on September 1, 2019 or September 1, 2020. The results of the actuarial valuation are dependent upon the actuarial assumptions used. Actual results can and almost certainly will differ, as actual experience deviates from the assumptions. Even seemingly minor changes in the assumptions can materially change the liabilities, calculated contribution rates and funding periods. A review of the impact of a different set of assumptions on the funded status of ERS is outside the scope of this actuarial valuation. The current actuarial assumptions and methods are outlined in Section F of this report.

Employees Retirement System of Texas B - 2
Funding Adequacy The Board of Trustees of ERS approved the Pension Funding Priorities and Guidelines on May 23, 2018. For the Board, adoption of this policy was intended to:
• enhance communications and provide transparency to the Legislature and plan members and retirees regarding Board of Trustees’ positions on plan funding strategy;
• provide policy guidance to current and future Boards; and • ensure that legislators, elected officials and other stakeholders have clear and accurate
information about the Trust’s funding goals and the needs of the Board in supporting sound fiduciary investment decisions in accordance with Texas Government Code Section 815.106.
This policy also stated that the main objective of ERS’ retirement programs is to fully fund the long-term cost of benefits provided by statute, through disciplined and timely accumulation of contributions and prudent investment of assets to deliver earned benefits on a continuing basis. In support of this objective, the policy laid out a multi-level funding period goal to gradually achieve funding on sound actuarial principles:
1. Avoid trust fund depletion of the pre-funded plans, 2. Meet current statutory standard of a 31-year funding period for unfunded liabilities, per Texas
Government Code Sections 811.006 and 840.106, and 3. Match funding period to the average years of service at retirement once a 31-year funding period is
achieved, and closed. The member contribution rates are established by State statute and the State contribution rate is set by State statute and legislative appropriation. Members contribute 9.50% of payroll, the State is scheduled to contribute 9.50% of payroll through direct appropriations, and state agencies contribute an additional 0.50% of payroll, resulting in total contributions of 19.50% of payroll for the current biennium. The long-term State contribution rates are subject to future legislative appropriations. The unfunded actuarial accrued liability (UAAL) of ERS increased from $11.6 billion as of August 31, 2018 to $11.7 billion as of August 31, 2019. However, the funded ratio of ERS—actuarial value of assets divided by the actuarial accrued liability—increased from 70.2% to 70.5% as of August 31, 2019. This increase in the funded ratio was due to the absence of across-the-board pay increases budgeted by the State Legislature for the current biennium. The funded status is one of many metrics used to show trends and develop future expectations about the health of a retirement system. The funded status measure itself is not appropriate for assessing the sufficiency of plan assets to cover the estimated cost of settling the plan’s benefit obligations or assessing the need for or the amount of future contributions since it does not reflect normal cost contributions, the timing of amortization payments, or future experience other than expected. The valuation shows that the total normal cost for funding purposes is 13.76% of payroll. The total contribution rate is currently 19.50% of payroll. Thus, the total contribution rate for the current fiscal year exceeds the normal cost by 5.74% of payroll which will be available to amortize the unfunded liability. As the number of members eligible for the newest benefit provisions increases over time, the normal cost rate is expected to decrease, and the amount available to amortize the unfunded liability will increase as a percentage of payroll. However, the projected contributions are not expected to be sufficient to eliminate the unfunded liability over a finite period of time. Assuming the market value of assets earns 7.50% per year, ERS is projected to remain solvent until the year 2075, after which the funding would revert to a pay-
Employees Retirement System of Texas B - 3
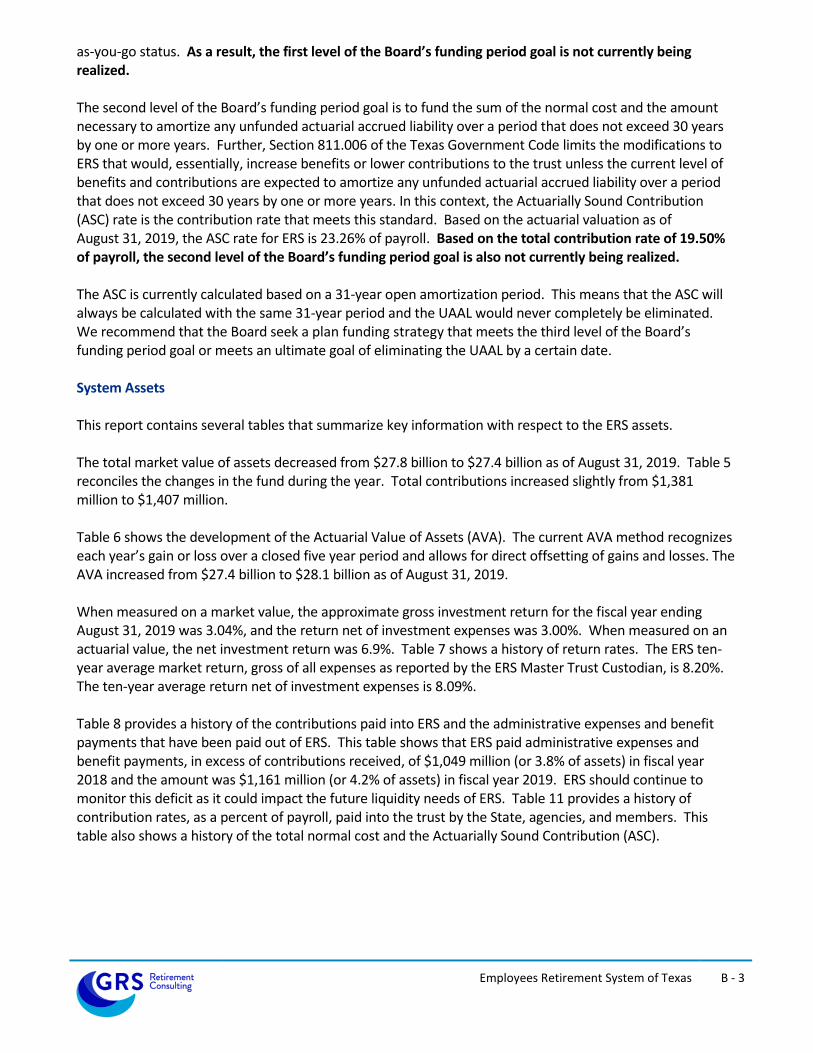
as-you-go status. As a result, the first level of the Board’s funding period goal is not currently being realized. The second level of the Board’s funding period goal is to fund the sum of the normal cost and the amount necessary to amortize any unfunded actuarial accrued liability over a period that does not exceed 30 years by one or more years. Further, Section 811.006 of the Texas Government Code limits the modifications to ERS that would, essentially, increase benefits or lower contributions to the trust unless the current level of benefits and contributions are expected to amortize any unfunded actuarial accrued liability over a period that does not exceed 30 years by one or more years. In this context, the Actuarially Sound Contribution (ASC) rate is the contribution rate that meets this standard. Based on the actuarial valuation as of August 31, 2019, the ASC rate for ERS is 23.26% of payroll. Based on the total contribution rate of 19.50% of payroll, the second level of the Board’s funding period goal is also not currently being realized. The ASC is currently calculated based on a 31-year open amortization period. This means that the ASC will always be calculated with the same 31-year period and the UAAL would never completely be eliminated. We recommend that the Board seek a plan funding strategy that meets the third level of the Board’s funding period goal or meets an ultimate goal of eliminating the UAAL by a certain date. System Assets This report contains several tables that summarize key information with respect to the ERS assets. The total market value of assets decreased from $27.8 billion to $27.4 billion as of August 31, 2019. Table 5 reconciles the changes in the fund during the year. Total contributions increased slightly from $1,381 million to $1,407 million. Table 6 shows the development of the Actuarial Value of Assets (AVA). The current AVA method recognizes each year’s gain or loss over a closed five year period and allows for direct offsetting of gains and losses. The AVA increased from $27.4 billion to $28.1 billion as of August 31, 2019. When measured on a market value, the approximate gross investment return for the fiscal year ending August 31, 2019 was 3.04%, and the return net of investment expenses was 3.00%. When measured on an actuarial value, the net investment return was 6.9%. Table 7 shows a history of return rates. The ERS ten-year average market return, gross of all expenses as reported by the ERS Master Trust Custodian, is 8.20%. The ten-year average return net of investment expenses is 8.09%. Table 8 provides a history of the contributions paid into ERS and the administrative expenses and benefit payments that have been paid out of ERS. This table shows that ERS paid administrative expenses and benefit payments, in excess of contributions received, of $1,049 million (or 3.8% of assets) in fiscal year 2018 and the amount was $1,161 million (or 4.2% of assets) in fiscal year 2019. ERS should continue to monitor this deficit as it could impact the future liquidity needs of ERS. Table 11 provides a history of contribution rates, as a percent of payroll, paid into the trust by the State, agencies, and members. This table also shows a history of the total normal cost and the Actuarially Sound Contribution (ASC).

Employees Retirement System of Texas B - 4
Data The valuation was based upon information as of August 31, 2019, furnished by ERS staff, concerning system benefits, financial transactions, plan provisions and active members, terminated members, retirees and beneficiaries. We checked for internal and year-to-year consistency, but did not audit the data. We are not responsible for the accuracy or completeness of the information provided by ERS staff. The tables in Section G show key census statistics for the various groups included in the valuation.

SECTION C
TABLES

Employees Retirement System of Texas C - 1
Table 1 Development of Employer Cost
August 31, 2019 August 31, 2018
1. Payroll
a. Reported Payroll (August Payroll of Active Members) 6,982,529,997$ 6,875,886,920$
b. Valuation Payroll (Expected Covered Payroll for
Following Plan Year) 6,984,576,697 6,875,886,920
2. Total Normal Cost Rate
a. Gross normal cost rate 13.43% 13.53%
b. Administrative expenses 0.33% 0.33%
c. Total (Item 2a + Item 2b) 13.76% 13.86%
3. Actuarial Accrued Liability for Active Members
a. Present value of future benefits for active members 20,878,202,583$ 21,310,291,435$
b. Less: present value of future normal costs (6,487,065,490) (6,505,985,620)
c. Actuarial accrued liability 14,391,137,093$ 14,804,305,815$
4. Total Actuarial Accrued Liability for:
a. Retirees and beneficiaries 23,686,007,554$ 22,527,977,524$
b. Inactive members 1,724,214,031 1,656,980,223
c. Active members (Item 3c) 14,391,137,093 14,804,305,815
d. Total 39,801,358,678$ 38,989,263,562$
5. Actuarial Value of Assets 28,060,120,223$ 27,359,943,116$
6. Unfunded Actuarial Accrued Liability
(UAAL) (Item 4d - Item 5) 11,741,238,455$ 11,629,320,446$
7. Contribution Rate Needed to Fund Normal Cost Plus
Amortize the UAAL Over 31 Years 23.26% 23.12%
8. Allocation of Contribution Rate
a. Combined State and employer rates 10.00% 10.00%
b. Member rate 9.50% 9.50%
c. Total contribution rate 19.50% 19.50%
d. Total normal cost rate 13.76% 13.86%
e. Available contribution rate to amortize UAAL 5.74% 5.64%
f. Total contribution rate 19.50% 19.50%
9. Funding period based on statutory contribution rates
and Actuarial Value of Assets (years) Never Never

Employees Retirement System of Texas C - 2
Table 2 Actuarial Present Value of Future Benefits
August 31, 2019 August 31, 2018
1. Active Members
a. Service Retirement 18,826,885,220$ 19,275,714,515$
b. Disability Benefits 164,793,909 165,410,881
c. Death Before Retirement 241,503,386 246,210,737
d. Termination 1,645,020,068 1,622,955,302
e. Total 20,878,202,583$ 21,310,291,435$
2. Inactive Members 1,724,214,031$ 1,656,980,223$
3. Annuitants 23,686,007,554$ 22,527,977,524$
4. Total Actuarial Present Value 46,288,424,168$ 45,495,249,182$ of Future Benefits

Employees Retirement System of Texas C - 3
Table 3 Analysis of Normal Cost
August 31, 2019 August 31, 2018
1. Gross Normal Cost Rate
a. Service Retirement 9.56% 9.64%
b. Disability Benefits 0.14% 0.14%
c. Death Before Retirement 0.18% 0.18%
d. Termination 3.55% 3.57%
e. Total 13.43% 13.53%
2. Administrative Expenses 0.33% 0.33%
3. Total Normal Cost 13.76% 13.86%
4. Less: Member Rate 9.50% 9.50%
5. Employer Normal Cost Rate 4.26% 4.36%

Employees Retirement System of Texas C - 4
Table 4 Historical Summary of Active Member Data
Valuation as of Percent Amount in Percent Percent Average Average
August 31, Number Increase $ Millions Increase $ Amount Increase Age Service
(1) (2) (3) (4) (5) (6) (7) (8) (9)
2008 134,626 N/A 5,313 N/A 39,468 N/A 43.7 9.4
2009 141,223 4.9% 5,677 6.8% 40,202 1.9% 43.6 9.2
2010 142,490 0.9% 5,845 3.0% 41,022 2.0% 43.8 9.2
2011 137,293 -3.6% 5,714 -2.2% 41,620 1.5% 44.1 9.5
2012 132,669 -3.4% 5,597 -2.0% 42,188 1.4% 44.3 9.7
2013 133,669 0.8% 5,689 1.7% 42,564 0.9% 44.3 9.6
2014 134,162 0.4% 5,953 4.6% 44,374 4.3% 44.3 9.4
2015 142,409 6.1% 6,407 7.6% 44,990 1.4% 43.6 8.8
2016 146,390 2.8% 6,806 6.2% 46,495 3.3% 43.3 8.5
2017 141,629 -3.3% 6,796 -0.2% 47,986 3.2% 43.6 8.7
2018 141,535 -0.1% 6,876 1.2% 48,581 1.2% 43.6 8.6
2019 141,865 0.2% 6,983 1.6% 49,220 1.3% 43.5 8.4
Active Members Covered Payroll Average Salary

Employees Retirement System of Texas C - 5
Table 5 Reconciliation of Plan Net Assets
August 31, 2019 August 31, 2018
(1) (2)
1. Market value of assets at beginning of year 27,753,334,784$ 26,371,827,298$
2. Revenue for the year
a. Contributions for the year
i. State (including membership fees) 712,647,639$ 697,189,414$
ii. Member (including penalty interest) 694,788,598 683,932,829
iii. Total 1,407,436,237$ 1,381,122,243$
b. Net investment income 758,466,709$ 2,430,297,025$
c. Total revenue 2,165,902,946$ 3,811,419,268$
3. Disbursements for the year
a. Benefit payments and refunds 2,616,741,786 2,479,475,003$
b. Net transfers from TRS (76,479,829) (73,113,185)
c. Administrative expenses 27,751,616 23,549,964
d. Total expenditures 2,568,013,573 2,429,911,782
4. Increase in net assets
(Item 2c - Item 3d) (402,110,627)$ 1,381,507,486$
5. Market value of assets at end of year (Item 1 + Item 4) 27,351,224,157$ 27,753,334,784$
Year Ending

Employees Retirement System of Texas C - 6
Table 6 Development of Actuarial Value of Assets
Year Ending
August 31, 2019
1. Market value of assets at beginning of year 27,753,334,784$
2. Net new investments
a. Contributions for the year (Table 5) 1,407,436,237$
b. Disbursements for the year (Table 5) (2,568,013,573)
c. Subtotal (1,160,577,336)
3. Market value of assets at end of year 27,351,224,157$
4. Net earnings (Item 3 - Item 1 - Item 2) 758,466,709$
5. Assumed investment return rate for fiscal year 7.50%
6. Expected return 2,037,978,459$
7. Excess return (Item 4 - Item 6) (1,279,511,750)$
8.
Fiscal
Year
End
Remaining Deferrals
of Excess (Shortfall)
of Investment Income
Offsetting of
Gains/(Losses)
Net Deferrals
Remaining
Years
Remaining
Recognized for
this valuation
Remaining after
this valuation
(1) (2) (3) = (1) + (2) (4) (5) = (3) / (4) (6) = (3) - (5)
2015 0$ 0$ 0$ 1 0$ 0$
2016 0 0 0 2 0 0
2017 0 0 0 3 0 0
2018 393,391,668 (393,391,668) 0 4 0 0
2019 (1,279,511,750) 393,391,668 (886,120,082) 5 (177,224,016) (708,896,066)
Total (886,120,082)$ 0$ (886,120,082)$ (177,224,016)$ (708,896,066)$
9. Actuarial value of assets as of August 31, 2019 (Item 3 - Item 8, Column 6) 28,060,120,223$
10.Ratio of actuarial value to market value 102.6%
Development of amounts to be recognized as of August 31, 2019:

Employees Retirement System of Texas C - 7
Table 7 History of Investment Return Rates
Year Ending Market Market
August 31 of Returns (Gross) Returns (Net) Actuarial
(1) (2) (3) (4)
1998 8.30% 8.23% 11.5%
1999 16.26% 16.46% 12.5%
2000 9.43% 9.40% 11.8%
2001 -6.91% -6.93% 7.6%
2002 -7.17% -7.21% 4.7%
2003 9.20% 9.14% 5.4%
2004 11.69% 11.64% 6.4%
2005 12.71% 12.62% 7.5%
2006 8.83% 8.76% 7.7%
2007 13.88% 13.76% 8.6%
2008 -4.58% -4.69% 5.7%
2009 -6.60% -6.71% 3.2%
2010 6.65% 6.48% 3.6%
2011 12.58% 12.36% 5.0%
2012 8.22% 8.04% 5.4%
2013 10.07% 9.87% 6.1%
2014 14.70% 14.58% 7.6%
2015 0.49% 0.44% 6.1%
2016 5.32% 5.28% 5.9%
2017 12.15% 12.11% 2.8%
2018 9.58% 9.54% 7.9%
2019 3.04% 3.00% 6.9%
Average Returns
Last Five Years: 6.03% 5.99% 5.9%
Last Ten Years: 8.20% 8.09% 5.7%
Last Fifteen Years: 6.94% 6.84% 6.0%
Last Twenty Years: 5.92% 5.83% 6.3%
Market returns provided by ERS Master Trust Custodian.
Rates in Column (2) represent the market returns gross of all expenses. Rates in Column (3) represent the market returns net of investment expenses. Net returns may exceed gross returns in years where adjustments are made to fee expenses.

Employees Retirement System of Texas C - 8
Table 8 History of Cash Flow
External External Cash
Year Ending Benefit Payments Administrative Cash Flow Market Value Flow as Percent
August 31, Contributions and Refunds Expenses Total for the Year of Assets of Market Value
(1) (2) (3) (5) (6) (7) (8) (9)
2007 657.7$ (1,333.2)$ (16.0)$ (1,349.2)$ (691.5)$ 23,480$ -2.9%
2008 678.8 (1,383.9) (16.2) (1,400.1) (721.3) 21,464 -3.4%
2009 716.1 (1,449.0) (17.3) (1,466.3) (750.2) 19,098 -3.9%
2010 810.4 (1,512.4) (19.0) (1,531.4) (721.0) 19,581 -3.7%
2011 839.9 (1,612.5) (18.8) (1,631.3) (791.4) 21,204 -3.7%
2012 758.1 (1,733.7) (17.8) (1,751.5) (993.4) 21,826 -4.6%
2013 798.3 (1,834.4) (18.7) (1,853.1) (1,054.8) 22,869 -4.6%
2014 912.8 (1,963.5) (20.2) (1,983.7) (1,070.9) 25,050 -4.3%
2015 962.6 (2,049.3) (21.8) (2,071.1) (1,108.5) 23,998 -4.6%
2016 1,361.4 (2,147.3) (20.4) (2,167.7) (806.3) 24,466 -3.3%
2017 1,385.5 (2,288.8) (23.1) (2,311.9) (926.4) 26,372 -3.5%
2018 1,381.1 (2,406.4) (23.5) (2,429.9) (1,048.8) 27,753 -3.8%
2019 1,407.4 (2,540.3) (27.7) (2,568.0) (1,160.6) 27,351 -4.2%
Dollar amounts in mill ions
Distributions and Expenditures

Employees Retirement System of Texas C - 9
Table 9 Total Experience Gain or Loss
Year Ending Year Ending
August 31, 2019 August 31, 2018
(2) (3)
A. Calculation of total actuarial gain or loss
1. Unfunded actuarial accrued liability (UAAL), previous year 11,629,320,446$ 11,257,958,076$
2. Normal cost for the year (excluding administrative expenses) 930,307,500 925,646,023
3. Actual administrative expenses 27,751,616 23,549,964
4. Contributions for the year (excluding service purchases) (1,366,868,178) (1,338,470,431)
5. Interest at 7.5%
a. On UAAL 872,199,033$ 844,346,856$
b. On normal cost and administrative expenses 35,927,217 35,594,850
c. On contributions (51,257,557) (50,192,641)
d. Total 856,868,693$ 829,749,065$
6. Assumption change (Gains)/Losses (9,971,397)$ 0$
7. Legislative changes*– Across-the-board pay increases budgeted for
upcoming biennium by the State Legislature (565,155,584) 0
8. Expected UAAL (Sum of Items 1 through 7) 11,502,253,096 11,698,432,697
9. Actual UAAL 11,741,238,455 11,629,320,446
10. Total (gain)/loss for the year (Item 9 - Item 8) 238,985,359$ (69,112,251)$
B. Source of gains and losses
11. Asset (Gain)/Loss for the year 0.37% 147,719,641 (98,347,917)
12. Pay Increases (Less)/Greater than Expected 0.25% 100,756,864 75,386,426
13. Non-Retired Demographic (Gains)/Losses 0.02% 9,510,548 10,285,236
14. Post-Retirement Mortality (Gains)/Losses 0.05% (18,309,293) (30,464,390)
15. Other Demographic (Gains)/Losses 0.00% (692,401) (25,971,606)
16. Total (Sum of Items 11 through 15) 0.60% 238,985,359$ (69,112,251)$
Item
(1)
% of
AAL
* The plan experiences a (gain)/loss when across-the-board pay increases budgeted by the State Legislature
are (less)/greater than assumed.

Employees Retirement System of Texas C - 10
Table 10 Solvency Test
Actuarial Accrued Liability and Percent of Active Member Payroll for:
% of % of % of Actuarial Value
August 31, (1) Payroll (2) Payroll (3) Payroll of Assets (1) (2) (3)
2007 4,059.7$ 77% 11,519.9$ 219% 8,407.5$ 160% 22,938.9$ 100% 100% 88%
2008 4,256.2 79% 12,195.8 227% 8,951.2 166% 23,511.9 100% 100% 79%
2009 4,460.6 77% 12,648.2 218% 9,799.0 169% 23,509.6 100% 100% 65%
2010 4,719.7 80% 13,407.8 226% 10,284.3 173% 23,628.6 100% 100% 54%
2011 4,943.7 85% 14,325.2 247% 9,781.3 169% 23,997.4 100% 100% 48%
2012 5,075.2 89% 15,244.0 269% 9,658.0 170% 24,272.5 100% 100% 41%
2013 5,201.0 91% 16,148.2 284% 10,536.8 185% 24,667.6 100% 100% 31%
2014 5,213.6 88% 17,113.9 287% 10,597.2 178% 25,431.9 100% 100% 29%
2015 5,235.1 82% 18,080.0 282% 10,553.3 165% 25,850.5 100% 100% 24%
2016 5,509.4 81% 19,018.0 279% 10,775.8 158% 26,557.1 100% 100% 19%
2017 5,709.1 84% 21,378.8 315% 10,541.9 155% 26,371.8 100% 97% 0%
2018 5,897.5 86% 22,528.0 328% 10,563.8 154% 27,359.9 100% 95% 0%
2019 6,044.4 87% 23,686.0 339% 10,070.9 144% 28,060.1 100% 93% 0%
Note : Dollar amounts in millions
Liabilities Covered
by Assets
Employer Financed
Portion of Vested
and Nonvested BenefitsInterest
Retirees and
Beneficiaries Currently
Receiving Benefits
Accumulated Member
Contributions Including
Portion of Accrued

Employees Retirement System of Texas C - 11
Table 11 Historical Contribution Rates
Total Normal
State Agency Members Total Cost Rate ASC *
1998 6.00% 0.00% 6.00% 12.00% 11.86% Not calculated
1999 6.00% 0.00% 6.00% 12.00% 12.33% Not calculated
2000 6.00% 0.00% 6.00% 12.00% 12.41% Not calculated
2001 6.00% 0.00% 6.00% 12.00% 12.67% Not calculated
2002 6.00% 0.00% 6.00% 12.00% 12.71% Not calculated
2003 6.00% 0.00% 6.00% 12.00% 12.26% 12.82%
2004 6.00% 0.00% 6.00% 12.00% 12.45% 13.12%
2005 6.45% 0.00% 6.00% 12.45% 12.28% 13.59%
2006 6.45% 0.00% 6.00% 12.45% 11.98% 13.20%
2007 6.45% 0.00% 6.00% 12.45% 11.98% 13.10%
2008 6.45% 0.00% 6.00% 12.45% 13.37% 15.45%
2009 ** 6.78% 0.00% 6.48% 13.26% 12.38% 15.84%
2010 6.95% 0.00% 6.50% 13.45% 12.30% 17.07%
2011 6.00% 0.00% 6.50% 12.50% 12.31% 17.47%
2012 6.50% 0.00% 6.50% 13.00% 12.31% 18.25%
2013 7.50% 0.50% 6.60% 14.60% 11.57% 18.73%
2014 7.50% 0.50% 6.90% 14.90% 11.58% 18.76%
2015 9.50% 0.50% 9.50% 19.50% 12.27% 19.62%
2016 9.50% 0.50% 9.50% 19.50% 12.28% 19.88%
2017 9.50% 0.50% 9.50% 19.50% 13.95% 23.21%
2018 9.50% 0.50% 9.50% 19.50% 13.86% 23.12%
2019 9.50% 0.50% 9.50% 19.50% 13.76% 23.26%
** For Fiscal Year 2010, members contributed 6.45% from September through December and 6.50% from January
through August. Similarly, the State contributed 6.45% from September through December and 6.95% from January
through August.
* The Actuarially Sound Contribution Rate (ASC) is the rate determined as of the valuation date to fund the normal
cost and amortize the UAAL over a 31 year period.
Contributions from:Actuarial
Valuation as
of August 31,

SECTION D
RISKS ASSOCIATED WITH MEASURING THE ACCRUED LIABILITY
AND ACTUARIALLY DETERMINED CONTRIBUTION

Employees Retirement System of Texas D - 1
Risks Associated with Measuring the Accrued Liability and Actuarially Determined Contribution
The determination of the accrued liability and the actuarially determined contribution requires the use of assumptions regarding future economic and demographic experience. Risk measures, as illustrated in this report, are intended to aid in the understanding of the effects of future experience differing from the assumptions used in the course of the actuarial valuation. Risk measures may also help with illustrating the potential volatility in the accrued liability and the actuarially determined contribution that result from the differences between actual experience and the actuarial assumptions.
Future actuarial measurements may differ significantly from the current measurements presented in this report due to such factors as the following: plan experience differing from that anticipated by the economic or demographic assumptions; changes in economic or demographic assumptions due to changing conditions; increases or decreases expected as part of the natural operation of the methodology used for these measurements (such as the end of an amortization period, or additional cost or contribution requirements based on the Plan’s funded status); and changes in plan provisions or applicable law. The scope of an actuarial valuation does not include an analysis of the potential range of such future measurements.
Examples of risk that may reasonably be anticipated to significantly affect the plan’s future financial condition include:
1. Investment risk – actual investment returns may differ from the expected returns; 2. Asset/Liability mismatch – changes in asset values may not match changes in liabilities, thereby
altering the gap between the accrued liability and assets and consequently altering the funded status and contribution requirements;
3. Contribution risk – actual contributions may differ from expected future contributions. For example, actual contributions may not be made in accordance with the plan’s funding policy or material changes may occur in the anticipated number of covered employees, covered payroll, or other relevant contribution base;
4. Salary and Payroll risk – actual salaries and total payroll may differ from expected, resulting in actual future accrued liability and contributions differing from expected;
5. Longevity risk – members may live longer or shorter than expected and receive pensions for a period of time other than assumed;
6. Other demographic risks – members may terminate, retire or become disabled at times or with benefits other than assumed resulting in actual future accrued liability and contributions differing from expected.
The effects of certain trends in experience can generally be anticipated. For example if the investment return since the most recent actuarial valuation is less (or more) than the assumed rate, the cost of the plan can be expected to increase (or decrease). Likewise if longevity is improving (or worsening), increases (or decreases) in cost can be anticipated.
The actuarially sound contribution rate may be considered as a minimum contribution rate that complies with State statute. The timely receipt of the actuarially determined contributions is critical to support the financial health of the plan. Currently, this, and other Board funding policy objectives are not being met. Users of this report should be aware that even contributions made at the actuarially sound contribution rate do not necessarily guarantee benefit security.

Employees Retirement System of Texas D - 2
Plan Maturity Measures
Risks facing a pension plan evolve over time. A young plan with virtually no investments and paying few benefits may experience little investment risk. An older plan with a large number of members in pay status and a significant trust may be much more exposed to investment risk. Generally accepted plan maturity measures include the following:
2019 2018 2017 2016 2015 2014 2013 2012 2011 2010
Ratio of the market value of
assets to total payroll3.9 4.0 3.9 3.6 3.6 4.1 3.8 3.8 3.7 3.3
Ratio of actuarial accrued
liability to payroll5.7 5.7 5.5 5.2 5.1 5.3 5.4 5.3 5.0 4.8
Ratio of actives to retirees
and beneficiaries1.2 1.3 1.3 1.4 1.4 1.4 1.5 1.5 1.6 1.8
Ratio of net cash flow to
market value of assets-4.2% -3.8% -3.5% -3.3% -4.6% -4.3% -4.6% -4.6% -3.7% -3.7%
Duration of the actuarial
accrued liability*11.6 11.7
*Duration measure not available before 2018
Ratio of Market Value of Assets to Payroll
The relationship between assets and payroll is a useful indicator of the potential volatility of contributions. For example, if the market value of assets is 2.0 times the payroll, a return on assets 5% different than assumed would equal 10% of payroll. A higher (lower) or increasing (decreasing) level of this maturity measure generally indicates a higher (lower) or increasing (decreasing) volatility in plan sponsor contributions as a percentage of payroll.
Ratio of Actuarial Accrued Liability to Payroll
The relationship between actuarial accrued liability and payroll is a useful indicator of the potential volatility of contributions for a fully funded plan. A funding policy that targets a funded ratio of 100% is expected to result in the ratio of assets to payroll and the ratio of liability to payroll converging over time.
The ratio of liability to payroll may also be used as a measure of sensitivity of the liability itself. For example, if the actuarial accrued liability is 2.5 times the payroll, a change in liability 2% other than assumed would equal 5% of payroll. A higher (lower) or increasing (decreasing) level of this maturity measure generally indicates a higher (lower) or increasing (decreasing) volatility in liability (and also plan sponsor contributions) as a percentage of payroll.
Ratio of Actives to Retirees and Beneficiaries
A young plan with many active members and few retirees will have a high ratio of active to retirees. A mature open plan may have close to the same number of actives to retirees resulting in a ratio near 1.0. A super-mature or closed plan may have significantly more retirees than actives resulting in a ratio below 1.0.
Ratio of Net Cash Flow to Market Value of Assets
A positive net cash flow means contributions exceed benefits and expenses. A negative cash flow means existing funds are being used to make payments. A certain amount of negative net cash flow is generally expected to occur when benefits are prefunded through a qualified trust. Large negative net cash flows as a percent of assets may indicate a super-mature plan or a need for additional contributions.

Employees Retirement System of Texas D - 3
Duration of Actuarial Accrued Liability
The duration of the actuarial accrued liability may be used to approximate the sensitivity to a 1% change in the assumed rate of return. For example, duration of 10 indicates that the actuarial accrued liability would increase approximately 10% if the assumed rate of return were lowered 1%.
Additional Risk Assessment
Additional risk assessment is outside the scope of the annual actuarial valuation. Additional assessment may include scenario tests, sensitivity tests, stochastic modeling, stress tests, and a comparison of the present value of accrued benefits at low-risk discount rates with the actuarial accrued liability.

SECTION E
SUMMARY OF PLAN PROVISIONS

Employees Retirement System of Texas E - 1
Summary of Plan Provisions for Employees Retirement System of Texas
Classes of Membership
1. Elected Class Membership:
a. Membership is optional and limited to:
i. Elected State officials not covered by either of the Judicial Retirement Systems
ii. Members of the Legislature; and
iii. District and Criminal District Attorneys paid by the State general revenue fund.
2. Employee Class Membership:
a. Membership is mandatory for all employees and appointed officers of every department, commission, board, agency, or institution of the State except for:
i. Independent contractors;
ii. Persons covered by the Teacher Retirement System or either of the Judicial Retirement Systems; and
iii. Employee Class Members already receiving retirement benefits under the System.
b. Includes two types of Employee Class service:
i. CPO/CO: Certified Peace Officer / Custodial Officer – in general, service rendered while a law enforcement officer, custodial officer, parole officer or caseworker (collectively referred to as “LECOs”); and
ii. Regular: Non-CPO/CO service.
c. Prior to September 1, 2015, membership begins after a 90-day waiting period. Effective September 1, 2015, membership begins immediately.
Member Contributions
1. Elected Class:
a. Legislators:
i. Fiscal year 2015: 8.00% of compensation
ii. Fiscal year 2016 and beyond: 9.50% of compensation
b. Non-legislators:
ii. Fiscal year 2015: 6.90% of compensation
iii. Fiscal year 2016 and beyond: 9.50% of compensation. Beginning in fiscal year 2018, the 9.50% will be reduced one-tenth of one percent for each one-tenth of one percent that the State contribution rate for the fiscal year to which the service relates is less than the State contribution rate established for the 2017 fiscal year.

Employees Retirement System of Texas E - 2
2. Employee Class:
a. Fiscal year 2015: 6.90% of compensation
b. Fiscal year 2016 and beyond: 9.50% of compensation. Beginning in fiscal year 2018, the 9.50% will be reduced one-tenth of one percent for each one-tenth of one percent that the State contribution rate for the fiscal year to which the service relates is less than the State contribution rate established for the 2017 fiscal year.
c. Additional member contributions may be allowable for service purchases.
3. Member contributions cease when a member’s benefit accrual has reached 100% of Average Monthly Compensation.
4. Member contributions accumulate interest at 5.00% per year through December 31, 2013 and 2.00% interest per year, thereafter.
State of Texas and Employer Contributions
State and employer contributions are set biennially by the legislature. The current projected contribution rates, as a percentage of compensation, are shown below. In addition, the State makes contributions for lump-sum death benefits, establishing service not previously established, and annual membership fees. State payroll contributions cease when a member’s benefit accrual has reached 100% of Average Monthly Compensation.
FY2015
FY2016 and
beyond
Employer (agency appropriations) 0.50% 0.50%
State (statewide appropriations) 7.50% 9.50%
State contributions after the 2021 fiscal year are subject to future legislative appropriations.
Return to Work Surcharge
For members who, on or after September 1, 2009, retire from the employee class and are rehired as a retiree into a position that would otherwise include membership in the employee class, the department or agency that employs the member must remit to the retirement system an amount equal to the amount of the State contribution that the department or agency would remit for an active member employed in the person's position.
Compensation
Compensation includes base salary, longevity and hazardous duty pay and excludes overtime pay. This amount is limited by Section 401(a)(17) of the Internal Revenue Code for members hired after August 31, 1996.

Employees Retirement System of Texas E - 3
Average Monthly Compensation (AMC)
1. Elected Class Service:
a. Elected class members other than district attorneys or criminal district attorneys: The State base salary, excluding longevity pay, of a district judge, as adjusted from time to time.
b. District attorneys and criminal district attorneys: The State salary, excluding longevity pay, of a district judge of the same number of years of service credit as the member on the member’s last day of service as a district or criminal district attorney, as adjusted from time to time.
2. Employee Class Service:
a. Members hired prior to September 1, 2009: Average of the 36 highest months of compensation for service in the employee class of membership
b. Members hired on or after September 1, 2009 and prior to September 1, 2013: Average of the 48 highest months of compensation for service in the employee class of membership
c. Members hired on or after September 1, 2013: Average of the 60 highest months of compensation for service in the employee class of membership
Creditable Service
The types of service creditable in ERS are membership service, military service and equivalent membership service. Equivalent membership service includes: previously cancelled service, service not previously established, waiting period service, and Additional Service Credit.
Unused Sick and Annual Leave
In many cases, unused sick and annual leave can be used to establish Creditable Service. Members hired prior to September 1, 2009 can use unused sick and annual leave to satisfy service requirements for Retirement and Death Benefit Plan eligibility as well as to calculate plan benefits. Members hired on or after September 1, 2009 can only use unused sick and annual leave to calculate plan benefits. However, members hired on or after September 1, 2013 cannot use unused annual leave to calculate plan benefits if the member opts to receive the unused annual leave as a lump-sum payment. Creditable Service in the Elected Class is not granted for unused sick and annual leave.
Standard Service Retirement Annuity
1. Elected Class:
a. Eligibility:
i. Age 60 and eight years of elected class service; or
ii. Age 50 and 12 years of elected class service.
b. Benefits: 2.3% of AMC times years of Creditable Service, adjusted automatically based on the State base salary of a district judge. Alternatively, an elected class member may elect to transfer their elected class service to the employee class in order to have their AMC based on actual compensation. However, if the elected service is transferred to the employee class, the member forfeits increases based on changes in the State base salary of a district judge unless the service is transferred back to the elected class.
Employees Retirement System of Texas E - 4
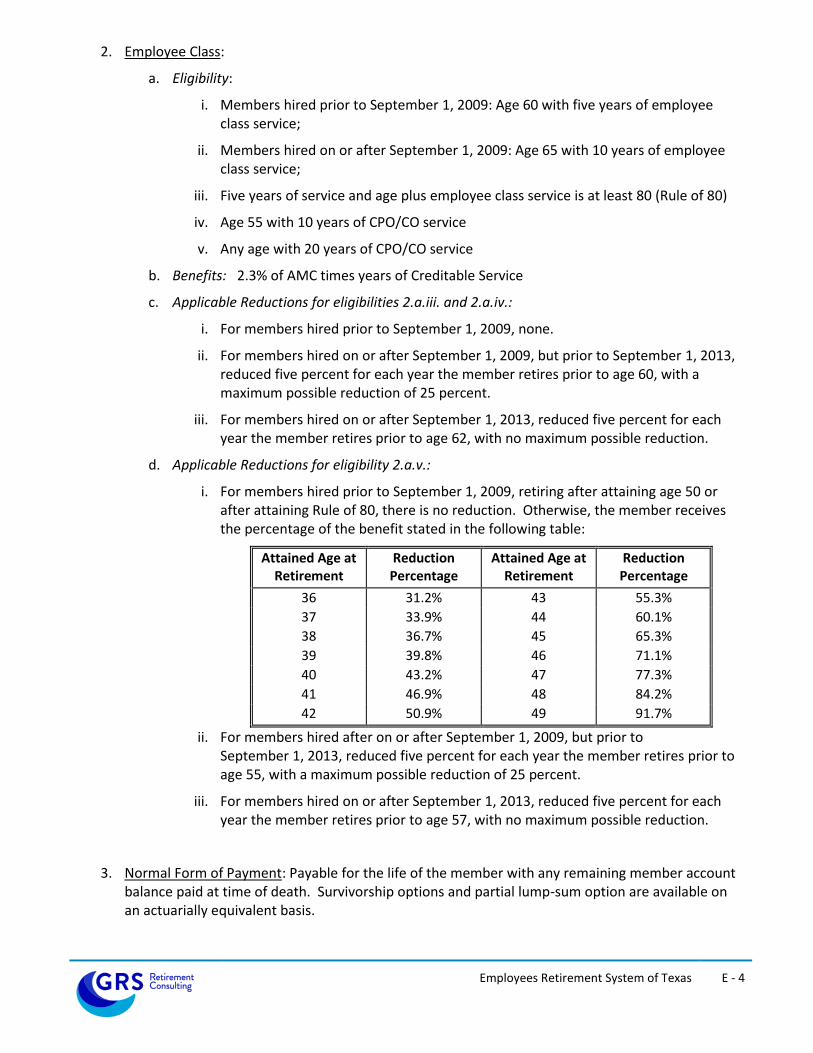
2. Employee Class:
a. Eligibility:
i. Members hired prior to September 1, 2009: Age 60 with five years of employee class service;
ii. Members hired on or after September 1, 2009: Age 65 with 10 years of employee class service;
iii. Five years of service and age plus employee class service is at least 80 (Rule of 80)
iv. Age 55 with 10 years of CPO/CO service
v. Any age with 20 years of CPO/CO service
b. Benefits: 2.3% of AMC times years of Creditable Service
c. Applicable Reductions for eligibilities 2.a.iii. and 2.a.iv.:
i. For members hired prior to September 1, 2009, none.
ii. For members hired on or after September 1, 2009, but prior to September 1, 2013, reduced five percent for each year the member retires prior to age 60, with a maximum possible reduction of 25 percent.
iii. For members hired on or after September 1, 2013, reduced five percent for each year the member retires prior to age 62, with no maximum possible reduction.
d. Applicable Reductions for eligibility 2.a.v.:
i. For members hired prior to September 1, 2009, retiring after attaining age 50 or after attaining Rule of 80, there is no reduction. Otherwise, the member receives the percentage of the benefit stated in the following table:
Attained Age at Retirement
Reduction Percentage
Attained Age at Retirement
Reduction Percentage
36 31.2% 43 55.3%
37 33.9% 44 60.1%
38 36.7% 45 65.3%
39 39.8% 46 71.1%
40 43.2% 47 77.3%
41 46.9% 48 84.2%
42 50.9% 49 91.7%
ii. For members hired after on or after September 1, 2009, but prior to September 1, 2013, reduced five percent for each year the member retires prior to age 55, with a maximum possible reduction of 25 percent.
iii. For members hired on or after September 1, 2013, reduced five percent for each year the member retires prior to age 57, with no maximum possible reduction.
3. Normal Form of Payment: Payable for the life of the member with any remaining member account balance paid at time of death. Survivorship options and partial lump-sum option are available on an actuarially equivalent basis.

Employees Retirement System of Texas E - 5
Standard Non-Occupational Disability Annuity
1. Elected Class:
a. Eligibility:
i. 8 years of elected class service; or
ii. 6 years of elected class service plus 2 years of pre-1978 military service; and
iii. Not eligible for a Standard Service Retirement Annuity.
b. Benefits: 2.3% of AMC times years of Creditable Service, adjusted automatically based on the State base salary of a district judge.
2. Employee Class:
a. Eligibility:
i. 10 years of employee class service; and
ii. Not eligible for a Standard Service Retirement Annuity on the basis of Rule of 80 or age 55 and 10 years of CPO/CO Service.
b. Benefits: 2.3% of AMC times years of Creditable Service
c. Applicable Reductions: Actuarially reduced from the age that the member would have been eligible for Standard Service Retirement Annuity
3. Normal Form of Payment: Annuity payable for life or until member is no longer incapacitated for the performance of duty. Any remaining member account balance paid at time of death. Survivorship options and partial lump-sum option are available on an actuarially equivalent basis.
Standard Occupational Disability Annuity
1. Elected Class:
a. Eligibility: Disability as a direct result of some risk or hazard inherent to employment
b. Benefits: 2.3% of AMC times years of Creditable Service, but not less than 18.4% of AMC, adjusted automatically based on the State base salary of a district judge
2. Employee Class (Regular State Employees):
a. Eligibility: Disability as a direct result of some risk or hazard inherent to employment
b. Benefits: 2.3% of AMC times years of Creditable Service, but not less than 35% of AMC

Employees Retirement System of Texas E - 6
3. Employee Class (LECO Members):
a. Eligibility: Disability as a direct result of some risk or hazard inherent to law enforcement or custodial duties
i. Total: Incapable of substantial gainful activity and eligible for Social Security disability benefits
ii. Non-total: Does not satisfy definition of Total Disability
b. Benefits:
i. Non-total with less than 20 years of CPO/CO Service: 2.3% of AMC times years of Creditable Service, but not less than 50% of AMC. 15% of AMC payable from LECOSRF and the remaining 35% of AMC is payable from the ERS trust
ii. Non-total with 20 years of CPO/CO Service: 2.3% of AMC times years of Creditable Service
iii. Total: 2.3% of AMC times years of Creditable Service, but not less than 35% of AMC
4. Normal Form of Payment: Annuity payable for life or until member is no longer incapacitated for the performance of duty. Any remaining member account balance paid at time of death. Survivorship options and partial lump-sum option are available on an actuarially equivalent basis.
Occupational Disability Lump-Sum Death Benefit
If a member receiving an occupational disability retirement annuity dies and it is determined that the death was an occupational death, a lump-sum death benefit is payable in an amount equal to one year's salary, computed on the basis of the retiree's rate of compensation at the time of disability retirement, and payable to a surviving spouse or dependent minor child.

Employees Retirement System of Texas E - 7
Death Benefit Plan (DBP) Annuity
1. Eligibility:
a. 10 years of employee class service; or
b. Eligible for Standard Service Retirement Annuity at time of death.
2. Benefits: Benefits are calculated as if the member had elected an optional form of payment, received a standard service retirement annuity, and died immediately thereafter. If the member dies before becoming eligible for the Standard Service Retirement Annuity, the benefit is reduced for early retirement as follows:
a. With 12 years of elected class service, the benefit is actuarially reduced from the member’s age 50,
b. With 10 years of CPO/CO service, the benefit is actuarially reduced from the member’s age 55,
c. With five years of employee class service for members hired before September 1, 2009 or eight years of elected class service, the benefit is actuarially reduced from the member’s age 60, and
d. With 10 years of employee class service for members hired on or after September 1, 2009, the benefit is actuarially reduced from the member’s age 65.
Pre-Retirement Death Refund Alternative
A refund of accumulated contributions is payable in cases of pre-retirement death where the member did not meet the eligibility requirements for a Death Benefit Plan Annuity, or the eligible beneficiary choses to receive a refund of the member account balance in lieu of an annuity. This amount is increased by 5% of the member’s account balance at death, times full years of service credit at death, to a maximum of 100%.
Occupational Death Lump-Sum Benefit
If an active member dies and it is determined that the death was an occupational death, a lump-sum death benefit is payable in an amount equal to one year's salary, computed on the basis of the member's rate of compensation at the time of death and payable to a surviving spouse or dependent minor child in addition to any other death benefits.
Post-Retirement Death General Lump-Sum Benefit
$5,000 upon the death of a retired member. This amount is funded separately by the State and not reflected in this valuation.

Employees Retirement System of Texas E - 8
Deferred Service Retirement Annuity
1. Elected Class:
a. Eligibility: Eight years of elected class service
b. Benefits: Standard Service Retirement Annuity payable at age 60 (or 50 with 12 years of elected class service)
2. Employee Class:
a. Eligibility:
i. Members hired prior to September 1, 2009: Five years of employee class service
ii. Members hired on or after September 1, 2009: 10 years of employee class service
b. Benefits:
i. For members hired prior to September 1, 2009: Standard Service Retirement Annuity payable at age 60
ii. For members hired on or after September 1, 2009: Standard Service Retirement Annuity payable at age 65
iii. For members with 10 years of CPO/CO service: Standard Service Retirement Annuity payable at age 55
3. Normal Form of Payment: Payable for the life of the member with any remaining member account balance paid at time of death. Survivorship options and partial lump-sum option are available on an actuarially equivalent basis.
Refund of Accumulated Contributions
A refund of accumulated contributions is payable in cases where a terminated member did not meet the eligibility requirements for an annuity, or a terminated member chooses to receive a refund of his or her account balance in lieu of an annuity.
Maximum Benefits
Annuity benefits are limited to 100% of Average Monthly Compensation. For members with CPO/CO service, this benefit limitation includes benefits from all sources (ERS and the Law Enforcement and Custodial Officer Supplemental Retirement Fund).
Limit on Plan Modifications
According to Section 811.006 of the Texas Government Code – a rate of member or State contributions to or a rate of interest required for the establishment of credit in the retirement system may not be reduced or eliminated, a type of service may not be made creditable in the retirement system, a limit on the maximum permissible amount of a type of creditable service may not be removed or raised, a new monetary benefit payable by the retirement system may not be established, and the determination of the amount of a monetary benefit from the system may not be increased, if, as a result of the particular action, the time, as determined by an actuarial valuation, required to amortize the UAAL of the retirement system would be increased to a period that exceeds 30 years by one or more years.
SECTION F
ACTUARIAL ASSUMPTIONS AND METHODS

Employees Retirement System of Texas F - 1
Summary of Actuarial Assumptions and Methods
The assumptions and methods applied in this actuarial valuation were adopted by the Board of
Trustees on August 23, 2017 based on the experience investigation that covered the five-year
period from September 1, 2011 through August 31, 2016.
I. Valuation Date
The valuation date is August 31 of each plan year. This is the date as of which the actuarial
present value of future benefits and the actuarial value of assets are determined.
II. Actuarial Cost Method
The actuarial valuation is used to determine the adequacy of the State contribution rate
(established by Legislative appropriation) and employer contribution rate (established by statute)
and to describe the current financial condition of ERS.
The actuarial valuation uses the Entry Age Normal actuarial cost method. Under this method, the
first step is to determine the contribution rate (level as a percentage of pay) required to provide
the benefits to each member, or the normal cost rate. The normal cost rate consists of two
pieces: (i) the member’s contribution rate, and (ii) the remaining portion of the normal cost rate
which is the employer’s normal cost rate. The total normal cost rate is based on the benefits
payable to each individual active member.
The Unfunded Actuarial Accrued Liability (UAAL) is the liability for future benefits which is in
excess of (i) the actuarial value of assets, and (ii) the present value of future normal costs. The
employer contribution provided in excess of the employer normal cost is applied to amortize the
UAAL.
The funding period is calculated as the number of years required to fully amortize the UAAL, and is
calculated with the use of an open group projection that takes into account: (a) future market
earnings, net of investment-related expenses, will equal 7.50% per year, (b) there will be no
changes in assumptions, (c) the number of active members will remain unchanged, (d) active
members who leave employment will be replaced by new entrants each year, and (e) State and
employer contributions will remain the same percentage of payroll as described in Section E of the
valuation report.
The Entry Age actuarial cost method is an “immediate gain” method (i.e., experience gains and
losses are separately identified as part of the UAAL). However, they are amortized over the same
period applied to all other components of the UAAL.

Employees Retirement System of Texas F - 2
III. Actuarial Value of Assets
The actuarial value of assets is based on the market value of assets with a five-year phase-in of
actual investment return in excess of (less than) expected investment income. Offsetting
unrecognized gains and losses are immediately recognized, with the shortest remaining bases
recognized first and the net remaining bases continue to be recognized on their original
timeframe. Expected investment income is determined using the assumed investment return rate
and the market value of assets (adjusted for receipts and disbursements during the year). The
returns are computed net of investment-related expenses. The actuarial value of assets was reset
to be equal to the market value of assets as of August 31, 2017 and the new method will be
applied prospectively.
IV. Actuarial Assumptions
Investment Return: 7.50% per year, net of investment-related expenses (composed of an assumed 2.50% inflation rate and a 5.00% real rate of return)
Administrative Expenses: 0.33% of valuation payroll per year
Salary Increases: Inflationary pay increases are assumed to occur at the beginning of the year and the remaining pay increases associated with merit, promotion and longevity are assumed to occur at the middle of the valuation year and vary by employee group. The components of the annual increases are:
Inflation ***Real Wage Growth
(Productivity)
Merit, Promotion
and Longevity
Elected Class: Legislators 0% 0% 0%
2.50% 0%See salary
structure below
2.50% 0% 0%
2.50%
included in Merit,
Promotion and
Longevity Increases
See sample rates
2.50% 0% 0%
2.50% 0% 2.50%
Employee Group
Elected Class: District Attorneys
Employee Class
State Base Salary of a District Judge*
Inactive members who transfer to TRS**
Elected Class: Other than Legislators and
District Attorneys
* Retirees from the Elected Class are assumed to receive post-retirement increases in accordance with changes in the State base salary of a district judge.
** Assumed in estimating benefits of former members who transfer to the Teacher Retirement System of Texas (TRS).
*** Total liabilities for this valuation reflect the notable across-the-board pay increases appropriated by the State legislature for the current biennium compared to the assumed rate of inflation.

Employees Retirement System of Texas F - 3
Sample Rates:
Age
20 6.80 % 5.25 % 4.75 % 4.30 %
25 6.40 5.25 4.75 3.50 2.50 %
30 5.90 5.25 4.75 3.00 2.50 2.00 %
35 5.40 4.75 4.00 3.00 2.50 2.00 1.90 %
40 4.90 4.75 4.00 3.00 2.50 1.90 1.80
45 4.40 4.25 3.75 3.00 2.40 1.90 1.70
50 3.90 3.70 3.20 2.70 2.20 1.70 1.60
55 3.40 3.20 2.80 2.40 1.90 1.60 1.50
60+ 2.90 2.70 2.30 2.00 1.60 1.40 1.30
Annual Salary Increases for Merit, Promotion and Longevity
Male and Female Regular State Employees
Years of Eligibility Service
0 1 2 - 4 5 - 9 10 - 14 15 - 19 20+
Age
All 7.00 % 5.00 % 3.50 % 2.50 % 2.25 % 2.00 %
Annual Salary Increases for Merit, Promotion and Longevity
Male and Female LECO Members
Years of Eligibility Service
0 1 2 -4 5 - 8 9 - 17 18+
District attorneys in the Elected Class are assumed to follow the judicial salary schedule of a district judge as prescribed in Section 659.012 of the Texas Government Code. The salary structure is illustrated below:
Age Less than 44 or more, but
less than 88 or more
All
State base salary
of a district judge
110% of
base salary
120% of
base salary
Annual Salary Increases for Merit, Promotion and Longevity
Male and Female District Attorneys in the Elected Class
Years of Eligibility Service as a District Attorney
New Entrant Wage Growth: 3.00% per year, compounded annually (for increasing new hire salary in open group projection).
New Entrant Profile: The average new hire is determined based on a new entrant profile, which is created from the valuation data by determining the entry age and entry pay for anyone with greater than or equal to three but less than eight years of service as of the valuation date. Each group of new hires’ salaries is assumed to grow at the New Entrant Wage Growth of 3.00% over the salaries of the previous year’s group.

Employees Retirement System of Texas F - 4
Post-Retirement Increases for Elected Class Members: If benefits are based on the State base salary of a district judge, the benefits are assumed to increase 2.50% per year during retirement (each September 1), compounded annually, consistent with the assumed salary increase for a district judge. Increases are assumed to also occur during deferral periods (if any). Otherwise, no increases are assumed.
Age and Service Assumptions and Methods:
Eligibility Service: Eligibility Service is considered to be all service eligible for vesting purposes, which includes service earned as a regular State employee, a LECO member, a member of the Elected Class, as State Judge, and service earned in the Teacher Retirement System of Texas (“TRS”).
Benefit Service: Current Benefit Service in years and months as of the valuation date was provided by ERS. This service plus Future Earned Service, Service Credit at Retirement, and Eligibility Service at Retirement were used to project benefit amounts.
Future Earned Service: Active members were assumed to earn one additional year of service credit in each future year employed based on their current class of membership (but not beyond the amount of credit needed to provide a 100% of average monthly compensation standard service retirement annuity).
Service Credit at Retirement: For regular State employees, Benefit Service when eligible for service retirement is assumed to be increased by:
1.0 years if age plus service, prior to adjustment, is greater than or equal to 80; and
0.5 years if age plus service, prior to adjustment, is less than 80. (but not beyond the amount of credit needed to provide a 100% of average monthly compensation standard service retirement annuity).
For LECO members, Benefit Service when eligible for service retirement is assumed to be increased by:
1.0 years if CPO/CO service, prior to adjustment, is at least 20 years; and
0.5 years if CPO/CO service, prior to adjustment, is less than 20 years. (but not beyond the amount of credit needed to provide a 100% of average monthly compensation standard service retirement annuity).
For the Elected Class members, there is no assumed increase in service credit when eligible for service retirement.
Entry Age: Entry age is calculated as the age at the valuation date minus Eligibility Service (excluding TRS service).
Decrement Timing: All decrements – mortality, service retirement, disability retirement, and termination of employment for reasons other than death or retirement – are assumed to occur at the middle of the valuation year.

Employees Retirement System of Texas F - 5
Mortality Decrements:
Service Retirees, Beneficiaries, and Inactive Members 2017 State Retirees of Texas (SRT) mortality table. Generational mortality improvements in accordance with the ultimate rates from the scale most recently published by Retirement Plans Experience Committee of the Society of Actuaries (“Scale U-MP”) and projected from the year 2017. Rates for male LECO members are set forward one year. Sample rates for the base mortality table included below.
Age Males Females
40 0.0603 0.0380
45 0.1059 0.0687
50 0.1825 0.1215
55 0.3145 0.2150
60 0.5421 0.3804
65 0.9344 0.6730
70 1.6105 1.1908
75 2.7757 2.1069
80 4.7842 3.7277
85 8.2459 6.5956
90 14.2527 11.7028
Annual Mortality Rates per 100 Individuals
Active Members RP-2014 Active Member Mortality table. Generational mortality improvements in accordance with Scale U-MP are projected from the year 2014.
Disability Retirees RP-2014 Disabled Retiree Mortality. Generational mortality improvements in accordance with Scale U-MP are projected from the year 2014.
Occupational Death 1.0% of male and female active member deaths are assumed to be occupational.

Employees Retirement System of Texas F - 6
Service Retirement Decrements: Graded tables based on ERS experience.
Active Regular State Employees Service retirement rates are determined by the first set of eligibility requirements satisfied:
Eligibility A: Age plus eligibility service is greater than or equal to 80 (“Rule of 80”)
Eligibility B: Retirement eligibility other than Rule of 80 Adjustments to the base rates are made to account for age at first eligibility or reduced retirement benefits, based on date of hire (described below sample table). Base rates for eligible members:
Eligibility A Eligibility B
Age Rule of 80 Other Age/Service
<50 0.50
50 0.40
51 0.35
52 0.30
53 0.28
54 0.27
55 0.26
56 0.25
57 0.24
58 0.23
59 0.22
60 0.21 0.18
61 0.20 0.12
62 0.33 0.20
63 0.27 0.18
64 0.27 0.18
65 -74 0.27 0.27
75 1.00 1.00
Annual Service Retirement Rates
Regular State Employees (Males & Females)
Adjustments for members hired before September 1, 2009:
Eligibility A: Add 0.30 at age of 1st eligibility
Adjustments for members hired on or after September 1, 2009, but before September 1, 2013:
Eligibility A: Add 0.30 at age 60
Adjustments for members hired on or after September 1, 2013:
Eligibility A: If age of 1st eligibility is before age 62, then o rates prior to age 62 are multiplied by 75% for each year prior to age 62 o the rate at age 62 is the base table rate plus 0.20 plus 0.06 times the number
of years the age at 1st eligibility was before age 62

Employees Retirement System of Texas F - 7
Active LECO Members Service retirement rates are determined by the first set of eligibility requirements satisfied:
Eligibility A: 20 years of CPO/CO service
Eligibility B: Age 55 and 10 years of CPO/CO service
Eligibility C: Any eligibility pertaining to regular State employees (see rates and adjustments for regular State employees)
Adjustments to the base rates are made to account for age at first eligibility or reduced retirement benefits, based on date of hire (described below sample table).
Base rates for eligible members:
Age 20 yrs CPO/CO Age Age 55 & 10 yrs CPO/CO
<48 0.03
48 0.04 55 0.20
49 0.05 56 0.18
50 0.60 57 0.16
51 - 61 0.33 58 - 61 0.14
62 - 74 0.50 62 - 74 0.27
75 1.00 75 1.00
Annual Service Retirement Rates
LECO Members (Males & Females)
Eligibility A Eligibility B
Adjustments for members hired before September 1, 2013:
Eligibility A and B: Rate set to zero if member has 18 or 19 years of CPO/CO service. Rate is doubled if member has 20 years of CPO/CO service. Adjustments only apply to members that attain 20 years of CPO/CO service prior to age 65.
Adjustments for members hired on or after September 1, 2013:
Eligibility A: If age of 1st eligibility is before age 57, then o rates prior to age 57 are multiplied by 75% for each year prior to age 57 o the rate at age 57 is 100%
Eligibility B: If member will attain 20 years of CPO/CO service at or before age 62, rates are zero prior to age 62 and 100% when member attains 20 years of CPO/CO service.
Eligibility B: If member will attain 20 years of CPO/CO service after age 62, then o rates prior to age 62 are multiplied by 75% for each year prior to age 62 o the rate at age 62 is the base table rate plus 0.20 plus 0.06 times the number
of years the age at 1st eligibility was before age 62
Active Elected Class Members
Age Male and Female
50 - 61 0.10
62 - 74 0.20
75+ 1.00
Annual Service Retirement Rates
Elected Class Members

Employees Retirement System of Texas F - 8
Disability Retirement Decrements: Graded Tables Based on ERS Experience
Active Regular State Employees
The rates do not apply before someone is eligible for the benefit.
10 years of service is required for non-occupational disability retirement.
Non-occupational disability rates are assumed to be zero once the sum of the member’s age and eligibility service is greater than or equal to 80.
Active Elected Class Members
The rates do not apply before someone is eligible for the benefit.
No occupational disabilities are assumed for the elected class or judges.
Eight years of service is required for non-occupational disability retirement.
Non-occupational disability rates are assumed to be zero once the member has attained service retirement eligibility.
Sample rates for eligible regular State employees and elected class members:
Age Males Females
30 0.0275 0.0135
35 0.0650 0.0442
40 0.0749 0.0896
45 0.1027 0.1455
50 0.1484 0.2072
55 0.2477 0.3488
60 0.3740 0.5583
Annual Disability Rates per 100
Participants
Regular State Employes
and Elected Class
99% of the disability rates stated above are assumed to be attributable to non-occupational disabilities and 1% are assumed to be attributable to occupational disabilities. No occupational disabilities are assumed for the elected class.

Employees Retirement System of Texas F - 9
Active LECO Members
The rates do not apply before a member is eligible for the benefit.
Service greater than zero is required for occupational disability retirement.
10 years of service is required for non-occupational disability retirement.
Non-occupational disability rates are assumed to be zero once the sum of the member’s age and eligibility service is greater than or equal to 80, or the member has attained age 55 with 10 or more years of CPO/CO service.
Sample rates for members:
Age Males and Females
30 0.0092
35 0.0314
40 0.0586
45 0.0980
50 0.1774
55 0.2460
60 0.3150
Annual Disability Rates per 100 Participants
LECO Members
95% of the disability rates stated above are assumed to be attributable to non-occupational disabilities, 4.5% are assumed to be attributable to non-total occupational disabilities, and 0.5% are assumed to be attributable to total occupational disabilities.

Employees Retirement System of Texas F - 10
Termination Decrements for Reasons Other Than Death or Retirement: Graded Tables Based on ERS Experience.
Rates of termination are zero for members eligible for service retirement. To account for active regular State employees and LECO members that accumulate additional eligibility service at retirement through converting sick/annual leave or other types of service purchases, termination rates are also set to zero in the year prior to first retirement eligibility. Rates for members not eligible for service retirement:
Active Regular State Employees
Eligibility
Service
Entry age 35 or
youngerEntry age over 35
0 25.25 19.63
1 21.24 16.07
2 17.88 13.26
3 15.07 11.08
4 12.76 9.42
5 10.86 8.16
6 9.33 7.21
7 8.09 6.49
8 7.10 5.94
9 6.31 5.50
10 5.67 5.11
11 5.15 4.75
12 4.71 4.39
13 4.32 4.03
14 3.97 3.66
15 3.64 3.29
16 3.30 2.95
17 2.97 2.69
18 2.62 2.53
19 2.27 1.00
20 1.92 1.00
21 1.59 1.00
22 1.29 1.00
23 1.05 1.00
24 0.89 1.00
25+ 0.85 1.00
Annual Rates of Termination per 100 Participants
Regular State Employees
Male and Female

Employees Retirement System of Texas F - 11
Active LECO Members
Eligibility
ServiceMale and Female
0 23.00
1 19.22
2 15.36
3 12.48
4 10.36
5 8.81
6 7.67
7 6.81
8 6.11
9 5.52
10 4.96
11 4.42
12 3.90
13 3.43
14 3.07
15 2.90
16 2.50
17 1.00
18 1.00
19+ 0.00
Annual Rates of Termination
per 100 Participants
LECO Members
Elected Class Members: 4 per 100 participants for members not eligible for service retirement
Withdrawal of Employee Contributions: Members that terminate with a vested benefit are assumed to choose the most valuable option available to them at the time of termination: withdrawal of contributions or deferred annuity.

Employees Retirement System of Texas F - 12
Percentage of Members Electing Various Benefit Options:
Sex / Benefit
Standard Life
Annuity Option 1 Option 4
Male Member
Disability 50% 50% 0%
Service Retirement
Non-LECO 100% 0% 0%
LECO 60% 40% 0%
Death Benefit Plan 0% 85% 15%
Female Member
Disability 75% 25% 0%
Service Retirement 100% 0% 0%
Death Benefit Plan 0% 70% 30%
The value of the Standard Service Retirement Life Annuity reflects the return of excess contributions payable as a lump sum death benefit in cases the annuity benefits paid are less than the member account balance at the time of retirement.
Beneficiary Characteristics: Males are assumed to be two years older than females.
Transfers from ERS to TRS:
Contributing ERS members:
It is assumed that 10% of regular State employees and LECO members who cease contributing to ERS and do not withdraw employee contributions will transfer ERS service credit to TRS at retirement.
Noncontributing ERS Members:
Records of ERS and TRS are matched by ERS staff to determine former ERS members who are currently contributing under TRS.
TRS Retirement Age:
Former ERS members who are, or are assumed to become, contributing TRS members are assumed to continue to earn service credit under TRS until first eligible for unreduced service retirement benefits, retire at that time, and transfer ERS service credit to TRS.

Employees Retirement System of Texas F - 13
Census Data and Assets
The valuation was based on members of ERS as of August 31, 2019 and does not take into account future members, with the exception of determining the funding period.
All census data was supplied by ERS and was subject to reasonable consistency checks.
There were data elements that were modified for some members as part of the valuation in order to make the data complete. However, the number of missing data items was immaterial.
Asset data was supplied by ERS.
Other Actuarial Valuation Procedures
No provision was made in this actuarial valuation for the limitations of Internal Revenue Code Sections 415 or 401(a)17.
Valuation payroll (earnings applied to the current valuation year) is the expected payroll for the fiscal year following the valuation date. It is based on reported payroll determined from August member contributions increased to reflect the across-the-board salary increases appropriated by the State legislature, effective on or after September 1, and projected according to the actuarial assumptions for the upcoming fiscal year.
No liability was included for benefits which are funded by special State appropriations.
State appropriations for membership fees are currently immaterial in relation to the overall payroll contributions and have been ignored.

14
SECTION G
DETAILED SUMMARIES OF MEMBERSHIP DATA

Employees Retirement System of Texas G - 1
Detailed Summaries of Membership Data
Table Page
Number
A G-2 Summary of Membership Data
B G-3 Active Members: Distribution by Age and Service (All Members)
C G-4 Active Members: Distribution by Age and Service (Regular State Employees)
D G-5 Active Members: Distribution by Age and Service (LECO Members)
E G-6 Active Members: Distribution by Age and Service (Elected Class Members)
F G-7 Retired and Beneficiary Members: Distribution by Age and Category (Excluding Deferred LECOSRF and ERS Reimbursing TRS Annuitants)
G G-8 Retired and Beneficiary Members: Distribution by Age and Category (LECOSRF Annuitants Deferred in ERS)
H G-9 Retired and Beneficiary Members: Distribution by Age and Category (Annuitants where ERS is Reimbursing TRS)

Employees Retirement System of Texas G - 2
Table A Summary of Membership Data
Item Male FemaleRegular State
Employees Elected Class LECO Members Total
Number of Members 60,160 81,705 105,242 327 36,296 141,865
Average Annual Salaries 52,628$ 46,710$ 50,510$ 68,245$ 45,305$ 49,220$
Average Age 43.6 43.5 44.4 53.3 41.0 43.5
Average Entry Age 35.0 35.3 35.8 44.8 33.2 35.1
Average Service 8.6 8.2 8.6 8.5 7.8 8.4
Item Number Annual AnnuitiesAverage
Annuities Average Age
Service Retirees* 103,934 2,220,477,648$ 21,364$ 69.1
Beneficiaries 8,984 136,091,676$ 15,148$ 74.1
Disability Retirees 2,237 20,832,936$ 9,313$ 67.4
Total 115,155 2,377,402,260$ 20,645$ 69.4 * Average Age and Service at Retirement for Service Retirees are 58.3 and 22.1, respectively
Item Number Annual AnnuitiesAverage
Annuities Average Age
Vested Members who are not Active at TRS 12,683 146,067,252$ 11,517$ 50.2
Vested Members who are Active at TRS 2,742 54,031,428$ 19,705$ 51.2
Total 15,425 200,098,680$ 12,972$ 50.4
Non-vested Members who are Active at TRS 11,220 36,011,016$ 3,210$ 44.8
Item Number Account BalancesAverage
Account Balance Average Age
Non-vested Members who are not Active at TRS 99,290 310,227,503$ 3,124$ 40.8
Non-vested Members who are Active at TRS 11,220 48,135,801$ 4,290$ 44.8 (this group assumed eligible for deferred annuities)
Total 110,510 358,363,305$ 3,243$ 41.2
Active Members
Annuitants
Inactive Members Assumed Eligible for Deferred Annuities
Non-vested Inactive Members
Updated 1/7/2020

Employees Retirement System of Texas G - 3
Table B
Active Members – All Members
Distribution by Age and Service
Age 0-4 5-9 10-14 15-19 20-24 25-29 30-34 35-39 40+ Total
Under 25 9,086 54 9,140
30,874$ 38,250$ 30,918$
25 - 29 12,344 1,854 39 14,237
39,725$ 44,981$ 41,924$ 40,415$
30 - 34 10,335 4,879 1,409 29 16,652
42,324$ 51,739$ 51,592$ 50,863$ 45,882$
35 - 39 8,393 4,505 3,847 976 77 17,798
43,391$ 52,847$ 58,743$ 59,632$ 56,979$ 50,052$
40 - 44 7,012 3,533 3,338 2,335 1,210 72 17,500
43,394$ 52,249$ 58,358$ 64,076$ 62,590$ 73,009$ 52,244$
45 - 49 6,407 3,453 3,115 2,577 2,975 1,434 56 20,017
43,422$ 51,152$ 55,528$ 61,856$ 65,107$ 65,890$ 77,076$ 53,939$
50 - 54 5,130 3,149 2,936 2,186 2,307 1,830 443 15 17,996
43,301$ 49,944$ 52,788$ 58,173$ 64,018$ 69,675$ 78,132$ 70,713$ 54,036$
55 - 59 4,221 2,931 2,620 2,027 1,514 982 508 135 7 14,945
42,721$ 48,814$ 51,130$ 56,886$ 60,705$ 69,228$ 81,025$ 80,321$ 56,390$ 52,523$
60 - 64 2,213 2,119 1,984 1,222 747 563 312 134 35 9,329
43,706$ 49,157$ 51,800$ 55,091$ 62,009$ 68,913$ 72,327$ 76,560$ 63,115$ 52,645$
Over 64 904 1,132 845 538 367 254 121 55 35 4,251
45,680$ 49,094$ 53,320$ 55,671$ 61,221$ 69,475$ 71,386$ 74,425$ 70,717$ 53,446$
Total 66,045 27,609 20,133 11,890 9,197 5,135 1,440 339 77 141,865
40,812$ 50,610$ 54,878$ 59,583$ 63,304$ 68,486$ 77,287$ 77,452$ 65,959$ 49,220$
Years of Service

Employees Retirement System of Texas G - 4
Table C
Active Members – Regular State Employees
Distribution by Age and Service
Age 0-4 5-9 10-14 15-19 20-24 25-29 30-34 35-39 40+ Total
Under 25 5,086 36 5,122
28,291$ 35,309$ 28,340$
25 - 29 8,704 1,057 19 9,780
39,631$ 43,709$ 38,535$ 40,070$
30 - 34 7,837 3,543 842 9 12,231
43,011$ 51,994$ 51,563$ 39,399$ 46,200$
35 - 39 6,379 3,496 2,813 570 54 13,312
44,736$ 54,238$ 59,582$ 58,618$ 56,426$ 51,010$
40 - 44 5,355 2,757 2,510 1,586 687 44 12,939
44,781$ 53,874$ 60,186$ 64,771$ 64,144$ 74,519$ 53,287$
45 - 49 4,948 2,671 2,365 1,811 1,923 873 42 14,633
44,677$ 52,656$ 57,241$ 63,321$ 66,496$ 66,976$ 74,220$ 54,754$
50 - 54 3,919 2,455 2,177 1,675 1,884 1,573 367 15 14,065
44,659$ 51,491$ 54,238$ 60,267$ 64,080$ 68,766$ 74,589$ 70,713$ 55,299$
55 - 59 3,296 2,276 2,053 1,605 1,307 899 466 129 7 12,038
44,233$ 50,401$ 52,712$ 58,827$ 61,988$ 69,577$ 80,428$ 78,939$ 56,390$ 54,391$
60 - 64 1,743 1,667 1,620 1,005 650 528 299 130 35 7,677
45,035$ 51,115$ 53,032$ 56,988$ 63,887$ 69,835$ 71,668$ 76,897$ 63,115$ 54,569$
Over 64 671 865 692 450 328 236 115 54 34 3,445
48,660$ 50,517$ 55,048$ 57,577$ 62,924$ 69,709$ 74,004$ 75,669$ 72,585$ 55,880$
Total 47,938 20,823 15,091 8,711 6,833 4,153 1,289 328 76 105,242
41,806$ 51,890$ 56,225$ 60,810$ 64,232$ 68,816$ 75,958$ 77,215$ 66,732$ 50,510$
Years of Service
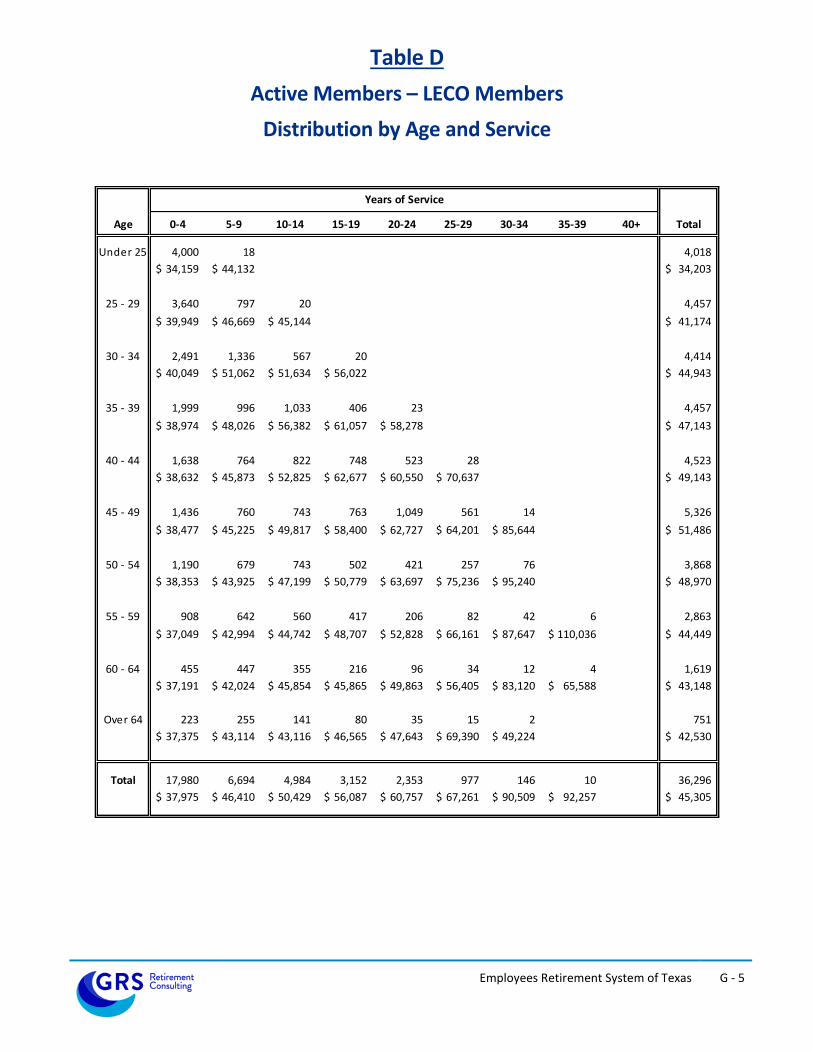
Employees Retirement System of Texas G - 5
Table D
Active Members – LECO Members
Distribution by Age and Service
Age 0-4 5-9 10-14 15-19 20-24 25-29 30-34 35-39 40+ Total
Under 25 4,000 18 4,018
34,159$ 44,132$ 34,203$
25 - 29 3,640 797 20 4,457
39,949$ 46,669$ 45,144$ 41,174$
30 - 34 2,491 1,336 567 20 4,414
40,049$ 51,062$ 51,634$ 56,022$ 44,943$
35 - 39 1,999 996 1,033 406 23 4,457
38,974$ 48,026$ 56,382$ 61,057$ 58,278$ 47,143$
40 - 44 1,638 764 822 748 523 28 4,523
38,632$ 45,873$ 52,825$ 62,677$ 60,550$ 70,637$ 49,143$
45 - 49 1,436 760 743 763 1,049 561 14 5,326
38,477$ 45,225$ 49,817$ 58,400$ 62,727$ 64,201$ 85,644$ 51,486$
50 - 54 1,190 679 743 502 421 257 76 3,868
38,353$ 43,925$ 47,199$ 50,779$ 63,697$ 75,236$ 95,240$ 48,970$
55 - 59 908 642 560 417 206 82 42 6 2,863
37,049$ 42,994$ 44,742$ 48,707$ 52,828$ 66,161$ 87,647$ 110,036$ 44,449$
60 - 64 455 447 355 216 96 34 12 4 1,619
37,191$ 42,024$ 45,854$ 45,865$ 49,863$ 56,405$ 83,120$ 65,588$ 43,148$
Over 64 223 255 141 80 35 15 2 751
37,375$ 43,114$ 43,116$ 46,565$ 47,643$ 69,390$ 49,224$ 42,530$
Total 17,980 6,694 4,984 3,152 2,353 977 146 10 36,296
37,975$ 46,410$ 50,429$ 56,087$ 60,757$ 67,261$ 90,509$ 92,257$ 45,305$
Years of Service

Employees Retirement System of Texas G - 6
Table E
Active Members – Elected Class Members
Distribution by Age and Service
Age 0-4 5-9 10-14 15-19 20-24 25-29 30-34 35-39 40+ Total
Under 25
25 - 29
30 - 34 7 7
83,086$ 83,086$
35 - 39 15 13 1 29
60,320$ 48,062$ 140,000$ 57,572$
40 - 44 19 12 6 1 38
62,786$ 84,667$ 51,467$ 7,200$ 66,446$
45 - 49 23 22 7 3 3 58
82,261$ 73,273$ 83,086$ 56,050$ 7,200$ 73,713$
50 - 54 21 15 16 9 2 63
70,438$ 69,173$ 115,100$ 80,978$ 73,600$ 83,086$
55 - 59 17 13 7 5 1 1 44
52,424$ 58,277$ 98,057$ 116,190$ 7,200$ 7,200$ 66,603$
60 - 64 15 5 9 1 1 1 1 33
86,880$ 33,760$ 64,583$ 140,938$ 7,200$ 7,200$ 140,000$ 71,169$
Over 64 10 12 12 8 4 3 4 1 1 55
30,960$ 73,600$ 73,600$ 39,500$ 40,400$ 51,467$ 7,200$ 7,200$ 7,200$ 50,022$
Total 127 92 58 27 11 5 5 1 1 327
67,359$ 66,304$ 86,601$ 71,927$ 31,345$ 33,760$ 33,760$ 7,200$ 7,200$ 68,245$
Years of Service
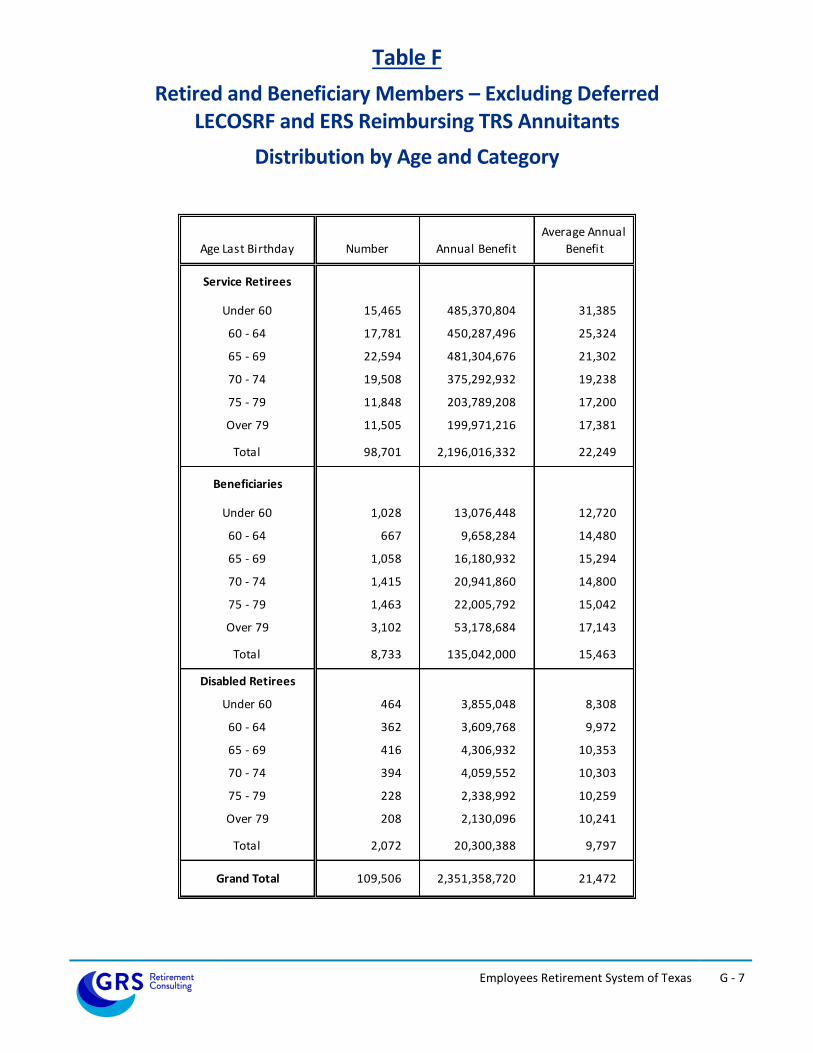
Employees Retirement System of Texas G - 7
Table F
Retired and Beneficiary Members – Excluding Deferred LECOSRF and ERS Reimbursing TRS Annuitants
Distribution by Age and Category
Age Last Birthday Number Annual Benefit
Average Annual
Benefit
Service Retirees
Under 60 15,465 485,370,804 31,385
60 - 64 17,781 450,287,496 25,324
65 - 69 22,594 481,304,676 21,302
70 - 74 19,508 375,292,932 19,238
75 - 79 11,848 203,789,208 17,200
Over 79 11,505 199,971,216 17,381
Total 98,701 2,196,016,332 22,249
Beneficiaries
Under 60 1,028 13,076,448 12,720
60 - 64 667 9,658,284 14,480
65 - 69 1,058 16,180,932 15,294
70 - 74 1,415 20,941,860 14,800
75 - 79 1,463 22,005,792 15,042
Over 79 3,102 53,178,684 17,143
Total 8,733 135,042,000 15,463
Disabled Retirees
Under 60 464 3,855,048 8,308
60 - 64 362 3,609,768 9,972
65 - 69 416 4,306,932 10,353
70 - 74 394 4,059,552 10,303
75 - 79 228 2,338,992 10,259
Over 79 208 2,130,096 10,241
Total 2,072 20,300,388 9,797
Grand Total 109,506 2,351,358,720 21,472

Employees Retirement System of Texas G - 8
Table G
Retired and Beneficiary Members – LECOSRF Annuitants Deferred in ERS
Distribution by Age and Category
Age Last Birthday Number Annual Benefit
Average Annual
Benefit
All Participants
Under 45 0 0 0
45 - 49 4 75,180 18,795
Total 4 75,180 18,795
Grand Total 4 75,180 18,795

Employees Retirement System of Texas G - 9
Table H
Retired and Beneficiary Members – Annuitants where ERS is Reimbursing TRS
Distribution by Age and Category
Age Last Birthday Number Annual Benefit
Average Annual
Benefit
Service Retirees
and Beneficiaries
Under 60 441 2,954,388 6,699
60 - 64 888 4,919,724 5,540
65 - 69 1,595 7,999,164 5,015
70 - 74 1,308 5,497,248 4,203
75 - 79 817 2,803,452 3,431
Over 79 431 1,261,836 2,928
Total 5,480 25,435,812 4,642
Disabled Retirees
Under 60 50 232,212 4,644
60 - 64 37 113,976 3,080
65 - 69 34 75,768 2,228
70 - 74 30 91,152 3,038
75 - 79 13 17,220 1,325
Over 79 1 2,220 2,220
Total 165 532,548 3,228
Grand Total 5,645 25,968,360 4,600

10
SECTION H
GLOSSARY

Employees Retirement System of Texas H - 1
Glossary
Actuarial Accrued Liability (AAL): That portion, as determined by a particular Actuarial Cost Method, of the Actuarial Present Value of Future Plan Benefits which is not provided for by future Normal Costs. It is equal to the Actuarial Present Value of Future Plan Benefits minus the actuarial present value of future Normal Costs. Actuarial Assumptions: Assumptions as to future experience under the Fund. These include assumptions about the occurrence of future events affecting costs or liabilities, such as:
mortality, withdrawal, disablement, and retirement;
future increases in salary;
future rates of investment earnings and future investment and administrative expenses;
characteristics of members not specified in the data, such as marital status;
characteristics of future members;
future elections made by members; and
other relevant items. Actuarial Cost Method or Funding Method: A procedure for allocating the Actuarial Present Value of Future Benefits to various time periods; a method used to determine the Normal Cost and the Actuarial Accrued Liability. These items are used to determine the ADC. Actuarial Gain or Actuarial Loss: A measure of the difference between actual experience and that expected based upon a set of Actuarial Assumptions, during the period between two Actuarial Valuation dates. Through the actuarial assumptions, rates of decrements, rates of salary increases, and rates of fund earnings have been forecasted. To the extent that actual experience differs from that assumed, Actuarial Accrued Liabilities emerge which may be the same as forecasted, or may be larger or smaller than projected. Actuarial gains are due to favorable experience, e.g., the Fund's assets earn more than projected, salaries do not increase as fast as assumed, members retire later than assumed, etc. Favorable experience means actual results produce actuarial liabilities not as large as projected by the actuarial assumptions. On the other hand, actuarial losses are the result of unfavorable experience, i.e., actual results that produce actuarial liabilities which are larger than projected. Actuarial gains will shorten the time required for funding of the actuarial balance sheet deficiency while actuarial losses will lengthen the funding period. Actuarially Equivalent: Of equal actuarial present value, determined as of a given date and based on a given set of Actuarial Assumptions. Actuarial Present Value (APV): The value of an amount or series of amounts payable or receivable at various times, determined as of a given date by the application of a particular set of Actuarial Assumptions. For purposes of this standard, each such amount or series of amounts is:
a. adjusted for the probable financial effect of certain intervening events (such as changes in compensation levels, marital status, etc.),
b. multiplied by the probability of the occurrence of an event (such as survival, death, disability, termination of employment, etc.) on which the payment is conditioned, and
c. discounted according to an assumed rate (or rates) of return to reflect the time value of money.

Employees Retirement System of Texas H - 2
Actuarial Present Value of Future Plan Benefits: The Actuarial Present Value of those benefit amounts which are expected to be paid at various future times under a particular set of Actuarial Assumptions, taking into account such items as the effect of advancement in age and past and anticipated future compensation and service credits. The Actuarial Present Value of Future Plan Benefits includes the liabilities for active members, retired members, beneficiaries receiving benefits, and inactive, nonretired members either entitled to a refund or a future retirement benefit. Expressed another way, it is the value that would have to be invested on the valuation date so that the amount invested plus investment earnings would be provide sufficient assets to pay all projected benefits and expenses when due.
Actuarial Valuation: The determination, as of a valuation date, of the Normal Cost, Actuarial Accrued Liability, Actuarial Value of Assets, and related Actuarial Present Values for a plan. An Actuarial valuation for a governmental retirement system typically also includes calculations of items needed for compliance with GASB.
Actuarial Value of Assets or Valuation Assets: The value of the Fund’s assets as of a given date, used by the actuary for valuation purposes. This may be the market or fair value of plan assets, but commonly actuaries use a smoothed value in order to reduce the year-to-year volatility of calculated results, such as the funded ratio and the ADC.
Actuarially Determined: Values which have been determined utilizing the principles of actuarial science. An actuarially determined value is derived by application of the appropriate actuarial assumptions to specified values determined by provisions of the law.
Amortization Method: A method for determining the Amortization Payment. The most common methods used are level dollar and level percentage of payroll. Under the Level Dollar method, the Amortization Payment is one of a stream of payments, all equal, whose Actuarial Present Value is equal to the UAAL. Under the Level Percentage of Pay method, the Amortization payment is one of a stream of increasing payments, whose Actuarial Present Value is equal to the UAAL. Under the Level Percentage of Pay method, the stream of payments increases at the assumed rate at which total covered payroll of all active members will increase.
Amortization Payment: That portion of the pension plan contribution or ADC which is designed to pay interest on and to amortize the Unfunded Actuarial Accrued Liability.
Actuarially Determined Contribution (ADC) or Annual Required Contribution (ARC): A calculated contribution for a defined benefit pension plan for the reporting period, most often determined based on the funding policy of the plan. Typically the calculated contribution has a normal cost payment and an amortization payment.
Closed Amortization Period: A specific number of years that is counted down by one each year and therefore declines to zero with the passage of time. For example if the amortization period is initially set at 30 years, it is 29 years at the end of one year, 28 years at the end of two years, etc. See Funding Period and Open Amortization Period.
Decrements: Those causes/events due to which a member’s status (active-inactive-retiree-beneficiary) changes, that is: death, retirement, disability, or termination.
Defined Benefit Plan: An employer-sponsored retirement benefit that provides workers, upon attainment of designated age and service thresholds, with a monthly benefit based on the employee’s salary and length of service. The value of a benefit from a defined benefit plan is generally not affected by the return on the assets that are invested to fund the benefit.

Employees Retirement System of Texas H - 3
Defined Contribution Plan: A retirement plan, such as a 401(k) plan, a 403(b) plan, or a 457 plan, in which the contributions to the plan are assigned to an account for each member, and the plan’s earnings are allocated to each account, and each member’s benefits are a direct function of the account balance. Employer Normal Cost: The portion of the Normal Cost to be paid by the employers. This is equal to the Normal Cost less expected member contributions. Experience Study: A periodic review and analysis of the actual experience of the Fund which may lead to a revision of one or more actuarial assumptions. Actual rates of decrement and salary increases are compared to the actuarially assumed values and modified as deemed appropriate by the Actuary. Funded Ratio: The ratio of the actuarial value of assets (AVA) to the actuarial accrued liability (AAL). Plans sometimes calculate a market funded ratio, using the market value of assets (MVA), rather than the AVA. Funding Period or Amortization Period: The term “Funding Period” is used it two ways. In the first sense, it is the period used in calculating the Amortization Payment as a component of the ADC. This funding period is chosen by the Board of Trustees. In the second sense, it is a calculated item: the number of years in the future that will theoretically be required to amortize (i.e., pay off or eliminate) the Unfunded Actuarial Accrued Liability, based on the statutory employer contribution rate, and assuming no future actuarial gains or losses. GASB: The Governmental Accounting Standards Board is an organization that exists in order to promulgate accounting standards for governmental entities. Normal Cost: That portion of the Actuarial Present Value of pension plan benefits and expenses which is allocated to a valuation year by the Actuarial Cost Method. Any payment in respect of an Unfunded Actuarial Accrued Liability is not part of Normal Cost (see Amortization Payment). For pension plan benefits which are provided in part by employee contributions, Normal Cost refers to the total of employee contributions and employer Normal Cost unless otherwise specifically stated. Under the entry age normal cost method, the Normal Cost is intended to be the level cost (when expressed as a percentage of pay) needed to fund the benefits of a member from hire until ultimate termination, death, disability or retirement. Open Amortization Period: An open amortization period is one which is used to determine the Amortization Payment but which does not change over time. In other words, if the initial period is set as 30 years, the same 30-year period is used in determining the Amortization Period each year. In theory, if an Open Amortization Period is used to amortize the Unfunded Actuarial Accrued Liability, the UAAL will never completely disappear, but will become smaller each year, either as a dollar amount or in relation to covered payroll. Unfunded Actuarial Accrued Liability: The excess of the Actuarial Accrued Liability over the Actuarial Value of Assets. This value may be negative in which case it may be expressed as a negative Unfunded Actuarial Accrued Liability, also called the Funding Surplus. Valuation Date or Actuarial Valuation Date: The date as of which the value of assets is determined and as of which the Actuarial Present Value of Future Plan Benefits is determined. The expected benefits to be paid in the future are discounted to this date.

4
SECTION I
LAW ENFORCEMENT AND CUSTODIAL OFFICER (LECO) PLAN
ACCOUNTING
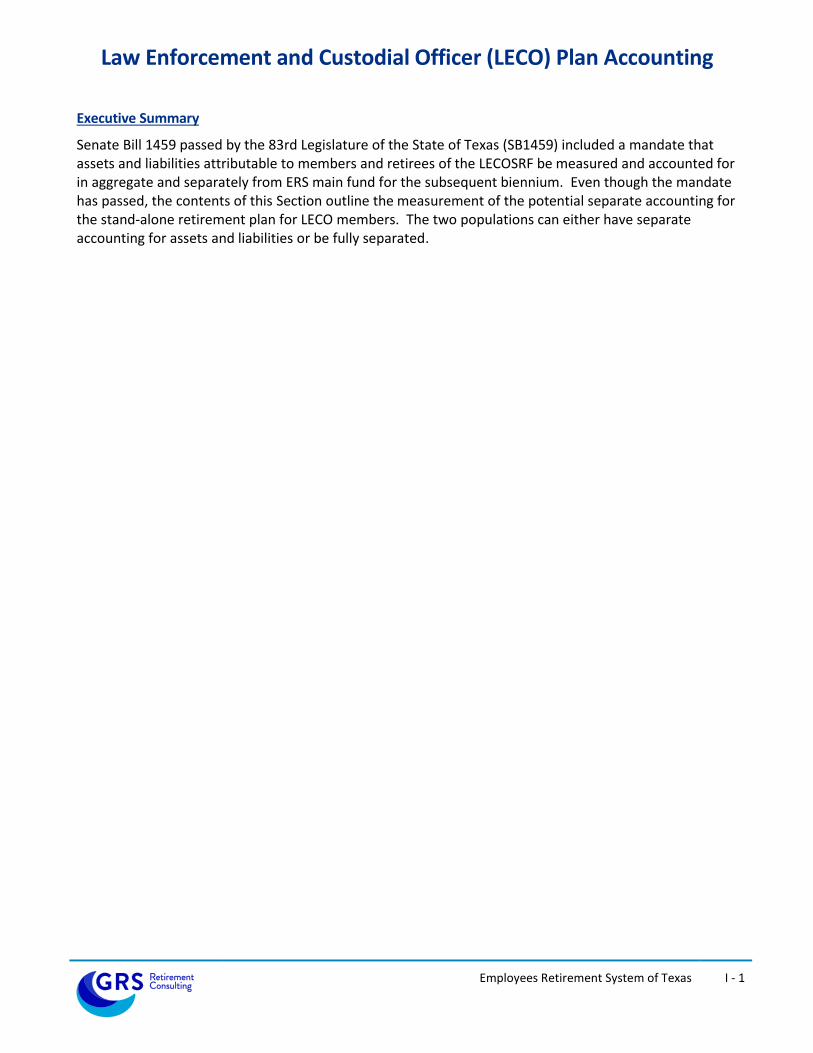
Employees Retirement System of Texas I - 1
Law Enforcement and Custodial Officer (LECO) Plan Accounting
Executive Summary
Senate Bill 1459 passed by the 83rd Legislature of the State of Texas (SB1459) included a mandate that assets and liabilities attributable to members and retirees of the LECOSRF be measured and accounted for in aggregate and separately from ERS main fund for the subsequent biennium. Even though the mandate has passed, the contents of this Section outline the measurement of the potential separate accounting for the stand-alone retirement plan for LECO members. The two populations can either have separate accounting for assets and liabilities or be fully separated.

Employees Retirement System of Texas I - 2
Summary of Results
Membership
• Number of
- Active members 105,569 36,296
- Retirees and beneficiaries* 95,443 19,712
- Inactive, vested* 13,842 1,583
- Inactive, nonvested* 91,854 18,656
- Total 306,708 76,247
• Valuation Payroll 5,340,184,997$ 1,644,391,700$
Statutory contribution rates
• Members 9.50% 10.00%
• Employers 0.50% 0.50%
• State 9.50% 10.00%
Total Payroll Contribution Rate 19.50% 20.50%
• Expected contributions from
court fees N/A $17.1 million per year
Actuarially Sound Rate (funds normal cost
and amortizes unfunded accrued liability
over 31 years, per Section 811.006 of the
Texas Government Code)
- Total Contribution Rate 22.55% 29.19%
- In addition to Court Fees 22.55% 28.44%
-3.05% -7.94%
Assets
• Market value (MVA) 22,593,263,608$ 5,701,583,194$
• Actuarial value (AVA) 23,178,841,628$ 5,849,408,346$
Actuarial Information on AVA (smoothed)
• Normal cost % 13.49% 16.71%
• Total normal cost 720,390,956$ 274,777,853$
• Actuarial accrued liability 31,775,861,102$ 9,508,132,778$
• Unfunded actuarial accrued
liability (UAAL) 8,597,019,474$ 3,658,724,432$
• Funded ratio 72.9% 61.5%
• Funding period (years) Never Never
Actuarial Information on MVA
• Unfunded actuarial accrued
liability (UAAL) 9,182,597,494$ 3,806,549,584$
• Funded ratio 71.1% 60.0%
• Funding period (years) Never Never
* Annuitants with at least 10 years of CPO service are identified as LECO annuitants. Inactive members with at
least three-fourths of total service certified as CPO service are identified as LECO inactive members. These
headcounts are shown for i l lustration purposes and do not directly relate to the methods used to allocate
individual l iabilities to the two resulting plans.
Item
Contribution Rate Sufficiency (Negative
figures indicates contribution shortfall)
Law Enforcement and
Custodial OfficersRegular Class

Employees Retirement System of Texas I - 3
Methodology for the LECO Plan
The goal was to re-assemble these plans for LECO members and regular State (non-LECO) employees as if they had been separate plans from the beginning. In broad terms, the methodology for structuring the proposed stand-alone retirement plan for LECO members can be described as: allocation of ERS liabilities, allocation of ERS assets, and addition of LECOSRF. Allocation of ERS Liabilities
The first step is to determine the plan liabilities for each resulting plan. ERS plan liabilities for currently contributing LECO members were attributed to the new LECO plan. Liabilities for individual annuitants and non-contributing members were attributed to the new LECO plan based on the proportion of their CPO-service relative to their total ERS plan service. The remaining ERS plan liabilities would remain in the regular State (non-LECO) employees plan. Adjusted Plan Liability for Purposes of Allocating Assets
LECO members are eligible for enhanced benefits at earlier ages with less reduction for early retirement; therefore, these benefits are more valuable than the benefits available to regular State (non-LECO) employees. Even though LECO members received more valuable benefits from the ERS plan, contributions for these members (State contributions and member contributions) to the ERS plan have historically been the same percentage of payroll as the contributions for regular State (non-LECO) employees. Solely for the purpose of allocating the plan assets, current ERS plan liabilities for LECO members were re-cast, or adjusted, to approximate the plan liabilities as if LECO members received the same benefits as regular State (non-LECO) employees. Allocation of Assets
Adjusted ERS plan liabilities of annuitants and non-contributing members in both of the resulting plans were fully funded with ERS assets at market value. There is precedence for first allocating assets to retiree liabilities in corporate plan spinoffs. In a sense, retiree liabilities have the highest “demand” for assets since benefit payments are already being made. The remaining assets were allocated evenly across the adjusted ERS plan liabilities for contributing members in both of the resulting plans. The ratio of actuarial to market value of assets was applied to the market-value asset allocation to arrive at the final actuarial value asset allocation.

Employees Retirement System of Texas I - 4
Impact of LECOSRF
The final step in allocating the liabilities and assets for a stand-alone plan for LECO members is to combine the allocated LECO liabilities and assets from the ERS plan with the liabilities and assets of the Law Enforcement and Custodial Officer Supplemental Retirement Fund (LECOSRF). Financing of Restructured Plans
Based on the results of the August 31, 2019 actuarial valuations of the ERS plan and LECOSRF, neither plan was considered actuarially sound. In this context, an actuarially sound retirement plan receives a total contribution rate sufficient to cover the normal cost, administrative expenses, and amortize the unfunded actuarial accrued liability over a period of 31 years, or less. Based on the allocation of liabilities and assets outlined in this Section, neither the stand-alone LECO plan nor the regular State (non-LECO) employees plan would be considered actuarially sound as of August 31, 2019. Administrative Considerations
The asset allocation outlined in this Section is only one of many “reasonable” asset allocations. Actuarial standards of practice give guidance on how to assess the actuarial soundness of a proposed allocation, but they do not prescribe a particular methodology for allocation of the assets in a situation such as this. As previously noted, there are detailed rules regarding the allocation of assets in corporate plan spinoffs, but there is very little precedent for public pension plans. There is supporting rationale for this allocation method, but there are other methods which could also be supported.

Law Enforcement and Custodial Officer Supplemental Retirement Fund of the Employees Retirement System of Texas Annual Actuarial Valuation - Funding As of August 31, 2019

December 4, 2019
Board of Trustees Employees Retirement System of Texas 200 East 18th Street Austin, TX 78701 Re: Actuarial Valuation for Funding Purposes as of August 31, 2019
Members of the Board:
We certify that the information contained in this report is accurate and fairly presents the actuarial position of the Law Enforcement and Custodial Officer Supplemental Retirement Fund (LECOSRF) of the Employees Retirement System of Texas as of August 31, 2019. This report was prepared at the request of the Board and is intended for use by ERS staff and those designated or approved by the Board. This report may be provided to parties other than ERS only in its entirety and only with the permission of the Board.
Actuarial Valuation
The primary purposes of the actuarial valuation report are to determine the adequacy of the current State and employer contribution rates, describe the current financial condition of LECOSRF, analyze changes in the condition of LECOSRF, and provide various summaries of the data.
The current financial outlook for LECOSRF is very poor. It is important to understand that the currently scheduled contributions are not expected to accumulate sufficient assets in order to pay all of the currently scheduled benefits when due. Based on current expectations and assumptions, LECOSRF is projected to remain solvent until the year 2043.
Plan Provisions
Our actuarial valuation as of August 31, 2019 reflects the benefit and contribution provisions set forth in Chapters 811 through 815 of the Texas Government Code with respect to the amounts payable from the Law Enforcement and Custodial Officer Supplemental Retirement Fund. The current plan provisions are outlined in Section E of this report.
Actuarial Assumptions and Methods
The assumptions and methods applied in this actuarial valuation were adopted by the Board of Trustees on August 23, 2017 based on the experience investigation that covered the five-year period from September 1, 2011 through August 31, 2016. Additionally, this actuarial valuation incorporates the notable across-the-board pay increases budgeted by the State Legislature when they are granted for the current biennium. The current actuarial assumptions and methods are outlined in Section F of this report.

Board of Trustees December 4, 2019 Page 2
Data
The valuation was based upon information as of August 31, 2019, furnished by ERS staff, concerning system benefits, financial transactions, plan provisions and active members, terminated members, retirees and beneficiaries. We checked for internal and year-to-year consistency, but did not audit the data. We are not responsible for the accuracy or completeness of the information provided by ERS staff.
Certification
All of our work conforms with generally accepted actuarial principles and practices, and to the Actuarial Standards of Practice issued by the Actuarial Standards Board. In our opinion, our calculations also comply with the requirements of, where applicable, the Internal Revenue Code and ERISA.
The signing actuaries are independent of the plan sponsor. Mr. Falls, Mr. Newton and Ms. Woolfrey are Enrolled Actuaries and Fellows of the Society of Actuaries, and all of the undersigned are Members of the American Academy of Actuaries, and meet the Qualification Standards of the American Academy of Actuaries. Finally, each of the undersigned are experienced in performing valuations for large public retirement systems.
Respectfully submitted,
Gabriel, Roeder, Smith & Company
R. Ryan Falls, FSA, EA, MAAA Joseph P. Newton, FSA, EA, MAAA
Senior Consultant & Actuary Pension Market Leader & Actuary
Dana Woolfrey, FSA, EA, MAAA Thomas J. Bevins, ASA, MAAA
Consultant & Actuary Actuary

Law Enforcement and Custodial Officer Supplemental Retirement Fund of the Employees Retirement System of Texas
Table of Contents
Section
Cover Letter
Section A Executive Summary
Section B Discussion
Section C Tables
1 - Development of Employer Cost
2 - Actuarial Present Value of Future Benefits
3 - Analysis of Normal Cost
4 - Historical Summary of Active Member Data
5 - Reconciliation of Plan Net Assets
6 - Development of Actuarial Value of Assets
7 - History of Investment Return Rates
8 - History of Cash Flow
9 - Total Experience Gain or Loss
10 - Solvency Test
11 - Historical Contribution Rates
Section D Risks Associated with Measuring the Accrued Liability and Actuarially Determined Contribution
Section E Summary of Plan Provisions
Section F Summary of Actuarial Assumptions and Methods
Section G Detailed Summaries of Membership Data
Section H Glossary

SECTION A
EXECUTIVE SUMMARY

Law Enforcement and Custodial Officer Supplemental Retirement Fund of the Employees Retirement System of Texas
A - 1
Executive Summary
2019 2018
Membership
• Number of
- Active members 36,296 37,167
- Retirees and beneficiaries 13,981 13,080
- Inactive, vested 111 104
- Inactive, nonvested 22,096 19,738
- Total 72,484 70,089
• Valuation Payroll 1,644,391,700$ 1,684,457,747$
Statutory contribution rates FY 2020 FY 2019
• Members 0.50% 0.50%
• State 0.50% 0.50%
• Expected annual contributions
from court fees $17.1 million $18.1 million
Actuarially Sound Rate (funds normal cost
and amortizes unfunded accrued liability
over 31 years, per Section 811.006 of the
Texas Government Code)
- Total Contribution Rate 3.91% 3.76%
- In addition to Court Fees 3.14% 2.99%
Assets
• Market value (MVA) 943,622,645$ 966,827,735$
• Actuarial value (AVA) 968,129,751$ 953,054,283$
• Return on market value (gross) 3.04% 9.58%
Return on market value (net) 3.00% 9.54%
• Return on actuarial value 7.0% 7.9%
Actuarial Information on AVA - smoothed
• Normal cost % 2.08% 2.09%
• Total normal cost 34,203,347$ 35,205,167$
• Actuarial accrued liability 1,482,635,202$ 1,452,657,797$
• Unfunded actuarial accrued
liability (UAAL) 514,505,451$ 499,603,514$
• Funded ratio 65.3% 65.6%
• Funding period (years) Never Never
Actuarial Information on MVA
• Unfunded actuarial accrued
liability (UAAL) 539,012,557$ 485,830,062$
• Funded ratio 63.6% 66.6%
Item

Law Enforcement and Custodial Officer Supplemental Retirement Fund of the Employees Retirement System of Texas
A - 2
The following chart illustrates the recent history and outlook of the funded status of LECOSRF over the next five years:
August 31, 2015 2016 2017 2018 2019 2020 2021 2022 2023 2024
Funded
Ratio
72.0%
71.1%
66.0%
65.6%
65.3%
63.6%
61.8%
59.8%
57.8%
56.0%
UAAL
(in millions) $353 $379 $476 $500 $515 $562 $612 $666 $724 $780
ASC* 3.01% 2.33% 2.87% 2.99% 3.14% 3.28% 3.41% 3.54% 3.68% 3.81%
* For 2016 and thereafter, the stated Actuarially Sound Contribution rate is the contribution necessary to be actuarially sound based on the 31-year standard in addition to expected annual contribution from court fees. Prior to 2016, the expected court fees were included in the ASC as 1.20% of pay.
The projections beyond 2019 are based on the same assumptions, methods and provisions used for the August 31, 2019 valuation, which include the notable across-the-board pay increases budgeted by the State Legislature when they are granted and the assumptions adopted by the Board in August 2017. Additionally, the market value of assets is expected to earn 7.5% per year.
It is important to understand that the currently scheduled contributions are not expected to accumulate sufficient assets in order to pay all of the currently scheduled benefits when due. Based on current expectations and assumptions, LECOSRF is projected to have money in the trust fund until the year 2043. After which, the funding would revert to a pay-as-you-go status. When LECOSRF reverts to a pay-as-you-go status, the required Legislative appropriation for LECOSRF will immediately increase to 11 times the current State contribution rate, not including contributions from court fees, in order to ensure all retirees continue to receive their promised benefit.
Given this outlook, we recommend the Legislature increase the contribution rates to LECOSRF.
50%
55%
60%
65%
70%
75%
80%
85%
90%
95%
100%
2015 2016 2017 2018 2019 2020 2021 2022 2023 2024
Historical and Future Projected Funded Ratios As of August 31

SECTION B
DISCUSSION

Law Enforcement and Custodial Officer Supplemental Retirement Fund of the Employees Retirement System of Texas
B - 1
Discussion
Introduction The results of the August 31, 2019 actuarial valuation of the Law Enforcement and Custodial Officer Supplemental Retirement Fund (LECOSRF) of the Employees Retirement System (ERS) of Texas are presented in this report. The primary purposes of this actuarial valuation report are to determine the adequacy of the current State and employer contribution rates, describe the current financial condition of LECOSRF, analyze the changes in the condition of LECOSRF, and provide various summaries of the data. The total contribution rate for the current fiscal year is less than the normal cost by 0.04% of payroll, which, on both an actuarial and market value of assets basis, is not sufficient to amortize the unfunded liability over a finite period of time. As a result, the UAAL is expected to grow indefinitely and the funding objective is not currently being realized. Based on current expectations and assumptions, LECOSRF is expected to remain solvent until the year 2043, after which the funding would revert to a pay-as-you-go status. All of the tables referenced in the following discussion appear in Section C of this report. Plan Provisions There were no changes to the plan provisions during the past year. The current plan provisions are outlined in Section E of this report. Actuarial Assumptions and Methods The assumptions and methods applied in this actuarial valuation were adopted by the Board of Trustees on August 23, 2017 based on the experience investigation that covered the five-year period from September 1, 2011 through August 31, 2016. We believe the assumptions are internally consistent and are reasonable, based on the actual experience of LECOSRF. The actuarial valuation as of August 31, 2019 incorporates the notable across-the-board pay increases budgeted by the State Legislature when they are granted for the current biennium. Specifically, employees were assumed to receive no across-the-board increase on September 1, 2019 or September 1, 2020. The results of the actuarial valuation are dependent upon the actuarial assumptions used. Actual results can and almost certainly will differ, as actual experience deviates from the assumptions. Even seemingly minor changes in the assumptions can materially change the liabilities, calculated contribution rates and funding periods. A review of the impact of a different set of assumptions on the funded status of LECOSRF is outside the scope of this actuarial valuation. The current actuarial assumptions and methods are outlined in Section F of this report.
Law Enforcement and Custodial Officer Supplemental Retirement Fund of the Employees Retirement System of Texas
B - 2
Funding Adequacy The Board of Trustees of ERS approved the Pension Funding Priorities and Guidelines on May 23, 2018. For the Board, adoption of this policy was intended to:
• enhance communications and provide transparency to the Legislature and plan members and retirees regarding Board of Trustees’ positions on plan funding strategy;
• provide policy guidance to current and future Boards; and • ensure that legislators, elected officials and other stakeholders have clear and accurate
information about the Trust’s funding goals and the needs of the Board in supporting sound fiduciary investment decisions in accordance with Texas Government Code Section 815.106.
This policy also stated that the main objective of ERS’ retirement programs is to fully fund the long-term cost of benefits provided by statute, through disciplined and timely accumulation of contributions and prudent investment of assets to deliver earned benefits on a continuing basis. In support of this objective, the policy laid out a multi-level funding period goal to gradually achieve funding on sound actuarial principles:
1. Avoid trust fund depletion of the pre-funded plans, 2. Meet current statutory standard of a 31-year funding period for unfunded liabilities, per Texas
Government Code Sections 811.006 and 840.106, and 3. Match funding period to the average years of service at retirement once a 31-year funding period is
achieved, and closed. The member contribution rates are established by State statute and the State contribution rate is set by State statute and legislative appropriation. For the fiscal year beginning September 1, 2019, members contribute 0.50% of payroll and the State contributes 0.50% of payroll. LECOSRF also receives a portion of the court fees collected under Section 133.102 of the Local Government Code. The contribution from this source is expected to be approximately $17.1 million for fiscal year 2020 and all subsequent years. It should be noted that level dollar contributions from court fees in future years will result in total contributions that are not expected to remain level as a percent of payroll over time. For fiscal year 2020, the contribution from court fees is expected to be approximately 1.04% of payroll. The unfunded actuarial accrued liability (UAAL) of LECOSRF increased from $500 million as of August 31, 2018 to $515 million as of August 31, 2019. Additionally, the funded ratio of LECOSRF—actuarial value of assets divided by the actuarial accrued liability—decreased from 65.6% to 65.3% as of August 31, 2019. This decrease was smaller than expected due to liability gains. The funded status is one of many metrics used to show trends and develop future expectations about the health of a retirement system. The funded status measure itself is not appropriate for assessing the sufficiency of plan assets to cover the estimated cost of settling the plan’s benefit obligations or assessing the need for or the amount of future contributions since it does not reflect normal cost contributions, the timing of amortization payments, or future experience other than expected. The valuation shows that the total normal cost for funding purposes is 2.08% of payroll. The approximate total contribution rate is currently 2.04% of payroll. Thus, the total contribution rate for the current fiscal year is less than the normal cost by 0.04% of payroll and no payment will be available to amortize the unfunded liability. As the number of members eligible for the newest benefit provisions increases over time, the normal cost rate is expected to decrease. However, the projected contributions are not expected to exceed the normal cost in any year and will not be sufficient to eliminate the unfunded liability over a

Law Enforcement and Custodial Officer Supplemental Retirement Fund of the Employees Retirement System of Texas
B - 3
finite period of time. Assuming the market value of assets earns 7.50% per year, LECOSRF is projected to remain solvent until the year 2043, after which the funding would revert to a pay-as-you-go status. As a result, the first level of the Board’s funding period goal is not currently being realized. The second level of the Board’s funding period goal is to fund the sum of the normal cost and the amount necessary to amortize any unfunded actuarial accrued liability over a period that does not exceed 30 years by one or more years. Further, Section 811.006 of the Texas Government Code limits the modifications to LECOSRF that would, essentially, increase benefits or lower contributions to the trust unless the current level of benefits and contributions are expected to amortize any unfunded actuarial accrued liability over a period that does not exceed 30 years by one or more years. In this context, the Actuarially Sound Contribution (ASC) rate is the contribution rate that meets this standard. Based on the actuarial valuation as of August 31, 2019, the ASC rate for LECOSRF is 3.14% of payroll in addition to the expected annual contributions from court fees of $17.1 million. Based on the current approximate total contribution rate of 2.04% of payroll, the second level of the Board’s funding period goal is also not currently being realized. The ASC is currently calculated based on a 31-year open amortization period. This means that the ASC will always be calculated with the same 31-year period and the UAAL would never completely be eliminated. We recommend that the Board seek a plan funding strategy that meets the third level of the Board’s funding period goal or meets an ultimate goal of eliminating the UAAL by a certain date. System Assets This report contains several tables that summarize key information with respect to the LECOSRF assets. The total market value of assets decreased from $967 million to $944 million as of August 31, 2019. Table 5 reconciles the changes in the fund during the year. Total contributions decreased slightly from $35.4 million to $35.0 million. Contributions for fiscal year 2020 are anticipated to be approximately 2.04% of pay. Contributions in subsequent years are expected to increase in dollar amount, but at a declining percentage of pay since contributions from court fees are expected to remain level. Table 6 shows the development of the Actuarial Value of Assets (AVA). The current AVA method recognizes each year’s gain or loss over a closed five year period and allows for direct offsetting of gains and losses. The AVA increased from $953 million to $968 million as of August 31, 2019. When measured on a market value, the approximate gross investment return for the fiscal year ending August 31, 2019 was 3.04%, and the return net of investment expenses was 3.00%. When measured on an actuarial value, the net investment return was 7.0%. Table 7 shows a history of return rates. The LECOSRF ten-year average market return, gross of all expenses as reported by the ERS Master Trust Custodian, is 8.20%. The ten-year average return net of investment expenses is 8.09%. Table 8 provides a history of the contributions paid into LECOSRF and the administrative expenses and benefit payments that have been paid out of LECOSRF. This table shows that LECOSRF paid administrative expenses and benefit payments, in excess of contributions received, of $42.1 million (or 4.4% of assets) in fiscal year 2018 and that amount was $49.5 million (or 5.2% of assets) in fiscal year 2019. ERS should continue to monitor this deficit as it could impact the future liquidity needs of LECOSRF. Table 11 provides a history of contribution rates, as a percent of payroll, paid into the trust by the state, agencies, and members. This table also shows a history of the total normal cost and the Actuarially Sound Contribution rate (ASC).

Law Enforcement and Custodial Officer Supplemental Retirement Fund of the Employees Retirement System of Texas
B - 4
Data The valuation was based upon information as of August 31, 2019, furnished by ERS staff, concerning system benefits, financial transactions, plan provisions and active members, terminated members, retirees and beneficiaries. We checked for internal and year-to-year consistency, but did not audit the data. We are not responsible for the accuracy or completeness of the information provided by ERS staff. The tables in Section G show key census statistics for the various groups included in the valuation.

SECTION C
TABLES

Law Enforcement and Custodial Officer Supplemental Retirement Fund of the Employees Retirement System of Texas
C - 1
Table 1 Development of Employer Cost
August 31, 2019 August 31, 2018
1. Payroll
a. Reported Payroll (August Payroll of Active Members) 1,644,391,700$ 1,684,457,747$
b. Valuation Payroll (Expected Covered Payroll for
Following Plan Year) 1,644,391,700 1,684,457,747
2. Total Normal Cost Rate
a. Gross normal cost rate 2.00% 2.01%
b. Administrative expenses 0.08% 0.08%
c. Total (Item 2a + Item 2b) 2.08% 2.09%
3. Actuarial Accrued Liability for Active Members
a. Present value of future benefits for active members 875,578,522$ 925,458,206$
b. Less: present value of future normal costs (238,344,568) (248,827,732)
c. Actuarial accrued liability 637,233,954$ 676,630,474$
4. Total Actuarial Accrued Liability for:
a. Retirees and beneficiaries 829,115,833$ 762,668,410$
b. Inactive members 16,285,415 13,358,913
c. Active members (Item 3c) 637,233,954 676,630,474
d. Total 1,482,635,202$ 1,452,657,797$
5. Actuarial Value of Assets 968,129,751$ 953,054,283$
6. Unfunded Actuarial Accrued Liability
(UAAL) (Item 4d - Item 5) 514,505,451$ 499,603,514$
7. Total Contribution Rate Needed to Fund Normal Cost Plus
Amortize the UAAL Over 31 Years 3.91% 3.76%
8. Expected Contribution from Court Fees
a. Expected future contributions 17,100,000$ 18,100,000$
b. Equivalent contribution rate for fiscal year 1.04% 1.07%
9. Contribution Rate In Addition to Expected Court Fees
Needed to Fund Normal Cost Plus Amortize the UAAL
Over 31 Years 3.14% 2.99%
10. Allocation of Contribution Rate for the Current Fiscal Year
a. Equivalent employer rate for fiscal year* 1.54% 1.57%
b. Member rate 0.50% 0.50%
c. Total contribution rate for fiscal year* 2.04% 2.07%
d. Total normal cost rate 2.08% 2.09%
e. Available contribution rate to amortize UAAL* -0.04% -0.02%
f. Total contribution rate for fiscal year* 2.04% 2.07%
11. Funding period based on statutory contribution rates,
expected court fees, and Actuarial Value of Assets (years) Never Never
* The annual court fees contributed to LECOSRF are expected to remain level in the future. As a result, the
equivalent contribution rate is expected to decrease over time as the payroll increases.

Law Enforcement and Custodial Officer Supplemental Retirement Fund of the Employees Retirement System of Texas
C - 2
Table 2 Actuarial Present Value of Future Benefits
August 31, 2019 August 31, 2018
1. Active Members
a. Service Retirement 850,915,208$ 899,980,280$
b. Disability Benefits 4,852,577 5,081,802
c. Death Before Retirement 6,227,199 6,673,095
d. Termination 13,583,538 13,723,029
e. Total 875,578,522$ 925,458,206$
2. Inactive Members 16,285,415$ 13,358,913$
3. Annuitants 829,115,833$ 762,668,410$
4. Total Actuarial Present Value 1,720,979,770$ 1,701,485,529$ of Future Benefits

Law Enforcement and Custodial Officer Supplemental Retirement Fund of the Employees Retirement System of Texas
C - 3
Table 3 Analysis of Normal Cost
August 31, 2019 August 31, 2018
1. Gross Normal Cost Rate
a. Service Retirement 1.82% 1.83%
b. Disability Benefits 0.02% 0.02%
c. Death Before Retirement 0.01% 0.01%
d. Termination 0.15% 0.15%
e. Total 2.00% 2.01%
2. Administrative Expenses 0.08% 0.08%
3. Total Normal Cost 2.08% 2.09%
4. Less: Member Rate 0.50% 0.50%
5. Employer Normal Cost Rate 1.58% 1.59%

Law Enforcement and Custodial Officer Supplemental Retirement Fund of the Employees Retirement System of Texas
C - 4
Table 4 Historical Summary of Active Member Data
Valuation as of Percent Amount in Percent Percent Average Average
August 31, Number Increase $ Millions Increase $ Amount Increase Age Service
(1) (2) (3) (4) (5) (6) (7) (8) (9)
2008 33,642 N/A 1,245 N/A 37,021 N/A 42.7 9.6
2009 37,819 12.4% 1,387 11.4% 36,687 -0.9% 42.0 8.6
2010 39,052 3.3% 1,483 6.9% 37,979 3.5% 41.9 8.5
2011 36,806 -5.8% 1,452 -2.1% 39,454 3.9% 42.2 8.9
2012 37,404 1.6% 1,475 1.6% 39,444 0.0% 42.5 9.1
2013 37,415 0.0% 1,477 0.1% 39,469 0.1% 42.4 9.1
2014 37,084 -0.9% 1,542 4.4% 41,584 5.4% 42.3 8.9
2015 38,526 3.9% 1,616 4.8% 41,957 0.9% 41.7 8.4
2016 39,066 1.4% 1,744 7.9% 44,634 6.4% 41.0 8.0
2017 38,206 -2.2% 1,720 -1.3% 45,029 0.9% 41.1 8.0
2018 37,167 -2.7% 1,684 -2.1% 45,321 0.7% 41.0 8.0
2019 36,296 -2.3% 1,644 -2.4% 45,305 0.0% 41.0 7.8
Active Members Covered Payroll Average Salary

Law Enforcement and Custodial Officer Supplemental Retirement Fund of the Employees Retirement System of Texas
C - 5
Table 5 Reconciliation of Plan Net Assets
August 31, 2019 August 31, 2018
(1) (2)
1. Market value of assets at beginning of year 966,827,735$ 923,989,580$
2. Revenue for the year
a. Contributions for the year
i. State (including membership fees) 25,864,146$ 26,109,655$
ii. Member (including penalty interest) 9,098,121 9,274,814
iii. Total 34,962,267$ 35,384,469$
b. Net investment income 26,250,173$ 84,937,315$
c. Total revenue 61,212,440$ 120,321,784$
3. Disbursements for the year
a. Benefit payments and refunds 82,250,048 75,632,867$
b. Net transfers from TRS 0 0
c. Administrative expenses 2,167,482 1,850,762
d. Total expenditures 84,417,530 77,483,629
4. Increase in net assets
(Item 2c - Item 3d) (23,205,090)$ 42,838,155$
5. Market value of assets at end of year (Item 1 + Item 4) 943,622,645$ 966,827,735$
Year Ending

Law Enforcement and Custodial Officer Supplemental Retirement Fund of the Employees Retirement System of Texas
C - 6
Table 6 Development of Actuarial Value of Assets
Year Ending
August 31, 2019
1. Market value of assets at beginning of year 966,827,735$
2. Net new investments
a. Contributions for the year (Table 5) 34,962,267$
b. Disbursements for the year (Table 5) (84,417,530)
c. Subtotal (49,455,263)
3. Market value of assets at end of year 943,622,645$
4. Net earnings (Item 3 - Item 1 - Item 2) 26,250,173$
5. Assumed investment return rate for fiscal year 7.50%
6. Expected return 70,657,508$
7. Excess return (Item 4 - Item 6) (44,407,335)$
8.
Fiscal
Year
End
Remaining Deferrals
of Excess (Shortfall)
of Investment Income
Offsetting of
Gains/(Losses)
Net Deferrals
Remaining
Years
Remaining
Recognized for
this valuation
Remaining after
this valuation
(1) (2) (3) = (1) + (2) (4) (5) = (3) / (4) (6) = (3) - (5)
2015 0$ 0$ 0$ 1 0$ 0$
2016 0 0 0 2 0 0
2017 0 0 0 3 0 0
2018 13,773,452 (13,773,452) 0 4 0 0
2019 (44,407,335) 13,773,452 (30,633,883) 5 (6,126,777) (24,507,106)
Total (30,633,883)$ 0$ (30,633,883)$ (6,126,777)$ (24,507,106)$
9. Actuarial value of assets as of August 31, 2019 (Item 3 - Item 8, Column 6) 968,129,751$
10. Ratio of actuarial value to market value 102.6%
Development of amounts to be recognized as of August 31, 2019:

Law Enforcement and Custodial Officer Supplemental Retirement Fund of the Employees Retirement System of Texas
C - 7
Table 7 History of Investment Return Rates
Year Ending Market Market
August 31 of Returns (Gross) Returns (Net) Actuarial
(1) (2) (3) (4)
1998 8.30% 8.23% N/A
1999 16.26% 16.46% N/A
2000 9.43% 9.40% N/A
2001 -6.91% -6.93% N/A
2002 -7.17% -7.21% N/A
2003 9.20% 9.14% 5.2%
2004 11.69% 11.64% 6.3%
2005 12.71% 12.62% 7.4%
2006 8.83% 8.76% 7.6%
2007 13.88% 13.76% 8.5%
2008 -4.58% -4.69% 5.7%
2009 -6.60% -6.71% 3.2%
2010 6.65% 6.48% 3.7%
2011 12.58% 12.36% 5.1%
2012 8.22% 8.04% 5.4%
2013 10.07% 9.87% 6.1%
2014 14.70% 14.58% 7.6%
2015 0.49% 0.44% 6.1%
2016 5.32% 5.28% 5.9%
2017 12.15% 12.11% 2.8%
2018 9.58% 9.54% 7.9%
2019 3.04% 3.00% 7.0%
Average Returns
Last Five Years: 6.03% 5.99% 5.9%
Last Ten Years: 8.20% 8.09% 5.7%
Last Fifteen Years: 6.94% 6.84% 6.0%
Last Twenty Years: 5.92% 5.83% N/A
Market returns provided by ERS Master Trust Custodian. Rates in Column (2) represent the market returns gross of all expenses. Rates in Column (3) represent the market returns net of investment expenses. Net returns may exceed gross returns in years where adjustments are made to fee expenses.

Law Enforcement and Custodial Officer Supplemental Retirement Fund of the Employees Retirement System of Texas
C - 8
Table 8 History of Cash Flow
External External Cash
Year Ending Benefit Payments Administrative Cash Flow Market Value Flow as Percent
August 31, Contributions and Refunds Expenses Total for the Year of Assets of Market Value
(1) (2) (3) (5) (6) (7) (8) (9)
2007 0.0$ (32.1)$ (0.5)$ (32.6)$ (32.6)$ 762.9$ -4.3%
2008 20.2 (34.9) (0.4) (35.3) (15.1) 704.9 -2.1%
2009 20.7 (38.7) (0.4) (39.1) (18.4) 634.8 -2.9%
2010 35.3 (41.2) (0.6) (41.8) (6.5) 668.4 -1.0%
2011 31.8 (43.7) (0.9) (44.6) (12.8) 737.4 -1.7%
2012 7.3 (48.1) (0.8) (48.9) (41.6) 747.7 -5.6%
2013 14.3 (52.4) (0.8) (53.2) (38.9) 780.7 -5.0%
2014 35.9 (57.1) (1.3) (58.4) (22.5) 869.9 -2.6%
2015 35.1 (61.3) (1.4) (62.7) (27.6) 844.1 -3.3%
2016 37.0 (64.5) (1.4) (65.9) (28.9) 860.0 -3.4%
2017 36.2 (69.8) (1.8) (71.6) (35.4) 924.0 -3.8%
2018 35.4 (75.6) (1.9) (77.5) (42.1) 966.8 -4.4%
2019 35.0 (82.3) (2.2) (84.5) (49.5) 943.6 -5.2%
Dollar amounts in mill ions
Column (7) = Column (2) + Column (6).
Distributions and Expenditures

Law Enforcement and Custodial Officer Supplemental Retirement Fund of the Employees Retirement System of Texas
C - 9
Table 9 Total Experience Gain or Loss
Year Ending Year Ending
August 31, 2019 August 31, 2018
(2) (3)
A. Calculation of total actuarial gain or loss
1. Unfunded actuarial accrued liability (UAAL), previous year 499,603,514$ 475,887,077$
2. Normal cost for the year (excluding administrative expenses) 33,857,601 34,923,358
3. Actual administrative expenses 2,167,482 1,850,762
4. Contributions for the year (excluding service purchases) (34,149,251) (34,494,780)
5. Interest at 7.5%
a. On UAAL 37,470,264$ 35,691,531$
b. On normal cost and administrative expenses 1,350,941 1,379,030
c. On contributions (1,280,597) (1,293,554)
d. Total 37,540,608$ 35,777,007$
6. Assumption change (Gains)/Losses 0$ 0$
7. Legislative changes*– Across-the-board pay increases budgeted for
upcoming biennium by the State Legislature (24,502,374) 0
8. Expected UAAL (Sum of Items 1 through 7) 514,517,580 513,943,424
9. Actual UAAL 514,505,451 499,603,514
10. Total (gain)/loss for the year (Item 9 - Item 8) (12,129)$ (14,339,910)$
B. Source of gains and losses
11. Asset (Gain)/Loss for the year 0.34% 5,093,768$ (3,443,363)$
12. Pay Increases (Less)/Greater than Expected 0.24% (3,596,314) (4,043,300)
13. Non-Retired Demographic (Gains)/Losses 0.56% (8,278,040) (14,545,639)
14. Post-Retirement Mortality (Gains)/Losses 0.00% 55,396 (1,065,643)
15. Other Demographic (Gains)/Losses 0.45% 6,713,061 8,758,036
16. Total (Sum of Items 11 through 15) 0.00% (12,129)$ (14,339,910)$
Item
(1)
% of
AAL
* The plan experiences a (gain)/loss when across-the-board pay increases budgeted by the State Legislature
are (less)/greater than assumed.

Law Enforcement and Custodial Officer Supplemental Retirement Fund of the Employees Retirement System of Texas
C - 10
Table 10 Solvency Test
Actuarial Accrued Liability and Percent of Active Member Payroll for:
% of % of % of Actuarial Value
August 31, (1) Payroll (2) Payroll (3) Payroll of Assets (1) (2) (3)
2007 0.0$ 0% 278.1$ 22% 484.6$ 9% 747.8$ 100% 100% 97%
2008 0.0 0% 314.6 25% 527.5 42% 774.5 100% 100% 87%
2009 0.0 0% 334.6 24% 572.5 41% 780.8 100% 100% 78%
2010 7.3 0% 368.0 25% 591.3 40% 802.9 100% 100% 72%
2011 13.9 1% 400.9 28% 578.0 40% 830.5 100% 100% 72%
2012 19.5 1% 447.5 30% 577.3 39% 832.5 100% 100% 63%
2013 24.4 2% 482.7 33% 690.0 47% 843.0 100% 100% 49%
2014 29.5 2% 533.3 35% 644.0 42% 883.6 100% 100% 50%
2015 34.5 2% 578.9 36% 648.9 40% 909.2 100% 100% 46%
2016 41.5 2% 619.0 35% 651.9 37% 933.5 100% 100% 42%
2017 47.0 3% 702.9 41% 649.9 38% 924.0 100% 100% 27%
2018 51.5 3% 762.7 45% 638.5 38% 953.1 100% 100% 22%
2019 54.7 3% 829.1 50% 598.8 36% 968.1 100% 100% 14%
Note: Dollar amounts in millions
Liabilities Covered
by Assets
Employer Financed
Portion of Vested
and Nonvested BenefitsInterest
Retirees and
Beneficiaries Currently
Receiving Benefits
Accumulated Member
Contributions Including
Portion of Accrued

Law Enforcement and Custodial Officer Supplemental Retirement Fund of the Employees Retirement System of Texas
C - 11
Table 11 Historical Contribution Rates
Actuarial
Valuation as Court Total Normal
of August 31, State Fees* Members Total Cost Rate ASC**
1998 0.00% 0.00% 0.00% 0.00% 1.70% Not calculated
1999 0.00% 0.00% 0.00% 0.00% 1.98% Not calculated
2000 0.00% 0.00% 0.00% 0.00% 1.95% Not calculated
2001 0.00% 0.00% 0.00% 0.00% 1.76% Not calculated
2002 0.00% 0.00% 0.00% 0.00% 1.75% Not calculated
2003 0.00% 0.00% 0.00% 0.00% 1.61% Not calculated
2004 0.00% 0.00% 0.00% 0.00% 1.62% Not calculated
2005 0.00% 0.00% 0.00% 0.00% 1.63% 1.54%
2006 0.00% 0.00% 0.00% 0.00% 1.55% 1.50%
2007 1.59% 0.00% 0.00% 1.59% 1.54% 1.61%
2008 1.59% 0.00% 0.00% 1.59% 2.18% 2.51%
2009 1.59% 0.00% 0.50% 2.09% 2.07% 2.58%
2010 1.59% 0.00% 0.50% 2.09% 2.07% 2.72%
2011 0.00% 0.00% 0.50% 0.50% 2.07% 2.72%
2012 0.50% 0.00% 0.50% 1.00% 2.02% 2.86%
2013 0.50% 1.20% 0.50% 2.20% 1.80% 3.09%
2014 0.50% 1.20% 0.50% 2.20% 1.77% 2.96%
2015 0.50% 1.20% 0.50% 2.20% 1.77% 3.01%
2016 0.50% 1.10% 0.50% 2.10% 1.81% 3.10%
2017 0.50% 1.09% 0.50% 2.09% 2.11% 3.67%
2018 0.50% 1.07% 0.50% 2.07% 2.09% 3.76%
2019 0.50% 1.04% 0.50% 2.04% 2.08% 3.91%
***LECOSRF did not receive any contributions for 14 years, from fiscal years 1994 through 2007.
Contributions from:
* From 2013 to 2015, it was assumed that contributions from court fees would remain level as a percentage of pay.
Beginning in 2016 and thereafter, the amount shown is the assumed level dollar amount as a percentage of
valuation payroll which is expected to go down over time.
** The Actuarially Sound Contribution (ASC) rate is the rate determined as of the valuation date to fund the normal
cost and amortize the UAAL over a 31 year period. In all cases, the ASC is calculated as the total contribution
necessary to meet the objective, including any expected contributions from court fees.

SECTION D
RISKS ASSOCIATED WITH MEASURING THE ACCRUED LIABILITY
AND ACTUARIALLY DETERMINED CONTRIBUTION

Law Enforcement and Custodial Officer Supplemental Retirement Fund of the Employees Retirement System of Texas
D - 1
Risks Associated with Measuring the Accrued Liability and Actuarially Determined Contribution
The determination of the accrued liability and the actuarially determined contribution requires the use of assumptions regarding future economic and demographic experience. Risk measures, as illustrated in this report, are intended to aid in the understanding of the effects of future experience differing from the assumptions used in the course of the actuarial valuation. Risk measures may also help with illustrating the potential volatility in the accrued liability and the actuarially determined contribution that result from the differences between actual experience and the actuarial assumptions.
Future actuarial measurements may differ significantly from the current measurements presented in this report due to such factors as the following: plan experience differing from that anticipated by the economic or demographic assumptions; changes in economic or demographic assumptions due to changing conditions; increases or decreases expected as part of the natural operation of the methodology used for these measurements (such as the end of an amortization period, or additional cost or contribution requirements based on the Plan’s funded status); and changes in plan provisions or applicable law. The scope of an actuarial valuation does not include an analysis of the potential range of such future measurements.
Examples of risk that may reasonably be anticipated to significantly affect the plan’s future financial condition include:
1. Investment risk – actual investment returns may differ from the expected returns; 2. Asset/Liability mismatch – changes in asset values may not match changes in liabilities, thereby
altering the gap between the accrued liability and assets and consequently altering the funded status and contribution requirements;
3. Contribution risk – actual contributions may differ from expected future contributions. For example, actual contributions may not be made in accordance with the plan’s funding policy or material changes may occur in the anticipated number of covered employees, covered payroll, or other relevant contribution base;
4. Salary and Payroll risk – actual salaries and total payroll may differ from expected, resulting in actual future accrued liability and contributions differing from expected;
5. Longevity risk – members may live longer or shorter than expected and receive pensions for a period of time other than assumed;
6. Other demographic risks – members may terminate, retire or become disabled at times or with benefits other than assumed resulting in actual future accrued liability and contributions differing from expected.
The effects of certain trends in experience can generally be anticipated. For example if the investment return since the most recent actuarial valuation is less (or more) than the assumed rate, the cost of the plan can be expected to increase (or decrease). Likewise if longevity is improving (or worsening), increases (or decreases) in cost can be anticipated.
The actuarially sound contribution rate may be considered as a minimum contribution rate that complies with State statute. The timely receipt of the actuarially determined contributions is critical to support the financial health of the plan. Currently, this, and other Board funding policy objectives are not being met. Users of this report should be aware that even contributions made at the actuarially sound contribution rate do not necessarily guarantee benefit security.
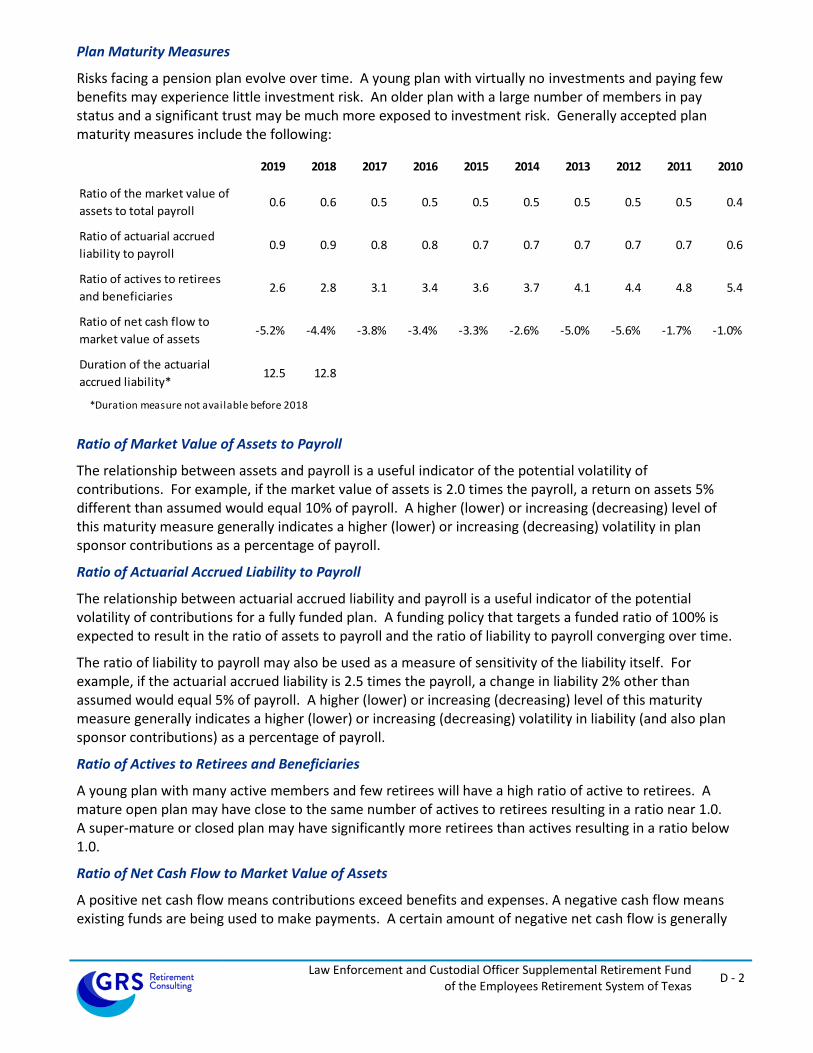
Law Enforcement and Custodial Officer Supplemental Retirement Fund of the Employees Retirement System of Texas
D - 2
Plan Maturity Measures
Risks facing a pension plan evolve over time. A young plan with virtually no investments and paying few benefits may experience little investment risk. An older plan with a large number of members in pay status and a significant trust may be much more exposed to investment risk. Generally accepted plan maturity measures include the following:
2019 2018 2017 2016 2015 2014 2013 2012 2011 2010
Ratio of the market value of
assets to total payroll0.6 0.6 0.5 0.5 0.5 0.5 0.5 0.5 0.5 0.4
Ratio of actuarial accrued
liability to payroll0.9 0.9 0.8 0.8 0.7 0.7 0.7 0.7 0.7 0.6
Ratio of actives to retirees
and beneficiaries2.6 2.8 3.1 3.4 3.6 3.7 4.1 4.4 4.8 5.4
Ratio of net cash flow to
market value of assets-5.2% -4.4% -3.8% -3.4% -3.3% -2.6% -5.0% -5.6% -1.7% -1.0%
Duration of the actuarial
accrued liability*12.5 12.8
*Duration measure not available before 2018
Ratio of Market Value of Assets to Payroll
The relationship between assets and payroll is a useful indicator of the potential volatility of contributions. For example, if the market value of assets is 2.0 times the payroll, a return on assets 5% different than assumed would equal 10% of payroll. A higher (lower) or increasing (decreasing) level of this maturity measure generally indicates a higher (lower) or increasing (decreasing) volatility in plan sponsor contributions as a percentage of payroll.
Ratio of Actuarial Accrued Liability to Payroll
The relationship between actuarial accrued liability and payroll is a useful indicator of the potential volatility of contributions for a fully funded plan. A funding policy that targets a funded ratio of 100% is expected to result in the ratio of assets to payroll and the ratio of liability to payroll converging over time.
The ratio of liability to payroll may also be used as a measure of sensitivity of the liability itself. For example, if the actuarial accrued liability is 2.5 times the payroll, a change in liability 2% other than assumed would equal 5% of payroll. A higher (lower) or increasing (decreasing) level of this maturity measure generally indicates a higher (lower) or increasing (decreasing) volatility in liability (and also plan sponsor contributions) as a percentage of payroll.
Ratio of Actives to Retirees and Beneficiaries
A young plan with many active members and few retirees will have a high ratio of active to retirees. A mature open plan may have close to the same number of actives to retirees resulting in a ratio near 1.0. A super-mature or closed plan may have significantly more retirees than actives resulting in a ratio below 1.0.
Ratio of Net Cash Flow to Market Value of Assets
A positive net cash flow means contributions exceed benefits and expenses. A negative cash flow means existing funds are being used to make payments. A certain amount of negative net cash flow is generally

Law Enforcement and Custodial Officer Supplemental Retirement Fund of the Employees Retirement System of Texas
D - 3
expected to occur when benefits are prefunded through a qualified trust. Large negative net cash flows as a percent of assets may indicate a super-mature plan or a need for additional contributions.
Duration of Actuarial Accrued Liability
The duration of the actuarial accrued liability may be used to approximate the sensitivity to a 1% change in the assumed rate of return. For example, duration of 10 indicates that the actuarial accrued liability would increase approximately 10% if the assumed rate of return were lowered 1%.
Additional Risk Assessment
Additional risk assessment is outside the scope of the annual actuarial valuation. Additional assessment may include scenario tests, sensitivity tests, stochastic modeling, stress tests, and a comparison of the present value of accrued benefits at low-risk discount rates with the actuarial accrued liability.

SECTION E
SUMMARY OF PLAN PROVISIONS

Law Enforcement and Custodial Officer Supplemental Retirement Fund of the Employees Retirement System of Texas
E - 1
Summary of Plan Provisions for Law Enforcement and Custodial Officer Supplemental Retirement
Fund of the Employees Retirement System of Texas Classes of Membership
1. Employee Class Membership:
a. Membership is mandatory for all employees and appointed officers of every department, commission, board, agency, or institution of the State except for:
i. Independent contractors;
ii. Persons covered by the Teacher Retirement System or either of the Judicial Retirement Systems; and
iii. Employee Class Members already receiving retirement benefits under the System.
b. Includes two types of Employee Class service:
i. CPO/CO: Certified Peace Officer / Custodial Officer – in general, service rendered while a law enforcement officer, custodial officer, parole officer or caseworker (collectively referred to as “LECOs”); and
ii. Regular: Non-CPO/CO service.
c. Prior to September 1, 2015, membership begins after a 90-day waiting period. Effective September 1, 2015, membership begins immediately.
The benefits payable by the Law Enforcement and Custodial Officer Supplemental Retirement Fund (LECOSRF) only apply to members that have accrued CPO/CO service.
Member Contributions
1. 0.5% of compensation to LECOSRF in addition to contributions payable to ERS. Additional member contributions may be allowable for service purchases.
2. Member contributions cease when a member’s benefit accrual has reached 100% of Average Monthly Compensation.
3. Member contributions accumulate interest at 2.00% per year.
State of Texas and Employer Contributions
State contributions are set biennially by the legislature. The current sources of contributions are shown below.
1. Payroll Contributions: The current projected contribution rate for the State is 0.50% of compensation for the 2020 and 2021 fiscal years. State payroll contributions cease when a member’s benefit accrual has reached 100% of Average Monthly Compensation.
2. Court Fees: LECOSRF also receives a portion of the court fees collected under Section 133.102 of the Local Government Code. Based on historical information, the contribution from this source is expected to be approximately $17.1 million for fiscal year 2020.
State contributions after the 2021 fiscal year are subject to future legislative appropriations.

Law Enforcement and Custodial Officer Supplemental Retirement Fund of the Employees Retirement System of Texas
E - 2
Return to Work Surcharge
For members who, on or after September 1, 2009, retire from the employee class and are rehired as a retiree into a position that would otherwise include membership in the employee class, the department or agency that employs the member must remit to the retirement system an amount equal to the amount of the State contribution that the department or agency would remit for an active member employed in the person's position.
Compensation
Compensation includes base salary, longevity and hazardous duty pay and excludes overtime pay. This amount is limited by Section 401(a)(17) of the Internal Revenue Code for members hired after August 31, 1996.
Average Monthly Compensation (AMC)
1. Members hired prior to September 1, 2009: Average of the 36 highest months of compensation for service in the employee class of membership
2. Members hired on or after September 1, 2009 and prior to September 1, 2013: Average of the 48 highest months of compensation for service in the employee class of membership
3. Members hired on or after September 1, 2013: Average of the 60 highest months of compensation for service in the employee class of membership.
Creditable Service
The types of service creditable in LECOSRF are membership service, military service and equivalent membership service. Equivalent membership service includes: previously cancelled service, service not previously established, waiting period service, and Additional Service Credit.
Unused Sick and Annual Leave
In many cases, unused sick and annual leave can be used to establish Creditable Service. Members hired prior to September 1, 2009 can use unused sick and annual leave to satisfy service requirements for Retirement and Death Benefit Plan eligibility as well as to calculate plan benefits. Members hired on or after September 1, 2009 can only use unused sick and annual leave to calculate plan benefits. However, members hired on or after September 1, 2013 cannot use unused annual leave to calculate plan benefits if the member opts to receive the unused annual leave as a lump-sum payment.

Law Enforcement and Custodial Officer Supplemental Retirement Fund of the Employees Retirement System of Texas
E - 3
Standard Service Retirement Annuity
1. Employee Class:
a. Eligibility:
i. Any age with 20 years of CPO/CO service
b. Benefits: 0.5% of AMC times years of CPO/CO Service
d. Applicable Reductions:
i. For members hired prior to September 1, 2009, retiring after attaining age 50 or after attaining Rule of 80, there is no reduction. Otherwise, the member receives the percentage of the benefit stated in the following table:
Attained Age at Retirement
Reduction Percentage
Attained Age at Retirement
Reduction Percentage
36 31.2% 43 55.3%
37 33.9% 44 60.1%
38 36.7% 45 65.3%
39 39.8% 46 71.1%
40 43.2% 47 77.3%
41 46.9% 48 84.2%
42 50.9% 49 91.7%
ii. For members hired after on or after September 1, 2009, but prior to September 1, 2013, reduced five percent for each year the member retires prior to age 55, with a maximum possible reduction of 25 percent.
iii. For members hired on or after September 1, 2013, reduced five percent for each year the member retires prior to age 57, with no maximum possible reduction.
2. Normal Form of Payment: Payable for the life of the member with any remaining member account balance paid at time of death. Survivorship options and partial lump-sum option are available on an actuarially equivalent basis.
Standard Non-Occupational Disability Annuity: None

Law Enforcement and Custodial Officer Supplemental Retirement Fund of the Employees Retirement System of Texas
E - 4
Standard Occupational Disability Annuity
1. Employee Class (LECO Members):
a. Eligibility: Disability as a direct result of some risk or hazard inherent to law enforcement or custodial duties
i. Total: Incapable of substantial gainful activity and eligible for Social Security disability benefits
ii. Non-total: Does not satisfy definition of Total Disability
b. Benefits:
i. Non-total with less than 20 years of CPO/CO Service: 15% of AMC payable from LECOSRF
ii. Non-total with 20 years of CPO/CO Service: Benefit defined in the Service Retirement Supplement Section
iii. Total: 100% of AMC offset by the amount paid by ERS (ERS pays 2.3% of AMC times years of Creditable Service, but not less than 35% of AMC)
2. Normal Form of Payment: Annuity payable for life or until member is no longer incapacitated for the performance of duty. Any remaining member account balance paid at time of death. Survivorship options and partial lump-sum option are available on an actuarially equivalent basis.
Death Benefit Plan (DBP) Annuity Supplement
1. Eligibility:
a. 20 years of CPO/CO Service; and
i. Death occurs while an active member; or
ii. Death occurs while an inactive member, and the member either:
1. Filed a DBP prior to September 1, 2006; or
2. Was eligible for service retirement when the member became inactive.
2. Benefits: Benefits are calculated as if the member had elected to receive a Service Retirement Supplement under an optional form of payment, received a Service Retirement Supplement, and died immediately thereafter.

Law Enforcement and Custodial Officer Supplemental Retirement Fund of the Employees Retirement System of Texas
E - 5
Deferred Service Retirement Annuity
1. Employee Class:
a. Eligibility:
i. 20 years of CPO/CO service at termination of CPO/CO employment, and either;
1. The member transfers to and retires from active regular class service; or
2. The member terminates all employee class service, and the regular employee class account balance is not withdrawn from the ERS trust.
b. Benefits:
i. Service Retirement Supplement, based on the member’s age at benefit commencement. AMC used in calculating the benefit payable from the ERS trust and the LECOSRF will both be based on all employee class service.
ii. Payments may commence at any age, provided that the member has terminated all employee class service. The member must retire simultaneously from the ERS trust and the LECOSRF.
2. Normal Form of Payment: Payable for the life of the member with any remaining member account balance paid at time of death. Survivorship options and partial lump-sum option are available on an actuarially equivalent basis.
Refund of Accumulated Contributions
A refund of accumulated contributions is payable in cases where a terminated member did not meet the eligibility requirements for an annuity, or a terminated member chooses to receive a refund of his or her account balance in lieu of an annuity.
Maximum Benefits
Annuity benefits are limited to 100% of Average Monthly Compensation. For members with CPO/CO service, this benefit limitation includes benefits from all sources (ERS and the Law Enforcement and Custodial Officer Supplemental Retirement Fund).
Limit on Plan Modifications
According to Section 811.006 of the Texas Government Code – a rate of member or State contributions to or a rate of interest required for the establishment of credit in the retirement system may not be reduced or eliminated, a type of service may not be made creditable in the retirement system, a limit on the maximum permissible amount of a type of creditable service may not be removed or raised, a new monetary benefit payable by the retirement system may not be established, and the determination of the amount of a monetary benefit from the system may not be increased, if, as a result of the particular action, the time, as determined by an actuarial valuation, required to amortize the UAAL of the retirement system would be increased to a period that exceeds 30 years by one or more years.

SECTION F
ACTUARIAL ASSUMPTIONS AND METHODS

Law Enforcement and Custodial Officer Supplemental Retirement Fund of the Employees Retirement System of Texas
F - 1
Summary of Actuarial Assumptions and Methods
The assumptions and methods applied in this actuarial valuation were adopted by the Board of
Trustees on August 23, 2017 based on the experience investigation that covered the five-year
period from September 1, 2011 through August 31, 2016.
I. Valuation Date
The valuation date is August 31 of each plan year. This is the date as of which the actuarial
present value of future benefits and the actuarial value of assets are determined.
II. Actuarial Cost Method
The actuarial valuation is used to determine the adequacy of the State contribution rate
(established by Legislative appropriation) and employer contribution rate (established by statute)
and to describe the current financial condition of LECOSRF.
The actuarial valuation uses the Entry Age Normal actuarial cost method. Under this method, the
first step is to determine the contribution rate (level as a percentage of pay) required to provide
the benefits to each member, or the normal cost rate. The normal cost rate consists of two
pieces: (i) the member’s contribution rate, and (ii) the remaining portion of the normal cost rate
which is the employer’s normal cost rate. The total normal cost rate is based on the benefits
payable to each individual active member.
The Unfunded Actuarial Accrued Liability (UAAL) is the liability for future benefits which is in
excess of (i) the actuarial value of assets, and (ii) the present value of future normal costs. The
employer contribution provided in excess of the employer normal cost is applied to amortize the
UAAL.
The funding period is calculated as the number of years required to fully amortize the UAAL, and is
calculated with the use of an open group projection that takes into account: (a) future market
earnings, net of investment-related expenses, will equal 7.50% per year, (b) there will be no
changes in assumptions, (c) the number of active members will remain unchanged, (d) active
members who leave employment will be replaced by new entrants each year, and (e) State and
employer contributions will remain the same percentage of payroll as described in Section D of
the valuation report.
The Entry Age actuarial cost method is an “immediate gain” method (i.e., experience gains and
losses are separately identified as part of the UAAL). However, they are amortized over the same
period applied to all other components of the UAAL.

Law Enforcement and Custodial Officer Supplemental Retirement Fund of the Employees Retirement System of Texas
F - 2
III. Actuarial Value of Assets
The actuarial value of assets is based on the market value of assets with a five-year phase-in of
actual investment return in excess of (less than) expected investment income. Offsetting
unrecognized gains and losses are immediately recognized, with the shortest remaining bases
recognized first and the net remaining bases continue to be recognized on their original
timeframe. Expected investment income is determined using the assumed investment return rate
and the market value of assets (adjusted for receipts and disbursements during the year). The
returns are computed net of investment-related expenses. The actuarial value of assets was reset
to be equal to the market value of assets as of August 31, 2017 and the new method has been
applied since that time.
IV. Actuarial Assumptions
Investment Return: 7.50% per year, net of investment-related expenses (composed of an assumed 2.50% inflation rate and a 5.00% real rate of return)
Administrative Expenses: 0.08% of valuation payroll per year
Salary Increases: Inflationary pay increases are assumed to occur at the beginning of the year and the remaining pay increases associated with merit, promotion and longevity are assumed to occur at the middle of the valuation year and vary by employee group. The components of the annual increases are:
Inflation *Real Wage Growth
(Productivity)
Merit, Promotion
and Longevity
2.50%
included in Merit,
Promotion and
Longevity Increases
See sample rates
Employee Group
Employee Class
* Total liabilities for this valuation reflect the notable across-the-board pay increases appropriated by the State legislature for the current biennium compared to the assumed rate of inflation.
Age
All 7.00 % 5.00 % 3.50 % 2.50 % 2.25 % 2.00 %
Annual Salary Increases for Merit, Promotion and Longevity
Male and Female LECO Members
Years of Eligibility Service
0 1 2 -4 5 - 8 9 - 17 18+
New Entrant Wage Growth: 3.00% per year, compounded annually (for increasing new hire salary in open group projection).

Law Enforcement and Custodial Officer Supplemental Retirement Fund of the Employees Retirement System of Texas
F - 3
New Entrant Profile: The average new hire is determined based on a new entrant profile, which is created from the valuation data by determining the entry age and entry pay for anyone with greater than or equal to three but less than eight years of service as of the valuation date. Each group of new hires’ salaries is assumed to grow at the New Entrant Wage Growth of 3.00% over the salaries of the previous year’s group.
Age and Service Assumptions and Methods:
Eligibility Service: Eligibility Service is considered to be all service eligible for vesting purposes, which includes service earned as a regular State employee, a LECO member, a member of the Elected Class, as State Judge, and service earned in the Teacher Retirement System of Texas (“TRS”).
Benefit Service: Current Benefit Service in years and months as of the valuation date was provided by ERS. This service plus Future Earned Service, Service Credit at Retirement, and Eligibility Service at Retirement were used to project benefit amounts.
Future Earned Service: Active members were assumed to earn one additional year of service credit in each future year employed based on their current class of membership (but not beyond the amount of credit needed to provide a 100% of average monthly compensation standard service retirement annuity).
Service Credit at Retirement: For LECO members, Benefit Service when eligible for service retirement is assumed to be increased by:
1.0 years if CPO/CO service, prior to adjustment, is at least 20 years; and
0.5 years if CPO/CO service, prior to adjustment, is less than 20 years. (but not beyond the amount of credit needed to provide a 100% of average monthly compensation standard service retirement annuity).
Entry Age: Entry age is calculated as the age at the valuation date minus Eligibility Service (excluding TRS service).
Decrement Timing: All decrements – mortality, service retirement, disability retirement, and termination of employment for reasons other than death or retirement – are assumed to occur at the middle of the valuation year.

Law Enforcement and Custodial Officer Supplemental Retirement Fund of the Employees Retirement System of Texas
F - 4
Mortality Decrements:
Service Retirees, Beneficiaries, and Inactive Members 2017 State Retirees of Texas (SRT) mortality table. Generational mortality improvements in accordance with the ultimate rates from the scale most recently published by Retirement Plans Experience Committee of the Society of Actuaries (“Scale U-MP”) and projected from the year 2017. Rates for male LECO members are set forward one year. Sample rates for the base mortality table included below.
Age Males Females
40 0.0603 0.0380
45 0.1059 0.0687
50 0.1825 0.1215
55 0.3145 0.2150
60 0.5421 0.3804
65 0.9344 0.6730
70 1.6105 1.1908
75 2.7757 2.1069
80 4.7842 3.7277
85 8.2459 6.5956
90 14.2527 11.7028
Annual Mortality Rates per 100 Individuals
Active Members RP-2014 Active Member Mortality table. Generational mortality improvements in accordance with Scale U-MP are projected from the year 2014.
Disability Retirees RP-2014 Disabled Retiree Mortality. Generational mortality improvements in accordance with Scale U-MP are projected from the year 2014.
Occupational Death 1.0% of male and female active member deaths are assumed to be occupational.

Law Enforcement and Custodial Officer Supplemental Retirement Fund of the Employees Retirement System of Texas
F - 5
Service Retirement Decrements: Graded tables based on ERS experience.
Active LECO Members Service retirement rates are determined by the first set of eligibility requirements satisfied:
Eligibility A: 20 years of CPO/CO service
Eligibility B: Age 55 and 10 years of CPO/CO service
Eligibility C: Any eligibility pertaining to regular State employees (see rates and adjustments for regular State employees)
Adjustments to the base rates are made to account for age at first eligibility or reduced retirement benefits, based on date of hire (described below sample table). Base rates for eligible members:
Age 20 yrs CPO/CO Age Age 55 & 10 yrs CPO/CO
<48 0.03
48 0.04 55 0.20
49 0.05 56 0.18
50 0.60 57 0.16
51 - 61 0.33 58 - 61 0.14
62 - 74 0.50 62 - 74 0.27
75 1.00 75 1.00
Annual Service Retirement Rates
LECO Members (Males & Females)
Eligibility A Eligibility B
Adjustments for members hired before September 1, 2013:
Eligibility A and B: Rate set to zero if member has 18 or 19 years of CPO/CO service. Rate is doubled if member has 20 years of CPO/CO service. Adjustments only apply to members that attain 20 years of CPO/CO service prior to age 65.
Adjustments for members hired on or after September 1, 2013:
Eligibility A: If age of 1st eligibility is before age 57, then o rates prior to age 57 are multiplied by 75% for each year prior to age 57 o the rate at age 57 is 100%
Eligibility B: If member will attain 20 years of CPO/CO service at or before age 62, rates are zero prior to age 62 and 100% when member attains 20 years of CPO/CO service.
Eligibility B: If member will attain 20 years of CPO/CO service after age 62, then o rates prior to age 62 are multiplied by 75% for each year prior to age 62 o the rate at age 62 is the base table rate plus 0.20 plus 0.06 times the number
of years the age at 1st eligibility was before age 62
Disability Retirement Decrements: Graded Tables Based on ERS Experience Active LECO Members
The rates do not apply before a member is eligible for the benefit.
Service greater than zero is required for occupational disability retirement.

Law Enforcement and Custodial Officer Supplemental Retirement Fund of the Employees Retirement System of Texas
F - 6
10 years of service is required for non-occupational disability retirement.
Non-occupational disability rates are assumed to be zero once the sum of the member’s age and eligibility service is greater than or equal to 80, or the member has attained age 55 with 10 or more years of CPO/CO service.
Sample rates for members:
Age Males and Females
30 0.0092
35 0.0314
40 0.0586
45 0.0980
50 0.1774
55 0.2460
60 0.3150
Annual Disability Rates per 100 Participants
LECO Members
95% of the disability rates stated above are assumed to be attributable to non-occupational disabilities, 4.5% are assumed to be attributable to non-total occupational disabilities, and 0.5% are assumed to be attributable to total occupational disabilities.

Law Enforcement and Custodial Officer Supplemental Retirement Fund of the Employees Retirement System of Texas
F - 7
Termination Decrements for Reasons Other Than Death or Retirement: Graded Tables Based on ERS Experience. Rates of termination are zero for members eligible for service retirement. To account for active members that accumulate additional eligibility service at retirement through converting sick/annual leave or other types of service purchases, termination rates are also set to zero in the year prior to first retirement eligibility. Rates for members not eligible for service retirement:
Active LECO Members
Eligibility
ServiceMale and Female
0 23.00
1 19.22
2 15.36
3 12.48
4 10.36
5 8.81
6 7.67
7 6.81
8 6.11
9 5.52
10 4.96
11 4.42
12 3.90
13 3.43
14 3.07
15 2.90
16 2.50
17 1.00
18 1.00
19+ 0.00
Annual Rates of Termination
per 100 Participants
LECO Members
Withdrawal of Employee Contributions: Every member that terminates employment and does not have a benefit payable from this plan is assumed to withdraw their employee contributions.

Law Enforcement and Custodial Officer Supplemental Retirement Fund of the Employees Retirement System of Texas
F - 8
Percentage of Members Electing Various Benefit Options:
Sex / Benefit
Standard Life
Annuity Option 1 Option 4
Male Member
Disability 50% 50% 0%
Service Retirement 60% 40% 0%
Death Benefit Plan 0% 85% 15%
Female Member
Disability 75% 25% 0%
Service Retirement 100% 0% 0%
Death Benefit Plan 0% 70% 30%
The value of the Standard Service Retirement Life Annuity reflects the return of excess contributions payable as a lump sum death benefit in cases the annuity benefits paid are less than the member account balance at the time of retirement.
Beneficiary Characteristics: Males are assumed to be two years older than females.
Transfers from ERS to TRS:
Contributing ERS members:
It is assumed that 10% of regular State employees and LECO members who cease contributing to ERS and do not withdraw employee contributions will transfer ERS service credit to TRS at retirement.
Noncontributing ERS Members:
Records of ERS and TRS are matched by ERS staff to determine former ERS members who are currently contributing under TRS.
TRS Retirement Age:
Former ERS members who are, or are assumed to become, contributing TRS members are assumed to continue to earn service credit under TRS until first eligible for unreduced service retirement benefits, retire at that time, and transfer ERS service credit to TRS.
Census Data and Assets
The valuation was based on members of LECOSRF as of August 31, 2019 and does not take into account future members, with the exception of determining the funding period.
All census data was supplied by ERS and was subject to reasonable consistency checks.
There were data elements that were modified for some members as part of the valuation in order to make the data complete. However, the number of missing data items was immaterial.
Asset data was supplied by ERS.
Other Actuarial Valuation Procedures
No provision was made in this actuarial valuation for the limitations of Internal Revenue Code Sections 415 or 401(a)17.

Law Enforcement and Custodial Officer Supplemental Retirement Fund of the Employees Retirement System of Texas
F - 9
Valuation payroll (earnings applied to the current valuation year) is the expected payroll for the fiscal year following the valuation date. It is based on reported payroll determined from August member contributions increased to reflect the across-the-board salary increases appropriated by the State legislature, effective on or after September 1, and projected according to the actuarial assumptions for the upcoming fiscal year.
No liability was included for benefits which are funded by special State appropriations.
State appropriations for membership fees are currently immaterial in relation to the overall payroll contributions and have been ignored.

10
SECTION G
DETAILED SUMMARIES OF MEMBERSHIP DATA

Law Enforcement and Custodial Officer Supplemental Retirement Fund of the Employees Retirement System of Texas
G - 1
Detailed Summaries of Membership Data
Table Page
Number
A G-2 Summary of Membership Data
B G-3 Active Members: Distribution by Age and Service
C G-4 Retired and Beneficiary Members: Distribution by Age and Category

Law Enforcement and Custodial Officer Supplemental Retirement Fund of the Employees Retirement System of Texas
G - 2
Table A
Summary of Membership Data
Item Male Female Total
Number of Members 21,983 14,313 36,296
Average Annual Salaries 48,534$ 40,346$ 45,305$
Average Age 41.0 40.9 41.0
Average Entry Age 32.7 33.8 33.2
Average Service 8.3 7.1 7.8
Item Number Annual Annuities
Average
Annuities Average Age
Service Retirees* 13,111 72,901,872$ 5,560$ 62.8
Beneficiaries 779 3,076,764$ 3,950$ 72.8
Disability Retirees 91 807,828$ 8,877$ 68.8
Total 13,981 76,786,464$ 5,492$ 63.4
* Average Age and Service at Retirement for Service Retirees are 54.0 and 23.6, respectively
Item Number Annual Annuities
Average
Annuities Average Age
Participants with Deferred Benefits 111 1,151,028$ 10,370$ 48.8
Item Number
Account
Balances
Average
Account
Balances Average Age
Non-vested Members 22,096 6,157,911$ 279$ 35.9
Annuitants
Inactive Members Assumed Eligible for Deferred Annuities
Non-vested Inactive Members
Active Members

Law Enforcement and Custodial Officer Supplemental Retirement Fund of the Employees Retirement System of Texas
G - 3
Table B
Active Members
Distribution by Age and Service
Age 0-4 5-9 10-14 15-19 20-24 25-29 30-34 35-39 40+ Total
Under 25 4,000 18 4,018
34,159$ 44,132$ 34,203$
25 - 29 3,640 797 20 4,457
39,949$ 46,669$ 45,144$ 41,174$
30 - 34 2,491 1,336 567 20 4,414
40,049$ 51,062$ 51,634$ 56,022$ 44,943$
35 - 39 1,999 996 1,033 406 23 4,457
38,974$ 48,026$ 56,382$ 61,057$ 58,278$ 47,143$
40 - 44 1,638 764 822 748 523 28 4,523
38,632$ 45,873$ 52,825$ 62,677$ 60,550$ 70,637$ 49,143$
45 - 49 1,436 760 743 763 1,049 561 14 5,326
38,477$ 45,225$ 49,817$ 58,400$ 62,727$ 64,201$ 85,644$ 51,486$
50 - 54 1,190 679 743 502 421 257 76 3,868
38,353$ 43,925$ 47,199$ 50,779$ 63,697$ 75,236$ 95,240$ 48,970$
55 - 59 908 642 560 417 206 82 42 6 2,863
37,049$ 42,994$ 44,742$ 48,707$ 52,828$ 66,161$ 87,647$ 110,036$ 44,449$
60 - 64 455 447 355 216 96 34 12 4 1,619
37,191$ 42,024$ 45,854$ 45,865$ 49,863$ 56,405$ 83,120$ 65,588$ 43,148$
Over 64 223 255 141 80 35 15 2 751
37,375$ 43,114$ 43,116$ 46,565$ 47,643$ 69,390$ 49,224$ 42,530$
Total 17,980 6,694 4,984 3,152 2,353 977 146 10 36,296
37,975$ 46,410$ 50,429$ 56,087$ 60,757$ 67,261$ 90,509$ 92,257$ 45,305$
Years of Service

Law Enforcement and Custodial Officer Supplemental Retirement Fund of the Employees Retirement System of Texas
G - 4
Table C
Retired and Beneficiary Members
Distribution by Age and Category
Age Last Birthday Number Annual Benefit
Average Annual
Benefit
Service Retirees
Under 60 5,456 31,932,156 5,853
60 - 64 2,785 15,723,480 5,646
65 - 69 2,324 11,813,652 5,083
70 - 74 1,459 7,515,852 5,151
75 - 79 637 3,295,128 5,173
Over 79 450 2,621,604 5,826
Total 13,111 72,901,872 5,560
Beneficiaries
Under 60 102 436,644 4,281
60 - 64 77 341,916 4,440
65 - 69 116 403,956 3,482
70 - 74 133 484,548 3,643
75 - 79 116 449,484 3,875
Over 79 235 960,216 4,086
Total 779 3,076,764 3,950
Disabled Retirees
Under 60 23 173,016 7,522
60 - 64 15 106,272 7,085
65 - 69 8 47,544 5,943
70 - 74 17 224,340 13,196
75 - 79 13 112,152 8,627
Over 79 15 144,504 9,634
Total 91 807,828 8,877
Grand Total 13,981 76,786,464 5,492

5
SECTION H
GLOSSARY

Law Enforcement and Custodial Officer Supplemental Retirement Fund of the Employees Retirement System of Texas
H - 1
Glossary
Actuarial Accrued Liability (AAL): That portion, as determined by a particular Actuarial Cost Method, of the Actuarial Present Value of Future Plan Benefits which is not provided for by future Normal Costs. It is equal to the Actuarial Present Value of Future Plan Benefits minus the actuarial present value of future Normal Costs. Actuarial Assumptions: Assumptions as to future experience under the Fund. These include assumptions about the occurrence of future events affecting costs or liabilities, such as:
mortality, withdrawal, disablement, and retirement;
future increases in salary;
future rates of investment earnings and future investment and administrative expenses;
characteristics of members not specified in the data, such as marital status;
characteristics of future members;
future elections made by members; and
other relevant items. Actuarial Cost Method or Funding Method: A procedure for allocating the Actuarial Present Value of Future Benefits to various time periods; a method used to determine the Normal Cost and the Actuarial Accrued Liability. These items are used to determine the ADC. Actuarial Gain or Actuarial Loss: A measure of the difference between actual experience and that expected based upon a set of Actuarial Assumptions, during the period between two Actuarial Valuation dates. Through the actuarial assumptions, rates of decrements, rates of salary increases, and rates of fund earnings have been forecasted. To the extent that actual experience differs from that assumed, Actuarial Accrued Liabilities emerge which may be the same as forecasted, or may be larger or smaller than projected. Actuarial gains are due to favorable experience, e.g., the Fund's assets earn more than projected, salaries do not increase as fast as assumed, members retire later than assumed, etc. Favorable experience means actual results produce actuarial liabilities not as large as projected by the actuarial assumptions. On the other hand, actuarial losses are the result of unfavorable experience, i.e., actual results that produce actuarial liabilities which are larger than projected. Actuarial gains will shorten the time required for funding of the actuarial balance sheet deficiency while actuarial losses will lengthen the funding period. Actuarially Equivalent: Of equal actuarial present value, determined as of a given date and based on a given set of Actuarial Assumptions. Actuarial Present Value (APV): The value of an amount or series of amounts payable or receivable at various times, determined as of a given date by the application of a particular set of Actuarial Assumptions. For purposes of this standard, each such amount or series of amounts is:
a. adjusted for the probable financial effect of certain intervening events (such as changes in compensation levels, marital status, etc.),
b. multiplied by the probability of the occurrence of an event (such as survival, death, disability, termination of employment, etc.) on which the payment is conditioned, and
c. discounted according to an assumed rate (or rates) of return to reflect the time value of money.

Law Enforcement and Custodial Officer Supplemental Retirement Fund of the Employees Retirement System of Texas
H - 2
Actuarial Present Value of Future Plan Benefits: The Actuarial Present Value of those benefit amounts which are expected to be paid at various future times under a particular set of Actuarial Assumptions, taking into account such items as the effect of advancement in age and past and anticipated future compensation and service credits. The Actuarial Present Value of Future Plan Benefits includes the liabilities for active members, retired members, beneficiaries receiving benefits, and inactive, nonretired members either entitled to a refund or a future retirement benefit. Expressed another way, it is the value that would have to be invested on the valuation date so that the amount invested plus investment earnings would be provide sufficient assets to pay all projected benefits and expenses when due. Actuarial Valuation: The determination, as of a valuation date, of the Normal Cost, Actuarial Accrued Liability, Actuarial Value of Assets, and related Actuarial Present Values for a plan. An Actuarial valuation for a governmental retirement system typically also includes calculations of items needed for compliance with GASB. Actuarial Value of Assets or Valuation Assets: The value of the Fund’s assets as of a given date, used by the actuary for valuation purposes. This may be the market or fair value of plan assets, but commonly actuaries use a smoothed value in order to reduce the year-to-year volatility of calculated results, such as the funded ratio and the ADC. Actuarially Determined: Values which have been determined utilizing the principles of actuarial science. An actuarially determined value is derived by application of the appropriate actuarial assumptions to specified values determined by provisions of the law. Amortization Method: A method for determining the Amortization Payment. The most common methods used are level dollar and level percentage of payroll. Under the Level Dollar method, the Amortization Payment is one of a stream of payments, all equal, whose Actuarial Present Value is equal to the UAAL. Under the Level Percentage of Pay method, the Amortization payment is one of a stream of increasing payments, whose Actuarial Present Value is equal to the UAAL. Under the Level Percentage of Pay method, the stream of payments increases at the assumed rate at which total covered payroll of all active members will increase. Amortization Payment: That portion of the pension plan contribution or ADC which is designed to pay interest on and to amortize the Unfunded Actuarial Accrued Liability. Actuarially Determined Contribution (ADC) or Annual Required Contribution (ARC): A calculated contribution for a defined benefit pension plan for the reporting period, most often determined based on the funding policy of the plan. Typically the calculated contribution has a normal cost payment and an amortization payment. Closed Amortization Period: A specific number of years that is counted down by one each year and therefore declines to zero with the passage of time. For example if the amortization period is initially set at 30 years, it is 29 years at the end of one year, 28 years at the end of two years, etc. See Funding Period and Open Amortization Period. Decrements: Those causes/events due to which a member’s status (active-inactive-retiree-beneficiary) changes, that is: death, retirement, disability, or termination. Defined Benefit Plan: An employer-sponsored retirement benefit that provides workers, upon attainment of designated age and service thresholds, with a monthly benefit based on the employee’s salary and

Law Enforcement and Custodial Officer Supplemental Retirement Fund of the Employees Retirement System of Texas
H - 3
length of service. The value of a benefit from a defined benefit plan is generally not affected by the return on the assets that are invested to fund the benefit.
Defined Contribution Plan: A retirement plan, such as a 401(k) plan, a 403(b) plan, or a 457 plan, in which the contributions to the plan are assigned to an account for each member, and the plan’s earnings are allocated to each account, and each member’s benefits are a direct function of the account balance.
Employer Normal Cost: The portion of the Normal Cost to be paid by the employers. This is equal to the Normal Cost less expected member contributions.
Experience Study: A periodic review and analysis of the actual experience of the Fund which may lead to a revision of one or more actuarial assumptions. Actual rates of decrement and salary increases are compared to the actuarially assumed values and modified as deemed appropriate by the Actuary.
Funded Ratio: The ratio of the actuarial value of assets (AVA) to the actuarial accrued liability (AAL). Plans sometimes calculate a market funded ratio, using the market value of assets (MVA), rather than the AVA.
Funding Period or Amortization Period: The term “Funding Period” is used it two ways. In the first sense, it is the period used in calculating the Amortization Payment as a component of the ADC. This funding period is chosen by the Board of Trustees. In the second sense, it is a calculated item: the number of years in the future that will theoretically be required to amortize (i.e., pay off or eliminate) the Unfunded Actuarial Accrued Liability, based on the statutory employer contribution rate, and assuming no future actuarial gains or losses.
GASB: The Governmental Accounting Standards Board is an organization that exists in order to promulgate accounting standards for governmental entities.
Normal Cost: That portion of the Actuarial Present Value of pension plan benefits and expenses which is allocated to a valuation year by the Actuarial Cost Method. Any payment in respect of an Unfunded Actuarial Accrued Liability is not part of Normal Cost (see Amortization Payment). For pension plan benefits which are provided in part by employee contributions, Normal Cost refers to the total of employee contributions and employer Normal Cost unless otherwise specifically stated. Under the entry age normal cost method, the Normal Cost is intended to be the level cost (when expressed as a percentage of pay) needed to fund the benefits of a member from hire until ultimate termination, death, disability or retirement.
Open Amortization Period: An open amortization period is one which is used to determine the Amortization Payment but which does not change over time. In other words, if the initial period is set as 30 years, the same 30-year period is used in determining the Amortization Period each year. In theory, if an Open Amortization Period is used to amortize the Unfunded Actuarial Accrued Liability, the UAAL will never completely disappear, but will become smaller each year, either as a dollar amount or in relation to covered payroll.
Unfunded Actuarial Accrued Liability: The excess of the Actuarial Accrued Liability over the Actuarial Value of Assets. This value may be negative in which case it may be expressed as a negative Unfunded Actuarial Accrued Liability, also called the Funding Surplus.
Valuation Date or Actuarial Valuation Date: The date as of which the value of assets is determined and as of which the Actuarial Present Value of Future Plan Benefits is determined. The expected benefits to be paid in the future are discounted to this date.
Judicial Retirement System of Texas, Plan 2 Annual Actuarial Valuation - Funding As of August 31, 2019

December 4, 2019
Board of Trustees Employees Retirement System of Texas 200 East 18th Street Austin, TX 78701 Re: Actuarial Valuation for Funding Purposes as of August 31, 2019
Members of the Board:
We certify that the information contained in this report is accurate and fairly presents the actuarial position of the Judicial Retirement System of Texas, Plan 2 (JRS-2) as of August 31, 2019. This report was prepared at the request of the Board and is intended for use by ERS staff and those designated or approved by the Board. This report may be provided to parties other than ERS only in its entirety and only with the permission of the Board.
Actuarial Valuation
The primary purposes of the actuarial valuation report are to determine the adequacy of the current State and employer contribution rates, describe the current financial condition of JRS-2, analyze changes in the condition of JRS-2, and provide various summaries of the data.
The current financial outlook for JRS-2 is very poor. It is important to understand that the currently scheduled contributions are not expected to accumulate sufficient assets in order to pay all of the currently scheduled benefits when due. Based on current expectations and assumptions, JRS-2 is projected to remain solvent until the year 2076. Contributions must materially increase in the next legislative session to secure the benefits for current members.
Plan Provisions
Our actuarial valuation as of August 31, 2019 reflects the benefit and contribution provisions set forth in Chapters 836 through 840 of the Texas Government Code. The current plan provisions are outlined in Section E of this report.
Actuarial Assumptions and Methods
The assumptions and methods applied in this actuarial valuation were adopted by the Board of Trustees on August 23, 2017 based on the experience investigation that covered the five-year period from September 1, 2011 through August 31, 2016. Additionally, this actuarial valuation incorporates the notable across-the-board pay increases budgeted by the State Legislature when they are granted for the current biennium. The current actuarial assumptions and methods are outlined in Section F of this report.

Board of Trustees December 4, 2019 Page 2
Data
The valuation was based upon information as of August 31, 2019, furnished by ERS staff, concerning system benefits, financial transactions, plan provisions and active members, terminated members, retirees and beneficiaries. We checked for internal and year-to-year consistency, but did not audit the data. We are not responsible for the accuracy or completeness of the information provided by ERS staff.
Certification
All of our work conforms with generally accepted actuarial principles and practices, and to the Actuarial Standards of Practice issued by the Actuarial Standards Board. In our opinion, our calculations also comply with the requirements of, where applicable, the Internal Revenue Code and ERISA.
The signing actuaries are independent of the plan sponsor. Mr. Falls, Mr. Newton and Ms. Woolfrey are Enrolled Actuaries and Fellows of the Society of Actuaries, and all of the undersigned are Members of the American Academy of Actuaries, and meet the Qualification Standards of the American Academy of Actuaries. Finally, each of the undersigned are experienced in performing valuations for large public retirement systems.
Respectfully submitted,
Gabriel, Roeder, Smith & Company
R. Ryan Falls, FSA, EA, MAAA Joseph P. Newton, FSA, EA, MAAA
Senior Consultant & Actuary Pension Market Leader & Actuary
Dana Woolfrey, FSA, EA, MAAA Thomas J. Bevins, ASA, MAAA
Consultant & Actuary Actuary

Judicial Retirement System of Texas, Plan 2
Table of Contents
Section
Cover Letter
Section A Executive Summary
Section B Discussion
Section C Tables
1 - Development of Employer Cost
2 - Actuarial Present Value of Future Benefits
3 - Analysis of Normal Cost
4 - Historical Summary of Active Member Data
5 - Reconciliation of Plan Net Assets
6 - Development of Actuarial Value of Assets
7 - History of Investment Return Rates
8 - History of Cash Flow
9 - Total Experience Gain or Loss
10 - Solvency Test
11 - Historical Contribution Rates
Section D Risks Associated with Measuring the Accrued Liability and Actuarially Determined Contribution
Section E Summary of Plan Provisions
Section F Summary of Actuarial Assumptions and Methods
Section G Detailed Summaries of Membership Data
Section H Glossary

SECTION A
EXECUTIVE SUMMARY

Judicial Retirement System of Texas, Plan 2 A - 1
Executive Summary
2019 2018
Membership
• Number of
- Active members 573 561
- Retirees and beneficiaries 472 393
- Inactive, vested 16 12
- Inactive, nonvested 171 141
- Total 1,232 1,107
• Valuation Payroll 91,026,600$ 80,072,000$
Statutory contribution rates FY 2020 FY 2019
• Members 9.39% 7.46%
• State 15.663% 15.663%
Actuarially Sound Rate (funds normal cost
and amortizes unfunded accrued liability
over 31 years, per Section 840.106 of the
Texas Government Code) 27.84% 23.84%
Assets
• Market value (MVA) 456,192,249$ 453,379,786$
• Actuarial value (AVA) 467,787,034$ 447,077,710$
• Return on market value (gross) 3.04% 9.58%
• Return on market value (net) 3.00% 9.54%
• Return on actuarial value 7.0% 7.9%
Actuarial Information on AVA (smoothed)
• Normal cost % 23.14% 20.83%
• Total normal cost 21,063,555$ 16,678,998$
• Actuarial accrued liability 534,563,746$ 487,771,546$
• Unfunded actuarial accrued
liability (UAAL) 66,776,712$ 40,693,836$
• Funded ratio 87.5% 91.7%
• Funding period (years) Never 69
Actuarial Information on MVA
• Unfunded actuarial accrued
liability (UAAL) 78,371,497$ 34,391,760$
• Funded ratio 85.3% 92.9%
Item

Judicial Retirement System of Texas, Plan 2 A - 2
The following chart illustrates the recent history and outlook of the funded status of JRS-2 over the next five years:
August 31, 2015 2016 2017 2018 2019 2020 2021 2022 2023 2024
Funded
Ratio
92.2%
92.9%
90.8%
91.7%
87.5%
86.8%
86.1%
85.4%
84.6%
84.3%
UAAL
(in millions) $31.4 $30.4 $42.8 $40.7 $66.8 $73.7 $81.0 $88.6 $96.5 $101.7
ASC 23.79% 23.48% 23.85% 23.84% 27.84% 28.21% 28.57% 28.94% 29.30% 29.48%
The projections beyond 2019 are based on the same assumptions, methods and provisions used for the August 31, 2019 valuation, which include the notable across-the-board pay increases budgeted by the State Legislature when they are granted and the assumptions adopted by the Board in August 2017. Additionally, the market value of assets is expected to earn 7.5% per year.
Currently scheduled member and State contributions are not expected to accumulate sufficient assets in order to pay all of the currently scheduled benefits when due. Based on current expectations and assumptions, JRS-2 is projected to have money in the trust fund until the year 2076. After which, the funding would revert to a pay-as-you-go status. When JRS-2 reverts to a pay-as-you-go status, the required Legislative appropriation for JRS-2 will immediately almost quadruple (i.e., increase by approximately 3.5 times), and remain at that level, in order to ensure all retirees continue to receive their promised benefit. Therefore, for the current benefit structure to be sustainable, the contribution levels will need to be increased.
50%
55%
60%
65%
70%
75%
80%
85%
90%
95%
100%
2015 2016 2017 2018 2019 2020 2021 2022 2023 2024
Historical and Future Projected Funded Ratios As of August 31

SECTION B
DISCUSSION

Judicial Retirement System of Texas, Plan 2 B - 1
Discussion
Introduction The results of the August 31, 2019 actuarial valuation of the Judicial Retirement System of Texas, Plan 2 (JRS-2) are presented in this report. The primary purposes of this actuarial valuation report are to determine the adequacy of the current State and employer contribution rates, describe the current financial condition of JRS-2, analyze the changes in the condition of JRS-2, and provide various summaries of the data. The total contribution rate for the current fiscal year exceeds the normal cost by 1.913% of payroll, which, on both an actuarial and market value of assets basis, is not sufficient to amortize the unfunded liability over a finite period of time. Based on current expectations and assumptions, JRS-2 is expected to remain solvent until 2076, after which the funding would revert to a pay-as-you-go status. All of the tables referenced in the following discussion appear in Section C of this report. Plan Provisions During the most recent legislative session, the Texas Legislature enacted House Bill 2384. House Bill 2384 increases the member contribution rate to 9.50% of member’s compensation for service after August 31, 2019. Additionally, House Bill 2384 clarifies that the retirement annuity for visiting judges who earn additional service credit will be based on their last salary while actively serving in office, not the salary earned while a visiting judge. Although not considered a plan change, House Bill 2384 also restructured the compensation and resulting retirement benefits for State judges, prompting a change to the assumption for long term salary increases, as noted in the subsection below. The current plan provisions are outlined in Section E of this report. Actuarial Assumptions and Methods The assumptions and methods applied in this actuarial valuation were adopted by the Board of Trustees on August 23, 2017 based on the experience investigation that covered the five-year period from September 1, 2011 through August 31, 2016. We believe the assumptions are internally consistent and are reasonable, based on the actual experience of JRS-2. The actuarial valuation as of August 31, 2019 incorporates the notable across-the-board pay increases budgeted by the State Legislature when they are granted for the current biennium. Specifically, judges were assumed to begin receiving salaries based on the new judicial salary schedule, as enacted by House Bill 2384, on September 1, 2019. This resulted in significant salary increases for many judges, specifically for those with longer service tenures. The recent changes in the judicial salary structure prompted a change to the long term growth assumption for judicial salaries from 2.75% to 2.50%. The assumed salary progression for a State judge was also updated to incorporate the scheduled service-based increases according to the State judicial salary

Judicial Retirement System of Texas, Plan 2 B - 2
schedule, as enacted by House Bill 2384. All other assumptions and methods are the same as the prior valuation. The results of the actuarial valuation are dependent upon the actuarial assumptions used. Actual results can and almost certainly will differ, as actual experience deviates from the assumptions. Even seemingly minor changes in the assumptions can materially change the liabilities, calculated contribution rates and funding periods. A review of the impact of a different set of assumptions on the funded status of JRS-2 is outside the scope of this actuarial valuation. The current actuarial assumptions and methods are outlined in Section F of this report. Funding Adequacy The Board of Trustees of ERS approved the Pension Funding Priorities and Guidelines on May 23, 2018. For the Board, adoption of this policy was intended to:
• enhance communications and provide transparency to the Legislature and plan members and retirees regarding Board of Trustees’ positions on plan funding strategy;
• provide policy guidance to current and future Boards; and • ensure that legislators, elected officials and other stakeholders have clear and accurate
information about the Trust’s funding goals and the needs of the Board in supporting sound fiduciary investment decisions in accordance with Texas Government Code Section 815.106.
This policy also stated that the main objective of ERS’ retirement programs is to fully fund the long-term cost of benefits provided by statute, through disciplined and timely accumulation of contributions and prudent investment of assets to deliver earned benefits on a continuing basis. In support of this objective, the policy laid out a multi-level funding period goal to gradually achieve funding on sound actuarial principles:
1. Avoid trust fund depletion of the pre-funded plans, 2. Meet current statutory standard of a 31-year funding period for unfunded liabilities, per Texas
Government Code Sections 811.006 and 840.106, and 3. Match funding period to the average years of service at retirement once a 31-year funding period is
achieved, and closed. The member contribution rates are established by State statute and the State contribution rate is set by State statute and legislative appropriation. For the fiscal year beginning September 1, 2019, members accruing benefits contribute 9.50% of payroll and the State contributes 15.663% of payroll. Since some active JRS-2 members have elected to cease contributing to the plan as well as cease accruing additional benefits, the effective member contribution rate for the fiscal year beginning September 1, 2019 is 9.39% of payroll. This State contribution rate is subject to future legislative appropriations. The unfunded actuarial accrued liability (UAAL) of JRS-2 increased from $40.7 million as of August 31, 2018 to $66.8 million as of August 31, 2019. Additionally, the funded ratio of JRS-2—actuarial value of assets divided by the actuarial accrued liability—decreased from 91.7% to 87.5% as of August 31, 2019. This deterioration in plan funding levels was primarily due to the new judicial salary schedule, as enacted by House Bill 2384. The funded status is one of many metrics used to show trends and develop future expectations about the health of a retirement system. The funded status measure itself is not appropriate for assessing the sufficiency of plan assets to cover the estimated cost of settling the plan’s benefit

Judicial Retirement System of Texas, Plan 2 B - 3
obligations or assessing the need for or the amount of future contributions since it does not reflect normal cost contributions, the timing of amortization payments, or future experience other than expected. The valuation shows that the total normal cost for funding purposes is 23.14% of payroll. The total contribution rate is 25.053% of payroll for the current fiscal year. The total contribution rate for the current fiscal year exceeds the normal cost by 1.913% of payroll, which is not sufficient to amortize the UAAL over a finite period of time. As assuming the market value of assets earns 7.50% per year, JRS-2 is projected to remain solvent until the year 2076, after which the funding would revert to a pay-as-you-go status. As a result, the first level of the Board’s funding period goal is not currently being realized. The second level of the Board’s funding period goal is to fund the sum of the normal cost and the amount necessary to amortize any unfunded actuarial accrued liability over a period that does not exceed 30 years by one or more years. Further, Section 840.106 of the Texas Government Code also limits the modifications to JRS-2 that would, essentially, increase benefits or lower contributions to the trust unless the current level of benefits and contributions are expected to amortize any unfunded actuarial accrued liability over a period that does not exceed 30 years by one or more years. In this context, the Actuarially Sound Contribution (ASC) rate is the contribution rate that meets this standard. Based on the actuarial valuation as of August 31, 2019, the ASC rate for JRS-2 is 27.84% of payroll. Based on the total contribution rate of 25.053% of payroll, the second level of the Board’s funding period goal is not currently being realized. The ASC is currently calculated based on a 31-year open amortization period. This means that the ASC will always be calculated with the same 31-year period and the UAAL would never completely be eliminated. We recommend that the Board seek a plan funding strategy that meets the third level of the Board’s funding period goal or meets an ultimate goal of eliminating the UAAL by a certain date. System Assets This report contains several tables that summarize key information with respect to the JRS-2 assets. The total market value of assets increased from $453.4 million to $456.2 million as of August 31, 2019. Table 5 reconciles the changes in the fund during the year. Total contributions increased from $18.5 million in fiscal year 2018 to $19.6 million in fiscal year 2019. Table 6 shows the development of the Actuarial Value of Assets (AVA). The current AVA method recognizes each year’s gain or loss over a closed five year period and allows for direct offsetting of gains and losses. The AVA increased from $447 million to $468 million as of August 31, 2019. When measured on a market value, the approximate gross investment return for the fiscal year ending August 31, 2019 was 3.04%, and the return net of investment expenses was 3.00%. When measured on an actuarial value, the net investment return was 7.0%. Table 7 shows a history of return rates. The JRS-2 ten-year average market return, gross of all expenses as reported by the ERS Master Trust Custodian, is 8.20%. The ten-year average return net of investment expenses is 8.09%. Table 8 provides a history of the contributions paid into JRS-2 and the administrative expenses and benefit payments that have been paid out of JRS-2. This table shows that JRS-2 paid administrative expenses and benefit payments, in excess of contributions received, of $6.7 million (or 1.5% of assets) in fiscal year 2018 and the amount was $10.0 million (or 2.2% of assets) in fiscal year 2019. ERS should continue to monitor this deficit as it could impact the future liquidity needs of JRS-2. Table 11 provides a history of contribution

Judicial Retirement System of Texas, Plan 2 B - 4
rates, as a percent of payroll, paid into the trust by the State, agencies, and members. This table also shows a history of the total normal cost and the Actuarially Sound Contribution (ASC). Data The valuation was based upon information as of August 31, 2019, furnished by ERS staff, concerning system benefits, financial transactions, plan provisions and active members, terminated members, retirees and beneficiaries. We checked for internal and year-to-year consistency, but did not audit the data. We are not responsible for the accuracy or completeness of the information provided by ERS staff. The tables in Section G show key census statistics for the various groups included in the valuation.

SECTION C
TABLES

Judicial Retirement System of Texas, Plan 2 C - 1
Table 1 Development of Employer Cost
August 31, 2019 August 31, 2018
1. Payroll
a. Reported Payroll (August Payroll of Active Members) 81,710,000$ 80,072,000$
b. Valuation Payroll (Expected Covered Payroll for
Following Plan Year) 91,026,600 80,072,000
2. Total Normal Cost Rate
a. Gross normal cost rate 22.81% 20.50%
b. Administrative expenses 0.33% 0.33%
c. Total (Item 2a + Item 2b) 23.14% 20.83%
3. Actuarial Accrued Liability for Active Members
a. Present value of future benefits for active members 335,516,196$ 314,011,342$
b. Less: present value of future normal costs (123,298,533) (83,398,816)
c. Actuarial accrued liability 212,217,663$ 230,612,526$
4. Total Actuarial Accrued Liability for:
a. Retirees and beneficiaries 308,068,547$ 246,496,810$
b. Inactive members 14,277,536 10,662,210
c. Active members (Item 3c) 212,217,663 230,612,526
d. Total 534,563,746$ 487,771,546$
5. Actuarial Value of Assets 467,787,034$ 447,077,710$
6. Unfunded Actuarial Accrued Liability
(UAAL) (Item 4d - Item 5) 66,776,712$ 40,693,836$
7. Contribution Rate Needed to Fund Normal Cost Plus
Amortize the UAAL Over 31 Years 27.84% 23.84%
8. Allocation of Contribution Rate
a. Employer rate 15.663% 15.663%
b. Member rate 9.39% 7.46%
c. Total contribution rate 25.053% 23.123%
d. Total normal cost rate 23.14% 20.83%
e. Available contribution rate to amortize UAAL 1.913% 2.293%
f. Total contribution rate 25.053% 23.123%
9. Funding period based on statutory contribution rates
and Actuarial Value of Assets (years) Never 69

Judicial Retirement System of Texas, Plan 2 C - 2
Table 2 Actuarial Present Value of Future Benefits
August 31, 2019 August 31, 2018
1. Active Members
a. Service Retirement 306,898,474$ 267,690,585$
b. Disability Benefits 3,693,678 2,891,604
c. Death Before Retirement 8,636,983 31,290,493
d. Termination 16,287,061 12,138,660
e. Total 335,516,196$ 314,011,342$
2. Inactive Members 14,277,536$ 10,662,210$
3. Annuitants 308,068,547$ 246,496,810$
4. Total Actuarial Present Value 657,862,279$ 571,170,362$
of Future Benefits

Judicial Retirement System of Texas, Plan 2 C - 3
Table 3 Analysis of Normal Cost
August 31, 2019 August 31, 2018
1. Gross Normal Cost Rate
a. Service Retirement 19.42% 15.51%
b. Disability Benefits 0.43% 0.40%
c. Death Before Retirement 0.68% 2.66%
d. Termination 2.28% 1.93%
e. Total 22.81% 20.50%
2. Administrative Expenses 0.33% 0.33%
3. Total Normal Cost 23.14% 20.83%
4. Less: Member Rate 9.39% 7.46%
5. Employer Normal Cost Rate 13.75% 13.37%

Judicial Retirement System of Texas, Plan 2 C - 4
Table 4 Historical Summary of Active Member Data
Valuation as of Percent Annual Percent Percent Average Average
August 31, Number Increase Payroll ($) Increase $ Amount Increase Age Service
(1) (2) (3) (4) (5) (6) (7) (8) (9)
2008 518 N/A 66,110,000 N/A 127,625 N/A 54.9 9.4
2009 533 2.9% 67,967,500 2.8% 127,519 -0.1% 55.2 9.0
2010 539 1.1% 68,755,000 1.2% 127,560 0.0% 55.8 9.5
2011 546 1.3% 69,655,000 1.3% 127,573 0.0% 55.7 9.2
2012 541 -0.9% 68,777,500 -1.3% 127,130 -0.3% 56.5 10.0
2013 545 0.7% 69,515,000 1.1% 127,550 0.3% 56.5 9.6
2014 554 1.7% 79,122,500 13.8% 142,820 12.0% 57.3 10.2
2015 563 1.6% 80,352,000 1.6% 142,721 -0.1% 56.9 9.3
2016 548 -2.7% 78,238,000 -2.6% 142,770 0.0% 57.4 10.1
2017 557 1.6% 79,330,000 1.4% 142,424 -0.2% 57.2 9.8
2018 561 0.7% 80,072,000 0.9% 142,731 0.2% 57.8 10.4
2019 573 2.1% 81,710,000 2.0% 142,600 -0.1% 56.4 8.5
Active Members Covered Payroll Average Salary

Judicial Retirement System of Texas, Plan 2 C - 5
Table 5 Reconciliation of Plan Net Assets
August 31, 2019 August 31, 2018
(1) (2)
1. Market value of assets at beginning of year 453,379,786$ 420,850,181$
2. Revenue for the year
a. Contributions for the year
i. State (including membership fees) 13,100,263$ 12,559,722$
ii. Member (including penalty interest) 6,462,797 5,939,830
iii. Total 19,563,060$ 18,499,552$
b. Net investment income 12,832,187$ 39,191,536$
c. Total revenue 32,395,247$ 57,691,088$
3. Disbursements for the year
a. Benefit payments and refunds 29,220,121 24,865,580$
b. Administrative expenses 362,663 295,903
c. Total expenditures 29,582,784 25,161,483
4. Increase in net assets
(Item 2c - Item 3c) 2,812,463$ 32,529,605$
5. Market value of assets at end of year (Item 1 + Item 4) 456,192,249$ 453,379,786$
Year Ending

Judicial Retirement System of Texas, Plan 2 C - 6
Table 6 Development of Actuarial Value of Assets
Year Ending
August 31, 2019
1. Market value of assets at beginning of year 453,379,786$
2. Net new investments
a. Contributions for the year (Table 5) 19,563,060$
b. Disbursements for the year (Table 5) (29,582,784)
c. Subtotal (10,019,724)
3. Market value of assets at end of year 456,192,249$
4. Net earnings (Item 3 - Item 1 - Item 2) 12,832,187$
5. Assumed investment return rate for fiscal year 7.50%
6. Expected return 33,627,744$
7. Excess return (Item 4 - Item 6) (20,795,557)$
8.
Fiscal
Year
End
Remaining Deferrals
of Excess (Shortfall) of
Investment Income
Offsetting of
Gains/(Losses)
Net Deferrals
Remaining
Years
Remaining
Recognized for
this valuation
Remaining after
this valuation
(1) (2) (3) = (1) + (2) (4) (5) = (3) / (4) (6) = (3) - (5)
2015 0$ 0$ 0$ 1 0$ 0$
2016 0 0 0 2 0 0
2017 0 0 0 3 0 0
2018 6,302,076 (6,302,076) 0 4 0 0
2019 (20,795,557) 6,302,076 (14,493,481) 5 (2,898,696) (11,594,785)
Total (14,493,481)$ 0$ (14,493,481)$ (2,898,696)$ (11,594,785)$
9. Actuarial value of assets as of August 31, 2019 (Item 3 - Item 8, Column 6) 467,787,034$
10.Ratio of actuarial value to market value 102.5%
Development of amounts to be recognized as of August 31, 2019:

Judicial Retirement System of Texas, Plan 2 C - 7
Table 7 History of Investment Return Rates
Year Ending Market Market
August 31 of Returns (Gross) Returns (Net) Actuarial
(1) (2) (3) (4)
1998 8.30% 8.23% N/A
1999 16.26% 16.46% N/A
2000 9.43% 9.40% N/A
2001 -6.91% -6.93% N/A
2002 -7.17% -7.21% N/A
2003 9.20% 9.14% 5.2%
2004 11.69% 11.64% 6.2%
2005 12.71% 12.62% 7.5%
2006 8.83% 8.76% 7.7%
2007 13.88% 13.76% 8.8%
2008 -4.58% -4.69% 5.9%
2009 -6.60% -6.71% 3.5%
2010 6.65% 6.48% 4.1%
2011 12.58% 12.36% 5.7%
2012 8.22% 8.04% 7.6%
2013 10.07% 9.87% 8.0%
2014 14.70% 14.58% 9.3%
2015 0.49% 0.44% 7.4%
2016 5.32% 5.28% 7.0%
2017 12.15% 12.11% 7.8%
2018 9.58% 9.54% 7.9%
2019 3.04% 3.00% 7.0%
Average Returns
Last Five Years: 6.03% 5.99% 7.4%
Last Ten Years: 8.20% 8.09% 7.2%
Last Fifteen Years: 6.94% 6.84% 7.0%
Last Twenty Years: 5.92% 5.83% N/A Market returns provided by ERS Master Trust Custodian.
Rates in Column (2) represent the market returns gross of all expenses. Rates in Column (3) represent the market returns net of investment expenses. Net returns may exceed gross returns in years where adjustments are made to fee expenses.

Judicial Retirement System of Texas, Plan 2 C - 8
Table 8 History of Cash Flow
External External Cash
Year Ending Benefit Payments Administrative Cash Flow Market Value Flow as Percent
August 31, Contributions and Refunds Expenses Total for the Year of Assets of Market Value
(1) (2) (3) (5) (6) (7) (8) (9)
2007 15,034 (5,805) (395) (6,200) 8,834 217,665 4.1%
2008 15,102 (6,717) (244) (6,962) 8,141 215,041 3.8%
2009 15,579 (8,229) (240) (8,469) 7,110 205,730 3.5%
2010 15,632 (9,407) (277) (9,684) 5,948 225,265 2.6%
2011 16,224 (11,768) (286) (12,054) 4,170 259,624 1.6%
2012 8,321 (12,982) (230) (13,212) (4,891) 295,913 -1.7%
2013 8,817 (14,869) (228) (15,098) (6,281) 318,385 -2.0%
2014 17,406 (16,420) (267) (16,687) 719 365,290 0.2%
2015 17,922 (19,238) (284) (19,522) (1,600) 364,510 -0.4%
2016 18,129 (21,155) (226) (21,381) (3,252) 381,120 -0.9%
2017 18,511 (23,361) (295) (23,656) (5,145) 420,850 -1.2%
2018 18,500 (24,866) (296) (25,162) (6,662) 453,380 -1.5%
2019 19,563 (29,220) (363) (29,583) (10,020) 456,192 -2.2%
Dollar amounts in thousands
Distributions and Expenditures

Judicial Retirement System of Texas, Plan 2 C - 9
Table 9 Total Experience Gain or Loss
Year Ending Year Ending
August 31, 2019 August 31, 2018
(2) (3)
A. Calculation of total actuarial gain or loss
1. Unfunded actuarial accrued liability (UAAL), previous year 40,693,836$ 42,753,509$
2. Normal cost for the year (excluding administrative expenses) 16,414,760 16,056,392
3. Actual administrative expenses 362,663 295,903
4. Contributions for the year (excluding service purchases) (19,093,012) (18,425,579)
5. Interest at 7.5%
a. On UAAL 3,052,038$ 3,206,513$
b. On normal cost and administrative expenses 629,153 613,211
c. On contributions (715,988) (690,959)
d. Total 2,965,203$ 3,128,765$
6. Assumption change (Gains)/Losses (1,930,114)$ 0$
7. Legislative changes*
a. Plan Changes due to HB2384 (1,802,177) 0
b. Legislated Pay Changes due to HB2384 24,932,680 0
c. Total 23,130,503$ 0$
8. Expected UAAL (Sum of Items 3 through 8) 62,543,839 43,808,990
9. Actual UAAL 66,776,712 40,693,836
10. Total (gain)/loss for the year (Item 10 - Item 9) 4,232,873$ (3,115,154)$
B. Source of gains and losses
11. Asset (Gain)/Loss for the year 0.45% 2,426,041$ (1,575,519)$
12. Pay Increases (Less)/Greater than Expected 0.12% 637,336 426,758
13. Non-Retired Demographic (Gains)/Losses 0.42% 2,260,512 (2,609,238)
14. Post-Retirement Mortality (Gains)/Losses 0.02% (98,837) 145,441
15. Other Demographic (Gains)/Losses 0.19% (992,179) 497,404
16. Total (Sum of Items 12 through 16) 0.79% 4,232,873$ (3,115,154)$
Item
(1)
% of
AAL
* The plan experiences a (gain)/loss when across-the-board pay increases budgeted by the State Legislature are (less)/greater than assumed.

Judicial Retirement System of Texas, Plan 2 C - 10
Table 10 Solvency Test
Actuarial Accrued Liability and Percent of Active Member Payroll for:
% of % of % of Actuarial Value
August 31, (1) Payroll (2) Payroll (3) Payroll of Assets (1) (2) (3)
2007 44,615$ 69% 62,008$ 96% 114,261$ 177% 211,933$ 100% 100% 92%
2008 50,408 76% 63,792 96% 124,898 189% 232,891 100% 100% 95%
2009 51,733 76% 85,845 126% 117,991 174% 248,279 100% 100% 94%
2010 57,347 83% 92,253 134% 132,160 192% 264,515 100% 100% 87%
2011 57,769 83% 120,798 173% 121,596 175% 283,935 100% 100% 87%
2012 63,678 93% 122,571 178% 128,950 187% 300,433 100% 100% 89%
2013 64,435 93% 147,052 212% 147,571 212% 318,026 100% 100% 72%
2014 69,364 88% 153,383 194% 163,539 207% 348,431 100% 100% 77%
2015 67,428 84% 194,524 242% 142,059 177% 372,615 100% 100% 78%
2016 73,450 94% 196,779 252% 155,636 199% 395,457 100% 100% 80%
2017 72,977 92% 241,314 304% 149,313 188% 420,850 100% 100% 71%
2018 78,283 98% 246,497 308% 162,992 204% 447,078 100% 100% 75%
2019 70,243 86% 308,069 377% 156,252 191% 467,787 100% 100% 57%
Note : Dollar amounts in thousands
Liabilities Covered
by Assets
Employer Financed
Portion of Vested
and Nonvested BenefitsInterest
Retirees and
Beneficiaries Currently
Receiving Benefits
Accumulated Member
Contributions Including
Portion of Accrued

Judicial Retirement System of Texas, Plan 2 C - 11
Table 11 Historical Contribution Rates
Actuarial
Valuation as Total Normal
of August 31, State Members* Total Cost Rate ASC**
1998 16.830% 6.00%* 22.830% 21.43% Not calculated
1999 16.830% 6.00%* 22.830% 21.82% Not calculated
2000 16.830% 6.00%* 22.830% 22.01% Not calculated
2001 16.830% 6.00%* 22.830% 22.37% Not calculated
2002 16.830% 6.00%* 22.830% 22.88% Not calculated
2003 16.830% 6.00%* 22.830% 19.58% Not calculated
2004 16.830% 6.00%* 22.830% 19.58% Not calculated
2005 16.830% 5.98% 22.810% 20.98% 22.64%
2006 16.830% 5.95% 22.780% 20.59% 21.70%
2007 16.830% 5.98% 22.810% 20.83% 21.60%
2008 16.830% 5.99% 22.820% 19.26% 19.81%
2009 16.830% 5.99% 22.820% 20.30% 20.94%
2010 16.830% 5.98% 22.810% 20.19% 21.68%
2011 6.000% 5.97% 11.970% 20.38% 21.76%
2012 6.500% 5.98% 12.480% 20.25% 21.52%
2013 15.663% 6.57% 22.233% 20.96% 24.08%
2014 15.663% 6.87% 22.533% 21.03% 23.86%
2015 15.663% 7.16% 22.823% 21.40% 23.79%
2016 15.663% 7.44% 23.103% 21.18% 23.48%
2017 15.663% 7.43% 23.093% 20.57% 23.85%
2018 15.663% 7.46% 23.123% 20.83% 23.84%
2019 15.663% 9.39% 25.053% 23.14% 27.84%
Contributions from:
** The Actuarially Sound Contribution Rate (ASC) is the rate determined as of the valuation date to
fund the normal cost and amortize the UAAL over a 31 year period.
* Effective member contribution rate due to the active JRS-2 members that have elected to cease
contributing to the plan as well as cease accruing additional benefits. FY 1998-2004 shows the rate
members contributed if they chose to continue contributions. FY 2005 and forward reflects the
effective rate that accounts for some JRS 2 members choosing not to participate after 20 years (or
12 years, if member is an appellate court justice).

SECTION D
RISKS ASSOCIATED WITH MEASURING THE ACCRUED LIABILITY
AND ACTUARIALLY DETERMINED CONTRIBUTION
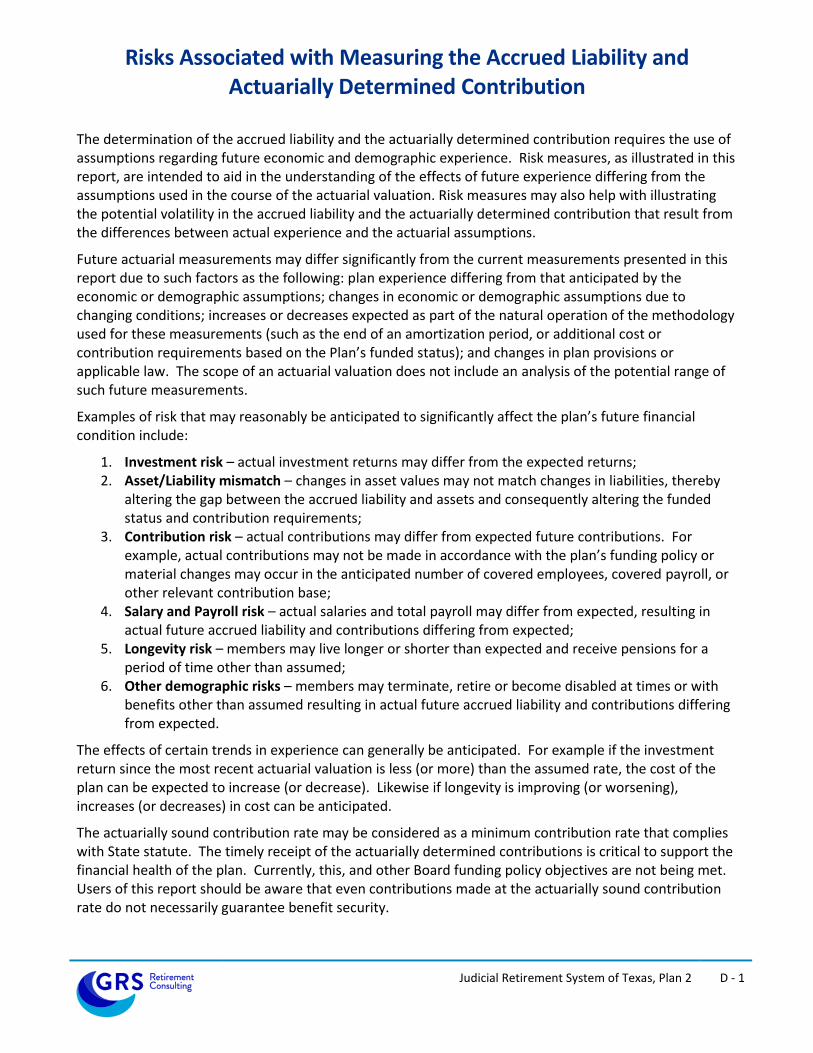
Judicial Retirement System of Texas, Plan 2 D - 1
Risks Associated with Measuring the Accrued Liability and Actuarially Determined Contribution
The determination of the accrued liability and the actuarially determined contribution requires the use of assumptions regarding future economic and demographic experience. Risk measures, as illustrated in this report, are intended to aid in the understanding of the effects of future experience differing from the assumptions used in the course of the actuarial valuation. Risk measures may also help with illustrating the potential volatility in the accrued liability and the actuarially determined contribution that result from the differences between actual experience and the actuarial assumptions.
Future actuarial measurements may differ significantly from the current measurements presented in this report due to such factors as the following: plan experience differing from that anticipated by the economic or demographic assumptions; changes in economic or demographic assumptions due to changing conditions; increases or decreases expected as part of the natural operation of the methodology used for these measurements (such as the end of an amortization period, or additional cost or contribution requirements based on the Plan’s funded status); and changes in plan provisions or applicable law. The scope of an actuarial valuation does not include an analysis of the potential range of such future measurements.
Examples of risk that may reasonably be anticipated to significantly affect the plan’s future financial condition include:
1. Investment risk – actual investment returns may differ from the expected returns; 2. Asset/Liability mismatch – changes in asset values may not match changes in liabilities, thereby
altering the gap between the accrued liability and assets and consequently altering the funded status and contribution requirements;
3. Contribution risk – actual contributions may differ from expected future contributions. For example, actual contributions may not be made in accordance with the plan’s funding policy or material changes may occur in the anticipated number of covered employees, covered payroll, or other relevant contribution base;
4. Salary and Payroll risk – actual salaries and total payroll may differ from expected, resulting in actual future accrued liability and contributions differing from expected;
5. Longevity risk – members may live longer or shorter than expected and receive pensions for a period of time other than assumed;
6. Other demographic risks – members may terminate, retire or become disabled at times or with benefits other than assumed resulting in actual future accrued liability and contributions differing from expected.
The effects of certain trends in experience can generally be anticipated. For example if the investment return since the most recent actuarial valuation is less (or more) than the assumed rate, the cost of the plan can be expected to increase (or decrease). Likewise if longevity is improving (or worsening), increases (or decreases) in cost can be anticipated.
The actuarially sound contribution rate may be considered as a minimum contribution rate that complies with State statute. The timely receipt of the actuarially determined contributions is critical to support the financial health of the plan. Currently, this, and other Board funding policy objectives are not being met. Users of this report should be aware that even contributions made at the actuarially sound contribution rate do not necessarily guarantee benefit security.

Judicial Retirement System of Texas, Plan 2 D - 2
Plan Maturity Measures
Risks facing a pension plan evolve over time. A young plan with virtually no investments and paying few benefits may experience little investment risk. An older plan with a large number of members in pay status and a significant trust may be much more exposed to investment risk. Generally accepted plan maturity measures include the following:
2019 2018 2017 2016 2015 2014 2013 2012 2011 2010
Ratio of the market value of
assets to total payroll5.0 5.7 5.3 4.9 4.5 4.6 4.1 4.3 3.7 3.3
Ratio of actuarial accrued
liability to payroll5.9 6.1 5.8 5.4 5.0 4.9 4.6 4.6 4.3 4.1
Ratio of actives to retirees
and beneficiaries1.2 1.4 1.5 1.7 1.7 2.1 2.1 2.5 2.6 3.3
Ratio of net cash flow to
market value of assets-2.2% -1.5% -1.2% -0.9% -0.4% 0.2% -2.0% -1.7% 1.6% 2.6%
Duration of the actuarial
accrued liability*9.5 9.7
*Duration measure not available before 2018
Ratio of Market Value of Assets to Payroll
The relationship between assets and payroll is a useful indicator of the potential volatility of contributions. For example, if the market value of assets is 2.0 times the payroll, a return on assets 5% different than assumed would equal 10% of payroll. A higher (lower) or increasing (decreasing) level of this maturity measure generally indicates a higher (lower) or increasing (decreasing) volatility in plan sponsor contributions as a percentage of payroll.
Ratio of Actuarial Accrued Liability to Payroll
The relationship between actuarial accrued liability and payroll is a useful indicator of the potential volatility of contributions for a fully funded plan. A funding policy that targets a funded ratio of 100% is expected to result in the ratio of assets to payroll and the ratio of liability to payroll converging over time.
The ratio of liability to payroll may also be used as a measure of sensitivity of the liability itself. For example, if the actuarial accrued liability is 2.5 times the payroll, a change in liability 2% other than assumed would equal 5% of payroll. A higher (lower) or increasing (decreasing) level of this maturity measure generally indicates a higher (lower) or increasing (decreasing) volatility in liability (and also plan sponsor contributions) as a percentage of payroll.
Ratio of Actives to Retirees and Beneficiaries
A young plan with many active members and few retirees will have a high ratio of active to retirees. A mature open plan may have close to the same number of actives to retirees resulting in a ratio near 1.0. A super-mature or closed plan may have significantly more retirees than actives resulting in a ratio below 1.0.

Judicial Retirement System of Texas, Plan 2 D - 3
Ratio of Net Cash Flow to Market Value of Assets
A positive net cash flow means contributions exceed benefits and expenses. A negative cash flow means existing funds are being used to make payments. A certain amount of negative net cash flow is generally expected to occur when benefits are prefunded through a qualified trust. Large negative net cash flows as a percent of assets may indicate a super-mature plan or a need for additional contributions. Duration of Actuarial Accrued Liability
The duration of the actuarial accrued liability may be used to approximate the sensitivity to a 1% change in the assumed rate of return. For example, duration of 10 indicates that the actuarial accrued liability would increase approximately 10% if the assumed rate of return were lowered 1%.
Additional Risk Assessment
Additional risk assessment is outside the scope of the annual actuarial valuation. Additional assessment may include scenario tests, sensitivity tests, stochastic modeling, stress tests, and a comparison of the present value of accrued benefits at low-risk discount rates with the actuarial accrued liability.

SECTION E
SUMMARY OF PLAN PROVISIONS

Judicial Retirement System of Texas, Plan 2 E - 1
Summary of Plan Provisions for Judicial Retirement System, Plan 2
Membership
Membership is mandatory at the first day of employment for eligible persons who, after August 31, 1985, became a judge, justice, or commissioner of:
(1) The Supreme Court;
(2) The Court of Criminal Appeals;
(3) Courts of Appeals;
(4) District Courts; or
(5) Specified commissioners to a court.
Member Contributions
Judicial officers contribute a percentage of their compensation based on the following schedule:
a. Fiscal year 2014: 6.60%
b. Fiscal year 2015: 6.90%
c. Fiscal year 2016: 7.20%
d. Fiscal years 2017 through 2019: 7.50%
e. Fiscal year 2020 and beyond: 9.50%
Contributions cease after member has accrued 20 years of service credit or has served 12 years on an appellate court and attained the Rule of 70. However, these members may elect to make contributions for each subsequent year of service credit and receive the additional benefit accruals.
Member contributions accumulate interest at 5.00% per year through December 31, 2013 and 2.00% interest per year, thereafter.
State of Texas Contributions
State contributions are set biennially by the legislature. For fiscal years 2020 and 2021, the State will contribute 15.663% of payroll.
Final Compensation
The State salary being paid at the time the member retires to a judge of a court of the same classification as the last court to which the member was elected or appointed. The final judicial pay tier for benefit determination is based on service excluding service as a statutory county court judge. The Final Compensation for a visiting judge is based on the final salary received while holding judicial office.
Creditable Service
The types of service creditable in JRS-2 are membership service, military service and equivalent membership service. Equivalent membership service includes: previously cancelled service, service not previously established, waiting period service, and Additional Service Credit.

Judicial Retirement System of Texas, Plan 2 E - 2
Standard Service Retirement Annuity
1. Eligibility:
a. Age 65 and ten years of service if currently holding judicial office; or
b. Age 65 and twelve years of service; or
c. Twenty years of service, regardless of age; or
d. Member’s age plus service credited in the retirement system equals 70 (Rule of 70), if the member has served at least twelve years on an appellate court.
2. Benefits: Monthly annuity payable for life, equal to 50% of Final Compensation at retirement, increased by 10% of Final Compensation at retirement if the member has not been out of judicial office for one year or the member has served as a visiting judge within one year of benefit commencement.
Members who elect to continue their contributions after 20 years of service credit, or after serving 12 years on an appellate court and attaining the Rule of 70, can earn up to a maximum total benefit of 90% of Final Compensation. For each such year, the service retirement annuity would be increased by 2.3% of the Final Compensation at retirement.
3. Normal Form of Payment: Payable for the life of the member with any remaining member account balance paid at time of death. Survivorship options and partial lump-sum option are available on an actuarially equivalent basis.
Early Commencement of Standard Service Retirement Annuity
1. Eligibility:
a. Age 60 and ten years of service if currently holding judicial office; or
b. Age 60 and twelve years of service.
2. Benefits: Standard Service Retirement Annuity with the 50% replaced by the following percentages based on age at retirement:
Attained Age Percent of
Final Compensation
60 40.0%
61 41.7
62 43.6
63 45.6
64 47.7
3. Normal Form of Payment: Payable for the life of the member with any remaining member account balance paid at time of death. Survivorship options and partial lump-sum option are available on an actuarially equivalent basis.

Judicial Retirement System of Texas, Plan 2 E - 3
Standard Non-Occupational Disability Annuity
1. Eligibility: Seven years of service and Chief Justice of the Supreme Court and the medical board must certify that the member is mentally or physically incapacitated for the further performance of regular judicial duties.
2. Benefits: Unreduced Standard Service Retirement Annuity.
3. Normal Form of Payment: Payable for the life of the member with any remaining member account balance paid at time of death. Survivorship options and partial lump-sum option are available on an actuarially equivalent basis.
Death Benefit Plan (DBP) Annuity
1. Eligibility: Death of an active member with 10 years of service.
2. Benefits: Benefits are calculated as if the member had elected an optional form of payment, received a Standard Service Retirement Annuity, and died immediately thereafter. If the member dies before becoming eligible for a Standard Service Retirement Annuity, the benefit is reduced for early retirement from age 65.
Pre-Retirement Death Refund Alternative
A refund of accumulated contributions is payable in cases of pre-retirement death where the member did not meet the eligibility requirements for a Death Benefit Plan Annuity, or the eligible beneficiary chooses to receive a refund of the member account balance in lieu of an annuity. This amount is increased by 5% of the member’s account balance at death, times full years of service credit at death, to a maximum of 100%.
Deferred Service Retirement Annuity
1. Eligibility: Twelve or more years of service and Member Contributions have not been refunded.
2. Benefits: The Standard Service Retirement Annuity earned as of the date of termination; provided that the annuity may be increased under the provisions of the proportionate retirement program if the member becomes a contributing member of another system that participates in the program.
3. Payments may commence at: Age 65; or a reduced amount as early as age 60.
4. Normal Form of Payment: Payable for the life of the member with any remaining member account balance paid at time of death. Survivorship options and partial lump-sum option are available on an actuarially equivalent basis.
Refund of Accumulated Contributions
A refund of accumulated contributions is payable in cases where a terminated member did not meet the eligibility requirements for an annuity, or a terminated member chooses to receive a refund of his or her account balance in lieu of an annuity.

Judicial Retirement System of Texas, Plan 2 E - 4
Limit on Plan Modifications
According to Section 840.106 of the Texas Government Code – a rate of member or State contributions to or a rate of interest required for the establishment of credit in the retirement system may not be reduced or eliminated, a type of service may not be made creditable in the retirement system, a limit on the maximum permissible amount of a type of creditable service may not be removed or raised, a new monetary benefit payable by the retirement system may not be established, and the determination of the amount of a monetary benefit from the system may not be increased, if, as a result of the particular action, the time, as determined by an actuarial valuation, required to amortize the UAAL of the retirement system would be increased to a period that exceeds 30 years by one or more years.

SECTION F
ACTUARIAL ASSUMPTIONS AND METHODS

Judicial Retirement System of Texas, Plan 2 F - 1
Summary of Actuarial Assumptions and Methods
The assumptions and methods applied in this actuarial valuation were adopted by the Board of
Trustees on August 23, 2017 based on the experience investigation that covered the five-year
period from September 1, 2011 through August 31, 2016.
I. Valuation Date
The valuation date is August 31 of each plan year. This is the date as of which the actuarial
present value of future benefits and the actuarial value of assets are determined.
II. Actuarial Cost Method
Because the employer contribution rate is set by statute, the actuarial valuation is used to
determine the adequacy of the current State contribution rate and describe the current financial
condition of JRS-2.
The actuarial valuation uses the Entry Age Normal actuarial cost method. Under this method, the
first step is to determine the contribution rate (level as a percentage of pay) required to provide
the benefits to each member, or the normal cost rate. The normal cost rate consists of two
pieces: (i) the member’s contribution rate, and (ii) the remaining portion of the normal cost rate
which is the employer’s normal cost rate. The total normal cost rate is based on the benefits
payable to each individual active member.
The Unfunded Actuarial Accrued Liability (UAAL) is the liability for future benefits which is in
excess of (i) the actuarial value of assets, and (ii) the present value of future normal costs. The
employer contribution provided in excess of the employer normal cost is applied to amortize the
UAAL.
The funding period is calculated as the number of years required to fully amortize the UAAL,
assuming that: (a) future market earnings, net of investment-related expenses, will equal 7.50%
per year, (b) there will be no liability gains/losses or changes in assumptions, (c) the number of
active members will remain unchanged, (d) active members who leave employment will be
replaced by new entrants each year, and (e) State contributions will remain the same percentage
of payroll as the current fiscal year.
The Entry Age actuarial cost method is an “immediate gain” method (i.e., experience gains and
losses are separately identified as part of the UAAL). However, they are amortized over the same
period applied to all other components of the UAAL.

Judicial Retirement System of Texas, Plan 2 F - 2
III. Actuarial Value of Assets
The actuarial value of assets is based on the market value of assets with a five-year phase-in of
actual investment return in excess of (less than) expected investment income. Offsetting
unrecognized gains and losses are immediately recognized, with the shortest remaining bases
recognized first and the net remaining bases continue to be recognized on their original
timeframe. Expected investment income is determined using the assumed investment return rate
and the market value of assets (adjusted for receipts and disbursements during the year). The
returns are computed net of investment-related expenses. The actuarial value of assets was reset
to be equal to the market value of assets as of August 31, 2017 and the new method has been
applied since that time.
IV. Actuarial Assumptions
Investment Return: 7.50% per year, net of investment-related expenses (composed of an assumed 2.50% inflation rate and a 5.00% real rate of return)
Administrative Expenses: 0.33% of valuation payroll per year
Salary Increases: Inflationary pay increases are assumed to occur at the beginning of the year and the remaining pay increases associated with merit, promotion and longevity are assumed to occur at the middle of the valuation year. The components of the annual increases are:
InflationReal Wage Growth
(Productivity)
Merit, Promotion
and Longevity
2.50% 0.00% See table below
Judges are assumed to follow the current statutory State judicial tiered salary schedule based on years of service and the type of judicial position held, as prescribed in Section 659.012 of the Texas Government Code, in addition to the inflation assumption. Each judicial position type has a defined State base salary with service based tiers, as follows:
Age Less than 44 or more, but
less than 88 or more
AllState base salary
110% of
base salary
120% of
base salary
Annual Salary Increases for Merit, Promotion and Longevity
Male and Female Judges
Years of Eligibility Service*
*Past service as a statutory county court judge is included in eligibility service for salary purposes. However, county court service is not applicable to JRS-2 benefits or retirement eligibility.
Payroll Growth: 2.50% per year, compounded annually (for projecting valuation payroll).
Post-Retirement Increases: None

Judicial Retirement System of Texas, Plan 2 F - 3
Age and Service Assumptions and Methods:
Eligibility Service: Eligibility Service is considered to be all service eligible for vesting purposes, which includes contributory and non-contributory service.
Benefit Service: Current Benefit Service in years and months as of the valuation date was provided by ERS. This service plus Future Earned Service, and Eligibility Service at Retirement were used to project benefit amounts.
Future Earned Service: Active members were assumed to earn one additional year of service credit in each future year employed based on their current class of membership (but not beyond the amount of credit needed to provide a 100% of average monthly compensation standard service retirement annuity).
Entry Age: Entry age is calculated as the age at the valuation date minus Eligibility Service.
Decrement Timing: All decrements – mortality, service retirement, disability retirement, and termination of employment for reasons other than death or retirement – are assumed to occur at the middle of the valuation year.

Judicial Retirement System of Texas, Plan 2 F - 4
Mortality Decrements:
Service Retirees, Beneficiaries, and Inactive Members 2017 State Retirees of Texas (SRT) mortality table. Generational mortality improvements in accordance with the ultimate rates from the scale most recently published by Retirement Plans Experience Committee of the Society of Actuaries (“Scale U-MP”) and projected from the year 2017. Sample rates for the base mortality table included below.
Age Males Females
40 0.0603 0.0380
45 0.1059 0.0687
50 0.1825 0.1215
55 0.3145 0.2150
60 0.5421 0.3804
65 0.9344 0.6730
70 1.6105 1.1908
75 2.7757 2.1069
80 4.7842 3.7277
85 8.2459 6.5956
90 14.2527 11.7028
Annual Mortality Rates per 100 Individuals
Active Members RP-2014 Active Member Mortality table. Generational mortality improvements in accordance with Scale U-MP are projected from the year 2014.
Disability Retirees RP-2014 Disabled Retiree Mortality. Generational mortality improvements in accordance with Scale U-MP are projected from the year 2014.

Judicial Retirement System of Texas, Plan 2 F - 5
Service Retirement Decrements: Graded tables based on JRS-1 and JRS-2 experience.
Eligibility Service is used to determine when the rates apply:
Age 65 with ten years of service, if member currently holding judicial office
Age 65 with twelve years of service
Twenty years of service
Age plus service equal to or greater than 70, if member has at least twelve years of service on an appellate court
Age Unreduced Reduced
50 - 64 0.20 0.10
65 - 69 0.20 N/A
70 - 74 0.25 N/A
75+ 1.00 N/A
Annual Service Retirement Rates
State Judges
Male and Female
Members are assumed to retire when they are projected to have accrued the maximum benefit of 90% of applicable salary, regardless of whether the member elects to continue contributing.
Disability Retirement Decrements: Graded Tables Based on ERS Experience
The rates do not apply before someone is eligible for the benefit.
No occupational disabilities are assumed for the elected class or judges.
Eight years of service is required for non-occupational disability retirement.
Non-occupational disability rates are assumed to be zero once the member has attained service retirement eligibility.
Sample rates for eligible members:
Age Males Females
30 0.0275 0.0135
35 0.0650 0.0442
40 0.0749 0.0896
45 0.1027 0.1455
50 0.1484 0.2072
55 0.2477 0.3488
60 0.3740 0.5583
Annual Disability Rates per 100
Participants
99% of the disability rates stated above are assumed to be attributable to nonoccupational disabilities and 1% are assumed to be attributable to occupational disabilities. No occupational disabilities are assumed for judges.
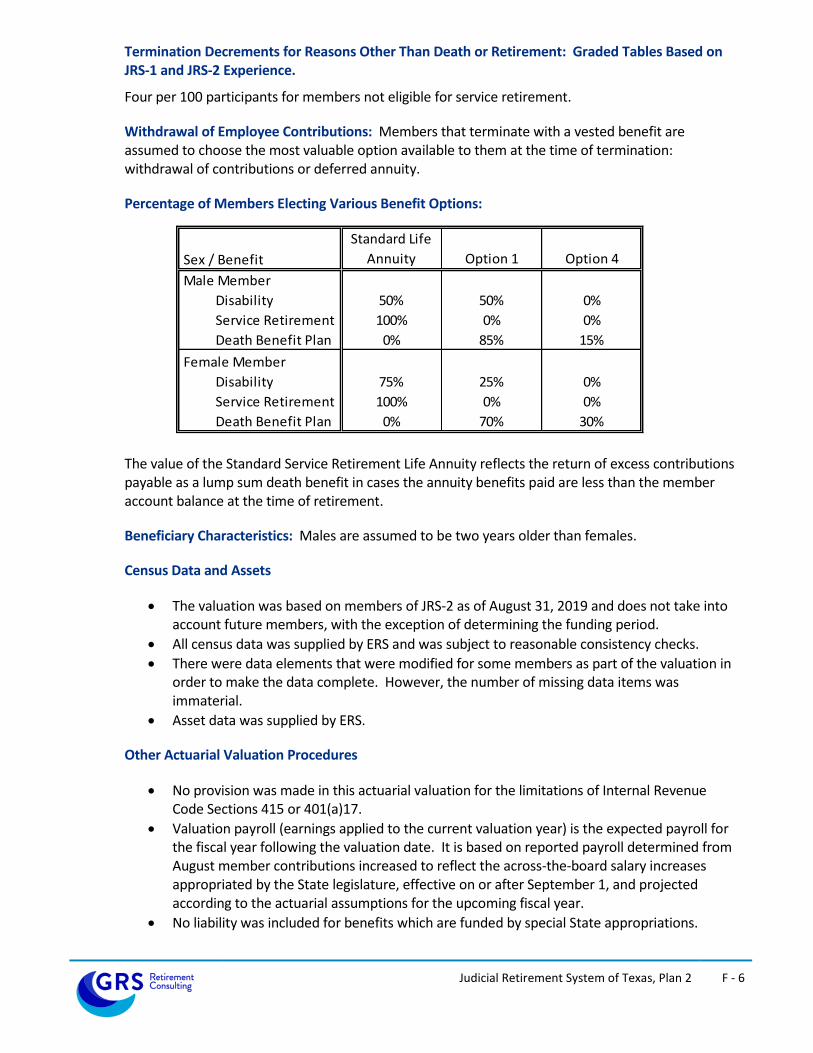
Judicial Retirement System of Texas, Plan 2 F - 6
Termination Decrements for Reasons Other Than Death or Retirement: Graded Tables Based on JRS-1 and JRS-2 Experience.
Four per 100 participants for members not eligible for service retirement.
Withdrawal of Employee Contributions: Members that terminate with a vested benefit are assumed to choose the most valuable option available to them at the time of termination: withdrawal of contributions or deferred annuity.
Percentage of Members Electing Various Benefit Options:
Sex / Benefit
Standard Life
Annuity Option 1 Option 4
Male Member
Disability 50% 50% 0%
Service Retirement 100% 0% 0%
Death Benefit Plan 0% 85% 15%
Female Member
Disability 75% 25% 0%
Service Retirement 100% 0% 0%
Death Benefit Plan 0% 70% 30%
The value of the Standard Service Retirement Life Annuity reflects the return of excess contributions payable as a lump sum death benefit in cases the annuity benefits paid are less than the member account balance at the time of retirement.
Beneficiary Characteristics: Males are assumed to be two years older than females.
Census Data and Assets
The valuation was based on members of JRS-2 as of August 31, 2019 and does not take into account future members, with the exception of determining the funding period.
All census data was supplied by ERS and was subject to reasonable consistency checks.
There were data elements that were modified for some members as part of the valuation in order to make the data complete. However, the number of missing data items was immaterial.
Asset data was supplied by ERS.
Other Actuarial Valuation Procedures
No provision was made in this actuarial valuation for the limitations of Internal Revenue Code Sections 415 or 401(a)17.
Valuation payroll (earnings applied to the current valuation year) is the expected payroll for the fiscal year following the valuation date. It is based on reported payroll determined from August member contributions increased to reflect the across-the-board salary increases appropriated by the State legislature, effective on or after September 1, and projected according to the actuarial assumptions for the upcoming fiscal year.
No liability was included for benefits which are funded by special State appropriations.

7
SECTION G
DETAILED SUMMARIES OF MEMBERSHIP DATA
Judicial Retirement System of Texas, Plan 2 G - 1
Detailed Summaries of Membership Data
Table Page
Number
A G-2 Summary of Membership Data
B G-3 Active Members: Distribution by Age and Service
C G-4 Retired and Beneficiary Members: Distribution by Age and Category

Judicial Retirement System of Texas, Plan 2 G - 2
Table A
Summary of Membership Data
Item Male Female Total
Number of Members 349 224 573
Average Annual Salaries 142,289$ 143,085$ 142,600$
Average Age 58.5 53.2 56.4
Average Entry Age 49.1 46.1 47.9
Average Service 9.4 7.1 8.5
Item Number
Annual
Annuities
Average
Annuities
Average
Age
Participants with Deferred Benefits 16 1,199,472$ 74,967$ 59.4
Service Retirees* 424 28,438,404$ 67,072$ 69.8
Beneficiaries 47 2,618,880$ 55,721$ 73.6
Disability Retirees 1 75,000$ 75,000$ 63.8
Total 488 32,331,756$ 66,254$ 69.8
* Average Age and Service at Retirement for Service Retirees are 63.2 and 15.2, respectively
Item Number
Account
Balances
Average
Account
Balance
Average
Age
Non-vested Participants 171 6,056,502$ 35,418$ 61.8
Inactive Members
Non-vested Members
Active Members

Judicial Retirement System of Texas, Plan 2 G - 3
Table B
Active Members
Distribution by Age and Service
Age 0-4 5-9 10-14 15-19 20-24 25-29 30-34 35-39 40+ Total
Under 25
25 - 29
30 - 34 2 2
140,000$ 140,000$
35 - 39 21 21
141,333$ 141,333$
40 - 44 49 6 4 59
142,857$ 147,000$ 140,000$ 143,085$
45 - 49 46 14 12 1 73
141,826$ 143,000$ 141,167$ 168,000$ 142,301$
50 - 54 36 27 17 7 1 88
142,333$ 142,074$ 141,647$ 142,000$ 140,000$ 142,068$
55 - 59 43 20 26 13 11 113
141,302$ 143,500$ 141,173$ 141,077$ 146,364$ 142,128$
60 - 64 29 19 18 14 14 94
144,828$ 144,421$ 141,556$ 144,000$ 145,357$ 144,074$
Over 64 24 22 28 22 19 5 3 123
141,750$ 140,000$ 140,500$ 145,318$ 145,553$ 140,000$ 149,333$ 142,492$
Total 250 108 105 57 45 5 3 573
142,296$ 142,722$ 141,090$ 144,018$ 145,567$ 140,000$ 149,333$ 142,600$
Years of Service

Judicial Retirement System of Texas, Plan 2 G - 4
Table C
Retired and Beneficiary Membership Data
Distribution by Age and Category
Age Last Birthday Number Annual Benefit
Average Annual
Benefit
Service Retirees
Under 60 33 1,855,464 56,226
60 - 64 61 4,145,244 67,955
65 - 69 131 9,067,848 69,220
70 - 74 97 6,698,460 69,056
75 - 79 75 4,999,836 66,664
Over 79 27 1,671,552 61,909
Total 424 28,438,404 67,072
Beneficiaries
Under 60 4 171,456 42,864
60 - 64 6 411,516 68,586
65 - 69 8 486,696 60,837
70 - 74 8 429,840 53,730
75 - 79 6 336,516 56,086
Over 79 15 782,856 52,190
Total 47 2,618,880 55,721
Disabled Retirees
Under 60 0 0 0
60 - 64 1 75,000 75,000
65 - 69 0 0 0
70 - 74 0 0 0
75 - 79 0 0 0
Over 79 0 0 0
Total 1 75,000 75,000
Grand Total 472 31,132,284 65,958

SECTION H
GLOSSARY

Judicial Retirement System of Texas, Plan 2 H - 1
Glossary
Actuarial Accrued Liability (AAL): That portion, as determined by a particular Actuarial Cost Method, of the Actuarial Present Value of Future Plan Benefits which is not provided for by future Normal Costs. It is equal to the Actuarial Present Value of Future Plan Benefits minus the actuarial present value of future Normal Costs. Actuarial Assumptions: Assumptions as to future experience under the Fund. These include assumptions about the occurrence of future events affecting costs or liabilities, such as:
mortality, withdrawal, disablement, and retirement;
future increases in salary;
future rates of investment earnings and future investment and administrative expenses;
characteristics of members not specified in the data, such as marital status;
characteristics of future members;
future elections made by members; and
other relevant items. Actuarial Cost Method or Funding Method: A procedure for allocating the Actuarial Present Value of Future Benefits to various time periods; a method used to determine the Normal Cost and the Actuarial Accrued Liability. These items are used to determine the ADC. Actuarial Gain or Actuarial Loss: A measure of the difference between actual experience and that expected based upon a set of Actuarial Assumptions, during the period between two Actuarial Valuation dates. Through the actuarial assumptions, rates of decrements, rates of salary increases, and rates of fund earnings have been forecasted. To the extent that actual experience differs from that assumed, Actuarial Accrued Liabilities emerge which may be the same as forecasted, or may be larger or smaller than projected. Actuarial gains are due to favorable experience, e.g., the Fund's assets earn more than projected, salaries do not increase as fast as assumed, members retire later than assumed, etc. Favorable experience means actual results produce actuarial liabilities not as large as projected by the actuarial assumptions. On the other hand, actuarial losses are the result of unfavorable experience, i.e., actual results that produce actuarial liabilities which are larger than projected. Actuarial gains will shorten the time required for funding of the actuarial balance sheet deficiency while actuarial losses will lengthen the funding period. Actuarially Equivalent: Of equal actuarial present value, determined as of a given date and based on a given set of Actuarial Assumptions. Actuarial Present Value (APV): The value of an amount or series of amounts payable or receivable at various times, determined as of a given date by the application of a particular set of Actuarial Assumptions. For purposes of this standard, each such amount or series of amounts is:
a. adjusted for the probable financial effect of certain intervening events (such as changes in compensation levels, marital status, etc.),
b. multiplied by the probability of the occurrence of an event (such as survival, death, disability, termination of employment, etc.) on which the payment is conditioned, and
c. discounted according to an assumed rate (or rates) of return to reflect the time value of money.

Judicial Retirement System of Texas, Plan 2 H - 2
Actuarial Present Value of Future Plan Benefits: The Actuarial Present Value of those benefit amounts which are expected to be paid at various future times under a particular set of Actuarial Assumptions, taking into account such items as the effect of advancement in age and past and anticipated future compensation and service credits. The Actuarial Present Value of Future Plan Benefits includes the liabilities for active members, retired members, beneficiaries receiving benefits, and inactive, nonretired members either entitled to a refund or a future retirement benefit. Expressed another way, it is the value that would have to be invested on the valuation date so that the amount invested plus investment earnings would be provide sufficient assets to pay all projected benefits and expenses when due. Actuarial Valuation: The determination, as of a valuation date, of the Normal Cost, Actuarial Accrued Liability, Actuarial Value of Assets, and related Actuarial Present Values for a plan. An Actuarial valuation for a governmental retirement system typically also includes calculations of items needed for compliance with GASB. Actuarial Value of Assets or Valuation Assets: The value of the Fund’s assets as of a given date, used by the actuary for valuation purposes. This may be the market or fair value of plan assets, but commonly actuaries use a smoothed value in order to reduce the year-to-year volatility of calculated results, such as the funded ratio and the ADC. Actuarially Determined: Values which have been determined utilizing the principles of actuarial science. An actuarially determined value is derived by application of the appropriate actuarial assumptions to specified values determined by provisions of the law. Amortization Method: A method for determining the Amortization Payment. The most common methods used are level dollar and level percentage of payroll. Under the Level Dollar method, the Amortization Payment is one of a stream of payments, all equal, whose Actuarial Present Value is equal to the UAAL. Under the Level Percentage of Pay method, the Amortization payment is one of a stream of increasing payments, whose Actuarial Present Value is equal to the UAAL. Under the Level Percentage of Pay method, the stream of payments increases at the assumed rate at which total covered payroll of all active members will increase. Amortization Payment: That portion of the pension plan contribution or ADC which is designed to pay interest on and to amortize the Unfunded Actuarial Accrued Liability. Actuarially Determined Contribution (ADC) or Annual Required Contribution (ARC): A calculated contribution for a defined benefit pension plan for the reporting period, most often determined based on the funding policy of the plan. Typically the calculated contribution has a normal cost payment and an amortization payment. Closed Amortization Period: A specific number of years that is counted down by one each year and therefore declines to zero with the passage of time. For example if the amortization period is initially set at 30 years, it is 29 years at the end of one year, 28 years at the end of two years, etc. See Funding Period and Open Amortization Period. Decrements: Those causes/events due to which a member’s status (active-inactive-retiree-beneficiary) changes, that is: death, retirement, disability, or termination. Defined Benefit Plan: An employer-sponsored retirement benefit that provides workers, upon attainment of designated age and service thresholds, with a monthly benefit based on the employee’s salary and

Judicial Retirement System of Texas, Plan 2 H - 3
length of service. The value of a benefit from a defined benefit plan is generally not affected by the return on the assets that are invested to fund the benefit.
Defined Contribution Plan: A retirement plan, such as a 401(k) plan, a 403(b) plan, or a 457 plan, in which the contributions to the plan are assigned to an account for each member, and the plan’s earnings are allocated to each account, and each member’s benefits are a direct function of the account balance.
Employer Normal Cost: The portion of the Normal Cost to be paid by the employers. This is equal to the Normal Cost less expected member contributions.
Experience Study: A periodic review and analysis of the actual experience of the Fund which may lead to a revision of one or more actuarial assumptions. Actual rates of decrement and salary increases are compared to the actuarially assumed values and modified as deemed appropriate by the Actuary.
Funded Ratio: The ratio of the actuarial value of assets (AVA) to the actuarial accrued liability (AAL). Plans sometimes calculate a market funded ratio, using the market value of assets (MVA), rather than the AVA.
Funding Period or Amortization Period: The term “Funding Period” is used it two ways. In the first sense, it is the period used in calculating the Amortization Payment as a component of the ADC. This funding period is chosen by the Board of Trustees. In the second sense, it is a calculated item: the number of years in the future that will theoretically be required to amortize (i.e., pay off or eliminate) the Unfunded Actuarial Accrued Liability, based on the statutory employer contribution rate, and assuming no future actuarial gains or losses.
GASB: The Governmental Accounting Standards Board is an organization that exists in order to promulgate accounting standards for governmental entities.
Normal Cost: That portion of the Actuarial Present Value of pension plan benefits and expenses which is allocated to a valuation year by the Actuarial Cost Method. Any payment in respect of an Unfunded Actuarial Accrued Liability is not part of Normal Cost (see Amortization Payment). For pension plan benefits which are provided in part by employee contributions, Normal Cost refers to the total of employee contributions and employer Normal Cost unless otherwise specifically stated. Under the entry age normal cost method, the Normal Cost is intended to be the level cost (when expressed as a percentage of pay) needed to fund the benefits of a member from hire until ultimate termination, death, disability or retirement.
Open Amortization Period: An open amortization period is one which is used to determine the Amortization Payment but which does not change over time. In other words, if the initial period is set as 30 years, the same 30-year period is used in determining the Amortization Period each year. In theory, if an Open Amortization Period is used to amortize the Unfunded Actuarial Accrued Liability, the UAAL will never completely disappear, but will become smaller each year, either as a dollar amount or in relation to covered payroll.
Unfunded Actuarial Accrued Liability: The excess of the Actuarial Accrued Liability over the Actuarial Value of Assets. This value may be negative in which case it may be expressed as a negative Unfunded Actuarial Accrued Liability, also called the Funding Surplus.
Valuation Date or Actuarial Valuation Date: The date as of which the value of assets is determined and as of which the Actuarial Present Value of Future Plan Benefits is determined. The expected benefits to be paid in the future are discounted to this date.

200 E. 18th StreetP.O. Box 13207
Austin, Texas 78711-3207www.ers.texas.gov