Activity—Earthquake Machine
13
e-binder for 2013 CEETEP workshop 85 VIDEOS—Demonstrations of the Earthquake Machine are in the 2. Earthquakes & Tsunamis folder on this DVD: 3. VIDEOS_Earthquake & Tsunami > Earthquake Machine-Blocks&Graphs > DEMO_EarthquakeMachine_1block.mov and DEMO_EarthquakeMachine_2block.mov or on the Internet: http://www.iris.edu/hq/programs/education_and_outreach/animations#L ANIMATIONS—How do you graph Time vs. Distance or Time vs. Strain? Go to the folder: 2. ANIMATIONS_Earthquake & Tsunami > Earthquake Machine-Blocks&Graphs There are also many relevant animations on elastic rebound in the 1. Earth & Plate Tectonics folder: 2. ANIMATIONS_Earth & Tectonics Plate Interaction_Converge Diverge Transform Strike Slip & Elastic Rebound For more-detailed instructions on the construction and use of the “earthquake machine” go to: Level 1: IRIS or Level 2: John Lahr Activity—Earthquake Machine How could pulling a block of wood with a string of rubber bands have anything to do with earthquakes? There are no rubber bands in the Earth, but all solids, including the Earth’s crust, are elastic. Block & sandpaper model friction and elastic rebound (release) as an example of the interaction between tectonic plates before and after an earthquake. 0 10 20 30 40 50 60 70 80 90 100 0 10 20 30 40 50 60 70 80 90 100 0 10 20 30 40 50 60 70 80 90 100 TAPE MEASURE--CENTIMETERS Block starting point, 0 cm Hand starting point, 60 cm Block is held by friction Energy stored in rubber as it stretches 30 cm Block jumped 20 cm Energy in rubber band is released Start Basic “earthquake machine” . Hand represents the regional force acting on the plate which, in this case, pulls on a rubber band. The force applied is proportional to the length of the rubber band. Resources on this DVD & Internet relevant to the Earthquake Machine Science Standards Systems • Inquiry • Forces & Motion • Energy & Matter • Evidence of Change • Transformation & Conservation • of energy Predictability & Feedback • Earthquakes can provide a useful context for teaching or reviewing many basic physics concepts, such as sliding and static friction, forms of energy and conversion from one form to another, and the elastic properties of materials. This lab could be part of an Earth science course, but could also be used in general science or physics. This lesson could be made more “inquiry based” than what is presented in PDF file. One possibility would be to spend one period in inquiry with the rubber bands and blocks of wood, and then a second one doing this more directed experiment.
Transcript of Activity—Earthquake Machine
e-binder for 2013 CEETEP workshop 85
VIDEOS —Demonstrations of the Earthquake Machine are in the 2. Earthquakes & Tsunamis folder on this DVD: 3. VIDEOS_Earthquake & Tsunami
> Earthquake Machine-Blocks&Graphs
> DEMO_EarthquakeMachine_1block.mov and DEMO_EarthquakeMachine_2block.mov
or on the Internet: http://www.iris.edu/hq/programs/education_and_outreach/animations#L
ANIMATIONS —How do you graph Time vs. Distance or Time vs. Strain? Go to the folder: 2. ANIMATIONS_Earthquake & Tsunami > Earthquake Machine-Blocks&Graphs
There are also many relevant animations on elastic rebound in the 1. Earth & Plate Tectonics folder: 2. ANIMATIONS_Earth & Tectonics
Plate Interaction_Converge Diverge Transform
Strike Slip & Elastic Rebound
For more-detailed instructions on the construction and use of the “earthquake machine” go to: Level 1: IRIS or Level 2: John Lahr
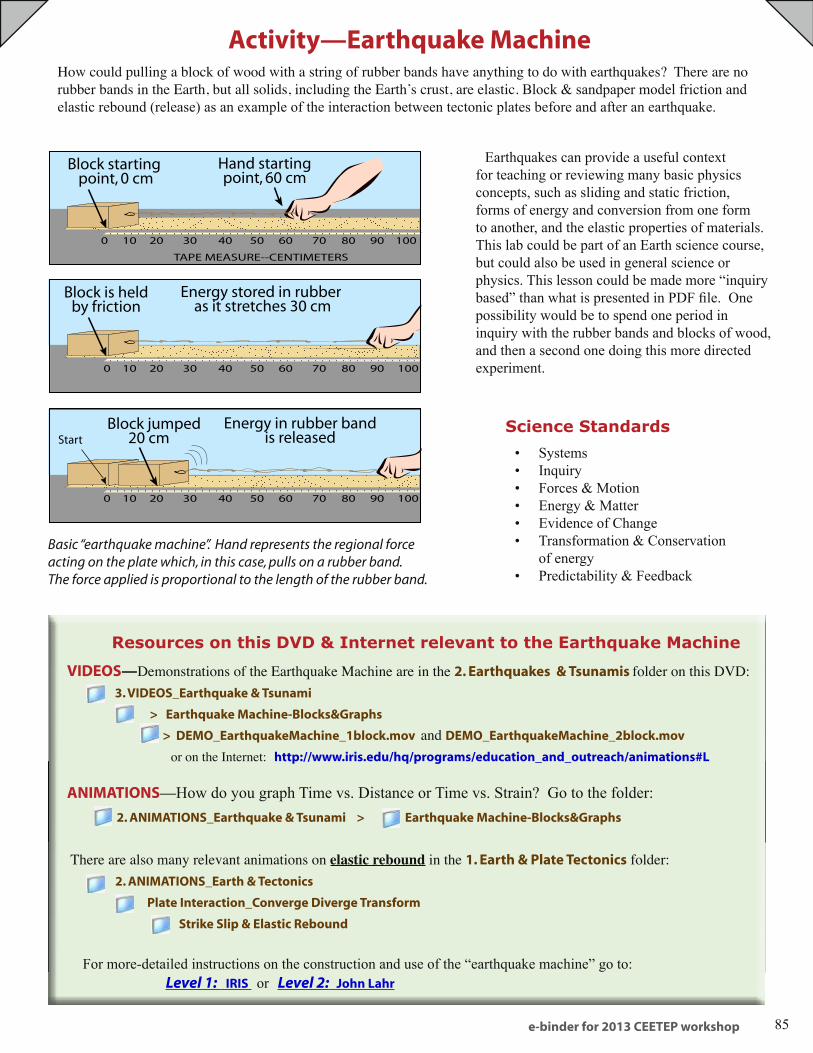
Activity—Earthquake MachineHow could pulling a block of wood with a string of rubber bands have anything to do with earthquakes? There are no rubber bands in the Earth, but all solids, including the Earth’s crust, are elastic. Block & sandpaper model friction and elastic rebound (release) as an example of the interaction between tectonic plates before and after an earthquake.
0 10 20 30 40 50 60 70 80 90 100
0 10 20 30 40 50 60 70 80 90 100
0 10 20 30 40 50 60 70 80 90 100
TAPE MEASURE--CENTIMETERS
Block starting point, 0 cm
Hand startingpoint, 60 cm
Block is heldby friction
Energy stored in rubber as it stretches 30 cm
Block jumped20 cm
Energy in rubber bandis releasedStart
Basic “earthquake machine”. Hand represents the regional force acting on the plate which, in this case, pulls on a rubber band. The force applied is proportional to the length of the rubber band.
Resources on this DVD & Internet relevant to the Earthquake Machine
Science Standards
Systems• Inquiry• Forces & Motion• Energy & Matter• Evidence of Change• Transformation & Conservation • of energyPredictability & Feedback•
Earthquakes can provide a useful context for teaching or reviewing many basic physics concepts, such as sliding and static friction, forms of energy and conversion from one form to another, and the elastic properties of materials. This lab could be part of an Earth science course, but could also be used in general science or physics. This lesson could be made more “inquiry based” than what is presented in PDF file. One possibility would be to spend one period in inquiry with the rubber bands and blocks of wood, and then a second one doing this more directed experiment.
86
Earthquake Machine & Elastic Rebound—overview of basic model
Time: 15-45 Minutes
Target Grade Level: grades 5-12
Content Objective:
Students work cooperatively to develop and test a hypothesis, make measurements, and write a short report on the results with graphs. They learn the concept of elastic rebound and how energy is stored and released using a block (static object) that is pulled by rubber bands (elastic force) to create an “earthquake.”
Earthquakes and Elastic Rebound The basic earthquake machine consists of a heavy
object that is dragged steadily with an elastic cord or rubber band. Although pulled with a constant velocity, the heavy object repeatedly slides and sticks. This intermittent sliding motion mimics the intermittent fault slippage that characterizes the earthquake fault zones. In tectonically active regions, the plates, which are about 15-200 km thick, are slowly deformed elastically along active faults. As the deformation increases, stress also increases, until fault slippage releases the stored elastic energy. This process is called elastic rebound.
Stress and Friction*Stress is force divided by the area of the fault (or wood block in this case). Since the area is constant, the length of the spring is also proportional to the stress applied to the fault. The frictional strength of the fault depends on the roughness of the sandpaper on the block and the board, on the area of the block, and on the force pushing the block against the board. This force is simply the weight of a rock (or any other weight) placed on top of the block. Note that there is a difference between static friction and dynamic friction. When at rest, the strength of the fault is determined by the static friction. However, as soon as the block starts moving, the strength (the stress which stops the motion) is determined by the dynamic friction. Static friction is always greater than dynamic friction; the friction is stronger when the block is at rest than when it is when moving. Finally, the displacement of the fault is simply the position of the block measured on the centimeter scale on the board. The slip during a particular “earthquake” is simply the difference in displacement before and after the earthquake.
[*From Jeff Barker, Binghamton University}
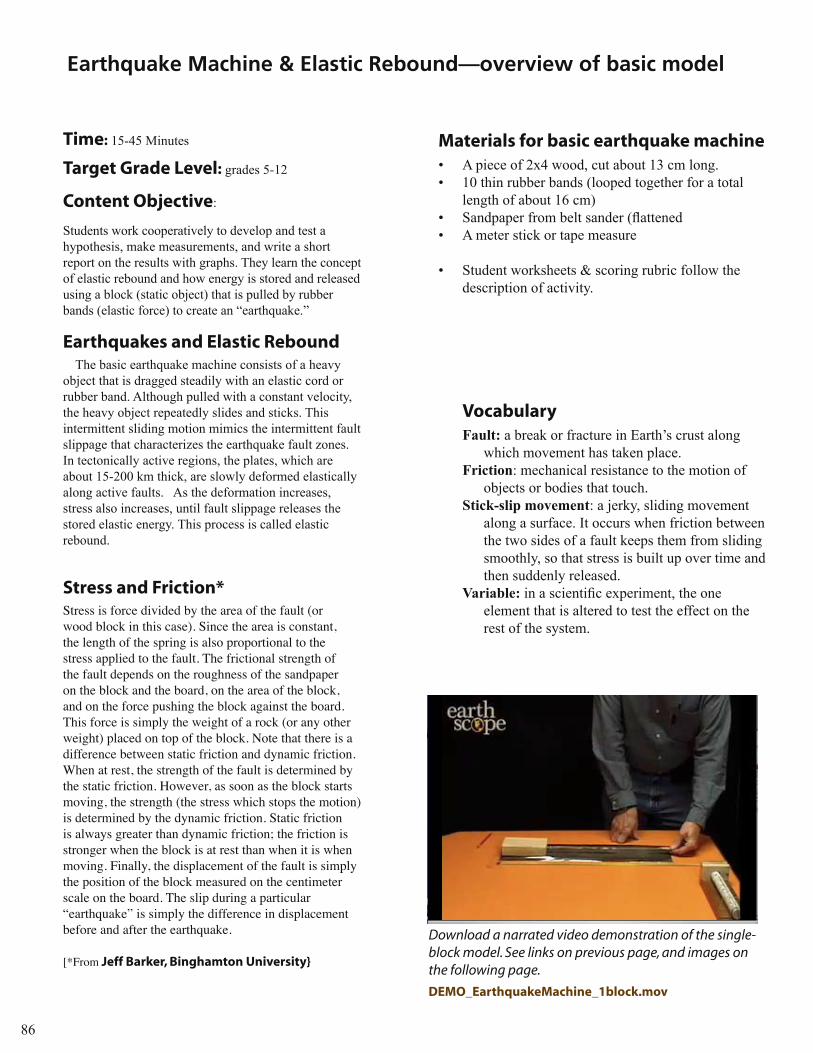
Download a narrated video demonstration of the single-block model. See links on previous page, and images on the following page.
DEMO_EarthquakeMachine_1block.mov
Materials for basic earthquake machineA piece of 2x4 wood, cut about 13 cm long.• 10 thin rubber bands (looped together for a total • length of about 16 cm)Sandpaper from belt sander (flattened• A meter stick or tape measure •
Student worksheets & scoring rubric follow the • description of activity.
VocabularyFault: a break or fracture in Earth’s crust along
which movement has taken place.Friction: mechanical resistance to the motion of
objects or bodies that touch.Stick-slip movement: a jerky, sliding movement
along a surface. It occurs when friction between the two sides of a fault keeps them from sliding smoothly, so that stress is built up over time and then suddenly released.
Variable: in a scientific experiment, the one element that is altered to test the effect on the rest of the system.
e-binder for 2013 CEETEP workshop 87
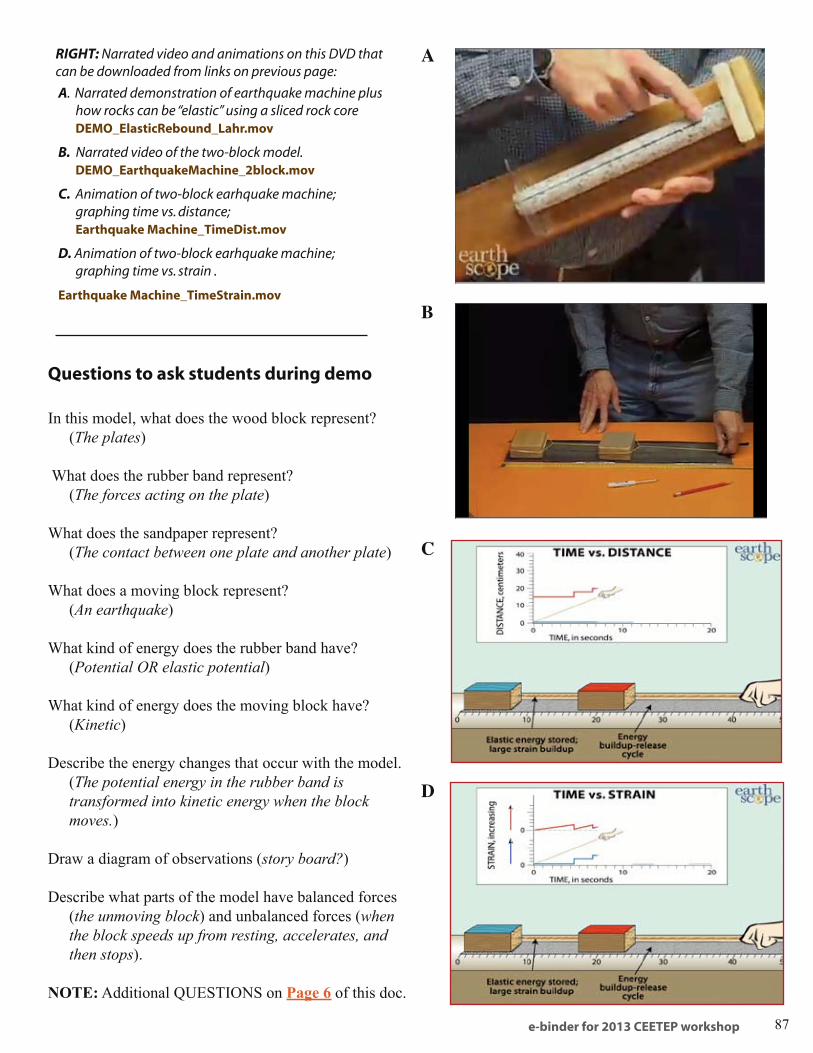
RIGHT: Narrated video and animations on this DVD that can be downloaded from links on previous page:
A. Narrated demonstration of earthquake machine plus how rocks can be “elastic” using a sliced rock core DEMO_ElasticRebound_Lahr.mov
B. Narrated video of the two-block model. DEMO_EarthquakeMachine_2block.mov
C. Animation of two-block earhquake machine; graphing time vs. distance; Earthquake Machine_TimeDist.mov
D. Animation of two-block earhquake machine; graphing time vs. strain .
Earthquake Machine_TimeStrain.mov
A
B
C
D
Questions to ask students during demo
In this model, what does the wood block represent? (The plates)
What does the rubber band represent? (The forces acting on the plate)
What does the sandpaper represent? (The contact between one plate and another plate)
What does a moving block represent? (An earthquake)
What kind of energy does the rubber band have? (Potential OR elastic potential)
What kind of energy does the moving block have? (Kinetic)
Describe the energy changes that occur with the model. (The potential energy in the rubber band is transformed into kinetic energy when the block moves.)
Draw a diagram of observations (story board?)
Describe what parts of the model have balanced forces (the unmoving block) and unbalanced forces (when the block speeds up from resting, accelerates, and then stops).
NOTE: Additional QUESTIONS on Page 6 of this doc.
88
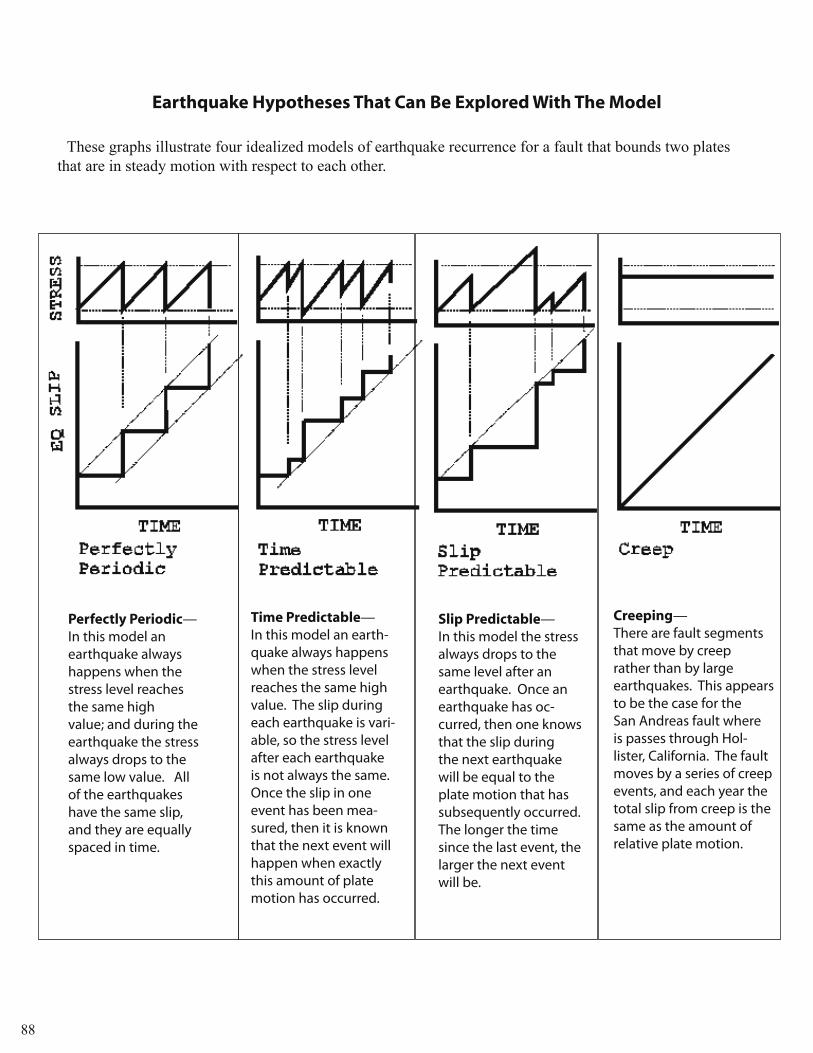
Perfectly Periodic—In this model an earthquake always happens when the stress level reaches the same high value; and during the earthquake the stress always drops to the same low value. All of the earthquakes have the same slip, and they are equally spaced in time.
The graphs above illustrate four idealized models of
earthquake recurrence for a fault that bounds two plates
that are in steady motion with respect to each other.
Perfectly Periodic
In this model an earthquake always happens when the stress level reaches the
same high value and during the earthquake the stress always drops to the same
low value. All of the earthquakes have the same slip and they are equally spaced
in time.
Time Predictable
In this model an earthquake always happens when the stress level reaches the
same high value. The slip during each earthquake is variable, so the stress level
after each earthquake is not always the same. Once the slip in one event has
been measured, then it is known that the next event will happen when exactly this
amount of plate motion has occurred.
Slip Predictable
In this model the stress always drops to the same level after an earthquake.
Once an earthquake has occurred, then one knows that the slip during the next
earthquake will be equal to the plate motion that has subsequently occurred. The
longer the time since the last event, the larger the next event will be.
Earthquake Hypotheses That Can Be Explored With The Model
These graphs illustrate four idealized models of earthquake recurrence for a fault that bounds two plates that are in steady motion with respect to each other.
Time Predictable— In this model an earth-quake always happens when the stress level reaches the same high value. The slip during each earthquake is vari-able, so the stress level after each earthquake is not always the same. Once the slip in one event has been mea-sured, then it is known that the next event will happen when exactly this amount of plate motion has occurred.
Slip Predictable— In this model the stress always drops to the same level after an earthquake. Once an earthquake has oc-curred, then one knows that the slip during the next earthquake will be equal to the plate motion that has subsequently occurred. The longer the time since the last event, the larger the next event will be.
Creeping— There are fault segments that move by creep rather than by large earthquakes. This appears to be the case for the San Andreas fault where is passes through Hol-lister, California. The fault moves by a series of creep events, and each year the total slip from creep is the same as the amount of relative plate motion.
e-binder for 2013 CEETEP workshop 89
2.1
R A T I O N A L E Students will operate a model to observe the type of motion that occurs at a fault during an earthquake and explore the effects of several variables.
F O C U S Q U E S T I O N S How much energy will a fault store before it fails? Is this quantity constant for all faults?
O B J E C T I V E S
Students will: 1. Model the frictional forces involved in the movements of a fault. 2. Measure movement, calculate averages, and plot this information on a graph. 3. Explore the variables of fault strength vs. energy stored.
M A T E R I A L S for each small group
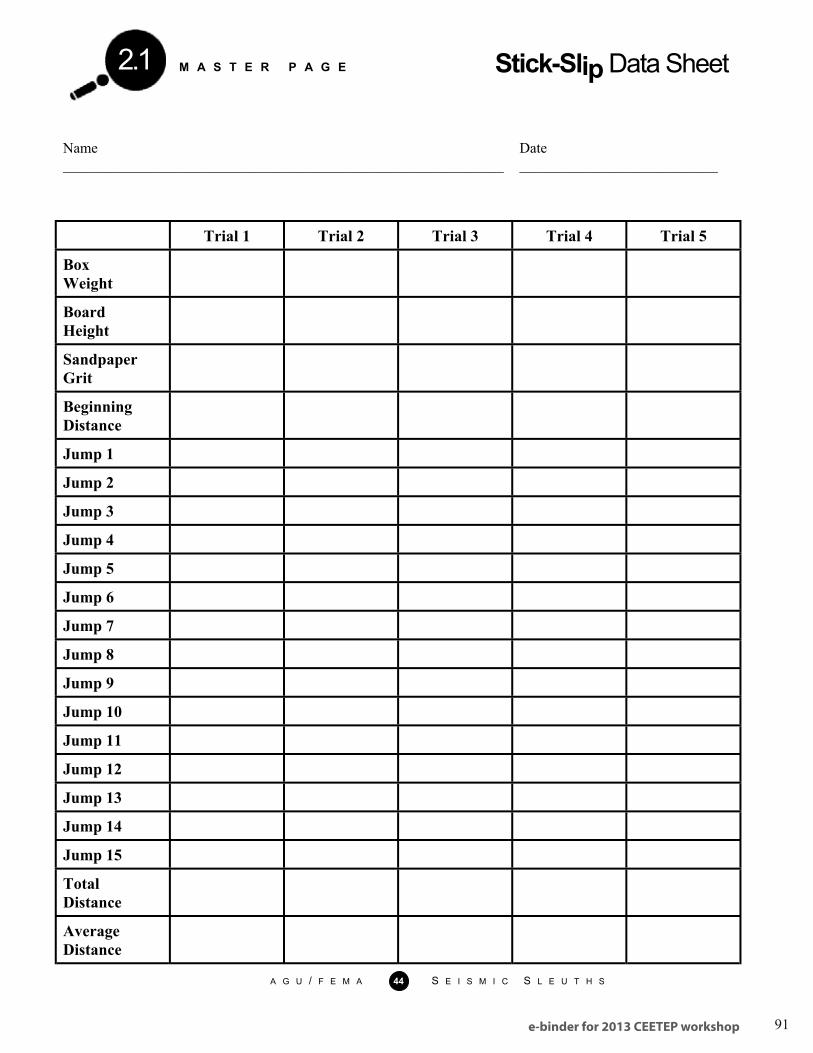
1 copy of Master 2.1a, Stick-Slip Data Sheet
4 sandpaper sheets, 23 cm x 28 cm (9 in. x 11 in.), in 60, 120, and 400 grit (12 sheets)
Scissors
Strapping tape
1-1b box of sugar cubes
8 thumbtacks
A box of rubber bands
2 large paper clips
Yardstick or meter stick
At least 2 m of string
Large dowel or empty tube from a roll of paper towels
A G U / F E M A 39 S E I S M I C S L E U T H S
RationaleStudents will operate a model to observe the type of motion
that occurs at a fault during an earthquake and explore the effects of several variables.
Focus QuestionsHow much energy will a fault store before it fails?Is this quantity constant for all faults?
ObjectivesStudents will:
Model the frictional forces involved in the movements of • a fault.
Measure movement, calculate averages, and plot this • information on a graph.
Explore the variables of fault strength vs. energy stored.•
Procedure A. Teacher Preparation
To assure success, construct the model ahead of time and rehearse the activity. Then arrange materials for student models in a convenient place. A. Introduction Elicit a definition of fault from the class, supplementing students’ information as necessary until the essential elements have been covered.
Explain to students that when an earthquake occurs and movement begins on a fault plane, the movement will not proceed smoothly away from the focus. Any change in the amount of friction along the fault will cause the fault movement to be irregular. This includes changes along the length of the fault and with depth, changes in rock type and strength along the fault, and natural barriers to movement, such as changes in the direction of the fault or roughness over the surface of the fault plane.
*Student group activityUses scales to quantify the experiment
MATERIALSfor each small group
1 copy of Master 2.1a, Stick-Slip Data Sheet• 4 sandpaper sheets, 23 cm x 28 cm •
(9 in. x 11 in.), in 60, 120, and 400 grit Scissors• Strapping tape• 1-1b box of sugar cubes• 8 thumbtacks• A box of rubber bands• 2 large paper clips• Yardstick or meter stick• At least 2 m of string• Large dowel or empty tube from a roll of paper •
towels Marking pen• Scales• Pine board, approx. 2.5 cm x 30 cm x 1.8 m (1 •
in. x 12 in. x 6 ft.) Several books to support one end of the board• Protractor for measuring angles• 1 brick (optional)•
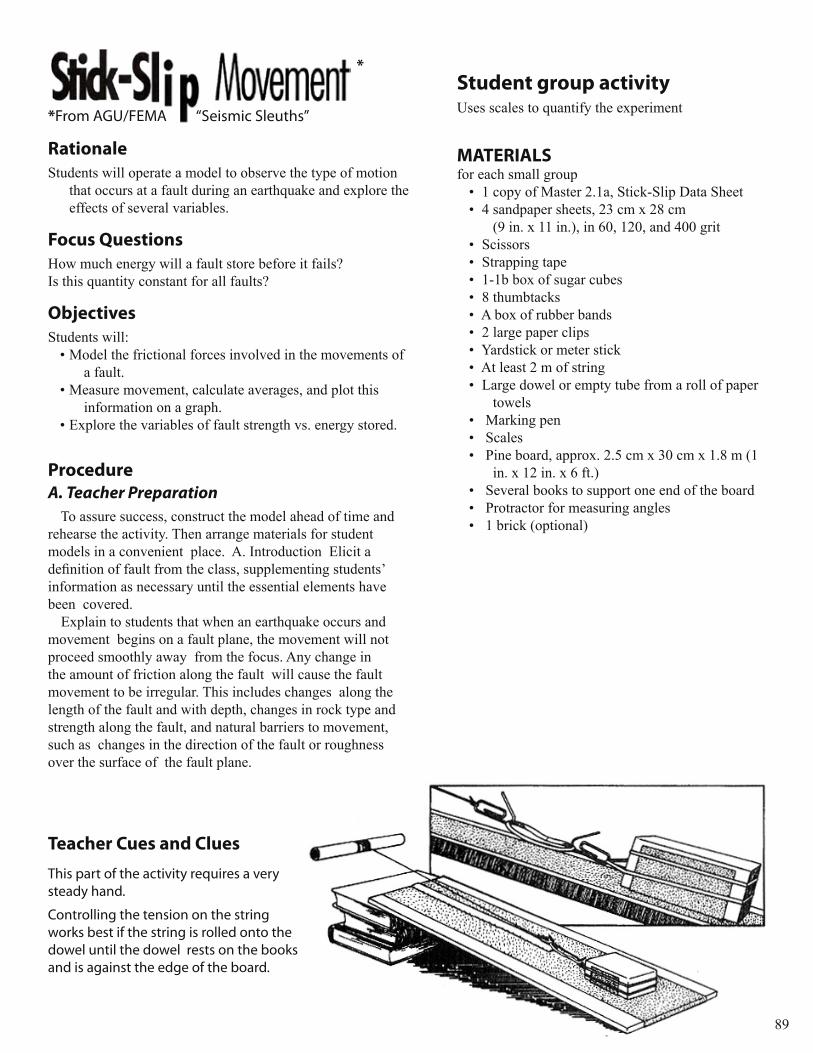
Teacher Cues and Clues
This part of the activity requires a very steady hand.
Controlling the tension on the string works best if the string is rolled onto the dowel until the dowel rests on the books and is against the edge of the board.
*From AGU/FEMA “Seismic Sleuths”
90
Rupture along a fault typically occurs by fits and starts, in a type of sporadic motion that geologists call stick-slip. As energy builds up, the rock on either side of the fault will store the energy until its force exceeds the strength of the fault. When the residual strength of the fault is exceeded, an earthquake will occur. Movement on the fault will continue until the failure reaches an area where the strength of the rock is great enough to prevent further rupture. In this manner, some of the energy stored in the rock, but not all of it, will be released by frictional heating on the fault, the crushing of rock, and the propagation of earthquake waves.
B. Lesson Development
1. Divide the class into working groups of at least four students each. Distribute one copy of Master 2.1a, Stick-Slip Data Sheet, to each group. Tell students that they are going to model a process, record data for each trial, and then vary the process, changing only one variable at a time.
2. Allow groups to assemble their materials, then give these directions:
a. Fold each piece of 120-grit sandpaper in half lengthwise and cut, to produce eight strips of sandpaper, each 11.5 cm x 28 cm (4.5 in. x 11 in.) in size.
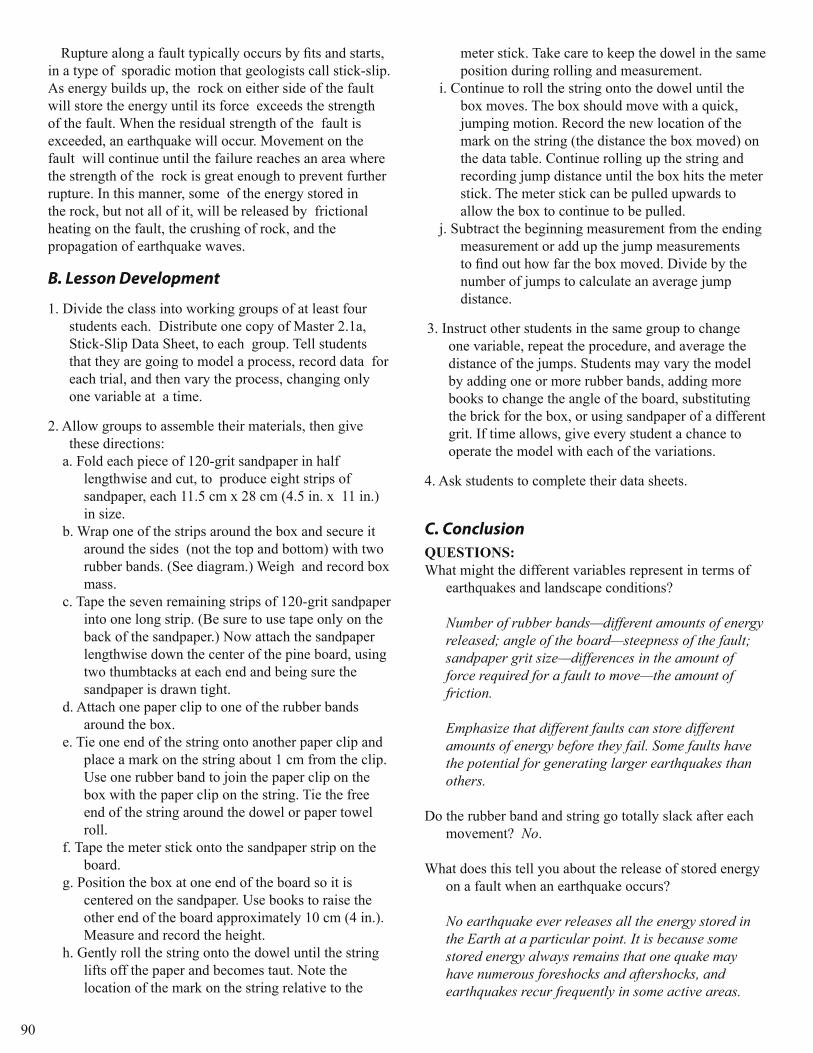
b. Wrap one of the strips around the box and secure it around the sides (not the top and bottom) with two rubber bands. (See diagram.) Weigh and record box mass.
c. Tape the seven remaining strips of 120-grit sandpaper into one long strip. (Be sure to use tape only on the back of the sandpaper.) Now attach the sandpaper lengthwise down the center of the pine board, using two thumbtacks at each end and being sure the sandpaper is drawn tight.
d. Attach one paper clip to one of the rubber bands around the box.
e. Tie one end of the string onto another paper clip and place a mark on the string about 1 cm from the clip. Use one rubber band to join the paper clip on the box with the paper clip on the string. Tie the free end of the string around the dowel or paper towel roll.
f. Tape the meter stick onto the sandpaper strip on the board.
g. Position the box at one end of the board so it is centered on the sandpaper. Use books to raise the other end of the board approximately 10 cm (4 in.). Measure and record the height.
h. Gently roll the string onto the dowel until the string lifts off the paper and becomes taut. Note the location of the mark on the string relative to the
meter stick. Take care to keep the dowel in the same position during rolling and measurement.
i. Continue to roll the string onto the dowel until the box moves. The box should move with a quick, jumping motion. Record the new location of the mark on the string (the distance the box moved) on the data table. Continue rolling up the string and recording jump distance until the box hits the meter stick. The meter stick can be pulled upwards to allow the box to continue to be pulled.
j. Subtract the beginning measurement from the ending measurement or add up the jump measurements to find out how far the box moved. Divide by the number of jumps to calculate an average jump distance.
3. Instruct other students in the same group to change one variable, repeat the procedure, and average the distance of the jumps. Students may vary the model by adding one or more rubber bands, adding more books to change the angle of the board, substituting the brick for the box, or using sandpaper of a different grit. If time allows, give every student a chance to operate the model with each of the variations.
4. Ask students to complete their data sheets.
C. ConclusionQUESTIONS:What might the different variables represent in terms of
earthquakes and landscape conditions? Number of rubber bands—different amounts of energy released; angle of the board—steepness of the fault; sandpaper grit size—differences in the amount of force required for a fault to move—the amount of friction. Emphasize that different faults can store different amounts of energy before they fail. Some faults have the potential for generating larger earthquakes than others.
Do the rubber band and string go totally slack after each movement? No.
What does this tell you about the release of stored energy on a fault when an earthquake occurs? No earthquake ever releases all the energy stored in the Earth at a particular point. It is because some stored energy always remains that one quake may have numerous foreshocks and aftershocks, and earthquakes recur frequently in some active areas.
e-binder for 2013 CEETEP workshop 91
M A S T E R P A G E Stick-Slip Data Sheet
2.1
Name ____________________________________________________________
Date ___________________________
Trial 1 Trial 2 Trial 3 Trial 4 Trial 5
Box Weight
Board Height
Sandpaper Grit
Beginning Distance
Jump 1
Jump 2
Jump 3
Jump 4
Jump 5
Jump 6
Jump 7
Jump 8
Jump 9
Jump 10
Jump 11
Jump 12
Jump 13
Jump 14
Jump 15
Total Distance
Average Distance
A G U / F E M A 44 S E I S M I C S L E U T H S
92
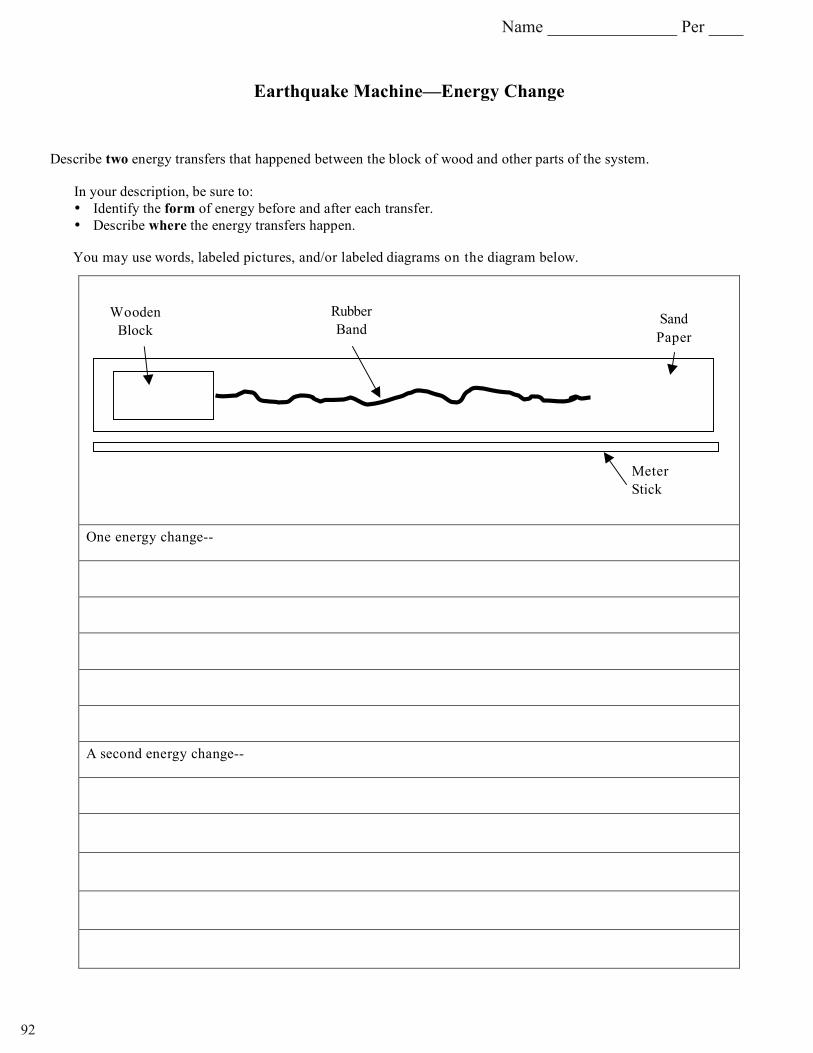
Earthquake Machine—Energy Change
Describe two energy transfers that happened between the block of wood and other parts of the system.
In your description, be sure to:
• Identify the form of energy before and after each transfer.
• Describe where the energy transfers happen.
You may use words, labeled pictures, and/or labeled diagrams on the diagram below.
One energy change--
A second energy change--
Wooden
Block
Rubber
Band Sand
Paper
Meter
Stick
Name _______________ Per ____
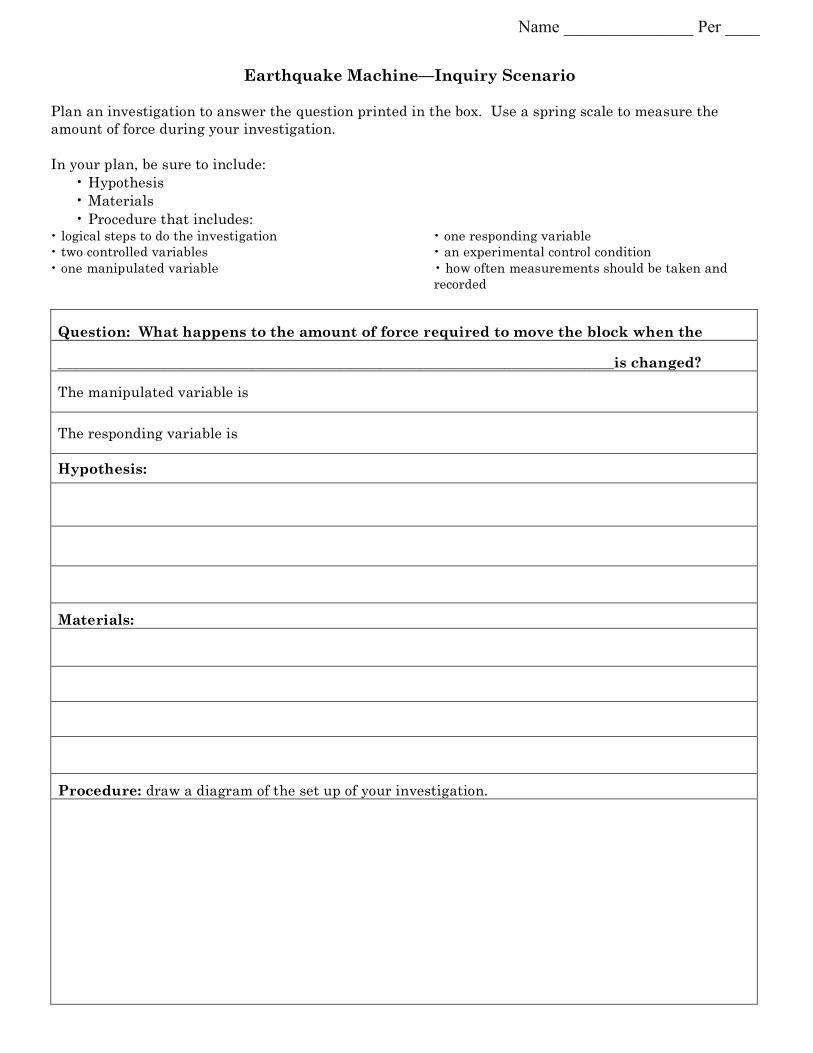
Earthquake Machine—Inquiry Scenario
Plan an investigation to answer the question printed in the box. Use a spring scale to measure the
amount of force during your investigation.
In your plan, be sure to include:
• Hypothesis
• Materials
• Procedure that includes: • logical steps to do the investigation
• two controlled variables
• one manipulated variable
• one responding variable
• an experimental control condition
• how often measurements should be taken and
recorded
Question: What happens to the amount of force required to move the block when the
____________________________________________________________________________is changed?
The manipulated variable is
The responding variable is
Hypothesis:
Materials:
Procedure: draw a diagram of the set up of your investigation.
Name _______________ Per ____

94
Procedure: continued
Data Table:
Conclusion:
e-binder for 2013 CEETEP workshop 95
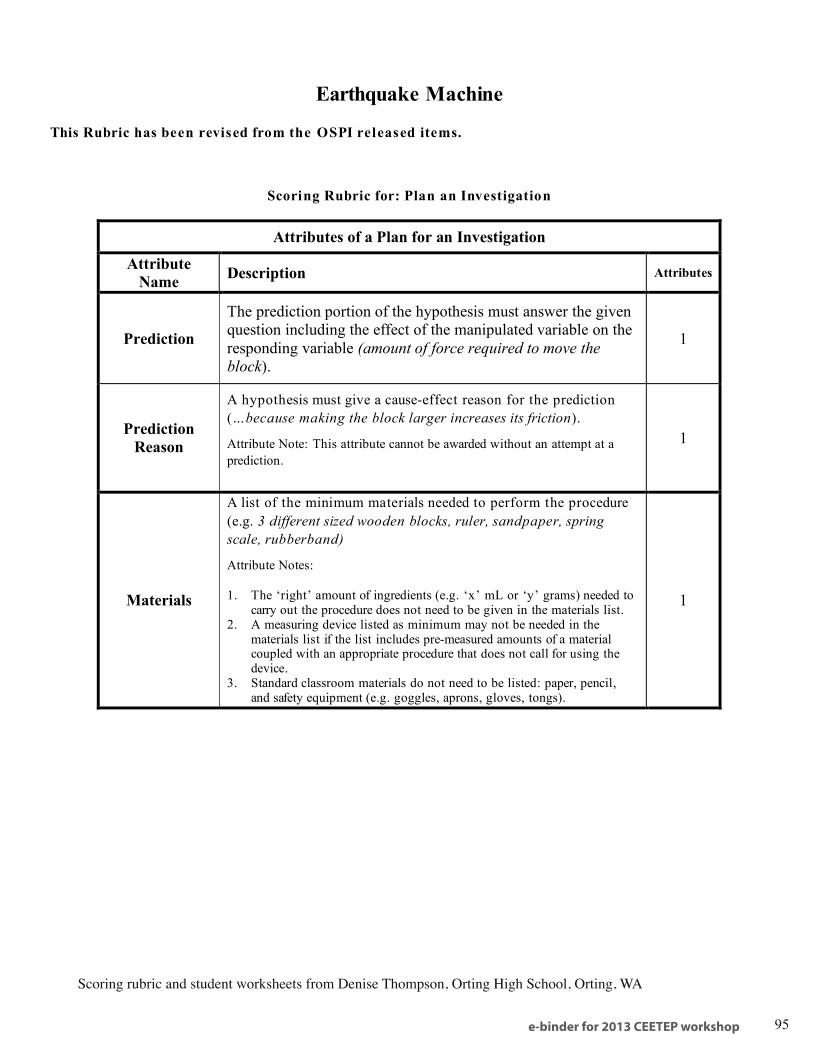
Earthquake Machine
This Rubric has been revised from the OSPI released items.
Scoring Rubric for: Plan an Investigation
Attributes of a Plan for an Investigation
Attribute
Name Description Attributes
Prediction
The prediction portion of the hypothesis must answer the given
question including the effect of the manipulated variable on the
responding variable (amount of force required to move the
block).
1
Prediction
Reason
A hypothesis must give a cause-effect reason for the prediction
(…because making the block larger increases its friction).
Attribute Note: This attribute cannot be awarded without an attempt at a
prediction.
1
Materials
A list of the minimum materials needed to perform the procedure
(e.g. 3 different sized wooden blocks, ruler, sandpaper, spring
scale, rubberband)
Attribute Notes:
1. The ‘right’ amount of ingredients (e.g. ‘x’ mL or ‘y’ grams) needed to carry out the procedure does not need to be given in the materials list.
2. A measuring device listed as minimum may not be needed in the materials list if the list includes pre-measured amounts of a material coupled with an appropriate procedure that does not call for using the device.
3. Standard classroom materials do not need to be listed: paper, pencil, and safety equipment (e.g. goggles, aprons, gloves, tongs).
1
Scoring rubric and student worksheets from Denise Thompson, Orting High School, Orting, WA
96
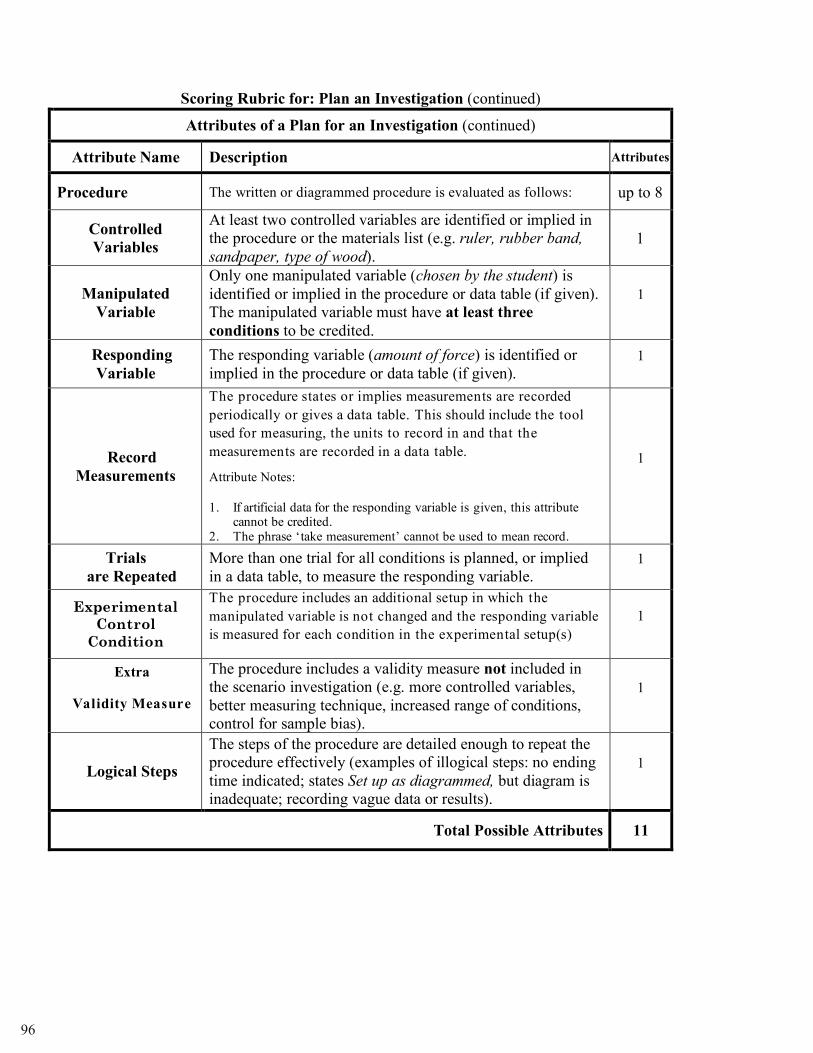
Scoring Rubric for: Plan an Investigation (continued)
Attributes of a Plan for an Investigation (continued)
Attribute Name Description Attributes
Procedure The written or diagrammed procedure is evaluated as follows: up to 8
Controlled
Variables
At least two controlled variables are identified or implied in
the procedure or the materials list (e.g. ruler, rubber band,
sandpaper, type of wood).
1
Manipulated
Variable
Only one manipulated variable (chosen by the student) is
identified or implied in the procedure or data table (if given).
The manipulated variable must have at least three
conditions to be credited.
1
Responding
Variable
The responding variable (amount of force) is identified or
implied in the procedure or data table (if given).
1
Record
Measurements
The procedure states or implies measurements are recorded
periodically or gives a data table. This should include the tool
used for measuring, the units to record in and that the
measurements are recorded in a data table.
Attribute Notes:
1. If artificial data for the responding variable is given, this attribute cannot be credited.
2. The phrase ‘take measurement’ cannot be used to mean record.
1
Trials
are Repeated
More than one trial for all conditions is planned, or implied
in a data table, to measure the responding variable.
1
Experimental
Control
Condition
The procedure includes an additional setup in which the
manipulated variable is not changed and the responding variable
is measured for each condition in the experimental setup(s)
1
Extra
Validity Measure
The procedure includes a validity measure not included in
the scenario investigation (e.g. more controlled variables,
better measuring technique, increased range of conditions,
control for sample bias).
1
Logical Steps
The steps of the procedure are detailed enough to repeat the
procedure effectively (examples of illogical steps: no ending
time indicated; states Set up as diagrammed, but diagram is
inadequate; recording vague data or results).
1
Total Possible Attributes 11
e-binder for 2013 CEETEP workshop 97
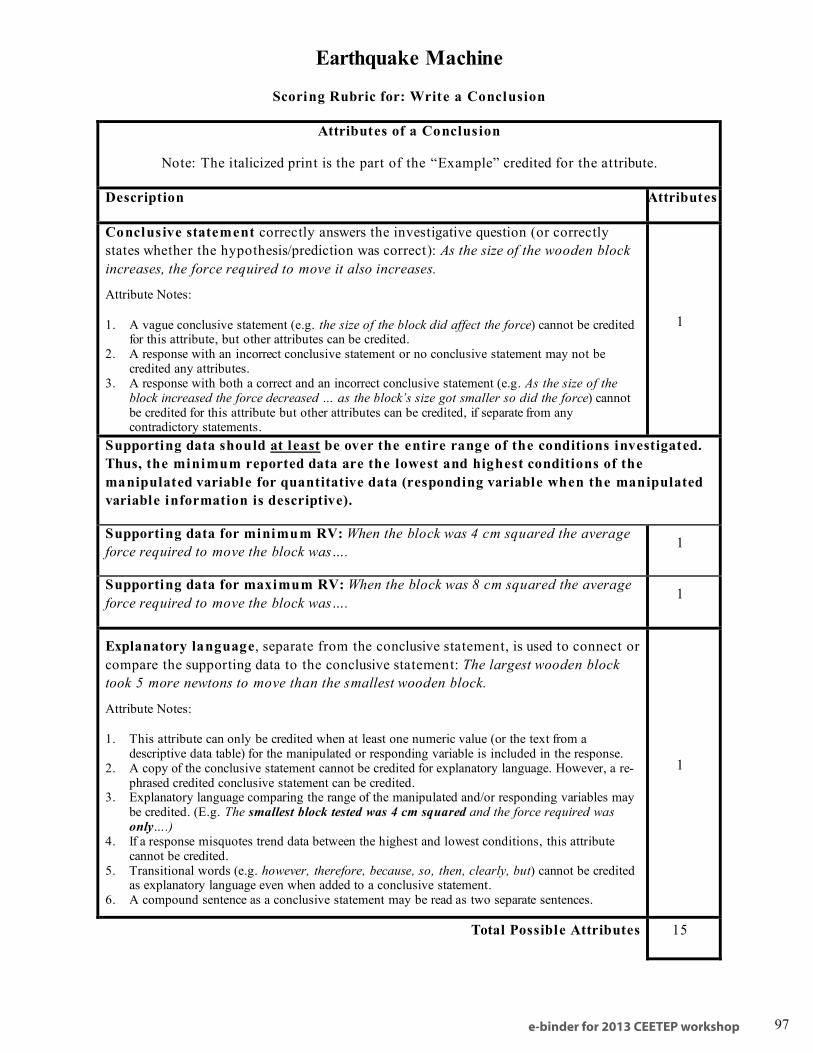
Earthquake Machine
Scoring Rubric for: Write a Conclusion
Attributes of a Conclusion
Note: The italicized print is the part of the “Example” credited for the attribute.
Description Attributes
Conclusive statement correctly answers the investigative question (or correctly
states whether the hypothesis/prediction was correct): As the size of the wooden block
increases, the force required to move it also increases.
Attribute Notes:
1. A vague conclusive statement (e.g. the size of the block did affect the force) cannot be credited for this attribute, but other attributes can be credited.
2. A response with an incorrect conclusive statement or no conclusive statement may not be credited any attributes.
3. A response with both a correct and an incorrect conclusive statement (e.g. As the size of the block increased the force decreased … as the block’s size got smaller so did the force) cannot be credited for this attribute but other attributes can be credited, if separate from any contradictory statements.
1
Supporting data should at least be over the entire range of the conditions investigated.
Thus, the minimum reported data are the lowest and highest conditions of the
manipulated variable for quantitative data (responding variable when the manipulated
variable information is descriptive).
Supporting data for minimum RV: When the block was 4 cm squared the average
force required to move the block was…. 1
Supporting data for maximum RV: When the block was 8 cm squared the average
force required to move the block was…. 1
Explanatory language, separate from the conclusive statement, is used to connect or
compare the supporting data to the conclusive statement: The largest wooden block
took 5 more newtons to move than the smallest wooden block.
Attribute Notes:
1. This attribute can only be credited when at least one numeric value (or the text from a descriptive data table) for the manipulated or responding variable is included in the response.
2. A copy of the conclusive statement cannot be credited for explanatory language. However, a re-phrased credited conclusive statement can be credited.
3. Explanatory language comparing the range of the manipulated and/or responding variables may be credited. (E.g. The smallest block tested was 4 cm squared and the force required was only….)
4. If a response misquotes trend data between the highest and lowest conditions, this attribute cannot be credited.
5. Transitional words (e.g. however, therefore, because, so, then, clearly, but) cannot be credited as explanatory language even when added to a conclusive statement.
6. A compound sentence as a conclusive statement may be read as two separate sentences.
1
Total Possible Attributes 15