ACTIVITY SEGMENTATION WITH SPECIAL EMPHASIS ON A …
101
ACTIVITY SEGMENTATION WITH SPECIAL EMPHASIS ON SIT-TO-STAND ANALYSIS A Thesis presented to the Faculty of the Graduate School at the University of Missouri-Columbia In Partial Fulfillment of the Requirements for the Degree Master of Science by TANVI BANERJEE Dr. Marjorie Skubic, Thesis Supervisor MAY 2010
Transcript of ACTIVITY SEGMENTATION WITH SPECIAL EMPHASIS ON A …

ACTIVITY SEGMENTATION WITH SPECIAL EMPHASIS ON
SIT-TO-STAND ANALYSIS
A Thesis presented to
the Faculty of the Graduate School
at the University of Missouri-Columbia
In Partial Fulfillment
of the Requirements for the Degree
Master of Science
by
TANVI BANERJEE
Dr. Marjorie Skubic, Thesis Supervisor
MAY 2010

The undersigned, appointed by the dean of the Graduate School, have examined the thesis
entitled:
ACTIVITY SEGMENTATION WITH SPECIAL EMPHASIS ON SIT-TO-STAND
ANALYSIS
presented by Tanvi Banerjee,
a candidate for the degree of Master of Science,
and hereby certify that, in their opinion, it is worthy of acceptance.
Dr. Marjorie Skubic, Ph.D.
Dr. James Keller, Ph.D.
Dr. Marilyn Rantz, Ph.D.

ii
ACKNOWLEDGEMENTS
I would like to thank my advisor, Dr Skubic for standing by me through thick and thin.
She has always been there to support my work as well as encourage new ideas and her
guidance to my work has been essential at every stage.
I would also like to thank Dr Keller for his valuable advice and suggestions for trying out
different techniques for my dissertation; this would not have been possible without his aid.
Also, I’d like to thank Carmen Abbott for all the help she provided and the umpteen numbers of
sit-to-stands she had to perform for my research.
Lastly, I would like to thank my parents, William Romine as well as Dr Keshab & Shubhra
Gangopadhyay for their moral support in my quest for acquiring more knowledge. They have
been the strength and the inspiration for me to continue with this quest and reach heights I had
never thought possible for me to reach.

iii
TABLE OF CONTENTS
ACKNOWLEDGEMENTS……………………………………………………………………………………………………………..ii
LIST OF FIGURES……………………………………………………………………………………………………………………….iv
LIST OF TABLES…………………………………………………………………………………………………………………………vii
ABSTRACT………………………………………………………………………………………………………………………………….ix
Chapter 1: Introduction……………………………………………………………………………………………………………..1
Chapter 2: Background & Related Work…………………………………………………………………………………….4
2.1 Sit-to-Stand Analysis in Physical Therapy…………………………………………………………….4
2.2 Manual Sit-To-Stand Measurements…………………………………………………………………..4
2.3 Activity Analysis………………………………………………………………………………………………….5
2.3.1 Tracking………………………………………………………………………………………………….6
2.3.2 Body Structure Analysis…………………………………………………………………………..7
2.3.3 Event Recognition……………………………………………………………………………………8
2.4 Sit-To-Stand Analysis…………………………………………………………………………………………12
2.5 Clustering Techniques for Activity Segmentation………………………………………………15
2.6 Background Subtraction……………………………………………………………………………………17
Chapter 3: Sit-To-Stand Analysis: Methodology……………………………………………………………………….19
3.1 Introduction……………………………………………………………………………………………………..19
3.2 Image Moments as Features for Classification…………………………………………………20
3.3 State Segmentation………………………………………………………………………………………….22
3.3.1 State Segmentation Using Neural Networks………………………………………….22
3.3.2 State Segmentation Using Bayesian Inference………………………………………24
3.3.3 State Segmentation Using Fuzzy Clustering Techniques………………………..27
3.3.3.1 Clustering Algorithms………………………………………………………………..28
3.3.4 State Segmentation Using Voxel Height & Orientation………………………….33
3.3.4.1 Orientation………………………………………………………………………………..36
3.3.4.2 The Entire Sequence………………………………………………………………….38
3.2.5 State Segmentation Using Voxel Height & Ellipse Fitting……………………….41

iv
Chapter 4: Experimental Setup…………………………………………………………………………………………………53
4.1 Introduction……………………………………………………………………………………………………..53
4.2 Variable Angle of Chair With Respect to Cameras…………………………………………….54
4.3 VICON System as Ground Truth………………………………………………………………………..54
4.4 Stop Watch……………………………………………………………………………………………………….55
Chapter 5: Experimental Results and Analysis………………………………………………………………………….57
5.1 Chair Placed Perpendicular to One Camera View………………………………………………57
5.1.1 Frame Classification Results …………………………………………………………………57
5.1.2 STS Time……………………………………………………………………………………………….62
5.2 Results Using Variable Angle of Chair……………………………………………………………….67
5.2.1 Frame Classification Results………………………………………………………………….68
5.2.2 STS Time……………………………………………………………………………………………….70
5.3 Results Using Variable Chair Location……………………………………………………………….74
5.3.1 Frame Classification Results………………………………………………………………….75
5.3.2 STS Time……………………………………………………………………………………………….79
5.4 Discussion…………………………………………………………………………………………………………81
Chapter 6: Future Work……………………………………………………………………………………………………………83
6.1 Introduction……………………………………………………………………………………………………..83
6.2 Detecting Bending Forward………………………………………………………………………………83
6.2 Detection of Rocking Movement………………………………………………………………………84
Chapter 6: Conclusion………………………………………………………………………………………………………………86
REFERENCES…………………………………………………………………………………………………………………………….87

v
LIST OF FIGURES
Figure Page
2.1 Different Techniques used in Human Motion Analysis………………………………………………..6
2.2 Errors Formed in Voxel Space…………………………………………………………………………………….11
2.3 Results using the Mixture of Gaussian Technique with the texture Features……………..18
3.1 Block Diagram of Transition Detection Using Fuzzy Clustering Techniques…………………28
3.2 Test results on a sequence with 13 sit-to-stand motions. GK on Zernike Moments
and clustering results into (a) 3 clusters and (b) 2 clusters. (c) 3 cluster results by
frame number. (d) 2 cluster results by frame number. In part (d), red corresponds
to the upright frames…………………………………………………………………………………………………32
3.3 Voxel person of a person (a) Standing, (b) Transitioning and (c) Sitting………………………34
3.4 Height Graph of a sequence indicating the upright and sit regions……………………………..35
3.5 Silhouette of a person sitting in a chair with occlusion present near the head…………….36
3.6 Graph of Orientation Vs the Frame Number of a Sequence (a) without any further
post-processing, (b) after using and averaging filter on the results………………………………38
3.7 Sequence of silhouettes with the silhouette indicating the beginning of sit-to-stand circled in green…………………………………………………………………………………………………………….39
3.8 Height of a sequence with viewing angle of 90 degrees with camera 1………………………..40
3.9 Orientation graph of the sequence marked in Figure 3.8 with viewing angle of 90 degrees with camera 1…………………………………………………………………………………………………41
3.10 Ellipse Fit Results for silhouettes in (a) Upright, (b) Transition, (c) Sit positions…………….47

vi
3.11 Ellipse Major/ Minor Ratio for camera 1 for chair at right angles with camera 1………….48
3.12 Height of the sequence with 45 degrees viewing angle with respect to camera 1………..49
3.13 Ellipse Major/ Minor Ra o for camera 1 for chair with loca on 45̊ with camera 1……….50
3.14 Angle of Orienta on with respect to camera 1 for chair at angle 45̊ with camera 1………51
3.15 Ellipse Fit Results of an occluded silhouette owing to viewing angle…………………………….52
4.1 An elderly participant with markers on the head, shoulder, two on the back and feet for the VICON motion capture system……………………………………………………………….55
5.1 Classification Results using the Gustafson Kessel (GK), Gath and Geva (GG), Fuzzy C Means (FCM) and Vicon System for Sit (a), Upright (b) and Transition (c) frames for the seven participants………………………………………………………………………………………………….59
5.2 Results of Rise Time for 5 subjects and the comparison of all the algorithms with the Vicon system as well as the stop watch………………………………………..………………………………65
5.3 Experimental setup to detect robustness of sit-to-stand analysis for different viewing angles ………………………………………………………………………………………………………………………….68
5.4 Comparison of all the techniques to measure the Sit-to-stand time with chair at various angles with respect to camera 1……………….……………………………………………………..71
5.5 Introduction of error in the Gustafson Kessel technique due to noise present in Zernike moments…………………………………………………………………………………………………………73
5.6 Experimental setup of chair locations at two extreme ends of the room with respect to camera 1……….…………………………………………………………………………………………………………74
5.7 Clustering results for (a) Far and (b) Near locations, respectively …………….………………….76
5.8 Membership values for the clustering results for (a) Far and (b) Near locations, respectively. Standing frames are denoted in red, and sitting frames are in blue ………..78
5.9 Sit-To-Stand Time results for the ellipse fit and orientation technique compared with the stop watch ………………………………………………………………………………………………….…………79
6.1 Detecting Rocking movements with inverse peak detection technique……………………….84
6.2 Detecting angles while rising using the Vicon system for Normal Sit-To-Stand……………85
vii
LIST OF TABLES
Table Page
2.1 Classification of HCC Data Using Neural Networks………………………………………………..23
5.1 Confusion matrix of the GG algorithm with respect to the Vicon system for the activities of sit, transition, and upright……………………………………………………………59
5.2 Confusion matrix of the FCM algorithm with respect to the Vicon system for the activities of sit, transition, and upright……………………………………………………………60
5.3 Confusion matrix of the GK algorithm with respect to the Vicon system for the activities of sit, transition, and upright……………………………………………………………60
5.4 Confusion matrix of the Voxel Height alone with respect to the Vicon system for the activities of sit, transition, and upright………………………………………………………61
5.5 Confusion matrix of the Voxel Height with Orientation Technique with respect to the Vicon system for the activities of sit, transition, and upright………………………61
5.6 Confusion matrix of the Voxel Height with Ellipse Fit Technique with respect to the Vicon system for the activities of sit, transition, and upright………………………62
5.7 Table for Average Sit-To-Stand Time Difference for the five subjects in Figure 5.2 for the Stop Watch, Voxel Height, Orientation and Ellipse Fit Technique with respect to the Vicon System……………………………………………………………………………66
5.8 Confusion matrix of the GK algorithm with respect to the Vicon system for the activities of sit, transition, and upright for various viewing angles……………………68
5.9 Confusion matrix of the Classification rates using voxel height alone with respect to the Vicon system for the activities of sit, transition, and upright for various viewing angles…………………………………………………………………………………………….69
5.10 Confusion matrix of the Classification rates using voxel height and orientation with respect to the Vicon system for the activities of sit, transition, and upright for various viewing angles……………………………………………………………………………………….69
5.11 Confusion matrix of the Ellipse Fit algorithm with respect to the Vicon system for the activities of sit, transition, and upright for various viewing angles……………….70
5.12 Sit-to-Stand Time Difference between Stop Watch, Voxel Height, Ellipse Fit, Orientation and Gustafson Kessel Clustering technique with respect to the Vicon system for different angles of the chair with respect to the camera system…..72

viii
5.13 Confusion matrix of the GK algorithm with respect to the Vicon system for the activities of sit, transition, and upright for the extreme chair locations…………….........79
5.14 Sit-to-Stand Time Difference between Voxel Height, Ellipse Fit, Orientation and Gustafson Kessel Clustering technique with respect to the Stop Watch for different locations of the chair with respect to the camera system…………………………..80
5.15 Overall Classification expressed in percentage for the different techniques for the activities of sit, upright and transition (sit-to-stand and stand-to-sit) in comparison to the Vicon system……………………………………………………………………………………………………82

ix
ABSTRACT
In this study, we present algorithms to segment the activities of sitting and standing, and
identify the regions of sit-to-stand transitions in a given image sequence. As a means of fall risk
assessment, we propose methods to measure sit-to-stand time using the three dimensional
modeling of a human body in voxel space as well as ellipse fitting algorithms and image features
to capture orientation of the body. Fuzzy clustering methods such as the Gustafson Kessel
algorithm are also investigated. The proposed algorithms were tested on 9 subjects with ages
ranging from 18 to 88. The classification results were the best for the voxel height with the
ellipse fit algorithm at 96.6%; using the voxel height alone gave a classification rate of 86.7%.
The comparison was done with the marker-based Vicon motion capture system as ground truth
as well as a manually controlled stop watch. The average error in sit-to-stand time
measurement was the best for the voxel height with the ellipse fit technique at 270 ms and
worst for the voxel height alone at 380 ms. This application can be used as a part of a
continuous video monitoring system in the homes of older adults and can provide valuable
information which could help detect fall risk and enable them to lead an independent lifestyle
for a longer time.

Chapter 1—Introduction and Background
1.1. Introduction
Fall risk assessment has been an important area of research, in particular with respect to
elderly people. Through the Center for Eldercare and Rehabilitation Technology at the
University of Missouri, we have seen the importance of regularly monitoring the physical
activity of elderly persons as an indication of their functional decline in order to help them
maintain a high standard of living for a longer period of time [1]. In particular, the time required
to get up from a chair, i.e. the sit-to-stand time is essential as a parameter of their physical
functionality. It has been observed that as an elderly person‘s health progressively declines, he/
she faces more difficulty in getting up from a chair. This in turn makes the person take a much
longer time to get up (assuming he or she manages to do so without any help). Hence, as a
measure of physical functionality, it becomes advantageous to continuously monitor the
movements of the elderly while they are undergoing their regular daily activities. This gives the
elderly more freedom to undertake daily activities without direct supervision, lightening the
load of caretakers while increasing the patient’s perceived self efficacy.
Tinetti [29] emphasized the importance of continuous mobility assessment to identify:
Parts of the body’s mobility that may present problems for the patient
Potential reasons for difficulty which create the problems mentioned above
Other high risk mobility conditions (e.g. falling )
Potential solutions which might alleviate the patient’s high risk conditions

2
As a part of this continuous physical assessment, an important parameter is to measure
the time required to get up from a chair. In order to obtain this information automatically, it is
important to be able to identify the regions in a video sequence where this activity occurs. In
this thesis, several methods are proposed to identify different segments such as upright, sitting,
and transition (sit-to-stand or stand-to-sit) in a video sequence; the sit-to-stand part is then
segmented out for further analysis. The techniques implemented range from being semi-
supervised in nature to completely unsupervised. Several experiments were conducted to test
the algorithms presented in this thesis. A two camera system was set up with the field of view
being at right angles to each other so as to have minimum field of view overlap. Initially, the
experiments were conducted in the laboratory under controlled conditions pertaining to a fixed
angle with respect to the cameras, i.e. the chair was facing one of the cameras and was at right
angles to the other camera. Since these algorithms are aimed at becoming a part of an
automated system for detecting physical decline by continuous video monitoring in the homes
of the older adults, it was extremely important to test the algorithms at several different
conditions to ensure that the activities are correctly identified. Hence, in order to test the
robustness of the algorithms described here, this condition was relaxed and several different
positions were tried to test the techniques at different angles with respect to the cameras and
at different locations in the room. The sit-to-stands performed in the experiments were
undertaken under the guidance of a physical therapist that performed the different ways in
which elder adults would get up depending on their ailments. These motions were conducted
with instructions as specified in the Berg Balance Scale Test [13]. According to the scale, the sit-
to-stands were measured using stop watches as well as verified by the marker-based Vicon

3
motion capture system. The subjects participating in the experiment were asked to fold their
hands while rising from the chair as specified by the Berg Balance Scale. This ensured that there
was no support from the arms of the chair and indicated the true physical functionality of the
subjects. Healthy adults from age 18 to 88 were part of the experiments. They were of different
physical shapes and sizes to ensure that a valid data set was included. Markers were placed on
the participants so that the experiments were simultaneously validated by the Vicon system,
the stop-watch (to measure the time required by the subjects to get up from the chair and
again sit down in the chair) as well as the proposed automated algorithms. Thus, using the
Vicon system and the stop watch, the validity of the algorithms was determined.
The rest of the thesis begins with a discussion of the background and related work in
Chapter 2. Chapter 3 presents the proposed sit-to-stand algorithms. Chapter 4 describes the
experimental setup in the lab, while Chapter 5 presents the experimental results and analysis.
Chapter 6 briefly mentions the future work and Chapter 7 concludes this thesis.

4
Chapter 2—Background & Related Work
2.1. Sit-to-Stand Analysis in Physical Therapy
Over time, physical therapists have used sit-to-stand analyses as measures of balance, muscle
strength, and muscle coordination. Nuzik et al. (1984) took progressive snapshots of individuals
during the sit-to-stand transition using a 32 frame per second spring wound camera to measure
seven body angles: ankle, knee, hip, pelvis, trunk, neck, and Frankfort plane (which
approximates the head’s center of gravity). Measurements were used as an approximation of
gait performance.
In addition to gait performance, the sit-to-stand test is also correlated with gait speed
(Thapa et al., [49]), control of posture (Shenkman et al. [47]), and fall risk (Nevitt et al. [45];
Campbell, Borrie, and Spears [46]; Guimaraes and Issacs, [50]). Whitney et al. [40] developed
the Five Times Sit-to-Stand Test (FTSST) as a way to approximate gait performance and balance
disorders, comparing it to the pre-existing Activities-Specific Balance Confidence (ABC) scale
and the Dynamic Gait Index (DGI). They found moderate correlation between the FTSST and
the sum of ABC and DGI. In this study, we model the sit-to-stand process using a number of
techniques in an effort to improve the sit-to-stand portion of the Berg Balance Scale Test.
2.2. Sit-To-Stand Measurements
The Berg Balance Scale Test [13] is used as the standard test to measure the sit-to-stand
time. The BBS test is a score of measuring the balance of an elderly person in a clinical

5
environment. The total score is of 56 with 41-56 being low fall risk, 21-40 being medium fall risk
and 0-20 being high fall risk. Some of the activities being measured are: Sitting to standing,
standing unsupported, sitting unsupported, standing to sitting, standing with eyes closed,
standing with feet together Reaching forward with outstretched arm, retrieving object from
floor, turning to look behind, turning 360 degrees, placing alternate foot on stool, standing with
one foot in front, and standing on one foot.
As a part of the test, a person was required to prompt the subject performing the sit-to-
stands to start so that the stop watch was synchronized. The subject was initially in a sitting
position. At the prompt, he would get up as soon as he was able to and then immediately sit
down without loss of balance and without any support. The stop watch time was measured as
soon as the subject resumed his initial position, i.e. sitting straight in the chair. These tests are
usually conducted under the supervision of physical therapists.
2.3 Activity Analysis
Human activity recognition has been an important focus of research in computer vision
for a long time. It has been important in various applications such as surveillance, robot
learning, and human-computer interaction, as well as physical function monitoring. Several
approaches have been proposed to identify different activities from video sequences. A
taxonomy of these techniques is shown in Figure 2.1 [22].
6
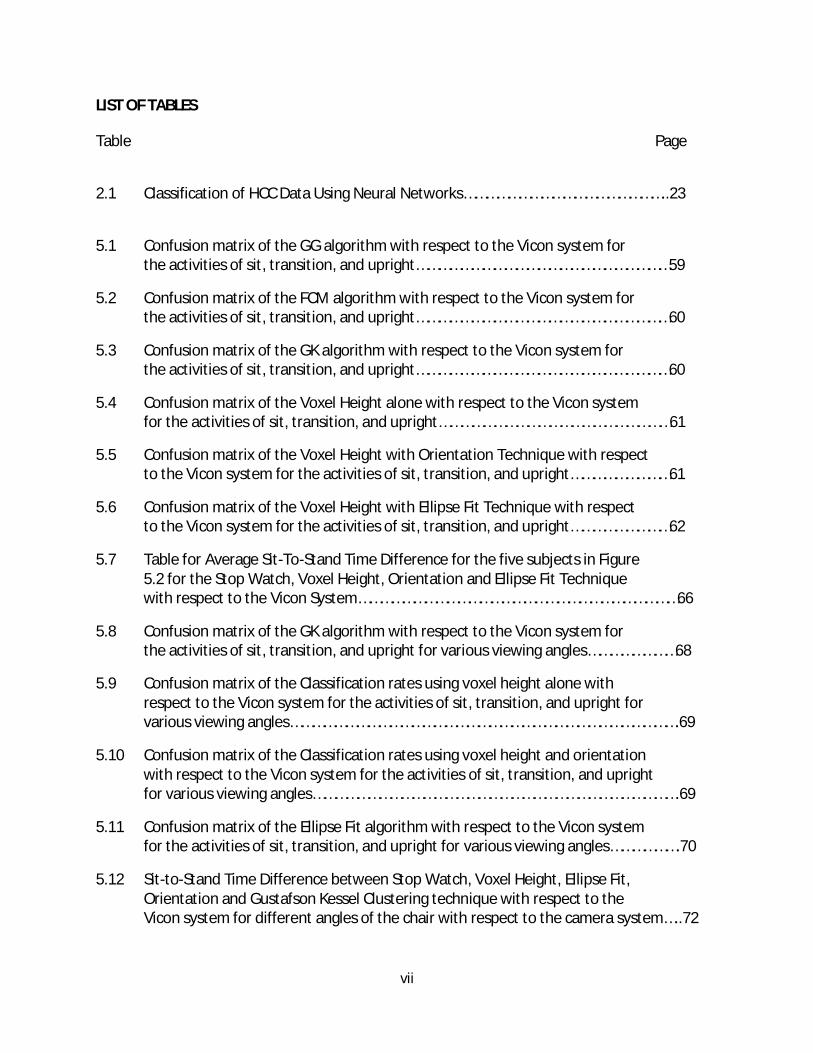
Figure 2.1. Different Techniques used in Human Motion Analysis adapted from [22]
As indicated in Figure 2.1, human motion analysis has three major aspects, one with respect to
the body part analysis, another related to the tracking of the person and finally recognition
using template matching or state-space representation.
2.3.1. Tracking
For tracking with single or multiple cameras, usually blobs or points are tracked in the video
sequence. In [6, 19], Polana and Nelson created a bounding box around the person to be
tracked and used the centroid as the tracking point. Positions of the previous frames were used
to estimate the centroid location of the current frame. Hence, correct tracking ensued even if
two subjects were occluded. Efficient techniques were undertaken to spatially scale the image
sequences so that the person identified in the frame was the same size and at the same
distance from the camera in all frames. Here, a unique idea was utilized as in by making the

7
person stationary in all the image frames; the background appeared moving, i.e. the
background was no longer stationary. Then the motion magnitude of each of these respective
frames was calculated and the periodicity was measured. Thus, the periodicity of the activities
of a person is also computed. Using these cycles, the average motion of a given cycle of activity
is measured and stored as a spatiotemporal motion template.
Another technique useful in tracking was blob detection [48]. Rossi and Bozzoli [20]
used blob detection to detect the number of pedestrians in a crowded area. However, as is
apparent by the mere name of the method, this technique could not be used to detect finer
features which were used to detect activities other than the velocity (to indicate that the
person is walking or running). However, using the afore-mentioned technique in a different
form, Sato et al [21] used a combination of blobs of all the body parts as a tracking technique.
The blobs of the body parts were tracked over the image sequence on the basis of their area,
brightness and rough 3D position and impressive results were obtained. They took video
sequences of pedestrians in crowded areas and showed the results to match the hand
segmented ground truths.
2.3.2. Body Structure Analysis
Another useful technique of analyzing motion is by tracking individual body parts.
Johansson [43] was the person who introduced the idea of putting reflective tapes on the
subject and then flooding the region with light and analyzing the motion of the joints such as
the knee, hip, ankle, shoulder and elbow. Using the trajectories of the movement of these
joints, he analyzed walking patterns. Another approach using a Bayesian framework was
8
implemented by Madabhushi and Aggarwal [7] by detecting the head in a video sequence and
analyzing its motion in all the activities. Using the location of the head, posteriori probabilities
of the activities such as sitting down, standing up, bending down, getting up, hugging,
squatting, rising from a squatting position, bending sideways, falling backward and walking
were calculated and the highest probable activity identified. The authors tested the algorithms
on a database of 77 action sequences of which they used 38 for training and 39 for testing.
From these, they got a success rate of 79%. They mentioned that a lot depended on the field of
view of the video sequence which is why they were unable to accurately identify the locations
of the feature points in some of them.
2.3.3. Event Recognition:
It is imperative to mention Hidden Markov Models when we mention activity
recognition. A Hidden Markov Model is a tool used to model a given system; the system
comprises of a set of features or parameters as well as a set of probable outcomes depending
on these parameters so that given a sequence of events or features, the maximum likelihood of
an outcome (activity) can be estimated and the most likely activity can be identified. In [6], the
authors used accelerometers to identify high activity intensive movements like walk and run
but were not able to use the same for low level activities like sit and stand; they used Hidden
Markov Models for identifying the latter motions by predicting the likelihood of outcome of the
low level activities such as sit and stand and then compared among these activities to detect
the one with the maximum likelihood of occurring.
9
Anderson et. al [39] used silhouette features such as the bounding box of the height-
width ratio as well as the off diagonal term from the covariance matrix obtained by using the
Mixture of Gaussian on the image; a Hidden Markov Model was then created for each of the
activities. On the basis of the maximum likelihood, they identified activities like kneeling, falling
and upright. In [1], they implemented a Fuzzy Logic system using linguistic summarization to
evaluate the fall risk of a person by using features like the eigen height, centroid height, and
similarity with the ground plane normal of the silhouette of the person. They identified the
activities of upright, on the chair, in between, on the ground, and on the couch. The
classification results obtained were 83% correct classification for upright state, 97% for on the
ground state and 70% for in between.
Harvey et. al [34] extracted information from silhouettes such as the height of the
bounding box, the number of foreground pixels, and other such features to determine the
activity level of a given video sequence. Here, instead of detecting activities of a given image
sequence, the authors were more concerned about detecting the activity level which in turn
would indicate the functional level of the elderly residents and provide a direct indication of
functional decline.
Fall detection has been the focus of the work of Tabar et. al [35, 36], which uses vision-
based reasoning to determine falls. They use features such as head location from camera
sequences to locate the person’s activity, i.e. whether he is upright or on the floor. They used
skin color as well as templates to identify the head-shoulder profile to detect the same. They
obtained an accuracy of 94% in detecting the posture, but they just looked for two positions,
10
namely upright or on the floor. They did not mention about the possibility of a person
exercising on the floor leading to false alarms. On a note similar to one of the techniques
implemented in this work, Lo et. al [38] used the orientation or the angle of the human
detected using simple background subtraction techniques. However, they used a single camera
view which indicates that the algorithm may be affected by the location of the person in the
room; the distance of the person from the camera is an important parameter which may affect
the results of the method.
Among other activities, gait analysis has been the focus of research in several projects.
Fang et. al [38] used three dimensional modeling from silhouettes obtained from two camera
views to obtain information such as gait speed, step length, step time and other gait
parameters. The three dimensional modeling is called modeling in voxel space and is described
later in this chapter. Apart from the various techniques mentioned above, an important one is
described below as it is a part of the algorithms implemented in this work.
2.3.4. Voxel Background
The idea of voxel space is an extremely valuable concept in computer vision. Voxel to 3-
dimensional (3D) imaging is what a pixel is to 2-dimensional imaging, i.e. it is a volume element
in 3D space. While it was not coined the term voxel, the concept was first introduced in [22]. In
this paper, the authors talked about Multiple Perspective Interactive video where the user
could specify the viewing angle which made it much easier to analyze and identify activities.
This was put to use in a football sequence. The idea was that the system determined the best
camera at every time instant and edited image sequences from these cameras, much like an

11
editor in standard live sport events, to provide a user the video sequence of the episode from
the user’s desired perspective. This allowed a full 360 degree viewing angle for any scene. Seitz
and Dyer [23] went one step further and implemented voxel coloring, i.e. coloring of the person
or the object similar to the real coloring. However, each viewing angle also brings its own errors
as shown in the following figure. Figure 2.2 indicates the circle as the object with the errors
introduced by the cameras. The Category 1 error is formed in front of the object whereas the
Category 2 error is formed behind the object where the cameras cannot see. Detailed
discussion of these errors can be found in [1].
Figure 2.2. Errors formed in voxel space
These errors are responsible for the noise present in the person created using voxel
space or the “voxel person” apart from the noise in the silhouettes. This is the reason why finer
features are hard to detect using voxel space. It must be noted, however, that for coarse

12
features like location, walking speed using centroid location, etc, the voxel person is highly
applicable. Oikonomopoulos et al. [2] used spatiotemporal points to build descriptors and
created a database of code words from these descriptors in order to use his technique for
image and video retrieval. Finally, they used RVMs or Relevance Vector Machines to recognize
activity for new data. The Relevance Vector Machines are more probabilistic in nature than the
Support Vector Machines and use an expectation maximization approach to reaching the
solution.
2.4. Sit-to-Stand Analysis
Sit-to-Stand analysis has been an important aspect of physical assessment of older
adults in different disciplines of research. Whitney [40] emphasized the Five-Times-Sit-To-Stand
Test (FTSST) as an important parameter of gauging the balance disorder. She tested her theory
on 93 subjects out of which 65% were correctly identified with physical dysfunction and she
went on to prove that if the test was conducted for seniors of age 60 or younger, the
continuous physical assessment was able to accurately discriminate between their previous
balance control and their current disorders. The accuracy rate went up to 81%. Lord [41]
conducted tests to determine whether balance and psychological factors in addition to lower-
limb strength predict sit-to-stand performance in older people. Testing his hunch on 669
community dwelling older adults, he verified that sit-to-stand analysis is indeed an indication of
their physiological processes. However, an important point he covered is that the ability to be
able perform sit-to-stands is a combination of physiological as well as psychological processes.

13
Several approaches have been made to analyze sit-to-stand activity. Allin et al. [9]
focused on certain parameters related to sit-to-stand as a measure of their physical capability.
In particular, they used silhouettes to discern parameters like arm swinging while rising as well
as the position of the foot while getting up from the chair. However, they used a three camera
system for monitoring and matched centroids from the three camera views as a means of
finding out the point location of the feet and torso centroids. From the three cameras, the
authors reconstructed three-dimensional features of the centroids and extrema across the
silhouette sequence. They computed the extremum points of the contours that are maximally
distant from the centroid to locate the foot and head segments and then smoothed the
locations over time using Kalman tracking. The features used were the Hu moments, distances
of the feet from the centroid, the head from the centroid, distances between the head, torso
and floor, speed of the head, angular speed of the torso, as well as raw locations of the feet.
For the classification of the activity, they used the decision tree software from the Weka
Machine Toolkit [14]. Also, preliminary work was presented in this paper using only two healthy
participants to perform eight types of sit-to-stands. These included no use of arms while rising,
use of arms to push from the seat, swinging of the arms to generate momentum, knee flexions
for angles of 80°, 90° and 110° while the person is rising. For the classifier they used 10-fold
cross validation technique for training the classifier. With the knee angle, they got 64% accuracy
which made sense because the angle difference is rather small between 80, 90, and 110
degrees. Also, with arms usage, they obtained 67% accuracy. However, with the activity or
state recognition, they got an 81% accuracy which seems promising. However, it they had very
few subjects on which they tested their results.

14
Another interesting approach was proposed by Goffredo et al. [10]. The authors
implemented a unique method of extracting the silhouette of the human body to get posture
information. They used the active contour model or the snake algorithm to extract the basic
contour of the silhouette but after that they used a neural network to further enhance the
contour obtained from the snake algorithm. This was a novel and interesting approach because
the active contouring assumes that there is a slight change in the contour over successive
image sequences which make motion tracking harder. They called this the neural snake
approach. From the extracted silhouettes, they tracked the trajectories of the marker-less
pivotal points of the human body, namely the hip joint, the shoulder joint and the knee joint as
a means to analyze sit-to-stand motion. For that, they used the Gaussian Laguerre log-
likelihood map (GLLLM) to estimate the points of interest, i.e. the joints in successive frames
using the estimated time required for each flexion movement, namely the hip motion, the knee
flexion and the trunk extension. The flexion angles were also computed using the GLLLM
method, and satisfactory results were obtained. This technique was interesting because they
used a dynamic time warping to compare the sit-to-stands of the different sequences, which
facilitates a comparison of the gaits or sit-to-stands of different subjects as well as of the same
subject over different time periods to indicate physical deterioration over time or as a measure
of estimating their stable health over time. The drawback of their technique was the
requirement of a large database of sit-to-stands which is not a requirement in the methods
described in this thesis. Most of the algorithms implemented here have not yet been tested in
the unstructured home setting.

15
In addition to computer vision techniques, other sensing modalities have been proposed
for capturing sit to stand motions. . Music et al. [28] used wearable inertial sensors and Kalman
filtering to detect sit-to-stand activity in the elderly. They computed the segment angles for the
hip, knee and ankle joints and verified the results using the Optotrak optical motion analysis
system. The drawback of these sensors is their sensitivity to motion which increases the
chances of false alarms. Hence, it seems a good idea to use motion sensors in addition to other
techniques such as videos and acoustic sensors in order to develop robust methods of
identifying activities using several sensing devices together which would then reduce the
chances of all of them being wrong at the same time, thus making it a more accurate system.
2.5. Clustering Techniques for Activity Segmentation
Clustering techniques have played an important part in motion analysis in computer
vision. Buzan [31] et al. used trajectories as features for cluster analysis to extract motion
information from videos. The moving blobs are detected from the background using the
mixture of Gaussian approach. Once the moving blobs are retrieved, Extended Kalman filtering
is employed to obtain reliable estimates of the moving blob trajectories. A parameter epsilon
was used to control the region of interest; the higher the value of epsilon, the greater the
region within which to detect similar trajectories and vice versa. Using agglomerative
hierarchical clustering techniques, the trajectories of the given video sequence are compared to
the video database of existing trajectories. Various distance measures were implemented such

16
as maximum distance, average distance, etc and these were compared to obtain results
regarding activities such as walking, running, and motion of cars [31].
Bensaid et.al. [32] implemented a novel semi-supervised approach of fuzzy c-means
clustering on medical resonance imaging of brain scans. They used semi-supervised clustering in
order to eliminate the two major disadvantages of clustering techniques, namely, choosing the
number of clusters during initialization and assigning physical labels to the classes at
termination. The latter issue is a point all clustering algorithms have to deal with during
implementation since there is usually no way to identify a particular class without any prior
information. In this paper, the authors labeled some of the pixels of an image into the different
classes so as to be able to identify the different segments of the brain. Using these labeled data,
cluster prototypes of the respective classes were obtained after which the classification was
much simpler than using unlabelled data.
Stauffer and Grimson [3] proposed clustering as a method to detect background
changes, but the activities were identified using a huge data base with prototypes of all the
activities which essentially made the segmentation more supervised in nature. They used
features such as the size of the object over time, the shape of the object and then compared
the motion silhouette clusters using co-occurrence matrices. This basically takes into account
the joint probability of two different activity segments and then gives the closest prototype.
Using this, the authors were able to identify the activities of a single person, a group of people
and motion of cars in a busy street. They monitored the activities in the area throughout the
day and compared the motion cluster with other existing prototypes. They built 400 prototypes

17
of people and cars and initially separated the data into two discrete classes: people and cars.
Then, they used the co-occurrence matrix to identify the pattern, i.e. whether a car was
eastbound or the motion of a person.
2.6. Background Subtraction
The crux of any tracking algorithm is separating out or identifying the object to be detected or
analyzed. Hence, before any activity segmentation technique is employed, the foreground has
to be segmented out from the background. For this research, the technique implemented is
silhouette extraction using color and texture features [43]. Silhouettes are black and white
images depicting the change in background in a given image sequence. Since our goal is to
create a continuously automated assessment system, researchers have found that silhouettes
are preferred for monitoring systems by older adults over the use of raw video sequences
because of privacy considerations [30].
A large part of the silhouette extraction depends on the accuracy of the background
modeling. Some of the major challenges faced currently in this front are variations in
illumination and the consequent effect of shadow in the background subtraction technique
implemented. Since the lighting is time varying in nature, the background subtraction is unable
to perform satisfactorily under varying illumination. Also, since the background is dynamic too,
if the background is changed, i.e. if some furniture is displaced or moved by residents, these are
reflected as noise in the resulting silhouettes.

18
Figure 2.3. Results using the Mixture of Gaussian Technique with the texture features.
The technique currently in use, described in [15], incorporates both color and texture
features for building the mixture of Gaussians defining the background. Here the color
components are expressed in Hue, Saturation and Value format; these results are fused with
the texture results using the Yager union. Morphological operations are then carried out to give
the final silhouettes. For our application, around 10 images are used to build the background.
Figure 2.3 shows the results of silhouette extraction using the technique mentioned above.

19
Chapter 3—Sit-To-Stand Analysis: Methodology
3.1 Introduction
As mentioned previously, the focus of this research was to obtain the regions in the
sequence where the sit-to-stand and stand-to-sit transitions took place. A point to note here is
that in the data runs logged, we followed an approach similar to the Berg Balance technique.
The subjects participating in the experiment were asked to fold their hands while getting up
which made them rise without using any kind of support from the chair, and the time measured
using a stopwatch was calculated from the time required to rise to the time to sit back in the
chair. A small program was used to measure this time on the same computer which stored the
image files so as to match the stopwatch time with the raw images time stamp. Also, the chair
used was the standard one used for the BBS test with an approximate seat height of 46cm [13].
The strategy implemented for transition analysis was the following: I first segmented
out the image frames into “sit” and “upright” and then obtained the remaining intermediate
frames as sit-to-stand and stand-to-sit. Since the time for sit-to-stand in the clinical
environment is measured as the time required by a person to get up from a chair and then sit in
it, it was required to identify both of these regions for analysis. The following techniques were
implemented in order to analyze the different activities performed in the image sequences.
1. Neural Network
2. Bayes Classifier
3. Fuzzy Clustering

20
4. Voxel Height Using Orientation
5. Voxel Height Using Shape Analysis With Ellipse Fitting
The initial two techniques (Neural Network and Bayes Classifier) did not yield satisfactory
results as they were both supervised techniques which made certain assumptions about the
nature of the data which was inaccurate. However, each of these methods led the way to the
latter techniques which gave more satisfactory outcomes as will be discussed later.
3.2. Image Moments as Features for Classification
Image moments are applicable in a wide range of applications such as pattern recognition
and image encoding. One of the most important and popular set of moments is the set of Hu
Moments [25]. These are a set of seven central moments taken around the weighted image
center. In particular, the first three Hu Moments are more robust in the presence of noise and
were used in this analysis.
In the Hu Moments, the central moments are defined as
휇 = ∑ ∑ (푥 − 푥̅) ∗ (푦 − 푦) ∗ 푓(푥, 푦), (1)
centered on the image centroid (푥̅,푦) with f(x,y) being the image intensity value at coordinate
(x,y). Using these moments, another set of moments are created using the following formula
휂 =( )
, (2)
Finally, the first three Hu Moments are computed with the equations (3) - (5) given as:

21
I = η + η , (3)
I = (η − η ) + (2η ) , (4)
I = (η − 3η ) + (3η − η ) , (5)
These moments are scale and rotation invariant which make them extremely robust and
applicable in different scenarios. However, they are non-orthogonal in nature; i.e., their basis
functions are correlated, making the information captured redundant. In contrast, the Zernike
orthogonal moments comprise image moments with higher performance in terms of noise
resilience, information redundancy and reconstruction capability.
The Zernike polynomials in polar coordinates [8] are given as:
V (r,θ) = R (r) ∗ exp(jnθ). (6)
The orthogonal radial polynomial is defined by
R (r) = ∑ (−1) F(m, n, s, r)| |
, (7)
where
F(m, n, s, r) = ( )!! | | ! | | !
r , (8)
For a discrete image, if P is the current pixel intensity, the Zernike moments are given by:
A = ∑ ∑ ∗V (x, y), (9)

22
Three of the moments were used in this experiment using equation (9) with order, m=2, 3, and
4 and angular dependence, n=0, 1 and 2 respectively. These were selected after implementing
Principal Component Analysis to see which moments were most suitable for this application.
The first three Hu moments were used as comparison since they are supposed to be more
robust in the presence of noise [25].
3.3. State Segmentation
The following section describes the segmentation techniques using neural networks,
Bayesian classifiers, clustering techniques as well as voxel height in addition to orientation and
ellipse fit methods implemented in order to identify the state of motion or state of activity.
3.3.1. State Segmentation Using Neural Networks
The first three Hu moments and Zernike image moments described above were initially
tested using the standard back propagation neural network. All the features were normalized in
order to make each of the features equally important in triggering the hidden nodes. Both the
camera views were tested using the Hu moments and the Zernike moments separately. Hidden
layers of 1 to 9 were tested with a different number of nodes in each layer ranging from 3 to 10
with 3 hidden layers of 5 nodes each. The Zernike image moments from both the camera views
yielded the better result. Using leave-one-out cross validation, I implemented the neural
network with epoch numbers ranging from 500 to 10,000 with 5,000 yielding optimum results.
A learning rate of 0.9 was found to be comparatively more effective.

23
Initially, segmentation of the activities using supervised techniques was tried. Using the
image moments described above, I hand segmented out the images and classified them into
three classes, namely, sit, transition and upright. The data used here was taken from residents
at Tiger Place with the senior residents as well as students from the University of Missouri
enacting scripted scenarios depicting regular activities such as a visitor coming into a room, and
the elderly resident sitting and reading a book and then walking for a short distance to put the
book in the trash. For the purpose of getting the Hu and Zernike moments of the resident only,
the images were manually segmented from those of the visitor. In some other sequences, there
was a housekeeper who came in to clean the room while the resident continued with his
regular work.
Using data from the residents at Tiger Place, I tried using leave one out cross validation and got
the following results:
Table 2.1. Classification of HCC Data Using Neural Networks
ID 2 ID 5 ID 9 ID 10
% Classification 81% 90% 51% 62%
Classification
(Numbers)
290/370 85/95 228/450 110/180
Here, the numbers ID 2, 5, 9, 10 refer to the reference numbers of the residents who
participated in our data runs and we address their privacy concerns by maintaining the
anonymity of their identities.
24
As can be seen, the inconsistency of results encouraged rethinking of the approach to
this particular problem. It seemed that hand segmenting out the data was not a very good idea.
This method brought to my notice that supervised techniques may not be that efficient at
activity recognition and other avenues needed to be explored.
3.3.2. State Segmentation Using Bayesian Inference
Using the same image moments (Hu and Zernike) described above and using similar
supervised techniques, I applied Bayesian analysis on the data sets. I tried it on one particular
data run first to see the feasibility. The data run was taken from a staged sequence in the lab of
a student making different sit-to-stands. The moments used here were both the Hu (first three)
as well as the Zernike moments. Neither method worked well, but the Zernike moments gave
better classification rates than the Hu moments. This indicated that the data is not Gaussian in
form.
My plan was to use a part of the data to obtain the posterior estimations of the mean
and covariance matrices of the Gaussian distributions and then use these values to classify the
remaining test data and compute the accuracy. Initially, I was planning on using the Empirical
Bayes technique using Maximum Likelihood to estimate the means and covariance matrices of
the 2 classes but for that I would have to use the conjugate priors for the mean and covariance
of the Gaussian distributions using hierarchical modeling which would make the problem more
complicated.

25
Instead, I applied the full Bayesian approach. I used the Inverse-Wishart distribution [8]
as priors to obtain the posterior estimate of the covariance matrices of the two classes and the
normal distribution to obtain the means [8].
Algorithm Steps:
I applied the Multivariate Normal with unknown mean and unknown Covariance matrix
technique on the two class sets (sit and stand) of data.
o For each of the two classes, I performed the following steps:
S = ∑ (y − y) ∗ (y − y) (10)
where y is the input image moment data and y is the sample mean.
o Then assuming the Jeffrey’s prior for the mean and Covariance matrix,
p(µ,Σ) ∝ |Σ| ( )/ (11)
o I got the posterior densities for the means and Covariance matrix using the
following functions:
Σ|y ~ Inv − Wishart (S) (12)
&
µ|Σ, y ~ N(y,Σ/n) (13)

26
After computing the means and Covariance matrices of the two classes: µ ,Σ , µ , Σ , I
computed the likelihood of the test data being in each of the two classes.
If p(y|µ , Σ ) > 푝(y|µ ,Σ ), then the data object y belongs in the first class; otherwise,
it belongs in the second class.
Finally, from the test data, I computed % accuracy by comparing the classes obtained for
the test data with the actual classification.
For this, I used the two packages bayesSurv and mnormt and mvnormt in R statistical language.
Using the Hu Moments, the results were disastrous with accuracy being less than 30%.
Consequently, I implemented the Zernike moments here separately.
The means and covariance matrices for the two classes obtained are:
Mean1 = [1434.27, 793.98, 1371.76]
Mean2 = [1490.68, 613.37, 1354.09]
Covariance Matrix1 = 9.158푒 − 10 −8.16푒 − 09 7.25푒 − 10−8.16푒 − 09 3.47푒 − 09 −3.05푒 − 097.25푒 − 10 −3.05푒 − 09 5.38푒 − 10
Covariance Matrix2 = 4.52푒 − 10 1.55푒 − 09 3.42푒 − 101.55푒 − 09 6.93푒 − 09 9.51푒 − 093.42푒 − 10 9.51푒 − 09 2.55푒 − 10
27
I tested the data set by splitting it into the training data and the testing data (300 training data
points and 100 test data points). I got 65.4% accuracy which does not seem very promising.
A predominant assumption here was that the parameters were arranged in a Gaussian
distribution which was really not the case and explained the poor results. While this particular
method did not yield successful results, it brought to notice the importance of considering the
nature of distribution of the moments since that determined the technique to be implemented.
3.3.3. State Segmentation Using Fuzzy Clustering Techniques
The fuzzy clustering idea was conceived after the supervised methods failed to yield
satisfactory results. It brought home the fact that unsupervised techniques might yield more
positive results in a problem where assigning classes to training data sets seemed to be an
unproductive idea. After obtaining the silhouettes from the image sequence, the next step in
the algorithm is extracting image moments as shown in the block diagram in Figure 3.1.
The clustering algorithms used in the experiments are explained later in this section.

28
Figure 3.1. Block Diagram of Sit-To-Stand Detection Using Fuzzy Clustering Techniques
3.3.3.1 Clustering Algorithms:
Gustafson Kessel clustering technique:
The Gustafson Kessel (GK) Algorithm is an extension of the Fuzzy C Means algorithm in
which each cluster has its own unique covariance matrix. This makes the algorithm more
robust and more applicable to various data sets which contain ellipsoidal clusters of
different orientations and sizes [26].
Algorithm:
1. Fix c = number of clusters & initialize the iteration counter t=1.
2. Initialize membership matrix U for all the data points and for each of the clusters. (The
initialization is explained further in this section.)
3. Do

29
4. Compute the cluster centers using equation (14).
푐 (푡) =∑ ( )∗∑ ( )
, (14)
5. Compute the covariance matrices for each of the clusters as in equation (15).
Σ (t) =∑ ( )∗ ( ) ∗( ( ))
∑ ( ), (15)
6. Update the partition matrix:
푢 (푡) =∑ (
,,
) /( ), (16)
using the Mahalanobis distance, Dik, given by:
퐷 = (푥 − 푐 (푡)) ∗ Σ (푡) ∗Σ (푡) ∗ 푥 − 푐 (푡)
where l is the length of feature vector x.
7. Increment the iteration counter t.
8. Until || c (t)-c (t-1) || <Є or t > tmax where Є is the minimum permissible error and
tmax is the maximum number of iterations specified.
Here, c(t) is the vector of all centers and the distance norm employed for determining
convergence is the standard Euclidean distance measure. An important point to note is that
it is essential to initialize the membership values to random values but with the mean equal

30
to 0.5 and standard deviation equal to one so that the algorithm converges at a much faster
rate.
Gath and Geva:
This fuzzy clustering technique employs a distance norm based on the fuzzy maximum
likelihood estimates [9] as shown below.
Algorithm:
1. Fix c = number of clusters.
2. Initialize the membership matrix. (Specified further in the section) Initialize the iteration
counter t=1.
3. Do
4. Calculate the cluster centers for input x with the membership values u as in equation
(17)
푐 (푡) =∑ ∗∑
, (17)
5. Compute the fuzzy covariance matrix, equation (18).
퐹 (푡) =∑ ( )∗( ( ))∗( ( ))
∑ ( ), (18)
6. The distance between the feature vectors is computed using equation (19).

31
퐷 =( )
. 푒푥푝 푥 − 푐 (푡) 퐹 푥 − 푐 (푡) (19)
with a priori probability:
훼 = ∑ , (20)
7. Update the partition matrix:
푢 (푡) =∑ ( ) /( )
, (21)
8. Increment iteration counter t.
9. Until || c (t) - c (t-1) || <Є
The distance function is what makes this algorithm so unique. However, due to the
exponential distance norm, unless properly initialized, it converges to a near local optimum
which could yield erroneous results. Using the simple initialization technique similar to the
GK algorithm leads to erroneous results, which is why, for our experiments, the partition
matrix is initialized using the resulting partitions of the standard Fuzzy C Means algorithm as
suggested in [27]. For our application, initially three clusters were implemented but the
results were not as satisfactory as can be seen in Figure 3.2.
32
(a) (b)
(c) (d)
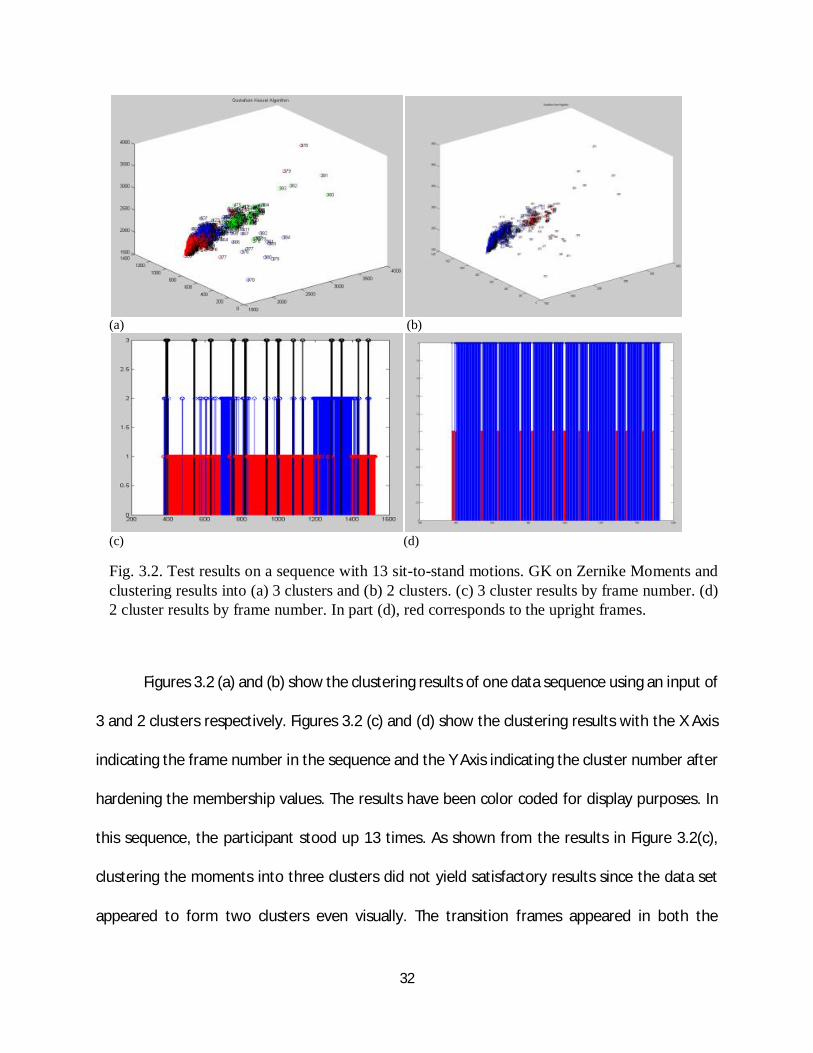
Fig. 3.2. Test results on a sequence with 13 sit-to-stand motions. GK on Zernike Moments and clustering results into (a) 3 clusters and (b) 2 clusters. (c) 3 cluster results by frame number. (d) 2 cluster results by frame number. In part (d), red corresponds to the upright frames.
Figures 3.2 (a) and (b) show the clustering results of one data sequence using an input of
3 and 2 clusters respectively. Figures 3.2 (c) and (d) show the clustering results with the X Axis
indicating the frame number in the sequence and the Y Axis indicating the cluster number after
hardening the membership values. The results have been color coded for display purposes. In
this sequence, the participant stood up 13 times. As shown from the results in Figure 3.2(c),
clustering the moments into three clusters did not yield satisfactory results since the data set
appeared to form two clusters even visually. The transition frames appeared in both the

33
clusters and did not form a separate cluster. In Figure 3.2(d), using two clusters, we can see the
clean separation with the 13 red regions corresponding to the 13 times the participant stood up
during the sequence. Based on these results, we chose to cluster the data into two clusters
which yielded good distinction between sitting and upright positions. In order to classify the
clusters as “upright” or “sit”, a semi-supervised approach was implemented in which the cluster
prototypes from previous data sets were classified into the “sit” and “upright” clusters and the
prototypes of the clusters of the current data set was then classified into the two classes using
the Nearest Neighbor approach.
3.3.4. State Segmentation Using Voxel Height & Orientation
Multiple camera views are important for activity recognition in order to increase the
robustness of the algorithm in terms of single camera occlusion and for a better estimation of
the location of the person in the room. The technique described in this section using a three-
dimensional model constructed from two camera views is more robust in terms of location of
the chair with respect to the position of the cameras. Similar to the pixels in two dimensions,
voxels are the three dimensional volume elements formed from non-overlapping cubes
representing the points of intersection of the various camera views and hence representing the
person or the foreground object in the room. For our application, the silhouettes of the two
images closest in time (from different cameras) are projected into voxel space; the intersection
is used to obtain the voxel person at a given time frame [15]. Currently, our system uses a
resolution of a 1 inch X 1 inch X 1 inch voxel. The resulting voxel person is shown below in
Figure 3.3 depicting the stand to sit motion.

34
(a) (b)
(c)
Figure 3.3. Voxel person of a person (a) Standing, (b) Transitioning (Stand to Sit) and (c) Sitting
For segmenting out the upright and the sit regions in an image sequence, the voxel height of a
person is used for the first stage to obtain a coarse segmentation. Figure 3.4 indicates a
sequence of a person sitting down and getting up from a chair.

35
Figure 3.4. Height Graph of a sequence indicating the upright and sit regions. The height before
filtering is shown in blue; the red color depicts the height after filtering.
The initial technique implemented used the height of the voxel person alone for the
measurement of the sit-to-stand time which did not give very accurate results in all cases. It is
apparent from the above figure, by simply looking at the height of the voxel person in three
dimensional space, it is possible to estimate when a person is upright and when he is sitting
down. In fact, another added advantage in this particular technique is the ability of being able
to segment out the upright sequence into standing and walking by using the centroid location

36
of the voxel person to indicate walking motion. It is logical that if the person is standing, the
centroid will remain stationary and when he is walking, the centroid will move. However,
sometimes, due to lighting or background changes, noise is introduced in the silhouettes which
can cause noise in the computation of the voxel height. The figure below indicates one such
problem of intersection of the silhouette with another object present in the image which was
not identified as background since the object was displaced.
Figure 3.5. Silhouette of a person sitting in a chair with noise present near the head
Figure 3.5 shows a person sitting in a chair and there is a book on the table which was
not present before which caused an extension of the silhouette near the person’s head. As is
obvious, this extension can cause an increase in the person’s height which will give rise to an
error. To mitigate this error somewhat, an averaging filter was implemented and is also shown
in the height figure displayed above (Figure 3.4, shown in red). However, this assumes that the
artifact present is temporary or else the entire sequence height will be affected.

37
3.3.4.1 Orientation
Image moments have already been mentioned previously in the activity segmentation
using fuzzy clustering. In this technique we also use image moments. Orientation of the
silhouette (in this case, the body) is the angle the body makes with respect to the normal to the
ground plane.
휃 = tan ( ∗ ) (22)
Where 휇 is defined in the definition of Hu moments in Equation 1.
Here, we use the second order image moments to compute the orientation of the
silhouette which is an indication of the shape and the angle of the silhouette. For this current
application, I use the angle of the silhouette shape computed with respect to the normal to the
floor plane.

38
Angle of Orientation vs. Frame Number
(a) (b)
Figure 3.6. Graph of Orientation (in degrees) vs. the Frame Number of a Sequence (a) without any further post processing, (b) after using an averaging filter on the results. The filtered results are shown in red.
Figure 3.6 shows the graph of orientation (in degrees) vs. the frame number. The left
graph indicates the original values and the right graph shows the results after averaging the
values using an averaging filter with window size 5 so as to mitigate the noise present in the
silhouettes. In this particular sequence, a person was initially sitting down and then he got up
from the chair. The plateau-like region in the graph indicates the region of the image sequence
where the person was sitting. As this is the orientation of the entire body of the person as he is
sitting down, the angle is quite large with respect to the normal to the ground. As he gets up,
this angle keeps decreasing until it reaches to almost zero degrees when the person is
completely erect. The horizontal line in both the graphs indicates the threshold to obtain the
location of the first frame from which sit-to-stand begins. A threshold of four degrees from the
maximum sitting angle yields satisfactory results on the image sequences for which this
algorithm has been tested. A part of the image sequence and the results are displayed below.

39
Sit-to-Stand Silhouettes Over 2 Second Interval
Figure 3.7. Sequence of silhouettes with the silhouette indicating the beginning of sit-to-stand transition circled in green.
Figure 3.7 shows a part of the image sequence whose orientation graph was displayed in
Figure 3.6. The silhouette circled in green indicates the frame selected as the beginning of the
sit-to-stand using the orientation technique with a threshold of the afore-mentioned 4 degrees
(below the maximum) as shown in Figure 3.6.
3.3.4.2. The Entire Sequence
Figure 3.8 shows the height of the person in a sequence showing a person walking into a
room and performing four sit-to-stand motions in a chair and then ending in the sitting
position. In this example, the chair is positioned at approximately 90 degrees with respect to
camera 1. The region of interest here consists of the two consecutive sit regions highlighted
which are then sent to the orientation algorithm.

40
Figure 3.8. Height (inches) of a person in a sequence with viewing angle of 90 degrees with camera 1 indicating a person performing 4 sit-to-stands.
Figure 3.9 shows the orientation results on the region of interest marked in Figure 3.8. The sit-
to-stand time is computed after thresholding from the maximum orientation value by four
degrees as indicated by the red line in Figure 3.9.
Sit Stand Sit

41
Silhouette Angle vs. Frame Number
Figure 3.9.Orientation graph (a) and after using the averaging filter (b) of the sequence marked in Figure 3.8 with viewing angle of 90 degrees with camera 1 showing a person performing a sit-to-stand.
3.3.5. State Segmentation Using Voxel Height & Ellipse Fitting
After implementing the orientation technique, it became apparent that the technique
was susceptible to noise present in the silhouettes. It became important to try other techniques
to identify the postures from the shape of the silhouettes using more robust techniques. Hence,
applying curve fitting algorithms seemed a good idea. However, without using dynamic models
which did not require any prior modeling information or templates, it seemed to be a complex
problem. It also seemed to be a good idea to specify the curve type and try and fit the
silhouette points onto that curve. It then was apparent that ellipse fit would be a good and
simple idea to gather more information about the silhouette. Fitzgibbon and Fischer [16]
proposed a simple technique to implement ellipse fit using least squares fitting.
Sit Stand Sit

42
F(x, y) = ax + bxy + cy + dx + ey + f = 0 (23)
Subject to the constraint (for ellipse)
b − 4ac < 0 (24)
where a = [a, b, c, d, e, f] are the coefficients of the ellipse and x = [x , xy, y , x, y, 1] is the
vector of co-ordinates.
Equation 23 can be rewritten as:
F (x) = a ∗ x = 0 (25)
Hence, the fitting of an ellipse on a set of given points is given by:
min ∑ F(x , y ) = min ∑ (x . a) (26)
In general, Fitzgibbon showed that it was hard to solve equations with constraints like Equation
24. Thus, the constraint was further specified as:
4ac − b = 1 (27)
And the problem can be reformulated as:
min ||Da|| subject to constraint a Ca = 1 (28)
where the Design Matrix of size Nx6 was given by:
D =x x y yx x y xx x y x
x y 1x y 1x y 1

43
and the constraint matrix C
On applying Lagrangian Multipliers, we get:
Sa = λCa and a Ca = 1 (29)
where S = D D.
The final system of equations is then solved by:
||Da|| = a D aD = a Sa = a λCa = λ (30)
However, this technique has some drawbacks since it does not take into consideration the
possibility of the scatter matrix S being singular. Another problem with the above algorithm is
also described in [17]. In [16], Fitzgibbon & Fischer proved that Eq. 30 has exactly one positive
eigenvalue and they stated that the corresponding eigenvector is an optimal solution of Eq. 29.
In [17], Halir and Flusser proved it wrong by pointing out that in an ideal case, when all data
points lie exactly on an ellipse, the eigenvalue is zero. Moreover, regarding a numerical
computation of eigenvalues, the optimal eigenvalue could even be a small negative number. In
such situations, Halir and Flusser [17]claimed that Fitzgibbon’s algorithm would produce non-
optimal or completely wrong solutions. To overcome this problem, the problem is decomposed
into two parts. The Design Matrix is divided into two parts.

44
D = (D1|D2) (31)
D1 =x x y yx x y xx x y x
& D2 = x y 1x y 1x y 1
Next, the scatter matrix was split into the following parts:
S = S1 S2S2 S3 , S1 = D D , S2 = D D , S3 = D D (32)
Similarly,
C = C1 00 0 , C1 =
0 0 20 −1 02 0 0
(33)
And finally, the ellipse vector is divided into two parts:
a = , a1 =abc
a2 =def
(34)
Hence, Equation 29 can be rewritten as:
S1 S2S2 S3 ∗ = λ. C1 0
0 0 ∗ (35)
This is equivalent to the following equation:
S1a1 + S2a2 = λC1a1
a2 = −S3 S2 a1

45
(S1 − S2 ∗ S3 ∗ S2 )a1 = λC1a1 (36)
In[17], Halir also claimed that S3 would be singular only if all the points fell in a line in which
case there would be no real case of fitting the points into an ellipse.
Due to the special shape of the matrix C, i.e., since C contains mostly zeros and using the block
arithmetic operations of matrices,
a1 C1a1 = 1 (37)
Using the above equations, the final set of equations is given as:
Ma1 = λa1 (38)
where
M = C1 (S1− S2 ∗ S3 ∗ S2 ) (39)
The final result was an improvement over the Fitzgibbon [16] method in terms of
numerical stability and preventing local optimization. In addition to this, the authors
implemented the algorithm on several synthetic data sets [17], proving the robustness of the
algorithm to noise, with a guaranteed ellipse solution and even invariance of the solution to
affine transformation of the data points. An important point in favor of this particular algorithm
is that it is non-iterative and extremely fast to implement making it suitable for real-time
applications. The ellipse fit also is less sensitive to noise compared to the orientation technique.
Figures 3.10 (a), (b) and (c) show the results of ellipse fitting on the set of points located at the
edge of the silhouettes obtained by using the Canny edge detector.
46
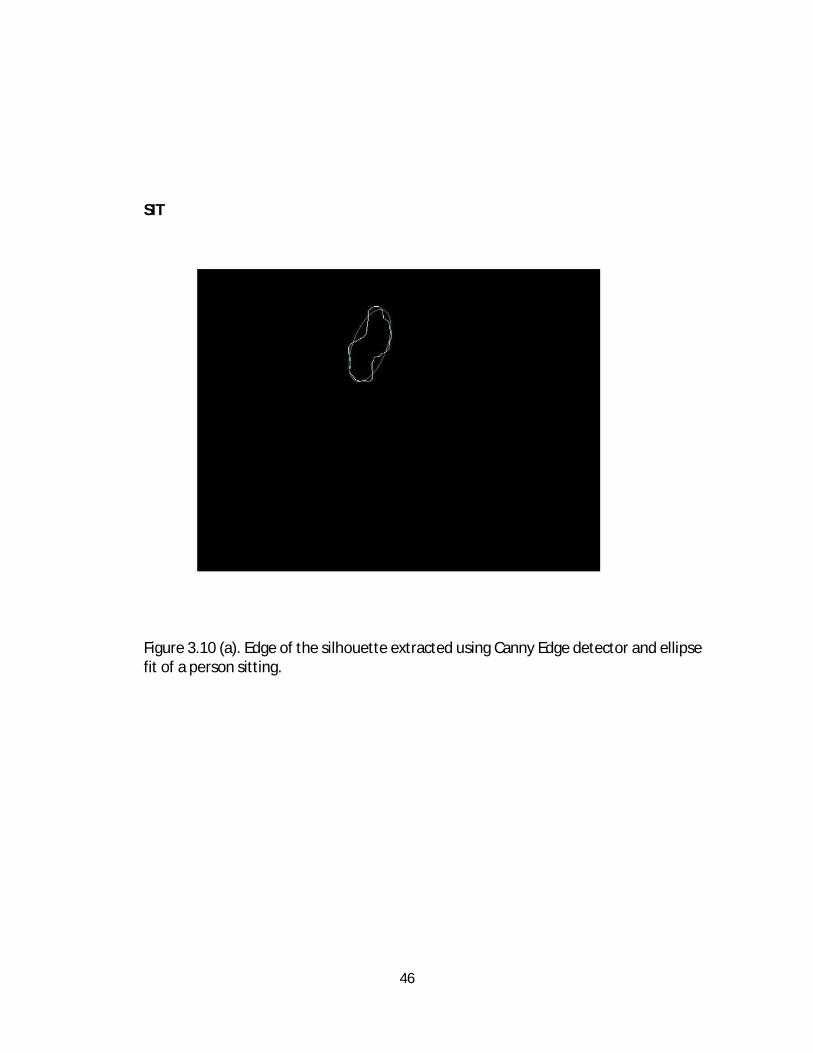
SIT
Figure 3.10 (a). Edge of the silhouette extracted using Canny Edge detector and ellipse fit of a person sitting.

47
TRANSITION
Figure 3.10 (b). Edge of the silhouette extracted using Canny Edge detector and ellipse fit of a person getting up. UPRIGHT
Figure 3.10 (c). Edge of the silhouette extracted using Canny Edge detector and ellipse fit of a person upright.

48
As can be seen in Figure 3.10 (b), the fitted ellipse is the smallest, i.e., the ellipse comes closest
to a circle at that point. The ratio of the major axis length divided by the minor axis length is the
least at that instance.
After sending the same frames to the ellipse fit algorithm as those shown in Figures 3-8-3.9, the
results of the major axis/ minor axis ratio is shown in Figure 3.11.
Figure 3.11. Ellipse Major/ Minor Ratio for camera 1 for chair at right angles with camera 1 of a person performing one sit-to-stand
The same experiment was repeated for a sequence with the chair at a non-orthogonal
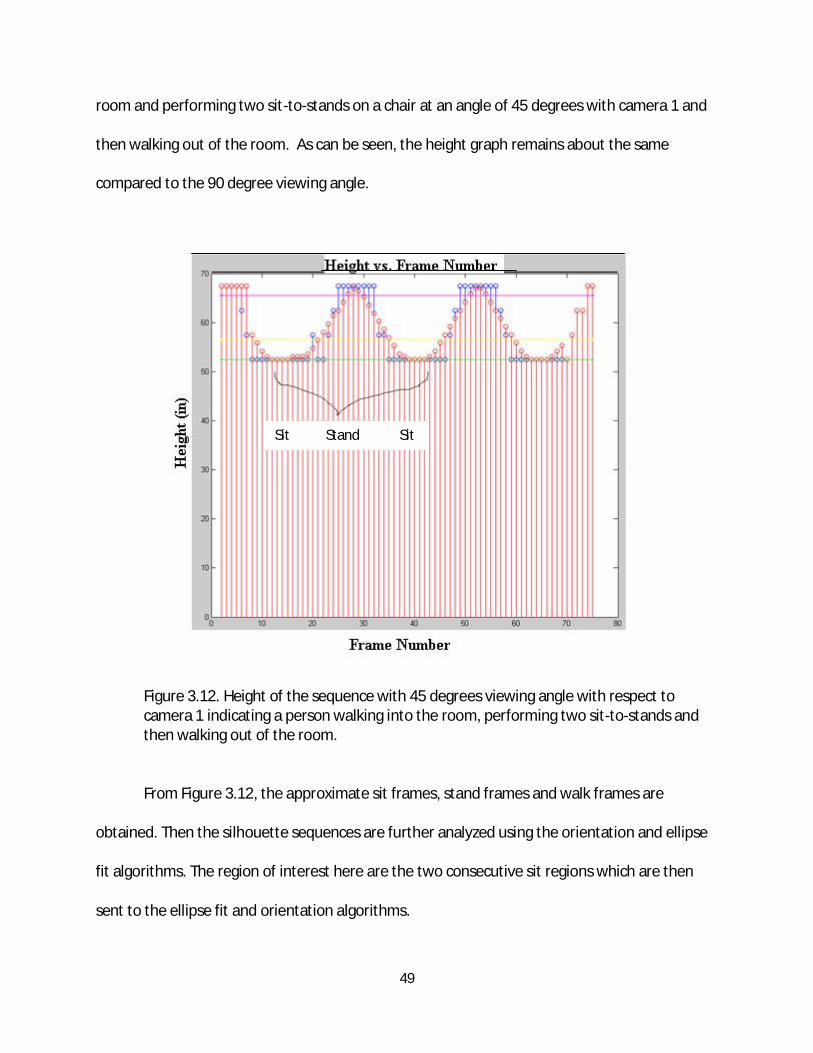
viewing angle. Figure 3.12 shows the height of a sequence showing a person walking into a
Sit Stand Sit
49
room and performing two sit-to-stands on a chair at an angle of 45 degrees with camera 1 and
then walking out of the room. As can be seen, the height graph remains about the same
compared to the 90 degree viewing angle.
Figure 3.12. Height of the sequence with 45 degrees viewing angle with respect to camera 1 indicating a person walking into the room, performing two sit-to-stands and then walking out of the room.
From Figure 3.12, the approximate sit frames, stand frames and walk frames are
obtained. Then the silhouette sequences are further analyzed using the orientation and ellipse
fit algorithms. The region of interest here are the two consecutive sit regions which are then
sent to the ellipse fit and orientation algorithms.
Sit Stand Sit

50
Figure 3.13 shows the ratio of the Major Axis/ Minor Axis of the ellipse fitting algorithm
described previously. The sequence shows a person initially sitting, getting up and sitting down
again. As can be seen, there are two noticeable dips which occur when the person scoots
forward in the process of getting up, as well as when the person just sits down. This position
was indicated previously in Figure 3.10 (b) where the ellipse gets closes to a circle which is why
the ratio of the major axis with respect to the minor axis is the minimum. Hence, an accurate
frame series is obtained to classify the sit-to-stand period.
Figure 3.13. Ellipse Major/ Minor Ra o for camera 1 for chair with loca on 45̊ with camera 1 for a person performing a sit-to-stand-to-sit.
Sit Stand Sit

51
Figure 3.14 shows the orientation results for the same sequence as Figure 3.13. Here,
we can see that the angle of the silhouette is the highest when the person is sitting and then it
gradually reduces as he gets up. When the person is completely upright, the orientation is the
minimum (tending to zero degrees) and then it again increases as the person sits down again.
Hence, it can be seen that there is no noticeable valley like figure 3.13 here. A thresholding of 3
degrees from the maximum is used to detect the sit-to-stand period which shows that more
approximation is required in this technique as compared to the former one.
Figure 3.14. Angle of Orienta on with respect to camera 1 for chair at angle 45̊ with camera 1 of a person performing a sit-to-stand-to-sit.
Sit Stand Sit

52
The best camera view was chosen using the ellipse fit technique by finding out the
difference between the minimum and maximum value in the major axis / minor axis for the
given image sequence. For example, for a viewing angle with the chair facing camera 1, the
difference was 0.932 and with camera 2 for the same sequence (here it was a side view, i.e. the
best viewing angle theoretically) the difference was 2.93. For a viewing angle of around 45° of
the chair with respect to both camera 1 & 2, the difference was 1.583 and 1.698 with the image
sequences from the two cameras. An important point to note here is that when the chair’s back
is facing one of the cameras, the silhouettes are cut off, i.e. occluded which gives results such as
those in Figure 3.15. The occlusion is present even when the person rises and the value of the
major axis is very small (~ 20 pixels) compared to the one when the silhouette is intact (~50
pixels); this is used to detect occlusion of the chair back.
Figure 3.15. Ellipse Fit Result of an occluded silhouette due to viewing angle
53
Chapter 4—Experimental Setup
4.1. Introduction
Experiments were conducted on nine people with ages varying from 18 to 88. Six of the
participants were healthy young adults; one was a healthy person over fifty years of age and
two elders over the age of 80 participated. The chair used had a standard seat height
(approximate 46 cm) as suggested in the Berg Balance Scale test. The video sequence was
captured at a rate of 5 frames per second using a two camera system and validated by the
Vicon system.
To explore the results for a range of sit-to-stand styles, different types of sit-to-stand
motions were acted out, including a slouched sit-to-stand which is common as elderly people
start bending forward with age, a sideways slouch (both left and right) to depict patients with
paralysis, and sit-to-stand with legs away from the body to portray patients suffering from knee
injuries. Two physical therapists were included in the participant group. They demonstrated the
abnormal sit-to-stand motions that show how paralysis, old age and knee injuries affect a
person’s ability to get up from a chair. Each of these motions was repeated multiple times by
each of the five healthy, young subjects. The two healthy, elderly participants were asked to
repeat their usual sit-to-stands five times each. In all, 70 runs were taken with 30 of them being
the normal healthy runs and the remaining 40 were the elderly or abnormal sit-to-stands
mentioned above.

54
In addition, another set of experiments was conducted to test the limits of the algorithms.
In particular, the chair angle was varied with respect to the cameras, and the chair was placed
at the boundary region of the voxel space. These experiments and results are discussed
separately in Chapter 5.
4.2. Variable Angle of Chair with Respect to Cameras
In order to make the experiments more robust, experiments were conducted with the
chair placed at different angles with respect to the camera. Since we plan on using the system
for real-time monitoring in the home, it is important to test the system with different scenarios.
The procedure implemented was the same as the ones described previously, the only change
being in the variation in the angle of position of the chair with respect to the cameras.
Rise Time was computed and classification was done using the Gustafson Kessel
technique as well as implementing the orientation and ellipse fit technique to indicate the
robustness of the two algorithms. The results for this are mentioned in the next section.
4.3. VICON System as Ground Truth
The Vicon Nexus motion capture system was used as ground truth to identify the
activities as well as measure the sit-to-stand times. Reflective markers are placed at the key
points on the subject’s body. These markers are detected by the MX cameras and their 3D
locations are determined over time which gives an accurate description of the activities

55
performed. For our experiments, reflective markers were placed on the top of the head,
shoulders, on top of the back in line with the shoulders, in the middle of the back and on the
feet of the subjects while the experiments were being conducted. This can be seen in Figure
4.1. These markers allowed the Nexus software to detect the activities of the person while
he/she was walking, standing, sitting or getting up from the chair within the field of view of the
camera system. Using the marker on the head, the height of the person is obtained which can
then be used to get information about the person with respect to his or her state of motion, i.e.
whether he is sitting, upright, walking or in transition state (sit-to-stand or stand-to-sit). For the
experiments described here, the classification was made using the height of the person
obtained from the Vicon marker on the head.
Figure 4.1. An elderly participant with markers on the head, shoulder, two on the back and feet for the VICON motion capture system.
4.4. Stop Watch
The stop watch is used by physical therapists to capture sit to stand times. For
comparison, it was used here as a secondary measure of ground truth. To capture time using

56
the stopwatch, the therapist has to manually reset the stop watch and instruct the subject
performing the sit-to-stand motions. The therapist says “Go!” wherein the subject rises to a
standing position and then sits back in the chair as soon as he is able without any loss of
balance or change in location of the chair. This method is subject to error in the sense that it
assumes immediate response from the subject as he or she rises to perform a sit-to-stand. Also,
the therapist controlling the stop watch has to be precise in stopping the time count as the
person’s back touches the back of the chair. This increases potential manual error and makes
the stop watch less suitable as a measure of ground truth for the data collection.

57
Chapter 5—Experimental Results and Analysis
5.1. Chair Placed Perpendicular to one Camera View
In this chapter, I first discuss frame classification results using the Gustafson Kessel (GK),
Gath and Geva (GG), Fuzzy C Means (FCM) and Vicon System for Sit, Upright and Transition
frames for the participants. Next, transition times between sitting and standing for a number of
body positions, including arm, leg, and pelvis positions are discussed with respect to the
stopwatch, VICON, and Voxel models. Finally, the different methods are compared. While,
ideally, all of the algorithms should work well, the elliptical method works best due to
robustness in presence of noise in the silhouettes. The stopwatch, while simple, is the least
effective method due to its manual operation.
5.1.1. Frame Classification Results
Figure 5.3 shows the clustering classification results on seven subjects using different
sit-to-stands and with different clustering techniques and the Vicon system as ground truth. We
use the marker on the head of the subject as a means of detecting the height of the person as
he is performing the activities such as sitting, standing, and walking, allowing distinction
between these activities. The results are explored in the form of confusion matrices in Tables
5.1-5.3.

58
(a)
(b)

59
(c)
Figure 5.1. Classification Results using the Gustafson Kessel (GK), Gath and Geva (GG), Fuzzy C Means (FCM) and Vicon System for Sit (a), Upright (b) and Transition (c) frames for the seven participants.
Table 5.1. Confusion matrix of the GK algorithm with respect to the Vicon system for the
activities of sit, transition, and upright.
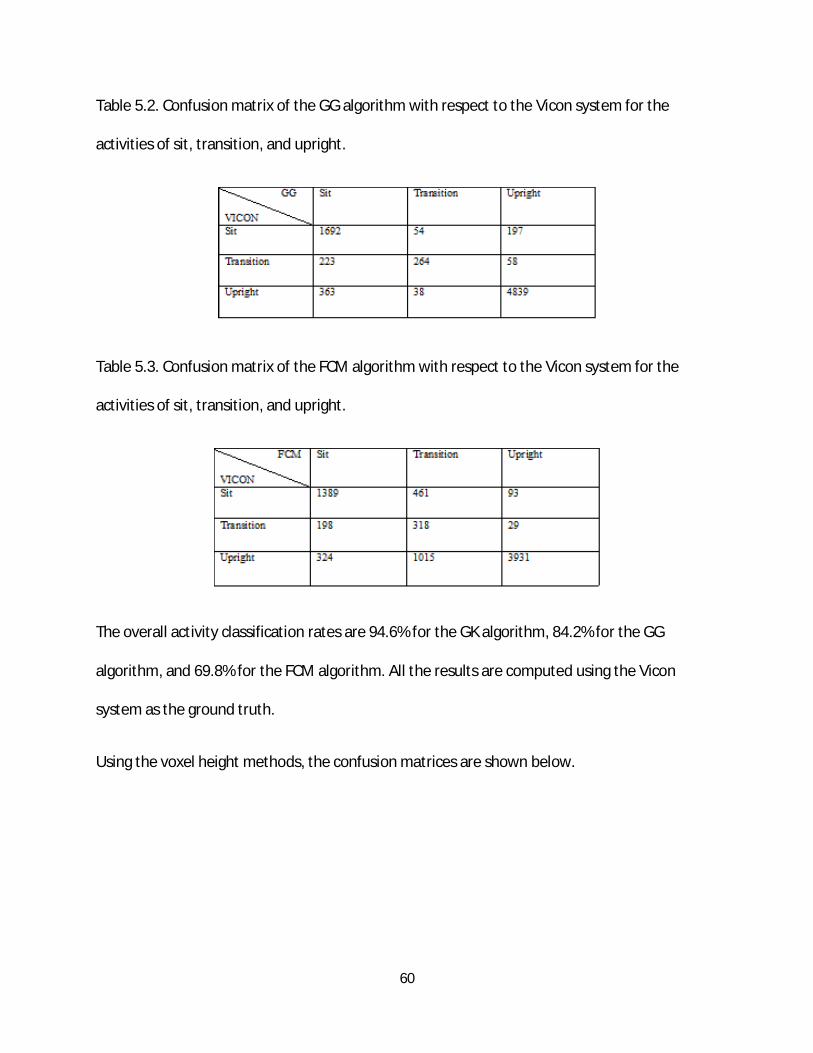
60
Table 5.2. Confusion matrix of the GG algorithm with respect to the Vicon system for the
activities of sit, transition, and upright.
Table 5.3. Confusion matrix of the FCM algorithm with respect to the Vicon system for the
activities of sit, transition, and upright.
The overall activity classification rates are 94.6% for the GK algorithm, 84.2% for the GG
algorithm, and 69.8% for the FCM algorithm. All the results are computed using the Vicon
system as the ground truth.
Using the voxel height methods, the confusion matrices are shown below.
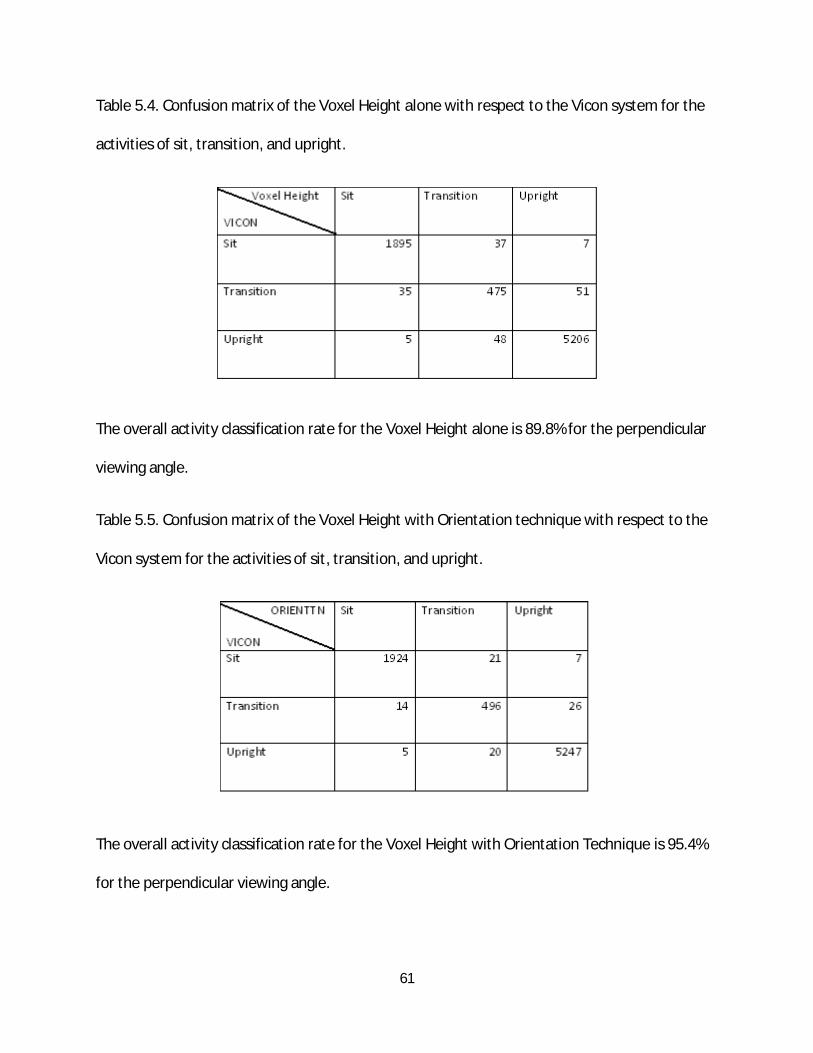
61
Table 5.4. Confusion matrix of the Voxel Height alone with respect to the Vicon system for the
activities of sit, transition, and upright.
The overall activity classification rate for the Voxel Height alone is 89.8% for the perpendicular
viewing angle.
Table 5.5. Confusion matrix of the Voxel Height with Orientation technique with respect to the
Vicon system for the activities of sit, transition, and upright.
The overall activity classification rate for the Voxel Height with Orientation Technique is 95.4%
for the perpendicular viewing angle.

62
Table 5.6. Confusion matrix of the Voxel Height with Ellipse Fit technique with respect to the
Vicon system for the activities of sit, transition, and upright.
The overall activity classification rate for the Voxel Height with Ellipse Fit Technique is 97.3% for
the perpendicular viewing angle .
5.1.2. Sit-To-Stand Time
Sit-to-stand and stand-to-sit transition time data were collected on five subjects
performing different trials such as slouching forward, slouching to the left and right sides
respectively, getting up from the chair with feet away from the body (hence making it difficult
to rise), getting up from the chair with feet under the body (as in normal sit to stand), and with
the assistance of hands. These are discussed in the following sections.

63
Voxel Height Using all the Techniques Reported by Subject:
Rise Time was measured using the frame rate after getting the sit-to-stand frames from
the sequences. Frames were classified as sit, transition, and stand by using the two-stage
approach described in Section 3.4.2.4. The results are expressed in column charts to indicate
the comparison with the stop watch and the Vicon system. The results are presented for each
subject, showing the different types of sit-to-stand motions.
0
1
2
3
4
5
6
Sit-
To-S
tand
Tim
e (s
econ
ds)
Subject 1
Stop Watch
VICON
Voxel +Ellipse Fit
Voxel + Orientation
GK
Voxel Height
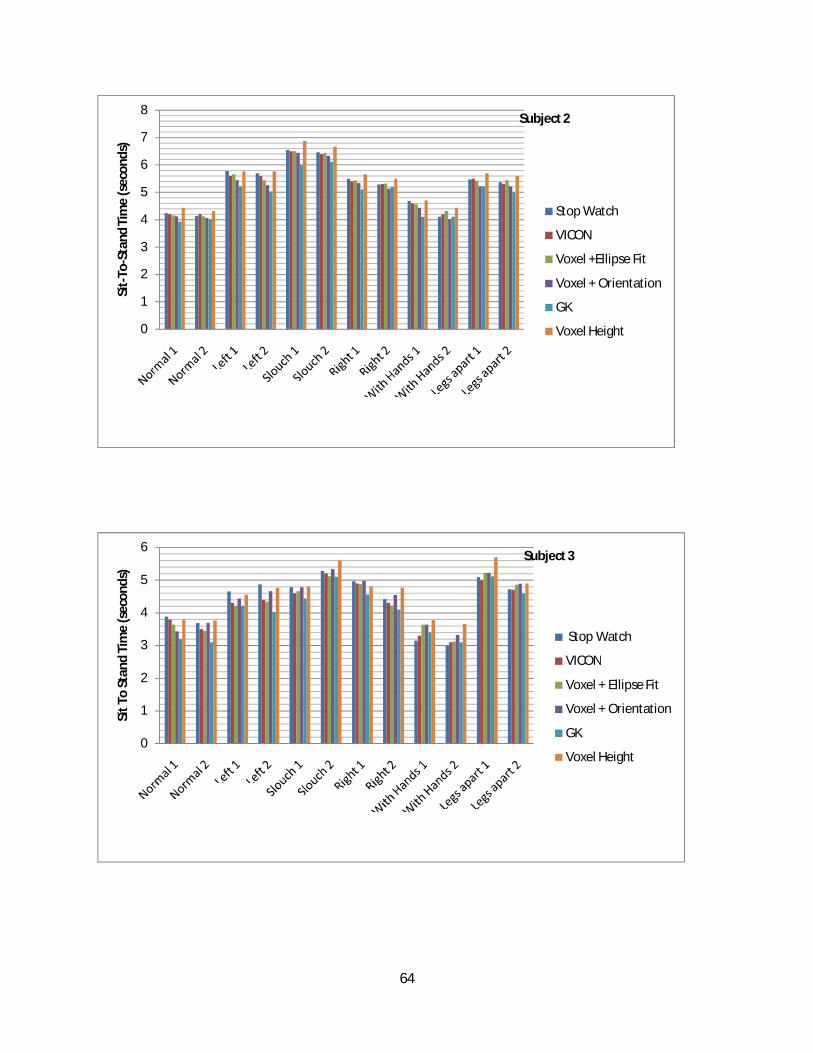
64
0
1
2
3
4
5
6
7
8Si
t-To
-Sta
nd T
ime
(sec
onds
)Subject 2
Stop Watch
VICON
Voxel +Ellipse Fit
Voxel + Orientation
GK
Voxel Height
0
1
2
3
4
5
6
Sit T
o St
and
Tim
e (s
econ
ds)
Subject 3
Stop Watch
VICON
Voxel + Ellipse Fit
Voxel + Orientation
GK
Voxel Height
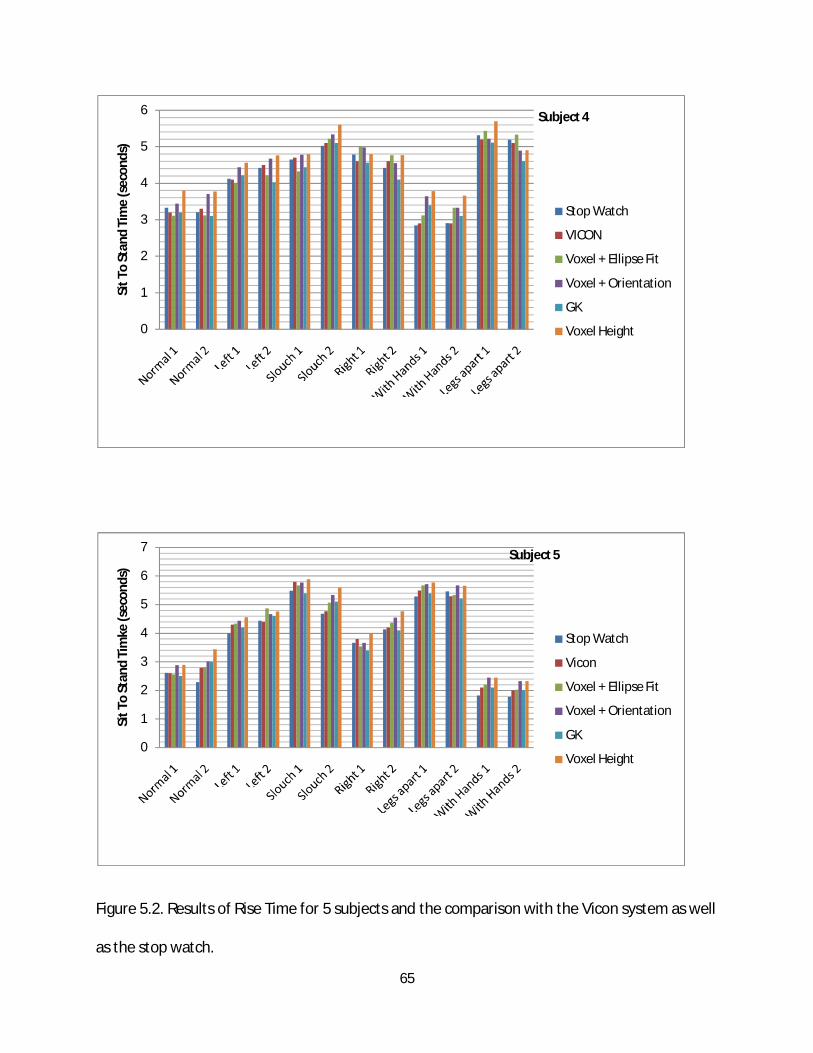
65
Figure 5.2. Results of Rise Time for 5 subjects and the comparison with the Vicon system as well
as the stop watch.
0
1
2
3
4
5
6Si
t To
Stan
d Ti
me
(sec
onds
)Subject 4
Stop Watch
VICON
Voxel + Ellipse Fit
Voxel + Orientation
GK
Voxel Height
0
1
2
3
4
5
6
7
Sit T
o St
and
Tim
ke (s
econ
ds)
Subject 5
Stop Watch
Vicon
Voxel + Ellipse Fit
Voxel + Orientation
GK
Voxel Height

66
As can be seen from the column chart results described in Figure 5.2., the voxel results with the
ellipse fit method are closest to the Vicon system.
Table 5.7. Table for Average Sit-To-Stand Time Difference for the five subjects in Figure 5.2 for
the Stop Watch, Voxel Height, Orientation and Ellipse Fit Technique with respect to the Vicon
System.
Subjects Stopwatch-Vicon
Time (sec)
Height-Vicon
Time (sec)
Ellipse-Vicon
Time (sec)
Orientation-Vicon
Time (sec)
1 0.32 0.34 0.28 0.31
2 0.34 0.32 0.29 0.30
3 0.33 0.32 0.29 0.31
4 0.31 0.31 0.28 0.29
5 0.30 0.32 0.29 0.29
Composite 0.32 0.32 0.29 0.30
Table 5.7 shows the average sit-to-stand time differences between the different techniques,
namely, the stop watch, computing sit-to-stand time using the voxel height alone, using voxel
height in conjunction with the ellipse fit technique and using the voxel height along with the
orientation method. The average for all the different types of sit-to-stands was taken, i.e., 12

67
sit-to-stands per person, hence 60 sit-to-stands for the five subjects described here. The
differences between the times measured using these methods were then compared by
subtracting them from the ground truth, in this case the Vicon system.
5.2. Variable Chair Angle
The experiment conducted here consisted of rotating the chair at different angles while
at a fixed location. The experiments were again verified using the Vicon system. The
experimental setup consisted of positioning the chair initially facing one camera (90 degrees
with respect to the second camera), then around 45 degrees with the first one (45 degrees with
the second), and so on at steps of 45 degrees. In total, 8 runs were taken, comprising two sit-to-
stand motions, as performed in the previous experiments. The setup of the chair is shown in
Figure 5.3.

68
Figure 5.3. Experimental setup to detect robustness of sit-to-stand analysis for different viewing
angles
5.2.1. Frame Classification Results
The results using the Gustafson Kessel technique are displayed as a confusion matrix as shown
below:
Table 5.8. Confusion matrix of the GK algorithm with respect to the Vicon system for the
activities of sit, transition, and upright for various viewing angles.
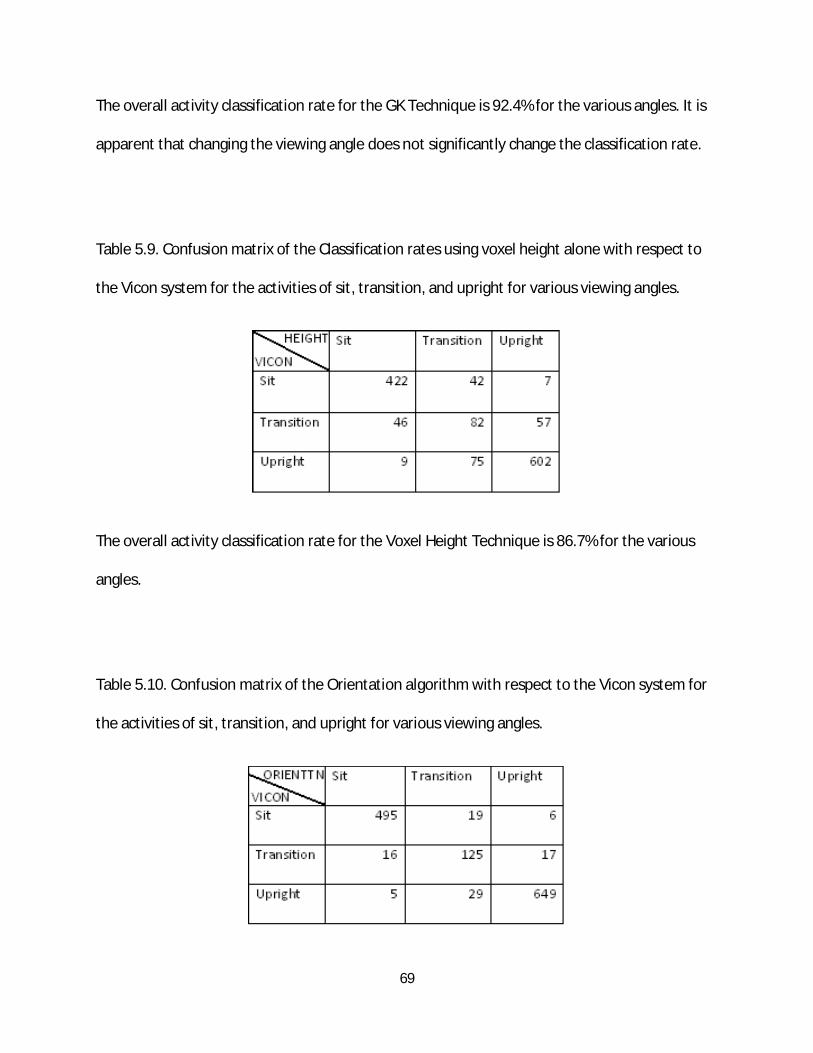
69
The overall activity classification rate for the GK Technique is 92.4% for the various angles. It is
apparent that changing the viewing angle does not significantly change the classification rate.
Table 5.9. Confusion matrix of the Classification rates using voxel height alone with respect to
the Vicon system for the activities of sit, transition, and upright for various viewing angles.
The overall activity classification rate for the Voxel Height Technique is 86.7% for the various
angles.
Table 5.10. Confusion matrix of the Orientation algorithm with respect to the Vicon system for
the activities of sit, transition, and upright for various viewing angles.

70
The overall activity classification rate for the Voxel Height with Orientation Technique is 93.5%
for the various angles.
Table 5.11. Confusion matrix of the Ellipse Fit algorithm with respect to the Vicon system for
the activities of sit, transition, and upright for various viewing angles.
The overall activity classification rate for the Voxel Height with ellipse fit Technique is 96.6% for
the various angles.
5.2.2. Sit-To-Stand Time
The results obtained from the various techniques are shown in Figure 5.5. The sit-to-
stand times for the stop watch, the vicon system, using the voxel height alone, using the
orientation technique in addition to the voxel height, using the ellipse fit technique in
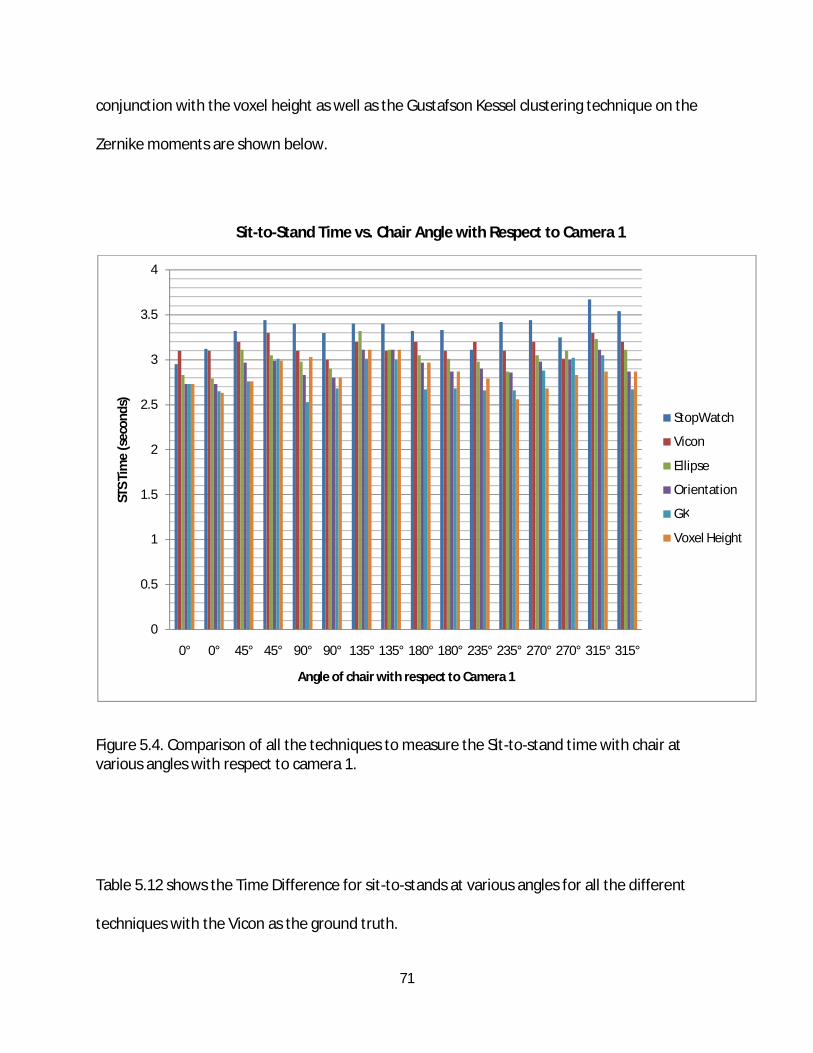
71
conjunction with the voxel height as well as the Gustafson Kessel clustering technique on the
Zernike moments are shown below.
Sit-to-Stand Time vs. Chair Angle with Respect to Camera 1
Figure 5.4. Comparison of all the techniques to measure the Sit-to-stand time with chair at various angles with respect to camera 1.
Table 5.12 shows the Time Difference for sit-to-stands at various angles for all the different
techniques with the Vicon as the ground truth.
0
0.5
1
1.5
2
2.5
3
3.5
4
0° 0° 45° 45° 90° 90° 135° 135° 180° 180° 235° 235° 270° 270° 315° 315°
STS
Tim
e (s
econ
ds)
Angle of chair with respect to Camera 1
StopWatch
Vicon
Ellipse
Orientation
GK
Voxel Height
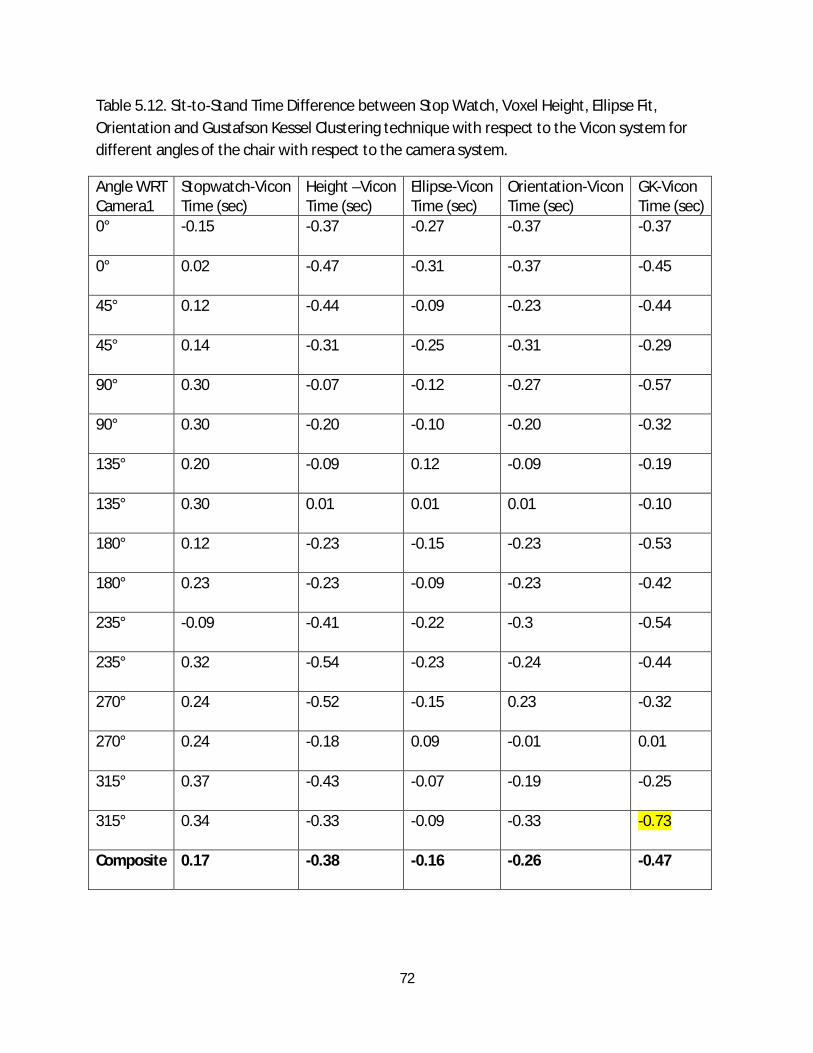
72
Table 5.12. Sit-to-Stand Time Difference between Stop Watch, Voxel Height, Ellipse Fit, Orientation and Gustafson Kessel Clustering technique with respect to the Vicon system for different angles of the chair with respect to the camera system.
Angle WRT Camera1
Stopwatch-Vicon Time (sec)
Height –Vicon Time (sec)
Ellipse-Vicon Time (sec)
Orientation-Vicon Time (sec)
GK-Vicon Time (sec)
0° -0.15 -0.37 -0.27 -0.37 -0.37
0° 0.02 -0.47 -0.31 -0.37 -0.45
45° 0.12 -0.44 -0.09 -0.23 -0.44
45° 0.14 -0.31 -0.25 -0.31 -0.29
90° 0.30 -0.07 -0.12 -0.27 -0.57
90° 0.30 -0.20 -0.10 -0.20 -0.32
135° 0.20 -0.09 0.12 -0.09 -0.19
135° 0.30 0.01 0.01 0.01 -0.10
180° 0.12 -0.23 -0.15 -0.23 -0.53
180° 0.23 -0.23 -0.09 -0.23 -0.42
235° -0.09 -0.41 -0.22 -0.3 -0.54
235° 0.32 -0.54 -0.23 -0.24 -0.44
270° 0.24 -0.52 -0.15 0.23 -0.32
270° 0.24 -0.18 0.09 -0.01 0.01
315° 0.37 -0.43 -0.07 -0.19 -0.25
315° 0.34 -0.33 -0.09 -0.33 -0.73
Composite 0.17 -0.38 -0.16 -0.26 -0.47

73
As can be seen in the highlighted section, there are some regions where the difference
is quite large; as large as 0.73 seconds which is equivalent to around 4 image frames in the
Gustafson Kessel clustering method. The reason for the error is explained in Figure 5.5.
Figure 5.5. Introduction of error in the Gustafson Kessel technique due to noise present in
Zernike moments.

74
Figure 5.5 shows the errors introduced in a sequence with the chair at an angle of 315° to
camera 1. As can be seen for the sequence, there is noise present in the sit regions in the
circled area for the membership function for the “sit” cluster using the Gustafson Kessel
clustering on the Zernike moments from the silhouette sequence from camera 1. This noise
created the error in Table 5.5 as highlighted.
5.3. Variable Chair Location
Figure 5.6. Experimental setup of chair locations at two extreme ends of the room with respect to camera 1. This technique worked for silhouettes of different sizes from far (a) to near (b).
The chair was placed at the two opposite ends of the room. These are the extreme ends of the
viewing angle and indicate the ends of the range for all the techniques. Two sit-to-stands were
performed at each location. This is shown in figure 5.6.

75
5.3.1. Frame Classification Results
The following figures show the results for the Gustafson Kessel clustering on the Zernike
image moments for the sequences with extreme locations in the given room.
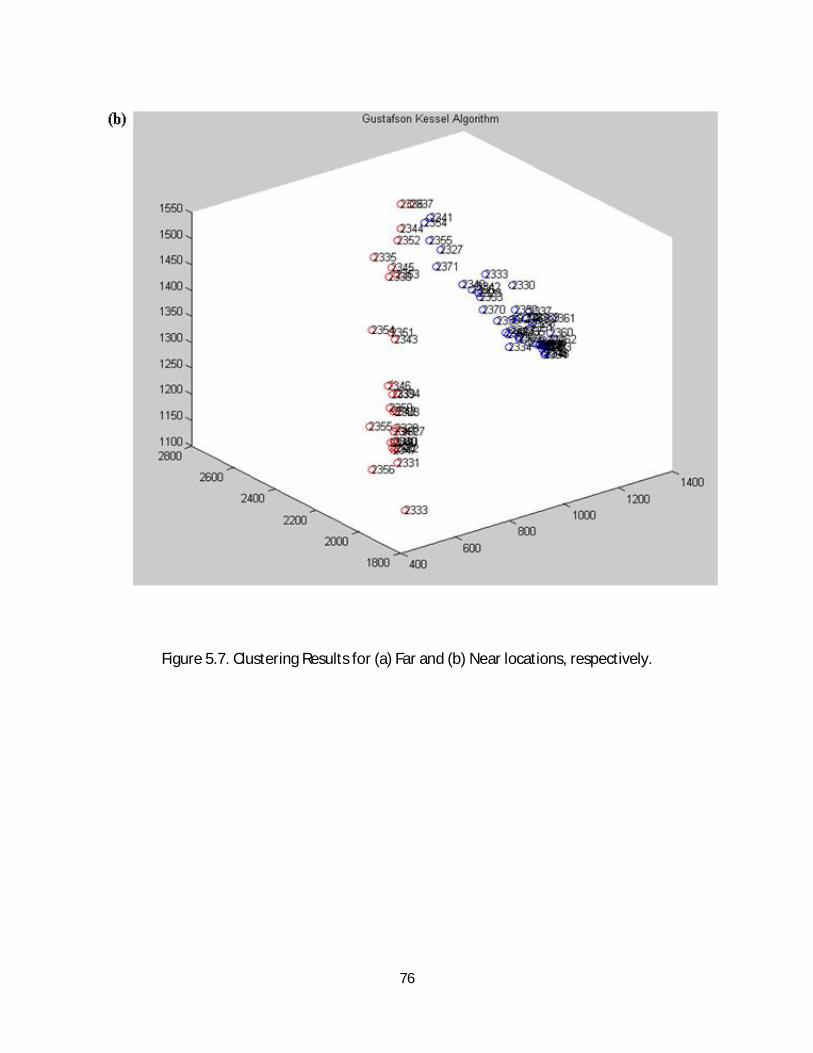
76
Figure 5.7. Clustering Results for (a) Far and (b) Near locations, respectively.
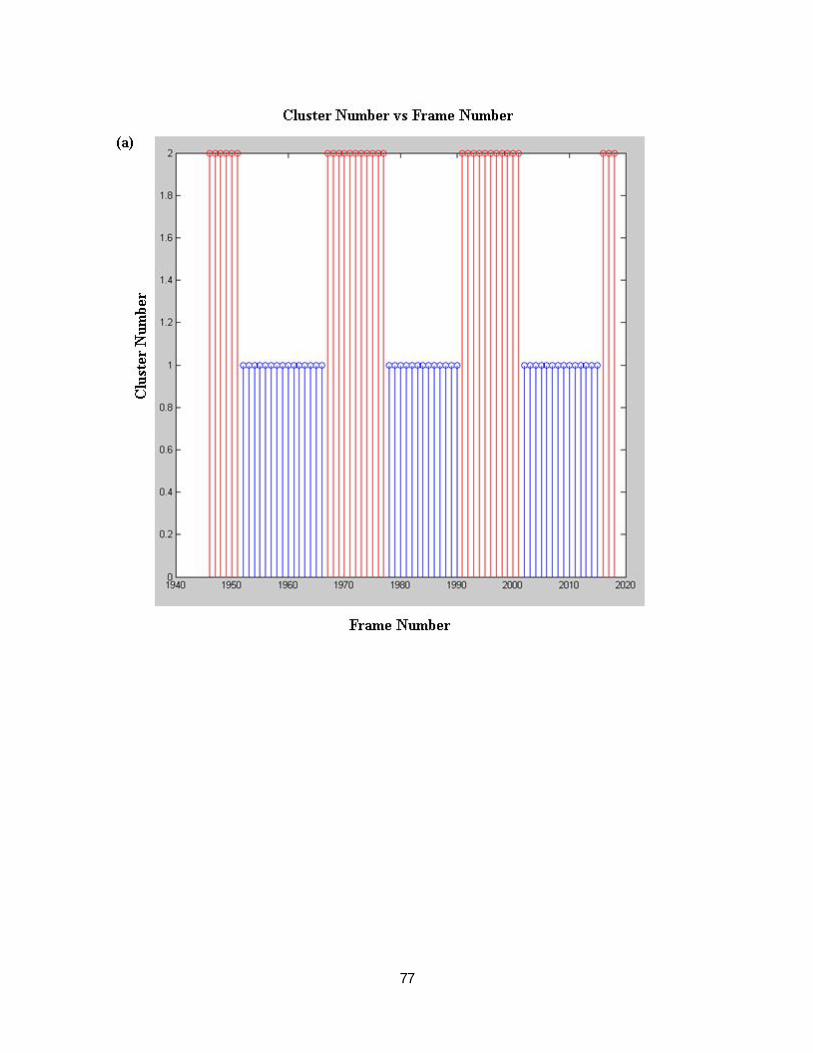
77
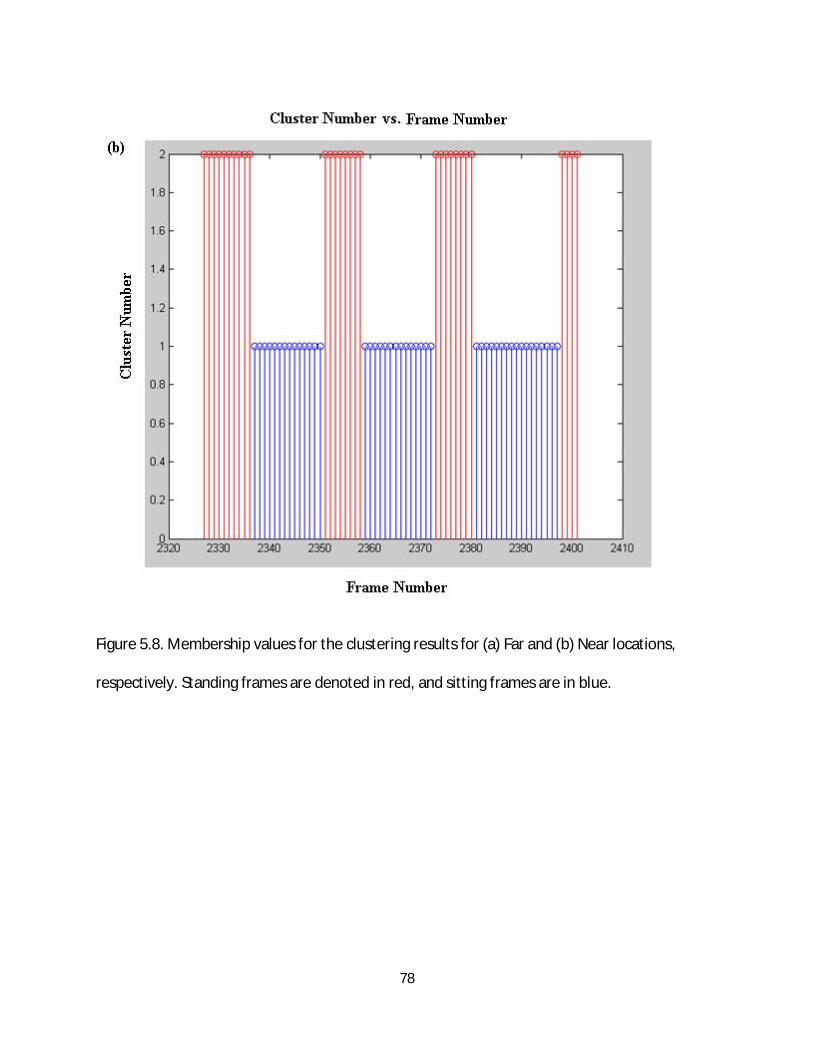
78
Figure 5.8. Membership values for the clustering results for (a) Far and (b) Near locations,
respectively. Standing frames are denoted in red, and sitting frames are in blue.
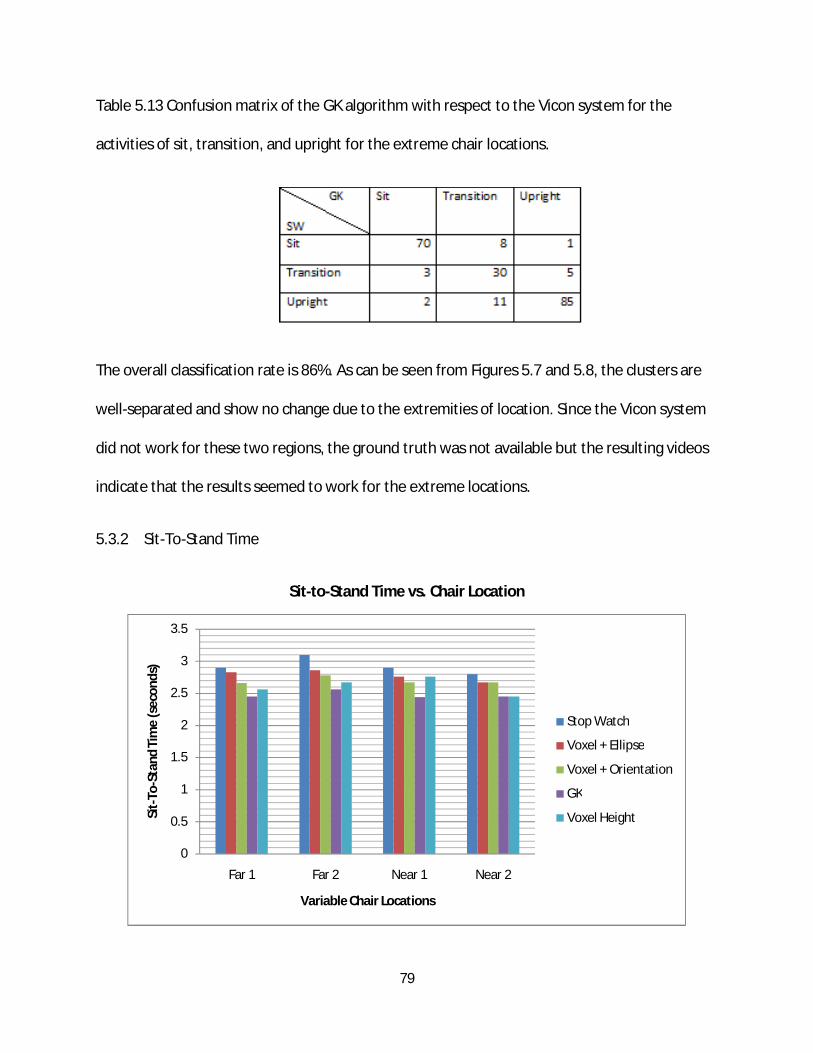
79
Table 5.13 Confusion matrix of the GK algorithm with respect to the Vicon system for the
activities of sit, transition, and upright for the extreme chair locations.
The overall classification rate is 86%. As can be seen from Figures 5.7 and 5.8, the clusters are
well-separated and show no change due to the extremities of location. Since the Vicon system
did not work for these two regions, the ground truth was not available but the resulting videos
indicate that the results seemed to work for the extreme locations.
5.3.2 Sit-To-Stand Time
Sit-to-Stand Time vs. Chair Location
0
0.5
1
1.5
2
2.5
3
3.5
Far 1 Far 2 Near 1 Near 2
Sit-
To-S
tand
Tim
e (s
econ
ds)
Variable Chair Locations
Stop Watch
Voxel + Ellipse
Voxel + Orientation
GK
Voxel Height

80
Figure 5.9. Sit-To-Stand Time results for the ellipse fit and orientation technique compared with
the stop watch.
Figure 5.9 shows the sit-to-stand times for the boundary locations of the chair at regions where
the Vicon data is not accessible. The Time Difference Chart is shown below.
Table 5.14. Sit-to-Stand Time Difference between Voxel Height, Ellipse Fit, Orientation and
Gustafson Kessel Clustering technique with respect to the Stop Watch for different locations of
the chair with respect to the camera system.
Height-SW Orientation-SW Ellipse-SW GK-SW
Far 1 -0.34 -0.24 -0.07 -0.45
Far 2 -0.43 -0.32 -0.24 -0.54
Near 1 -0.14 -0.23 -0.14 -0.46
Near 2 -0.35 -0.13 -0.13 -0.35
Composite -0.31 -0.23
-0.14 -0.45
As can be seen from the above data, the sit-to-stands can be identified with the same
ease as for the different angles and when the chair is perpendicular to the camera view. The
clustering results are equally well separated and the time difference is consistent with the
previous results.

81
5.4. Discussion
We have applied the various techniques for sit-to-stands depicting various ailments, for
sit-to-stands at right angles to the camera view as well as for sit-to-stands at various angles to
the camera views and the boundary locations in the field of view. From Figures 5.1 & 5.8, it can
be seen that the stop watch results are not consistent which is why the Vicon system was used
as ground truth wherever possible. However, with the extreme boundary locations, it was not
possible to get the Vicon results, and the stop watch was required to be used as ground truth.
This still showed the Ellipse Fit results to be the best among all the techniques which
corroborated with the results from Tables 5.1 and 5.8. Using both the result displays, i.e. the
confusion matrices from Tables 5.2-5.7, 5.9-5.11, the results using the Voxel Height in addition
with the Ellipse Fit results yielded the most satisfactory results. Hence, in order to measure the
sit-to-stand times for real life scenarios, the latter technique might be more effective. Table
5.15 indicates the change in efficiency for classification results (compared to the Vicon system)
when the angle of the chair is varied.

82
Table 5.15. Overall Classification expressed in percentage for the different techniques for the
activities of sit, upright and transition (sit-to-stand and stand-to-sit) in comparison to the Vicon
system.
Perpendicular Camera View Variable Angle Chair Location
Voxel Height 89.8 86.7
Voxel Height + Orientation 95.4 93.5
Voxel Height + Ellipse Fit 97.3 96.6
Gustafson Kessel Clustering 94.6 92.4
It is apparent that the change in angle of chair does affect the classification efficiency a little but
not significantly. The voxel height has a slightly higher error rate than the others which might
have to do with the fact that a thresholding technique is implemented on the smoothed height
of the voxel person which leads to incorrect classification of the transition frames.
83
Chapter 6—Future Work
6.1. Introduction
This chapter is an exploratory investigation to see the results of applying the techniques
implemented previously on different data sets. In this chapter, some preliminary results are
shown on implementing the Gustafson Kessel clustering technique on other activities using a
different number of clusters. Also, some results are displayed for detecting rocking motion
using the orientation technique as a person attempts to rise from the chair.
6.2. Detection of Bending Forward
In preliminary work, the bending forward motion was performed in a sequence.
When the Gustafson Kessel clustering technique using the Zernike moments was tested using
two clusters, the results were surprising since the new bending activity was identified as sit
(0.96 membership) which was a strong value. Basically, the algorithm could not identify the
activity as different from sit (2 clusters). In testing the GK clustering with three clusters, it did
work! However, due to the addition of a class, there were more errors introduced in the
classification. Using the Xie Beni Index, the values for 2 and 3 clusters was 2.49 and 2.43 which
showed that 3 clusters might be evident in the sequence. However, the difference was very
small. Figure 6.1 shows the membership results for clustering using 3 clusters.

84
Figure 6.1. Clustering membership results for 3 clusters
6.3. Detection of Rocking Movement
Figure 6.2 shows the orientation results of a person rocking while rising from a chair.

85
Figure 6.2. Detecting Rocking movements with inverse peak detection technique
Rocking motion is quite common in the elderly. In fact, it could also indicate the person
attempting to get up and being unable to do so. Using the orientation parameter described
before, it is possible to use the inverse peak detection algorithm to find out the number of
times a person makes an attempt to get up and is unable to. The above figure shows a person
who rocks twice (or is undecided in this case) and then finally gets up.

86
Chapter 7—Conclusion
Several techniques were applied as a means to segment a video sequence involving sit-
to-stand motions. Semi-supervised as well as unsupervised methods were implemented. In
particular, transition regions were identified and parameters related to that were measured
such as the rise time and rocking motion. While some of the techniques described in this work
such as the neural network method or the Bayes classifier technique did not yield satisfactory
results, they were useful as preliminary work that led to more fruitful methods by indicating the
futility of using completely supervised approaches or of making incorrect assumptions, in this
case, assuming the data to be in Gaussian form.
Using the latter four techniques, namely using the voxel height, voxel height along with
orientation, voxel height along with the ellipse fit method as well as the Gustafson Kessel
clustering approach, the rise time computation was effective in capturing the sit-to-stand time
and promises to be of importance in the future as a means to measure physical decline of the
elderly in order to assist them in leading a continued happy and fulfilled life. In addition,
applying the clustering methods to detect other activities such as bending forward or falling or
even forward reach can make activity identification much more useful and effective as a means
to detect several other activities at a time. Future work will involve trying to gain more insight
into sit-to-stands in order to find other parameters such as the angle of slouch of a person as
well as other physical traits that can help determine the functionality of an elderly person over
time.

87
References
[1] D. Anderson, R. H. Luke, M. Skubic, J. M. Keller, M. Rantz and M. Aud, "Evaluation of a Video Based Fall Recognition System for Elders Using Voxel Space," 6th International Conference of the International Society for Gerontechnology, Pisa, Tuscany, Italy, June 4-6, 2008.
[2] A. Oikonomopoulos, M. Pantic, and I. Patra,”Sparse B spline polynomial descriptors for
human activity recognition,” Image and Vision Computing, 27(12), 2009.
[3] C. Stauffer and W.E.L. Grimson, “Learning patterns of activity using real-time tracking,” IEEE Trans. Pattern Anal. Mach. Intell., vol. 22, pp. 747–757, Aug. 2000.
[4] T. Banerjee, J. Keller, M. Skubic and C. Abbott, “Sit-To-Stand Detection Using Fuzzy Clustering Techniques”, Proc, IEEE World Congress on Computational Intelligence, Barcelona, Spain, July, 2010.
[5] Ramprasad Polana and Randal C. Nelson ``Low Level Recognition of Human Motion (or
How to Get Your Man without Finding his Body Parts)'' IEEE Computer Society Workshop on Motion of Nonrigid and Articulate Objects, Austin, TX, October 1994.
[6] M. Quwaider and S. Biswas, “Body posture identification using hidden Markov model with a wearable sensor network,” in Proceedings of the ICST 3rd international conference on Body area networks table of contents. ICST (Institute for Computer Sciences, Social-Informatics and Telecommunications Engineering) ICST, Brussels, Belgium, 2008.
[7] A. Madabhushi and J. Aggarwal, “A Bayesian approach to human activity recognition.” Proceedings Second IEEE Workshop on Visual Surveillance, 25–32, 1999.
[8] Gelman, Andrew, Carlin, John B., Stern, Hal S. and Rubin, Donald B. Bayesian Data Analysis, Second Edition, 2003.
[9] S. Allin, and A. Mihailidis, “Automated sit-to-stand detection and analysis.” AAAI 2008 Fall Symposium on AI in Eldercare: New Solutions to Old Problems, Arlington, VA, 2008.
[10] M. Goffredo, M. Schmid, S. Conforto, M. Carli, A. Neri, T. D'Alessio, “Markerless Human Motion Analysis in Gauss-Laguerre Transform Domain: An Application to Sit-To-Stand in Young and Elderly People.” Information Technology in Biomedicine, IEEE Transactions on, 13:2: 207-216, 2009.

88
[11] Dounia Berrada , Mario Romero , Gregory Abowd , Marion Blount , John Davis, “Automatic administration of the Get Up and Go Test,” Proceedings of the 1st ACM SIGMOBILE international workshop on Systems and networking support for healthcare and assisted living environments, June 11-11, 2007, San Juan, Puerto Rico.
[12] T. M. Steffen, T. A. Hacker, & L. Mollinger, “Age- and gender-related test performance in
community-dwelling elderly people: Six-Minute Walk Test, Berg Balance Scale, Timed Up & Go Test, and gait speeds.” Physical Therapy, 82, 128-137, 2002.
[13] K. Berg, S. Wood-Dauphinee, J. I. Williams, B. Maki, 1992, “Measuring balance in the elderly: Validation of an instrument.” Can. J. Pub. Health 2:S7-11.
[14] I. Witten and E. Frank, 2005. Data Mining: Practical machine learning tools and techniques,
2nd Ed, Morgan Kaufmann, SF. [15] D. Anderson, R. H. Luke, J. M. Keller, M. Skubic, M. Rantz and M. Aud, "Modeling Human
Activity from Voxel Person Using Fuzzy Logic," IEEE Transactions on Fuzzy Systems, vol. 17, no. 1, 2009, pp. 39-49.
[16] A. W. Fitzgibbon and R. B Fischer, “A buyer’s guide to conic fitting.” In Proc. of the British
Machine Vision Conference, pages 265–271, Birmingham, 1995. [17] R. Halır and J. Flusser, “Numerically stable direct least squares fitting of ellipses,” in Proc.
6th Int. Conf. Computer Graphics and Visualization, vol. 1, 1998, pp. 125–132. [18] J. Aggarwal and Q. Cai, “Human Motion Analysis: A Review,” Computer Vision and Image
Understanding, vol. 73, pp. 428-440, 1999. [19] R. Polana and R. Nelsom, “Low level Recognition of Human Motion (or how to get your
man without finding his body parts)”. Proc. Of IEEE Computer Society Workshop on Motion of Non-Rigid and Articulated Objects, Pages 77-82, Austin, TX, 1991.
[20] M. Rossi and A. Bozzoli, “Tracking and Counting People.” 1st International Conference in
Image Processing, pages 212-216, Austin, TX, November 1994. [21] K. Sato, T. Maeda, H. Kato and S. Inokuchi, “CAD-based object tracking with distributed
monocular camera for security monitoring.” Proc. 2nd CAD-based Vision Workshop, pages 291-297, Champion, PA, February, 1994.

89
[22] P. H. Kelly, A. Katkere, D. Y. Kuramura, S. Moezzi, S. Chatterjee, and R. Jain, “An architecture for Multiple Perspective Interactive Video.” Proc. Of ACM Conference on Multimedia, pages 201-212, 1995.
[23] S. M. Seitz, C. R. Dyer, “Photorealistic Scene Reconstruction by Voxel Coloring”, Proc.
Computer Vision and Pattern Recognition Conference, pp. 1067-1073, 1997. [24] http://drawinglab.evansville.edu/body.html
[25] M.K. Hu, “Visual pattern recognition by moment invariants.” IRE Trans. on Information
Theory, IT-8:pp. 179-187, 1962. [26] S. Theodoridis and K. Koutroumbas, “Pattern Recognition”, Academic Press, San Diego, CA
(1999). [27] I. Gath and G. Geva, “Unsupervised optimal fuzzy clustering,” IEEE Trans. Pattern Anal.
Mach. Intell., vol. 11, pp. 773–781, July 1989. [28] J. Music, R. Kamnik, V. Zanchi and M. Munih, “Human Body Model Based Inertial
Measurement of Sit-to-Stand Motion Kinematics.” WSEAS Transactions on Systems, Volume 7, Issue 11, 2008.
[29] M. E. Tinetti, “Performance-oriented assessment of mobility problems in elderly patients.”
J Am Geriatric Society 1986: 34:119-126. [30] Demiris G, Parker Oliver D, Giger J, Skubic M, Rantz M, "Older adults' privacy
considerations for vision based recognition methods of eldercare applications," Technology and Health Care 2009;17(1):41-48.
[31] D. Buzan, S. Sclaroff, and G. Kollios, “Extraction and clustering of motion trajectories in
video,” in Proc. Int. Conf. Pattern Recog., Cambridge, U.K., Aug. 2004, pp. 521–524.
[32] A.M. Bensaid, L.O. Hall, J.C. Bezdek, and L.P. Clarke, “Partially supervised clustering for image segmentation.” Pattern Recognition, 29(5):859–871, 199.
[33] E.J. Pauwels and G. Frederix, “Nonparametric Clustering for Image Segmentation and
Grouping” Image Understanding, vol. 75, no. 1, pp. 73-85, 2000.
90
[34] Harvey N, Zhou Z, Keller JM, Rantz M & He Z, "Automated Estimation of Elder Activity Levels from Anonymized Video Data," Proceedings, 31st Annual International Conference of the IEEE Engineering in Medicine and Biology Society, Minneapolis, Minnesota, September 2-6, 2009, pp 7236-7239.
[35] A. M. Tabar, A. Keshavarz, and H. Aghajan, “Smart home care network using sensor fusion and distributed vision-based reasoning.” In Proc. of VSSN 2006, October 2006.
[36] A. Keshavarz,H. Maleki-Tabar, H. Aghajan, “Distributed vision-based reasoning for smart
home care,” ACM SenSys Workshop on Distributed Smart Cameras (DSC’06). [37] B. P. Lo, J. L. Wang, and G.-Z. Yang. From imaging networks to behavior profiling:
Ubiquitous sensing for managed homecare of the elderly. In Adjunct Proceedings Of the 3rd International Conference on Pervasive Computing, May 2005.
[38] F. Wang, E. Stone, W. Dai, T. Banerjee, J. Giger, J. Crampe, M. Rantz, and M. Skubic,
“Testing an In-Home Gait Assessment Tool for Older Adults” Proceedings, 31st Annual International Conference of the IEEE Engineering in Medicine and Biology Society, Minneapolis, Minnesota, September 2-6, 2009, pp 7236-7239.
[39] D. Anderson, J. Keller, M. Skubic, X. Chen, Z. He, “Recognizing Silhouettes from Falls.” Proceedings, 28th Annual International Conference of the IEEE Engineering in Medicine and Biology Society, New York City, August 31-3, 2006
[40] Susan L Whitney, “Clinical Measurement of Sit to Stand Performance in People with
Balance Disorders: Validity of data for the Five Times Sit to Stand Test.” Physical Therapy, 2005.
[41] Stephen R Lord, “Sit to Stand Performance Depends on Sensation, Speed, Balance and
Psychological Status in Additon to Strength in Older People.” J of Gerontology, 2002. [42] Luke RH, Anderson D, Keller JM & Skubic M, "Human segmentation from video in indoor
environments using fused color and texture features," Technical Report, ECE Dept, University of Missouri, Columbia, MO, 2008.
[43] G. Johansson, “Visual Perception of Biological Motion & a Model for Its Analysis”, Perception &
Psychophysics, Volume 14, 201-211, 1973. [44] I. A. Kakadiaris and D. Metaxas. Model-based estimation of 3d human motion with occlusion based
on active multi-viewpoint selection. In CVPR, 1996. [45] MC Nevitt, SR Cummings, S Kidd, D. Black, “Risk factors for recurrent non-syncopal falls: a
prospective study.” JAMA. 1989;261: 2663–2668.

91
[46] AJ Campbell, MJ Borrie, GF Spears, “Risk factors for falls in a community-based prospective study of people 70 years and older.” J Gerontol. 1989; 44:M112–M117.
[47] ML Schenkman, MA Hughes, G Samsa, SA Studenski, “The relative importance of strength and
balance in chair rise by functionally impaired older individuals.” J Am Geriatr Soc. 1996;44:1441–1446.
[48] PV Jonsson, MM Kelley, JS Koestner, “Causes and correlates of recurrent falls in ambulatory frail
elderly.” J Gerontol A Biol Sci Med Sci. 1991; 46:M114 –M122. [49] PB Thapa, P Gideon, RL Fought, “Comparison of clinical and biomechanical measures of balance
and mobility in elderly nursing home residents.” J Am Geriatr Soc. 1994;42:493–500.
[50] RM Guimaraes, B. Issacs, “Characteristics of the gait in old people who fall.” Int Rehabil Med. 1980; 2:177–180.