Activity in motor-sensory projections reveals distributed coding in ... Lab... · Activity in...
8
LETTER doi:10.1038/nature11321 Activity in motor–sensory projections reveals distributed coding in somatosensation Leopoldo Petreanu 1 {, Diego A. Gutnisky 1 , Daniel Huber 1 {, Ning-long Xu 1 , Dan H. O’Connor 1 , Lin Tian 1 {, Loren Looger 1 & Karel Svoboda 1 Cortical-feedback projections to primary sensory areas terminate most heavily in layer 1 (L1) of the neocortex 1,2 , where they make synapses with tuft dendrites of pyramidal neurons. L1 input is thought to provide ‘contextual’ information 3 , but the signals trans- mitted by L1 feedback remain uncharacterized. In the rodent somatosensory system, the spatially diffuse 4 feedback projection from vibrissal motor cortex (vM1) to vibrissal somatosensory cortex (vS1, also known as the barrel cortex) may allow whisker touch to be interpreted in the context of whisker position to compute object location 5,6 . When mice palpate objects with their whiskers to localize object features 7,8 , whisker touch excites vS1 9 and later vM1 in a somatotopic manner 10–13 . Here we use axonal calcium imaging to track activity in vM1RvS1 afferents in L1 of the barrel cortex while mice performed whisker-dependent object localization. Spatially intermingled individual axons represent whisker movements, touch and other behavioural features. In a subpopulation of axons, activity depends on object location and persists for seconds after touch. Neurons in the barrel cortex thus have information to integrate movements and touches of multiple whiskers over time, key components of object identification and navigation by active touch. We trained head-fixed mice to perform a whisker-based object- localization task under a two-photon microscope with one whisker row (C row) (Fig. 1a) 12 . In each trial, a pole was moved into one of several locations within reach of the whiskers (sampling period, approximately 1 s; Supplementary Fig. 1a), arranged along the anterior–posterior axis on one side of the head (Fig. 1b). Mice moved their whiskers to determine whether the pole was either in one of several ‘go’ locations or in a ‘no-go’ location. Automated whisker tracking 14 measured whisker movements and shape. The force acting on the follicles, which underlies object localization 8,15,16 , can be estimated from whisker shape changes induced by touch. A change in curvature at point p of the whisker is proportional to the force applied by the pole on the whisker 16 : F / Dk p y p , where y p is the bending stiffness at p. We thus present forces acting on the whiskers as the change in curvature, Dk (Supplementary Fig. 1b). Mice report their decision about object location with licking. Imaging was performed in trained mice (descriminability (d9) average, 1 Janelia Farm Research Campus, Howard Hughes Medical Institute, Ashburn, Virginia 20147, USA. {Present addresses: Department for Basic Neurosciences, University of Geneva, Geneva CH-1211, Switzerland (D.H.); Champalimaud Neuroscience Programme, Lisbon 1400-038, Portugal (L.P.); Department of Biochemistry and Molecular Medicine. School of Medicine, University of California, Davis California 95616, USA (L.T.). Water reward 20 μm rAAV-GCaMP3 vM1 vS1 Mean activity (events per frame) Correlation coefficient (R) 0 0.02 0.04 0.06 0 1 5 s 2ΔF/F 0 5 μm ROI number 0 R 1 ROI number 0 1 0 1 2 3 4 5 6 Correlation coefficient (R) Probability density a b c d e h i f g Two-photon microscope High-speed videography All other pairs Same axon pairs All other pairs Same axon pairs C1 C2 C3 500 μm 0.3 0.6 % j Pole position θ t No go Go Figure 1 | Imaging activity in vM1RvS1 axons during whisker-based object localization. a, Head-fixed mouse performing an object-localization task under the microscope. b, One frame of a high-speed video sequence and typical pole positions corresponding to multiple go locations (hues of blue) and a single no-go location (red). Whisker touch was possible for all object locations for the long posterior whiskers. The azimuthal angle h describes whisker position (h t denotes azimuthal angle at first touch). c, vM1 neurons were infected with GCaMP3-expressing virus and their axons were imaged in L1 of vS1. d, Intrinsic optical-imaging signals corresponding to deflections of whiskers C1, C2 and C3, overlaid on a brightfield image of the vasculature. e, Two-photon images showing vM1 axons in the C1 barrel column. f, Field of view used for in vivo imaging showing varicosities (arrowheads correspond to varicosities used for fluorescence time series in g). g, Fluorescence dynamics over multiple behavioural trials. Coloured bars indicate the sampling period, when the pole is within reach (blue, go trials; red, no-go trials). h, Matrix of correlation coefficients for activity in different varicosities in one field of view. Arrowheads correspond to varicosities marked in f. i, Distribution of correlation coefficients for all fields of view. Black line denotes pairs of varicosities on the same axon (78 varicosities, 31 axons) and grey line denotes all other varicosity pairs (51,325 varicosities). Correlation coefficients were computed over the entire session. j, Correlation coefficients as a function of mean activity level (black denotes pairs of varicosities on the same axon and grey denotes all other pairs). The solid line is an exponential fit (y 5 a(1 2 e 2bx ) 1 c ) to the black circles and the dashed lines represent the 95% confidence interval. 13 SEPTEMBER 2012 | VOL 489 | NATURE | 299 Macmillan Publishers Limited. All rights reserved ©2012
Transcript of Activity in motor-sensory projections reveals distributed coding in ... Lab... · Activity in...
LETTERdoi:10.1038/nature11321
Activity in motor–sensory projections revealsdistributed coding in somatosensationLeopoldo Petreanu1{, Diego A. Gutnisky1, Daniel Huber1{, Ning-long Xu1, Dan H. O’Connor1, Lin Tian1{, Loren Looger1
& Karel Svoboda1
Cortical-feedback projections to primary sensory areas terminatemost heavily in layer 1 (L1) of the neocortex 1,2, where they makesynapses with tuft dendrites of pyramidal neurons. L1 input isthought to provide ‘contextual’ information3, but the signals trans-mitted by L1 feedback remain uncharacterized. In the rodentsomatosensory system, the spatially diffuse4 feedback projectionfrom vibrissal motor cortex (vM1) to vibrissal somatosensorycortex (vS1, also known as the barrel cortex) may allow whiskertouch to be interpreted in the context of whisker position tocompute object location5,6. When mice palpate objects with theirwhiskers to localize object features7,8, whisker touch excites vS19
and later vM1 in a somatotopic manner10–13. Here we use axonalcalcium imaging to track activity in vM1RvS1 afferents in L1 ofthe barrel cortex while mice performed whisker-dependent objectlocalization. Spatially intermingled individual axons representwhisker movements, touch and other behavioural features. In asubpopulation of axons, activity depends on object location andpersists for seconds after touch. Neurons in the barrel cortex thushave information to integrate movements and touches of multiple
whiskers over time, key components of object identification andnavigation by active touch.
We trained head-fixed mice to perform a whisker-based object-localization task under a two-photon microscope with one whiskerrow (C row) (Fig. 1a)12. In each trial, a pole was moved into one ofseveral locations within reach of the whiskers (sampling period,approximately 1 s; Supplementary Fig. 1a), arranged along theanterior–posterior axis on one side of the head (Fig. 1b). Mice movedtheir whiskers to determine whether the pole was either in one ofseveral ‘go’ locations or in a ‘no-go’ location. Automated whiskertracking14 measured whisker movements and shape. The force actingon the follicles, which underlies object localization8,15,16, can beestimated from whisker shape changes induced by touch. A changein curvature at point p of the whisker is proportional to the forceapplied by the pole on the whisker16: F / Dkp yp, where yp isthe bending stiffness at p. We thus present forces acting on thewhiskers as the change in curvature, Dk (Supplementary Fig. 1b).Mice report their decision about object location with licking.Imaging was performed in trained mice (descriminability (d9) average,
1Janelia Farm Research Campus, Howard Hughes Medical Institute, Ashburn, Virginia 20147, USA. {Present addresses: Department for Basic Neurosciences, University of Geneva, Geneva CH-1211,Switzerland (D.H.); Champalimaud Neuroscience Programme, Lisbon 1400-038, Portugal (L.P.); Department of Biochemistry and Molecular Medicine. School of Medicine, University of California, DavisCalifornia 95616, USA (L.T.).
Water
reward
20 μm
rAAV-GCaMP3
vM1 vS1
Mean activity (events per frame)
Co
rrela
tio
n c
oeffi
cie
nt
(R)
0 0.02 0.04 0.06
0
1
5 s
2ΔF
/F0
5 μm
ROI number0
R1RO
I num
ber
0 10
1
2
3
4
5
6
Correlation coefficient (R)
Pro
bab
ility
density
a b c
d e
h i
f g
Two-photon
microscopeHigh-speed
videography
All other
pairsSame axon
pairs
All other
pairs
Same axon
pairs
C1C2
C3
500 μm 0.3 0.6%
j
Pole position
θt
No go Go
Figure 1 | Imaging activity in vM1RvS1 axons during whisker-based objectlocalization. a, Head-fixed mouse performing an object-localization taskunder the microscope. b, One frame of a high-speed video sequence and typicalpole positions corresponding to multiple go locations (hues of blue) and a singleno-go location (red). Whisker touch was possible for all object locations for thelong posterior whiskers. The azimuthal angle h describes whisker position (ht
denotes azimuthal angle at first touch). c, vM1 neurons were infected withGCaMP3-expressing virus and their axons were imaged in L1 of vS1. d, Intrinsicoptical-imaging signals corresponding to deflections of whiskers C1, C2 and C3,overlaid on a brightfield image of the vasculature. e, Two-photon imagesshowing vM1 axons in the C1 barrel column. f, Field of view used for in vivoimaging showing varicosities (arrowheads correspond to varicosities used for
fluorescence time series in g). g, Fluorescence dynamics over multiplebehavioural trials. Coloured bars indicate the sampling period, when the pole iswithin reach (blue, go trials; red, no-go trials). h, Matrix of correlationcoefficients for activity in different varicosities in one field of view. Arrowheadscorrespond to varicosities marked in f. i, Distribution of correlation coefficientsfor all fields of view. Black line denotes pairs of varicosities on the same axon (78varicosities, 31 axons) and grey line denotes all other varicosity pairs (51,325varicosities). Correlation coefficients were computed over the entire session.j, Correlation coefficients as a function of mean activity level (black denotespairs of varicosities on the same axon and grey denotes all other pairs). The solidline is an exponential fit (y 5 a(1 2 e2bx) 1 c ) to the black circles and thedashed lines represent the 95% confidence interval.
1 3 S E P T E M B E R 2 0 1 2 | V O L 4 8 9 | N A T U R E | 2 9 9
Macmillan Publishers Limited. All rights reserved©2012
1.8, corresponding to 80% correct trials; range, 1.2–2.6) (Supplemen-tary Fig. 1c–e).
To image activity in vM1RvS1 axons we expressed the geneticallyencoded calcium indicator GCaMP3 (ref. 17) in vM1 neurons5,12 andimplanted a chronic imaging window over vS1 (ref. 18) (Fig. 1c).Imaging was in barrel columns with principal whiskers C1, C2 orC3, based on intrinsic signal imaging19 (Fig. 1d). Fluorescent axonswere abundant in L1 (Fig. 1e, f and Supplementary Fig. 2a, b).GCaMP3-positive axonal varicosities appeared as bright spots alongthe axon backbone20. Two-photon time-lapse images (field of view,40mm 3 40mm) were acquired using raster scanning (16 Hz) over100–200 trials per imaging location (trial duration, 7 s) (Fig. 1f, gand Supplementary Fig. 1c, d).
Action potentials reliably invade cortical axonal arborizations andcause calcium accumulations in varicosities21, which harbour synapticterminals. We measured GCaMP3-mediated fluorescence transients,corresponding to trains of action potentials ($5; SupplementaryFig. 2c–f), in regions of interest (ROIs) containing individualvaricosities (range, 35–80 varicosities per field of view; 17 fields ofview; 6 mice). Fluorescence transients were detected in multipleROIs within each field of view (range, 6–20 active varicosities per fieldof view) (Figs 1f and 2a). As expected, the fluorescence signals fromvaricosities belonging to the same axon were highly correlated,whereas correlations computed across all other pairs were low(Fig. 1g). These correlations allowed us to identify varicosities on thesame axon, even in cases where the local arborization could not bereconstructed morphologically (Fig. 1h–j). Below we report the activityof one varicosity per axon to represent the activity of the entire axon.
Only active axons were analysed (Methods). This ensured that almostall (.99%) fluorescence signals reported neural activity rather thanmovement (Supplementary Fig. 3).
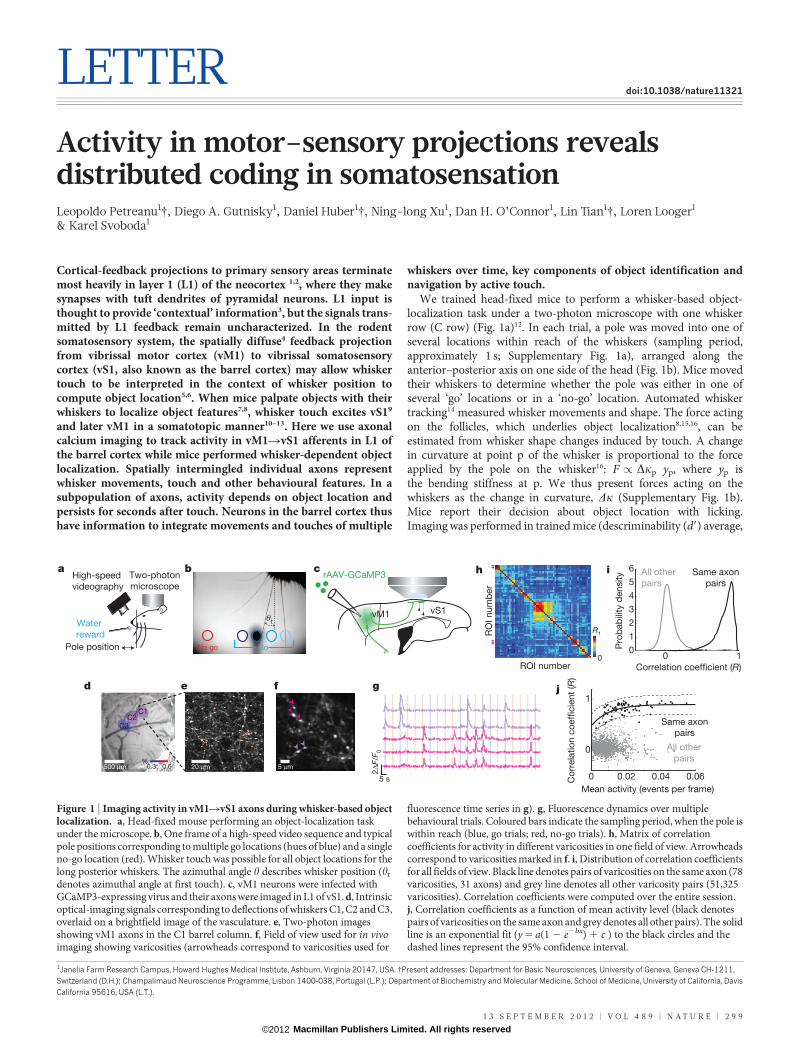
We aligned fluorescence time series with recordings of behaviouralfeatures, including Dk, whisker movements (whisking) and lick rate,and grouped trials by trial type (Fig. 2). Axonal activity was concen-trated around the sampling period, and correlated with specific beha-vioural variables. Some axons were active coincident with whiskingbefore and during the sampling period (Fig. 2b–d; compare ROI1 andwhisking amplitude), whereas other axons were mainly active in trialswith strong whisker touch (compare ROI2 and Dk). Some axons wereprimarily active during licking or could not obviously be explained by asingle behavioural feature12. Correlations between activity and beha-viour were apparent across trials and within trials. These data indicatethat individual vM1RvS1 axons represent specific behaviouralfeatures, but the representations are diverse across the population ofaxons.
We used a generalized form of regression (Random Forests,Methods) to quantify how behavioural features are represented byvM1RvS1 axons12. Both behaviour and activity varied within trials,across individual trials and across trial types (Fig. 2b, c). For example,in some trials whisker touch was strong, whereas in other trials it wasweak or absent (touch in no-go trials was typically the weakest;Supplementary Fig. 1b, e). In some trials mice whisked gingerly andlate during the sampling period (Fig. 2b, trial 144), whereas in othertrials they whipped their whiskers against the pole as soon as it camewithin reach (Fig. 2b, trial 145). Our algorithms exploit this variabilityand the large number of trials in our data set (Supplementary Fig. 1d)
1ΔF
/F0
0 20 2 0 1025°–0.08ΔF/F0ΔF/F0
Go
(p
ole
po
sitio
n)
No
go
Lick rate ΔF/F0, ROI1 ΔF/F0, ROI2 Δκ (whisker C3)
4 H
z
15°
2 s
–0.0
2 m
m–1
0 0 mm–1 Hz
1ΔF
/F0
1ΔF
/F0
2 s
Whisking
amplitude
5 μm
1 2
Licking
ROI1
ROI2
a b
c
d
20°Whisker position, θ
Whisking set-point
Whisking amplitude 20°
Trial 144 Trial 145 Trial 146
1 s
Δκ (whisker C3)
0.1
mm
–1
Figure 2 | Motor and sensory signals in vM1RvS1 axons. a, Image of thefield of view and ROIs (red) corresponding to all visible axonal varicosities.Yellow numbers indicate ROI1 and ROI2. b, Activity (DF/F0) of two individualaxons (ROI1 and ROI2) across three trials of one behavioural session, alignedwith different behavioural features (whisker position, whisking set-point,whisking amplitude, Dk, licking (ticks)). Protraction forces correspond tonegative Dk. Coloured bars indicate the sampling period (blue, go trials; red,no-go trials). c, Activity across an entire session for two axons (DF/F0 ROI1;DF/F0
ROI2). Each row corresponds to a trial. Dashed white lines indicate the samplingperiod when the pole is within reach. Trial type is indicated on the far left (hues ofblue correspond to different object locations in go trials, as indicated in Fig. 1b).Only correct trials are shown. Right, behavioural variables (see Methods). Dkdue to protractions; retractions are not shown. Whisking amplitude is theamplitude of the band-pass filtered (6–30 Hz) whisker angle. Lick rate is theinstantaneous rate of tongue protractions. d, Activity (left) and behaviouralvariables (right) averaged across trial types. Shading represents s.e.m.
RESEARCH LETTER
3 0 0 | N A T U R E | V O L 4 8 9 | 1 3 S E P T E M B E R 2 0 1 2
Macmillan Publishers Limited. All rights reserved©2012
to quantify how well specific behavioural features could be decodedfrom axonal activity.
We first decoded the measured behavioural features (Dk; whiskingand licking; Methods) on the basis of activity in all axons in a field ofview (Fig. 3a). The algorithms used the activity of populations of axonsto fit individual behavioural features, taking into account variabilitywithin and across trials. The explained variance (Ri
2, for the ith beha-vioural feature) was used to measure the quality of decoding(Supplementary Fig. 4).
Population activity decoded the recorded behavioural features,including Dk, whisking and lick rate (Fig. 3a). Whisking was decom-posed into set-point (,1.6 Hz) and amplitude (6–30 Hz; Methods)6,12
(Fig. 2b), but these parameters were highly correlated (Supplementary
Fig. 5a) and decoding was similar for these parameters. All imagedfields of view decoded all behavioural features (R2 larger than fortrial-shuffled data; P , 0.001, bootstrap test for all sessions and fea-tures (Supplementary Fig. 4a)). This is despite the fact that each experi-ment sampled only approximately 1 3 1025 % of the synapses in vS1(assuming: thickness of L1 in vS1, 0.09 mm (ref. 22); vS1 area, 2 mm2;synaptic density, 1 3 109 per mm (refs 3 and 23)). We conclude thatvM1RvS1 axons relay signals related to touch, whisking, licking andother task-related variables to vS1 in a distributed and highly redund-ant manner.
We used similar methods to classify individual axons on the basis oftheir activity patterns12 (Methods; Fig. 3b–e). One half of the activeaxons (78 out of 138 active axons; 56%) decoded one or more of the
Categories
Touch
Mixed
Whisking
Licking
Unclassified
R2
–2 0 2 4ΔF/F0, z-scored
0.4
5
0.2
80
.58
Hits
Correct
rejections
False
alarms
2 s
4 z
-sco
red
ΔF/F 0
2 s
HitsCorrect
rejections
False
alarms
a
b c
(1)
(2)
(3)
(4)
(5)
(6)
(7)
n=9
N=5
n=9
N=4
n=7
N=4
n=8
N=4
n=18
N=6
n=14
N=6
n=33
N=6
d
Touch
Mixed
Whisking
Licking
5 μm Unclassified
Δκ (m
m–1)
Time (s)
0
5
10
Lic
k r
ate
(H
z)
0 10 20 30 40 50 60
Wh
iskin
g
am
pl. (°)
0
20
40
Data Model
–0.05
0
e
Lic
kin
g
Wh
iskin
gT
ou
ch
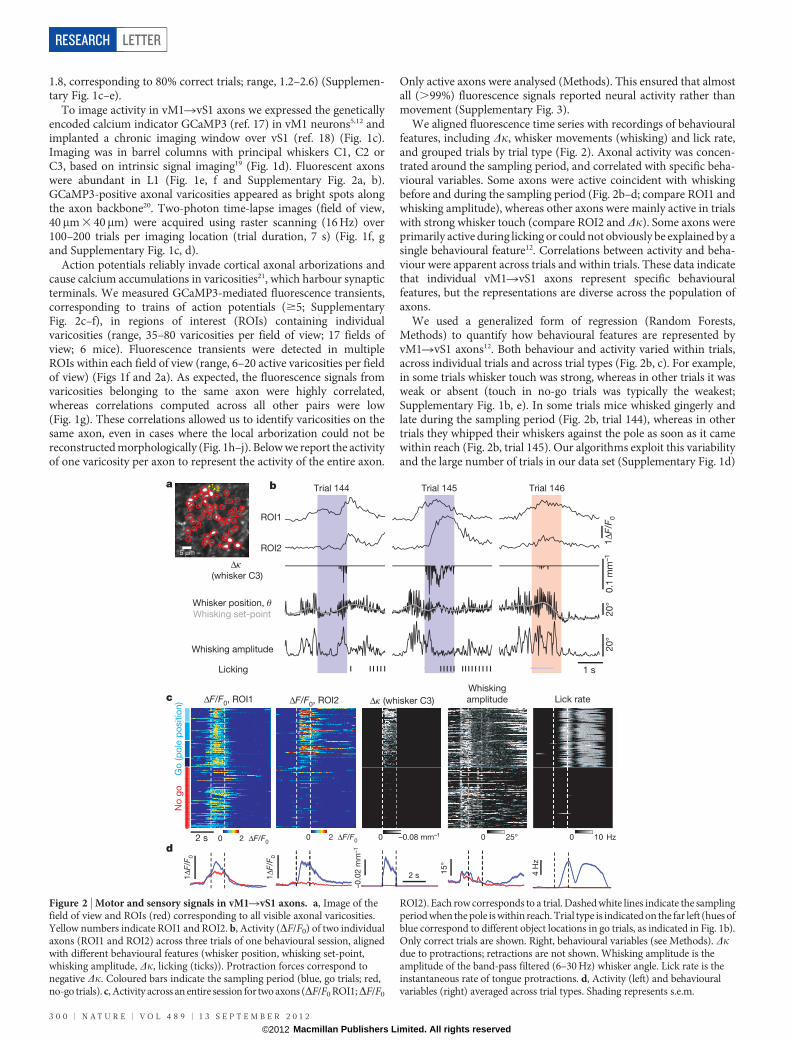
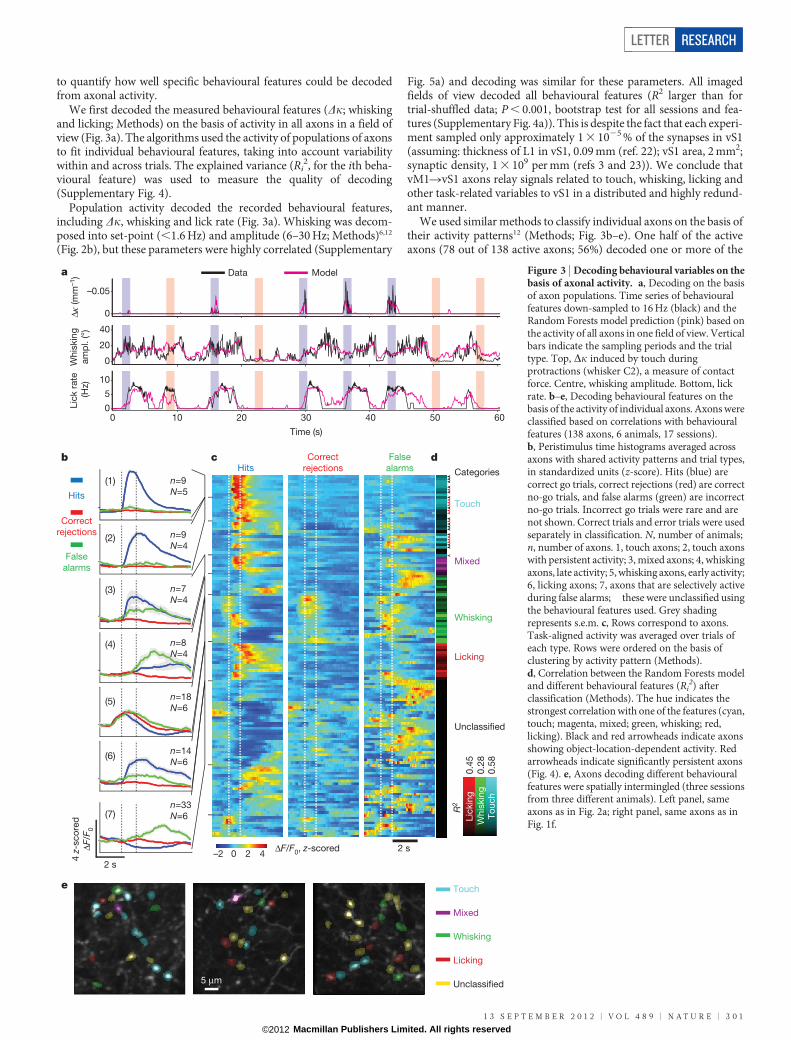
Figure 3 | Decoding behavioural variables on thebasis of axonal activity. a, Decoding on the basisof axon populations. Time series of behaviouralfeatures down-sampled to 16 Hz (black) and theRandom Forests model prediction (pink) based onthe activity of all axons in one field of view. Verticalbars indicate the sampling periods and the trialtype. Top, Dk induced by touch duringprotractions (whisker C2), a measure of contactforce. Centre, whisking amplitude. Bottom, lickrate. b–e, Decoding behavioural features on thebasis of the activity of individual axons. Axons wereclassified based on correlations with behaviouralfeatures (138 axons, 6 animals, 17 sessions).b, Peristimulus time histograms averaged acrossaxons with shared activity patterns and trial types,in standardized units (z-score). Hits (blue) arecorrect go trials, correct rejections (red) are correctno-go trials, and false alarms (green) are incorrectno-go trials. Incorrect go trials were rare and arenot shown. Correct trials and error trials were usedseparately in classification. N, number of animals;n, number of axons. 1, touch axons; 2, touch axonswith persistent activity; 3, mixed axons; 4, whiskingaxons, late activity; 5, whisking axons, early activity;6, licking axons; 7, axons that are selectively activeduring false alarms; these were unclassified usingthe behavioural features used. Grey shadingrepresents s.e.m. c, Rows correspond to axons.Task-aligned activity was averaged over trials ofeach type. Rows were ordered on the basis ofclustering by activity pattern (Methods).d, Correlation between the Random Forests modeland different behavioural features (Ri
2) afterclassification (Methods). The hue indicates thestrongest correlation with one of the features (cyan,touch; magenta, mixed; green, whisking; red,licking). Black and red arrowheads indicate axonsshowing object-location-dependent activity. Redarrowheads indicate significantly persistent axons(Fig. 4). e, Axons decoding different behaviouralfeatures were spatially intermingled (three sessionsfrom three different animals). Left panel, sameaxons as in Fig. 2a; right panel, same axons as inFig. 1f.
LETTER RESEARCH
1 3 S E P T E M B E R 2 0 1 2 | V O L 4 8 9 | N A T U R E | 3 0 1
Macmillan Publishers Limited. All rights reserved©2012
measured behavioural features (mean R2 for best feature, 0.22).Whisking-related axons (26 out of 138 active axons) were active duringwhisking for all trial types, independent of touch (Fig. 2; ROI1).Whisking-related fluorescence signals lagged whisking onset (mean6 s.d., 259 6 101 ms) (Supplementary Fig. 5b–d). However, becauseof the slow dynamics of calcium-dependent fluorescence we cannotexclude the possibility that the underlying spikes might lead whisking.Coding of whisking amplitude and whisking set-point is consistentwith neurophysiological6,24 and imaging experiments in vM1 (ref. 12).Touch-related axons (31 out of 138 active axons) were activatedmainly in trials with touch, but not by whisking alone (Fig. 4b;Supplementary Fig. 4c). Consistently, trimming whiskers, which
precluded touch during whisking, abolished activity of touch-relatedaxons (Supplementary Fig. 6). Other axons decoded lick rate (classifiedas lick related)25 or a mixture of features (classified as ‘mixed’ axons)(Fig. 3d).
Axons representing different behavioural features were spatiallyintermingled over length scales of micrometres (Figs 2 and 3e); nearbyvaricosities were equally likely to be part of any of the representations.Repeated imaging experiments showed that the representations ofindividual axons were largely stable (Supplementary Fig. 6). The L1apical tuft dendrites of individual neurons in vS1 may have access to arich amalgam of contextual information.
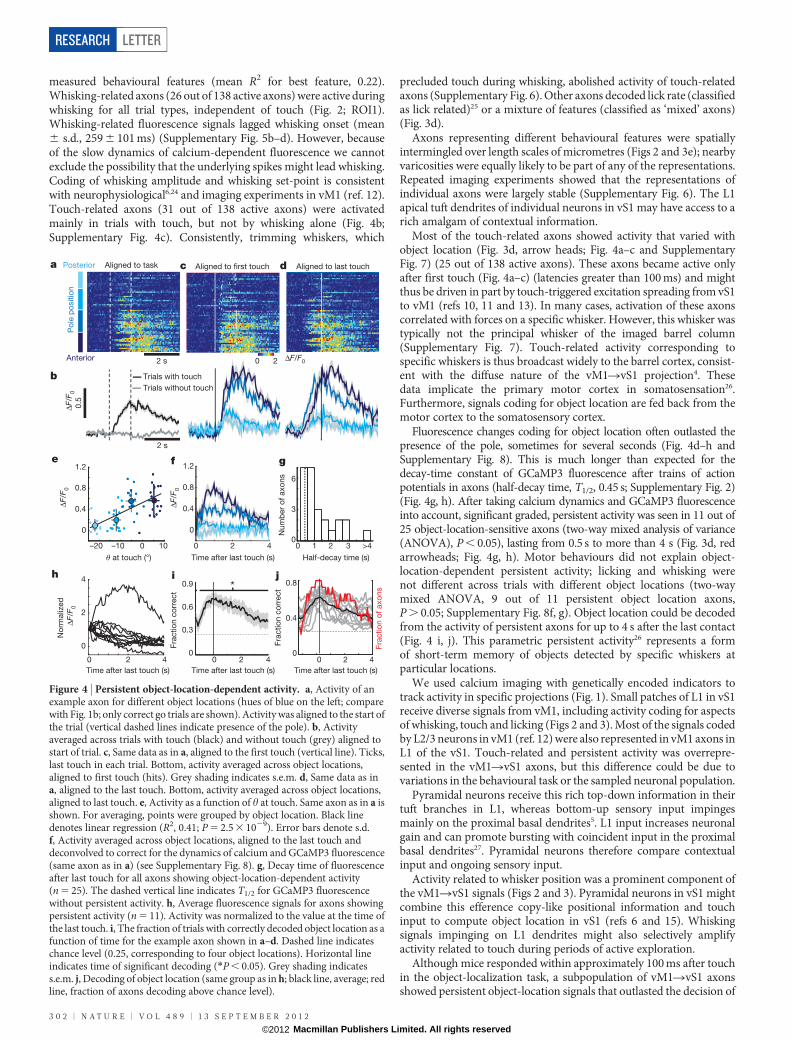
Most of the touch-related axons showed activity that varied withobject location (Fig. 3d, arrow heads; Fig. 4a–c and SupplementaryFig. 7) (25 out of 138 active axons). These axons became active onlyafter first touch (Fig. 4a–c) (latencies greater than 100 ms) and mightthus be driven in part by touch-triggered excitation spreading from vS1to vM1 (refs 10, 11 and 13). In many cases, activation of these axonscorrelated with forces on a specific whisker. However, this whisker wastypically not the principal whisker of the imaged barrel column(Supplementary Fig. 7). Touch-related activity corresponding tospecific whiskers is thus broadcast widely to the barrel cortex, consist-ent with the diffuse nature of the vM1RvS1 projection4. Thesedata implicate the primary motor cortex in somatosensation26.Furthermore, signals coding for object location are fed back from themotor cortex to the somatosensory cortex.
Fluorescence changes coding for object location often outlasted thepresence of the pole, sometimes for several seconds (Fig. 4d–h andSupplementary Fig. 8). This is much longer than expected for thedecay-time constant of GCaMP3 fluorescence after trains of actionpotentials in axons (half-decay time, T1/2, 0.45 s; Supplementary Fig. 2)(Fig. 4g, h). After taking calcium dynamics and GCaMP3 fluorescenceinto account, significant graded, persistent activity was seen in 11 out of25 object-location-sensitive axons (two-way mixed analysis of variance(ANOVA), P , 0.05), lasting from 0.5 s to more than 4 s (Fig. 3d, redarrowheads; Fig. 4g, h). Motor behaviours did not explain object-location-dependent persistent activity; licking and whisking werenot different across trials with different object locations (two-waymixed ANOVA, 9 out of 11 persistent object location axons,P . 0.05; Supplementary Fig. 8f, g). Object location could be decodedfrom the activity of persistent axons for up to 4 s after the last contact(Fig. 4 i, j). This parametric persistent activity26 represents a formof short-term memory of objects detected by specific whiskers atparticular locations.
We used calcium imaging with genetically encoded indicators totrack activity in specific projections (Fig. 1). Small patches of L1 in vS1receive diverse signals from vM1, including activity coding for aspectsof whisking, touch and licking (Figs 2 and 3). Most of the signals codedby L2/3 neurons in vM1 (ref. 12) were also represented in vM1 axons inL1 of the vS1. Touch-related and persistent activity was overrepre-sented in the vM1RvS1 axons, but this difference could be due tovariations in the behavioural task or the sampled neuronal population.
Pyramidal neurons receive this rich top-down information in theirtuft branches in L1, whereas bottom-up sensory input impingesmainly on the proximal basal dendrites5. L1 input increases neuronalgain and can promote bursting with coincident input in the proximalbasal dendrites27. Pyramidal neurons therefore compare contextualinput and ongoing sensory input.
Activity related to whisker position was a prominent component ofthe vM1RvS1 signals (Figs 2 and 3). Pyramidal neurons in vS1 mightcombine this efference copy-like positional information and touchinput to compute object location in vS1 (refs 6 and 15). Whiskingsignals impinging on L1 dendrites might also selectively amplifyactivity related to touch during periods of active exploration.
Although mice responded within approximately 100 ms after touchin the object-localization task, a subpopulation of vM1RvS1 axonsshowed persistent object-location signals that outlasted the decision of
a
ΔF/F 0
0.5
P
ole
po
sitio
n
Anterior
Posterior
2 s
2 s
Time after last touch (s)Time after last touch (s)
Time after last touch (s)
0 2 40
0.4
0.8
Fra
ctio
n c
orr
ect
Fra
ctio
n o
f axo
ns
Time after last touch (s)
No
rmaliz
ed
ΔF
/F0
0 2
0
2
4
Half-decay time (s)
Num
ber
of
axo
ns
0 1 2 3 >40
3
6
4
0.3
0.6
0.9
0 2 40
d
b
0 2 4
0
0.4
0.8
1.2
*
0 2
Aligned to first touch
ΔF/F0
θ at touch (°)
–20 –10 0 10
0
0.4
0.8
1.2
ΔF/F 0
Aligned to last touchAligned to task
ΔF/F 0
Fra
ctio
n c
orr
ect
c
e f
h i
g
j
Trials with touch
Trials without touch
Figure 4 | Persistent object-location-dependent activity. a, Activity of anexample axon for different object locations (hues of blue on the left; comparewith Fig. 1b; only correct go trials are shown). Activity was aligned to the start ofthe trial (vertical dashed lines indicate presence of the pole). b, Activityaveraged across trials with touch (black) and without touch (grey) aligned tostart of trial. c, Same data as in a, aligned to the first touch (vertical line). Ticks,last touch in each trial. Bottom, activity averaged across object locations,aligned to first touch (hits). Grey shading indicates s.e.m. d, Same data as ina, aligned to the last touch. Bottom, activity averaged across object locations,aligned to last touch. e, Activity as a function of h at touch. Same axon as in a isshown. For averaging, points were grouped by object location. Black linedenotes linear regression (R2, 0.41; P 5 2.5 3 1029). Error bars denote s.d.f, Activity averaged across object locations, aligned to the last touch anddeconvolved to correct for the dynamics of calcium and GCaMP3 fluorescence(same axon as in a) (see Supplementary Fig. 8). g, Decay time of fluorescenceafter last touch for all axons showing object-location-dependent activity(n 5 25). The dashed vertical line indicates T1/2 for GCaMP3 fluorescencewithout persistent activity. h, Average fluorescence signals for axons showingpersistent activity (n 5 11). Activity was normalized to the value at the time ofthe last touch. i, The fraction of trials with correctly decoded object location as afunction of time for the example axon shown in a–d. Dashed line indicateschance level (0.25, corresponding to four object locations). Horizontal lineindicates time of significant decoding (*P , 0.05). Grey shading indicatess.e.m. j, Decoding of object location (same group as in h; black line, average; redline, fraction of axons decoding above chance level).
RESEARCH LETTER
3 0 2 | N A T U R E | V O L 4 8 9 | 1 3 S E P T E M B E R 2 0 1 2
Macmillan Publishers Limited. All rights reserved©2012

the animals by seconds (Fig. 4). These memory traces, which mightnot be relevant to solve this particular task, represent informationabout touches of specific whiskers in the recent past. Haptic objectrecognition is constructed from localization of several related objectfeatures, based on multiple touches over time28,29 with multiplewhiskers30. The vM1RvS1 projection links the past state of specificwhiskers (input in L1) with present sensory input from other whiskers,ascending into vS1 through the sensory thalamus. The vS1«vM1 loopthus has the capacity to integrate haptic information across time andspace, key components of object recognition and somatosensorynavigation. Pyramidal cells in vS1 receive L1 inputs related to pasttouch, whereas their proximal basal dendrites receive input signallingpresent touch. These neurons could selectively burst after specificsequences of touches with different whiskers, within time windowsdefined by the mnemonic activity in L1. In this scheme burst firing ofpopulations of vS1 neurons codes for complex object shape(Supplementary Fig. 9).
METHODS SUMMARYVirus expressing GCaMP3 (rAAV-synapsin (SYN)-GCaMP3, serotype 2/1,University of Pennsylvania Gene Therapy Program Vector Core) was injected(20 nl, 10 nl min21, 350mm deep) into the left vM1 of adult (.P60) C57BL/6 malemice and a circular craniotomy was made over the ipsilateral vS1. Animals weretrained in a whisker-dependent object-localization task. vM1 axons were imagedin the vS1 14–23 days after virus injection. Images of the whiskers were acquiredusing a high-speed camera at 500 frames per second. The whisker position(azimuthal angle at the whisker base, h) and whisker shape were tracked usingautomated whisker tracking8, 14. Licking was detected using an optical lickport.
Full Methods and any associated references are available in the online version ofthe paper.
Received 16 September 2011; accepted 12 June 2012.
Published online 26 August 2012.
1. Felleman, D. J. & Van Essen, D. C. Distributed hierarchical processing in theprimate cerebral cortex. Cereb. Cortex 1, 1–47 (1991).
2. Cauller, L. J. & Connors, B. W. Synaptic physiology of horizontal afferents to layer 1in slices of rat S1 neocortex. J. Neurosci. 14, 751–762 (1994).
3. Cauller, L. Layer I of primary sensory neocortex: where top-down converges uponbottom-up. Behav. Brain Res. 71, 163–170 (1995).
4. Veinante, P. & Deschenes, M. Single-cell study of motor cortex projections to thebarrel field in rats. J. Comp. Neurol. 464, 98–103 (2003).
5. Petreanu, L., Mao, T., Sternson, S. M. & Svoboda, K. The subcellular organization ofneocortical excitatory connections. Nature 457, 1142–1145 (2009).
6. Hill, D. N., Curtis, J. C., Moore, J. D. & Kleinfeld, D. Primary motor cortex reportsefferent control of vibrissa motion on multiple timescales. Neuron 72, 344–356(2011).
7. Knutsen, P. M., Pietr, M. & Ahissar, E. Haptic object localization in the vibrissalsystem: behavior and performance. J. Neurosci. 26, 8451–8464 (2006).
8. O’Connor, D. H. et al. Vibrissa-based object localization in head-fixed mice.J. Neurosci. 30, 1947–1967 (2010).
9. O’Connor,D. H., Peron, S. P., Huber, D. & Svoboda, K.Neural activity inbarrel cortexunderlying vibrissa-based object localization in mice. Neuron 67, 1048–1061(2010).
10. Ferezou, I. et al. Spatiotemporal dynamics of cortical sensorimotor integration inbehaving mice. Neuron 56, 907–923 (2007).
11. Kleinfeld, D., Sachdev, R. N., Merchant, L. M., Jarvis, M. R. & Ebner, F. F. Adaptivefiltering of vibrissa input in motor cortex of rat. Neuron 34, 1021–1034 (2002).
12. Huber, D. et al. Multiple dynamic representations in the motor cortex duringsensorimotor learning. Nature 484, 473–478 (2012).
13. Mao, T. et al. Long-range neuronal circuits underlying the interaction betweensensory and motor cortex. Neuron 72, 111–123 (2011).
14. Clack, N. G. et al. Automated tracking of whiskers in videos of head fixed rodents.PLOS Comput. Biol. 8, e1002591 (2012).
15. Knutsen, P. M. & Ahissar, E. Orthogonal coding of object location. Trends Neurosci.32, 101–109 (2009).
16. Birdwell, J. A. et al. Biomechanical models for radial distance determination by therat vibrissal system. J. Neurophysiol. 98, 2439–2455 (2007).
17. Tian,L.et al. Imaging neural activity inworms, flies andmicewith improvedGCaMPcalcium indicators. Nature Methods 6, 875–881 (2009).
18. Trachtenberg, J. T. et al. Long-term in vivo imaging of experience-dependentsynaptic plasticity in adult cortex. Nature 420, 788–794 (2002).
19. Masino, S. A., Kwon, M. C., Dory, Y. & Frostig, R. D. Characterization of functionalorganization within rat barrel cortex using intrinsic signal optical imaging througha thinned skull. Proc. Natl Acad. Sci. USA 90, 9998–10002 (1993).
20. De Paola, V. et al. Cell type-specific structural plasticity of axonal branches andboutons in the adult neocortex. Neuron 49, 861–875 (2006).
21. Cox, C. L., Denk, W., Tank, D. W. & Svoboda, K. Action potentials reliably invadeaxonal arbors of rat neocortical neurons. Proc. Natl Acad. Sci. USA 97, 9724–9728(2000).
22. Hooks,B.M.et al. Laminaranalysis of excitatory local circuits in vibrissal motor andsensory cortical areas. PLoS Biol. 9, e1000572 (2011).
23. De Felipe, J., Marco, P., Fairen, A. & Jones, E. G. Inhibitory synaptogenesis in mousesomatosensory cortex. Cereb. Cortex 7, 619–634 (1997).
24. Carvell, G. E., Miller, S. A. & Simons, D. J. The relationship of vibrissal motor cortexunit activity towhisking in theawakerat.Somatosens.Mot. Res.13,115–127 (1996).
25. Komiyama, T. et al. Learning-related fine-scale specificity imaged in motor cortexcircuits of behaving mice. Nature 464, 1182–1186 (2010).
26. Hernandez, A. et al. Decoding a perceptual decision process across cortex. Neuron66, 300–314 (2010).
27. Larkum, M. E., Senn, W. & Luscher, H. R. Top-down dendritic input increases thegain of layer 5 pyramidal neurons. Cereb. Cortex 14, 1059–1070 (2004).
28. Anjum, F., Turni, H., Mulder, P. G., van der Burg, J. & Brecht, M. Tactile guidance ofprey capture in Etruscan shrews. Proc. Natl Acad. Sci. USA 103, 16544–16549(2006).
29. Davidson, P. W. Haptic judgments of curvature by blind and sighted humans.J. Exp. Psychol. 93, 43–55 (1972).
30. Krupa, D. J., Matell, M. S., Brisben, A. J., Oliveira, L. M. & Nicolelis, M. A. Behavioralproperties of the trigeminal somatosensory system in rats performing whisker-dependent tactile discriminations. J. Neurosci. 21, 5752–5763 (2001).
Supplementary Information is linked to the online version of the paper atwww.nature.com/nature.
Acknowledgements We thank M. Hooks, N. Li, Z. Guo, J. Magee and J. Dudman forcomments on the manuscript, N. Clack, V. Iyer and J. Vogelstein for help with softwareand D. Flickinger for help with microscope design.
Author Contributions L.P. and K.S. conceived the study. L.P. performed theexperiments. L.P., D.A.G. and K.S. analysed the data. D.A.G. and D.H.O. contributedsoftware. D.H. and D.H.O. helped with behavioural and imaging experiments. N.-l.X.performed key pilot studies. L.T. and L.L. provided reagents. L.P., D.A.G. and K.S. wrotethe paper with comments from all authors.
Author Information Reprints and permissions information is available atwww.nature.com/reprints. The authors declare no competing financial interests.Readers are welcome to comment on the online version of this article atwww.nature.com/nature. Correspondence and requests for materials should beaddressed to K.S. ([email protected]).
LETTER RESEARCH
1 3 S E P T E M B E R 2 0 1 2 | V O L 4 8 9 | N A T U R E | 3 0 3
Macmillan Publishers Limited. All rights reserved©2012
METHODSVirus injection and chronic-window preparation. All procedures wereapproved by the Janelia Farm Research Campus Institutional Animal Care andUse Committee. Surgeries were conducted on adult (.P60) male C57BL/6 miceunder isoflurane anaesthesia (1.5–2%). Other drugs reduced potential inflam-mation (Ketofen, 5 mg kg21, subcutaneously) and provided local (Marcaine,0.5%, injected under the scalp) and general analgesia (buprenorphine, 0.1 mgkg21, intraperitoneally). To label motor cortex axons a small craniotomy wasperformed over the left vM1 (coordinates relative to bregma, anterior, 1.3 mm;lateral, 0.7 mm). Virus expressing GCaMP3 (rAAV-synapsin(SYN)-GCaMP3,serotype 2/1, University of Pennsylvania Gene Therapy Program Vector Core)was injected (20 nl, 10 nl min21, 350mm deep) with a custom-made volumetricinjection system (based on a Narishige MO-10 manipulator)5. Glass pipettes(Drummond) were pulled and bevelled to a sharp tip (30mm outer diameter).Pipettes were back-filled with mineral oil and front-loaded with viral suspensionimmediately before injection. Compared to synthetic calcium indicators, expres-sion of protein sensors ensures labelling of long-range axons and also allowsimaging in trained mice across multiple behavioural sessions, separated by daysto weeks. The virus infected neurons in layers 2–5, including most vS1-projectingneurons13 (Supplementary Fig. 2a). A custom-machined titanium frame wascemented to the skull with dental acrylic (Lang Dental).
For imaging, a circular craniotomy was made over the left barrel cortex (vS1;diameter, 1.5 mm; centre relative to bregma, lateral, 3.5 mm; anterior, 21.4 mm;left hemisphere, Fig. 1d). An imaging window was constructed from two layers ofstandard microscope coverglass (Fisher; thickness, 170–210mm), joined with anultraviolet curable optical glue (NOR-61, Norland). A larger piece was attached tothe bone and a smaller insert fit snugly into the craniotomy. The bone surroundingthe craniotomy was thinned to allow for a flush fit between the insert andunderlying dura. The window was cemented in place using dental acrylic (LangDental). After 3 days of recovery the C-row whiskers were mapped using intrinsicsignal imaging9 (Fig. 1d). Mice were anaesthetized with isoflurane (1%) afterinjection of chlorprothixene (1 mg kg21)31. Images were acquired through acranial window through a Leica MZ12.5 microscope under 630 nm illumination.Images of the vasculature over the same field of view were taken under 530 nmlight-emitting diode illumination. Individual whiskers were moved using apiezoelectric bimorph (0.75 mm, 3 mm from the base; 10 Hz; 4 s, repeatedevery 20 s; total time, 10–30 min). Acquisition was performed with Ephus(http://www.ephus.org)32. Water restriction was started 1 day later.Behaviour. The behavioural task was modified from previous studies8,12 (Fig. 1a, band Supplementary Fig. 1). Behavioural training began after the mice hadrestricted access to water for at least 7 days (1 ml per day). In the initial sessionmice first learned to lick for water rewards (,40 rewards). Animals were thentrained to lick only in trials in which a metal pole was within easy reach of thewhiskers on the right side of their face. The pole was mounted on a pneumaticlinear slider (Festo; SLS-10-30-P-A Mini slide; P/N 170496) and was movedrapidly (,0.25 s) in and out of reach of the whiskers under computer control.The pole was within reach of the whiskers for ,1 s (sampling period). Tonguemovements were tracked using an optical lickport.
Because the pole was placed in one of five randomly selected locations, it wasimpossible for mice to position their whiskers to solve the task with passivewhisker stimulation. However, consistent with previous studies8, mice tended tofocus their whisking on the rewarded target locations. Passive stimulation by themoving pole thus occurred in some trials (23% of trials; 6 sessions, 5 animals). Ingeneral, mice whisked to contact the pole, but whisking varied across trials (Fig. 2b,c and Supplementary Fig. 1). Whisking strategies also varied across mice. Afterremoval of the pole, during an answer period lasting ,1.5 s, licking was rewardedwith a drop of water in go trials and punished with an extra inter-trial interval of 4 sin no-go trials. Licking was ignored in other behavioural epochs. Multiple polepositions in go trials were introduced at this early training stage. The range of gopositions was initially relatively small (4.5 mm) and was gradually increased withtraining. The pole positions were (relative to the C2 follicle at rest) (SupplementaryFig. 1b): lateral, 6.7–9.1 mm. Go positions, centre of anterior–posterior range,0.35–3.32 mm; anterior–posterior range, 5.6–7.0 mm; no-go positions, anterior–posterior location, 8.9–13.6 mm; lateral, 6.7–9.1 mm. Although all pole locationswere within reach of the long posterior whiskers (C1, C2), mice did not alwaystouch the most anterior (no-go) location8 (Supplementary Fig. 1e).
Once the animals were trained (d9 . 1), all whiskers apart from C row weretrimmed on the right side of the face. Subsequent behavioural sessions wereperformed while imaging under the two-photon microscope.Imaging. Imaging was performed 14–23 days after virus injection with a custom-made microscope (design available at http://research.janelia.org/Svoboda/).GCaMP3 was excited using a Ti:sapphire laser (Mai Tai, Spectra Physics) tunedto l 5 925 nm. We used GaAsP photomultiplier tubes (10770PB-40, Hamamatsu)
and a 316 (0.8 NA) microscope objective (Nikon). The field of view was40 3 40mm (128 3 256 pixels) (Fig. 1f), imaged at 16 Hz. The microscope wascontrolled with ScanImage33 (http://www.scanimage.org). The average power forimaging was ,50 mW, measured at the entrance pupil of the objective. For eachmouse the optical axis was adjusted to be perpendicular to the imaging window.Imaging was stopped during inter-trial intervals (3 s; 7 s after false-alarms trials).Bleaching of GCaMP3 was negligible. Slow drifts of the field of view were correctedmanually approximately every 50 trials using a reference image. In some caseswe imaged the same axons over several days (Supplementary Fig. 6). Vascularlandmarks and visual comparison with reference images from previous days wereused to identify the same axons.
Calcium imaging has some drawbacks. Presently used genetically encodedindicators are not sufficiently sensitive to detect single action potentials, and as aconsequence axons with low firing rates were probably missed9,17 (SupplementaryFig. 2). This implies that the representations in vM1RvS1 axons are probably evenricher than suggested by our imaging data. In addition, the slow dynamics(hundreds of milliseconds) of the calcium indicator limits the temporal resolutionof the neurophysiological measurements. Advances in the development of fluor-escent sensors of neuronal function will probably ameliorate these problems.Image analysis. Frames were registered using rigid translation based on cross-correlation34. First, we selected a trial with little movement and the frames withinthe trial were registered and averaged. All of the frames from a session wereregistered to this averaged image. To extract fluorescence signals, ROIs weredrawn over fluorescent varicosities identified by using the mean, maximumintensity and standard deviation values of all trials. The pixels in each ROI wereaveraged to estimate fluorescence corresponding to a single varicosity. Thebaseline fluorescence of the ROI, F0, was estimated as the 30th percentile of thefluorescence using a 32 s sliding window and used to calculateDF/F0 5 ((F 2 F0)/F0).To produce an event vector from the DF/F0 trace, and thereby minimize thetemporal distortions caused by GCaMP3 dynamics17, we used a non-negativedeconvolution method35. These event vectors were used to train the decoder andto measure average activity when selecting for active axons. Active axons weredefined as having an average event rate higher than 0.007 events per frame and apeak DF/F0 in the peristimulus time histograms higher than 30% for any trial type(that is, hit, correct rejection or false alarm). This assures that the calcium signalsare not due to motion artefacts (less than 1% of the GCaMP3 signals are expected tobe polluted by movement) (Supplementary Fig. 3).Whisker tracking. Whiskers were illuminated using a high-power light-emittingdiode (940 nm, Roithner) and condenser optics (Thorlabs). Images were acquiredthrough a telecentric lens (30.36, Edmund Optics) by a high-speed CMOS camera(EoSense CL, Mikrotron) running at 500 frames per second (640 3 352 pixels;42 pixels per mm). Image acquisition was controlled by Streampix 3 (Norpix,Canada). The whisker position (h) and whisker shape were tracked using auto-mated whisker tracking8,14 (https://openwiki.janelia.org/wiki/display/MyersLab/Whisker1Tracking). Whiskers are cantilevered beams, with one end embeddedinto the follicle in the whisker pad. Measurement of whisker shape and themechanical properties of the whisker can be used to estimate the forces actingon the follicle16. The amplitudes of the forces in the follicle are proportional to thecurvature change of the whisker, Dk. We used Dk at a particular location alongthe whisker (2–3 mm) as a substitute for the mechanical forces acting on thewhiskers14,16. Curvature was measured from a parametric curve comprisingsecond-order polynomials fitted to the whisker backbone. Periods of contactbetween the whisker and object (touch) were detected on the basis of nearestdistance between whisker and object.Behavioural features. Licking was detected using a lickometer8. Lick rate (Hz) wasthe inverse of the inter-lick interval. Motor cortex neurons primarily code for slowvariables related to whisking6,24. We decomposed whisking (that is, h at base) intowhisking set-point and whisking amplitude. Whisking set-point was defined as the0.6 s moving average of h. Whisker amplitude was defined as the Hilbert trans-form36 of the absolute value of the band-pass filtered (6–30 Hz) h. Whisking set-point and whisker amplitude were highly correlated in our behavioural task(Supplementary Fig. 5a) and only one of these features (whisking amplitude) isshown in most figures (Figs 2 and 3). To characterize the quality of the decom-position we reconstructed whisker position from set-point, whisker amplitude andwhisking phase. The reconstruction error (root mean squared error) across allanimals was 4.5 6 0.18u (mean 6 s.e.m.; range 3.5–6.1u), corresponding to 30% ofthe variance of whisker position. The analysis of curvature was restricted to periodsof touch. We further derived features related to protraction touch (negative Dk)and retraction touch (positive Dk) and separately absolute values.
All behavioural features were down-sampled to the image-acquisition rate(16 Hz). Mean and maximum values were calculated for each feature in a 64-mswindow centred on the middle of the new sampling point. Mice whisk atfrequencies above 8 Hz (the Nyquist frequency)37 and this information is lost by
RESEARCH LETTER
Macmillan Publishers Limited. All rights reserved©2012
down-sampling. Across animals, 48 6 1% of the energy of the whisking trajectorywas contained at frequencies below 8 Hz. The higher frequency signals (that is,phase) are not thought to be coded by most of the motor cortex neurons6,24. Also,our imaging methods would be too slow to capture modulation with whisking phase.Correlation analysis to determine if multiple varicosities are part of the sameaxon. vM1 axons form elaborate arborizations in L1 of the vS1, and multiplevaricosities in one field of view were often part of the same axon. To characterizethe diversity of signals impinging on vS1, we wanted to report activity in distinctaxons, as opposed to distinct varicosities. We used correlation-based methods todistinguish varicosities that were part of the same axon and those that were part ofdifferent axons (Fig. 1h–j).
We first selected varicosities that, on the basis of structural images, were part ofthe same axon (14 sessions). We computed their correlation coefficient over anentire session, and compared them to correlation coefficients computed over allpairs of varicosities (dominated by pairs from different axons). As expected21,38,pairs of varicosities from the same axon showed markedly higher correlationcoefficients compared with random pairs. The correlation coefficient increaseswith increasing event rates. For varicosities from the same axon we plotted thecorrelation coefficients as a function of event rates and fitted an exponential curveto the data (Fig. 1j). The 95% confidence value of the fit was used as a criterion toassign pairs of varicosities to the same axon, even in the cases where the axonalmorphology could not be discerned.
To build clusters of correlated ROIs we selected all the pairs that were consid-ered to be from the same axon on the basis of correlations (Fig. 1h–j). We seeded acluster with one randomly selected pair. The next randomly selected pair couldshare one of the ROIs with the existing cluster, in which case it joined the cluster;otherwise it seeded a second cluster, and so on. We iterated this procedure until allpairs were assigned. Each cluster was represented in the data set by a ‘represent-ative’ ROI, defined by the largest mean DF/F0.Characterizing movement using mice with GFP-expressing axons. Axons andtheir varicosities are tiny structures (one micrometer diameter, or less20).Movement of the animal could displace axons in and out of the objective focalplane and thus produce motion artefacts in the fluorescence signal. To quantifythese errors we performed control experiments in three mice with vM1RvS1axons labelled with green fluorescent protein (GFP). All experimental conditionswere identical, except that rAAV-SYN-GFP (serotype 2/1) was injected into vM1instead of the GCaMP3-expressing virus. These mice were trained in the object-localization behaviour and analysed identically to mice expressing GCaMP3(Supplementary Fig. 3). Although varicosities in GFP animals showed move-ment-induced changes in fluorescence, mainly during the licking period, thesechanges rarely exceeded 25%.Characterization of axonal varicosities in brain slices. Male C57BL/6 mice(P15) were injected in the left vM1 with 20 nl AAV-SYN-GCamP3, serotype 2/1as described5. Two weeks later vS1 slices were prepared. Mice were anaesthetizedwith an intraperitoneal injection of a ketamine/xylazine mixture (0.13 mg keta-mine and 0.01 mg xylazine per gram of body weight) and perfused through theheart with ice-cold artificial cerebrospinal fluid (ACSF; ,5 ml) containing127 mM NaCl, 25 mM NaHCO3, 25 mM D-glucose, 2.5 mM KCl, 1 mM MgCl2,2 mM CaCl2 and 1.25 mM NaH2PO4, aerated with 95% O2 and 5% CO2. The brainwas removed and placed into ice-cold cutting solution containing 110 mM cholinechloride, 25 mM NaHCO3, 25 mM D-glucose, 11.6 mM sodium ascorbate, 7 mMMgCl2, 3.1 mM sodium pyruvate, 2.5 mM KCl, 1.25 mM NaH2PO4 and 0.5 mMCaCl2. Coronal slices (300mm thick) of the right barrel cortex were cut with avibrating slicer (Microm, Walldorf) and incubated in oxygenated ACSF for 45 minat 37 uC and then at room temperature (approximately 23 uC). For recording,slices were placed in a chamber with circulating ACSF at 34 uC under a custom-built two-photon microscope. A 40 3 40mm area of L1 in the barrel cortex wasimaged at 16 Hz using a Ti:sapphire laser tuned to l 5 925 nm. L1 axons werestimulated with an extracellular electrode at 83 Hz. Fluorescence traces wereextracted as described for the in vivo experiments.Decoding behavioural variables. The relationship between fluorescence signal xi
of the ith axon and the jth behavioural variable yj can be characterized as anencoding description P(xi yj j) or a decoding description P(yj xj i). The encodingdescription specifies how much of the activity of the axon can be accounted for bythe behavioural variables. The decoding description specifies how well a beha-vioural variable can be derived from the activity of populations of axons (Fig. 3aand Supplementary Fig. 4) or single axons (Figs 3b–e and 4i, j). Here, we focusedon the decoding description.
We used machine learning algorithms to decode the behavioural variables basedon activity. For single axon decoding (Fig. 3b–e) each axon was used to predictbehavioural variables, such as forces on each whisker, whisking amplitude and lickrate. The input to the algorithm was the event rate (that is, deconvoluted DF/F0) of agiven axon as well as time-shifted versions. To predict sensory input we used present
and future activity. For motor variables we used both past and future values, as neuralactivity could reflect motor commands, corollary discharges or re-afferent input.
The goal of the decoder algorithm was to find a mappingyj(tk)~f ½xi(tk{l), . . . ,xi(tk), . . . ,xi(tkzp)� that best approximates yj(tk) for all tk.tk is discretized time (in units of 1/16 s, corresponding to the imaging rate); l and prepresent the maximum negative and positive shifts of the activity, respectively.
We concatenated trials to generate a vector �t of time-binned data. For sensoryvariables we used l 5 5 and p 5 0 and for sensory–motor variables l 5 5 and p 5 5(corresponding to time-shifts up to 0.32 s). The dimensionality of the input vari-ables is l 1 p 1 1.
For decoding neural populations (Fig. 3a and Supplementary Fig. 4a) we usedfor each session all axons showing at least one event and created an input vector ofsize Naxons 3 (l 1 p 1 1). Each behavioural session, corresponding to one imagedfield of view, was treated separately.
The algorithm was trained on a subset of trials (the training set, 80%) andevaluated on a separate set of test trials (20%) We repeated this procedure fivetimes to obtain a prediction for all trials39.
The accuracy of the decoding algorithm was evaluated using the Pearson cor-relation coefficient (r) between the model estimate and the data. The explainedvariance is R2 5 r2 (range, 0–1). R2 was calculated separately for each trial type(that is, hit, correct rejection, miss and false alarm). Treating trial types separatelywas critical to disambiguate the relationship between different behavioural vari-ables and activity of single axons. For instance, we observed large-amplitudewhisking during licking, which complicates the classification of the response typeof the axon. However, during correct-rejection trials, licking was absent andwhisking present, simplifying the classification of axon types. Similarly, in trainedanimals, touch and licking occurred with short latencies in hit trials. By contrast, infalse-alarm trials touch was typically absent or diminished in magnitude.
Decoding was with Random Forests39,40, a multivariate nonparametric machinelearning algorithm based on bootstrap aggregation (that is, bagging) of regressiontrees. We used the TreeBagger class implemented in Matlab. TreeBagger requiresonly few parameters: the number of trees (Ntrees 5 32), the minimum leaf size(minleaf 5 10), the number of features chosen randomly at each split(Nsplit 5 Nfeatures/3; the typical value used by default40). These parameters werechosen as a trade-off between decoder accuracy and computation time. We did notobserve much improvement in decoding accuracy for Ntrees . 32 and minleaf, 10 (data not shown).Classification of response types. We measured the R2 between each measuredbehavioural variable (that is, whisking amplitude, lick rate, whisking set-point, etc)and each axon’s decoder prediction for all the trials and for each trial type (Fig. 3b–e). In addition, we used ANOVA to determine whether calcium responses weredifferent for different pole locations (Fig. 4). We grouped the behavioural variablesin larger categories such as whisking (that is, including whisking amplitude andwhisker set-point), lick rate and touch (that is, touch per whisker, rate of change offorces, absolute magnitude, etc). We considered the best R2 set for each of the threebehavioural categories. Alternatively, all axons were classified manually on thebasis of trial-to-trial calcium transients and behavioural prediction for each trialtype. For most axons classification was unambiguous based on the decoder R2
values. The remaining axons were more accurately classified based on a rarer trialtype. For example, touch-related axons were much more active in trials withtouches compared to trials without touches (Supplementary Fig. 4c). Lick-relatedaxons, but not touch-related axons, were active during licking in false-alarm trials.Three of the authors independently arrived at consistent classifications.Clustering of response types. We used clustering algorithms to display the trial-averaged responses of all active unique axons (Fig. 3b). First, we divided the axons intofive categories: touch, whisking, licking, mixed and unclassified. Within each categorywe computed a similarity index between pairs of axons based on the trial-averagedresponses in hit, correct-rejection and false-alarm trials. For each axon we concate-nated their trial-averaged response for these three trial types. The similarity index wasthe pairwise correlation between the concatenated trial-average responses betweenevery axonal pair. We computed a weighted correlation to take into account that thenumber of false-alarm trials is typically lower than either hit or correct-rejection trials.
Given the two vectors �y and �x and the weight vector �w (by the relative number oftrials in each trial type):
Weighted mean: m(�x; �w)~
Pi wixiP
i wi
Weighted covariance: cov(�x,�y; �w)~
Pi wi(xi{m(�x; �w))(yi{m(�y; �w))
Pi wi
Weighted correlation: corr(�x,�y; �w)~cov(�x,�y; �w)
ffiffiffiffiffiffiffiffiffiffiffiffiffiffiffiffiffiffiffiffiffiffiffiffiffiffiffiffiffiffiffiffiffiffiffiffiffiffiffiffiffiffifficov(�x,�x; �w)cov(�y,�y; �w)
p
Axons were reordered using hierarchical clustering for each category separately(using linkage and dendrogram from Matlab with unweighted average distancesbetween clusters).
LETTER RESEARCH
Macmillan Publishers Limited. All rights reserved©2012
Analysis of sustained activity. For all cells showing object-location-dependentactivity we tested for parametric persistent activity. Fluorescence traces weredeconvolved with an exponential decay characterized by the GCaMP3 decay-timeconstant (T1/2 5 0.45 s) (compare Fig. 4d, f and Supplementary Fig. 8c, d). Themean value of the deconvolved traces at different times after contact (0.2–1.1, 1.1–2.0, 2.0–2.9 and 2.9–3.8 s after the last contact) was tested for object-location-dependent activity (two-way mixed-effect ANOVA). To determine whetherobject-location-dependent motor behaviours could explain object-location-dependent activity, similar analyses were performed for lick rate and whiskingparameters (Supplementary Fig. 8f, g).
We applied linear and nonlinear decoders (Random Forests, linear andquadratic discriminant analysis; naive Bayes was also tested and gave identicalresults to linear discriminant analysis) to determine the time course of theobject-location memory traces and compared their performance(Supplementary Fig. 8h). Each decoder was trained to predict the pole positionas a function of time on the basis of the average activity (that is, events) in theprevious 0.5 s for each axon. We performed 200 repetitions of this procedure tocompute the average performance of each decoder and their confidence inter-vals. We ensured that there was an equal number of trials per each of the fourpossible pole positions (that is, chance level corresponded to 0.25). As before, weused 80% of the trials to train the decoders and tested the performance in theremaining 20% trials (repeating this five times to obtain a prediction for the fullset of trials). The linear and quadratic discriminant decoders assume that the
input is a multivariate Gaussian and find the optimal linear or quadratic curvethat best separates the classes41.
31. Kaneko, M.,Hanover, J. L., England, P. M. & Stryker, M. P. TrkB kinase is required forrecovery, but not loss, of cortical responses following monocular deprivation.Nature Neurosci. 11, 497–504 (2008).
32. Suter, B. A. et al. Ephus: multipurpose data acquisition software for neuroscienceexperiments. Front. Neural Circuits 4, 100 (2010).
33. Pologruto, T. A., Sabatini, B. L. & Svoboda, K. ScanImage: flexible software foroperating laser-scanning microscopes. Biomed. Eng. Online 2, 13 (2003).
34. Guizar-Sicairos, M., Thurman, S. T. & Fienup, J. R. Efficient subpixel imageregistration algorithms. Opt. Lett. 33, 156–158 (2008).
35. Vogelstein, J. T. et al. Fast nonnegative deconvolution for spike train inference frompopulation calcium imaging. J. Neurophysiol. 104, 3691–3704 (2010).
36. Hill, D. N., Bermejo, R., Zeigler, H. P. & Kleinfeld, D. Biomechanics of the vibrissamotor plant in rat: rhythmic whisking consists of triphasic neuromuscular activity.J. Neurosci. 28, 3438–3455 (2008).
37. Voigts, J., Sakmann, B. & Celikel, T. Unsupervised whisker tracking in unrestrainedbehaving animals. J. Neurophysiol. 100, 504–515 (2008).
38. Koester,H. J.&Sakmann,B.Calciumdynamicsassociatedwithactionpotentials insingle nerve terminals of pyramidal cells in layer 2/3 of the young rat neocortex.J. Physiol. 529, 625–646 (2000).
39. Hastie, T., Tibshirani, R. & Friedman, J. The Elements of Statistical Learning 2nd edn(Springer, 2009).
40. Breiman, L. Random forests. Mach. Learn. 45, 5–32 (2001).41. Duda, R. O., Hart, P. E. & Stork, D. G. Pattern Classification 2nd edn (Wiley, 2001).
RESEARCH LETTER
Macmillan Publishers Limited. All rights reserved©2012