Activity-Based Costing and Management CHAPTER 5 Copyright © 2015 McGraw-Hill Education. All rights...
47
Activity-Based Costing and Management CHAPTER 5 Copyright © 2015 McGraw-Hill Education. All rights reserved. No reproduction or distribution without the prior written consent of McGraw-Hill Education.
-
Upload
diane-harrison -
Category
Documents
-
view
213 -
download
0
Transcript of Activity-Based Costing and Management CHAPTER 5 Copyright © 2015 McGraw-Hill Education. All rights...

Activity-Based Costing and Management
CHAPTER 5
Copyright © 2015 McGraw-Hill Education. All rights reserved. No reproduction or distribution without the prior written consent of McGraw-Hill Education.

Learning Objective 1
5-2

Traditional, Volume-Based Product-Traditional, Volume-Based Product-Costing SystemCosting System
Aerotech produces three complex printed circuit boards referred to as Mode I, Mode II, and Mode III.
The following information is obtained from company records:
Aerotech produces three complex printed circuit boards referred to as Mode I, Mode II, and Mode III.
The following information is obtained from company records:
Mode I Mode I I Mode I I IProduction: Units 10,000 20,000 4,000 Runs 1 run of 10,000
units 4 runs of
5,000 units 10 runs of 400 units
5-3

Traditional, Volume-Based Product-Traditional, Volume-Based Product-Costing SystemCosting System
Additional information includes:Mode I Mode I I Mode I I I
Direct materials 50.00$ 90.00$ 20.00$ Direct labor (hr/board) 3 4 2 Setup time (hr/run) 10 10 10 Machine time (hr/board) 1 1.25 2
Manufacturing overhead is determined as follows5-4

Traditional, Volume-Based Product-Traditional, Volume-Based Product-Costing SystemCosting System
Budgeted manufacturing overhead Budgeted manufacturing overhead $3,894,000 $3,894,000 Budgeted direct-labor hours 118,000Budgeted direct-labor hours 118,000 = $33 per hour= $33 per hour
5-5

Traditional, Volume-Based Product-Traditional, Volume-Based Product-Costing SystemCosting System
With these product costs, Aerotech established target selling prices (Cost × 125%).
209.00 x 1.255-6

Learning Objective 2
5-7

Activity Based Costing System Activity Based Costing System (ABC)(ABC)
ABC systems follow a two-stage two-stage procedure to assign overhead costs to products.
Stage OneIdentify significant activities and assign overhead costs to each activity in proportion to resources used.
Stage TwoIdentify cost drivers appropriate to each activity and allocate overhead to the products.
5-8

Learning Objective 3
5-9

Overhead CostsOverhead CostsTotal budgeted cost = $3,894,000Total budgeted cost = $3,894,000
ActivityActivityCostCostPoolsPools
MachineryMachinerycost poolcost pool
$1,212,600$1,212,600
SetupSetupcost poolcost pool$3,000$3,000
EngineeringEngineeringcost poolcost pool$700,000$700,000
FacilityFacilitycost poolcost pool$507,400$507,400
Unit-Level
Batch-Level
Product-Sustaining-
Level
Facility-Level
Identificationof ActivityCost Pools
Identificationof ActivityCost Pools
ActivityActivitymust bemust bedone ondone oneach uniteach unitproduced.produced.
ActivityActivityperformedperformedon eachon eachbatchbatch
produced.produced.
Activities needed to supportActivities needed to supportan entire product linean entire product line
Activity required in orderActivity required in orderfor the productionfor the productionprocess to occur.process to occur.
5-10

Receiving/InspectionReceiving/Inspectioncost pool cost pool $200,000$200,000
Material-HandlingMaterial-Handlingcost pool cost pool $600,000$600,000
Quality-AssuranceQuality-Assurancecost pool cost pool $421,000$421,000
Packaging/ShippingPackaging/Shippingcost pool cost pool $250,000$250,000
MachineryMachinerycost poolcost pool
$1,212,600$1,212,600
SetupSetupcost poolcost pool$3,000$3,000
EngineeringEngineeringcost poolcost pool$700,000$700,000
FacilityFacilitycost poolcost pool$507,400$507,400
Unit-Level
Batch-Level
Product-Sustaining-
LevelFacility-
Level
5-11

Learning Objectives 3 & 4
5-12

Machinery Cost PoolMachinery Cost PoolTotal budgeted cost = $1,212,600
Maintenance
Depreciation
Computer Support
Lubrication
Electricity
Calibration
ActivityActivitycostcostpoolpool
STAGE ONESTAGE ONE
Various overheadVarious overheadcosts relatedcosts relatedto to machinerymachinery
5-13

CalculateCalculatethe poolthe pool
raterate
Budgeted Machinery Costs $1,212,600 Budgeted Machine Hours 43,000 $28.20/hour$28.20/hour
CostCostAssignmentAssignment
STAGE TWOSTAGE TWO
=
=
5-14
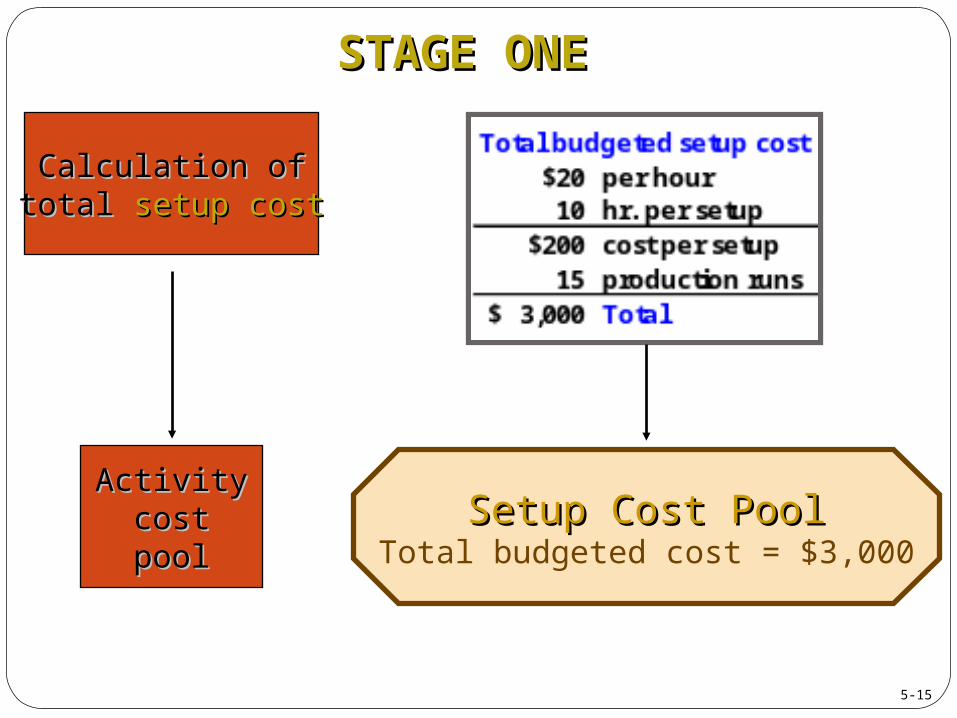
Calculation ofCalculation oftotal total setup costsetup cost
Setup Cost PoolSetup Cost PoolTotal budgeted cost = $3,000
ActivityActivitycostcostpoolpool
STAGE ONESTAGE ONE
5-15

CalculateCalculatethe poolthe pool
raterate
Budgeted Setup Costs $3,000Planned Production Runs 15 runs $200 per run$200 per run
CostCostAssignmentAssignment
STAGE TWOSTAGE TWO
=
=
5-16

Various overheadVarious overheadcosts relatedcosts related
to to engineeringengineering
Engineering salaries
Engineering supplies
Engineering software
Depreciation
Engineering Cost PoolEngineering Cost PoolTotal budgeted cost = $700,000
ActivityActivitycostcostpoolpool
STAGE ONESTAGE ONE
5-17

Allocate basedAllocate basedon on engineeringengineering
transactionstransactions
CostCostAssignmentAssignment
STAGE TWOSTAGE TWO
Engineering Cost PoolEngineering Cost PoolTotal budgeted cost = $700,000
5-18

Various overheadVarious overheadcosts relatedcosts related
to to generalgeneraloperationsoperations
Plant depr.
Plant mgmt.
Plant maint.
Property taxes
Insurance
Security
Facility Cost PoolFacility Cost PoolTotal budgeted cost = $507,400
ActivityActivitycostcostpoolpool
STAGE ONESTAGE ONE
5-19

Budgeted Facilities Cost $507,400Budgeted Direct-Labor Hours 118,000 $4.30/hour$4.30/hour
CostCostAssignmentAssignment
STAGE TWOSTAGE TWO
=
=
CalculateCalculatethe poolthe pool
raterate
5-20

Other Overhead CostsOther Overhead Costs
Board Overhead × % ÷ Units = Cost/UnitMode I 200,000$ × 6% ÷ 10,000 = 1.20$ Mode II 200,000 × 24% ÷ 20,000 = 2.40 Mode III 200,000 × 70% ÷ 4,000 = 35.00
Receiving and Inspection Cost Pool
Board Overhead × % ÷ Units = Cost/UnitMode I 600,000$ × 7% ÷ 10,000 = 4.20$ Mode II 600,000 × 30% ÷ 20,000 = 9.00 Mode III 600,000 × 63% ÷ 4,000 = 94.50
Material-Handling Cost Pool
Board Overhead × % ÷ Units = Cost/UnitMode I 421,000$ × 20% ÷ 10,000 = 8.42$ Mode II 421,000 × 40% ÷ 20,000 = 8.42 Mode III 421,000 × 40% ÷ 4,000 = 42.10
Quality-Assurance Cost Pool
Board Overhead × % ÷ Units = Cost/UnitMode I 250,000$ × 4% ÷ 10,000 = 1.00$ Mode II 250,000 × 30% ÷ 20,000 = 3.75 Mode III 250,000 × 66% ÷ 4,000 = 41.25
Packaging and Shipping Cost Pool
5-21

Board Overhead × % ÷ Units = Cost/UnitMode I 250,000$ × 4% ÷ 10,000 = 1.00$ Mode II 250,000 × 30% ÷ 20,000 = 3.75 Mode III 250,000 × 66% ÷ 4,000 = 41.25
Packaging and Shipping Cost Pool
Board Overhead × % ÷ Units = Cost/UnitMode I 421,000$ × 20% ÷ 10,000 = 8.42$ Mode II 421,000 × 40% ÷ 20,000 = 8.42 Mode III 421,000 × 40% ÷ 4,000 = 42.10
Quality-Assurance Cost Pool
Other Overhead CostsOther Overhead Costs
Board Overhead × % ÷ Units = Cost/UnitMode I 200,000$ × 6% ÷ 10,000 = 1.20$ Mode II 200,000 × 24% ÷ 20,000 = 2.40 Mode III 200,000 × 70% ÷ 4,000 = 35.00
Receiving and Inspection Cost Pool
Board Overhead × % ÷ Units = Cost/UnitMode I 600,000$ × 7% ÷ 10,000 = 4.20$ Mode II 600,000 × 30% ÷ 20,000 = 9.00 Mode III 600,000 × 63% ÷ 4,000 = 94.50
Material-Handling Cost Pool
$14.82$14.82
5-22

Product Cost from ABCProduct Cost from ABC
These are the new product costs when Aerotech uses ABC.
5-23

Learning Objective 5
5-24

Distorted Product CostsDistorted Product CostsBoth original and ABC target selling prices
are based on (Cost × 125%).
[$209.00 × 1.25] [$183.44 × 1.25]
The selling price of Mode I and II are decreased,The selling price of Mode I and II are decreased,while the selling price for Mode III is increased.while the selling price for Mode III is increased.
5-25

Can you identify any problems Aerotech is likely to face as a result of this distortion?
Traditional costing understates the costTraditional costing understates the costof complex, low volume products.of complex, low volume products.
Distorted Product CostsDistorted Product Costs
5-26

Two Key PointsTwo Key Points
A large proportion of non-unit-level activities A unit-level cost driver, such as direct labor, machine hours, or throughput, will not be able to assign the costs of non-unit-level activities accurately.
A large proportion of non-unit-level activities A unit-level cost driver, such as direct labor, machine hours, or throughput, will not be able to assign the costs of non-unit-level activities accurately.
Product diversity When the consumption ratios differ widely between activities, no single cost driver will accurately assign the resulting overhead costs.
Product diversity When the consumption ratios differ widely between activities, no single cost driver will accurately assign the resulting overhead costs.
5-27

Learning Objective 6
5-28

Cost DriversCost DriversA characteristic of an event or activity that
results in the incurrence of costs. In selecting a cost driver, we must consider . . .
Degree ofDegree ofCorrelationCorrelation
Cost ofCost ofMeasurementMeasurement
BehavioralBehavioralEffectsEffects
5-29

Learning Objective 7
5-30

COLLECTING ABC DATACOLLECTING ABC DATAINTERVIEWS AND PAPER TRAILS - The information for ABC systems initially comes from interviews with employees in the support departments and a review of each department’s records.
STORYBOARDING - A procedure used to develop a detailed process flow chart, which visually represents activities and the relationships among activities.
MULTIDISCIPLINARY ABC PROJECT TEAMS – To gather information from all facets of an organization’s operations, it is essential to involve personnel from a variety of functional areas. A typical ABC project team includes ACCOUNTING, FINANCE, PRODUCTION, OPERATIONS, ENGINEERS, MARKETING, etc.
5-31

Learning Objective 8
5-32

Activity-Based ManagementActivity-Based Management
The use ofABC costing information
to helpmanagement
make decisions
5-33

Activity-Based ManagementActivity-Based Management
Activity-based costing establishes relationshipsbetween overhead costs and activities so that
we can better allocate overhead costs.
Activity-based management focuses on managing activities to reduce costs.
5-34

Two-Dimensional ABC and Activity-Two-Dimensional ABC and Activity-Based ManagementBased Management
ActivitiesActivities
5-35

Two-Dimensional ABC and Activity-Two-Dimensional ABC and Activity-Based ManagementBased Management
Cost ObjectsCost ObjectsCost ObjectsCost Objects
ActivitiesActivities
Resource costsResource costsResource costsResource costs
Cost Assignment ViewCost Assignment View
5-36

Two-Dimensional ABC and Activity-Two-Dimensional ABC and Activity-Based ManagementBased Management
ActivityActivityTriggersTriggersActivityActivityTriggersTriggers
Cost ObjectsCost ObjectsCost ObjectsCost Objects
ActivitiesActivitiesRootRoot
CausesCausesRootRoot
CausesCauses
Process ViewProcess ViewActivity AnalysisActivity Analysis
Resource costsResource costsResource costsResource costs
Cost Assignment ViewCost Assignment View
PerformancePerformanceMeasuresMeasures
PerformancePerformanceMeasuresMeasures
Activity EvaluationActivity Evaluation
5-37

Elimination of Non-Value-Added Elimination of Non-Value-Added CostsCosts
Non-value-added
activities
NecessaryNecessaryUnnecessaryUnnecessary
ActivitiesActivities
Reduce orReduce orEliminateEliminate
Continually Evaluate Continually Evaluate
and Improveand Improve 5-38

Using ABM to Eliminate Non-Value-Using ABM to Eliminate Non-Value-Added Activities and CostsAdded Activities and Costs
1. Identify Activities.
2. Identify Non-Value-Added Activities.
3. Understand Activity Linkages, Root Causes, and Triggers.
4. Establish Performance Measures.
5. Report Non-Value-Added Costs.
SpecifySpecifypartsparts
SpecifySpecifypartsparts
SelectSelectvendorvendorSelectSelectvendorvendor
ReceiveReceivepartsparts
ReceiveReceivepartsparts
ProduceProducegoodsgoods
ProduceProducegoodsgoods
InspectInspectfinishedfinishedgoodsgoods
InspectInspectfinishedfinishedgoodsgoods
ReworkReworkdefectivedefectiveproductsproducts
ReworkReworkdefectivedefectiveproductsproducts
5-39

Using ABM to Eliminate Non-Value-Using ABM to Eliminate Non-Value-Added Activities and CostsAdded Activities and Costs
Inspection time
Process time
Storage time
Move time Waiting time
5-40

Learning Objective 9
5-41
Customer Profitability Analysis
Customer profitability analysis usesactivity-based costing to determine
the activities, costs, and profit associated with serving particular customers.
5-42
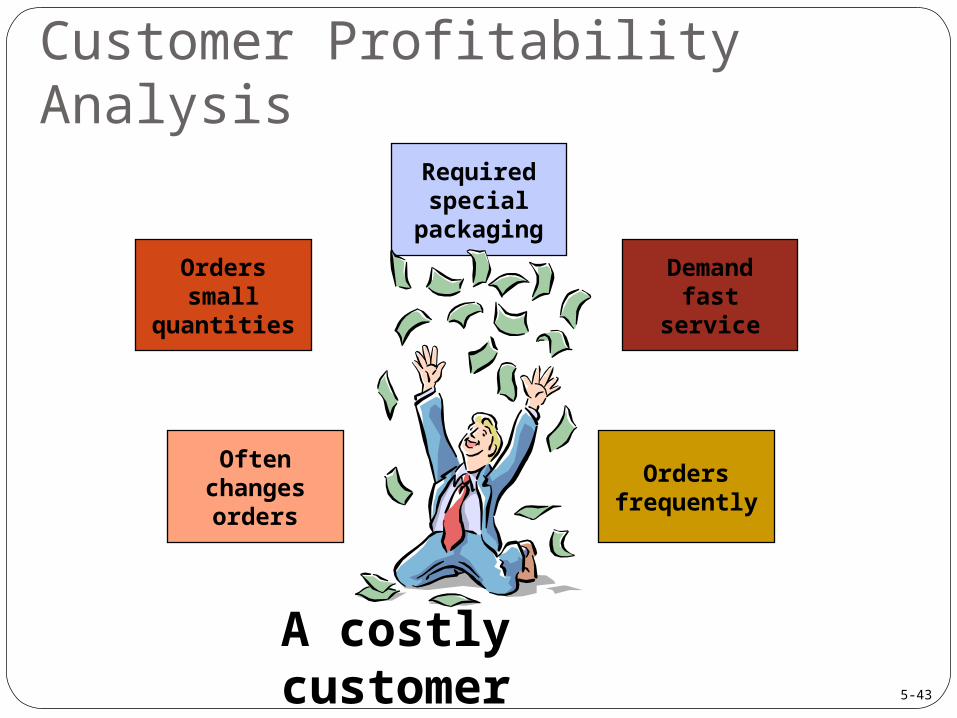
Customer Profitability Analysis
Orderssmall
quantities
Ordersfrequently
Oftenchangesorders
Requiredspecial
packaging
Demandfast
service
A costly customer 5-43

Customer Profitability Analysis
Customer-Related Activities Cost Driver Base Cost Drive
Rate Order processing Purchase orders 150$ Sales contacts (phone calls, faxes, etc.) Contacts 100 Sales visits Visits 1,000 Shipment processing Shipments 200 Billing and collection Invoices 160 Design/engineering change orders Design changes 4,000 Special packaging Units packaged 40 Special handling Units handled 60
A company may use these customerrelated costs to help determine the
profitability of each customer.
A company may use these customerrelated costs to help determine the
profitability of each customer.
5-44

Customer Profitability AnalysisCustomer Profitability
0.0%
25.0%
50.0%
75.0%
100.0%
125.0%
1 2 3 4 5 6 7 8 9 10 11 12 13 14 15 16 17 18 19 20Cu
mu
lati
ve
Op
era
tin
g I
nc
om
e a
s a
% o
f T
ota
l O
pe
rati
ng
In
co
me
75% of actual operating income
50% of actual operating income
25% of actual operating income
5-45

Learning Objective 10
5-46

End of Chapter 5End of Chapter 5This is
my kind of cost pool!
5-47